Interactive Mathematics Program Curriculum Framework
45
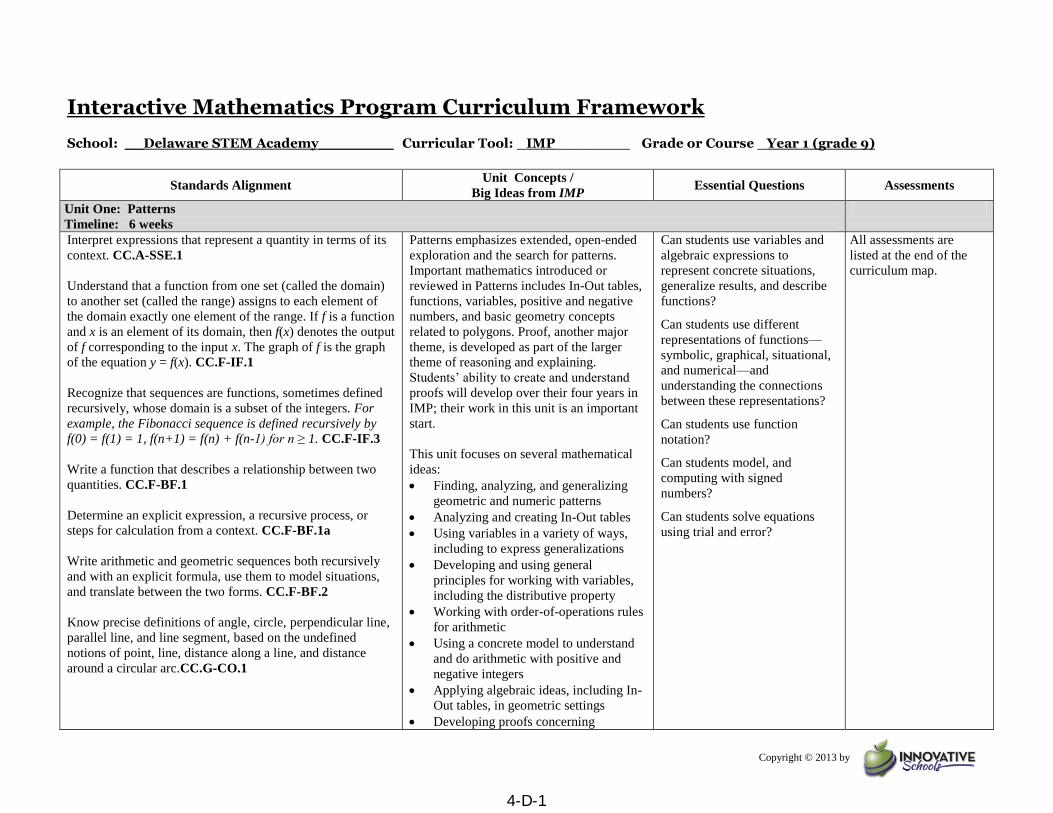
Copyright © 2013 by Interactive Mathematics Program Curriculum Framework School: __Delaware STEM Academy________ Curricular Tool: _IMP________ Grade or Course _Year 1 (grade 9) Standards Alignment Unit Concepts / Big Ideas from IMP Essential Questions Assessments Unit One: Patterns Timeline: 6 weeks Interpret expressions that represent a quantity in terms of its context. CC.A-SSE.1 Understand that a function from one set (called the domain) to another set (called the range) assigns to each element of the domain exactly one element of the range. If f is a function and x is an element of its domain, then f(x) denotes the output of f corresponding to the input x. The graph of f is the graph of the equation y = f(x). CC.F-IF.1 Recognize that sequences are functions, sometimes defined recursively, whose domain is a subset of the integers. For example, the Fibonacci sequence is defined recursively by f(0) = f(1) = 1, f(n+1) = f(n) + f(n-1) for n ≥ 1. CC.F-IF.3 Write a function that describes a relationship between two quantities. CC.F-BF.1 Determine an explicit expression, a recursive process, or steps for calculation from a context. CC.F-BF.1a Write arithmetic and geometric sequences both recursively and with an explicit formula, use them to model situations, and translate between the two forms. CC.F-BF.2 Know precise definitions of angle, circle, perpendicular line, parallel line, and line segment, based on the undefined notions of point, line, distance along a line, and distance around a circular arc.CC.G-CO.1 Patterns emphasizes extended, open-ended exploration and the search for patterns. Important mathematics introduced or reviewed in Patterns includes In-Out tables, functions, variables, positive and negative numbers, and basic geometry concepts related to polygons. Proof, another major theme, is developed as part of the larger theme of reasoning and explaining. Students’ ability to create and understand proofs will develop over their four years in IMP; their work in this unit is an important start. This unit focuses on several mathematical ideas: Finding, analyzing, and generalizing geometric and numeric patterns Analyzing and creating In-Out tables Using variables in a variety of ways, including to express generalizations Developing and using general principles for working with variables, including the distributive property Working with order-of-operations rules for arithmetic Using a concrete model to understand and do arithmetic with positive and negative integers Applying algebraic ideas, including In- Out tables, in geometric settings Developing proofs concerning Can students use variables and algebraic expressions to represent concrete situations, generalize results, and describe functions? Can students use different representations of functions— symbolic, graphical, situational, and numerical—and understanding the connections between these representations? Can students use function notation? Can students model, and computing with signed numbers? Can students solve equations using trial and error? All assessments are listed at the end of the curriculum map. 4-D-1
-
Upload
khangminh22 -
Category
Documents
-
view
2 -
download
0
Transcript of Interactive Mathematics Program Curriculum Framework
Copyright © 2013 by
Interactive Mathematics Program Curriculum Framework School: __Delaware STEM Academy________ Curricular Tool: _IMP________ Grade or Course _Year 1 (grade 9)
Standards Alignment Unit Concepts /
Big Ideas from IMP Essential Questions Assessments
Unit One: Patterns
Timeline: 6 weeks
Interpret expressions that represent a quantity in terms of its
context. CC.A-SSE.1
Understand that a function from one set (called the domain)
to another set (called the range) assigns to each element of
the domain exactly one element of the range. If f is a function
and x is an element of its domain, then f(x) denotes the output
of f corresponding to the input x. The graph of f is the graph
of the equation y = f(x). CC.F-IF.1
Recognize that sequences are functions, sometimes defined
recursively, whose domain is a subset of the integers. For
example, the Fibonacci sequence is defined recursively by
f(0) = f(1) = 1, f(n+1) = f(n) + f(n-1) for n ≥ 1. CC.F-IF.3
Write a function that describes a relationship between two
quantities. CC.F-BF.1
Determine an explicit expression, a recursive process, or
steps for calculation from a context. CC.F-BF.1a
Write arithmetic and geometric sequences both recursively
and with an explicit formula, use them to model situations,
and translate between the two forms. CC.F-BF.2
Know precise definitions of angle, circle, perpendicular line,
parallel line, and line segment, based on the undefined
notions of point, line, distance along a line, and distance
around a circular arc.CC.G-CO.1
Patterns emphasizes extended, open-ended
exploration and the search for patterns.
Important mathematics introduced or
reviewed in Patterns includes In-Out tables,
functions, variables, positive and negative
numbers, and basic geometry concepts
related to polygons. Proof, another major
theme, is developed as part of the larger
theme of reasoning and explaining.
Students’ ability to create and understand
proofs will develop over their four years in
IMP; their work in this unit is an important
start.
This unit focuses on several mathematical
ideas:
Finding, analyzing, and generalizing
geometric and numeric patterns
Analyzing and creating In-Out tables
Using variables in a variety of ways,
including to express generalizations
Developing and using general
principles for working with variables,
including the distributive property
Working with order-of-operations rules
for arithmetic
Using a concrete model to understand
and do arithmetic with positive and
negative integers
Applying algebraic ideas, including In-
Out tables, in geometric settings
Developing proofs concerning
Can students use variables and
algebraic expressions to
represent concrete situations,
generalize results, and describe
functions?
Can students use different
representations of functions—
symbolic, graphical, situational,
and numerical—and
understanding the connections
between these representations?
Can students use function
notation?
Can students model, and
computing with signed
numbers?
Can students solve equations
using trial and error?
All assessments are
listed at the end of the
curriculum map.
4-D-1
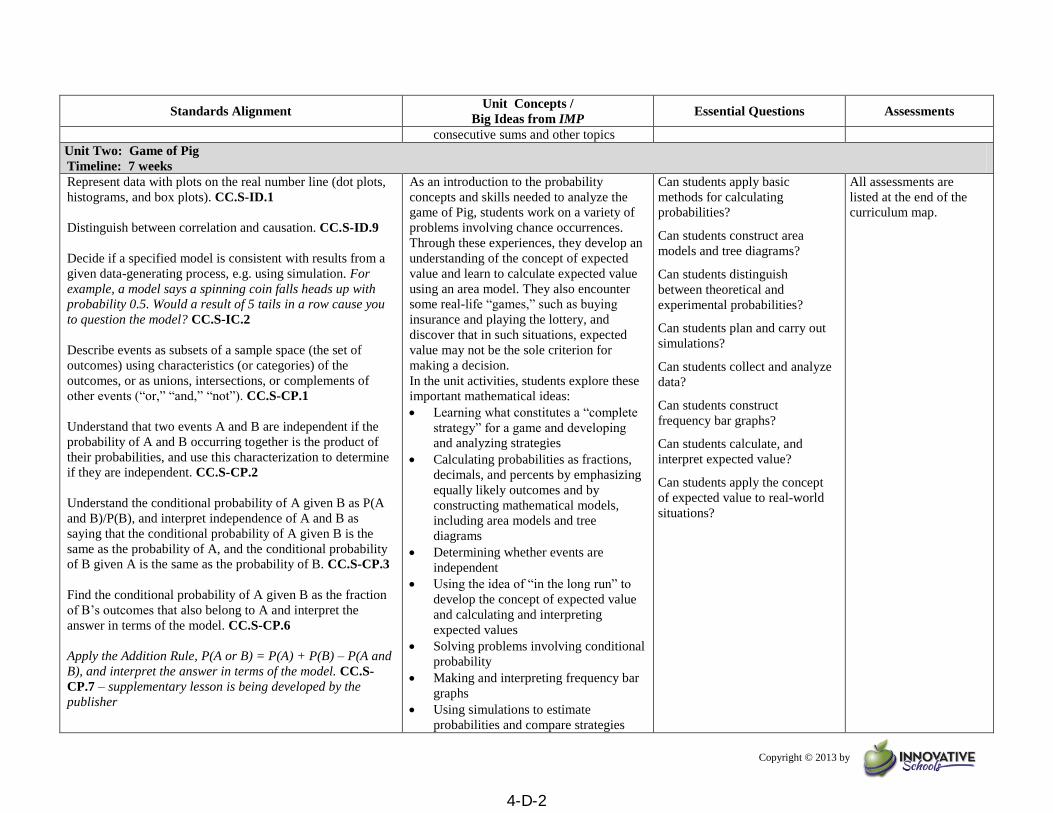
Copyright © 2013 by
Standards Alignment Unit Concepts /
Big Ideas from IMP Essential Questions Assessments
consecutive sums and other topics
Unit Two: Game of Pig
Timeline: 7 weeks
Represent data with plots on the real number line (dot plots,
histograms, and box plots). CC.S-ID.1
Distinguish between correlation and causation. CC.S-ID.9
Decide if a specified model is consistent with results from a
given data-generating process, e.g. using simulation. For
example, a model says a spinning coin falls heads up with
probability 0.5. Would a result of 5 tails in a row cause you
to question the model? CC.S-IC.2
Describe events as subsets of a sample space (the set of
outcomes) using characteristics (or categories) of the
outcomes, or as unions, intersections, or complements of
other events (“or,” “and,” “not”). CC.S-CP.1
Understand that two events A and B are independent if the
probability of A and B occurring together is the product of
their probabilities, and use this characterization to determine
if they are independent. CC.S-CP.2
Understand the conditional probability of A given B as P(A
and B)/P(B), and interpret independence of A and B as
saying that the conditional probability of A given B is the
same as the probability of A, and the conditional probability
of B given A is the same as the probability of B. CC.S-CP.3
Find the conditional probability of A given B as the fraction
of B’s outcomes that also belong to A and interpret the
answer in terms of the model. CC.S-CP.6
Apply the Addition Rule, P(A or B) = P(A) + P(B) – P(A and
B), and interpret the answer in terms of the model. CC.S-
CP.7 – supplementary lesson is being developed by the
publisher
As an introduction to the probability
concepts and skills needed to analyze the
game of Pig, students work on a variety of
problems involving chance occurrences.
Through these experiences, they develop an
understanding of the concept of expected
value and learn to calculate expected value
using an area model. They also encounter
some real-life “games,” such as buying
insurance and playing the lottery, and
discover that in such situations, expected
value may not be the sole criterion for
making a decision. In the unit activities, students explore these
important mathematical ideas:
Learning what constitutes a “complete
strategy” for a game and developing
and analyzing strategies
Calculating probabilities as fractions,
decimals, and percents by emphasizing
equally likely outcomes and by
constructing mathematical models,
including area models and tree
diagrams
Determining whether events are
independent
Using the idea of “in the long run” to
develop the concept of expected value
and calculating and interpreting
expected values
Solving problems involving conditional
probability
Making and interpreting frequency bar
graphs
Using simulations to estimate
probabilities and compare strategies
Can students apply basic
methods for calculating
probabilities?
Can students construct area
models and tree diagrams?
Can students distinguish
between theoretical and
experimental probabilities?
Can students plan and carry out
simulations?
Can students collect and analyze
data?
Can students construct
frequency bar graphs?
Can students calculate, and
interpret expected value?
Can students apply the concept
of expected value to real-world
situations?
All assessments are
listed at the end of the
curriculum map.
4-D-2
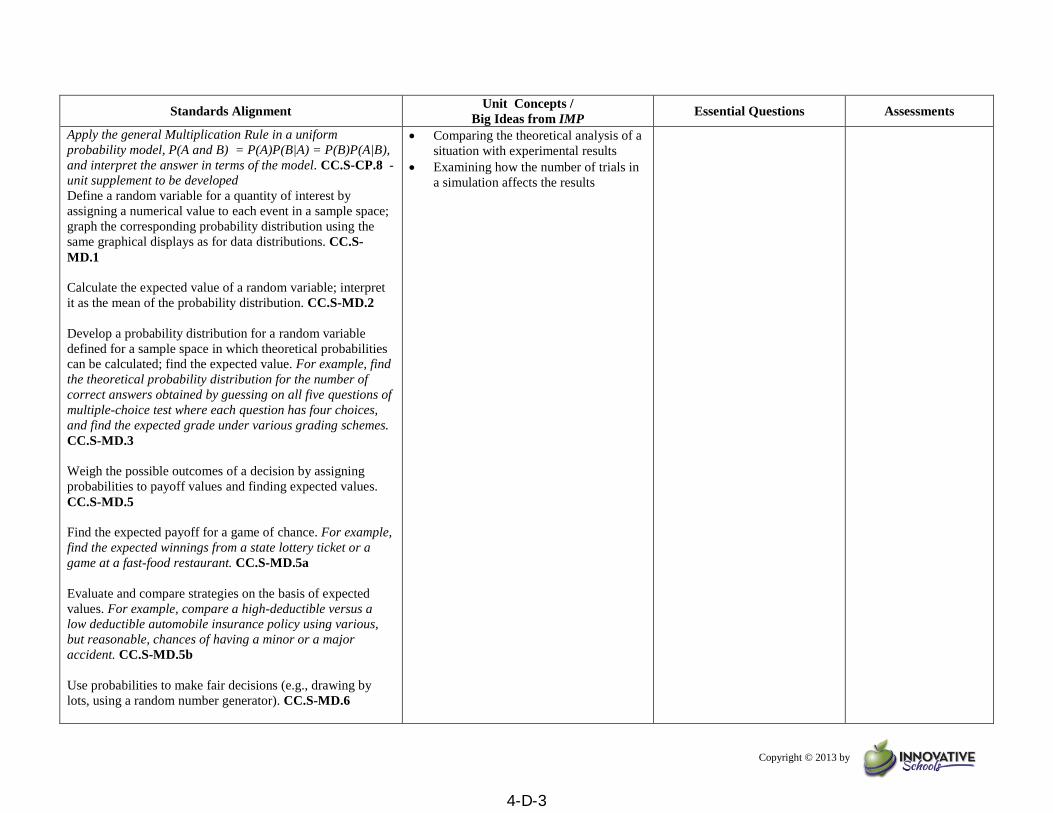
Copyright © 2013 by
Standards Alignment Unit Concepts /
Big Ideas from IMP Essential Questions Assessments
Apply the general Multiplication Rule in a uniform
probability model, P(A and B) = P(A)P(B|A) = P(B)P(A|B),
and interpret the answer in terms of the model. CC.S-CP.8 -
unit supplement to be developed
Define a random variable for a quantity of interest by
assigning a numerical value to each event in a sample space;
graph the corresponding probability distribution using the
same graphical displays as for data distributions. CC.S-
MD.1
Calculate the expected value of a random variable; interpret
it as the mean of the probability distribution. CC.S-MD.2
Develop a probability distribution for a random variable
defined for a sample space in which theoretical probabilities
can be calculated; find the expected value. For example, find
the theoretical probability distribution for the number of
correct answers obtained by guessing on all five questions of
multiple-choice test where each question has four choices,
and find the expected grade under various grading schemes.
CC.S-MD.3
Weigh the possible outcomes of a decision by assigning
probabilities to payoff values and finding expected values.
CC.S-MD.5
Find the expected payoff for a game of chance. For example,
find the expected winnings from a state lottery ticket or a
game at a fast-food restaurant. CC.S-MD.5a
Evaluate and compare strategies on the basis of expected
values. For example, compare a high-deductible versus a
low deductible automobile insurance policy using various,
but reasonable, chances of having a minor or a major
accident. CC.S-MD.5b
Use probabilities to make fair decisions (e.g., drawing by
lots, using a random number generator). CC.S-MD.6
Comparing the theoretical analysis of a
situation with experimental results
Examining how the number of trials in
a simulation affects the results
4-D-3
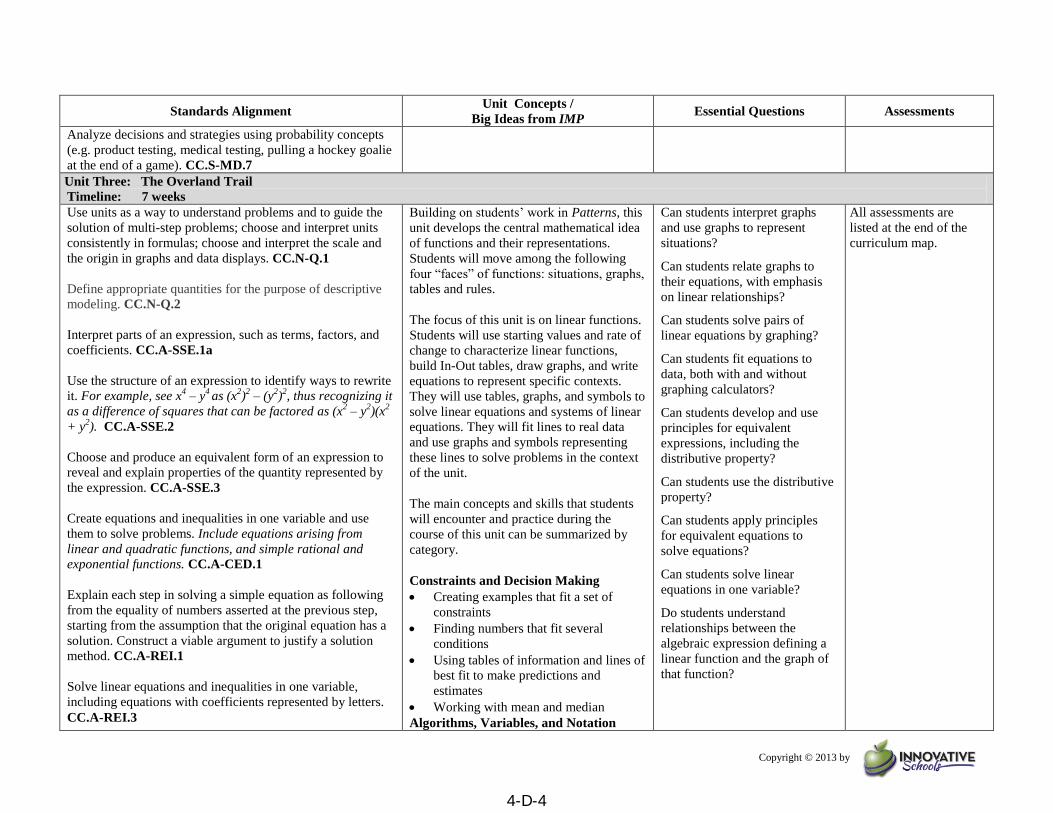
Copyright © 2013 by
Standards Alignment Unit Concepts /
Big Ideas from IMP Essential Questions Assessments
Analyze decisions and strategies using probability concepts
(e.g. product testing, medical testing, pulling a hockey goalie
at the end of a game). CC.S-MD.7
Unit Three: The Overland Trail
Timeline: 7 weeks
Use units as a way to understand problems and to guide the
solution of multi-step problems; choose and interpret units
consistently in formulas; choose and interpret the scale and
the origin in graphs and data displays. CC.N-Q.1
Define appropriate quantities for the purpose of descriptive
modeling. CC.N-Q.2
Interpret parts of an expression, such as terms, factors, and
coefficients. CC.A-SSE.1a
Use the structure of an expression to identify ways to rewrite
it. For example, see x4 – y
4 as (x
2)2 – (y
2)
2, thus recognizing it
as a difference of squares that can be factored as (x2 – y
2)(x
2
+ y2). CC.A-SSE.2
Choose and produce an equivalent form of an expression to
reveal and explain properties of the quantity represented by
the expression. CC.A-SSE.3
Create equations and inequalities in one variable and use
them to solve problems. Include equations arising from
linear and quadratic functions, and simple rational and
exponential functions. CC.A-CED.1
Explain each step in solving a simple equation as following
from the equality of numbers asserted at the previous step,
starting from the assumption that the original equation has a
solution. Construct a viable argument to justify a solution
method. CC.A-REI.1
Solve linear equations and inequalities in one variable,
including equations with coefficients represented by letters.
CC.A-REI.3
Building on students’ work in Patterns, this
unit develops the central mathematical idea
of functions and their representations.
Students will move among the following
four “faces” of functions: situations, graphs,
tables and rules.
The focus of this unit is on linear functions.
Students will use starting values and rate of
change to characterize linear functions,
build In-Out tables, draw graphs, and write
equations to represent specific contexts.
They will use tables, graphs, and symbols to
solve linear equations and systems of linear
equations. They will fit lines to real data
and use graphs and symbols representing
these lines to solve problems in the context
of the unit.
The main concepts and skills that students
will encounter and practice during the
course of this unit can be summarized by
category.
Constraints and Decision Making
Creating examples that fit a set of
constraints
Finding numbers that fit several
conditions
Using tables of information and lines of
best fit to make predictions and
estimates
Working with mean and median
Algorithms, Variables, and Notation
Can students interpret graphs
and use graphs to represent
situations?
Can students relate graphs to
their equations, with emphasis
on linear relationships?
Can students solve pairs of
linear equations by graphing?
Can students fit equations to
data, both with and without
graphing calculators?
Can students develop and use
principles for equivalent
expressions, including the
distributive property?
Can students use the distributive
property?
Can students apply principles
for equivalent equations to
solve equations?
Can students solve linear
equations in one variable?
Do students understand
relationships between the
algebraic expression defining a
linear function and the graph of
that function?
All assessments are
listed at the end of the
curriculum map.
4-D-4
Copyright © 2013 by
Standards Alignment Unit Concepts /
Big Ideas from IMP Essential Questions Assessments
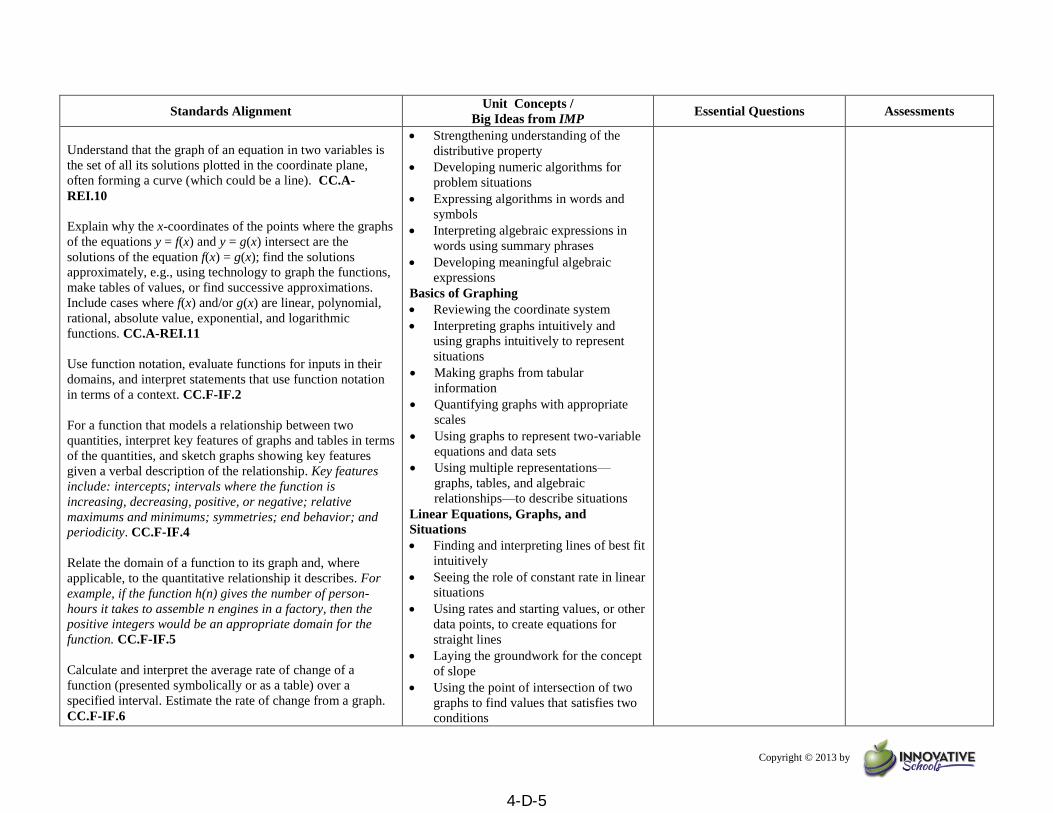
Understand that the graph of an equation in two variables is
the set of all its solutions plotted in the coordinate plane,
often forming a curve (which could be a line). CC.A-
REI.10
Explain why the x-coordinates of the points where the graphs
of the equations y = f(x) and y = g(x) intersect are the
solutions of the equation f(x) = g(x); find the solutions
approximately, e.g., using technology to graph the functions,
make tables of values, or find successive approximations.
Include cases where f(x) and/or g(x) are linear, polynomial,
rational, absolute value, exponential, and logarithmic
functions. CC.A-REI.11
Use function notation, evaluate functions for inputs in their
domains, and interpret statements that use function notation
in terms of a context. CC.F-IF.2
For a function that models a relationship between two
quantities, interpret key features of graphs and tables in terms
of the quantities, and sketch graphs showing key features
given a verbal description of the relationship. Key features
include: intercepts; intervals where the function is
increasing, decreasing, positive, or negative; relative
maximums and minimums; symmetries; end behavior; and
periodicity. CC.F-IF.4
Relate the domain of a function to its graph and, where
applicable, to the quantitative relationship it describes. For
example, if the function h(n) gives the number of person-
hours it takes to assemble n engines in a factory, then the
positive integers would be an appropriate domain for the
function. CC.F-IF.5
Calculate and interpret the average rate of change of a
function (presented symbolically or as a table) over a
specified interval. Estimate the rate of change from a graph.
CC.F-IF.6
Strengthening understanding of the
distributive property
Developing numeric algorithms for
problem situations
Expressing algorithms in words and
symbols
Interpreting algebraic expressions in
words using summary phrases
Developing meaningful algebraic
expressions
Basics of Graphing
Reviewing the coordinate system
Interpreting graphs intuitively and
using graphs intuitively to represent
situations
Making graphs from tabular
information
Quantifying graphs with appropriate
scales
Using graphs to represent two-variable
equations and data sets
Using multiple representations—
graphs, tables, and algebraic
relationships—to describe situations
Linear Equations, Graphs, and
Situations
Finding and interpreting lines of best fit
intuitively
Seeing the role of constant rate in linear
situations
Using rates and starting values, or other
data points, to create equations for
straight lines
Laying the groundwork for the concept
of slope
Using the point of intersection of two
graphs to find values that satisfies two
conditions
4-D-5
Copyright © 2013 by
Standards Alignment Unit Concepts /
Big Ideas from IMP Essential Questions Assessments
Graph functions expressed symbolically and show key
features of the graph, by hand in simple cases and using
technology for more complicated cases. CC.F-IF.7
Graph square root, cube root, and piecewise-defined
functions, including step functions and absolute value
functions. CC.F-IF.7b
Prove that linear functions grow by equal differences over
equal intervals, and that exponential functions grow by equal
factors over equal intervals. CC.F-LE.1a
Recognize situations in which one quantity changes at a
constant rate per unit interval relative to another. CC.F-
LE.1b
Interpret the parameters in a linear or exponential function in
terms of a context. CC.F-LE.5
Represent data on two quantitative variables on a scatter plot
and describe how the variables are related. CC.S-ID.6
Use a model function fitted to the data to solve problems in
the context of the data. Use given model functions or choose
a function suggested by the context. Emphasize linear and
exponential models. CC.S-ID.6a
Informally assess the fit of a model function by plotting and
analyzing residuals. CC.S-ID.6b – unit supplement to be
developed
Fit a linear function for scatter plots that suggest a linear
association. CC.S-ID.6c
Interpret the slope (rate of change) and the intercept
(constant term) of a linear fit in the context of the data.
CC.S-ID.7
Solving linear equations for one
variable in terms of another
Solving problems involving two linear
conditions
Solving linear equations in one variable
Graphs and Technology
Making and interpreting graphs on a
graphing calculator
Using the zoom and trace features to
get information from a graphing
calculator
4-D-6
Copyright © 2013 by
Standards Alignment Unit Concepts /
Big Ideas from IMP Essential Questions Assessments
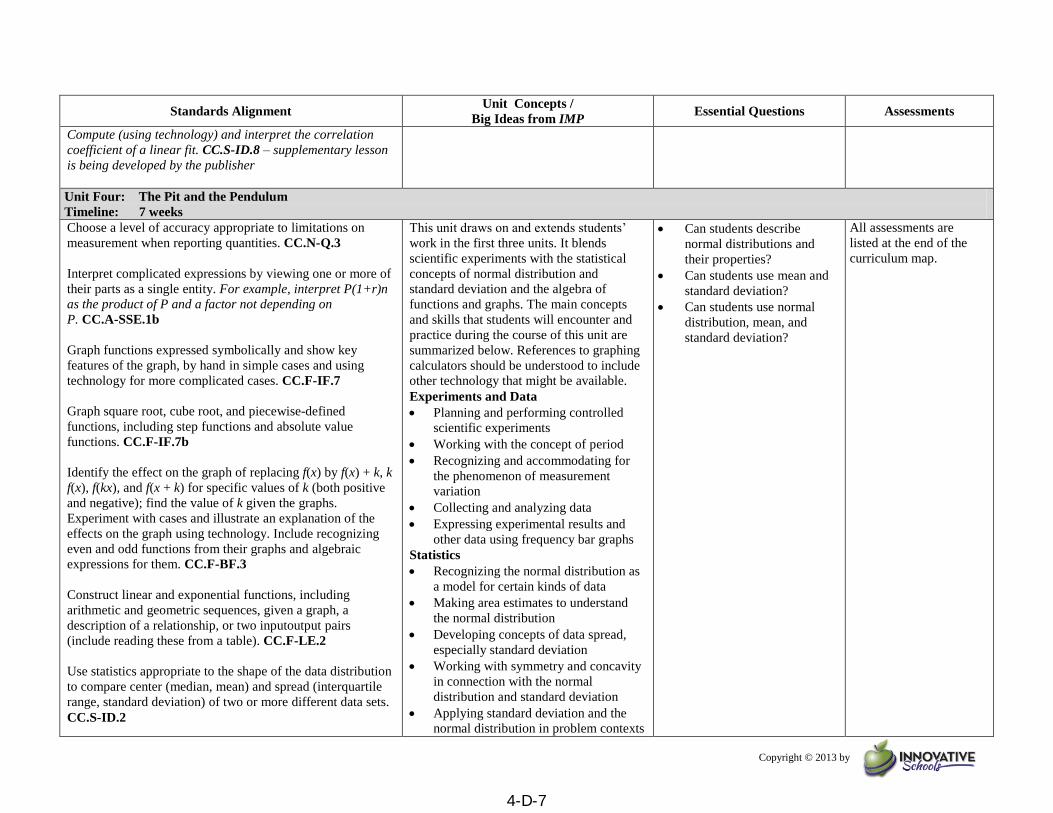
Compute (using technology) and interpret the correlation
coefficient of a linear fit. CC.S-ID.8 – supplementary lesson
is being developed by the publisher
Unit Four: The Pit and the Pendulum
Timeline: 7 weeks
Choose a level of accuracy appropriate to limitations on
measurement when reporting quantities. CC.N-Q.3
Interpret complicated expressions by viewing one or more of
their parts as a single entity. For example, interpret P(1+r)n
as the product of P and a factor not depending on
P. CC.A-SSE.1b
Graph functions expressed symbolically and show key
features of the graph, by hand in simple cases and using
technology for more complicated cases. CC.F-IF.7
Graph square root, cube root, and piecewise-defined
functions, including step functions and absolute value
functions. CC.F-IF.7b
Identify the effect on the graph of replacing f(x) by f(x) + k, k
f(x), f(kx), and f(x + k) for specific values of k (both positive
and negative); find the value of k given the graphs.
Experiment with cases and illustrate an explanation of the
effects on the graph using technology. Include recognizing
even and odd functions from their graphs and algebraic
expressions for them. CC.F-BF.3
Construct linear and exponential functions, including
arithmetic and geometric sequences, given a graph, a
description of a relationship, or two inputoutput pairs
(include reading these from a table). CC.F-LE.2
Use statistics appropriate to the shape of the data distribution
to compare center (median, mean) and spread (interquartile
range, standard deviation) of two or more different data sets.
CC.S-ID.2
This unit draws on and extends students’
work in the first three units. It blends
scientific experiments with the statistical
concepts of normal distribution and
standard deviation and the algebra of
functions and graphs. The main concepts
and skills that students will encounter and
practice during the course of this unit are
summarized below. References to graphing
calculators should be understood to include
other technology that might be available.
Experiments and Data Planning and performing controlled
scientific experiments
Working with the concept of period
Recognizing and accommodating for
the phenomenon of measurement
variation
Collecting and analyzing data
Expressing experimental results and
other data using frequency bar graphs
Statistics Recognizing the normal distribution as
a model for certain kinds of data
Making area estimates to understand
the normal distribution
Developing concepts of data spread,
especially standard deviation
Working with symmetry and concavity
in connection with the normal
distribution and standard deviation
Applying standard deviation and the
normal distribution in problem contexts
Can students describe
normal distributions and
their properties?
Can students use mean and
standard deviation?
Can students use normal
distribution, mean, and
standard deviation?
All assessments are
listed at the end of the
curriculum map.
4-D-7

Copyright © 2013 by
Standards Alignment Unit Concepts /
Big Ideas from IMP Essential Questions Assessments
Interpret differences in shape, center, and spread in the
context of the data sets, accounting for possible effects of
extreme data points (outliers). CC.S-ID.3
Use the mean and standard deviation of a data set to fit it to a
normal distribution and to estimate population percentages.
Recognize that there are data sets for which such a procedure
is not appropriate. Use calculators, spreadsheets and tables to
estimate areas under the normal curve. CC.S-ID.4
Understand that statistics is a process for making inferences
about population parameters based on a random sample from
that population. CC.S-IC.1
Develop a probability distribution for a random variable
defined for a sample space in which probabilities are
assigned empirically; find the expected value. For example,
find a current data distribution on the number of TV sets per
household in the United States and calculate the expected
number of sets per household. How many TV sets would you
expect to find in 100 randomly selected households? CC.S-
MD.4
Distinguishing between population
standard deviation and sample
Calculating the mean and standard
deviation of data sets, both by hand and
with calculators
Using standard deviation to decide
whether a variation in experimental
results is significant
Functions and Graphs Using function notation
Using graphing calculators to explore
the graphs of various functions
Fitting a function to data using a
graphing calculator
Making predictions based on curve-
fitting
Unit Five: Shadows
Timeline: 7 weeks
Rearrange formulas to highlight a quantity of interest, using
the same reasoning as in solving equations. For example,
rearrange Ohm’s law V = IR to highlight resistance R.
CC.A-CED.4
Know precise definitions of angle, circle, perpendicular line,
parallel line, and line segment, based on the undefined
notions of point, line, distance along a line, and
distance around a circular arc.CC.G-CO.1
Use geometric descriptions of rigid motions to transform
figures and to predict the effect of a rigid motion on a figure;
given two figures, use the definition of congruence
The concept of similarity is the central
theme of this unit. Through this concept,
students explore the following important
ideas from geometry and algebra.
Similarity and Congruence
Developing intuitive ideas about the
meaning of “same shape” and learning
the formal definitions of similar and
congruent
Discovering the special properties of
triangles in connection with similarity,
as well as other features of triangles as
special polygons
Do students understand the
meaning of angles and angle
measurement?
Can students apply the
relationships among angles of
polygons, including angle-sum
formulas?
Can students apply criteria for
similarity and congruence?
Can students use properties of
similar polygons to solve real-
All assessments are
listed at the end of the
curriculum map.
4-D-8
Copyright © 2013 by
Standards Alignment Unit Concepts /
Big Ideas from IMP Essential Questions Assessments
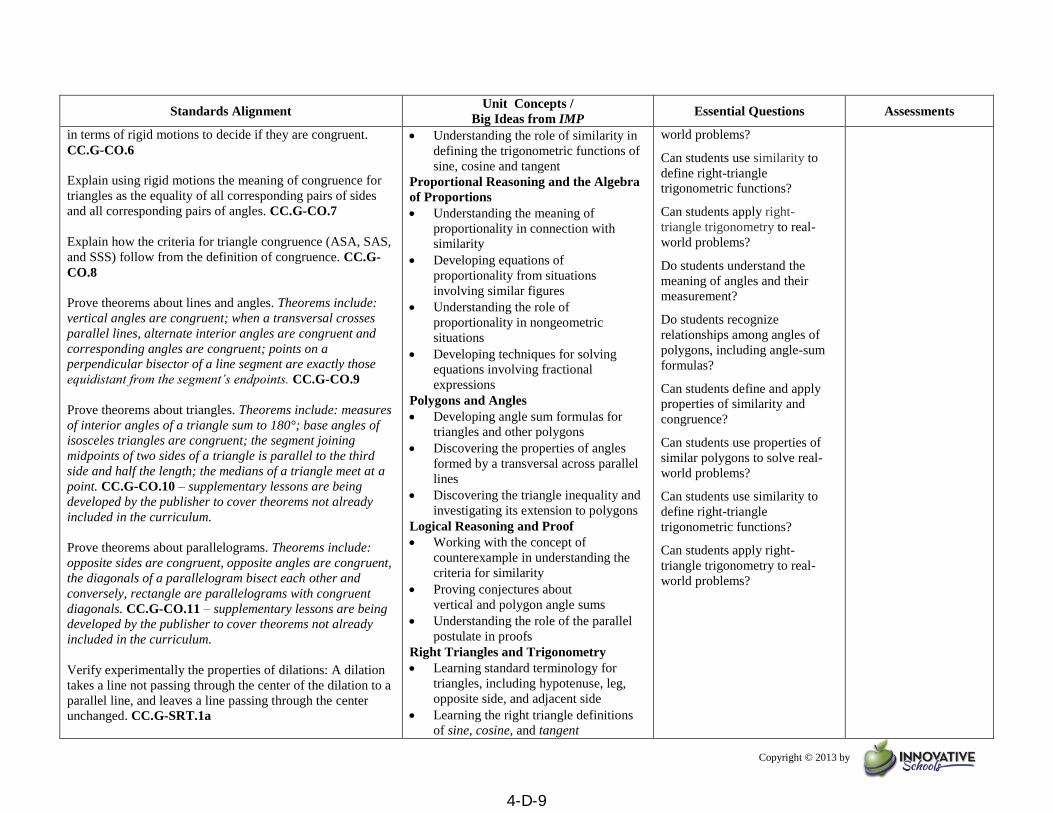
in terms of rigid motions to decide if they are congruent.
CC.G-CO.6
Explain using rigid motions the meaning of congruence for
triangles as the equality of all corresponding pairs of sides
and all corresponding pairs of angles. CC.G-CO.7
Explain how the criteria for triangle congruence (ASA, SAS,
and SSS) follow from the definition of congruence. CC.G-
CO.8
Prove theorems about lines and angles. Theorems include:
vertical angles are congruent; when a transversal crosses
parallel lines, alternate interior angles are congruent and
corresponding angles are congruent; points on a
perpendicular bisector of a line segment are exactly those
equidistant from the segment’s endpoints. CC.G-CO.9
Prove theorems about triangles. Theorems include: measures
of interior angles of a triangle sum to 180°; base angles of
isosceles triangles are congruent; the segment joining
midpoints of two sides of a triangle is parallel to the third
side and half the length; the medians of a triangle meet at a
point. CC.G-CO.10 – supplementary lessons are being
developed by the publisher to cover theorems not already
included in the curriculum.
Prove theorems about parallelograms. Theorems include:
opposite sides are congruent, opposite angles are congruent,
the diagonals of a parallelogram bisect each other and
conversely, rectangle are parallelograms with congruent
diagonals. CC.G-CO.11 – supplementary lessons are being
developed by the publisher to cover theorems not already
included in the curriculum.
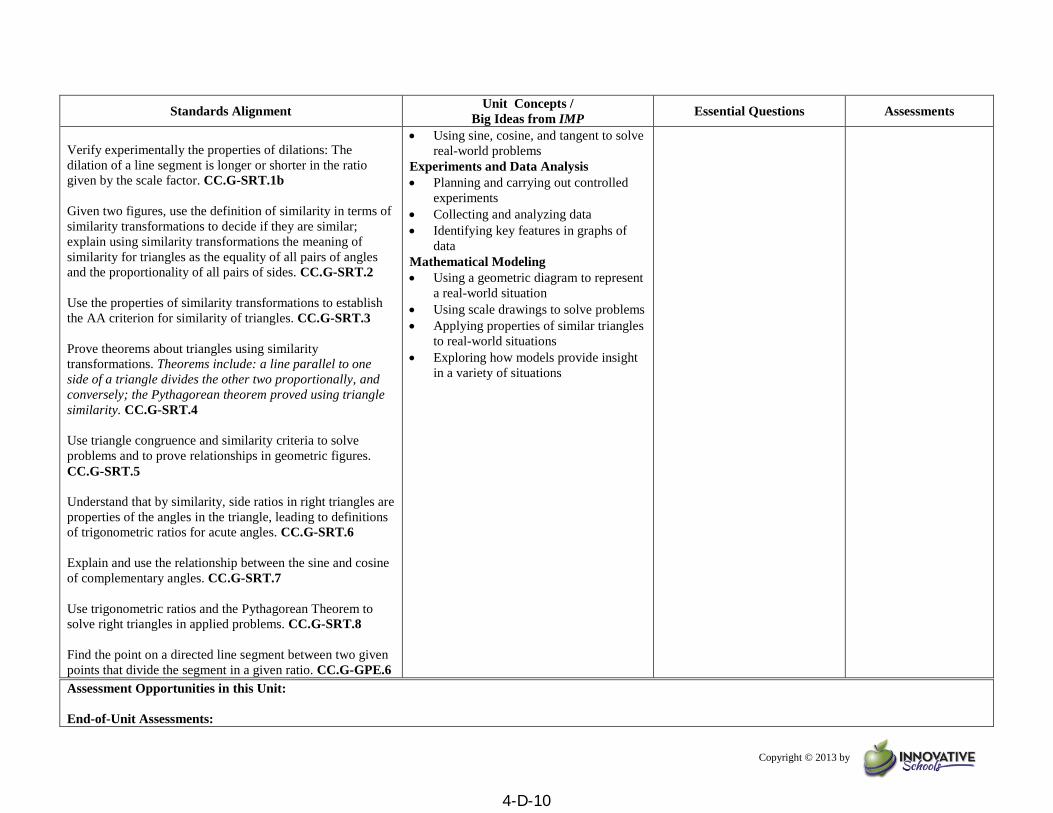
Verify experimentally the properties of dilations: A dilation
takes a line not passing through the center of the dilation to a
parallel line, and leaves a line passing through the center
unchanged. CC.G-SRT.1a
Understanding the role of similarity in
defining the trigonometric functions of
sine, cosine and tangent
Proportional Reasoning and the Algebra
of Proportions
Understanding the meaning of
proportionality in connection with
similarity
Developing equations of
proportionality from situations
involving similar figures
Understanding the role of
proportionality in nongeometric
situations
Developing techniques for solving
equations involving fractional
expressions
Polygons and Angles
Developing angle sum formulas for
triangles and other polygons
Discovering the properties of angles
formed by a transversal across parallel
lines
Discovering the triangle inequality and
investigating its extension to polygons
Logical Reasoning and Proof
Working with the concept of
counterexample in understanding the
criteria for similarity
Proving conjectures about
vertical and polygon angle sums
Understanding the role of the parallel
postulate in proofs
Right Triangles and Trigonometry
Learning standard terminology for
triangles, including hypotenuse, leg,
opposite side, and adjacent side
Learning the right triangle definitions
of sine, cosine, and tangent
world problems?
Can students use similarity to
define right-triangle
trigonometric functions?
Can students apply right-
triangle trigonometry to real-
world problems?
Do students understand the
meaning of angles and their
measurement?
Do students recognize
relationships among angles of
polygons, including angle-sum
formulas?
Can students define and apply
properties of similarity and
congruence?
Can students use properties of
similar polygons to solve real-
world problems?
Can students use similarity to
define right-triangle
trigonometric functions?
Can students apply right-
triangle trigonometry to real-
world problems?
4-D-9
Copyright © 2013 by
Standards Alignment Unit Concepts /
Big Ideas from IMP Essential Questions Assessments
Verify experimentally the properties of dilations: The
dilation of a line segment is longer or shorter in the ratio
given by the scale factor. CC.G-SRT.1b
Given two figures, use the definition of similarity in terms of
similarity transformations to decide if they are similar;
explain using similarity transformations the meaning of
similarity for triangles as the equality of all pairs of angles
and the proportionality of all pairs of sides. CC.G-SRT.2
Use the properties of similarity transformations to establish
the AA criterion for similarity of triangles. CC.G-SRT.3
Prove theorems about triangles using similarity
transformations. Theorems include: a line parallel to one
side of a triangle divides the other two proportionally, and
conversely; the Pythagorean theorem proved using triangle
similarity. CC.G-SRT.4
Use triangle congruence and similarity criteria to solve
problems and to prove relationships in geometric figures.
CC.G-SRT.5
Understand that by similarity, side ratios in right triangles are
properties of the angles in the triangle, leading to definitions
of trigonometric ratios for acute angles. CC.G-SRT.6
Explain and use the relationship between the sine and cosine
of complementary angles. CC.G-SRT.7
Use trigonometric ratios and the Pythagorean Theorem to
solve right triangles in applied problems. CC.G-SRT.8
Find the point on a directed line segment between two given
points that divide the segment in a given ratio. CC.G-GPE.6
Using sine, cosine, and tangent to solve
real-world problems
Experiments and Data Analysis
Planning and carrying out controlled
experiments
Collecting and analyzing data
Identifying key features in graphs of
data
Mathematical Modeling
Using a geometric diagram to represent
a real-world situation
Using scale drawings to solve problems
Applying properties of similar triangles
to real-world situations
Exploring how models provide insight
in a variety of situations
Assessment Opportunities in this Unit:
End-of-Unit Assessments:
4-D-10
Copyright © 2013 by
Each unit concludes with in-class and take-home assessments. The in-class assessment is intentionally short so that time pressures will not affect student performance.
Students may use graphing calculators and their notes from previous work when they take the assessments.
On-Going Assessments:
Ongoing assessment includes the daily work of determining how well students understand key ideas and what level of achievement they have attained in acquiring key
skills. Students’ written and oral work provides many opportunities for teachers to gather this information.
Presentations on Calculator Exploration: These presentations will give you information on how comfortable students are with calculators and open-ended
investigation.
Pulling Out Rules: This activity will help you gauge how well students understand the basic ideas of In-Out tables and evaluate their ability in writing rules to
describe tables.
You’re the Chef: This summary activity will tell you how well students understand the arithmetic of positive and negative integers.
Presentations on Consecutive Sums: These presentations will indicate how students are developing in their ability to conduct independent mathematical
investigations.
An Angular Summary: This activity will help you gauge students’ understanding of the sum of the angles in a polygon and related formulas.
Border Varieties: This activity will reflect students’ understanding of the use of variables.
Pig Strategies: This activity will help you gauge how well students understand the rules of Pig and assess their comfort level with the idea of strategy.
0 to 1, or Never to Always: This activity will illustrate students’ grasp of the 0-to-1 scale for probability.
Two-Dice Sums and Products: This activity will show how well students understand and can work with two-dimensional area models.
Spinner Give and Take: This activity can provide a baseline of students’ initial understanding of the meaning of “the long run,” in preparation for work with
expected value.
Spins and Draws: This activity will tell you how well students understand and can work with expected value.
A Fair Deal for the Carrier?: This activity will inform you about students’ ability to find probabilities in two-stage situations.
Little Pig Strategies: This activity will tell you how well prepared students are for the detailed analysis of Little Pig.
The Best Little Pig: This activity will inform you of students’ grasp of the big picture in the analysis of Little Pig.
Creating Families: This assignment will give you information on how well students can deal with verbal constraints.
Laced Travelers: This activity will tell you whether students can put arithmetic processes into words.
Ox Expressions at Home: This assignment will help you assess how well students understand meaningful algebraic expressions
Graph Sketches: This activity will give you a sense of how well students understand graphs.
Who Will Make It? This activity can help you gauge students’ ability to make meaningful inferences from graphs.
All Four, One--Linear Functions: This assignment will give you information about students’ understanding of the connections among different ways to represent a
situation.
Straight Line Reflections: This activity will give you a sense of how well students understand concepts related to straight-line graphs.
More Fair Share for Hired Hands: This assignment can provide information on student understanding of the connection between graphs and equations.
Family Comparisons by Algebra: This activity will help you evaluate students’ ability to represent situations using equations and their facility with solving linear
equations.
Initial Experiments: This activity will tell you how well students understand the idea of isolating a single variable.
Pulse Analysis: This assignment will tell you about students’ understanding of mean and frequency bar graphs.
Kai and Mai Spread Data: This activity will give you a baseline of information about students’ understanding of data spread.
Penny Weight Revisited: This activity will guide you in determining students’ intuitive understanding of standard deviation.
Pendulum Conclusions: This assignment will tell you how well students can reason using the concept of standard deviation.
4-D-11
Copyright © 2013 by
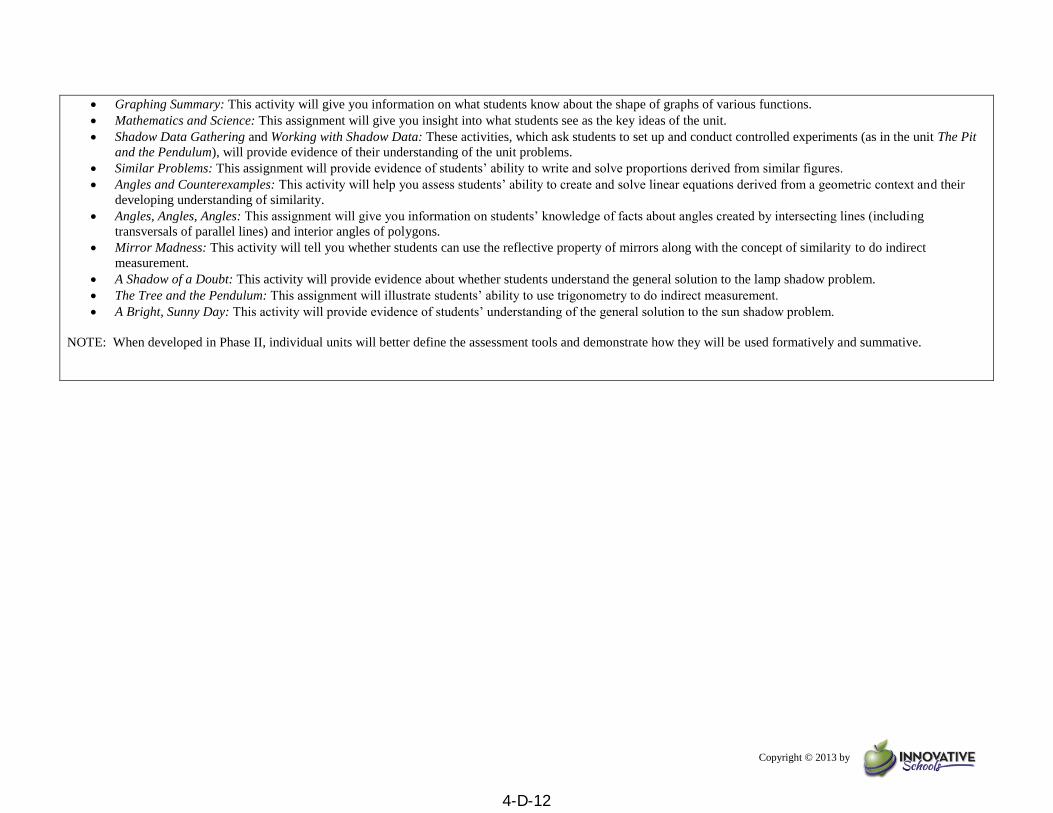
Graphing Summary: This activity will give you information on what students know about the shape of graphs of various functions.
Mathematics and Science: This assignment will give you insight into what students see as the key ideas of the unit.
Shadow Data Gathering and Working with Shadow Data: These activities, which ask students to set up and conduct controlled experiments (as in the unit The Pit
and the Pendulum), will provide evidence of their understanding of the unit problems.
Similar Problems: This assignment will provide evidence of students’ ability to write and solve proportions derived from similar figures.
Angles and Counterexamples: This activity will help you assess students’ ability to create and solve linear equations derived from a geometric context and their
developing understanding of similarity.
Angles, Angles, Angles: This assignment will give you information on students’ knowledge of facts about angles created by intersecting lines (including
transversals of parallel lines) and interior angles of polygons.
Mirror Madness: This activity will tell you whether students can use the reflective property of mirrors along with the concept of similarity to do indirect
measurement.
A Shadow of a Doubt: This activity will provide evidence about whether students understand the general solution to the lamp shadow problem.
The Tree and the Pendulum: This assignment will illustrate students’ ability to use trigonometry to do indirect measurement.
A Bright, Sunny Day: This activity will provide evidence of students’ understanding of the general solution to the sun shadow problem.
NOTE: When developed in Phase II, individual units will better define the assessment tools and demonstrate how they will be used formatively and summative.
4-D-12
Copyright © 2013 by
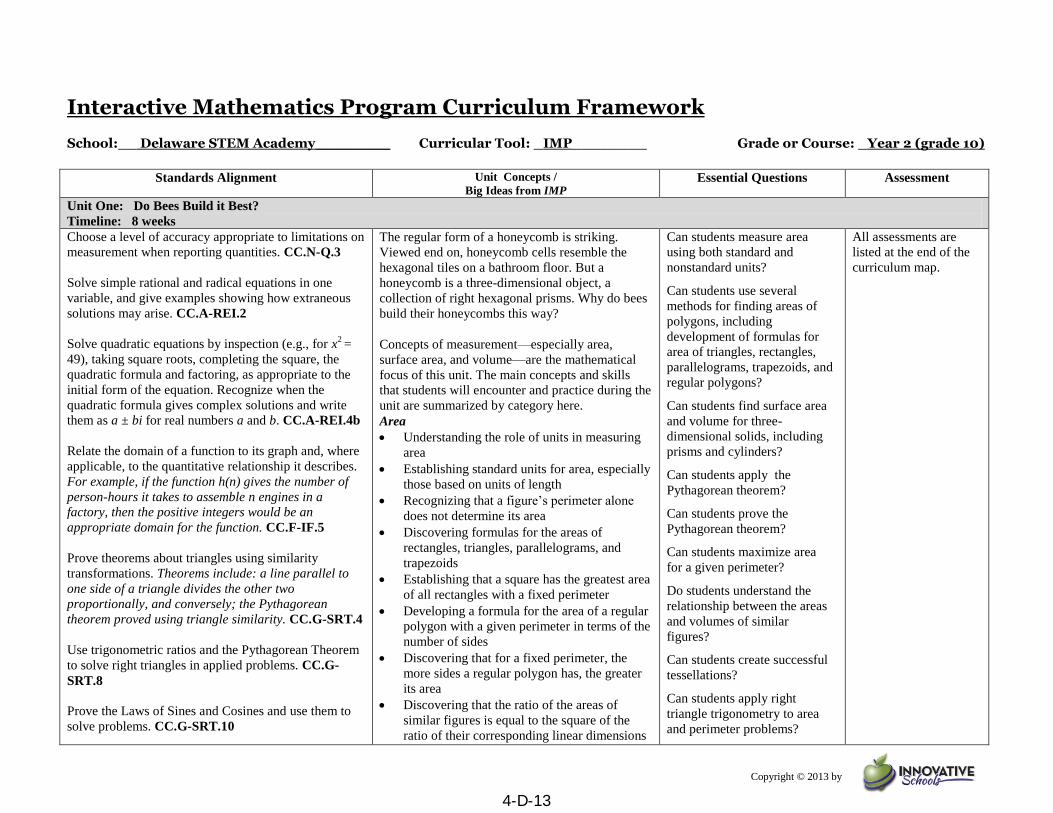
Interactive Mathematics Program Curriculum Framework School:__ Delaware STEM Academy________ Curricular Tool: _IMP________ Grade or Course: _Year 2 (grade 10)
Standards Alignment
Unit Concepts /
Big Ideas from IMP Essential Questions Assessment
Unit One: Do Bees Build it Best?
Timeline: 8 weeks
Choose a level of accuracy appropriate to limitations on
measurement when reporting quantities. CC.N-Q.3
Solve simple rational and radical equations in one
variable, and give examples showing how extraneous
solutions may arise. CC.A-REI.2
Solve quadratic equations by inspection (e.g., for x2 =
49), taking square roots, completing the square, the
quadratic formula and factoring, as appropriate to the
initial form of the equation. Recognize when the
quadratic formula gives complex solutions and write
them as a ± bi for real numbers a and b. CC.A-REI.4b
Relate the domain of a function to its graph and, where
applicable, to the quantitative relationship it describes.
For example, if the function h(n) gives the number of
person-hours it takes to assemble n engines in a
factory, then the positive integers would be an
appropriate domain for the function. CC.F-IF.5
Prove theorems about triangles using similarity
transformations. Theorems include: a line parallel to
one side of a triangle divides the other two
proportionally, and conversely; the Pythagorean
theorem proved using triangle similarity. CC.G-SRT.4
Use trigonometric ratios and the Pythagorean Theorem
to solve right triangles in applied problems. CC.G-
SRT.8
Prove the Laws of Sines and Cosines and use them to
solve problems. CC.G-SRT.10
The regular form of a honeycomb is striking.
Viewed end on, honeycomb cells resemble the
hexagonal tiles on a bathroom floor. But a
honeycomb is a three-dimensional object, a
collection of right hexagonal prisms. Why do bees
build their honeycombs this way?
Concepts of measurement—especially area,
surface area, and volume—are the mathematical
focus of this unit. The main concepts and skills
that students will encounter and practice during the
unit are summarized by category here.
Area
Understanding the role of units in measuring
area
Establishing standard units for area, especially
those based on units of length
Recognizing that a figure’s perimeter alone
does not determine its area
Discovering formulas for the areas of
rectangles, triangles, parallelograms, and
trapezoids
Establishing that a square has the greatest area
of all rectangles with a fixed perimeter
Developing a formula for the area of a regular
polygon with a given perimeter in terms of the
number of sides
Discovering that for a fixed perimeter, the
more sides a regular polygon has, the greater
its area
Discovering that the ratio of the areas of
similar figures is equal to the square of the
ratio of their corresponding linear dimensions
Can students measure area
using both standard and
nonstandard units?
Can students use several
methods for finding areas of
polygons, including
development of formulas for
area of triangles, rectangles,
parallelograms, trapezoids, and
regular polygons?
Can students find surface area
and volume for three-
dimensional solids, including
prisms and cylinders?
Can students apply the
Pythagorean theorem?
Can students prove the
Pythagorean theorem?
Can students maximize area
for a given perimeter?
Do students understand the
relationship between the areas
and volumes of similar
figures?
Can students create successful
tessellations?
Can students apply right
triangle trigonometry to area
and perimeter problems?
All assessments are
listed at the end of the
curriculum map.
4-D-13
Copyright © 2013 by
Standards Alignment
Unit Concepts /
Big Ideas from IMP Essential Questions Assessment
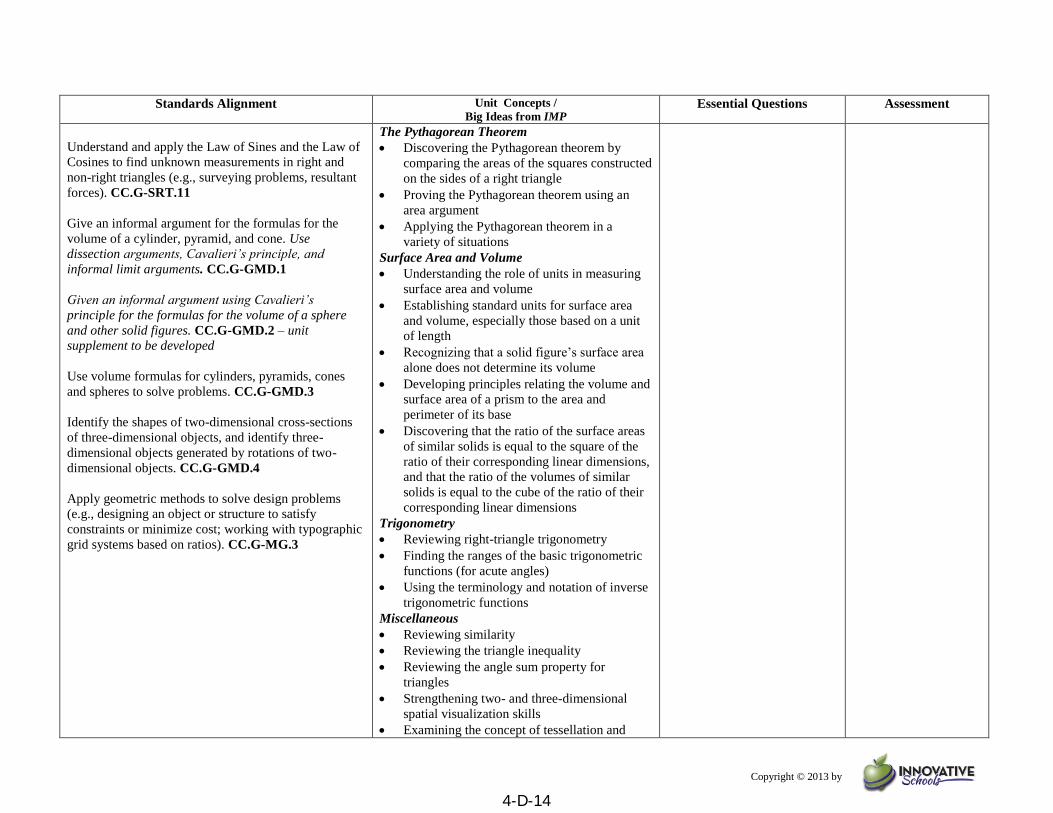
Understand and apply the Law of Sines and the Law of
Cosines to find unknown measurements in right and
non-right triangles (e.g., surveying problems, resultant
forces). CC.G-SRT.11
Give an informal argument for the formulas for the
volume of a cylinder, pyramid, and cone. Use
dissection arguments, Cavalieri’s principle, and
informal limit arguments. CC.G-GMD.1
Given an informal argument using Cavalieri’s
principle for the formulas for the volume of a sphere
and other solid figures. CC.G-GMD.2 – unit
supplement to be developed
Use volume formulas for cylinders, pyramids, cones
and spheres to solve problems. CC.G-GMD.3
Identify the shapes of two-dimensional cross-sections
of three-dimensional objects, and identify three-
dimensional objects generated by rotations of two-
dimensional objects. CC.G-GMD.4
Apply geometric methods to solve design problems
(e.g., designing an object or structure to satisfy
constraints or minimize cost; working with typographic
grid systems based on ratios). CC.G-MG.3
The Pythagorean Theorem
Discovering the Pythagorean theorem by
comparing the areas of the squares constructed
on the sides of a right triangle
Proving the Pythagorean theorem using an
area argument
Applying the Pythagorean theorem in a
variety of situations
Surface Area and Volume
Understanding the role of units in measuring
surface area and volume
Establishing standard units for surface area
and volume, especially those based on a unit
of length
Recognizing that a solid figure’s surface area
alone does not determine its volume
Developing principles relating the volume and
surface area of a prism to the area and
perimeter of its base
Discovering that the ratio of the surface areas
of similar solids is equal to the square of the
ratio of their corresponding linear dimensions,
and that the ratio of the volumes of similar
solids is equal to the cube of the ratio of their
corresponding linear dimensions
Trigonometry
Reviewing right-triangle trigonometry
Finding the ranges of the basic trigonometric
functions (for acute angles)
Using the terminology and notation of inverse
trigonometric functions
Miscellaneous
Reviewing similarity
Reviewing the triangle inequality
Reviewing the angle sum property for
triangles
Strengthening two- and three-dimensional
spatial visualization skills
Examining the concept of tessellation and
4-D-14
Copyright © 2013 by
Standards Alignment
Unit Concepts /
Big Ideas from IMP Essential Questions Assessment
discovering which regular polygons tessellate
Developing some properties of square-root
radicals
Developing the general concept of an inverse
function
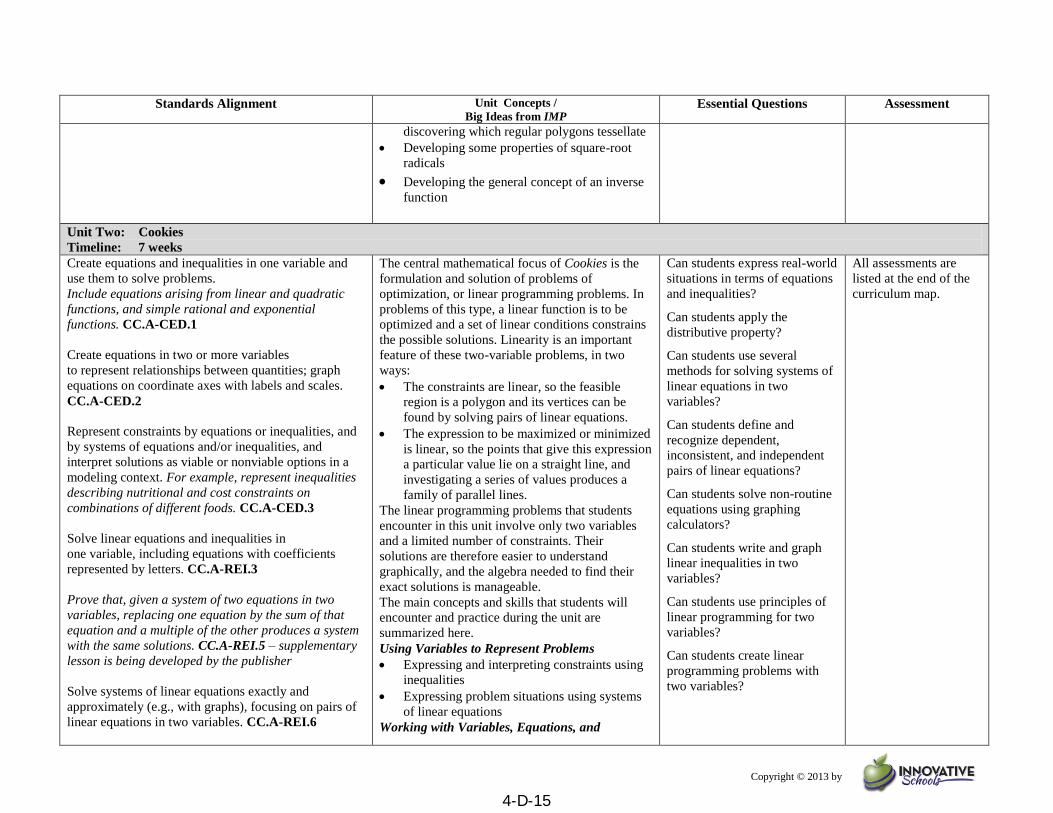
Unit Two: Cookies
Timeline: 7 weeks Create equations and inequalities in one variable and
use them to solve problems.
Include equations arising from linear and quadratic
functions, and simple rational and exponential
functions. CC.A-CED.1
Create equations in two or more variables
to represent relationships between quantities; graph
equations on coordinate axes with labels and scales.
CC.A-CED.2
Represent constraints by equations or inequalities, and
by systems of equations and/or inequalities, and
interpret solutions as viable or nonviable options in a
modeling context. For example, represent inequalities
describing nutritional and cost constraints on
combinations of different foods. CC.A-CED.3
Solve linear equations and inequalities in
one variable, including equations with coefficients
represented by letters. CC.A-REI.3
Prove that, given a system of two equations in two
variables, replacing one equation by the sum of that
equation and a multiple of the other produces a system
with the same solutions. CC.A-REI.5 – supplementary
lesson is being developed by the publisher
Solve systems of linear equations exactly and
approximately (e.g., with graphs), focusing on pairs of
linear equations in two variables. CC.A-REI.6
The central mathematical focus of Cookies is the
formulation and solution of problems of
optimization, or linear programming problems. In
problems of this type, a linear function is to be
optimized and a set of linear conditions constrains
the possible solutions. Linearity is an important
feature of these two-variable problems, in two
ways:
The constraints are linear, so the feasible
region is a polygon and its vertices can be
found by solving pairs of linear equations.
The expression to be maximized or minimized
is linear, so the points that give this expression
a particular value lie on a straight line, and
investigating a series of values produces a
family of parallel lines.
The linear programming problems that students
encounter in this unit involve only two variables
and a limited number of constraints. Their
solutions are therefore easier to understand
graphically, and the algebra needed to find their
exact solutions is manageable.
The main concepts and skills that students will
encounter and practice during the unit are
summarized here.
Using Variables to Represent Problems
Expressing and interpreting constraints using
inequalities
Expressing problem situations using systems
of linear equations
Working with Variables, Equations, and
Can students express real-world
situations in terms of equations
and inequalities?
Can students apply the
distributive property?
Can students use several
methods for solving systems of
linear equations in two
variables?
Can students define and
recognize dependent,
inconsistent, and independent
pairs of linear equations?
Can students solve non-routine
equations using graphing
calculators?
Can students write and graph
linear inequalities in two
variables?
Can students use principles of
linear programming for two
variables?
Can students create linear
programming problems with
two variables?
All assessments are
listed at the end of the
curriculum map.
4-D-15
Copyright © 2013 by
Standards Alignment
Unit Concepts /
Big Ideas from IMP Essential Questions Assessment
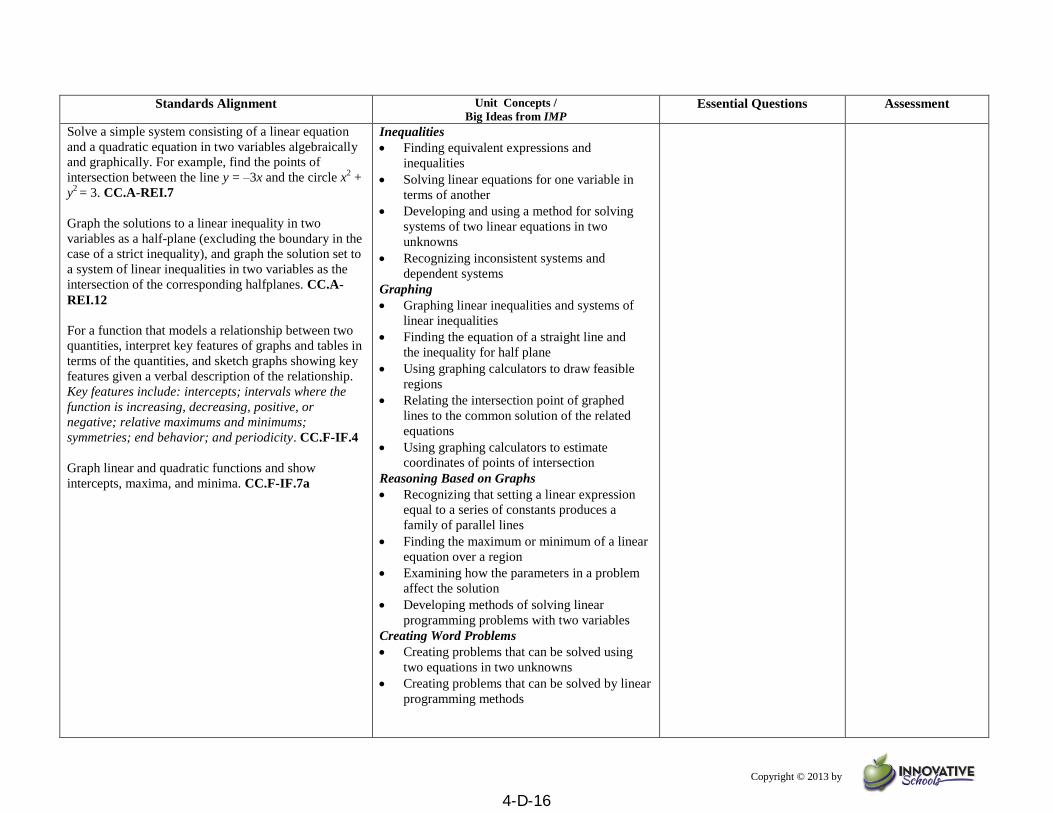
Solve a simple system consisting of a linear equation
and a quadratic equation in two variables algebraically
and graphically. For example, find the points of
intersection between the line y = –3x and the circle x2 +
y2 = 3. CC.A-REI.7
Graph the solutions to a linear inequality in two
variables as a half-plane (excluding the boundary in the
case of a strict inequality), and graph the solution set to
a system of linear inequalities in two variables as the
intersection of the corresponding halfplanes. CC.A-
REI.12
For a function that models a relationship between two
quantities, interpret key features of graphs and tables in
terms of the quantities, and sketch graphs showing key
features given a verbal description of the relationship.
Key features include: intercepts; intervals where the
function is increasing, decreasing, positive, or
negative; relative maximums and minimums;
symmetries; end behavior; and periodicity. CC.F-IF.4
Graph linear and quadratic functions and show
intercepts, maxima, and minima. CC.F-IF.7a
Inequalities
Finding equivalent expressions and
inequalities
Solving linear equations for one variable in
terms of another
Developing and using a method for solving
systems of two linear equations in two
unknowns
Recognizing inconsistent systems and
dependent systems
Graphing
Graphing linear inequalities and systems of
linear inequalities
Finding the equation of a straight line and
the inequality for half plane
Using graphing calculators to draw feasible
regions
Relating the intersection point of graphed
lines to the common solution of the related
equations
Using graphing calculators to estimate
coordinates of points of intersection
Reasoning Based on Graphs
Recognizing that setting a linear expression
equal to a series of constants produces a
family of parallel lines
Finding the maximum or minimum of a linear
equation over a region
Examining how the parameters in a problem
affect the solution
Developing methods of solving linear
programming problems with two variables
Creating Word Problems
Creating problems that can be solved using
two equations in two unknowns
Creating problems that can be solved by linear
programming methods
4-D-16

Copyright © 2013 by
Standards Alignment
Unit Concepts /
Big Ideas from IMP Essential Questions Assessment
Unit Three: Is There Really a Difference?
Timeline: 8 weeks Summarize categorical data for two categories in two-
way frequency tables. Interpret relative frequencies in
the context of the data (including joint, marginal and
conditional relative frequencies). Recognize possible
associations and trends in the data. CC.S-ID.5
Distinguish between correlation and causation. CC.S-
ID.9
Understand that statistics is a process for making
inferences about population parameters based on a
random sample from that population. CC.S-IC.1
Decide if a specified model is consistent with results
from a given data-generating process, e.g. using
simulation. For example, a model says a spinning coin
falls heads up with probability 0.5. Would a result of 5
tails in a row cause you to question the model? CC.S-
IC.2
Recognize the purposes of and differences among
sample surveys, experiments and observational studies;
explain how randomization relates to each. CC.S-IC.3
Use data from a sample survey to estimate a population
mean or proportion; develop a margin of error through
the use of simulation models for random sampling.
CC.S-IC.4
Use data from a randomized experiment to compare
two treatments; justify significant differences between
parameters through the use of simulation models for
random assignment. CC.S-IC.5
Evaluate reports based on data. CC.S-IC.6
Construct and interpret two-way frequency tables of
data when two categories are associated with each
The unit explores two categories of problems:
Problems that compare a single population to
a theoretical model (the theoretical-model
case)
Problems that compare two distinct
populations (the two-population case)
Students learn that statisticians often presume that
a “neutral” hypothesis, called a null hypothesis,
holds unless there is clear evidence to the contrary.
In the context of the two categories of problems,
the null hypothesis is that the single
population does fit the model or that the two
populations being studied are the same. Students
learn that to evaluate the null hypothesis, they
must examine whether the observed data could
reasonably have occurred under that null
hypothesis.
In the course of studying such questions, students
will
work with double-bar graphs to explore data
form hypotheses and corresponding null
hypotheses
develop an intuitive sense for evaluating
differences between sets of data
learn ways of organizing and presenting data
learn about designing and carrying out
statistical studies
This unit builds on students’ prior experience with
statistical ideas in the Year 1 unit The Pit and the
Pendulum. In that unit, students worked with
the normal distribution and used the standard
deviation statistic as their primary tool. In this unit,
students use the chi-square statistic, or x2 statistic.
In the main activities of the unit, students use
the x2 statistic only in the case of one degree of
freedom. Supplemental activities explore more
general use of the statistic.
Can students draw inferences
from statistical data?
Can students design, conduct,
and interpret statistical
experiments?
Can students make and test
statistical hypotheses?
Can students formulate null
hypotheses and understand its
role in statistical reasoning?
Can students use the χ2
statistic?
Do students understand that
tests of statistical significance
do not lead to definitive
conclusions?
Can students solve problems
that involve conditional
probability?
All assessments are
listed at the end of the
curriculum map.
4-D-17
Copyright © 2013 by
Standards Alignment
Unit Concepts /
Big Ideas from IMP Essential Questions Assessment
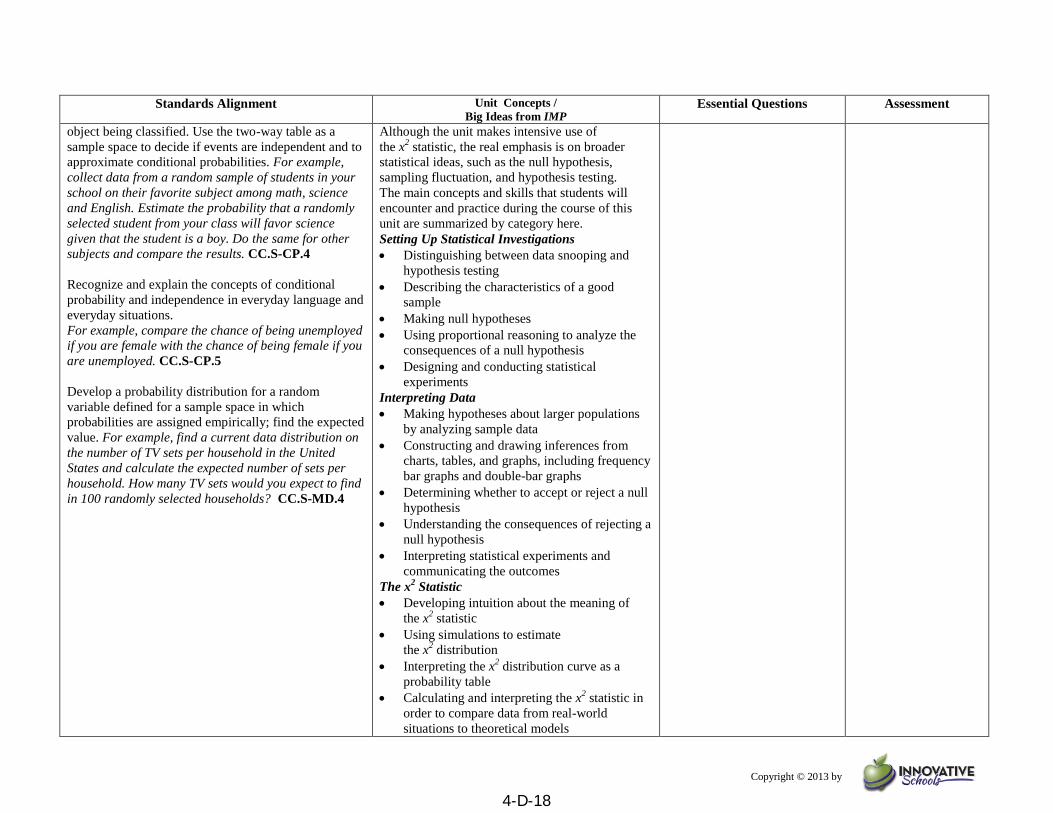
object being classified. Use the two-way table as a
sample space to decide if events are independent and to
approximate conditional probabilities. For example,
collect data from a random sample of students in your
school on their favorite subject among math, science
and English. Estimate the probability that a randomly
selected student from your class will favor science
given that the student is a boy. Do the same for other
subjects and compare the results. CC.S-CP.4
Recognize and explain the concepts of conditional
probability and independence in everyday language and
everyday situations.
For example, compare the chance of being unemployed
if you are female with the chance of being female if you
are unemployed. CC.S-CP.5
Develop a probability distribution for a random
variable defined for a sample space in which
probabilities are assigned empirically; find the expected
value. For example, find a current data distribution on
the number of TV sets per household in the United
States and calculate the expected number of sets per
household. How many TV sets would you expect to find
in 100 randomly selected households? CC.S-MD.4
Although the unit makes intensive use of
the x2 statistic, the real emphasis is on broader
statistical ideas, such as the null hypothesis,
sampling fluctuation, and hypothesis testing.
The main concepts and skills that students will
encounter and practice during the course of this
unit are summarized by category here.
Setting Up Statistical Investigations
Distinguishing between data snooping and
hypothesis testing
Describing the characteristics of a good
sample
Making null hypotheses
Using proportional reasoning to analyze the
consequences of a null hypothesis
Designing and conducting statistical
experiments
Interpreting Data
Making hypotheses about larger populations
by analyzing sample data
Constructing and drawing inferences from
charts, tables, and graphs, including frequency
bar graphs and double-bar graphs
Determining whether to accept or reject a null
hypothesis
Understanding the consequences of rejecting a
null hypothesis
Interpreting statistical experiments and
communicating the outcomes
The x2 Statistic
Developing intuition about the meaning of
the x2 statistic
Using simulations to estimate
the x2 distribution
Interpreting the x2 distribution curve as a
probability table
Calculating and interpreting the x2 statistic in
order to compare data from real-world
situations to theoretical models
4-D-18
Copyright © 2013 by
Standards Alignment
Unit Concepts /
Big Ideas from IMP Essential Questions Assessment
Calculating and interpreting the x2 statistic in
order to compare two populations
Using the x2 statistic to make decisions
Understanding some limitations in applying
the x2 statistic
Related Concepts
Working with conditional probabilities
Using simulations to develop intuition and to
obtain data about sampling fluctuation
Developing intuition about when differences
in samples indicate that the larger populations
are likely to be different
Understanding why neither numeric difference
nor percentage difference is an adequate tool
for measuring the “weirdness” of data
Reviewing the normal distribution and
standard deviation and their applications to
decision making
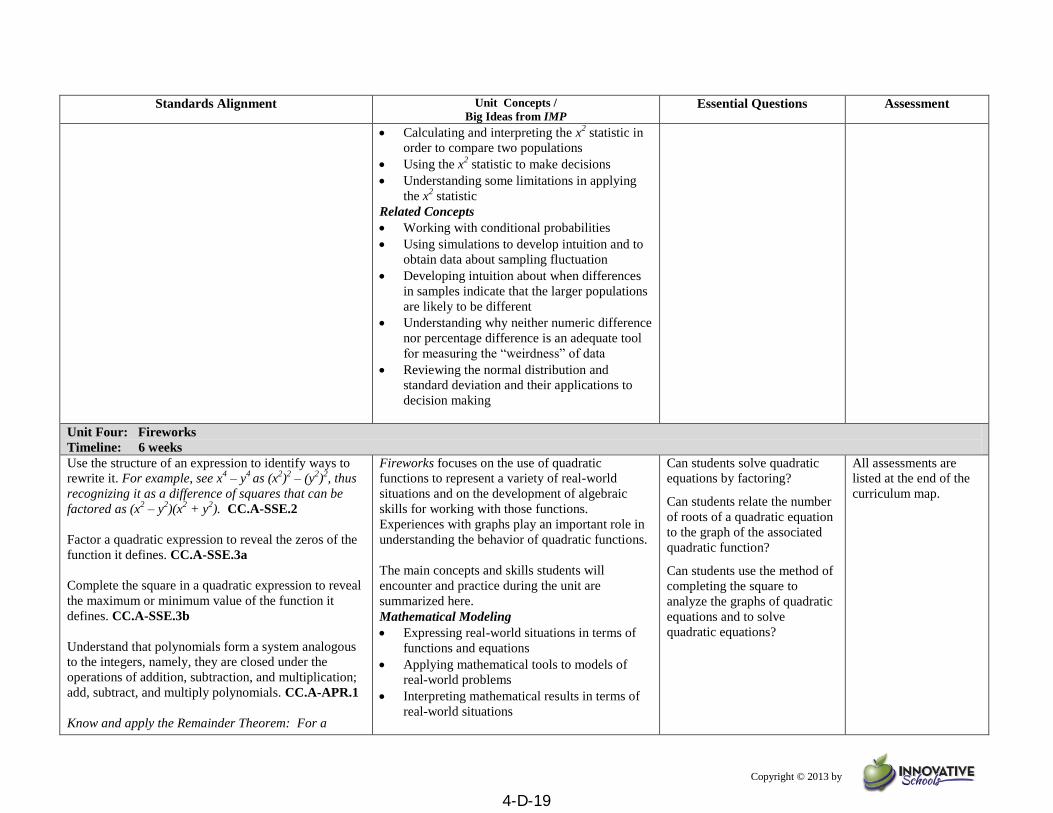
Unit Four: Fireworks
Timeline: 6 weeks Use the structure of an expression to identify ways to
rewrite it. For example, see x4 – y
4 as (x
2)2 – (y
2)
2, thus
recognizing it as a difference of squares that can be
factored as (x2 – y
2)(x
2 + y
2). CC.A-SSE.2
Factor a quadratic expression to reveal the zeros of the
function it defines. CC.A-SSE.3a
Complete the square in a quadratic expression to reveal
the maximum or minimum value of the function it
defines. CC.A-SSE.3b
Understand that polynomials form a system analogous
to the integers, namely, they are closed under the
operations of addition, subtraction, and multiplication;
add, subtract, and multiply polynomials. CC.A-APR.1
Know and apply the Remainder Theorem: For a
Fireworks focuses on the use of quadratic
functions to represent a variety of real-world
situations and on the development of algebraic
skills for working with those functions.
Experiences with graphs play an important role in
understanding the behavior of quadratic functions.
The main concepts and skills students will
encounter and practice during the unit are
summarized here.
Mathematical Modeling
Expressing real-world situations in terms of
functions and equations
Applying mathematical tools to models of
real-world problems
Interpreting mathematical results in terms of
real-world situations
Can students solve quadratic
equations by factoring?
Can students relate the number
of roots of a quadratic equation
to the graph of the associated
quadratic function?
Can students use the method of
completing the square to
analyze the graphs of quadratic
equations and to solve
quadratic equations?
All assessments are
listed at the end of the
curriculum map.
4-D-19

Copyright © 2013 by
Standards Alignment
Unit Concepts /
Big Ideas from IMP Essential Questions Assessment
polynomial p(x) and a number a, the remainder on
division by x – a is p(a), so p(a) = 0 if and only if (x –
a) is a factor of p(x). CC.A-APR.2 - unit supplement
to be developed
Identify zeros of polynomials when suitable
factorizations are available, and use the zeros to
construct a rough graph of the function defined by the
polynomial. CC.A-APR.3
Solve quadratic equations in one variable. CC.A-REI.4
Use the method of completing the square to transform
any quadratic equation in x into an equation of the form
(x – p)2 = q that has the same solutions. Derive the
quadratic formula from this form. CC.A-REI.4a
Solve quadratic equations by inspection (e.g., for x2 =
49), taking square roots, completing the square, the
quadratic formula and factoring, as appropriate to the
initial form of the equation. Recognize when the
quadratic formula gives complex solutions and write
them as a ± bi for real numbers a and b. CC.A-REI.4b
Graph linear and quadratic functions and show
intercepts, maxima, and minima. CC.F-IF.7a
Graph polynomial functions, identifying zeros when
suitable factorizations are available, and showing end
behavior. CC.F-IF.7c
Write a function defined by an expression in different
but equivalent forms to reveal and explain different
properties of the function. CC.F-IF.8
Use the process of factoring and completing the square
in a quadratic function to show zeros, extreme values,
and symmetry of the graph, and interpret these in terms
of a context. CC.F-IF.8a
Graphs of Quadratic Functions
Understanding the roles of the vertex and x-
intercept in the graphs of quadratic functions
Recognizing the significance of the sign of
the x2 term in determining the orientation of
the graph of a quadratic function
Using graphs to understand and solve
problems involving quadratic functions
Working with Algebraic Expressions
Using an area model to understand
multiplication of binomials, factoring of
quadratic expressions, and completing the
square of quadratic expressions
Transforming quadratic expressions into
vertex form
Simplifying expressions involving parentheses
Identifying certain quadratic expressions as
perfect squares
Solving Quadratic Equations
Interpreting quadratic equations in terms of
graphs and vice versa
Estimating x-intercepts using a graph
Finding roots of an equation using the vertex
form of the corresponding function
Using the zero product rule of multiplication
to solve equations by factoring
4-D-20
Copyright © 2013 by
Standards Alignment
Unit Concepts /
Big Ideas from IMP Essential Questions Assessment
Compare properties of two functions each represented
in a different way (algebraically, graphically,
numerically in tables, or by verbal descriptions). For
example, given a graph of one quadratic function and
an algebraic expression for another, say which has the
larger maximum. CC.F-IF.9
Identify the effect on the graph of replacing f(x) by f(x)
+ k, k f(x), f(kx), and f(x + k) for specific values of k
(both positive and negative); find the value of k given
the graphs. Experiment with cases and illustrate an
explanation of the effects on the graph using
technology. Include recognizing even and odd
functions from their graphs and algebraic expressions
for them. CC.F-BF.3
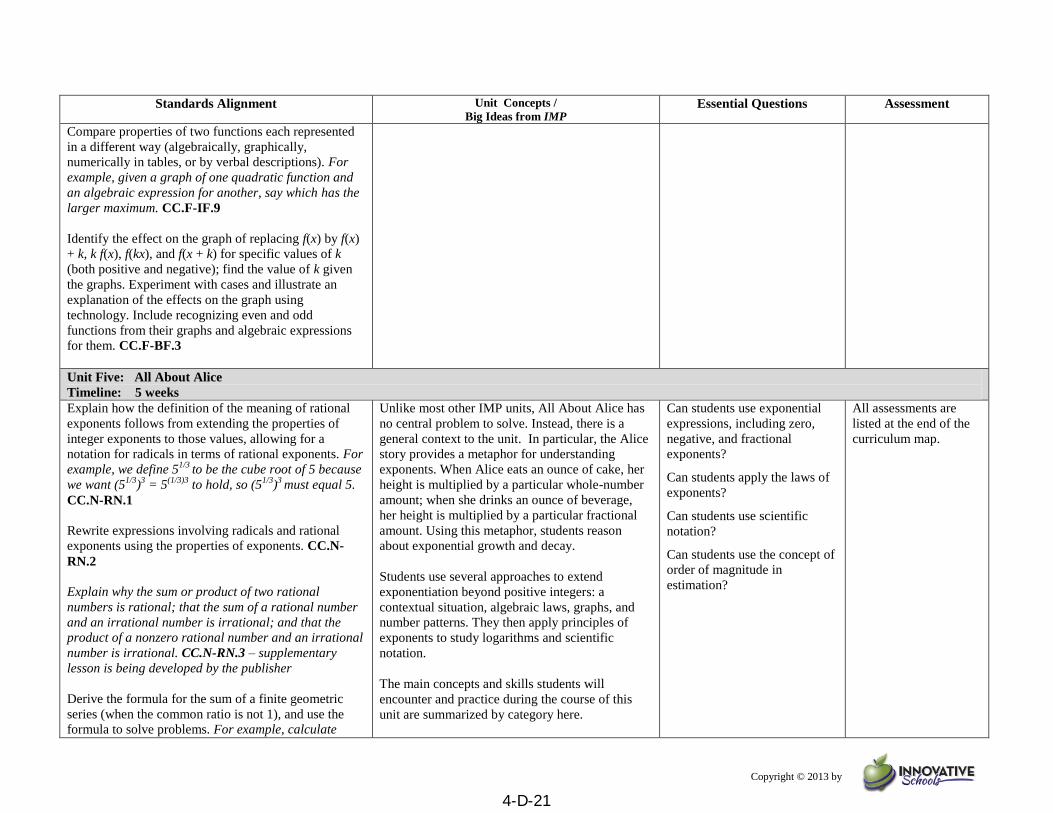
Unit Five: All About Alice
Timeline: 5 weeks
Explain how the definition of the meaning of rational
exponents follows from extending the properties of
integer exponents to those values, allowing for a
notation for radicals in terms of rational exponents. For
example, we define 51/3
to be the cube root of 5 because
we want (51/3
)3 = 5
(1/3)3 to hold, so (5
1/3)
3 must equal 5.
CC.N-RN.1
Rewrite expressions involving radicals and rational
exponents using the properties of exponents. CC.N-
RN.2
Explain why the sum or product of two rational
numbers is rational; that the sum of a rational number
and an irrational number is irrational; and that the
product of a nonzero rational number and an irrational
number is irrational. CC.N-RN.3 – supplementary
lesson is being developed by the publisher
Derive the formula for the sum of a finite geometric
series (when the common ratio is not 1), and use the
formula to solve problems. For example, calculate
Unlike most other IMP units, All About Alice has
no central problem to solve. Instead, there is a
general context to the unit. In particular, the Alice
story provides a metaphor for understanding
exponents. When Alice eats an ounce of cake, her
height is multiplied by a particular whole-number
amount; when she drinks an ounce of beverage,
her height is multiplied by a particular fractional
amount. Using this metaphor, students reason
about exponential growth and decay.
Students use several approaches to extend
exponentiation beyond positive integers: a
contextual situation, algebraic laws, graphs, and
number patterns. They then apply principles of
exponents to study logarithms and scientific
notation.
The main concepts and skills students will
encounter and practice during the course of this
unit are summarized by category here.
Can students use exponential
expressions, including zero,
negative, and fractional
exponents?
Can students apply the laws of
exponents?
Can students use scientific
notation?
Can students use the concept of
order of magnitude in
estimation?
All assessments are
listed at the end of the
curriculum map.
4-D-21
Copyright © 2013 by
Standards Alignment
Unit Concepts /
Big Ideas from IMP Essential Questions Assessment
mortgage payments. CC.A-SSE.4
Graph exponential and logarithmic functions, showing
intercepts and end behavior, and trigonometric
functions, showing period, midline, and amplitude.
CC.F-IF.7e
Use the properties of exponents to interpret expressions
for exponential functions. For example, identify percent
rate of change in functions such as y = (1.02)t, y =
(0.97)t, y = (1.01)
12t, y = (1.2)
t/10, and classify them as
representing exponential growth or decay. CC.F-IF.8b
Find inverse functions. CC.F-BF.4
Solve an equation of the form f(x) = c for a simple
function f that has an inverse and write an expression
for the inverse. For example, f(x) =2 x3 for x > 0 or f(x)
= (x+1)/(x–1) for x ≠ 1. CC.F-BF.4a
Verify by composition that one function is the inverse
of another. CC.F-BF.4b
Read values of an inverse function from a graph or a
table, given that the function has an inverse. CC.F-
BF.4c
Understand the inverse relationship between exponents
and logarithms and use this relationship to solve
problems involving logarithms and exponents. CC.F-
BF.5
Distinguish between situations that can be modeled
with linear functions and with exponential functions.
CC.F-LE.1
Prove that linear functions grow by equal differences
over equal intervals, and that exponential functions
grow by equal factors over equal intervals. CC.F-
LE.1a
Extending the Operation of Exponentiation
Defining the operation for an exponent of zero
Defining the operation for negative integer
exponents
Defining the operation for fractional
exponents
Laws of Exponents
Developing the additive law of exponents
Developing the law of repeated
exponentiation
Graphing
Describing the graphs of exponential
functions
Comparing graphs of exponential functions
for different bases
Describing the graphs of logarithmic functions
Comparing graphs of logarithmic functions
for different bases
Logarithms
Understanding the meaning of logarithms
Making connections between exponential and
logarithmic equations
Scientific Notation
Converting numbers from ordinary notation to
scientific notation, and vice versa
Developing principles for doing computations
using scientific notation
Using the concept of order of magnitude in
estimation
4-D-22
Copyright © 2013 by
Standards Alignment
Unit Concepts /
Big Ideas from IMP Essential Questions Assessment
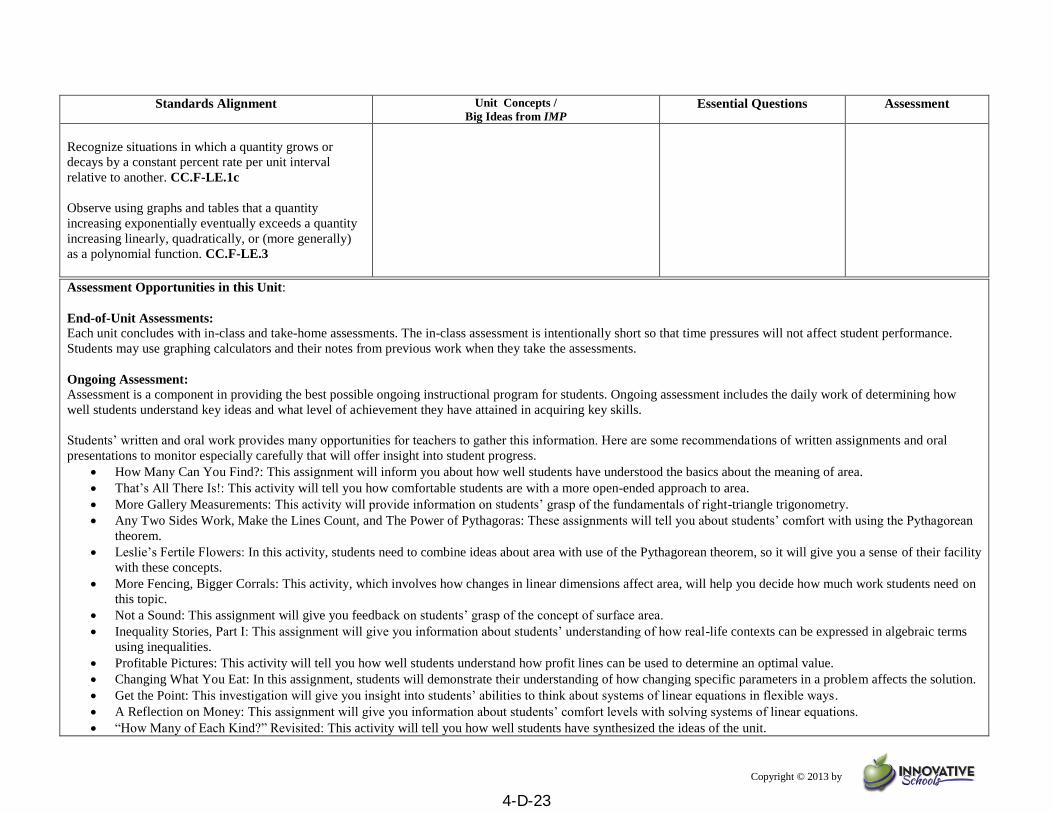
Recognize situations in which a quantity grows or
decays by a constant percent rate per unit interval
relative to another. CC.F-LE.1c
Observe using graphs and tables that a quantity
increasing exponentially eventually exceeds a quantity
increasing linearly, quadratically, or (more generally)
as a polynomial function. CC.F-LE.3
Assessment Opportunities in this Unit:
End-of-Unit Assessments: Each unit concludes with in-class and take-home assessments. The in-class assessment is intentionally short so that time pressures will not affect student performance.
Students may use graphing calculators and their notes from previous work when they take the assessments.
Ongoing Assessment:
Assessment is a component in providing the best possible ongoing instructional program for students. Ongoing assessment includes the daily work of determining how
well students understand key ideas and what level of achievement they have attained in acquiring key skills.
Students’ written and oral work provides many opportunities for teachers to gather this information. Here are some recommendations of written assignments and oral
presentations to monitor especially carefully that will offer insight into student progress.
How Many Can You Find?: This assignment will inform you about how well students have understood the basics about the meaning of area.
That’s All There Is!: This activity will tell you how comfortable students are with a more open-ended approach to area.
More Gallery Measurements: This activity will provide information on students’ grasp of the fundamentals of right-triangle trigonometry.
Any Two Sides Work, Make the Lines Count, and The Power of Pythagoras: These assignments will tell you about students’ comfort with using the Pythagorean
theorem.
Leslie’s Fertile Flowers: In this activity, students need to combine ideas about area with use of the Pythagorean theorem, so it will give you a sense of their facility
with these concepts.
More Fencing, Bigger Corrals: This activity, which involves how changes in linear dimensions affect area, will help you decide how much work students need on
this topic.
Not a Sound: This assignment will give you feedback on students’ grasp of the concept of surface area.
Inequality Stories, Part I: This assignment will give you information about students’ understanding of how real-life contexts can be expressed in algebraic terms
using inequalities.
Profitable Pictures: This activity will tell you how well students understand how profit lines can be used to determine an optimal value.
Changing What You Eat: In this assignment, students will demonstrate their understanding of how changing specific parameters in a problem affects the solution.
Get the Point: This investigation will give you insight into students’ abilities to think about systems of linear equations in flexible ways.
A Reflection on Money: This assignment will give you information about students’ comfort levels with solving systems of linear equations.
“How Many of Each Kind?” Revisited: This activity will tell you how well students have synthesized the ideas of the unit.
4-D-23
Copyright © 2013 by
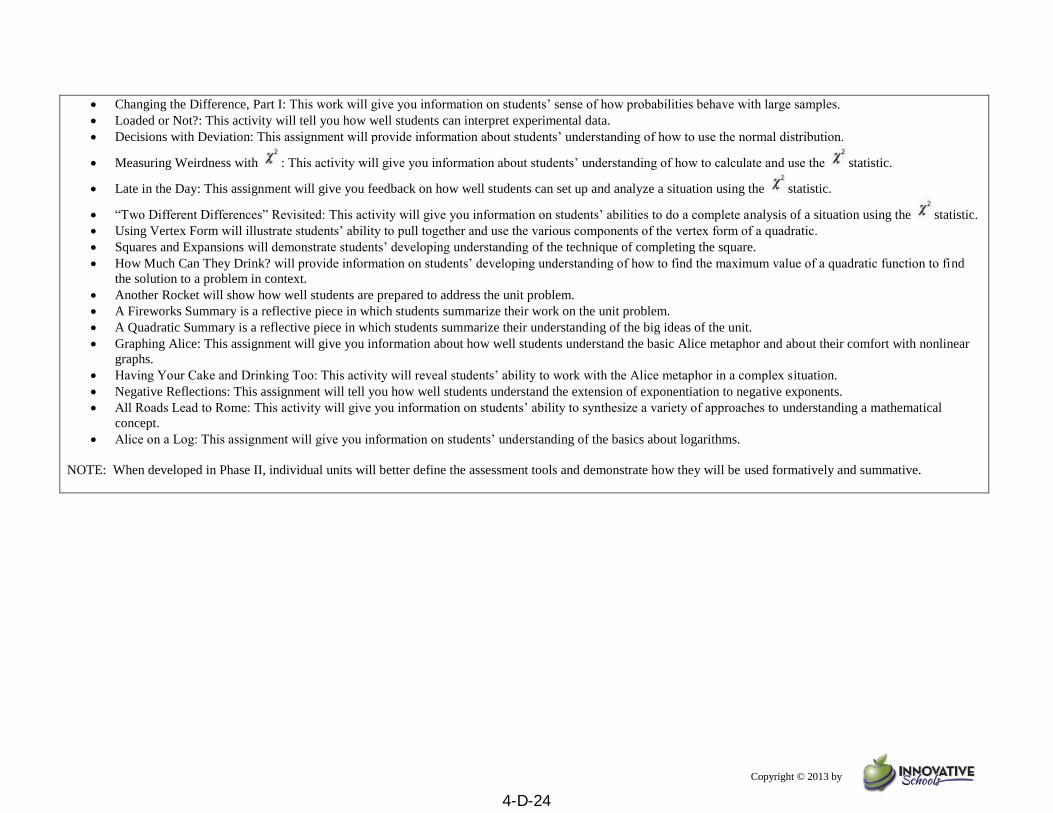
Changing the Difference, Part I: This work will give you information on students’ sense of how probabilities behave with large samples.
Loaded or Not?: This activity will tell you how well students can interpret experimental data.
Decisions with Deviation: This assignment will provide information about students’ understanding of how to use the normal distribution.
Measuring Weirdness with : This activity will give you information about students’ understanding of how to calculate and use the statistic.
Late in the Day: This assignment will give you feedback on how well students can set up and analyze a situation using the statistic.
“Two Different Differences” Revisited: This activity will give you information on students’ abilities to do a complete analysis of a situation using the statistic.
Using Vertex Form will illustrate students’ ability to pull together and use the various components of the vertex form of a quadratic.
Squares and Expansions will demonstrate students’ developing understanding of the technique of completing the square.
How Much Can They Drink? will provide information on students’ developing understanding of how to find the maximum value of a quadratic function to find
the solution to a problem in context.
Another Rocket will show how well students are prepared to address the unit problem.
A Fireworks Summary is a reflective piece in which students summarize their work on the unit problem.
A Quadratic Summary is a reflective piece in which students summarize their understanding of the big ideas of the unit.
Graphing Alice: This assignment will give you information about how well students understand the basic Alice metaphor and about their comfort with nonlinear
graphs.
Having Your Cake and Drinking Too: This activity will reveal students’ ability to work with the Alice metaphor in a complex situation.
Negative Reflections: This assignment will tell you how well students understand the extension of exponentiation to negative exponents.
All Roads Lead to Rome: This activity will give you information on students’ ability to synthesize a variety of approaches to understanding a mathematical
concept.
Alice on a Log: This assignment will give you information on students’ understanding of the basics about logarithms.
NOTE: When developed in Phase II, individual units will better define the assessment tools and demonstrate how they will be used formatively and summative.
4-D-24
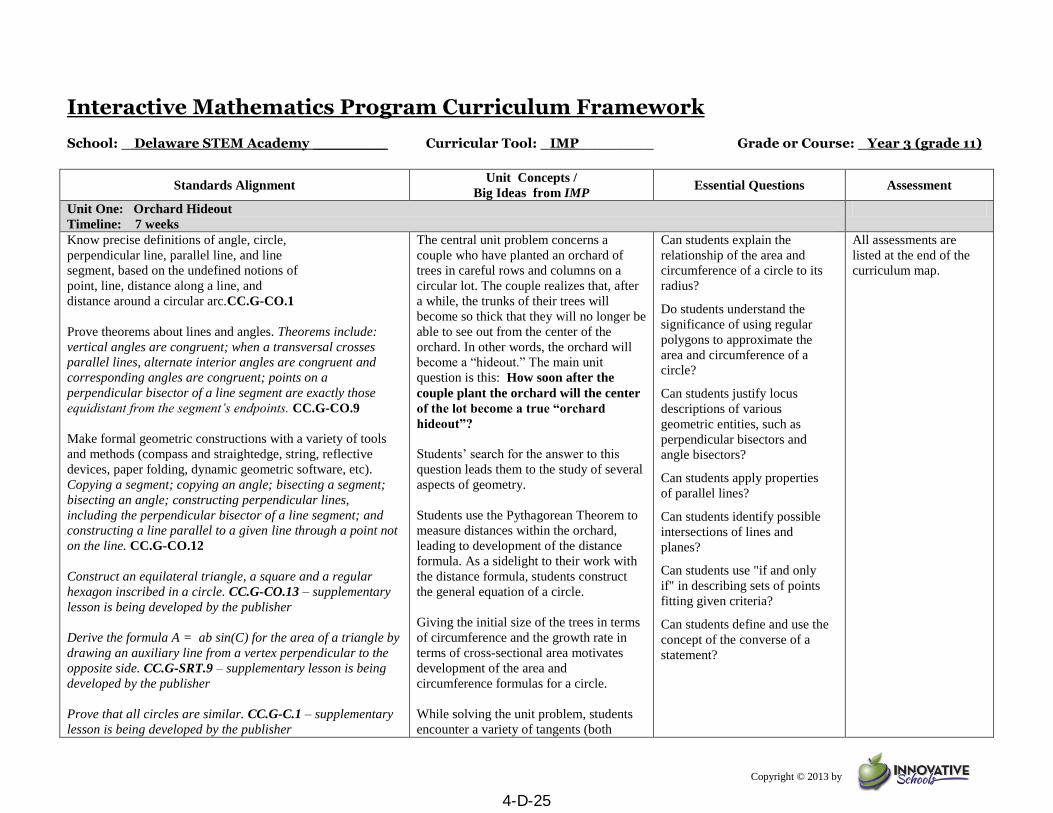
Copyright © 2013 by
Interactive Mathematics Program Curriculum Framework School: _ Delaware STEM Academy ________ Curricular Tool: _IMP________ Grade or Course: _Year 3 (grade 11)
Standards Alignment Unit Concepts /
Big Ideas from IMP Essential Questions Assessment
Unit One: Orchard Hideout
Timeline: 7 weeks
Know precise definitions of angle, circle,
perpendicular line, parallel line, and line
segment, based on the undefined notions of
point, line, distance along a line, and
distance around a circular arc.CC.G-CO.1
Prove theorems about lines and angles. Theorems include:
vertical angles are congruent; when a transversal crosses
parallel lines, alternate interior angles are congruent and
corresponding angles are congruent; points on a
perpendicular bisector of a line segment are exactly those
equidistant from the segment’s endpoints. CC.G-CO.9
Make formal geometric constructions with a variety of tools
and methods (compass and straightedge, string, reflective
devices, paper folding, dynamic geometric software, etc).
Copying a segment; copying an angle; bisecting a segment;
bisecting an angle; constructing perpendicular lines,
including the perpendicular bisector of a line segment; and
constructing a line parallel to a given line through a point not
on the line. CC.G-CO.12
Construct an equilateral triangle, a square and a regular
hexagon inscribed in a circle. CC.G-CO.13 – supplementary
lesson is being developed by the publisher
Derive the formula A = ab sin(C) for the area of a triangle by
drawing an auxiliary line from a vertex perpendicular to the
opposite side. CC.G-SRT.9 – supplementary lesson is being
developed by the publisher
Prove that all circles are similar. CC.G-C.1 – supplementary
lesson is being developed by the publisher
The central unit problem concerns a
couple who have planted an orchard of
trees in careful rows and columns on a
circular lot. The couple realizes that, after
a while, the trunks of their trees will
become so thick that they will no longer be
able to see out from the center of the
orchard. In other words, the orchard will
become a “hideout.” The main unit
question is this: How soon after the
couple plant the orchard will the center
of the lot become a true “orchard
hideout”?
Students’ search for the answer to this
question leads them to the study of several
aspects of geometry.
Students use the Pythagorean Theorem to
measure distances within the orchard,
leading to development of the distance
formula. As a sidelight to their work with
the distance formula, students construct
the general equation of a circle.
Giving the initial size of the trees in terms
of circumference and the growth rate in
terms of cross-sectional area motivates
development of the area and
circumference formulas for a circle.
While solving the unit problem, students
encounter a variety of tangents (both
Can students explain the
relationship of the area and
circumference of a circle to its
radius?
Do students understand the
significance of using regular
polygons to approximate the
area and circumference of a
circle?
Can students justify locus
descriptions of various
geometric entities, such as
perpendicular bisectors and
angle bisectors?
Can students apply properties
of parallel lines?
Can students identify possible
intersections of lines and
planes?
Can students use "if and only
if" in describing sets of points
fitting given criteria?
Can students define and use the
concept of the converse of a
statement?
All assessments are
listed at the end of the
curriculum map.
4-D-25
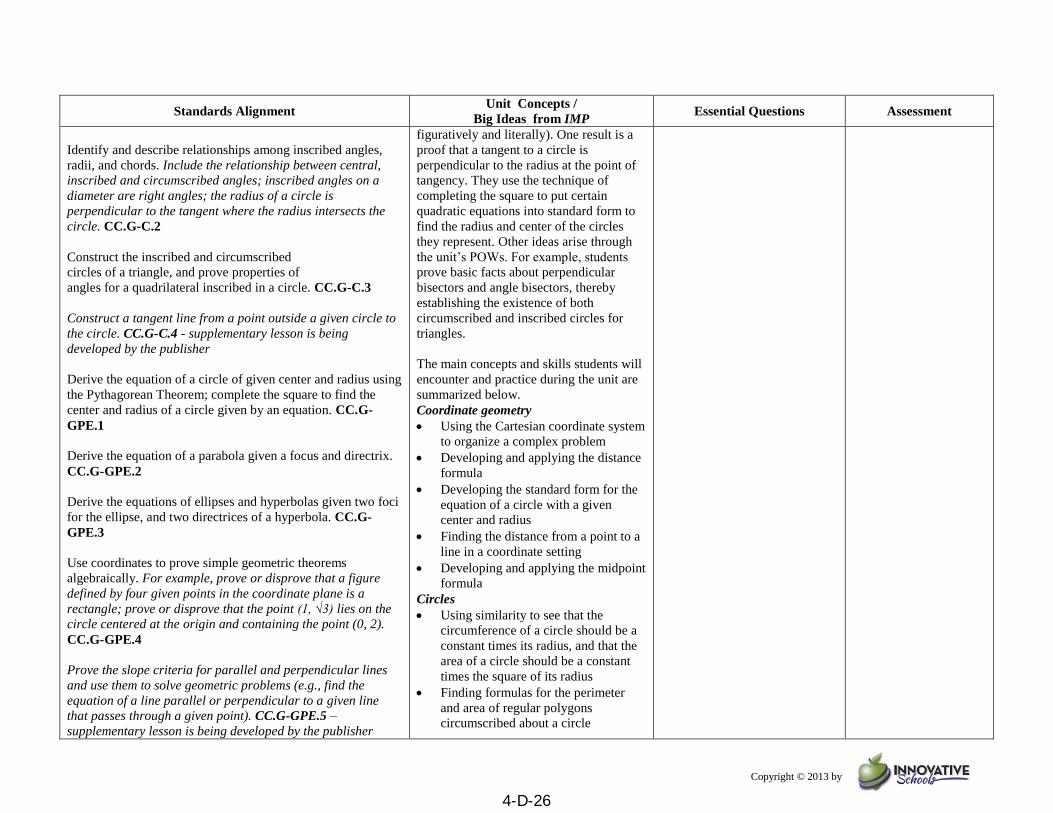
Copyright © 2013 by
Standards Alignment Unit Concepts /
Big Ideas from IMP Essential Questions Assessment
Identify and describe relationships among inscribed angles,
radii, and chords. Include the relationship between central,
inscribed and circumscribed angles; inscribed angles on a
diameter are right angles; the radius of a circle is
perpendicular to the tangent where the radius intersects the
circle. CC.G-C.2
Construct the inscribed and circumscribed
circles of a triangle, and prove properties of
angles for a quadrilateral inscribed in a circle. CC.G-C.3
Construct a tangent line from a point outside a given circle to
the circle. CC.G-C.4 - supplementary lesson is being
developed by the publisher
Derive the equation of a circle of given center and radius using
the Pythagorean Theorem; complete the square to find the
center and radius of a circle given by an equation. CC.G-
GPE.1
Derive the equation of a parabola given a focus and directrix.
CC.G-GPE.2
Derive the equations of ellipses and hyperbolas given two foci
for the ellipse, and two directrices of a hyperbola. CC.G-
GPE.3
Use coordinates to prove simple geometric theorems
algebraically. For example, prove or disprove that a figure
defined by four given points in the coordinate plane is a
rectangle; prove or disprove that the point (1, √3) lies on the
circle centered at the origin and containing the point (0, 2).
CC.G-GPE.4
Prove the slope criteria for parallel and perpendicular lines
and use them to solve geometric problems (e.g., find the
equation of a line parallel or perpendicular to a given line
that passes through a given point). CC.G-GPE.5 –
supplementary lesson is being developed by the publisher
figuratively and literally). One result is a
proof that a tangent to a circle is
perpendicular to the radius at the point of
tangency. They use the technique of
completing the square to put certain
quadratic equations into standard form to
find the radius and center of the circles
they represent. Other ideas arise through
the unit’s POWs. For example, students
prove basic facts about perpendicular
bisectors and angle bisectors, thereby
establishing the existence of both
circumscribed and inscribed circles for
triangles.
The main concepts and skills students will
encounter and practice during the unit are
summarized below.
Coordinate geometry
Using the Cartesian coordinate system
to organize a complex problem
Developing and applying the distance
formula
Developing the standard form for the
equation of a circle with a given
center and radius
Finding the distance from a point to a
line in a coordinate setting
Developing and applying the midpoint
formula
Circles
Using similarity to see that the
circumference of a circle should be a
constant times its radius, and that the
area of a circle should be a constant
times the square of its radius
Finding formulas for the perimeter
and area of regular polygons
circumscribed about a circle
4-D-26
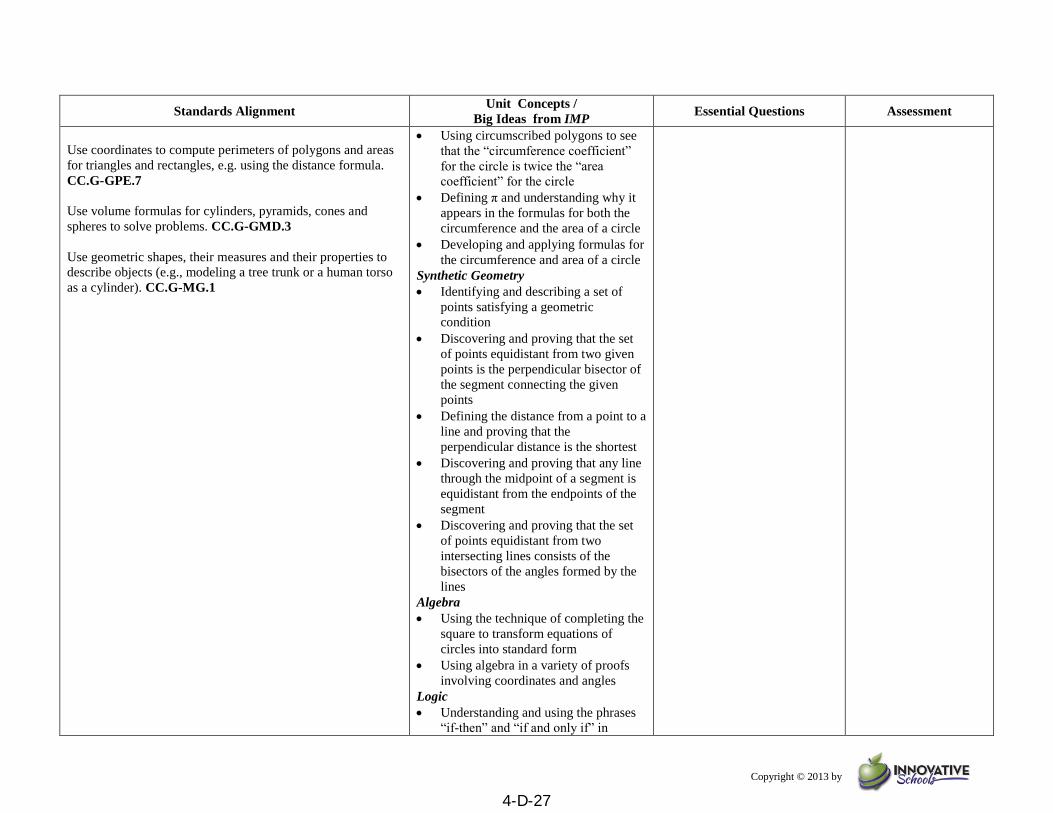
Copyright © 2013 by
Standards Alignment Unit Concepts /
Big Ideas from IMP Essential Questions Assessment
Use coordinates to compute perimeters of polygons and areas
for triangles and rectangles, e.g. using the distance formula.
CC.G-GPE.7
Use volume formulas for cylinders, pyramids, cones and
spheres to solve problems. CC.G-GMD.3
Use geometric shapes, their measures and their properties to
describe objects (e.g., modeling a tree trunk or a human torso
as a cylinder). CC.G-MG.1
Using circumscribed polygons to see
that the “circumference coefficient”
for the circle is twice the “area
coefficient” for the circle
Defining π and understanding why it
appears in the formulas for both the
circumference and the area of a circle
Developing and applying formulas for
the circumference and area of a circle
Synthetic Geometry
Identifying and describing a set of
points satisfying a geometric
condition
Discovering and proving that the set
of points equidistant from two given
points is the perpendicular bisector of
the segment connecting the given
points
Defining the distance from a point to a
line and proving that the
perpendicular distance is the shortest
Discovering and proving that any line
through the midpoint of a segment is
equidistant from the endpoints of the
segment
Discovering and proving that the set
of points equidistant from two
intersecting lines consists of the
bisectors of the angles formed by the
lines
Algebra
Using the technique of completing the
square to transform equations of
circles into standard form
Using algebra in a variety of proofs
involving coordinates and angles
Logic
Understanding and using the phrases
“if-then” and “if and only if” in
4-D-27
Copyright © 2013 by
Standards Alignment Unit Concepts /
Big Ideas from IMP Essential Questions Assessment
definitions and proofs
Working with converses
Miscellaneous
Using symmetry to help analyze a
problem
Learning about Pythagorean triples
Unit Two: Meadows or Malls?
Timeline: 11 weeks
Use matrices to represent and manipulate data, e.g., to
represent payoffs or incidence relationships in a network.
CC.N-VM.6
Multiply matrices by scalars to produce new matrices, e.g., as
when all of the payoffs in a game are doubled. CC.N-VM.7
Add, subtract, and multiply matrices of appropriate
dimensions. CC.N-VM.8
Understand that, unlike multiplication of numbers, matrix
multiplication for square matrices is not a commutative
operation, but still satisfies the associative and distributive
properties. CC.N-VM.9
Understand that the zero and identity matrices play a role in
matrix addition and multiplication similar to the role of 0 and
1 in the real numbers. The determinant of a square matrix is
nonzero if and only if the matrix has a multiplicative inverse.
CC.N-VM.10
Multiply a vector (regarded as a matrix with one column) by a
matrix of suitable dimensions to produce another vector. Work
with matrices as transformations of vectors. CC.N-VM.11 –
supplementary unit being is developed by the publisher
Work with 2 × 2 matrices as transformations of the plane, and
interpret the absolute value of the determinant in terms of
area. CC.N-VM.12 - supplementary unit is being developed
by the publisher
The main concepts and skills that students
will encounter and practice during this unit
are:
General Linear Programming
Seeing that for two-variable problems,
the optimal value always occurs at a
corner point of the feasible region
Generalizing the corner-point
principle to more than two variables
Recognizing that for two-variable
problems, corner points can be found
as the intersections of lines
corresponding to constraint equations
or inequalities
Generalizing the method of finding
corner points to more than two
variables
Solving Linear Equations
Using substitution, graphing, and
guess-and-check methods to solve
systems of linear equations in two
variables
Developing and using the elimination
method to solve systems of linear
equations in two or more variables
Using the concepts
of inconsistent, dependent,
and independent systems of
equations
Geometry in the Plane and in 3-Space
Can students use the
elimination method for solving
systems of linear equations in
up to four variables?
Can students extend the
concepts of dependent,
inconsistent, and independent
systems of linear equations to
more than two variables?
Can students use matrices?
Can students use the operations
of matrix addition and
multiplication in the context of
applied problems?
Can students use of matrices to
represent systems of linear
equations?
Can students use the identity
element and inverse in the
context of matrices?
Can students use matrices and
matrix inverses to solve
systems of linear equations?
Can students relate the
existence of matrix inverses to
the uniqueness of the solution
of corresponding systems of
All assessments are
listed at the end of the
curriculum map.
4-D-28
Copyright © 2013 by
Standards Alignment Unit Concepts /
Big Ideas from IMP Essential Questions Assessment
Represent constraints by equations or inequalities, and by
systems of equations and/or inequalities, and interpret
solutions as viable or nonviable options in a modeling context.
For example, represent inequalities describing nutritional and
cost constraints on combinations of different foods. CC.A-
CED.3
Represent a system of linear equations as a single matrix
equation in a vector variable. CC.A-REI.8
Find the inverse of a matrix if it exists and use it to solve
systems of linear equations (using technology for matrices of
dimension 3 × 3 or greater). CC.A-REI.9
Extending the concept of coordinates
to three variables by introducing a
third axis perpendicular to the first
two
Graphing linear equations in three
variables and recognizing that these
graphs are planes in 3-space
Seeing that two distinct points always
determine a unique line and that two
distinct lines in the plane determine a
unique point unless the lines are
parallel
Examining the possible intersections
of planes in 3-space
Relating the possible intersections of
lines and planes to the algebra of
solving linear systems in two or three
variables
Matrix Algebra
Using matrices to represent
information
Using problem situations to motivate
and develop the definitions of matrix
addition and multiplication
Examining whether matrix operations
have certain properties, such as
associativity and commutativity
Matrices and Systems of Linear
Equations
Seeing that systems of linear
equations are equivalent to certain
types of matrix equations
Recognizing the role of identity and
inverse elements in solving certain
types of matrix equations
Finding matrix inverses by hand by
solving systems of linear equations
Understanding the relationship
between a system of linear equations
linear equations?
Can students use calculators to
multiply and invert matrices
and to solve systems of linear
equations?
Can students apply the concepts
of linear programming to
problems with several
variables?
Can students use equations of
planes in three-dimensional
coordinate geometry?
Can students define polar
coordinates?
Do students recognize graphs of
polar equations?
4-D-29
Copyright © 2013 by
Standards Alignment Unit Concepts /
Big Ideas from IMP Essential Questions Assessment
having a unique solution and the
coefficient matrix being invertible
Technology
Entering matrices and doing matrix
operations on a graphing calculator
Using matrix inversion on a graphing
calculator to solve systems of linear
equations
Unit Three: Small World, Isn’t It?
Timeline: 6 weeks
Use the properties of exponents to transform expressions for
exponential functions. For example the expression 1.15t can
be rewritten as (1.151/12
)12t
≈ 1.01212t
to reveal the
approximate equivalent monthly interest rate if the annual
rate is 15%. CC.A-SSE.3c
Derive the formula for the sum of a finite geometric series
(when the common ratio is not 1), and use the formula to solve
problems. For example, calculate mortgage payments. CC.A-
SSE.4
Relate the domain of a function to its graph and, where
applicable, to the quantitative relationship it describes. For
example, if the function h(n) gives the number of person-hours
it takes to assemble n engines in a factory, then the positive
integers would be an appropriate domain for the function.
CC.F-IF.5
Use the properties of exponents to interpret expressions for
exponential functions. For example, identify percent rate of
change in functions such as y = (1.02)t, y = (0.97)
t, y =
(1.01)12t
, y = (1.2)t/10
, and classify them as representing
exponential growth or decay. CC.F-IF.8b
Write arithmetic and geometric sequences both recursively
and with an explicit formula, use them to model situations,
and translate between the two forms. CC.F-BF.2
Recognize situations in which a quantity grows or decays by a
The main concepts and skills that students
will encounter and practice during this unit
are:
Rate of Change
Evaluating average rate of change in
terms of the coordinates of points on a
graph
Understanding the relationship
between the rate of change of a
function and the appearance of its
graph
Realizing that in many contexts, the
rate of growth or decline with respect
to time in a population is proportional
to the population
Slope and Linear Functions
Developing an algebraic definition of
slope
Proving, using similarity, that a line
has a constant slope
Understanding the significance of a
negative slope for a graph and an
applied context
Seeing that the slope of a line is equal
to the coefficient of x in the y = a +
bx representation of the line
Using slope to develop equations for
lines
Can students use exponential
and logarithmic functions and
describe their graphs?
Do students understand the
relationship between logarithms
and exponents?
Do students understand that the
derivative of an exponential
function is proportional to the
value of the function?
Can students use the general
laws of exponents?
Do students understand the
meaning and significance of e?
Can students approximate data
with an exponential function?
Can students define slope and
understand its relationship to
rate of change and to equations
for straight lines?
Can students develop equations
for straight lines from two
points and from point-slope
information?
Can students apply various
All assessments are
listed at the end of the
curriculum map.
4-D-30
Copyright © 2013 by
Standards Alignment Unit Concepts /
Big Ideas from IMP Essential Questions Assessment
constant percent rate per unit interval relative to another.
CC.F-LE.1c
Construct linear and exponential functions, including
arithmetic and geometric sequences, given a graph, a
description of a relationship, or two inputoutput pairs (include
reading these from a table). CC.F-LE.2
For exponential models, express as a logarithm the solution to
abct = d where a, c, and d are numbers and the base b is 2, 10,
or e; evaluate the logarithm using technology. CC.F-LE.4
Apply concepts of density based on area and volume in
modeling situations (e.g., persons per square mile, BTUs per
cubic foot). CC.G-MG.2
Use a model function fitted to the data to solve problems in
the context of the data. Use given model functions or choose a
function suggested by the context. Emphasize linear and
exponential models. CC.S-ID.6a
Derivatives
Developing the concept of the
derivative of a function at a point
Seeing that the derivative of a
function at a point is the slope of the
tangent line at that point
Finding numerical estimates for the
derivatives of functions at specific
points
Working with the derivative of a
function as a function in itself
Realizing that for functions of the
form y = bx, the derivative at each
point of the graph is proportional to
the y-value at that point
Exponential and Logarithmic Functions
Using exponential functions to model
real-life situations
Strengthening understanding of
logarithms
Reviewing and applying the principles
that ab • a
c = a
b+c and (a
b)
c = a
bc
Understanding and using the fact
that alog
a b = b
Discovering that any exponential
function can be expressed using any
positive number other than 1 as a base
Learning the meaning of the terms
natural logarithm and common
logarithm
Using an exponential function to fit a
curve to numerical data
The Number e and Compound Interest
Estimating the value of b for which
the function y = bx has a derivative at
each point on its graph equal to the y-
value at that point
Developing and using a formula for
compound interest
formulas from coordinate
geometry, including:
Distance formula?
Midpoint formula?
Equation of a circle with
arbitrary center and
radius?
Can students find the distance
from a point to a line?
Do students understand the
meaning of the derivative of a
function at a point and its
relationship to instantaneous
rate of change?
Can students approximate the
value of a derivative at a given
point?
4-D-31
Copyright © 2013 by
Standards Alignment Unit Concepts /
Big Ideas from IMP Essential Questions Assessment
Seeing that expressions of the
form (1+1/n)n have a limiting value,
called e, as n increases without bound
Learning that the limiting value e is
the same number as the special base
for exponential functions
Unit Four: Pennant Fever
Timeline: 4 weeks
Prove polynomial identities and use them to describe
numerical relationships. For example, the polynomial identity
(x2 + y
2)2= (x
2– y
2)
2 + (2xy)
2 can be used to generate
Pythagorean triples. CC.A-APR.4 – unit supplement to be
developed
Know and apply the Binomial Theorem for the expansion of
(x + y)n in powers of x and y for a positive integer n, where x
and y are any numbers, with coefficients determined for
example by Pascal’s Triangle. CC.A-APR.5
Use permutations and combinations to compute probabilities
of compound events and solve problems. CC.S-CP.9
The main concepts and skills that students
will encounter and practice during this unit
are:
Probability and statistics
Developing a mathematical model for
a complex probability situation
Using area diagrams and tree
diagrams to find and explain
probabilities
Using a simulation to understand a
situation, to help analyze
probabilities, and to support a
theoretical analysis
Finding expected value
Finding and using probabilities for
sequences of events
Using specific problem contexts to
develop the binomial distribution and
finding a formula for the associated
probabilities
Using probability to evaluate null
hypotheses
Counting principles
Developing systematic lists for
complex situations
Using the multiplication principle for
choosing one element from each of
several sets
Defining and using the concepts of
permutation and combination
Can students apply principles
for finding the probability for a
sequence of events?
Can students systematically list
possibilities for complex
problems?
Can students use combinatorial
and permutation coefficients in
the context of real-world
situations, and understanding
the distinction between
combinations and
permutations?
Can student use Pascal's
triangle?
Can students use the binomial
distribution?
Can students express the
physical laws of falling bodies
in terms of quadratic functions?
All assessments are
listed at the end of the
curriculum map.
4-D-32
Copyright © 2013 by
Standards Alignment Unit Concepts /
Big Ideas from IMP Essential Questions Assessment
Understanding and using standard
notation for counting permutations
and combinations
Developing formulas for the
permutation and combinatorial
coefficients
Pascal’s triangle and combinatorial
coefficients
Finding patterns and properties within
Pascal’s triangle
Recognizing that Pascal’s triangle
consists of combinatorial coefficients
Explaining the defining pattern and
other properties of Pascal’s triangle
using the meaning of combinatorial
coefficients
Developing and explaining the
binomial theorem
Unit Five: High Dive
Timeline: 6 weeks
Interpret complicated expressions by viewing one or more of
their parts as a single entity. For example, interpret P(1+r)n as
the product of P and a factor not depending on P. CC.A-
SSE.1b
Rewrite simple rational expressions in different forms; write
a(x)/b(x) in the form q(x) + r(x)/b(x), where a(x), b(x), q(x),
and r(x) are polynomials with the degree of r(x) less than the
degree of b(x), using inspection, long division, or, for the more
complicated examples, a computer algebra system. CC.A-
APR.6 – unit supplement to be developed
Understand that rational expressions form a system analogous
to the rational numbers, closed under addition, subtraction,
multiplication, and division by a nonzero rational expression;
add, subtract, multiply, and divide rational expressions.
CC.A-APR.7 – supplementary unit is being developed by
publisher
The main concepts and skills that students
will encounter and practice during this unit
are:
Trigonometry
Extending the trigonometric functions
to all angles
Reinforcing the importance of
similarity in the definitions of the
trigonometric functions
Graphing the trigonometric functions
and variations on those functions
Defining the inverse trigonometric
functions and principal values
Discovering and explaining the
Pythagorean identity sin2 θ + cos
2 θ =
1, and other trigonometric identities
Defining polar coordinates and
finding rectangular coordinates from
Can students apply right-
triangle trigonometry to real-
world situations?
Can students extend the right-
triangle trigonometric functions
to circular functions?
Can students use trigonometric
functions to work with polar
coordinates?
Can students define radian
measure?
Can students graph the sine and
cosine functions and variations
of these functions?
Can students use inverse
All assessments are
listed at the end of the
curriculum map.
4-D-33
Copyright © 2013 by
Standards Alignment Unit Concepts /
Big Ideas from IMP Essential Questions Assessment
For a function that models a relationship between two
quantities, interpret key features of graphs and tables in terms
of the quantities, and sketch graphs showing key features
given a verbal description of the relationship. Key features
include: intercepts; intervals where the function is increasing,
decreasing, positive, or negative; relative maximums and
minimums; symmetries; end behavior; and periodicity. CC.F-
IF.4
Graph exponential and logarithmic functions, showing
intercepts and end behavior, and trigonometric functions,
showing period, midline, and amplitude. CC.F-IF.7e
Explain how the unit circle in the coordinate plane enables the
extension of trigonometric functions to all real numbers,
interpreted as radian measures of angles traversed
counterclockwise around the unit circle. CC.F-TF.2
Choose trigonometric functions to model periodic phenomena
with specified amplitude, frequency, and midline. CC.F-TF.5
Use inverse functions to solve trigonometric equations that
arise in modeling contexts; evaluate the solutions using
technology, and interpret them in terms of the context. CC.F-
TF.7
Prove the Pythagorean identity sin2(θ) + cos
2(θ) = 1 and use it
to calculate trigonometric ratios. CC.F-TF.8
polar coordinates and vice versa
Physics
Developing quadratic expressions for
the height of free-falling objects,
based on the principle of constant
acceleration
Recognizing that a person falling from
a moving object will follow a
different path than someone falling
from a stationary object
Quadratic Equations
Developing simple quadratic
equations to describe the behavior of
falling objects
trigonometric functions?
Can students apply various
trigonometric formulas,
including:
The Pythagorean identity?
Formulas for the sine and
cosine of a sum of angles?
The law of sines and the
law of cosines?
Assessment Opportunities in this Unit:
End-of-Unit Assessments: Each unit concludes with in-class and take-home assessments. The in-class assessment is intentionally short so that time pressures will not
affect student performance. Students may use graphing calculators and their notes from previous work when they take the assessments.
On-Going Assessments:
Ongoing assessment includes the daily work of determining how well students understand key ideas and what level of achievement they have attained in acquiring key
skills. Students’ written and oral work provides many opportunities for teachers to gather this information.
Sprinkler in the Orchard
Proving with Distance—Part I or Proving with Distance—Part II
4-D-34

Copyright © 2013 by
Polygoning the Circle
Orchard Growth Revisited
Cable Ready
Hiding in the Orchard
Presentations of Programming Puzzles
Presentations or write-ups of Just the Plane Facts
Three Variables, Continued
Matrices in the Oven
Inverses and Equations
Presentations of Meadows or Malls? Revisited
How Many More People?
Points, Slopes, and Equations
Photo Finish
What’s It All About?
Slippery Slopes
Return to “A Crowded Place”
Baseball Probabilities
How Likely Is All Wins?
Monthly Matches
Cones from Bowls, Bowls from Cones
Who’s on First?
About Bias
Race for the Pennant Revisited
As the Ferris Wheel Turns
Testing the Definition
More Beach Adventures
A Practice Jump
Moving Cart, Turning Ferris Wheel
NOTE: When developed in Phase II, individual units will better define the assessment tools and demonstrate how they will be used formatively and summative.
4-D-35

Copyright © 2013 by
Interactive Mathematics Program Curriculum Framework School: _Delaware STEM Academy________ Curricular Tool: _IMP________ Grade or Course _Year 4 (grade 12)
Standards Alignment Unit Concepts /
Big Ideas from IMP Essential Questions Assessment
Unit One: The Diver Returns
Timeline: 6 weeks
Know there is a complex number i such that i2 = –1,
and every complex number has the form a + bi with
a and b real. CC.N-CN.1
Use the relation i2 = –1 and the
commutative, associative, and distributive
properties to add, subtract, and multiply complex
numbers. CC.N-CN.2
Find the conjugate of a complex number; use
conjugates to find moduli and quotients of complex
numbers. CC.N-CN.3
Represent complex numbers on the complex plane
in rectangular and polar form (including real and
imaginary numbers), and explain why the
rectangular and polar forms of a given complex
number represent the same number. CC.N-CN.4
Represent addition, subtraction, multiplication, and
conjugation of complex numbers geometrically on
the complex plane; use properties of this
representation for computation. For example, (1 –
√3i)3 = 8 because (1 – √3i) has modulus 2 and
argument 120°. CC.N-CN.5 - supplementary lesson
is being developed by publisher
Calculate the distance between numbers in the
complex plane as the modulus of the difference, and
the midpoint of a segment as the average of the
numbers at its endpoints. CC.N-CN.6 –
supplementary lesson is being developed by
publisher
This unit uses key ideas from High Dive, including
the extension of the trigonometric functions and the
physics of objects falling from rest. The unit builds
on those ideas, especially extending the physics
principles to include motion with both horizontal and
vertical initial components, which students learn to
express as vectors. This leads to a study of quadratic
equations and the need to express a solution in terms
of the coefficients. That work culminates in the
development of the quadratic formula and an
introduction of complex numbers.
The main concepts and skills that students will
encounter and practice during the unit are
summarized below.
Trigonometry and Geometry
Using the extended trigonometric functions
Applying the principle that the tangent to a
circle is perpendicular to the radius at the point
of tangency
Physics
Reinforcing the idea that a person falling from a
moving object will follow a different path than
someone falling from a stationary object
Expressing velocity in terms of vertical and
horizontal components
Representing the motion of falling objects when
the vertical and horizontal components of the
initial velocity are both nonzero
Quadratic Equations
Recognizing the importance of quadratic
equations in the analysis of falling objects
Developing the quadratic formula
Can students apply the
quadratic formula?
Can students express the
physical laws of falling bodies
in terms of quadratic functions?
Can students use complex
numbers to solve certain
quadratic equations?
Can students extend right-
triangle trigonometric functions
to circular functions?
All assessments are
listed at the end of the
curriculum map.
4-D-36
Copyright © 2013 by
Standards Alignment Unit Concepts /
Big Ideas from IMP Essential Questions Assessment
Solve quadratic equations with real coefficients that
have complex solutions. CC.N-CN.7
Extend polynomial identities to the complex
numbers. For example, rewrite x2 + 4 as (x + 2i)(x
– 2i). CC.N-CN.8 – supplementary lesson is being
developed by publisher
Know the Fundamental Theorem of Algebra; show
that it is true for quadratic polynomials. CC.N-
CN.9 – supplementary lesson is being developed by
publisher
Recognize vector quantities as having both
magnitude and direction. Represent vector
quantities by directed line segments, and use
appropriate symbols for vectors and their
magnitudes (e.g., v, |v|, ||v||, v). CC.N.VM.1
Find the components of a vector by subtracting the
coordinates of an initial point from the coordinates
of a terminal point. CC.N-VM.2
Solve problems involving velocity and other
quantities that can be represented by vectors. CC.N-
VM.3
Add vectors end-to-end, componentwise, and by the
parallelogram rule. Understand that the magnitude
of a sum of two vectors is typically not the sum of
the magnitudes. CC.N-VM.4a
Given two vectors in magnitude and direction form,
determine the magnitude and direction of their sum.
CC.N-VM.4b
Understand vector subtraction v – w as
v + (–w), where –w is the additive inverse of
w, with the same magnitude as w and pointing in the
Using the quadratic formula to solve quadratic
equations
Finding a general solution for the falling time of
objects with an initial vertical velocity
Complex Numbers
Seeing the need to extend the number system to
solve certain quadratic equations
Establishing basic ideas about complex number
arithmetic
Representing complex numbers in the plane and
seeing addition of complex numbers as a vector
sum
4-D-37
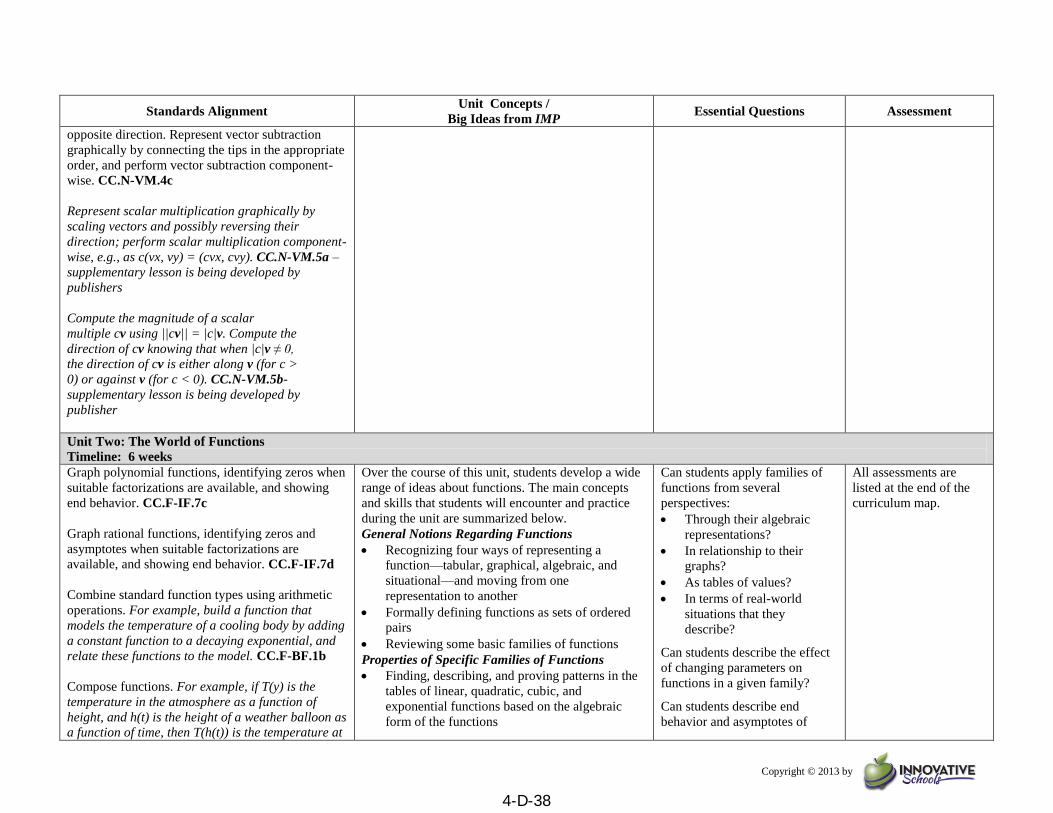
Copyright © 2013 by
Standards Alignment Unit Concepts /
Big Ideas from IMP Essential Questions Assessment
opposite direction. Represent vector subtraction
graphically by connecting the tips in the appropriate
order, and perform vector subtraction component-
wise. CC.N-VM.4c
Represent scalar multiplication graphically by
scaling vectors and possibly reversing their
direction; perform scalar multiplication component-
wise, e.g., as c(vx, vy) = (cvx, cvy). CC.N-VM.5a –
supplementary lesson is being developed by
publishers
Compute the magnitude of a scalar
multiple cv using ||cv|| = |c|v. Compute the
direction of cv knowing that when |c|v ≠ 0,
the direction of cv is either along v (for c >
0) or against v (for c < 0). CC.N-VM.5b-
supplementary lesson is being developed by
publisher
Unit Two: The World of Functions
Timeline: 6 weeks
Graph polynomial functions, identifying zeros when
suitable factorizations are available, and showing
end behavior. CC.F-IF.7c
Graph rational functions, identifying zeros and
asymptotes when suitable factorizations are
available, and showing end behavior. CC.F-IF.7d
Combine standard function types using arithmetic
operations. For example, build a function that
models the temperature of a cooling body by adding
a constant function to a decaying exponential, and
relate these functions to the model. CC.F-BF.1b
Compose functions. For example, if T(y) is the
temperature in the atmosphere as a function of
height, and h(t) is the height of a weather balloon as
a function of time, then T(h(t)) is the temperature at
Over the course of this unit, students develop a wide
range of ideas about functions. The main concepts
and skills that students will encounter and practice
during the unit are summarized below.
General Notions Regarding Functions
Recognizing four ways of representing a
function—tabular, graphical, algebraic, and
situational—and moving from one
representation to another
Formally defining functions as sets of ordered
pairs
Reviewing some basic families of functions
Properties of Specific Families of Functions
Finding, describing, and proving patterns in the
tables of linear, quadratic, cubic, and
exponential functions based on the algebraic
form of the functions
Can students apply families of
functions from several
perspectives:
Through their algebraic
representations?
In relationship to their
graphs?
As tables of values?
In terms of real-world
situations that they
describe?
Can students describe the effect
of changing parameters on
functions in a given family?
Can students describe end
behavior and asymptotes of
All assessments are
listed at the end of the
curriculum map.
4-D-38
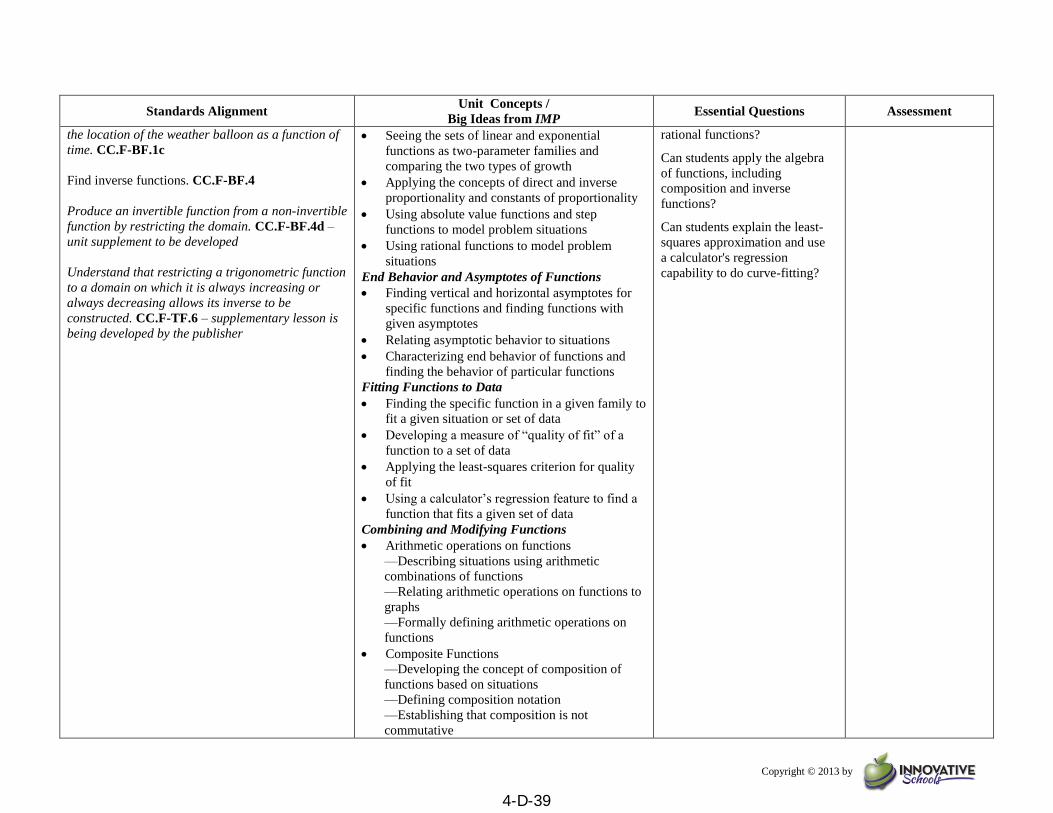
Copyright © 2013 by
Standards Alignment Unit Concepts /
Big Ideas from IMP Essential Questions Assessment
the location of the weather balloon as a function of
time. CC.F-BF.1c
Find inverse functions. CC.F-BF.4
Produce an invertible function from a non-invertible
function by restricting the domain. CC.F-BF.4d –
unit supplement to be developed
Understand that restricting a trigonometric function
to a domain on which it is always increasing or
always decreasing allows its inverse to be
constructed. CC.F-TF.6 – supplementary lesson is
being developed by the publisher
Seeing the sets of linear and exponential
functions as two-parameter families and
comparing the two types of growth
Applying the concepts of direct and inverse
proportionality and constants of proportionality
Using absolute value functions and step
functions to model problem situations
Using rational functions to model problem
situations
End Behavior and Asymptotes of Functions
Finding vertical and horizontal asymptotes for
specific functions and finding functions with
given asymptotes
Relating asymptotic behavior to situations
Characterizing end behavior of functions and
finding the behavior of particular functions
Fitting Functions to Data
Finding the specific function in a given family to
fit a given situation or set of data
Developing a measure of “quality of fit” of a
function to a set of data
Applying the least-squares criterion for quality
of fit
Using a calculator’s regression feature to find a
function that fits a given set of data
Combining and Modifying Functions
Arithmetic operations on functions
—Describing situations using arithmetic
combinations of functions
—Relating arithmetic operations on functions to
graphs
—Formally defining arithmetic operations on
functions
Composite Functions
—Developing the concept of composition of
functions based on situations
—Defining composition notation
—Establishing that composition is not
commutative
rational functions?
Can students apply the algebra
of functions, including
composition and inverse
functions?
Can students explain the least-
squares approximation and use
a calculator's regression
capability to do curve-fitting?
4-D-39
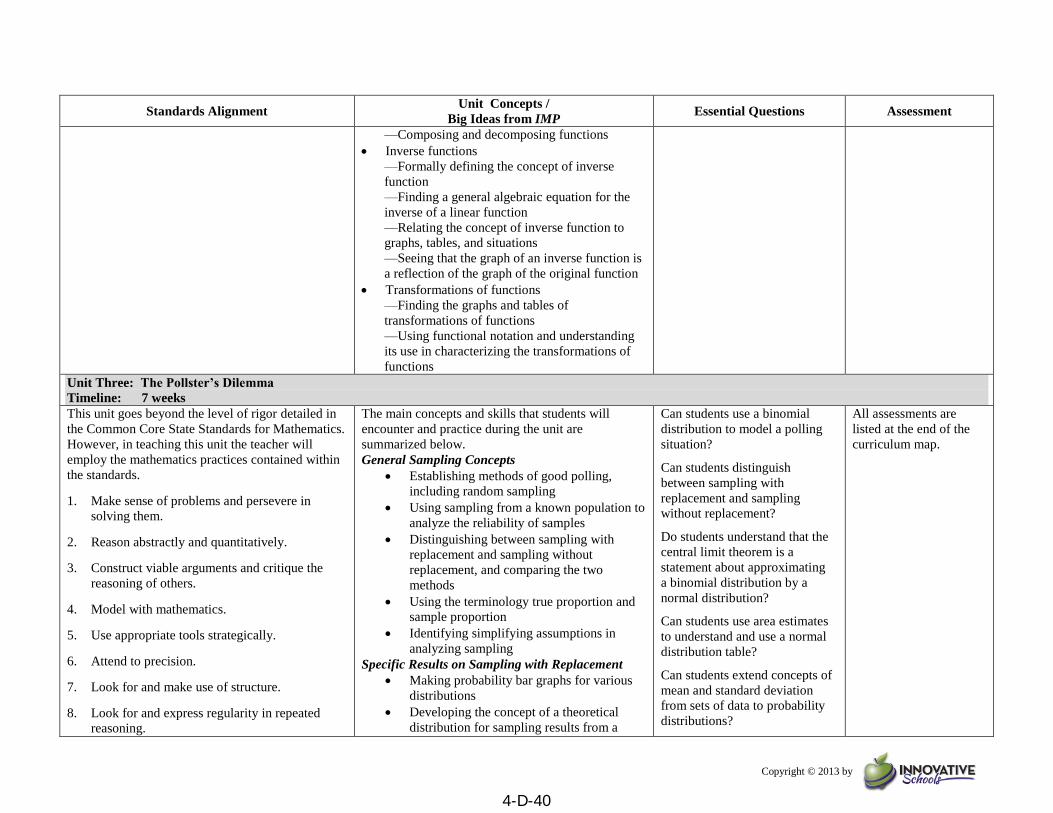
Copyright © 2013 by
Standards Alignment Unit Concepts /
Big Ideas from IMP Essential Questions Assessment
—Composing and decomposing functions
Inverse functions
—Formally defining the concept of inverse
function
—Finding a general algebraic equation for the
inverse of a linear function
—Relating the concept of inverse function to
graphs, tables, and situations
—Seeing that the graph of an inverse function is
a reflection of the graph of the original function
Transformations of functions
—Finding the graphs and tables of
transformations of functions
—Using functional notation and understanding
its use in characterizing the transformations of
functions
Unit Three: The Pollster’s Dilemma
Timeline: 7 weeks
This unit goes beyond the level of rigor detailed in
the Common Core State Standards for Mathematics.
However, in teaching this unit the teacher will
employ the mathematics practices contained within
the standards.
1. Make sense of problems and persevere in
solving them.
2. Reason abstractly and quantitatively.
3. Construct viable arguments and critique the
reasoning of others.
4. Model with mathematics.
5. Use appropriate tools strategically.
6. Attend to precision.
7. Look for and make use of structure.
8. Look for and express regularity in repeated
reasoning.
The main concepts and skills that students will
encounter and practice during the unit are
summarized below.
General Sampling Concepts
Establishing methods of good polling,
including random sampling
Using sampling from a known population to
analyze the reliability of samples
Distinguishing between sampling with
replacement and sampling without
replacement, and comparing the two
methods
Using the terminology true proportion and
sample proportion
Identifying simplifying assumptions in
analyzing sampling
Specific Results on Sampling with Replacement
Making probability bar graphs for various
distributions
Developing the concept of a theoretical
distribution for sampling results from a
Can students use a binomial
distribution to model a polling
situation?
Can students distinguish
between sampling with
replacement and sampling
without replacement?
Do students understand that the
central limit theorem is a
statement about approximating
a binomial distribution by a
normal distribution?
Can students use area estimates
to understand and use a normal
distribution table?
Can students extend concepts of
mean and standard deviation
from sets of data to probability
distributions?
All assessments are
listed at the end of the
curriculum map.
4-D-40
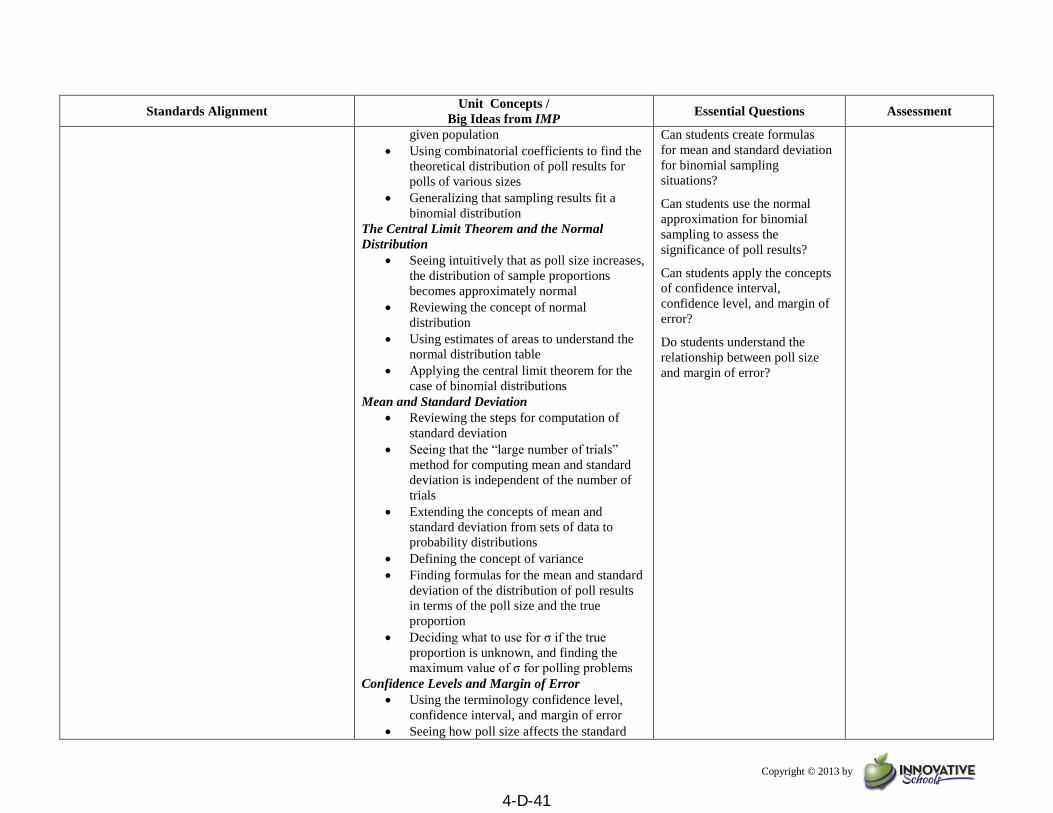
Copyright © 2013 by
Standards Alignment Unit Concepts /
Big Ideas from IMP Essential Questions Assessment
given population
Using combinatorial coefficients to find the
theoretical distribution of poll results for
polls of various sizes
Generalizing that sampling results fit a
binomial distribution
The Central Limit Theorem and the Normal
Distribution
Seeing intuitively that as poll size increases,
the distribution of sample proportions
becomes approximately normal
Reviewing the concept of normal
distribution
Using estimates of areas to understand the
normal distribution table
Applying the central limit theorem for the
case of binomial distributions
Mean and Standard Deviation
Reviewing the steps for computation of
standard deviation
Seeing that the “large number of trials”
method for computing mean and standard
deviation is independent of the number of
trials
Extending the concepts of mean and
standard deviation from sets of data to
probability distributions
Defining the concept of variance
Finding formulas for the mean and standard
deviation of the distribution of poll results
in terms of the poll size and the true
proportion
Deciding what to use for σ if the true
proportion is unknown, and finding the
maximum value of σ for polling problems
Confidence Levels and Margin of Error
Using the terminology confidence level,
confidence interval, and margin of error
Seeing how poll size affects the standard
Can students create formulas
for mean and standard deviation
for binomial sampling
situations?
Can students use the normal
approximation for binomial
sampling to assess the
significance of poll results?
Can students apply the concepts
of confidence interval,
confidence level, and margin of
error?
Do students understand the
relationship between poll size
and margin of error?
4-D-41

Copyright © 2013 by
Standards Alignment Unit Concepts /
Big Ideas from IMP Essential Questions Assessment
deviation of poll results
Establishing confidence intervals in terms
of sample proportions and standard
deviation
Seeing how the term margin of error is
commonly used in news reporting
Estimating the size of a poll based on the
reported margin of error
Unit Four: How Much? How Fast?
Timeline: 6 weeks
Understand radian measure of an angle as the length
of the arc on the unit circle subtended by the angle.
CC.F-TF.1
Use special triangles to determine
geometrically the values of sine, cosine,
tangent for π/3, π/4 and π/6, and use the unit
circle to express the values of sine, cosines,
and tangent for x, π + x, and 2π – x in terms
of their values for x, where x is any real number.
CC.F-TF.3
Use the unit circle to explain symmetry (odd and
even) and periodicity of trigonometric functions.
CC.F-TF.4
Derive using similarity the fact that the
length of the arc intercepted by an angle is
proportional to the radius, and define the
radian measure of the angle as the constant
of proportionality; derive the formula for the area
of a sector. CC.G-C.5 – supplementary lesson is
being developed by the publisher
This unit focuses on key ideas and techniques from
calculus and their applications in various settings.
The main concepts and skills that students will
encounter and practice during the unit are
summarized below.
Accumulation
Recognizing that the area under a rate curve
represents an accumulation
Estimating amount of total accumulation
based on linear approximations of a
situation
Creating and analyzing graphs for
accumulation as a function of time
Derivatives
Reviewing the concept of a derivative as an
instantaneous rate of change
Estimating derivatives from graphs
Developing formulas for derivatives of
simple polynomial functions
Developing formulas for derivatives of the
sine and cosine functions
Establishing principles for the derivative of
a sum or constant multiple
The Fundamental Theorem of Calculus
Seeing that an accumulation function is an
antiderivative of the corresponding rate
function
Finding areas and volumes using
Can students estimate
derivatives from graphs, and
develop formulas for
derivatives of some basic
functions?
Do students understand
accumulation as the
antiderivative of a corresponding
rate function?
Can students define radian
measure?
All assessments are
listed at the end of the
curriculum map.
4-D-42
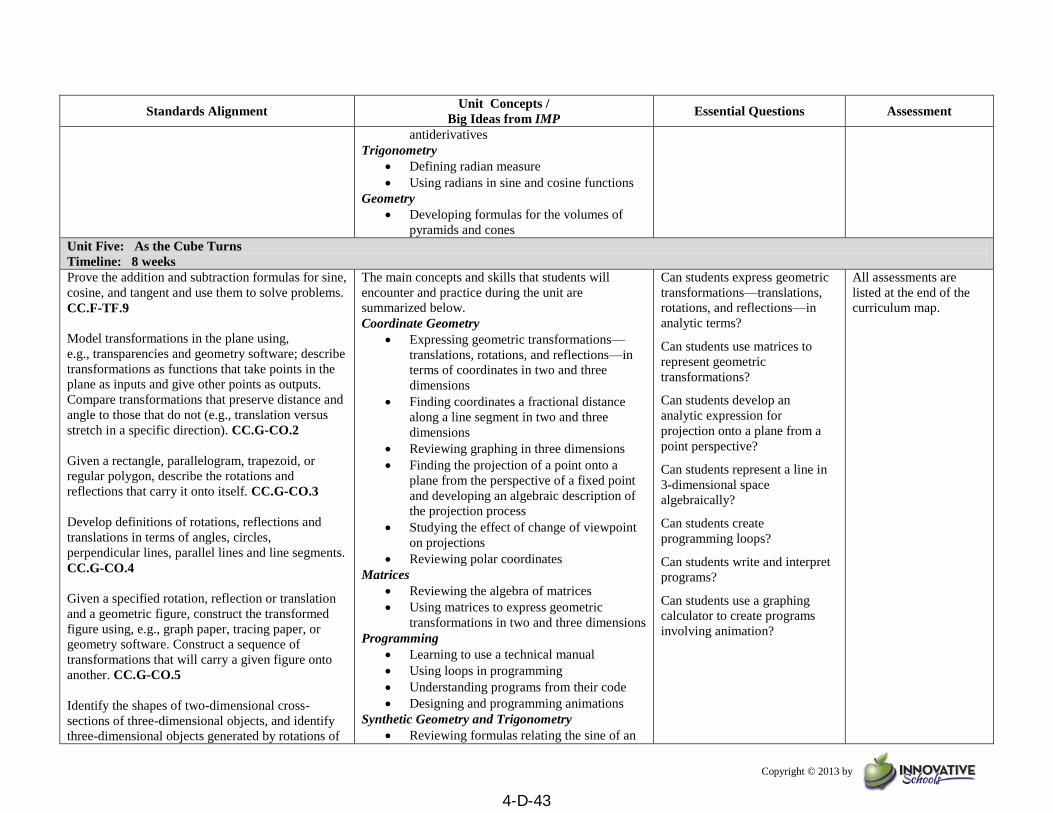
Copyright © 2013 by
Standards Alignment Unit Concepts /
Big Ideas from IMP Essential Questions Assessment
antiderivatives
Trigonometry
Defining radian measure
Using radians in sine and cosine functions
Geometry
Developing formulas for the volumes of
pyramids and cones
Unit Five: As the Cube Turns
Timeline: 8 weeks
Prove the addition and subtraction formulas for sine,
cosine, and tangent and use them to solve problems.
CC.F-TF.9
Model transformations in the plane using,
e.g., transparencies and geometry software; describe
transformations as functions that take points in the
plane as inputs and give other points as outputs.
Compare transformations that preserve distance and
angle to those that do not (e.g., translation versus
stretch in a specific direction). CC.G-CO.2
Given a rectangle, parallelogram, trapezoid, or
regular polygon, describe the rotations and
reflections that carry it onto itself. CC.G-CO.3
Develop definitions of rotations, reflections and
translations in terms of angles, circles,
perpendicular lines, parallel lines and line segments.
CC.G-CO.4
Given a specified rotation, reflection or translation
and a geometric figure, construct the transformed
figure using, e.g., graph paper, tracing paper, or
geometry software. Construct a sequence of
transformations that will carry a given figure onto
another. CC.G-CO.5
Identify the shapes of two-dimensional cross-
sections of three-dimensional objects, and identify
three-dimensional objects generated by rotations of
The main concepts and skills that students will
encounter and practice during the unit are
summarized below.
Coordinate Geometry
Expressing geometric transformations—
translations, rotations, and reflections—in
terms of coordinates in two and three
dimensions
Finding coordinates a fractional distance
along a line segment in two and three
dimensions
Reviewing graphing in three dimensions
Finding the projection of a point onto a
plane from the perspective of a fixed point
and developing an algebraic description of
the projection process
Studying the effect of change of viewpoint
on projections
Reviewing polar coordinates
Matrices
Reviewing the algebra of matrices
Using matrices to express geometric
transformations in two and three dimensions
Programming
Learning to use a technical manual
Using loops in programming
Understanding programs from their code
Designing and programming animations
Synthetic Geometry and Trigonometry
Reviewing formulas relating the sine of an
Can students express geometric
transformations—translations,
rotations, and reflections—in
analytic terms?
Can students use matrices to
represent geometric
transformations?
Can students develop an
analytic expression for
projection onto a plane from a
point perspective?
Can students represent a line in
3-dimensional space
algebraically?
Can students create
programming loops?
Can students write and interpret
programs?
Can students use a graphing
calculator to create programs
involving animation?
All assessments are
listed at the end of the
curriculum map.
4-D-43
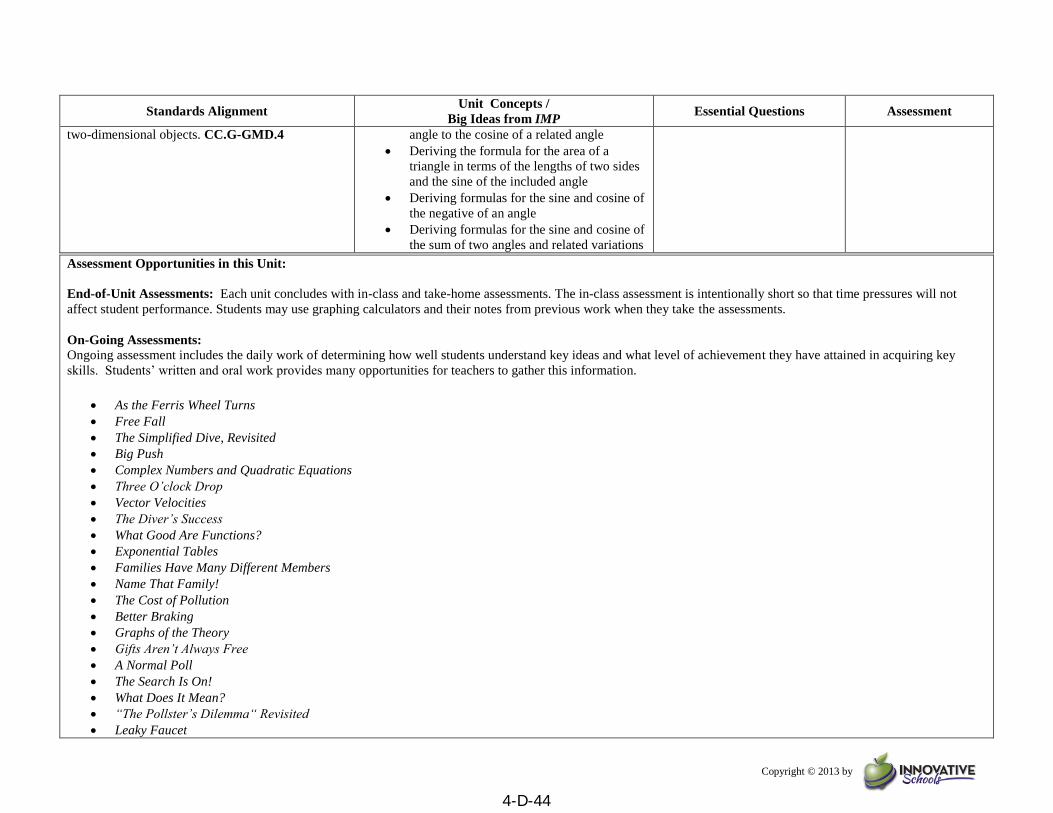
Copyright © 2013 by
Standards Alignment Unit Concepts /
Big Ideas from IMP Essential Questions Assessment
two-dimensional objects. CC.G-GMD.4
angle to the cosine of a related angle
Deriving the formula for the area of a
triangle in terms of the lengths of two sides
and the sine of the included angle
Deriving formulas for the sine and cosine of
the negative of an angle
Deriving formulas for the sine and cosine of
the sum of two angles and related variations
Assessment Opportunities in this Unit:
End-of-Unit Assessments: Each unit concludes with in-class and take-home assessments. The in-class assessment is intentionally short so that time pressures will not
affect student performance. Students may use graphing calculators and their notes from previous work when they take the assessments.
On-Going Assessments:
Ongoing assessment includes the daily work of determining how well students understand key ideas and what level of achievement they have attained in acquiring key
skills. Students’ written and oral work provides many opportunities for teachers to gather this information.
As the Ferris Wheel Turns
Free Fall
The Simplified Dive, Revisited
Big Push
Complex Numbers and Quadratic Equations
Three O’clock Drop
Vector Velocities
The Diver’s Success
What Good Are Functions?
Exponential Tables
Families Have Many Different Members
Name That Family!
The Cost of Pollution
Better Braking
Graphs of the Theory
Gifts Aren’t Always Free
A Normal Poll
The Search Is On!
What Does It Mean?
“The Pollster’s Dilemma“ Revisited
Leaky Faucet
4-D-44
Copyright © 2013 by
A Distance Graph
Zero to Sixty
A Pyramid of Bright Ideas
A Solar Summary
Learning the Loops
Move That Line!
Oh, Say What You Can See
Swing That Line!
And Fred Brings the Lunch
Find Those Corners!
Work on POW 9: An Animated POW (The outline is turned in for An Animated Outline, the write-up is turned in for An Animated POW Write-up, and
presentations are made following that.)
NOTE: When developed in Phase II, individual units will better define the assessment tools and demonstrate how they will be used formatively and summative.
4-D-45