Relative abundance and morphometrics of the Travancore tortoise, Indotestudo travancorica, in the...
68
NOTES AND FIELD REPORTS Chelonian Conservation and Biology, 2008, 7(1): 88–95 Ó 2008 Chelonian Research Foundation The Status of Apalone atra Populations in Cuatro Cie ´negas, Coahuila, Me ´xico: Preliminary Data SUZANNE E. MCGAUGH 1 AND FREDRIC J. JANZEN 1 1 Department of Ecology, Evolution, and Organismal Biology, Iowa State University, Ames, Iowa 50011 USA [[email protected]; [email protected]] ABSTRACT . – The species-level designation of the Mexican softshell turtle, Apalone atra, has been repeatedly challenged, yet no DNA evidence has been collected. We conducted field studies of all the drainages of the Cuatro Cie ´negas basin, and the only pure morphological population of A. atra found was in Tı ´o Candido, the type locality for the species. One nuclear intron known to show species-level divergence in the family Trionychidae, 2 nuclear genes, and a mitochondrial gene revealed little molecular diver- gence for A. atra when compared with A. spinifera emoryi from the Rio Grande. Further, no reciprocal monophyly of the mitochondrial gene tree was seen between A. atra and A. s. emoryi morphotypes. For many species, hybridization and high migration rates are important components of an organism’s long- term evolutionary trajectory (Maddison 1997), but in a short time scale, these behaviors create difficulty in the delimitation of these organisms as evolutionarily signifi- cant units (ESU) for conservation protection (Moritz 1994). ESUs are defined in 2 ways: 1) populations that have reciprocal monophyly at mitochondrial loci with significant divergence in nuclear loci (Moritz 1994) and 2) populations that are substantially reproductively isolated and represent distinct evolutionary legacies (i.e., genetic variability; Waples 1991, 1995). Here we investigate DNA evidence to determine if the turtle species Apalone atra, the endemic Cuatro Cie ´negas black softshell, meets either of these criteria. The taxonomic and conservation standing of A. atra is controversial. This turtle is currently listed on the CITES (Convention on International Trade in Endangered Species of Wild Flora and Fauna) Appendix I endangered species list, but it has also been reported to be extinct (Smith and Smith 1979). Hybridization between A. atra and a south Texas species, Apalone spinifera emoryi, is thought to have begun in the 1880s when irrigation canals were constructed, opening the Cuatro Cie ´negas basin hydrolog- ically (D. Hendrickson, pers. comm.; Webb 1973). Winokur (1968) could not determine the rate of hybrid- ization, concluded the identification of some specimens as hybrids to be uncertain, and verified pure A. atra. By 1979, Smith and Smith considered A. atra to be an extinct lineage due to hybridization with A. spinifera emoryi. In 1983, a softshell resembling pure A. atra was noted in a field trip to the Cuatro Cie ´negas basin (Ernst and Barbour 1992). In this study, we sought to illuminate the taxonomic status of the endemic Cuatro Cie ´negas black softshell, A. atra, by assessing its molecular distinction from the invasive congener, A. s. emoryi. We sampled all 5 drainages in the basin (Evans 2005) for turtles with A. atra morphological characteristics and used mitochondrial DNA sequence data from Cuatro Cie ´negas softshell turtles and A. spinifera subspecies to reconstruct a haplotype network and a phylogenetic tree. In addition, we built distance matrices with the mitochondrial DNA data and 3 nuclear loci. Methods. — Morphological surveys were extensive; we inspected all currently defined and flowing drainages in El A ´ rea de Proteccio ´n de Flora y Fauna Cuatro Cie ´negas, Coahuila, Me ´xico, for A. atra (Fig. 1; Minckley 1969). This sampling included the type locality, Tı ´o Candido, and spanned 62 days of trapping from 16 May to 16 June 2003 and from 4 June to 5 July 2004 (Webb and Legler 1960). Turtles were captured in lobster or hoop traps that were baited with sardines and checked every 12–14 hours. Each turtle was tattooed in a unique pattern on the plastron. Morphologically, A. atra is characterized by 5 main traits: 1) ‘‘blackish’’ pigmentation of dorsal surface, 2) speckled pigmentation on ventral surfaces, 3) faint marginal bands and posterior white tubercles on the carapace of males only, 4) longitudinal corrugations on the posterior of the carapace, and 5) ovoid adult carapaces (Webb and Legler 1960; Winokur 1968). Apalone spinifera emoryi is defined by 1) tan to olive-brown carapace; 2) no ventral pigmentation; 3) defined pale marginal band; 4) white, raised tubercles on the back third of the carapace; and 4) a clear triangular facial pattern (Ernst et al. 1994). In this study, A. atra were distinguished from A. s. emoryi by dark pigmentation on the carapace, speckled pigmentation on the plastron, and corrugations on the posterior carapace. These traits showed no sexual dimorphism and little to no change through adult life and were exclusive to A. atra. See Appendix I for morphological characteristics and habitat types and Appendix II for photo voucher accession numbers for each specimen. Less than 0.5 ml of blood were drawn from the caudal vein of the 26 field-collected animals, stored in buffer (0.01 M Tris, 10 mM EDTA, 0.01 M NaCl, and 1% SDS), and frozen. DNA was extracted using Roche High Pure Template Preparation Kit (Cat. 1796828). DNA sequence data were obtained using an ABI 3730 DNA Analyzer.
-
Upload
azimpremjiuniversity -
Category
Documents
-
view
0 -
download
0
Transcript of Relative abundance and morphometrics of the Travancore tortoise, Indotestudo travancorica, in the...
NOTES AND FIELD REPORTS
Chelonian Conservation and Biology, 2008, 7(1): 88–95
� 2008 Chelonian Research Foundation
The Status of Apalone atra Populations inCuatro Cienegas, Coahuila, Mexico:
Preliminary Data
SUZANNE E. MCGAUGH1
AND
FREDRIC J. JANZEN1
1Department of Ecology, Evolution, and Organismal Biology, Iowa
State University, Ames, Iowa 50011 USA [[email protected];
ABSTRACT. – The species-level designation of theMexican softshell turtle, Apalone atra, has beenrepeatedly challenged, yet no DNA evidence has beencollected. We conducted field studies of all thedrainages of the Cuatro Cienegas basin, and the onlypure morphological population of A. atra found was inTıo Candido, the type locality for the species. Onenuclear intron known to show species-level divergencein the family Trionychidae, 2 nuclear genes, and amitochondrial gene revealed little molecular diver-gence for A. atra when compared with A. spiniferaemoryi from the Rio Grande. Further, no reciprocalmonophyly of the mitochondrial gene tree was seenbetween A. atra and A. s. emoryi morphotypes.
For many species, hybridization and high migration
rates are important components of an organism’s long-
term evolutionary trajectory (Maddison 1997), but in a
short time scale, these behaviors create difficulty in the
delimitation of these organisms as evolutionarily signifi-
cant units (ESU) for conservation protection (Moritz
1994). ESUs are defined in 2 ways: 1) populations that
have reciprocal monophyly at mitochondrial loci with
significant divergence in nuclear loci (Moritz 1994) and 2)
populations that are substantially reproductively isolated
and represent distinct evolutionary legacies (i.e., genetic
variability; Waples 1991, 1995). Here we investigate DNA
evidence to determine if the turtle species Apalone atra,
the endemic Cuatro Cienegas black softshell, meets either
of these criteria.
The taxonomic and conservation standing of A. atra is
controversial. This turtle is currently listed on the CITES
(Convention on International Trade in Endangered Species
of Wild Flora and Fauna) Appendix I endangered species
list, but it has also been reported to be extinct (Smith and
Smith 1979). Hybridization between A. atra and a south
Texas species, Apalone spinifera emoryi, is thought to
have begun in the 1880s when irrigation canals were
constructed, opening the Cuatro Cienegas basin hydrolog-
ically (D. Hendrickson, pers. comm.; Webb 1973).
Winokur (1968) could not determine the rate of hybrid-
ization, concluded the identification of some specimens as
hybrids to be uncertain, and verified pure A. atra. By 1979,
Smith and Smith considered A. atra to be an extinct
lineage due to hybridization with A. spinifera emoryi. In
1983, a softshell resembling pure A. atra was noted in a
field trip to the Cuatro Cienegas basin (Ernst and Barbour
1992).
In this study, we sought to illuminate the taxonomic
status of the endemic Cuatro Cienegas black softshell, A.atra, by assessing its molecular distinction from the
invasive congener, A. s. emoryi. We sampled all 5
drainages in the basin (Evans 2005) for turtles with A.atra morphological characteristics and used mitochondrial
DNA sequence data from Cuatro Cienegas softshell turtles
and A. spinifera subspecies to reconstruct a haplotype
network and a phylogenetic tree. In addition, we built
distance matrices with the mitochondrial DNA data and 3
nuclear loci.
Methods. — Morphological surveys were extensive;
we inspected all currently defined and flowing drainages in
El Area de Proteccion de Flora y Fauna Cuatro Cienegas,
Coahuila, Mexico, for A. atra (Fig. 1; Minckley 1969).
This sampling included the type locality, Tıo Candido, and
spanned 62 days of trapping from 16 May to 16 June 2003
and from 4 June to 5 July 2004 (Webb and Legler 1960).
Turtles were captured in lobster or hoop traps that were
baited with sardines and checked every 12–14 hours. Each
turtle was tattooed in a unique pattern on the plastron.
Morphologically, A. atra is characterized by 5 main
traits: 1) ‘‘blackish’’ pigmentation of dorsal surface, 2)
speckled pigmentation on ventral surfaces, 3) faint
marginal bands and posterior white tubercles on the
carapace of males only, 4) longitudinal corrugations on the
posterior of the carapace, and 5) ovoid adult carapaces
(Webb and Legler 1960; Winokur 1968). Apalonespinifera emoryi is defined by 1) tan to olive-brown
carapace; 2) no ventral pigmentation; 3) defined pale
marginal band; 4) white, raised tubercles on the back third
of the carapace; and 4) a clear triangular facial pattern
(Ernst et al. 1994). In this study, A. atra were
distinguished from A. s. emoryi by dark pigmentation on
the carapace, speckled pigmentation on the plastron, and
corrugations on the posterior carapace. These traits
showed no sexual dimorphism and little to no change
through adult life and were exclusive to A. atra. See
Appendix I for morphological characteristics and habitat
types and Appendix II for photo voucher accession
numbers for each specimen.
Less than 0.5 ml of blood were drawn from the caudal
vein of the 26 field-collected animals, stored in buffer
(0.01 M Tris, 10 mM EDTA, 0.01 M NaCl, and 1% SDS),
and frozen. DNA was extracted using Roche High Pure
Template Preparation Kit (Cat. 1796828). DNA sequence
data were obtained using an ABI 3730 DNA Analyzer.
This included 725 base pairs (bp) of cytochrome bmitochondrial gene (CytbF: 50 ACAGGCGTAATCC-
TACTAC 30; DW1594; see Weisrock and Janzen 2000)
from putative A. atra in the type locality (n ¼ 6), 8 other
localities in the basin (n ¼ 19), and the pallid softshell (A.s. pallida; MidCon63). Additionally, 1638 bp of recom-
bination activating gene-1 (RAG-1; see Krenz et al. 2005
for primers), 886 bp of RNA fingerprint protein 35 nuclear
intron (R35; see Fujita et al. 2004 for primers), and 538 bp
of the oncogene C-mos (see Saint et al. 1998 for primers)
were used to construct distance matrices to compared the
type locality specimens (n ¼ 2) to A. s. pallida (CME63
from Irion County, Texas), A. s. emoryi (TXsc from
Valverde County, Texas, and NMrg from Socorro County,
New Mexico; Weisrock and Janzen 2000), and A. mutica(LAcrm1 from East Baton Rouge Parish, Baker, Louisi-
ana; Weisrock and Janzen 2000). The nuclear intron R35
has been successful in resolving species-level phylogenies
in the family Trionychidae (Engstrom et al. 2004), and
RAG-1 has been successful in resolving species-level
phylogenies in other Testudines (Krenz et al. 2005). The
third nuclear marker, C-mos, has not been extensively used
for phylogenetics in turtles. All PCR products were gel
purified for the appropriate band size using Qiagen’s
QIAquick Gel Extraction Kit (Cat. 28706). Some
heterozygosity was observed in the RAG-1 sequences.
As needed, we cloned separate alleles using pGEM-T Easy
Vector System I (Promega A1360) and One Shot Mach I
Competent Cells (Invitrogen C8620–03). GenBank acces-
sion numbers are located in Appendix II.
Eight additional samples from a previous study were
used for the total phylogenetic analysis (total n ¼ 34;
Weisrock and Janzen 2000; LAcr1m, NMrg, ONtr1,
FLer1, GAsr, TXcc, TXki, and TXsc). Alignments were
performed in CLUSTAL W (Thompson et al. 1994), and
sequences were visually reviewed and corrected in BioEdit
7.0.0 (Hall 1999). Modeltest 3.7 (Posada and Crandall
1998) was used to estimate parameters of sequence
evolution for all genes using Akaike’s information
criterion (Posada and Buckley 2004). No model of
sequence evolution was proposed or tested in other studies
of Apalone phylogeography (e.g., Weisrock and Janzen
2000), but the models for cytochrome b in this study were
tested with representatives from major clades of Weisrock
and Janzen (2000). These parameters were taken into
account when constructing distance matrices in PHYLIP
3.62 (Felsenstein 2005). A maximum likelihood tree using
cytochrome b was constructed using parameters estimated
in Modeltest 3.7 and bootstrapped for 100 replicates using
Paup 4.0b. Parsimony and neighbor-joining trees carried
the same signature of weakly supported nodes and can be
obtained from the first author. Nuclear DNA sequences
showed little to no divergence, and therefore, no trees were
constructed using those data. Haplotype groups were
defined with DNASP (Rozas et al. 2003). Haplotype
networks were built using statistical parsimony in TCS
with gaps set as missing data (Clement et al. 2000).
Results. — Animals that were morphologically
concordant with A. atra were found predominantly in the
type locality, Tıo Candido (Fig. 2). Here, no A. s. emoryi
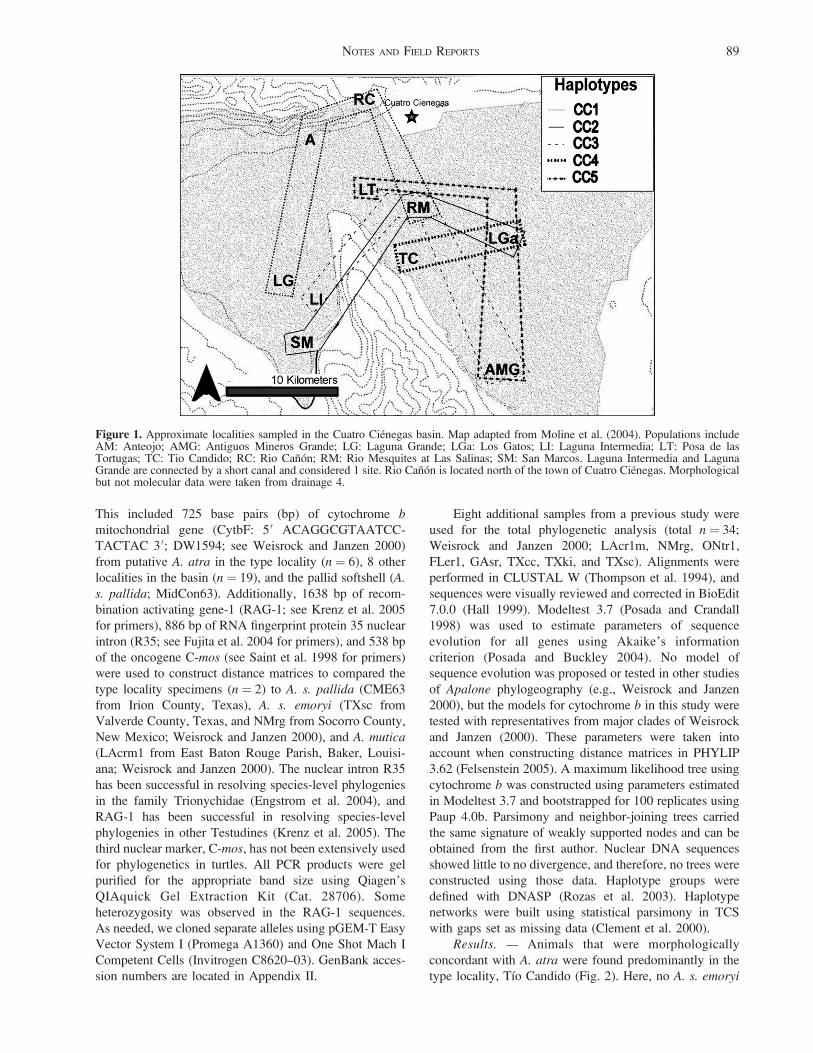
Figure 1. Approximate localities sampled in the Cuatro Cienegas basin. Map adapted from Moline et al. (2004). Populations includeAM: Anteojo; AMG: Antiguos Mineros Grande; LG: Laguna Grande; LGa: Los Gatos; LI: Laguna Intermedia; LT: Posa de lasTortugas; TC: Tio Candido; RC: Rio Canon; RM: Rio Mesquites at Las Salinas; SM: San Marcos. Laguna Intermedia and LagunaGrande are connected by a short canal and considered 1 site. Rio Canon is located north of the town of Cuatro Cienegas. Morphologicalbut not molecular data were taken from drainage 4.
NOTES AND FIELD REPORTS 89

morphs were found in 11 days of trapping (Webb and
Legler 1960). Turtles trapped in Antiguos Mineros
Grande, and 3 turtles trapped in Posa de las Tortugas
(e.g., LT104; also known as Mojarral Este) also were
morphologically concordant to the description of A. atra,
but A. s. emoryi morphs and potential hybrids were also
present. Within the other 3 sites, Antejeo, Rio Mesquites,
and Rio Canon, A. atra–like traits were found in
conjunction with A. s. emoryi–like traits in the same
animal. Hybrids and backcrosses were difficult to
accurately define; although, 9 turtles presented both A. s.emoryi and A. atra characteristics (Appendix I). Only
morphological characteristics of A. s. emoryi were found at
San Marcos, Los Gatos, and Laguna Grande.
Results from distance matrices are illustrated in Table
1. Cytochrome b divergence of A. atra (TC38 and TC36,
Table 1) with unequivocal species and subspecies, A.mutica (; 9.24%) and A. s. pallida (1.24%), was
substantial. Cytochrome b divergence of A. atra with A.s. emoryi was nearly an order of magnitude lower (0.14%–
0.28%). Likewise, the nuclear loci showed divergence
between A. mutica and A. atra (RAG-1: 0.93%, R35:
1.14%, C-mos: 0.58%) but very little divergence between
A. s. emoryi and A. atra (RAG-1 , 0.01%, R35: 0.10%,
C-mos: 0.0.09%). Apalone atra did not show substantial
divergence with A. s. pallida at these nuclear loci either
(RAG-1 , 0.01%, R35 , 0.01%, C-mos: 0.14). This
combined genetic information, with special emphasis on
the cytochrome b data, suggests that sequence divergence
between the Rio Grande A. s. emoryi (Txsc and NMrg;
Weisrock and Janzen 2000) and individuals from the type
locality for A. atra, Tıo Candido, where A. s. emoryimorphs were never caught, is insufficient for strong ESU
delimitation through Waples’s (1991, 1995) requirement
of reproductive isolation.
Results from the phylogenetic analysis strengthened
the hypothesis that A. atra does not represent a unique
species. The maximum likelihood tree is illustrative of all
trees constructed (Fig. 3). The lack of reciprocal
monophyly of A. atra morphs in comparison to A. s.emoryi morphs suggests that A. atra does not qualify as an
ESU through Mortiz’s (1994) definition (Fig. 3).
Nine mitochondrial haplotypes were recorded among
25 individuals from the 9 sites in the Cuatro Cienegas
basin, 2 Rio Grande A. s. emoryi samples (TXsc and
Figure 2. Putative Apalone atra from Tio Candido (TC35,female, 2a) and Apalone spinifera emoryi from the RioMesquites at Las Salinas (RM25, male, 2b). Apalone atra ischaracterized by dark, ‘‘blackish’’ pigmentation of dorsal andventral surfaces and longitudinal corrugations on the posteriorpart of the carapace. Defining characteristics for A. s. emoryi are atan or olive-brown carapace with the back third covered in whitetubercles. Photos by S. McGaugh.
Table 1. DNA pairwise distances of Apalone spinifera emoryi (TXsc and NMrg), A. atra (Tıo Candido, Cuatro Cienegas, Mexico;TC38 and TC36), A. s. pallida (Irion County, TX; CME63), and A. mutica. Values are given in percentages for 725 base pairs (bp) ofcytochrome b, 1638 bp of recombination activase gene-1, 886 bp of RNA fingerprint protein 35 nuclear intron, and 538 bp of C-mos,respectively.
A. atra (TC36) A. atra (TC38) A. s. emoryi (TXsc) A. s. emoryi (NMrg) A. s. pallida (CME63)
A. atra (TC36) 0A. atra (TC38) 0.001, 0.001,
0.001, 0.100A. s. emoryi (TXsc) 0.276, 0.001,
0.001, 0.0920.276, 0.001,
0.001, 0.092A. s. emoryi (NMrg) 0.139, 0.001
0.103, 0.09110.139, 0.001
0.103, 0.0910.139, 0.001,
0.103, 0.061A. s. pallida (CME63) 1.261, 0.001,
0.001, 0.1411.261, 0.001,
0.001, 0.1411.261, 0.001,
0.001, 0.0711.120, 0.001,
0.103, 0.071A. mutica 9.243, 0.934,
1.144, 0.5829.243, 0.939,
1.144, 0.5829.249, 0.939,1.144, 0.550
9.085, 0.939,1.2492, 0.551
8.447, 0.939,1.144, 0.176
90 CHELONIAN CONSERVATION AND BIOLOGY, Volume 7, Number 1 — 2008

NMrg), 2 south Texas A. s. pallida samples (TXcc and
MidCon63), and 1 southeast Texas A. s. guadalupensissample (TXki; Fig. 4). Although for a within-population
analysis including south Texas Apalone may not be
accurate, including these samples provided perspective on
the close relationship of A. s. emoryi and A. atrahaplotypes. Five of the 9 mitochondrial haplotypes
(CC1–CC5) occurred in the Cuatro Cienegas basin, with
1 of those 5 (CC1) containing a Rio Grande sample
(NMrg; Fig. 4). One mitochondrial haplotype (CC4) was
shared among all Tıo Candido turtles, and 2 other turtles
from another eastern locality in the basin (Los Gatos; Fig.
4). This preliminary sampling was not sufficient to
perform statistical evaluations of haplotype genealogy
and diversity, but examination of the geographic distribu-
tion of haplotypes (Fig. 1) suggests that some microgeo-
graphic genetic structuring may potentially exist.
Discussion. — Weisrock and Janzen (2000) reported
that A. spinifera and A. mutica exhibit relatively large
amounts of intraspecific mitochondrial cytochrome b DNA
variation. This marker is sufficiently variable to reveal
sequence divergences between legitimate species (e.g., A.spinifera and A. mutica are 8.0%–8.8% divergent from
one another; Weisrock and Janzen 2000). Two Rio Grande
populations of A. s. emoryi, Socorro County, New Mexico,
and Valverde County, Texas, have low sequence diver-
gence for cytochrome b (0.1%), and these samples served
as primary references for evaluating the genetic divergence
between A. atra and A. s. emoryi morphotypes in the
Cuatro Cienegas basin. We found that sequence diver-
Figure 3. Maximum likelihood tree for cytochrome b samples within the Cuatro Cienegas basin. Bootstrap values are given. Apalonespinifera subspecies are given in the tree, including A. s. emoryi from the Rio Grande (NMrg: Socorro County, New Mexico; TXsc:Valverde County, Texas; see Appendix I for full descriptions). The out-group is A. mutica (Lacr1m) from East Baton Rouge Parish,Baker, Louisiana. Haplotypes are defined only within the Cuatro Cienegas basin. Solid gray boxes indicate those specimens that weremost concordant with species descriptions of A. atra. Dotted gray boxes indicate specimens that are very similar but not perfectlyconcordant to species descriptions of A. atra.
NOTES AND FIELD REPORTS 91

gences between the Rio Grande A. s. emoryi and the type
locality for A. atra in the Tio Candido drainage of Cuatro
Cienegas (0.14%–0.28%) are comparable to the within–
Rio Grande levels of divergence for A. s. emoryi,providing no mitochondrial evidence of previous specia-
tion between these taxa. In the case of sexually
symmetrical hybridization, one would expect to find a
distinct, remnant mitochondrial signature if the popula-
tions were separate in the recent (; 130 years) past. No
evidence for asymmetrical gene flow (from A. s. emoryifemales to A. atra males) is apparent, and so the
homogeneous nature of haplotypes reported here supports
the idea that these putative species were probably not
historically separate in gene flow.
The phylogenetic and haplotype analyses of the
mitochondrial data indicate that there is nonreciprocal
monophyly between morphologically putative A. atra, the
A. s. emoryi morphotypes in the basin, or Rio Grande
individuals (Figs. 3, 4). With such weak divergences and
low bootstrap support for within-basin comparisons (Fig.
3), important insight can be drawn from a haplotype
network (Fig. 4) in conjunction with the phylogenetic
analysis. Network examination reveals greater diversity is
present between haplotypes within the Cuatro Cienegas
basin than between the A. s. emoryi of the Rio Grande and
A. atra. Although type locality individuals (Tıo Candido)
are all of the same haplotype (CC4), Los Gatos individuals
are from the same haplotype group and are morpholog-
ically A. s. emoryi.The haplotype analysis is probably unaffected by the
analysis of only 2 samples of A. s. emoryi. These samples
are separated by greater than 1100 km of river distance;
still, the haplotypes were only 0.1% divergent from one
another (Weisrock and Janzen 2000). Thus, it could be
safely assumed that the total divergence across the entire
range of A. s. emoryi is probably similarly low. Even with
more extensive A. s. emoryi sampling, haplotypes will
most likely continue to be very similar to those found in
the Cuatro Cienegas basin.
At least 2 factors must be considered before
conservation management recommendations are made.
First, morphological variation within the basin is abundant
and could be indicative of real, locally adapted morphs.
Winokur (1968) hypothesized that this morphological
variability may be related to habitat type. Overall, darker,
A. atra–like individuals were found in dark-bottomed
lagoons, while lighter, A. s. emoryi–like individuals were
found in light-bottomed playa lakes and rivers (Winokur
1968; Webb 1973). This view is supported, at least, for
coloration, a trait that is hypothesized here to be a result of
background matching (Appendix I; McGaugh 2008).
Background matching is a physiological color change in
response to light or dark surroundings and is known to
happen over several weeks to months in A. spinifera(Bartley 1971; Ernst et al. 1994). Second, even if the
morphological variability can be potentially explained by
habitat parameters, the limited geographic distribution of
mitochondrial haplotype CC4 suggests that some genetic
substructuring may potentially exist. An analysis of
mitochondrial haplotypes containing more individuals
and incorporating population-level nuclear markers, such
as microsatellites or amplified fragment length polymor-
phism, could help delimit management units within the
Cuatro Cienegas basin (Moline et al. 2004; Carson and
Dowling 2006).
Our analysis exemplifies a notable problem of current
biology and taxonomy: delimiting species and ESUs. In
the last thorough examination, Winokur (1968) maintained
the status of A. atra as a distinct species based on the
assumption that gene flow was prezygotically restricted
between A. atra and A. s. emoryi by ecological
preferences. Our analysis reiterates that morphological
variation is associated with habitat type (A. atra–like
animals in lagoons and A. s. emoryi–like individuals in
rivers and playa lakes) but demonstrates little to no
molecular distinctions and no reciprocal monophyly
between the animals in the Cuatro Cienegas basin and
those in the Rio Grande. These data provide strong
evidence that Apalone atra is not a separate species from
Apalone spinifera emoryi.
Acknowledgments. — We thank Chelonian Research
Foundation’s Linnaeus Fund Research Grants for support.
Collections were made under permits DAN00739 and
04US084859/9 and Texas Resident NonGame Collectors
Permit #7237400165001298. Field methods were
approved by the Committee on Animal Care from Iowa
State University (protocol number 5-03-5442-J). SEM was
supported by a Graduate Research Fellowship from the
NSF and by NSF IBN-0212935 to FJJ. Rebecca Jeppesen,
Nancy Hernandez, Eddie Bonnell, Chrissy McKinney,
Figure 4. Haplotype network of cytochrome b generated bystatistical parsimony. Each vertical bar represents 1 mutation, anddiagonal bars separate mutation events. Haplotypes are namedonly within the Cuatro Cienegas basin. It is clear from thenetwork that Apalone from the Cuatro Cienegas basin share orare very close to A. s. emoryi (NMrg and TXsc) haplotypes. Morevariability occurs within the Cuatro Cienegas basin than betweenthe 2 putative taxa (A. atra and A. s. emoryi). Haplotypes fromother Texas A. spinifera subspecies (TXki: A. s. guadalupensis;TXcc and MidCon63: A. s. pallida) are more distant to each otherand to the A. s. emoryi-Cuatro Cienegas haplotypes than the A. s.emoryi and Cuatro Cienegas haplotypes are to each other.
92 CHELONIAN CONSERVATION AND BIOLOGY, Volume 7, Number 1 — 2008

Jennifer Howeth, Jack Siegrist, and Dean Hendrickson
provided valuable field assistance.
LITERATURE CITED
BARTLEY, J.A. 1971. A histological and hormonal analysis of
physiological and morphological chromatophore responses in
the soft-shelled turtle Trionyx sp. Journal of Zoology 163:
125–144.
CARSON, E.W. AND DOWLING, T.E. 2006. Influence of hydrogeo-
graphic history and hybridization on the distribution of genetic
variation in the pupfishes Cyprinodon atrorus and C.bifasciatus. Molecular Ecology 15:667–679.
CLEMENT, M., POSADA, D., AND CRANDALL, K. 2000. TCS: a
computer program to estimate gene genealogies. Molecular
Ecology 9:1657–1660.
ENGSTROM, T.N., SHAFFER, H.B., AND MCCORD, W.P. 2004.
Multiple data sets, high homoplasy, and the phylogeny of
softshell turtles (Testudines: Trionychidae). Systematic Biol-
ogy 53:693–710.
ERNST, C.H. AND BARBOUR, R.W. 1992. Turtles of the World.
Washington, DC: Smithsonian Institution Press, 313 pp.
ERNST, C.H., LOVICH, J.E., AND BARBOUR, R.W. 1994. Turtles of
the United States and Canada. Smithsonian Institution Press,
Washington, D.C.
EVANS, S.B. 2005. Using chemical data to define flow systems in
Cuatro Cienegas, Coahuila, Mexico. Unpubl. M.S. Thesis,
University of Texas, Austin, TX, USA.
FELSENSTEIN, J. 2005. PHYLIP (Phylogeny Inference Package).
Version 3.6. Distributed by the author. Department of Genome
Sciences, University of Washington, Seattle, WA.
FUJITA, M.F., ENGSTROM, T.N., STARKEY, D.E., AND SHAFFER, H.B.
2004. Turtle phylogeny: insights from a novel nuclear intron.
Molecular Phylogenetics Evolution 31:1031–1040.
HALL, T.A. 1999. BioEdit: a user-friendly biological sequence
alignment editor and analysis program for Windows 95/98/
NT. Nucleic Acids Symposium Series 41:95–98.
KRENZ, J.G., NAYLOR, G.J., SHAFFER, H.B., AND JANZEN, F.J. 2005.
Molecular phylogenetics and evolution of turtles. Molecular
Phylogenetics and Evolution 37:178–191.
MADDISON, W.P. 1997. Gene trees in species trees. Systematic
Biology 46:523–536.
MCGAUGH, S.E. 2008. Color variation correlated with habitat type
and background coloration in Apalone spinifera in Cuatro
Cienegas, Coahuila, Mexico. Journal of Herpetology 42:
347–353.
MINCKLEY, W.L. 1969. Environments of the Bolson of Cuatro
Cienegas, Coahuila, Mexico, with Special Reference to the
Aquatic Biota. El Paso, TX: Texas Western Press. Science
Series 2, 65 pp.
MOLINE, A.M., SHUSTER, S.M., HENDRICKSON, D.A., AND MARKS,
J.C. 2004. Genetic variation in a desert aquatic snail
(Nymphophilus minckleyi) from Cuatro Cienegas, Coahuila,Mexico. Hydrobiologia 522:179–192.
MORITZ, C. 1994. Defining ‘‘evolutionarily significant units’’ forconservation. Trends in Ecology and Evolution 9:373–375.
POSADA, D. AND BUCKLEY, T.R. 2004. Model selection and modelaveraging in phylogenetics: advantages of the AIC andBayesian approaches over likelihood ratio tests. Systematic
Biology 53:793–808.POSADA, D. AND CRANDALL, K.A. 1998. Modeltest: testing the
model of DNA substitution. Bioinformatics 14:817–818.
ROZAS, J., SANCHEZ-DELBARRIO, J.C., MESSEGUER, X., AND ROZAS,R. 2003. DnaSP, DNA polymorphism analyses by thecoalescent and other methods. Bioinformatics 19:2496–2497.
SAINT, K.M., AUSTIN, C.C., DONNELLAN, S.C., AND HUTCHINSON,M.N. 1998. C-mos, a nuclear marker useful for squamatephylogenetic analyses. Molecular Phylogenetics and Evolution10:259–263.
SMITH, H.M. AND SMITH, R.B. 1979. Synopsis of the herpetofaunaof Mexico. In: Johnson, J. (Ed.). Guide to Mexican Turtles.Volume 6. Bibliographic Addendum III. North Benington,VT: John Johnson, 1044 pp.
THOMPSON, J.D., HIGGINS, D.G., AND GIBSON, T.J. 1994.CLUSTAL W: improving the sensitivity of progressivemultiple sequence alignment through sequence weighting,positions-specific gap penalties and weight matrix choice.
Nucleic Acids Research 22:4673–4680.WAPLES, R.S. 1991. Definition of a ‘‘species’’ under the
Endangered Species Act: application to Pacific salmon.National Oceanic and Atmospheric Administration technical
memorandum. NMFS-F/NWC-194. Northwest Fisheries Sci-ence Center, Seattle, WA.
WAPLES, R.S. 1995. Evolutionary significant units and the
conservation of biodiversity under the Endangered SpeciesAct. In: Nielson, J.L. (Ed.). Evolution of the aquaticecosystem: Defining unique units of population conservation.Symposium 17. Bethesda, MD: American Fisheries
WEBB, R.G. 1973. Trionyx atra Webb and Legler: black softshellturtle. In: Catalogue of American Amphibians and Reptiles.Danbury, CT: Society for the Study of Amphibians andReptiles, 137.1.
WEBB, R.G. AND LEGLER, J.M. 1960. A new softshell turtle(Genus Trionyx) from Coahuila, Mexico. University of KansasScience Bulletin 40:21–30.
WEISROCK, D.W. AND JANZEN, F.J. 2000. Comparative molecularphylogeography of North American softshell turtles (Ap-alone): implications for regional and wide-scale historicalevolutionary forces. Molecular Phylogenetics and Evolution14:152–164.
WINOKUR, R.M. 1968. The morphology and relationships of thesoft-shelled turtles of the Cuatrocienegas basin, Coahuila,Mexico. Master’s Thesis. Arizona State University, Tempe, AZ.
Received: 26 January 2006
Revised and Accepted: 21 July 2007
NOTES AND FIELD REPORTS 93

Appendix I. Sample names are given along with locality, habitat type, and morphological identification.
Sample Locality and morphological information
LAcr1m* Comite River, East Baton Rouge Parish Baker, Louisiana, A. muticaTXsc* Sycamore Creek, Valverde County, Texas, A. s. emoryiNMrg* North Elephant Butte Reservoir, Socorro County, New Mexico, A. s. emoryiFLer1* Escambia River, Escambia County, Florida, A. s. asperaGasr* Suwanee River, Lanier County, Georgia, A. s. asperaONtr1* Thames River, north of London, Ontario, Canada, A. s. spiniferaTXki* Kingsville, Kleber County, Texas, A. s. guadalupensisTXcc* Coleto Creek, Goliad County, Texas, A. s. pallidaMidCon63 Middle Concho River, Irion County, Texas, A. s. pallidaTC34mt Tio Candido, A. atra type locality: Lagoon, Rugose margin, dark coloration on carapace and dark markings on
plastronTC35mt Tio Candido, A. atra type locality: Lagoon, Rugose margin, dark coloration on carapace and dark markings on
plastronTC37mt Tio Candido, A. atra type locality: Lagoon, Rugose margin, dark coloration on carapace and dark markings on
plastronTC38mt Tio Candido, A. atra type locality: Lagoon, Rugose margin, dark coloration on carapace and dark markings on
plastronTC36mt Tio Candido, A. atra type locality: Lagoon, Rugose margin, dark coloration on carapace and dark markings on
plastronTC45mt Tio Candido, A. atra type locality: Lagoon, Rugose margin, dark coloration on carapace and dark markings on
plastronAM7mt Antejeo: Lagoon, Slightly rugose margin, medium dark carapace pigmentation, few markings on plastronAMG18 Antiguos Mineros Grande: Lagoon, Slightly rugose margin, dark pigmentation on carapace, some dark markings on
plastronAMGst6 Antiguos Mineros Grande: Lagoon, Slightly rugose margin, dark pigmentation on carapace, some dark markings on
plastronAMGst1 Antiguos Mineros Grande: Lagoon, Margin very slightly rugose, medium dark pigmentation on carapace, few dark
markings on plastronAMGst2 Antiguos Mineros Grande: Lagoon, Margins not rugose, medium dark pigmentation on carapace, no dark markings
on plastronLT104 Morjarral Este: Lagoon, Rugose margins, dark pigmentation, dark markings on plastronSM102 Eijido San Marcos: Waste water pond, Margins not rugose, no dark pigmentationRM46mt Rio Mesquites: River, Margin not rugose, medium dark carapace pigmentation, no markings on plastronRM26mt Rio Mesquites: River, Slightly rugose margin, dark carapace pigmentation, few markings on plastronRM47mt Rio Mesquites: River, Slightly rugose margin, medium dark carapace pigmentation, few dark markings on plastronRM106 Rio Mesquites: River, Slightly rugose margin, medium dark pigmentation, few dark markings on plastronRM15mt Rio Mesquites: River, Margin not rugose, medium dark pigmentation, no markings on plastronRC57mt Rio Canon: River, Very slightly rugose margin, dark pigmentation on carapace, some dark markings on plastronLGst28 Laguna Grande: Playa lake, Margin not rugose, no dark pigmentationLIRim15 Laguna Intermedia: Playa lake, Slightly rugose margin, no dark pigmentationLGa46 Los Gatos: Playa lake, Margins not rugose, no dark pigmentationLGa45 Los Gatos: Playa lake, Margins not rugose, no dark pigmentationLGa25 Los Gatos: Playa lake, Margins not rugose, no dark pigmentationLGaRIM17 Los Gatos: Playa lake, Margins not rugose, no dark pigmentation
94 CHELONIAN CONSERVATION AND BIOLOGY, Volume 7, Number 1 — 2008

Chelonian Conservation and Biology, 2008, 7(1): 95–100
� 2008 Chelonian Research Foundation
Human Recreation and the Nesting Ecologyof a Freshwater Turtle (Chrysemys picta)
KENNETH D. BOWEN1,2
AND FREDRIC J. JANZEN1
1Department of Ecology, Evolution, and Organismal Biology, Iowa
State University, Ames, Iowa 50011 USA [[email protected]];2Present Address: 13725 Shaftsburg Road, Perry, Michigan 48872
USA [[email protected]]
ABSTRACT. – Over a 3-year period, we studied therelationship between the intensity of human recreation
and the nesting ecology of the painted turtle(Chrysemys picta) at a major nesting beach. Ourresults suggest that the intensity of human recreationat this site had no effect on the decision of turtles toemerge from the water and nest, or on habitatselection by nesting turtles. This apparent lack ofeffect of human recreation is contrary to the results ofmany previously published studies on other taxa andunderscores the variability in wildlife responses tohuman recreation and the need for species-specific andpopulation-specific studies.
The effects of human recreation on wildlife popula-
tions have recently received a great deal of scientific
attention, in part because of a rapid increase in outdoor
recreation activities over the last several decades (Flather
and Cordell 1995). To date, most reported effects of
recreation and human disturbance on wildlife have been
negative (Boyle and Samson 1985; Carney and Sydeman
1999). However, some investigators have suggested that
the effects of human disturbance on wildlife populations
may be overestimated (Boyle and Samson 1985; Nisbet
2000), and the impact of human recreation on groups such
as reptiles is not well studied (Boyle and Samson 1985).
Although declines in populations of organisms such
as amphibians (Wake 1991) have been well publicized,
concordant declines in turtle populations have received
comparatively little attention (Gibbons et al. 2000;
Klemens 2000). Although habitat alteration is a major
factor in turtle population declines (Mitchell and Klemens
2000), human recreation can also be detrimental (Garber
and Burger 1995; Bury and Luckenbach 2002). The
potential effects of human disturbance on the nesting
ecology of freshwater turtles are significant because
females may alter nest-site selection based on the risk
that they themselves will be depredated (Spencer 2002;
Spencer and Thompson 2003).
If females perceive humans as a predation risk and
alter their nesting behavior, maternal and offspring fitness
can be altered through combinations of a variety of factors.
For example, the site where a female chooses to deposit
eggs can affect the probability of nest depredation through
nest density (Valenzuela and Janzen 2001; Marchand et al.
2002; but see Burke et al. 1998) and edge effects (Temple
1987; Kolbe and Janzen 2002a). Nest-site selection may
also affect offspring survival through temperature-related
incubation success (Schwarzkopf and Brooks 1987;
Wilson 1998) and overwintering success (Weisrock and
Janzen 1999), as well as offspring sex ratio in turtles with
temperature-dependent sex determination (reviewed in
Bull 1983; Ewert and Nelson 1991; Janzen and Paukstis
1991; Shine 1999).
The purpose of this study was to determine the effects
of human recreation on the nesting behavior of the painted
turtle (Chrysemys picta). In particular, we evaluated how
different levels of human recreation on a major nesting
Appendix II. GenBank and photo voucher accession numbers.An asterisk denotes sequences obtained from GenBank; all butR35 for LAcrm were obtained from Weisrock and Janzen (2000).Photo vouchers are not available for these GenBank specimens,and this is indicated as NA. GenBank accession numbers aregiven for cytochrome b, RAG-1, C-mos, and R35, respectively,and separated by semicolons for each gene. Alleles for each geneare separated by commas.
LAcr1m* NA; AF168766*; DQ529173; DQ529206;AY259581.1*
FLer1* NA; AF168751*GAsr* NA; AF168752*ONtr1* NA; AF168757*TXki* NA; AF168759*TXcc* NA; AF168758*TXsc* NA; AF168760*; DQ529147, DQ529148;
DQ529185, DQ529186; DQ529125NMrg* NA; AF168756*; DQ529151; DQ529187;
DQ529127MidCon63 ISUA200614; DQ529103; DQ529157, DQ529158;
DQ529192; DQ529122TC34 ISUA200620; DQ529113TC35 ISUA200621; DQ529112TC37 ISUA200622; DQ529111TC38 ISUA200623; DQ529114; DQ529132, DQ529133;
DQ529174; DQ529118TC36 ISUA200625; EU040193; EU040200; EU040201,
EU040202; DQ529119TC45 ISUA200624; EU040194; DQ529134, DQ529135;
DQ529175; no data R35AM7 ISUA200717; EU040181AMGst18 ISUA200716; EU040186AMGst6 ISUA200714; EU040187AMGst1 ISUA200713; EU040188AMGst2 ISUA200712; EU040195LT104 ISUA20073; EU040199SM102 ISUA20075; EU040189RM46 ISUA20077; EU040193RM26 ISUA20079; ; EU040184RM47 ISUA20076; EU040179RM106 ISUA20074; EU040192RM15 ISUA200715; EU040185RC57 ISUA20078; EU040180LG28 ISUA200718; EU040182LIRim15 ISUA200710; EU040191LGa46 ISUA20072; EU040190LGa45 ISUA20071; EU040196LGa25 ISUA200711; EU040197LGaRim17 ISUA200719; EU040198
NOTES AND FIELD REPORTS 95

beach affected the decision of turtles to emerge from the
water and nest, as well as components of habitat selection
of nesting turtles. We hypothesized that an increased
number of humans on the nesting beach would decrease
the number of turtles emerging to nest and cause turtles to
choose low-quality nesting sites.
Methods. — This research represents a portion of a
long-term study of painted turtle nesting ecology (Janzen
1994) at the Thomson Causeway Recreation Area (TCRA)
near Thomson, Illinois. The Thomson Causeway is an
;450- 3 900-m island on the eastern bank of the
Mississippi River, and it contains an ;1.5-ha nesting area
that is bordered on the east side by a 200-m-wide slough
from which most turtles emerge to nest. The site is
managed and maintained by the United States Army Corp
of Engineers (USACE; see Kolbe and Janzen 2002a for a
more complete site description). The TCRA is a popular
destination for recreationists with motor homes (recrea-
tional vehicles [RV]) during the spring and summer
months. Use of the area is variable, with most activity
occurring on weekends and holidays (Bowen and Janzen,
pers. obs.). The nesting area is interspersed with concrete
pads for parking RVs and has a paved road running
through it. This setting provides an opportunity to
investigate the nesting responses of painted turtles to
different levels of human recreation throughout the nesting
season.
Chrysemys picta is a small- to medium-sized
freshwater turtle that ranges from southern Canada to
New Mexico and from the Atlantic to the Pacific Oceans
(Ernst et al. 1994; Starkey et al. 2003). At TCRA, the
mean clutch size is 10.5 6 2.0 standard deviation (SD)
eggs, and individual females may lay up to 3 clutches in a
nesting season from late May to early July (Morjan 2003).
Chrysemys picta has temperature-dependent sex determi-
nation, with cooler temperatures producing males (Ewert
and Nelson 1991). Hatchlings remain in the nest during the
winter and emerge from the nest and enter water in the
spring (Ernst et al. 1994; Weisrock and Janzen 1999).
The nesting beach at TCRA was monitored for
nesting turtles from early to late June in 2001 and from
late May to early July in 2002 and 2003. The turtles were
individually marked by using a series of notches in the
marginal scutes of the carapace (Cagle 1939). Each year
we observed females leave the water, construct nests, and
lay eggs. Once a female had finished nesting, we
temporarily mapped the location of the nest by using
nearby landmarks (e.g., trees, posts, and RV sites), and
determined the amount of overstory vegetation (% shaded)
in all 4 cardinal directions over the nest by using a
spherical densiometer (see Janzen 1994; Weisrock and
Janzen 1999). Once the nesting season was complete, we
returned to the location and established precise Cartesian
coordinates for each nest by using the program IN-
TERPNT (Boose et al. 1998). Geographic information
system coverages were created by using these coordinates
in ArcViewt (ESRI Inc., Redlands, CA). We used these
location data to determine the distance of each nest from
the water. Error in this mapping and measuring process
ranges from 0 to 15 cm (see Kolbe and Janzen 2002a for
more detail). We also followed the fate of each nest
through the third week of September (i.e., until all
hatching was completed) by noting which nests had been
depredated and which remained intact.
As an indicator of the level of human disturbance at
TCRA during the nesting season, we used data on the
number of RVs present daily at the nesting beach and
nearby sites for the months of May through July in the
years 2001–2003 obtained from the USACE. We used
nested analysis of variance (ANOVA) to determine the
effect that varying numbers of RVs had on the decision of
turtles to nest. We used the number of nests constructed on
a given day as an indicator of the decision of turtles to
emerge from the water and nest. Effects in the nested
ANOVA were the number of RVs, the Julian date, and the
interaction between these two (all nested within year). The
Julian date was included in an attempt to control for
seasonal changes in nesting behavior that might be
independent of human activity.
We hypothesized that the number of turtles emerging
to nest would decrease as the number of RVs increased.
This relationship was considered important because mass
nesting events in response to decreased human presence
might increase nest density on small scales and serve as
cues for nest predators. Higher nest densities are known to
result in higher probabilities of nest depredation at TCRA
(Valenzuela and Janzen 2001).
We used nested ANOVAs to examine the effect of
human recreation on habitat selection of nesting turtles by
comparing the number of RVs present on a given day to
the distance from water of nests laid on that day and by
comparing the number of RVs present on a given day to
the south and west overstory vegetation cover of nests laid
on that day. Effects for each nested ANOVA were the
number of RVs, Julian date, maximum air temperature on
the day of nesting, water temperature on the day of
nesting, and the interactions between these variables (all
nested within year).
Weather variables were included in an attempt to
account for the effects of weather on habitat selection.
Maximum air temperature and water temperature were
chosen because these variables appear to affect the
decision of turtles to emerge from the water and nest at
TCRA (Bowen et al. 2005). We obtained weather data for
the nesting seasons from the USACE Lock and Dam 13,
ca. 12 km south of the study site.
We hypothesized that as the level of human activity
increased females would perceive a greater risk to
themselves, and the distance of nests from the water
would decrease (Spencer 2002). This relationship was
considered important because rates of nest depredation are
higher along the water edge in most years at TCRA (Kolbe
and Janzen 2002a). Sites near the water are less shaded at
TCRA; therefore, we hypothesized that nest overstory
96 CHELONIAN CONSERVATION AND BIOLOGY, Volume 7, Number 1 — 2008

vegetation cover would decrease with increasing levels of
human recreation (Kolbe and Janzen 2002a). This
relationship was considered important because south and
west overstory vegetation cover is a predictor of nest
temperature and offspring sex ratio at this site in most
years (Janzen 1994; Morjan and Janzen 2003). Nesting
turtles are known to choose nesting sites nonrandomly
with respect to overstory vegetation at TCRA (Janzen and
Morjan 2001).
Although some females at TCRA lay multiple
clutches within a nesting season (Morjan 2003), we used
only the first nest for each female within years in our
analyses. We did so to ensure that each nesting event was
independent within years (i.e., females may exhibit
different nesting behavior during their second attempt,
based on what they experience during their first attempt).
Adding data from second and third nests did not change
our findings (results not shown). All statistical analyses
were performed by using JMP (SAS Institute Inc).
Results. — Nesting began by 7 June in each year and
the nesting beach was monitored until at least 1 July.
Either 23 (2001 and 2003) or 35 (2002) nesting days for
each year were included in the analyses. The number of
nesting days varied, in part, as a result of weather
conditions that inhibited nesting on some days. Data were
analyzed from 147 nests in 2001, 158 nests in 2002, and
218 nests in 2003. Nest parameters were highly variable
during the nesting season in all years studied, as was the
number of RVs present at TCRA (ranging from 0 to 64
RVs per day; Table 1). Overall, substantial within- and
among-year variation existed in the data set for the
response and predictor variables of interest in this study.
The number of nests laid on a given day was not
affected by any of the predictor variables (overall
p ¼ 0.7993, r2 ¼ 0.09; Table 2). A similar pattern was
observed for overstory vegetation (overall p ¼ 0.4360,
r2 ¼ 0.06; Table 3). The nested ANOVA for the distance
of the nests from water was statistically significant (overall
p ¼ 0.0009), but none of the individual effects approached
statistical significance and the r2 value was small
(r2 ¼ 0.12; Table 4). The biological significance, therefore,
is likely to be negligible.
Discussion. — Human recreational activity, as
measured by the number of RVs on and near a major
nesting beach, did not appear to affect large-scale patterns
in the nesting ecology of the population of painted turtles
studied here. Variables that represented both the decision
to emerge from the water to nest and habitat selection had
no biologically significant relationship with the number of
RVs present.
Based on the results of previous studies, the lack of
effect found here was unexpected. For example, breeding
and nest survival of colonial waterbirds may be negatively
affected by human recreation (Yorio et al. 2001; reviewed
in Carney and Sydeman 1999). Garber and Burger (1995)
documented that 2 populations of the wood turtle
(Glyptemys insculpta) declined 100% within 10 years
after the opening of habitat to human recreation (foot
traffic leading to opportunistic removal of turtles). Bury
and Luckenbach (2002) found that a population of desert
tortoises (Gopherus agassizii) that was subjected to human
recreation in the form of off-road vehicles appeared to be
less dense and less healthy than a population that was
protected. Given that human recreation and disturbance
can have adverse effects on breeding organisms in general
and on turtle populations in particular, combined with the
likelihood for some turtles to alter nesting behavior when
disturbed or when they perceive danger (Iverson and
Smith 1993; Spencer 2002; Spencer and Thompson 2003),
one might assume that nesting turtles would suffer from
human activity. It is important to note, however, that we
studied behavioral responses and not population dynamics.
Our results give tentative support to the assertion of a
number of investigators (Whittaker and Knight 1998;
Miller and Hobbs 2000; Nisbet 2000) that wildlife
responses to human recreation are difficult to generalize.
Wildlife may respond to human recreation in many ways,
thus studies of these effects should be done on a species-
specific level (Miller and Hobbs 2000). A population-
specific level may be necessary if some species are capable
of habituating to disturbance by humans (i.e., they no
Table 1. Descriptive statistics (mean 6 1 SD) and sample sizes for human recreational activity and nest variables of the painted turtle(Chrysemys picta) at a nesting beach in northwestern Illinois.
Y (nests) No. nests/d Nest distance to water (m) Nest southwest overstory vegetation (%) RV/da
2001 (147) 7.1 6 7.6 (23 d) 34.3 6 24.6 39.2 6 21.0 5.6 6 9.12002 (158) 7.7 6 9.3 (23 d) 28.6 6 23.6 42.8 6 22.6 18.3 6 13.82003 (218) 6.6 6 7.3 (35 d) 24.7 6 23.0 41.7 6 22.4 23.6 6 19.0
a recreational vehicle.
Table 2. Results for individual effects from a nested analysis ofvariance to determine the effect of the number of recreationalvehicles (RV) on the number of painted turtle (Chrysemys picta)nests constructed on a nesting beach in northwestern Illinoisduring the years 2001–2003.a An asterisk (*) signifies aninteraction between terms.
Source of variation df Sum of squares F-ratio p value
RVs 3 100.49657 0.5084 0.6778Julian date 3 29.93952 0.1515 0.9284RVs*Julian date 3 80.81181 0.4088 0.7471Y 2 20.06618 0.1523 0.8590
a All effects were nested within year. The p value and r 2 value for theoverall test were 0.7993 and 0.09, respectively.
NOTES AND FIELD REPORTS 97
longer respond to human disturbance; Whittaker and
Knight 1998). In the future, we plan to test the hypothesis
that our turtles have habituated to human presence by
using comparative experimental studies with nearby
populations.
There is an important caveat to consider in interpret-
ing our results: the analytical methods used are capable of
detecting only large-scale changes in turtle nesting
behavior as a result of human recreation. We did not
evaluate the responses of individual turtles per se, nor did
we directly track population dynamics. We have observed
turtles abandon nesting attempts as the result of direct
human intrusion, adults and hatchlings killed by automo-
biles, and removal of turtles from the study area by
recreationists. These types of situations are not accounted
for in our analysis. Examining the response of an
individual turtle under different conditions might be more
instructive in determining the effects of human recreation.
However, this experimental approach would be difficult to
implement given that we cannot control when a turtle
emerges to nest nor can we directly manipulate the
intensity of human recreation.
What do our results mean for managers? Human
recreation at TCRA does not appear to have effects on
large-scale patterns of painted turtle nesting behavior, and
the needs of these turtles and human recreationists may be
reconcilable. However, we emphasize that these results
should not be taken to suggest that human recreation does
not affect freshwater turtles. Generalizations to other
species and other forms of recreation should be avoided.
Furthermore, even if painted turtles are unaffected by
large-scale human activity, the actions of individual
humans (removing or disturbing nesting turtles, road kills)
should still be taken into account. Education of the public
(Klein 1993; Taylor and Knight 2003) concerning the
plight and sensitivity of turtles is a good first step. At
TCRA, education over the past 15 years by both our
research team and USACE park rangers has minimized,
but not eliminated, individual human disturbance of
painted turtles. Monitoring and enforcement of applicable
laws will still be necessary in most cases.
We generally agree with other investigators (Boyle
and Samson 1985; Nisbet 2000) that the large number of
studies that suggest a negative relationship between human
recreation and wildlife should not be applied to all species
and all situations. Furthermore, studies that test explicit
hypotheses and attempt to determine the fitness effects of
recreation on wildlife (Boyle and Samson 1985) should be
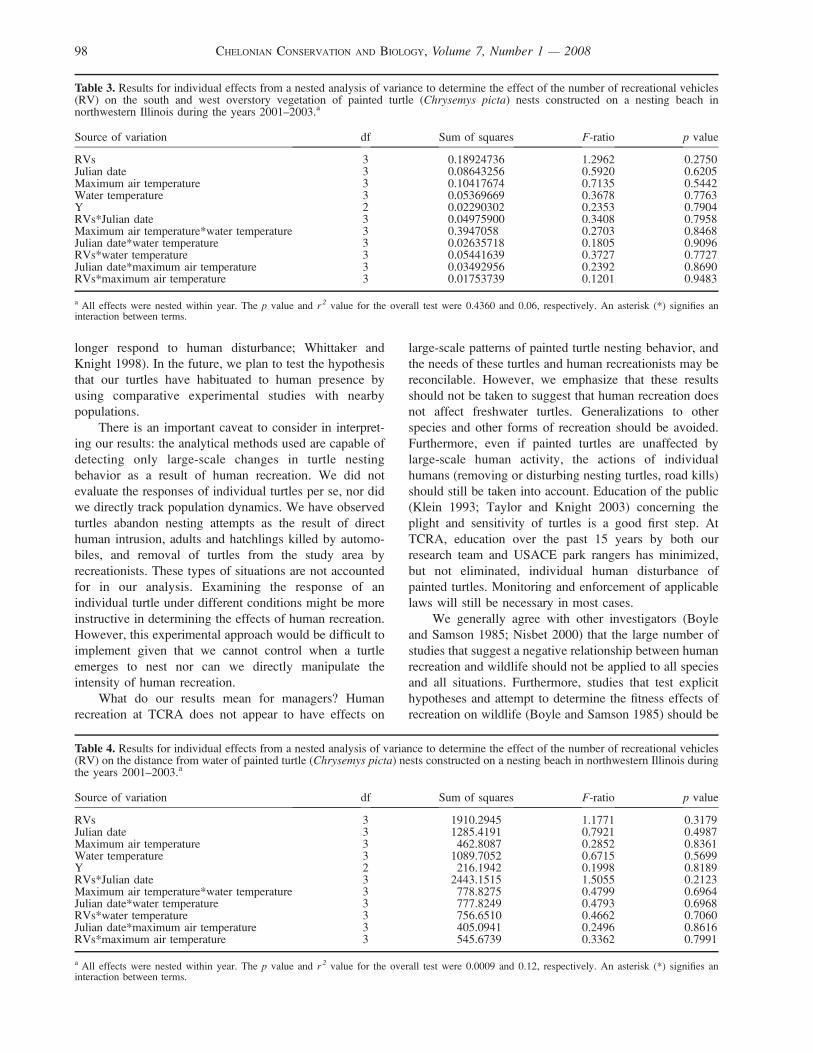
Table 3. Results for individual effects from a nested analysis of variance to determine the effect of the number of recreational vehicles(RV) on the south and west overstory vegetation of painted turtle (Chrysemys picta) nests constructed on a nesting beach innorthwestern Illinois during the years 2001–2003.a
Source of variation df Sum of squares F-ratio p value
RVs 3 0.18924736 1.2962 0.2750Julian date 3 0.08643256 0.5920 0.6205Maximum air temperature 3 0.10417674 0.7135 0.5442Water temperature 3 0.05369669 0.3678 0.7763Y 2 0.02290302 0.2353 0.7904RVs*Julian date 3 0.04975900 0.3408 0.7958Maximum air temperature*water temperature 3 0.3947058 0.2703 0.8468Julian date*water temperature 3 0.02635718 0.1805 0.9096RVs*water temperature 3 0.05441639 0.3727 0.7727Julian date*maximum air temperature 3 0.03492956 0.2392 0.8690RVs*maximum air temperature 3 0.01753739 0.1201 0.9483
a All effects were nested within year. The p value and r 2 value for the overall test were 0.4360 and 0.06, respectively. An asterisk (*) signifies aninteraction between terms.
Table 4. Results for individual effects from a nested analysis of variance to determine the effect of the number of recreational vehicles(RV) on the distance from water of painted turtle (Chrysemys picta) nests constructed on a nesting beach in northwestern Illinois duringthe years 2001–2003.a
Source of variation df Sum of squares F-ratio p value
RVs 3 1910.2945 1.1771 0.3179Julian date 3 1285.4191 0.7921 0.4987Maximum air temperature 3 462.8087 0.2852 0.8361Water temperature 3 1089.7052 0.6715 0.5699Y 2 216.1942 0.1998 0.8189RVs*Julian date 3 2443.1515 1.5055 0.2123Maximum air temperature*water temperature 3 778.8275 0.4799 0.6964Julian date*water temperature 3 777.8249 0.4793 0.6968RVs*water temperature 3 756.6510 0.4662 0.7060Julian date*maximum air temperature 3 405.0941 0.2496 0.8616RVs*maximum air temperature 3 545.6739 0.3362 0.7991
a All effects were nested within year. The p value and r 2 value for the overall test were 0.0009 and 0.12, respectively. An asterisk (*) signifies aninteraction between terms.
98 CHELONIAN CONSERVATION AND BIOLOGY, Volume 7, Number 1 — 2008

designed where feasible. Finally, although research on
‘‘secure’’ populations of freshwater turtles is important
(Congdon et al. 2003), ecological and evolutionary studies
on human-influenced populations (Kolbe and Janzen
2002b; Feinberg and Burke 2003) are equally crucial
given the current rate of habitat alteration and the
conservation status of most turtle species. Future studies
should focus on the area around individual nesting turtles
that must be kept inviolate, if they are to remain
undisturbed (area of influence; Miller et al. 2001), and on
the effects of recreation-related deaths and adult removals
on population dynamics (Garber and Burger 1995).
Acknowledgments. — We thank the U.S. Army Corps
of Engineers for continued access to the field site and the
Janzen Lab turtle camp crews from 2001–2003 for helping
with data collection. E. Bowen, R. Brooks, J. Carr, W.
Clark, M. Haussmann, and R. Spencer provided comments
on earlier drafts of the manuscript. The research was
conducted under approved animal care protocols from
Iowa State University and by permission of the U.S. Fish
and Wildlife Service and the Illinois Department of
Natural Resources. Funding was provided by NSF grant
DEB0089680 to FJJ. KDB acknowledges the support of
an Iowa State University Graduate College Fellowship.
LITERATURE CITED
BOOSE, E.R., BOOSE, E.F., AND LEZBERG, A.L. 1998. A practical
method for mapping trees using distance measurements.
Ecology 79:819–827.
BOWEN, K.D., SPENCER, R.-J., AND JANZEN, F.J. 2005. A
comparative study of environmental factors that affect nesting
in Australian and North American freshwater turtles. Journal
of Zoology 267:397–404.
BOYLE, S.A. AND SAMSON, F.B. 1985. Effects of nonconsumptive
recreation on wildlife: a review. Wildlife Society Bulletin 13:
110–116.
BULL, J.J. 1983. Evolution of Sex Determining Mechanisms.
Menlo Park, CA: Benjamin/Cummings, 316 pp.
BURKE, V.J., RATHBUN, S.L., BODIE, J.R., AND GIBBONS, J.W. 1998.
Effect of density on predation rate for turtles in a complex
landscape. Oikos 83:3–11.
BURY, R.B. AND LUCKENBACH, R.A. 2002. Comparison of desert
tortoise (Gopherus agassizii) populations in an unused and
off-road vehicle area in the Mojave desert. Chelonian
Conservation and Biology 4:457–463.
CAGLE, F.R. 1939. A system of marking turtles for future
identification. Copeia 1939:170–173.
CARNEY, J.M. AND SYDEMAN, W.J. 1999. A review of human
disturbance effects on nesting colonial waterbirds. Waterbirds
22:68–79.
CONGDON, J.D., NAGLE, R.D., KINNEY, O.M., VAN LOBEN SELS,
R.C., QUINTER, T., AND TINKLE, D.W. 2003. Testing hypotheses
of aging in long-lived Painted Turtles (Chrysemys picta).
Experimental Gerontology 38:765–772.
ERNST, C.H., LOVICH, J.E., AND BARBOUR, R.W. 1994. Turtles of
the United States and Canada. Washington, D.C.: Smithsonian
Institution Press, 682 pp.
EWERT, M.A. AND NELSON, C.E. 1991. Sex determination in
turtles: diverse patterns and possible adaptive values. Copeia
1991:50–69.
FEINBERG, J.A. AND BURKE, R.L. 2003. Nesting ecology and
predation of Diamondback Terrapins, Malaclemys terrapin, at
Gateway National Recreation Area, New York. Journal of
Herpetology 37:517–526.
FLATHER, C.H. AND CORDELL, H.K. 1995. Outdoor recreation:
historical and anticipated trends. In: Knight, R.L. and
Gutzwiller, K.J. (Eds.). Wildlife and Recreationists: Coexis-
tence through Management and Research. Washington, D.C.:
Island Press, pp. 3–16.
GARBER, S.D. AND BURGER, J. 1995. A 20-yr study documenting
the relationship between turtle decline and human recreation.
Ecological Applications 5:1151–1162.
GIBBONS, J.W., SCOTT, D.E., RYAN, T.J., BUHLMANN, K.A.,
TUBERVILLE, T.D., METTS, B.S., GREENE, J.L., MILLS, T., LEIDEN,
Y., POPPY, S., AND WINNE, C.T. 2000. The global decline of
reptiles, deja vu amphibians. Bioscience 50:653–666.
IVERSON, J.B. AND SMITH, G.R. 1993. Reproductive ecology of the
Painted Turtle (Chrysemys picta) in the Nebraska sandhills
and across its range. Copeia 1993:1–21.
JANZEN, F.J. 1994. Vegetational cover predicts the sex ratio of
hatchling turtles in natural nests. Ecology 75:1593–1599.
JANZEN, F.J. AND MORJAN, C.L. 2001. Repeatability of microen-
vironment-specific nesting behaviour in a turtle with environ-
mental sex determination. Animal Behaviour 62:73–82.
JANZEN, F.J. AND PAUKSTIS, G.L. 1991. Environmental sex
determination in reptiles: ecology, evolution and experimental
design. Quarterly Review of Biology 66:149–179.
KLEIN, M.L. 1993. Waterbird behavioral responses to human
disturbances. Wildlife Society Bulletin 21:31–39.
KLEMENS, M.W. 2000. Introduction. In: Klemens, M.W. (Ed.).
Turtle Conservation. Washington D.C.: Smithsonian Institu-
tion Press, pp. 1–4.
KOLBE, J.J. AND JANZEN, F.J. 2002a. Spatial and temporal
dynamics of turtle nest predation: edge effects. Oikos 99:
538–544.
KOLBE, J.J. AND JANZEN, F.J. 2002b. Impact of nest-site selection
on nest success and nest temperature in natural and disturbed
habitats. Ecology 83:269–281.
MARCHAND, M.N., LITVAITIS, J.A., MAIER, T.J., AND DEGRAAF,
R.M. 2002. Use of artificial nests to investigate predation on
freshwater turtle nests. Wildlife Society Bulletin 30:
1092–1098.
MILLER, J.R. AND HOBBS, N.T. 2000. Recreational trails, human
activity, and nest predation in lowland riparian areas.
Landscape and Urban Planning 50:227–236.
MILLER, S.G., KNIGHT, R.L., AND MILLER, C.K. 2001. Wildlife
responses to pedestrians and dogs. Wildlife Society Bulletin
29:124–132.
MITCHELL, J.C. AND KLEMENS, M.W. 2000. Primary and secondary
effects of habitat alteration. In: Klemens, M.W. (Ed.). Turtle
Conservation. Washington D.C.: Smithsonian Institution
Press, pp. 5–32.
MORJAN, C.L. 2003. Variation in nesting patterns affecting nest
temperatures in two populations of Painted Turtles
(Chrysemys picta) with temperature-dependent sex determi-
nation. Behavioral Ecology and Sociobiology 53:254–261.
MORJAN, C.L. AND JANZEN, F.J. 2003. Nest temperature is not
related to egg size in a turtle with temperature-dependent sex
determination. Copeia 2003:366–372.
NISBET, I.C.T. 2000. Disturbance, habituation, and management
of waterbird colonies. Waterbirds 23:312–322.
SCHWARZKOPF, L. AND BROOKS, R.J. 1987. Nest-site selection and
NOTES AND FIELD REPORTS 99

offspring sex ratio in Painted turtles, Chrysemys picta. Copeia1987:53–61.
SHINE, R. 1999. Why is sex environmentally determined by nesttemperature in many reptiles? Trends in Ecology andEvolution 14:186–189.
SPENCER, R.-J. 2002. Experimentally testing nest site selection:
fitness trade-offs and predation risk in turtles. Ecology 83:2136–2144.
SPENCER, R.-J. AND THOMPSON, M.B. 2003. The significance ofpredation in nest site selection of turtles: an experimentalconsideration of macro- and microhabitat preferences. Oikos102:592–600.
STARKEY, D.E., SHAFFER, H.B., BURKE, R.L., FORSTNER, M.R.J.,IVERSON, J.B., JANZEN, F.J., RHODIN, A.G.J., AND ULTSCH, G.R.
2003. Molecular systematics, phylogeography, and the effectsof Pleistocene glaciation in the Painted Turtle (Chrysemyspicta) complex. Evolution 57:119–128.
TAYLOR, A.R. AND KNIGHT, R.L. 2003. Wildlife responses torecreation and associated visitor perceptions. EcologicalApplications 13:951–963.
TEMPLE, S.A. 1987. Predation on turtle nests increases near
ecological edges. Copeia 1987:250–252.VALENZUELA, N. AND JANZEN, F.J. 2001. Nest-site philopatry and
the evolution of temperature-dependent sex determination.Evolutionary Ecology Research 3:779–794.
WAKE, D.B. 1991. Declining amphibian populations. Science253:860.
WEISROCK, D.W. AND JANZEN, F.J. 1999. Thermal and fitness-related consequences of nest location in Painted Turtles(Chrysemys picta). Functional Ecology 13:94–101.
WHITTAKER, D. AND KNIGHT, R.L. 1998. Understanding wildliferesponses to humans. Wildlife Society Bulletin 26:312–317.
WILSON, D.S. 1998. Nest-site selection: microhabitat variationand its effects on the survival of turtle embryos. Ecology 79:1884–1892.
YORIO, P., FRERE, E., GANDINI, P., AND SCHIAVINI, A. 2001.Tourism and recreation at seabird breeding sites in Patagonia,Argentina: current concerns and future prospects. BirdConservation International 11:231–245.
Received: 20 January 2006
Revised and Accepted: 30 May 2007
Chelonian Conservation and Biology, 2008, 7(1): 100–104� 2008 Chelonian Research Foundation
Population Structure of the AlligatorSnapping Turtle, Macrochelys temminckii, on
the Western Edge of its Distribution
J. DAREN RIEDLE1,4, PAUL A. SHIPMAN
1,5,
STANLEY F. FOX2, JOSEPH C. HACKLER
1, AND
DAVID M. LESLIE, JR3
1Oklahoma Cooperative Fish and Wildlife Research Unit,
Department of Zoology, Oklahoma State University, Stillwater,
Oklahoma 74078 USA [[email protected]];2Department of Zoology, Oklahoma State University, Stillwater,
Oklahoma 74078 USA [[email protected]];3United States Geological Survey, Oklahoma Cooperative Fish and
Wildlife Research Unit, Oklahoma State University, Stillwater,
Oklahoma 74078 USA [[email protected]];4Present Address: Department of Life, Earth and Environmental
Sciences, West Texas A&M University, Canyon, Texas 79016 USA
[[email protected]];5Present Address: Department of Biological Sciences, Rochester
Institute of Technology, 85 Lomb Memorial Drive, Rochester, New
York 14623 USA [[email protected]]
ABSTRACT. – A mark-recapture project on Macrochelystemminckii was conducted between 1997 and 2000 atSequoyah National Wildlife Refuge, Muskogee andSequoyah counties, in eastern Oklahoma. Turtles werecaptured in all streams and exhibited equal sex ratios,marked sexual-size dimorphism, and population den-sities between 28 and 34 animals per km stretch ofstream. There was evidence of past populationperturbations, with very few large adults captured,and a cohort of subadults highly underrepresented.
Turtles have long been recognized as an integral part
of aquatic communities, and all relevant literature on river
turtle diversity, ecological roles, and community structure
was recently reviewed in Moll and Moll (2004). Within this
synopsis though, it is clear that outside of common species,
such as the slider turtle, Trachemys scripta (Cagle 1950;
Gibbons 1990), in-depth life history studies of individual
species are noticeably absent. Detailed life-history strate-
gies have been constructed only for a handful of species,
most notably the Blanding’s turtle, Emydoidea blandingii(Congdon et al. 1993), and the common snapping turtle,
Chelydra serpentina (Congdon et al. 1994). The data
collected on C. serpentina were representative only of
populations at the northern reaches of the species’
distribution and so did not demonstrate geographic
variation in life-history strategies for that species. With
many species of turtles facing various threats, a better
understanding of these life-history strategies is much
needed for developing sound management strategies.
The alligator snapping turtle, Macrochelys temminck-ii, is a large, riverine, bottom-dwelling species that
occupies a predator-scavenger role in the southeastern
United States (Moll and Moll 2000). Shipman and Riedle
(1994) and Shipman and Neeley (1998) surveyed 2
populations in southeastern Missouri. In each, turtles were
2–24 kg in body mass; the sex ratio for the 2 populations
was 1 male to 1.09 females. Trauth et al. (1998) surveyed
2 sites in Arkansas with a population sex ratio of 1:1 and
reported that males were significantly larger than females.
Males were also significantly larger than females from
examination of specimens at a commercial meat-process-
ing facility in Louisiana (Tucker and Sloan 1997). Based
on growth curves, M. temminckii reached sexual maturity
when the straight carapace length (CL) was 370 mm in
males and 330 mm in females (Dobie 1971; Tucker and
Sloan 1997).
Because of the apparent decline of the species
throughout its range (Pritchard 1989; Ernst et al. 1994),
100 CHELONIAN CONSERVATION AND BIOLOGY, Volume 7, Number 1 — 2008

large unimpacted populations are difficult to find. Despite
the need for aggressive conservation measures throughout
its range, information on ecology and demography of
unimpacted populations is largely nonexistent but obvi-
ously necessary for the management or restoration of
impacted populations. The eastern third of Oklahoma was
surveyed in 1997–1999 specifically for M. temminckii,which has experienced drastic declines throughout its
range, and only 2 seemingly healthy populations were
discovered (Riedle et al. 2005). Our objective was to
describe the demographic structure of a population of M.temminckii by quantifying population size and density, sex
ratio, sexual dimorphism, and size-class distribution,
which are needed to develop conservation strategies.
Methods. — Sequoyah National Wildlife Refuge
(SNWR) is a 51,376-ha area in Oklahoma that encom-
passes parts of the Canadian and Arkansas rivers and their
confluence. Primary habitat was bottomland flood plain
with many small tributaries that drained into both rivers.
We sampled SNWR sporadically in 1997 and 1998, and
more intensively in 1999 and 2000. Several small streams
were surveyed, including Dirty Creek, Hezekiah Creek,
Big Vian Creek, Little Vian Creek, and Negro Creek. Sally
Jones Lake, a shallow lake connected to Big Vian Creek,
also was surveyed (Fig. 1). Surveying was conducted
again in 2001 to capture M. temminckii at sites where it
was not previously captured. Throughout the study, Big
Vian Creek and Little Vian Creek were sampled more
intensively because of their easy access and were used to
estimate population size and density. Both streams are
tributaries of the Arkansas River, and their mouths were
about 0.5 km apart. The navigable (by a 4.2-m flat-
bottomed boat) stretches of both streams were surveyed.
The navigable stretch of Little Vian Creek was 2 km in
length, reaching from its mouth until the stream became
shallow and predominated by riffles. Big Vian Creek was
4.5 km in length from the mouth to where the stream
became very shallow and clogged with fallen logs.
All streams were sampled by using commercial hoop
nets that were 2.1 m in length and constructed of four
1.05-m hoops covered with 2.5-cm mesh. Nets were set
upstream from submerged structures, such as fallen trees.
Nets were baited with fresh fish suspended by a piece of
twine on the hoop furthest from the opening of the net.
Bait fish were procured with gill nets or incidental capture
in the turtle nets. Turtle nets were set late in the afternoon
or evening and were checked the following morning.
We recorded basic morphometric data on each M.temminckii captured, including mass (to the nearest 0.1
kg), sex, and maximum CL and plastron length (PL) to the
nearest millimeter. All individuals of M. temminckiicaptured were uniquely marked and fitted with numbered
tags. The marking was done by using a hole drilled into
specific marginal scutes along the carapace. We placed
short plastic cable ties in all holes to ensure that they did
not prematurely close. Numbered plastic cattle ear tags
also were attached to one of the holes by a plastic cable tie.
Each M. temminckii was assigned to 1 of 3 groups
based on sex and size. Sex was determined by the presence
or absence of a penis. The penis, if present, can be felt by
Figure 1. Sequoyah National Wildlife Refuge, Muskogee and Sequoyah counties, Oklahoma.
NOTES AND FIELD REPORTS 101

inserting a finger into the turtle’s cloaca. Turtles that were
too small to examine for a penis were classified as
juveniles (sex unknown). Morphologic measurements
were compared between males and females by using 2
sample t-tests. A v2 analysis of sexes by size class was
used to compare number of males to females in 2 size
classes: medium (361–480 mm) and large (481–620 mm).
Results. — Population Size and Density. — We
surveyed for 565 net nights (1 net night ¼ 1 net/night)
between 1997 and 2000 on Dirty Creek, Hezekiah Creek,
Big Vian Creek, Little Vian Creek, Sally Jones Lake, and
Negro Creek and made 197 captures of M. temminckii.Macrochelys temminckii was not captured in Sally Jones
Lake or Negro Creek between 1997 and 2000. We marked
and released 157 M. temminckii, with a recapture rate of
21%. An additional 26 captures (22 new individuals, 4
recaptures) of M. temminckii were made in 2001, 4 of
those on Negro Creek. Nine species of aquatic turtles were
captured, and M. temminckii was the second most
abundant, which represented 7% of all captures (Table 1).
We used a Lincoln-Peterson estimator of population
size based on capture-mark-recapture data in 1997–2000.
Estimated population sizes were 127.5 6 24.5 standard
error (SE) individuals, with a density of 28.3 turtles/km in
Big Vian Creek, and 68.4 6 18.2 SE individuals, with a
density of 34.2 turtles/km in Little Vian Creek.
Size Distribution. — Mean sizes of turtles were 8.71
kg (range 0.22–46.4 kg), 330 mm CL (110–614 mm), and
240 mm PL (72–470 mm). We captured few small
juveniles and large adults, and turtles with CL between
321 and 360 mm were noticeably underrepresented (Fig.
2).
Sex Ratio and Sexual-Size Dimorphism. — We
captured 41 males, 47 females, and 91 juveniles. The
male:female ratio (1:1.1) did not differ from 1:1
(v2 ¼ 0.0036, df ¼ 1, p ¼ 0.952). We were able to
determine sex of males �240 mm CL and females �260
mm CL in most cases. We were able to determine sex of
all individuals (except one) at CL . 360 mm (Fig. 2).
We evaluated sexual-size dimorphism of adult turtles
based on the upper end of the range of size at sexual
maturity (400 mm; Dobie 1971; Tucker and Sloan 1997).
Males were significantly larger than females in CL
(t ¼ 2.45, df ¼ 53, p ¼ 0.017) and mass (t ¼ 2.84,
df ¼ 56, p ¼ 0.006). The number of males and females
differed between the medium and large size classes
(v2 ¼ 4.76, df ¼ 1, p ¼ 0.029); males were more abundant
in the large adult cohort (Fig. 2).
Discussion. — Macrochelys temminckii was the
second-most abundant species captured at SNWR, which
occurred in high densities relative to most other popula-
tions in the state (Riedle et al. 2005). Because the Lincoln-
Peterson estimator assumes no emigration or immigration,
it may have overestimated population size, but M.temminckii was captured frequently and still exhibited a
low recapture rate. Unfortunately, there is a paucity of
information on absolute population densities of M.temminckii to compare with SNWR densities.
The adult sex ratio of 1:1.1 is similar to values from
populations in Missouri and Arkansas (Shipman and
Riedle 1994; Shipman and Neeley 1998; Trauth et al.
1998). Among the larger turtles (CL . 480 mm), males
significantly outnumbered females (7:1). Although we
were able to sex some individuals at relatively small sizes,
our ability to sex small turtles was inconsistent from
individual to individual (limited by the inability to insert a
finger far enough into the cloaca to feel for the presence or
absence of a penis). We also were not able to determine the
size of sexual maturity, because we did no internal analysis
of follicular or testicular maturation. We were, however,
able to accurately sex all individuals (except one) with
CL � 380 mm, which was within the size range for
sexually mature turtles in Louisiana (Tucker and Sloan
1997). Populations of M. temminckii in Louisiana reached
sexual maturity at 13–21 years for females and 11–21
years for males, but estimates of age to maturity are not
available for Oklahoma populations. A wide range of size
classes was captured, which provided evidence for a stable
population with good recruitment (Fig. 2), with some
Table 1. Number of individuals and composition of turtle speciescaptured at Sequoyah National Wildlife Refuge, Oklahoma,between 1997–2000.
Species n % Total captures
Trachemys scripta 2287 82.8Macrochelys temminckii 197 7.1Graptemys ouachitensis 103 3.7Chelydra serpentina 64 2.3Apalone spinifera 40 1.4Pseudemys concinna 32 1.1Sternotherus odoratus 18 0.6Graptemys pseudogeographica 17 0.6Kinosternon subrubrum 1 ,0.1
Figure 2. Size classes, based on carapace length in millimeters,of Macrochelys temminckii captured at Sequoyah NationalWildlife Refuge, Oklahoma.
102 CHELONIAN CONSERVATION AND BIOLOGY, Volume 7, Number 1 — 2008

exceptions. Three cohorts were rare or absent from our
sample: hatchling-size turtles, turtles in the size class 321–
360 mm CL, and large adults.
Although the population of M. temminckii at SNWR
appeared stable, there was evidence of current and historic
population perturbations. Hatchling-size turtles were
absent from our sample, and turtles ,180-mm CL were
rare. There may have been a trap bias toward larger turtles
because the 2.5-cm mesh was small enough to contain
hatchling turtles, but the throat, designed to capture larger
turtles, may have been large enough to allow the escape of
small turtles. Juvenile common snapping turtles, Chelydraserpentina, occupy small streams after hatching and
disperse from those streams as they reach sexual maturity
(Graves and Anderson 1987). This could also be occurring
with hatchling M. temminckii at SNWR, with smaller
turtles occupying smaller streams where we did not trap at
all. Lastly, the absence of small turtles could be attributed
to mammalian predation, principally raccoons, Procyonlotor. Raccoons have been identified as one of the most
important predators on North American turtles (Stancyk
1982; Ernst et al. 1994), with raccoon related egg and
hatchling mortality rates that reach 100% in many
populations (Mitchell and Klemens 2000).
Individuals with 321–360-mm CL were underrepre-
sented in our sample. One hypothesis may be that the
refuge population experienced some past disturbance that
may have had a negative impact on nest success, and that
the underrepresented size-age class is the lingering
‘‘footprint’’ of such relative nest failure. Such a past
disturbance, known to affect other species of turtles (Moll
and Moll 2000), was the flooding of upstream areas after
construction of the dam to make the Robert S. Kerr
Reservoir downstream from SNWR. Construction of the
dam began in April 1964, and the closure occurred in
October 1970. Subsequently, stream levels rose signifi-
cantly based on anecdotal information from SNWR
personnel and the presence of remnant hardwood structure
in the current streambed. This dramatic rise in water level
may have temporarily destroyed nest sites along the
streams. The time elapsed since this post-1970 flooding
some 25 years ago may correspond to the age of the 321–
360-mm CL underrepresented size class, although, based
on Tucker and Sloan (1997), these turtles seem too young.
Nevertheless, the growth rate of Oklahoma M. temminckiiis unknown, and the time course of habitat disruption
because of upstream flooding after the creation of a large
reservoir is also unknown.
Large adults (25–55 kg) also were scarce in our
sample; although, many such large individuals were
captured throughout eastern Oklahoma in the past (Webb
1970; Carpenter and Krupa 1989). We captured 7 large
males (25.0, 28.1, 34.5, 36.3, 41.8, 42.3, and 46.4 kg) and
one large female (26.8 kg) while sampling at SNWR. One
hypothesis for the scarcity of large turtles in our study is
that historic harvest of large turtles may have occurred at
SNWR. Shipman and Riedle (1994) and Trauth et al.
(1998) reported differences in body size between harvested
and unharvested populations, with the absence of larger
turtles from exploited populations.
There is some evidence for an historical take of M.temminckii in Oklahoma (Carpenter and Krupa 1989;
Pritchard 1989). Before SNWR was established in 1970,
there may have been a significant harvest of M.temminckii, especially large ones, from that area, and
not enough time has elapsed to allow for the current adult
cohort to grow to larger body sizes. The current paucity
of large adults supports this conclusion. If breeding adults
were seriously depleted before the refuge was established,
then there would have been very little recruitment of
turtles (now represented by the missing size-age class).
However, smaller turtles would have been commercially
unimportant and left unharvested. These turtles have now
grown into the small adult age class at SNWR (Fig. 2).
Their offspring are the current subadults. A few turtles
big enough to be commercially important before the
refuge was established somehow escaped harvest and
currently represent the largest size-age class at SNWR
(Fig. 2).
Although the type and severity of historical impacts
on populations of M. temminckii at SNWR are largely
speculative, there is some evidence that total protection of
the adult cohorts will allow populations of M. temminckiito recover over time. A large number of adults reaching
sexual maturity and even more subadult turtles following
behind, which suggests that the species can recover after
historic disturbances, albeit slowly, are shown in Fig. 2.
What remains unknown is what is happening with the
hatchling cohorts and how that may affect the future
stability of the population. Much work is needed in the
future to more fully understand the life history of M.temminckii and its role in the aquatic turtle community.
Acknowledgments. — The project was funded by the
Federal Aid, Endangered Species Act under Project E-40
of the Oklahoma Department of Wildlife Conservation and
Oklahoma State University, with additional financial and
logistical support provided by Sequoyah National Wildlife
Refuge and the Oklahoma Cooperative Fish and Wildlife
Research Unit (Oklahoma State University, Oklahoma
Department of Wildlife Conservation, United States
Geological Survey Biological Resources Division, and
the Wildlife Management Institute cooperating). We also
want to thank our field assistants and volunteers L.
Andrews, T. Ashby, A. Buck, K. Cole, A. Goodwin, J.
Knight, M. Martin, C. O’Melia, M. O’Melia, C. Osterhaut,
F. Rezende, R. Stark, T. Talbot, J. Whittham, M.
Stangland-Willis, and J. Yoshioka for all their help in
ensuring the success of this project.
LITERATURE CITED
CAGLE, F.R. 1950. The life history of the slider turtle, Pseudemysscripta troostii (Holbrook). Ecological Monographs 20:31–54
NOTES AND FIELD REPORTS 103

CARPENTER, C.C. AND KRUPA, J.J. 1989. Oklahoma Herpetology:An Annotated Bibliography. Norman, OK: Univ. of OklahomaPress, 258 pp.
CONGDON, J.D., DUNHAM, A.E., AND VAN LOBEN SELS, R.C. 1993.Delayed sexual maturity and demographics of Blanding’sturtles (Emydoidea blandingii): implications for conservationand management of long-lived organisms. ConservationBiology 7:826–833.
CONGDON, J.D., DUNHAM, A.E., AND VAN LOBEN SELS, R.C. 1994.Demographics of common snapping turtles (Chelydra serpen-tina): implications for conservation and management of long-lived organisms. American Zoologist 34:397–408.
DOBIE, J.L. 1971. Reproduction and growth in the alligatorsnapping turtle, Macroclemys temminckii (Troost). Copeia1971:645–658.
ERNST, C.H., LOVICH, J.E., AND BARBOUR, R.W. 1994. Turtles ofthe United States and Canada. Washington, D.C.: SmithsonianInstitute Press, 313 pp.
GIBBONS, J.W. (ED.). 1990. Life History and Ecology of the SliderTurtle. Washington, D.C.: Smithsonian Institution Press, 368 pp.
GRAVES, B.M. AND ANDERSON, S.H. 1987. Habitat suitabilityindex models: snapping turtle. United States Fish and WildlifeService Biological Report 82 (10.141).
MITCHELL, J.C. AND KLEMENS, M.W. 2000. Primary and secondaryeffects of habitat alteration. In: Klemens, M.W. (Ed.). TurtleConservation. Washington, D.C.: Smithsonian Institution
Press, pp. 5–32.
MOLL, E.O. AND MOLL, D. 2000. Conservation of river turtles. In:Klemens, M.W. (Ed.). Turtle Conservation. Washington,D.C.: Smithsonian Institution Press, pp. 126–155.
MOLL, E.O. AND MOLL, D. 2004. The Ecology, Exploitation, andConservation of River Turtles. New York: Oxford UniversityPress, 393 pp.
PRITCHARD, P.C.H. 1989. The Alligator Snapping Turtle: Biologyand Conservation. Milwaukee, WI: Milwaukee Public Muse-um, 104 pp.
RIEDLE, J.D., SHIPMAN, P.A., FOX, S.F., AND LESLIE, D.M., JR.2005. Status and distribution of the alligator snapping turtle,Macrochelys temminckii, in Oklahoma. The SouthwesternNaturalist 50:79–84
SHIPMAN, P.A. AND NEELEY, A. 1998. Alligator snapping turtle
trap, mark, and telemetry project. Final Report to the MissouriDepartment of Conservation, Jefferson City, Missouri, 35 pp.
SHIPMAN, P.A. AND RIEDLE, D. 1994. Alligator snapping turtle,Macroclemys temminckii, trap, mark and release project 1994.Final Report to the Missouri Department of Conservation,Jefferson City, Missouri, 29 pp.
STANCYK, S.E. 1982. Non-human predators of sea turtles and theircontrol. In: Bjorndal, K.A. (Ed.). Biology and Conservation ofSea Turtles. Washington, D.C.: Smithsonian Institution Press,pp. 139–152.
TRAUTH, S.E., WILHIDE, J.D., AND HOLT, A. 1998. Populationstructure and movement patterns of alligator snapping turtles(Macroclemys temminckii) in northeastern Arkansas. Chelo-
nian Conservation and Biology 3:64–70.
TUCKER, A.D. AND SLOAN, K.N. 1997. Growth and reproductiveestimates from alligator snapping turtles, Macroclemystemminckii, taken by commercial harvest in Louisiana.Chelonian Conservation and Biology 2:587–592.
WEBB, R.G. 1970. Reptiles of Oklahoma. Norman, OK: Univ. ofOklahoma Press, 370 pp.
Received: 23 November 2005
Revised and Accepted: 18 September 2007
Chelonian Conservation and Biology, 2008, 7(1): 104–108� 2008 Chelonian Research Foundation
Potential Bacterial Pathogens Carried byNesting Leatherback Turtles (Dermochelys
coriacea) in Costa Rica
MARIO SANTORO1,4, GIOVANNA HERNANDEZ
2,
MAGALY CABALLERO2, AND FERNANDO GARCIA
3
1Departamento de Patologıa, Escuela de Medicina Veterinaria,Universidad Nacional, PO Box 86, Heredia 3000, Costa Rica;
2Laboratorio de Bacteriologıa, Escuela de Medicina Veterinaria,
Universidad Nacional, PO Box 86, Heredia 3000, Costa Rica;3Centro de Investigacion en Enfermedades Tropicales, Facultad deMicrobiologıa, Universidad de Costa Rica, San Jose, Costa Rica
ABSTRACT. – Between March and May 2003, theleatherback turtle (Dermochelys coriacea) nestingpopulation of the Pacuare Nature Reserve (northernCaribbean coast of Costa Rica) was surveyed forpotential bacterial pathogens associated with thecloaca and upper respiratory tracts. A total of 189isolates that belong to 15 genera, including 113 gram-negative and 76 gram-positive bacteria, were identifiedfrom samples of 70 nesting females. The majority ofthe bacterial species recovered in this study, including5 Salmonella isolates, may be considered as potentialpathogens for sea turtles, as well as for humans.
The leatherback sea turtle (Dermochelys coriacea) is
the only surviving member of the Dermochelyidae and the
largest of living chelonians. It is highly migratory and is
distributed in temperate and tropical pelagic waters
(Plotkin 2003). The leatherback turtle rookery of Carib-
bean Central America represents 1 of the 4 largest
remaining rookeries worldwide, together with French
Guiana/Suriname, Gabon, and Trinidad (Troeng et al.
2004).
Incidental capture in gillnet and longline fisheries,
together with egg harvest, have been indicated as the
principal factors involved in the decline of many
leatherback populations (Kar and Bhaskar 1982; Spotila
et al. 2000; Lewison et al. 2004; Sarti-Martinez et al. 2007;
Alfaro-Shigueto et al. 2007). Marine pollution by several
anthropogenic contaminants, primarily plastic debris, may
also have an important impact on the survival of this
species (Wehle and Coleman 1983; Barreiros and Barcelos
2001). However, there is insufficient information on the
impact of marine debris throughout most of this species
range, nor is there adequate knowledge on the health status
of leatherbacks in the wild.
No information exists on the cloacal and nasal
microflora of apparently healthy leatherback turtles. Only
1 report exists on the isolation of Vibrio damsela that
causes lethal valvular endocarditis and septicemia in a
104 CHELONIAN CONSERVATION AND BIOLOGY, Volume 7, Number 1 — 2008
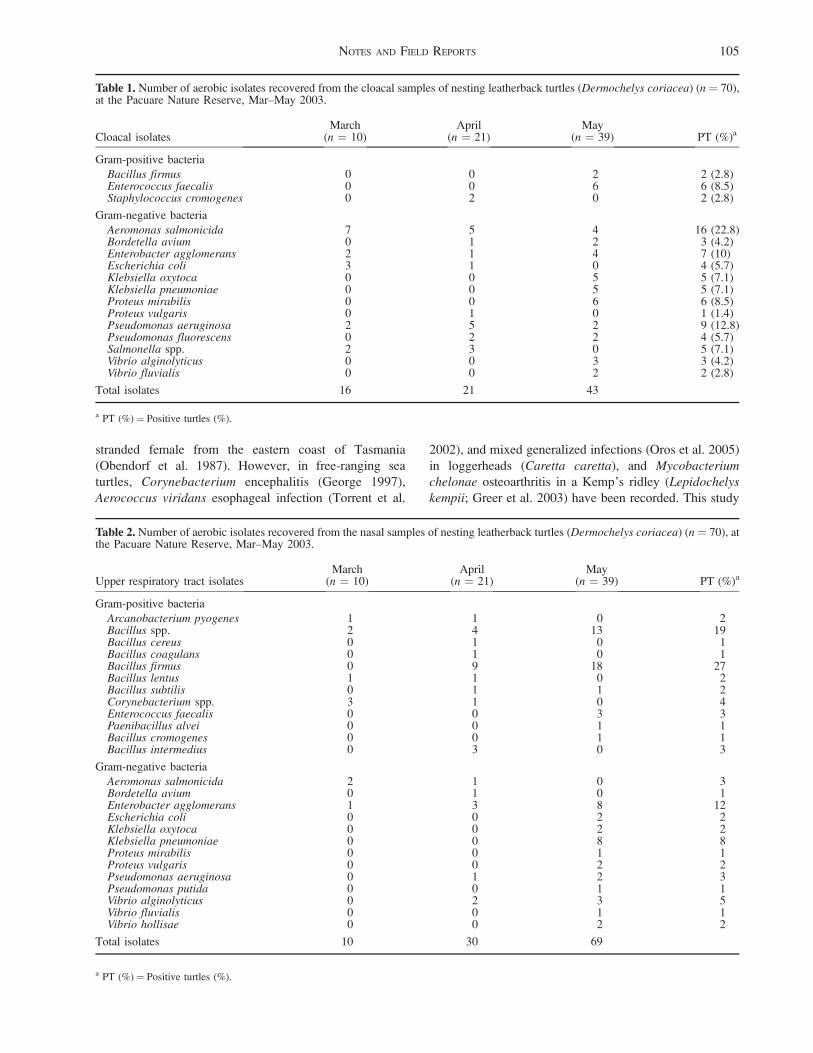
stranded female from the eastern coast of Tasmania
(Obendorf et al. 1987). However, in free-ranging sea
turtles, Corynebacterium encephalitis (George 1997),
Aerococcus viridans esophageal infection (Torrent et al.
2002), and mixed generalized infections (Oros et al. 2005)
in loggerheads (Caretta caretta), and Mycobacteriumchelonae osteoarthritis in a Kemp’s ridley (Lepidochelyskempii; Greer et al. 2003) have been recorded. This study
Table 1. Number of aerobic isolates recovered from the cloacal samples of nesting leatherback turtles (Dermochelys coriacea) (n ¼ 70),at the Pacuare Nature Reserve, Mar–May 2003.
Cloacal isolatesMarch
(n ¼ 10)April
(n ¼ 21)May
(n ¼ 39) PT (%)a
Gram-positive bacteria
Bacillus firmus 0 0 2 2 (2.8)Enterococcus faecalis 0 0 6 6 (8.5)Staphylococcus cromogenes 0 2 0 2 (2.8)
Gram-negative bacteria
Aeromonas salmonicida 7 5 4 16 (22.8)Bordetella avium 0 1 2 3 (4.2)Enterobacter agglomerans 2 1 4 7 (10)Escherichia coli 3 1 0 4 (5.7)Klebsiella oxytoca 0 0 5 5 (7.1)Klebsiella pneumoniae 0 0 5 5 (7.1)Proteus mirabilis 0 0 6 6 (8.5)Proteus vulgaris 0 1 0 1 (1.4)Pseudomonas aeruginosa 2 5 2 9 (12.8)Pseudomonas fluorescens 0 2 2 4 (5.7)Salmonella spp. 2 3 0 5 (7.1)Vibrio alginolyticus 0 0 3 3 (4.2)Vibrio fluvialis 0 0 2 2 (2.8)
Total isolates 16 21 43
a PT (%) ¼ Positive turtles (%).
Table 2. Number of aerobic isolates recovered from the nasal samples of nesting leatherback turtles (Dermochelys coriacea) (n ¼ 70), atthe Pacuare Nature Reserve, Mar–May 2003.
Upper respiratory tract isolatesMarch
(n ¼ 10)April
(n ¼ 21)May
(n ¼ 39) PT (%)a
Gram-positive bacteria
Arcanobacterium pyogenes 1 1 0 2Bacillus spp. 2 4 13 19Bacillus cereus 0 1 0 1Bacillus coagulans 0 1 0 1Bacillus firmus 0 9 18 27Bacillus lentus 1 1 0 2Bacillus subtilis 0 1 1 2Corynebacterium spp. 3 1 0 4Enterococcus faecalis 0 0 3 3Paenibacillus alvei 0 0 1 1Bacillus cromogenes 0 0 1 1Bacillus intermedius 0 3 0 3
Gram-negative bacteria
Aeromonas salmonicida 2 1 0 3Bordetella avium 0 1 0 1Enterobacter agglomerans 1 3 8 12Escherichia coli 0 0 2 2Klebsiella oxytoca 0 0 2 2Klebsiella pneumoniae 0 0 8 8Proteus mirabilis 0 0 1 1Proteus vulgaris 0 0 2 2Pseudomonas aeruginosa 0 1 2 3Pseudomonas putida 0 0 1 1Vibrio alginolyticus 0 2 3 5Vibrio fluvialis 0 0 1 1Vibrio hollisae 0 0 2 2
Total isolates 10 30 69
a PT (%) ¼ Positive turtles (%).
NOTES AND FIELD REPORTS 105

documents the cloacal and nasal aerobic bacteria from
apparently healthy nesting leatherbacks at the Pacuare
Nature Reserve (PNR), Costa Rica.
Study Site. — The PNR is located along the northeast
Caribbean coast of Costa Rica (from lat 108070N, long
0838110W to lat 108130N, long 0838160W), near Matina,
Limon Province, and includes approximately 5.7 km of
protected beach. It is bordered to the north by the Pacuare
River and to the south by Mondonguillo Lagoon and is
surrounded by a complex network of canals and rivers,
along which several villages, farms, and banana planta-
tions are located. Between 490 and 1286 leatherback nests
are recorded annually during the nesting season, which
runs from March to July (Troeng et al. 2004).
Methods. — Between March and May 2003, samples
were obtained from 70 female leatherbacks, with a mean
curved-carapace length of 152.5 cm. Sampling consisted
of introducing sterile swabs in the cloaca (ca. 10-cm
internal depth) and in 1 nasal duct (ca. 8-cm internal depth)
while the turtles were completing nesting activities in the
PNR. We recorded flipper tag numbers so as to not
resample individuals, and we only collected samples from
apparently healthy nesting leatherbacks with no external
lesions or signs of diseases.
Samples were placed in Amies agar gel transport
medium (Oxoid Ltd., Basingstoke, Hampshire, UK), kept
on ice, and cultured within 24 hours on blood agar,
MacConkey agar, manitol salt agar, thiosulfate-citrate-
bile-salts-sucrose agar, and xylose-lysine-desoxycholate
(XLD) agar (Oxoid). The latter 2 agars are selective for
Vibrio spp. and Shigella/Salmonella spp., respectively.
Plates were incubated aerobically at 25–278C and were
examined after 24 hours. To aid in the recovery of
Salmonella spp., cloacal samples were also inoculated into
a Rappaport-Vassiliadis-Soya peptone broth (Oxoid),
incubated at 378C for 18 hours, and subcultured on XLD
agar. Bacterial isolates were identified by standard
protocols described by Murray et al. (1999). Identification
of gram-negative organisms was confirmed by Api System
20E and 20NE (BioMerieux, Marcy l’Etoile, France).
During the same period, March to May 2003, sea
water samples from the PNR were also obtained off the
nesting beach. Three samples per month corresponding to
1 sample per 1.9 km were collected in 100-mL sterile
plastic bags and processed by conventional methods
(American Public Health Association 1995). Total and
fecal coliforms, and enterococci were enumerated by most-
probable-number estimates by using standard techniques
(American Public Health Association 1995).
Results and Discussion. — This study represents the
only report of cloacal and nasal bacteria in leatherbacks. A
total of 189 bacterial isolates that belong to 15 genera,
including 113 (60%) gram-negative and 76 (40%) gram-
positive bacteria, was identified (Tables 1 and 2). Eighty
isolates were recovered from the cloaca and 109 from the
nasal cavities. Isolates of the genus Bacillus were
predominant among gram-positive isolates (54 of 76
isolates [71.1%]) and were recovered mostly from nasal
samples (52 of 54 isolates [96.3%]). Only 10 gram-
positive isolates were recovered from cloacal samples,
including 6 Enterococcus faecalis. Enterobacteriaceae
isolates, including Enterobacter agglomerans, Escherich-ia coli, Klebsiella oxytoca, Klebsiella pneumoniae,
Proteus mirabilis, Proteus vulgaris, and Salmonella spp.
were predominant among gram-negative isolates (60 of
113 isolates [53%]); whereas, Aeromonas, Pseudomonas,and Vibrio represented only 16.8%, 15.0%, and 11.5% of
the gram-negative isolates, respectively. Aeromonas and
Pseudomonas were recovered more often from cloacal
samples (84.2% and 76.4%, respectively) rather than from
nasal samples (15.8% and 23.6%, respectively). Such
differences were not observed for Enterobacteriaceae and
Vibrio. The majority of the bacterial species recovered in
this study may be considered as potential pathogens for sea
turtles, as well as for humans.
During March and April, no water bacterial pollution
was detected, but a high degree of total and fecal coliforms
and enterococci was found in seawater samples from May
(Table 3). In May, the National Weather Institute of Costa
Rica registered a strong precipitation increase in the study
area (Table 3), which reflects the beginning of the rainy
Table 3. Most-probable numbers of total and fecal coliforms, enterococci from seawater samples (100 mL), and monthly precipitation atthe Pacuare Nature Reserve, Mar–May 2003.
Site Indicator trait
Months of sampling, 2003
Mar Apr May
Site 1 Total coliforms , 2/100 mL , 2/100 mL . 1600/100 mLFecal coliforms , 2/100 mL , 2/100 mL . 1600/100 mL
Enterococci , 3/mL , 3/mL . 1600/100 mLSite 2 Total coliforms , 2/100 mL , 2/100 mL . 1600/100 mL
Fecal coliforms , 2/100 mL , 2/100 mL 1600/100 mLEnterococci , 3/mL , 3/mL . 1600/100 mL
Site 3 Total coliforms , 2/100 mL , 2/100 mL 1600/100 mLFecal coliforms , 2/100 mL , 2/100 mL 22/100mL
Enterococci , 3/mL , 3/mL 1600/100 mLPrecipitation (mm)a 148.3 99.1 500.8
a Precipitation data are from the National Weather Institute of Costa Rica.
106 CHELONIAN CONSERVATION AND BIOLOGY, Volume 7, Number 1 — 2008

season in Costa Rica. Heavy rainfall raised the level of the
rivers, which caused serious flooding of the nearby
villages, farms, and plantations. Alongside the high
bacterial counts of sea water, some bacterial species,
namely E. faecalis, K. oxytoca, K. pneumoniae, P.mirabilis, Pseudomonas putida, Vibrio fluvialis, and
Vibrio hollisae, were recovered from the turtle samples
only during May. Whether the elevated levels of coliforms
and enterococci found from seawater collected in May
were induced by altered environmental conditions because
of heavy rainfall or were influenced by other conditions is
not known. Many bacteria here recovered were microor-
ganisms commonly found in the environment (Murray
et al. 1999), and the possibility that they were acquired
from seawater or beach sand contamination must be also
considered.
Coliforms and enterococci are common inhabitants of
intestinal tracts of larger endo- and ectothermic animals
(Aguirre et al. 1994; American Public Health Association
1995; Santoro et al. 2006a, b). However, bacteriological
analyses performed on fresh feces from green sea turtles
(Chelonia mydas) yielded very low concentrations of
coliforms and enterococci compared with mammal and
avian faeces (Balazs et al. 1993). Most of the microbes
found in this study were associated with pathologies in
captive and free-ranging sea turtles (Glazebrook and
Campbell 1990; Glazebrook et al. 1993; Oros et al. 2005).
Within sea turtles, Salmonella spp. were previously
found in hawksbill (Eretmochelys imbricata) (Keymer
et al. 1968), green (Raidal et al. 1998; O’Grady and
Krause 1999), and olive ridley (Lepidochelys olivacea)
turtles (Santoro et al. 2006a). Salmonellosis is the most
recognized reptilian zoonosis. We recommend caution,
particularly concerning volunteers and biologists handling
chelonians or working on nesting beaches and handling
eggs from natural nests.
Acknowledgments. — We thank the staff of the PNR
and especially Belinda Dick, Gerardo Zuniga, and Matteo
Hammond for their support and assistance. We also thank
Maria Laura Arias for assistance with water-sample
analyses, and Maria Forzan and Karen A. Bjorndal for
their constructive comments on the manuscript. Research
activities at the PNR were conducted under permission
091-2003–OFAU from the Ministry of Environment and
Energy and from the National System of Conservation
Areas of Costa Rica.
LITERATURE CITED
AGUIRRE, A.A., BALAZS, G.H., ZIMMERMAN, B., AND SPRAKER, T.R.
1994. Evaluation of Hawaiian green turtles (Chelonia mydas)
for potential pathogens associated with fibropapillomas.
Journal of Wildlife Diseases 30:8–15.
ALFARO-SHIGUETO, J., DUTTON, P.H., VAN BRESSEM, M., AND
MANGEL, J. 2007. Interactions between leatherback turtles and
Peruvian artisanal fisheries. Chelonian Conservation and
Biology 6:129–134.
AMERICAN PUBLIC HEALTH ASSOCIATION 1995. Standard Methodsfor the Examination of Water and Wastewater. Nineteenthedition. Washington, DC: American Public Health Associa-tion, 1325 pp.
BALAZS, G.H., FUJIOKA, R., AND FUJIOKA, C. 1993. Marine turtlefaeces on Hawaiian beaches. Marine Pollution Bulletin 26:392–394.
BARREIROS, J.P. AND BARCELOS, J. 2001. Plastic ingestion byleatherback turtle (Dermochelys coriacea) from Azores (NEAtlantic). Marine Pollution Bulletin 42:1196–1197.
GEORGE, R.H. 1997. Health problems and diseases of sea turtles.In: Lutz, P.L. and Musick, J.A. (Eds.). The Biology of SeaTurtles. Washington, D.C.: CRC Press, pp. 363–385.
GLAZEBROOK, J.S. AND CAMPBELL, R.S.F. 1990. A survey of thediseases of marine turtles in northern Australia. I. Farmedturtles. Diseases of Aquatic Organisms 9:83–95.
GLAZEBROOK, J.S., CAMPBELL, R.S.F., AND THOMAS, A.T. 1993.Studies on an ulcerative stomatitis-obstructive rhinitis-pneu-monia disease complex in hatchling and juvenile sea turtles,Chelonia mydas and Caretta caretta. Diseases of AquaticOrganisms 16:133–147.
GREER, L.L., STRANDBERG, J.D., AND WHITAKER, B.R. 2003.Mycobacterium chelonae osteoarthritis in a Kemp’s ridley seaturtle (Lepidochelys kempii). Journal of Wildlife Diseases 39:736–742.
KAR, C.S. AND BHASKAR, S. 1982. Status of sea turtles in theeastern Indian Ocean. In: Bjorndal, K.A. (Ed.). Biology andConservation of Sea Turtles. Washington, DC: SmithsonianInstitution Press, pp. 365–372.
KEYMER, I.F., RIDEALGH, D., AND FRETWELL, G. 1968. Salmonellaregent: a new species associated with colitis in a Pacifichawksbill turtle (E. imbricata bissa). Journal of Pathology andBacteriology 96:215.
LEWISON, R.L., FREEMAN, S.A., AND CROWDER, L.B. 2004.Quantifying the effects of fisheries on threatened species: theimpact of pelagic long lines on loggerhead and leatherback seaturtle. Ecology Letters 7:221–231.
MURRAY, P.R., BARON, E.J., PFALLER, M.A., TENOVER, F.C., AND
YOLKEN, R.H. 1999. Manual of Clinical Microbiology.Seventh edition. Washington, D.C: ASM Press, 1773 pp.
OBENDORF, D.L., CARSON, J., AND MCMANUS, T.J. 1987. Vibriodamsela infection in a stranded leatherback turtle (Der-mochelys coriacea). Journal of Wildlife Diseases 23:666–668.
O’GRADY, K.A. AND KRAUSE, V. 1999. An outbreak ofsalmonellosis linked to a marine turtle. Southeast AsianJournal of Tropical Medicine and Public Health 30:324–327.
OROS, J., TORRENT, A., CALABUIG, P., AND DENIZ, S. 2005.Diseases and causes of mortality among sea turtles stranded inthe Canary Islands, Spain (1998–2001). Diseases of AquaticOrganisms 63:13–24.
PLOTKIN, P. 2003. Adult migrations and habitat use. In: Lutz,P.L., Musick, J.A., and Wyneken, J. (Eds.). The Biology ofSea Turtles. Washington, D.C.: CRC Press, pp. 225–241.
RAIDAL, S.R., OHARA, M., HOBBS, R.P., AND PRINCE, R.I. 1998.Gram-negative bacterial infections and cardiovascular parasit-ism in green sea turtles (Chelonia mydas). AustralianVeterinary Journal 76:415–417.
SANTORO, M., HERNANDEZ, G., CABALLERO, M., AND GARCIA, F.2006b. Aerobic bacterial flora of nesting green turtles(Chelonia mydas) from Tortuguero National Park, Costa Rica.Journal of Zoo and Wildlife Medicine 37:549–552.
SANTORO, M., ORREGO, C., AND HERNANDEZ, G. 2006a. Florabacteriana nasal y cloacal de Lepidochelys olivacea (Testu-dines: Cheloniidae) en el pacıfico norte de Costa Rica. Revistade Biologıa Tropical 54:43–48.
NOTES AND FIELD REPORTS 107

SARTI-MARTINEZ, L., BARRAGAN, A.R., GARCIA MUNOZ, D.,
GARCIA, N., HUERTA, P., AND VARGAS, F. 2007. Conservation
and biology of the leatherback turtle in the Mexican Pacific.
Chelonian Conservation and Biology 6:70–78.
SPOTILA, J.R., REINA, R.D., STEYERMARK, A.C., PLOTKIN, P., AND
PALADINO, F.V. 2000. Pacific leatherback turtles face extinc-
tion. Nature 405:529–530.
TROENG, S., CHACON, D., AND DICK, B. 2004. Possible decline in
leatherback turtle Dermochelys coriacea nesting along
Caribbean Central America. Oryx 38:395–403.
WEHLE, D.H.S. AND COLEMAN, F.C. 1983. Plastics at sea. Natural
History 83:20–26.
Received: 6 August 2006
Revised and Accepted: 5 November 2007
Chelonian Conservation and Biology, 2008, 7(1): 108–113
� 2008 Chelonian Research Foundation
Relative Abundance and Morphometrics ofthe Travancore Tortoise, Indotestudo
travancorica, in the Indira Gandhi WildlifeSanctuary, Southern Western Ghats, India
MADHURI RAMESH1,2
1Centre for Herpetology, Madras Crocodile Bank, Mamallapuram,
PO Bag 4, Tamil Nadu – 603 104, India [[email protected]];2Present Address: Group for Nature Preservation and Education,
New no. 30, Block II, Gandhi Mandapam Road, Kotturpuram,
Chennai – 600 041, India
ABSTRACT. – Relative abundance of the Travancoretortoise, Indotestudo travancorica, was assessed in 5localities within the Indira Gandhi Wildlife Sanctuary,India, from December 2002 to March 2003. Relativeabundance varied with site and season, but the overallmean search effort for this study was only 3.4 man-hours/tortoise. Morphometric data were collectedfrom 49 adults and 3 juveniles; sexual differences incarapace shape (elongated in males, ovoid in females)and variations in carapace color (darker in mesichabitats) were also observed.
First described by Boulenger (1907), the Travancore
tortoise, Indotestudo travancorica (Fig. 1), is endemic to
the forested hill ranges of the Western Ghats of India
(Boulenger 1907; Vijaya 1983; Pritchard 2000; Iverson et
al. 2001). It is a medium-sized brown tortoise, often with
dark blotches on the plastron and the carapace (Boulenger
1907; Pritchard 2000).
Studies on wild I. travancorica have mainly consisted
of rapid surveys and anecdotal notes (Groombridge et al.
1983; Vijaya 1983; Frazier 1989; Moll 1989; Das 1991;
Bhupathy and Choudhury 1995); the only field study on
the species was conducted by J. Vijaya more than 20 years
ago, but the results were not published (H. Andrews, pers.
comm. in Ramesh 2004). Population estimates are not
available (Molur and Walker 1998; Choudhury et al. 2000;
IUCN 2004), but I. travancorica is considered a
vulnerable species by the International Union for Conser-
vation of Nature (IUCN 2004). Information on its natural
history is sparse; it is known to inhabit forests up to 750 m
and is found near streams and marshes (Bhupathy and
Choudhury 1995; Ramesh, in press). It uses leaf litter, tree
buttresses, and rock clefts for shelter (Vijaya 1983; Das
1991; Bhupathy and Choudhury 1995), as well as dense
thickets of weeds such as Lantana camara. Though
considered a crepuscular species, during a 2-month-long
survey in the Indira Gandhi Wildlife Sanctuary (IGWLS),
most tortoises were encountered during the evening hours
(1700–1830 hours; Ramesh, in press). Indotestudotravancorica is sexually dimorphic—in males the plastron
is concave; in females, flat. The tail terminates in a claw (a
horny tubercle) which is large and hooked in males, small
and conical in females (Auffenberg 1964; Vijaya 1983;
Das 1991).
The first intensive survey of I. travancorica was
conducted in 2002, in the IGWLS, and because this
resulted in the largest number of sightings to date (n ¼ 27,
Ramesh, in press), a more detailed study was conducted to
assess the relative abundance of I. travancorica in
different localities within the sanctuary and to collect
morphometric data.
Study Area. — The IGWLS (lat 108120–108350N, long
768490–778240E) in the southern Western Ghats, is one of
the largest protected areas in India, with an area of 958
km2. Several Forest Department posts are located within
its boundaries, Topslip (lat 10828.561 0N, long
76849.9920E, 750 msl) and Varagaliar (lat 10825.0700N,
long 76851.9400E, 600 msl) being 2 such sites. There also
exist tribal settlements within the sanctuary—the Kadar
settlement of Erumaparai is located 1.5 km from Topslip,
and the elephant camp at Varagaliar is inhabited mainly by
Malasars and Pulayars. The 2 sites are 23 km apart by road
Figure 1. The Travancore tortoise, Indotestudo travancorica, inthe Indira Gandhi Wildlife Sanctuary, India. Photo by S.U.Saravanakumar/Ecotone.
108 CHELONIAN CONSERVATION AND BIOLOGY, Volume 7, Number 1 — 2008

(straight-line distance about 7 km, No.58/B/15/4, 1:15,000
Tamil Nadu Coimbatore Forest Circle, Government of
India). The study area comprised the region between
Topslip and Varagaliar in the east and the Kerala–Tamil
Nadu interstate border in the west (Fig. 2). This region
receives rainfall from both the southwest and northeast
monsoons; June and July are the wettest months of the
year, and December to April, the driest.
Five localities within the study area were searched
intensively for tortoises. They included the Karian Shola
National Park at Topslip, which has tropical wet evergreen
forests of the Drypetes–Calophyllum–Polyalthia–Vateriatype (Champion and Seth 1968; Pascal 1988); Kozhika-
muthy, which has tropical moist deciduous forest of the
Terminalia–Anogeissus–Tectona type (Champion and Seth
1968); the teak (Tectona grandis) plantations of Sichali
and Varagaliar; and the Anaikundhy Shola—a small wet
evergreen forest fragment. Small, seasonal streams run
through all 5 localities, and the teak plantations also have
stretches of marshy ground covered with grasses. The
latter are locally known as vayal and are often the only
source of water in the plantations in summer.
Methods. — Based on the results of the preliminary
survey (Ramesh, in press), I conducted a more intensive
study from 14 December 2002 to 31 March 2003. During
this period, the area-constrained visual encounter survey
method was used (Crump and Scott 1994), in which 2
persons searched the banks of streams and vayals for
tortoises from 1400 to 1900 hours, except for 2 days in
March when 3 searchers were used. In the case of large
vayals, wherever possible, the middle section was also
searched for tortoises that could be resting in clumps of tall
grasses. Each area was searched only once daily. Apart
from direct sightings, cues indicative of tortoise presence,
such as trails and foraging signs, were used to locate
individuals. Search effort was used as a measure of relative
abundance (Klemens and Moll 1995; Platt et al. 2003).
But, unlike other studies in which search effort is
presented as number of tortoises observed per man-hour
of searching, i.e., sighting frequency, I converted this into
its reciprocal (number of man-hours of searching required
to find one tortoise) to facilitate comparisons (Freilich et
al. 2000).
All tortoises found were marked with a unique
combination of notches on marginal scutes (Cagle 1939)
and checked for evidence of external injury and ectopar-
asites. Straight carapace length (SCL), straight carapace
width, shell height (HT), plastron length, and plastron
width were measured using Mitutoyo steel calipers (300
mm); anal fork (AF) and anal notch (AN) by dial calipers
(150 mm); and body mass (WT) by Zebco Deliar weighing
scales (Smith et al. 2001). Tortoises were sexed on the
basis of plastral and tail-claw characteristics (Auffenberg
1964; Vijaya 1983; Das 1991), and individuals smaller
than 160 mm SCL were considered to be juveniles
(Ramesh, in press). Morphometric differences between
Figure 2. Map of the study area within the Indira Gandhi Wildlife Sanctuary, south India. This sanctuary lies in the state of Tamil Naduand is contiguous with the Parambikulam Wildlife Sanctuary of Kerala.
Table 1. Search effort for Indotestudo travancorica across localities in the Indira Gandhi Wildlife Sanctuary (December 2001–March2003).
Locality Vegetation type Man-hours of search No. of tortoises Hours of effort per tortoise
Anaikundhy Shola Wet evergreen 43.6 21 2.1Karian Shola Wet evergreen 64.5 20 3.3Sichali Teak/vayal 47.4 12 4.0Kozhikamuthy Moist deciduous 14.0 2 7.0Varagaliar Teak/vayal 21.4 2 10.7
NOTES AND FIELD REPORTS 109

male and female tortoises were tested using a 2-tailed
Mann-Whitney U test.
Results. — In total, 57 individuals were found. Adults
of both sexes were sighted in equal numbers (27 each), but
only 3 juveniles were recorded. There were no recaptures
despite repeated searches of some localities (Karian Shola,
Sichali, and Anaikundhy). Apart from signs such as trails
and bitten leaves, the rustling sound produced when a
tortoise moves on dry leaf litter also proved useful in
locating individuals. In one instance, 3 tortoises were
located by another auditory cue—a tortoise (male, SCL
251mm, WT 2.3 kg) was heard grunting loudly and shell-
ramming another individual (male, SCL 209.5mm, WT 1.4
kg) while a third individual remained nearby (female, SCL
266 mm, WT 3.2kg). This is the first record of male
combat observed in the wild. Overall, the mean search
effort was 3.4 man-hours/tortoise. Search effort was lowest
in Anaikundhy Shola and highest in Varagaliar (Table 1).
It also varied across the 4 months, with search effort being
highest in January and lowest in March (Table 2). All
tortoises were found singly, except during the month of
March when after convectional summer showers, 2 or
more individuals were found in close spatial proximity and
therefore only 1 hour of search effort was required to
locate each tortoise (Table 3).
Morphometric data were collected from 49 adults and
3 juveniles (Table 4); 5 tortoises could not be measured
because fieldwork was interrupted by elephants. There
were no significant differences among sexes in SCL
(z ¼ 1.34, p ¼ 0.18), WT (z ¼ 0.74, p ¼ 0.45) and AN
(z ¼�0.46, p ¼ 0.65), but males had significantly lower
HT (z ¼�2.12, p ¼ 0.034) and larger AF (z ¼ 2.22,
p ¼ 0.026). The largest tortoise (a male) measured 307
mm (SCL) and weighed 3.6 kg.
In addition, carapacial color appeared to vary
according to the locality: 35% of tortoises found in Karian
Shola (n ¼ 20) and 33% in Anaikundhy (n ¼ 21) were
dark brown and/or had large black blotches on the scutes;
whereas, tortoises from Sichali, Kozhikamuthy, and
Varagaliar were a lighter, duller brown.
Most of the tortoises (51 of 57 found, 90%) had ticks
(average¼ 3 ticks/tortoise) attached to the marginal scutes
of the carapace. Occasionally, ticks were also found near
the base of the tail. Some tortoises were found to shelter in
thickets of weeds (Lantana camara and Cromolariumglandulosum) (Ramesh, in press; 6 of 57 found, 10.5%).
Discussion. — Because of its cryptic coloration the
Travancore tortoise is considered difficult to find in the
wild (Frazier 1989). Even local people such as the Kadars
(a hunter-gatherer tribe), who are knowledgeable about the
area and familiar with this species, consider it an arduous
task to find tortoises, and in surveys conducted by other
biologists, the largest number observed was 7 (Moll 1989).
However, the overall mean search effort reported in this
study is much lower than those reported elsewhere (Table
5). Therefore, factors that are thought to have resulted in
greater capture success are discussed here. Suitable
localities and microhabitats (near streams and vayals)
were identified and search effort was concentrated here.
Signs of tortoise presence such as trails, bitten leaves, and
fresh scat were used to locate individuals—trails proved to
be the most reliable indicators, since they are clearly
visible in wet and dry seasons and in different microhab-
itats. Searches were conducted only during the period
when tortoises are most active, thereby improving capture
probabilities (Freilich et al. 2000; Ramesh, in press).
Further, confining the number of searchers to 2
instead of a group improved search efficiency as tortoises
were less likely to be disturbed and hide under dense cover
(Ramesh, in press), and auditory cues (rustling of dry
leaves caused by moving tortoises, grunting and shell-
ramming by males) were more noticeable because the
noise made by the movement of searchers was also
reduced. Moreover, because the same 2 searchers worked
in the 5 localities, it also reduced interobserver bias, which
can be significant in locating tortoises and causing
variations in capture probability (Freilich and LaRue
1998; Platt et al. 2003).
Environmental factors such as the availability of
suitable microhabitats and forage need to be investigated
Table 2. Search effort for Indotestudo travancorica in the IndiraGandhi Wildlife Sanctuary from December 2002 to March 2003.
MonthMan-hoursof search
No. oftortoises
Hours of effortper tortoise
Dec 2002 32.9 10 3.3Jan 2003 53.2 6 8.9Feb 2003 62.4 16 3.9Mar 2003 42.5 25 1.7
Table 3. Search effort for Indotestudo travancorica in the Indira Gandhi Wildlife Sanctuary from 10 March 2003 to 25 March 2003.
Date LocalityNo. of
searchersMan-hours
of searchingTime intervala
(minutes)
No. of tortoisesHours of effort
per tortoiseMales Females
10 Mar Anaikundhy Shola 3 7.5 90 4 2 1.311 Mar Anaikundhy Shola 3 7.5 115 4 4 0.917 Mar Karian Shola 2 5 70 4 3 0.725 Mar Anaikundhy Shola 2 3 0 2 0 1.5
a Time interval was calculated as the interval between first and last capture of the day.
110 CHELONIAN CONSERVATION AND BIOLOGY, Volume 7, Number 1 — 2008

further to explain variation in relative abundance across
localities within IGWLS (Table 1). However, although
Sichali and Varagaliar are very similar in terms of habitat
type, the hours of search effort required to find a single
tortoise at the latter site was almost 3 times as much as that
required in the former. A probable reason is that
Varagaliar has fairly heavy levels of disturbance caused
by activities such as collection of fuel wood and forage for
camp elephants. But more importantly, the inhabitants
have dogs that are often used for hunting small animals,
including tortoises. Kozhikamuthy is also used as a
seasonal elephant camp, but by a smaller number of
inhabitants, and this could contribute to the low encounter
rates at that locality. The presence of dogs and increased
movement of people may result in a greater number of
tortoises being hunted and, therefore, affect relative
abundance more significantly than habitat disturbance
per se because tortoises are known to shelter even in
thickets of weeds such as Lantana camara and Cromo-larium glandulosum, which grow in disturbed areas.
The high relative abundance of I. travancorica in
Anaikundhy and the variation in search effort across the 4-
month study period could have been caused by seasonal
changes in the microhabitat. For example, after the first 2
days of summer showers that occurred in March, 3
searchers found 14 tortoises in 15 man-hours (Table 3):
individuals were found clustered together; therefore, a
larger number of tortoises were found per man-hour of
searching. Some chelonians are known to drink rainwater
(Peterson 1996), so the sudden availability of water at the
end of the dry season could have resulted in tortoises
aggregating near streams and vayals. Fresh forage may
also have been available in these microhabitats. Such
seasonal changes can alter tortoise activity thereby
affecting encounter rates (Rose and Judd 1975; Berry
and Turner 1986; Geffen and Mendelssohn 1989; Freilich
et al. 2000). This clustering of tortoises could also be
indicative of reproductive behavior because male combat
reported herein is known to occur alongside courtship in
captive tortoises (Das 1991; Ramesh, pers. obs.), and in 4
instances (10 March to 17 March), a female was found
with 1 or 2 males. However, no courtship behavior was
observed. Further investigation is required because there is
some uncertainty regarding the breeding season of I.travancorica. Auffenberg (1964) reported it to be from
November to January; whereas, according to another
report, it coincides with the monsoons (Das 1991)
beginning in June, but only single individuals were
encountered in an earlier survey conducted from May to
June (Ramesh, in press). In addition, the Kadars too
believe that the summer showers (called the Elavanpumari) signal the onset of the breeding season of this
species.
It is interesting to note that of the 57 individuals found
during this study, juveniles comprised only 5% of all
captures; whereas, during the earlier survey, they com-
prised 33% of all captures (n ¼ 27). With the onset of the
monsoons in June, water and forage may have been easily
available, and this in turn could have increased the activity
levels and capture probabilities of juveniles during the
earlier study. However, this needs to be verified as in
general, neonates and juvenile tortoises are very difficult to
Table 4. Morphometric data (in mm and kg) of Indotestudo travancorica from the Indira Gandhi Wildlife Sanctuary, from December2002 to March 2003.
Males (n ¼ 24) Females (n ¼ 25) Juveniles (n ¼ 3)
Mean 6 1 SD Range Mean 6 1 SD Range Mean 6 1 SD Range
Straight carapace length 249.7 6 24.2 (206–307) 238.4 6 26.4 (192.5–295) 140.7 6 21.9 (122.5–165)Straight carapace width 154.9 6 13.4 (130–190) 153.2 6 15.5 (127.5–190) 104.2 6 8.2 (95.7–112)Plastron length 179.5 6 16.3 (153.5–224) 176.4 6 17.6 (149–219) 113.1 6 17.5 (100.2–133)Plastron width 145.9 6 16.9 (121–198) 144 6 19.1 (115–204) 94.2 6 9.1 (86.1–104)Shell height 91.7 6 6.5 (81–104) 97.7 6 9 (77–113) 69.3 6 8.2 (60–75)Anal fork 47.4 6 6.6 (34.6–57.6) 43.2 6 6.1 (32.1–52.9) 23.5 6 2.6 (21.6–26.5)Anal notch 48.3 6 6.3 (37.6–57.1) 48.5 6 9.4 (30–61.6) 21.9 6 4.9 (17.1–26.8)Weight 2.1 6 0.6 (2.5–3.6) 2 6 0.7 (1.1–3.9) 0.46 6 0.4 (0.2–0.9)
Table 5. Comparison of search effort for Indotestudo travancorica in the southern Western Ghats, India.
Study Area MonthMan-hoursof search
No. oftortoises
Hours of effortper tortoise
Groombridge et al. 1983 Anamalai Hills Oct–Nov 37.5 6 6.3Moll 1989 Anamalai Hills Nov 40 7 5.7Das 1991 — Feb 22 4 5.5Bhupathy and Choudhury 1995 Parambikulam Wildlife Sanctuary Oct–Dec 60 3 20.0Bhupathy and Choudhury 1995 Indira Gandhi Wildlife Sanctuary Oct–Dec 60 0 —Present study Indira Gandhi Wildlife Sanctuary Dec–Mar 191 57 3.4
NOTES AND FIELD REPORTS 111

find and, as a result their ecological requirements, are
poorly understood (Berry and Turner 1986; Mason et al.
2000; Freilich et al. 2000).
Among adult I. travancorica, it has been reported that
males are larger than females (Das 1991), but despite the
relatively large sample size of this study (24 males, 25
females), there was no significant difference in carapace
length (Fig. 3). The difference in shell height and anal
notch has been recorded earlier, and the latter is believed
to provide the tail of the male greater freedom of
movement during copulation (Vijaya 1983). There is a
marked difference in the shape of the carapace as well:
males tended to have a more uniformly elongated
carapace; whereas, females have an ovoid shape, with a
broader anterior end. In addition to the characters
mentioned earlier, this may also serve as useful guide to
differentiate between sexes in the field. In view of the fact
that both the male-to-female ratio (1:1 December–March;
2.6:1 May–June) and representation of juveniles varies
according to season, sampling during both wet and dry
periods may be necessary to determine size distribution of
the population.
The carapacial color variation seen in tortoises is
believed to provide effective camouflage (Pritchard 1979),
with tortoises in wetter habitats being darker than those in
dry habitats (Kabigumila 2000). Therefore, the color
variation observed in I. travancorica may serve a similar
purpose. It should be noted that I. travancorica may have
fairly large home ranges; there is a recorded instance of a
tortoise travelling at least 20 km in as many years (Ramesh
2004), and given the mosaic landscape of the Western
Ghats, habitat variables can vary considerably between
sites.
To conclude, the search methodology described here
can be used to effectively sample this rare species and
assess the relative abundance of I. travancorica in
different types of habitats. If surveys are conducted during
March–April, the sound of shell-ramming and grunting
can be heard about 50 m away and, therefore, can serve as
an important auditory cue and further reduce search effort.
At the same time, it could yield valuable data on the
reproductive behavior of this species. Although further
studies are necessary in order to estimate the size and
structure of the population, I. travancorica may not be as
rare as believed earlier because it has been sighted even in
moderately disturbed areas during this study and others
(Bhupathy and Choudhury 1995); it is known to occur in
several protected areas totaling about 3900 km2 (Das
1991; Bhupathy and Choudhury 1995); and so far, large-
scale trade or exploitation of this species has not been
recorded (Das 1991; Choudhury et al. 2000). However, it
is necessary to continue with the enforcement of wildlife
protection laws applicable to the species because tortoises
are very vulnerable to exploitation by humans (Moll 1989)
and to large-scale habitat destruction such as those caused
by wildfires, conversion of forests to plantations, and
construction of hydroelectric dams (Groombridge et al.
1983; Das 1991; Choudhury et al. 2000).
Acknowledgments. — I would like to thank the Tamil
Nadu Forest Department for working and tagging
permission for IGWLS and for their cooperation. I am
grateful to H.V. Andrews, S.U. Saravanakumar, R.
Chellam, N.M. Ishwar, and A. Kumar for many valuable
discussions and their support; M. Pedrono generously sent
me several reprints, and comments from S.G. Platt greatly
improved the manuscript. I would also like to thank D.
Venugopal for the map, and my assistant Ganesan Anna
for his good humor and expertise in the field. This study
was funded by the Centre for Herpetology, Madras
Crocodile Bank Trust, India.
LITERATURE CITED
AUFFENBERG, W. 1964. Notes on the courtship of the land tortoise
Geochelone travancorica (Boulenger). Journal of the Bombay
Natural History Society 61:247–253.
BERRY, K.H. AND TURNER, F.B. 1986. Spring activities and habits
of juvenile desert tortoises in California. Copeia 1986:
1010–1012.
BHUPATHY, S. AND CHOUDHURY, B.C. 1995. Status, distribution
and conservation of the Travancore tortoise Indotestudoforstenii in the Western Ghats. Journal of the Bombay Natural
History Society 92:16–21.
BOULENGER, G.A. 1907. A new tortoise from Travancore. Journal
of the Bombay Natural History Society 17:560–561.
CAGLE, F.R. 1939. A system for marking turtles for future
identification. Copeia 1939:170–173.
CHAMPION, H.G. AND SETH, S.K. 1968. A revised survey of the
forest types of India. New Delhi: Manager of Publication,
404 pp.
CHOUDHURY, B.C., BHUPATHY, S., AND HANFEE, F. 2000. Status
information on the tortoises and freshwater turtles of India. In:
van Dijk, P.P., Stuart, B.L., and Rhodin, A.G.J. (Eds.). Asian
Turtle Trade: Proceedings of a Workshop on Conservation and
Trade of Freshwater Turtles and Tortoises in Asia. Chelonian
Research Monographs 2:86–94.
CRUMP, M.L. AND SCOTT, N.J., JR. 1994. Visual encounter survey.
In: Heyer, W.R., Donnelly, M.A., McDiarmid, R.W., Hayek,
L.C., and Foster, M.S. (Eds.). Measuring and Monitoring
Biological Diversity, Standard Methods for Amphibians.
Washington DC: Smithsonian Institution Press, pp. 84–91.
Figure 3. Straight carapace length (mm) of Indotestudotravancorica from the Indira Gandhi Wildlife Sanctuary.
112 CHELONIAN CONSERVATION AND BIOLOGY, Volume 7, Number 1 — 2008
DAS, I. 1991. Colour Guide to the Turtles and Tortoises of the
Indian Subcontinent. Avon, United Kingdom: R & A
Publishing Lmt, 133 pp.
FRAZIER, J.G. 1989. Chelonians of the Western Ghats. Hamadryad
14:4–7.
FREILICH, J.E., BURNHAM, K.P., COLLINS, C.M., AND GARRY, C.A.
2000. Factors affecting population assessments of desert
tortoises. Conservation Biology 14:1479–1489.
FREILICH, J.E. AND LA RUE, E.L., JR. 1998. Importance of observer
experience in finding desert tortoises. Journal of Wildlife
Management 62:590–596.
GEFFEN, E. AND MENDELSSOHN, H. 1989. Activity patterns and
thermoregulatory behaviour of the Egyptian tortoise Testudokleinmanni in Israel. Journal of Herpetology 23:404–409.
GROOMBRIDGE, B., MOLL, E.O., AND VIJAYA, J. 1983. Rediscovery
of a rare Indian turtle. Oryx 17:130–134.
[IUCN] INTERNATIONAL UNION FOR CONSERVATION OF NATURE.
2004. Indotestudo travancorica. In: IUCN red list of
threatened species. www.redlist.org (5 April 2006).
IVERSON, J.B., SPINKS, P.Q., SHAFFER, H.B., MCCORD, W.P., AND
DAS, I. 2001. Phylogenetic relationships among the Asian
tortoises of the genus Indotestudo (Reptilia: Testudines:
Testudinidae). Hamadryad 26:272–275.
KABIGUMILA, J. 2000. Growth and carapacial colour variation of
the leopard tortoise, Geochelone pardalis babcocki, in
northern Tanzania. African Journal of Ecology 38:217–223.
KLEMENS, M.W. AND MOLL, D. 1995. An assessment of the effects
of commercial exploitation on the pancake tortoise, Mala-cochersus tornieri, in Tanzania. Chelonian Conservation. and
Biology 3:223–226.
MASON, M.C., KERLEY, G.I.H., WEATHERBY, C.A., AND BRANCH,
W.R. 2000. Angulate and leopard tortoises in the Thicket
Biome, Eastern Cape, South Africa: populations and biomass
estimates. African Journal of Ecology 38:147–153.
MOLL, E.O. 1989. Indotestudo forstenii, Travancore tortoise. In:
Swingland, I.R. and Klemens, M.W. (Eds.). The Conservation
Biology of Tortoises. Occasional paper, IUCN/SSC 5. Gland,
Switzerland: IUCN, 202 pp.
MOLUR, S. AND WALKER, S. 1998. Report of the workshop
‘‘Conservation Assessment and Management Plan for reptiles
of India’’. Coimbatore, India: BCPP – Endangered Species
Project, Zoo Outreach Organisation, Captive Breeding Spe-
cialist Group, India, 175 pp.
PASCAL, J.P. 1988. Wet Evergreen Forests of the Western Ghats:
Ecology, Structure, Floristic Composition and Structure.
Pondicherry, India: French Institute, 345 pp.
PETERSON, C.C. 1996. Ecological energetic of the desert tortoise
(Gopherus agassizii): effects of rainfall and drought. Ecology
77:1831–1844.
PLATT, S.G., KO, W.K., KHAING, L.L., MYO, K.M., SWE, T., LWIN,
T., AND RAINWATER, T.R. 2003. Population status and
conservation of the critically endangered Burmese star tortoise
Geochelone platynota in central Myanmar. Oryx 37:464–471.
PRITCHARD, P.C.H. 1979. Encyclopedia of Turtles. Surrey, United
Kingdom: TFH Publishers, 895 pp.
PRITCHARD, P.C.H. 2000. Indotestudo travancorica...a valid
species of tortoise? Reptile and Amphibian Hobbyist.
February:18–28.
RAMESH, M. 2004. Long distance dispersal by a Travancore
tortoise, Indotestudo travancorica. Hamadryad 28:105.
RAMESH, M. Preliminary survey of Indotestudo travancorica(Testudinidae) at the Indira Gandhi Wildlife Sanctuary,
southern India. Hamadryad (in press).
ROSE, F.L. AND JUDD, F.W. 1975. Activity and home range size of
the Texas tortoise Gopherus berlandieri, in south Texas.Herpetologica 31:448–456.
SMITH, L.S., PEDRONO, M., DORAZIO, R.M., AND BISHKO, J. 2001.Morphometrics, sexual dimorphism, and growth in theAngonoka tortoise (Geochelone yniphora) of western Mada-gascar. African Journal of Herpetology 50:9–18.
VIJAYA, J. 1983. The Travancore tortoise Geochelone travancor-ica. Hamadryad 8:11–13.
Received: 9 June 2006
Revised and Accepted: 7 December 2007
Chelonian Conservation and Biology, 2008, 7(1): 113–118
� 2008 Chelonian Research Foundation
Terrestrial Movements of Hatchling WoodTurtles (Glyptemys insculpta) in Agricultural
Fields in New Jersey
CHRISTINA M. CASTELLANO1,4, JOHN L. BEHLER
2,
AND GORDON R. ULTSCH3,5
1Department of Biological Sciences, Fordham University, Bronx,New York 10458 USA [[email protected]];
2Department of Herpetology, Wildlife Conservation Society, Bronx,
New York 10460 USA [Deceased];3Department of Zoology, University of Florida, Gainesville,
Florida 32611 USA [[email protected]]4Present Address: Institute for Applied Ecology,University of Canberra, ACT 2601 Australia;
5Present Address: 4324 NW 36th Street, Cape Coral,
Florida 33993 USA
ABSTRACT. – Hatchling Glyptemys insculpta did nottravel to water directly upon emergence from theirnests but remained in agricultural fields for severaldays to weeks, during which time they fed and grew.Hatchlings were less active and occupied sites withsignificantly lower air and substrate temperaturesthan adult turtles. A management scheme to delayagricultural harvesting until turtles have enteredaquatic habitats for hibernation is advised.
Little is known of the behavior, ecology, and
physiology of hatchling turtles in cold-temperate climates
that emerge in autumn and do not overwinter in or below
the nest cavity. Kolbe and Janzen (2002) posited that some
hatchling turtles move quickly from the nest to water,
minimizing exposure to predators but increasing water
loss, while others delay the journey, increasing the chances
of predation but minimizing the risk of desiccation.
Overall, the migration rates of hatchling turtles are
influenced by body size (Janzen et al. 2000a; Tucker
2000), water loss (Finkler et al. 2000; Kolbe and Janzen
2002), predation risk (Janzen et al. 2000b), weather
conditions (Filoramo and Janzen 2002), and nest-site
characteristics (Kolbe and Janzen 2001).
NOTES AND FIELD REPORTS 113

Despite the trade-offs considered by Kolbe and Janzen
(2002), a simple assumption is that, upon emergence,
hatchlings of aquatic turtles from moderate climates move
to water in as direct a manner as practical to begin feeding,
which presumably will occur provided that water temper-
atures are not prohibitive (Ultsch 1989). However, some
aquatic species are known to feed terrestrially, such as bog
turtles (Glyptemys muhlenbergii; Barton and Price 1955),
Blanding’s turtles (Emydoidea blandingii; Cahn 1937 in
Ernst et al. 1994), and wood turtles (Glyptemys insculpta;
Farrell and Graham 1991). Furthermore, hatchling Bland-
ing’s and wood turtles spend time in terrestrial environ-
ments where they feed prior to entering aquatic
hibernacula (Butler and Graham 1995; Tuttle and Carroll
2005).
The wood turtle is a semi-aquatic freshwater turtle that
is widely distributed throughout the northeastern United
States and southeastern Canada (Ernst et al. 1994). In New
Jersey, G. insculpta is primarily terrestrial from late May
to mid-September but returns to aquatic overwintering
sites in October and November (Farrell and Graham 1991).
Hatchling G. insculpta are not known to overwinter in the
nest chamber (Buech et al. 2004; but see Parren and Rice
2004), as do hatchlings of some other sympatric species
(e.g., Chrysemys picta; Gibbons and Nelson 1978). Recent
research using fluorescent powder showed that neonate G.insculpta in New Hampshire spent several days on land
before entering an aquatic habitat (Tuttle and Carroll
2005).
Much of the natural history of hatchling turtles,
including G. insculpta, is unknown because of the
difficulty of tracking such small animals. However, with
the advent of radiotransmitters small enough to attach to
turtle hatchlings, it is now possible to reliably track
hatchlings as soon as they emerge from their nests. We
used radiotelemetry to describe the movements and
behavior of hatchling G. insculpta in New Jersey during
their journey to aquatic habitats for hibernation. Our
objectives were to document hatchling behavior with a
different tracking method than used in previous studies
and to gather information on hatchlings in this geographic
region.
Methods. — Our study was conducted in 2002 along a
3.8-km stretch of stream that terminates at the Delaware
River in Warren County, New Jersey. The stream was
bordered by deciduous forest composed primarily of silver
maple (Acer saccharinum), black walnut (Juglans nigra),
oaks (Quercus spp.), and agricultural fields. The agricul-
tural fields were used to grow corn (Zea mays) and
included 42% (66 ha) of the total site area. The farming
schedule practiced here was soil tillage in April, planting
in May, fertilizing and herbicide application in June, and
harvesting in October. Turtles used the cornfields for
nesting during the last week of May and first 2 weeks of
June. The majority of hatchlings emerged in mid to late
August.
We installed nest protectors constructed of 2.5-cm
wire fencing over 4 nests at the time of egg deposition
(Graham 1997). The mean straight-line distance between
the nests and the nearest aquatic habitat was 67 6 21 m
(mean 6 1 standard deviation; range 49–90 m). We
monitored the nests throughout the incubation period and
later weighed and measured hatchlings within 24 hours of
their exiting the nest chamber during emergence. Ten
hatchlings from the 4 nests were fitted with BD-2A
transmitters (Holohil Systems Ltd, Carp, Ontario, Canada)
with an expected battery life of 2–3 weeks and signal
range of approximately 500 m (Fig. 1). Transmitters were
glued to the carapace using Devcon 5-min epoxy (ITW
Brands, Wood Dale, IL) and removed or replaced after 15–
19 days, near the anticipated end of battery life. The total
package mass of the transmitter and epoxy averaged 0.8 g
and was 8–10% of neonate weight. We did not have
enough transmitters to replace all of them on all hatchlings
until they entered water; on 3 hatchlings the transmitters
were replaced once, and on one it was replaced twice.
These 4 individuals were weighed and measured when the
original transmitters were removed and before the
replacement transmitters were attached. The site was
visited between 0700 and 1900 hours (EST) from 1
August to 15 October 2002. The mean time interval
between tracking locations was 1.5 6 0.1 day (range 1–9).
The position change of hatchlings relative to their last
location was determined by Universal Transmercator
coordinates at each capture location using a Garmin III
Plus handheld Global Positioning System unit with an
error of approximately 3 m (Garmin International Inc.,
Olathe, KS).
To compare behavior between age classes, we fitted
10 adult G. insculpta (5 males and 5 females) with R1535
transmitters (Advanced Telemetry Systems, Isanti, MN)
and tracked them simultaneously with hatchlings. We
recorded turtle behavior at each capture location as resting
(beneath vegetation or in forms), basking (fully or partially
exposed), foraging (prey on beak or in mouth), or traveling
(moving between locations). We measured air temperature
at 1 m above ground for each capture location using a
rapid register thermometer (Miller & Weber Inc, Ridge-
wood, NY). Substrate temperature was measured at the
Figure 1. Hatchling Glyptemys insculpta [CL ¼ 37 mm] fittedwith radiotransmitter.
114 CHELONIAN CONSERVATION AND BIOLOGY, Volume 7, Number 1 — 2008

surface of the ground beside each individual. We used
Student t-test to determine if air and substrate temperatures
differed between hatchling and adult G. insculptalocations; significance was accepted when p , 0.05. We
report the results as means 6 1 standard deviation.
Results. — Hatchlings emerged from the nests from
13 to 20 August after incubation periods of 69–76 days
(Table 1). The average mass and straight-line carapace
length of the 10 hatchlings prior to being fitted with
transmitters were 8.9 6 0.6 g (range 8.0–10.1 g) and
37.9 6 1.1 mm (range 36.0–39.2 mm), respectively.
Three hatchlings were lost within 24 hours. The mean
tracking period for the remaining 7 was 30 6 17 days
(range 13–62 days), and the mean total straight-line
distance traveled was 493 6 306 m (range 163-1052 m)
(Table 1). The average minimum daily movement
(straight-line distance between location sites) was
24 6 8 m (range 7–34 m), expressed as the mean of the
means for each hatchling for observations separated by 1
day; if mean daily movement is calculated as (total
straight-line distance moved)/(total days tracked), this
figure is 18 m/d. Movements were greatest during the first
24 hours, when they averaged 131 6 84 m (range 2–257
m), which could be an artifact due to the handling
associated with transmitter attachment. Movements varied
greatly among and within individuals. For example, turtle
2 made an initial movement of 81 m and then stayed in the
same area for 14 days. Four hatchlings remained in the
agricultural fields during the tracking period, while 3
reached water (Delaware River or parental home stream).
The mean travel time and total distance traveled by these
latter 3 were 43 6 17 days (range 29–62) and 546 6 457
m (range 163–1052). This distance was 8 times greater
than the mean straight-line distance between the nests from
which they emerged and the nearest water.
When located during the day, the hatchlings were
found resting 57.6% of the time, basking 36.8%, foraging
4.0%, and traveling 1.6%. Resting hatchlings were located
primarily beneath dead corn leaves and stalks (from the
previous season) but also beneath flattened patches of
green corn, yellow wood sorrel (Oxalis europaea),
woodland horsetail (Equisetum sylvaticum), dewberry
(Rubus flagellaris), carpetweed (Mollugo verticillata),
yellow nutsedge (Cyperus esculentus), black nightshade
(Solanum nigrum), and poison ivy (Toxicodendronradicans). Basking hatchlings were found partially
covered by vegetation or adjacent to the prop roots of
standing corn. Traveling hatchlings were observed walk-
ing between cornrows.
Hatchlings were observed foraging 7 times on slugs
(Arion subfuscus); 6 of these events occurred on overcast
days with light to heavy rain. After 12 to 18 days from
release, 4 hatchlings increased their carapace length an
average of 2.6 6 0.8 mm (range 1.7–3.4 mm) and mass
1.1 6 0.3 g (range 0.9–1.5 g). Hatchlings that reached
water were found submerged beneath branches, duckweed
(Lemna sp.), and floating mats of Elodea, at depths of 0.1–
0.5 m. Average water temperature for these observations
was 22.38 6 2.88C (range 19.58–25.08C).
The average mass and straight-line carapace length for
the 10 adults radiotracked simultaneously with the
hatchlings were 892.9 6 149.3 g (range 735.0–1190.0 g)
and 192.9 6 14.5 mm (range 168.8–220.0 g), respective-
ly. The total number of tracking locations for adults was
202. The percentages of observations made on the diurnal
activity of adults were 49.1% resting, 22.7% basking,
21.1% traveling, and 7.1% foraging. Air temperatures at
the capture sites for adults were significantly (t ¼ 4.01,
df ¼ 15, p ¼ 0.001) higher (28.18 6 1.78C, range 24.7–
31.58C) than those for hatchlings (25.38 6 0.88C, range
23.98–26.38C). Likewise, substrate temperatures at the
capture sites for adults were significantly (t ¼ 5.62,
df ¼ 15, p , 0.001) higher (26.48 6 1.18C; range ¼24.48–28.08C) than those for hatchlings (23.58 6 1.08C;
range ¼ 22.58–25.18C).
Discussion. — Some species of turtles that typically
live in or near water can feed on land as well as in the water,
including G. insculpta, E. blandingii, and G. muhlenbergii.For these species, moving directly to water after emergence
from the nest may not be as crucial as it is for species that
Table 1. Movement data for 10 G. insculpta hatchlings following emergence from nests in New Jersey.
Turtleno.
Emergencedate
Incubationperiod (d)
Nest to waterdistance (m)
Trackingperiod (d)
Timeslocated
Total straight-linedistance moved (m)
Straight-linedistance moved
per day (m)a
1 19 Aug 70 49 29 19 425 24 6 43 (0–141)2 19 Aug 70 49 29 19 163 7 6 21 (0–81)3 20 Aug 73 90 15 13 298 23 6 59 (0–210)4 18 Aug 69 50 14 13 334 26 6 44 (0–147)5 18 Aug 69 50 23 22 756 34 6 64 (0–257)6 13 Aug 76 80 63 33 1052 27 6 59 (0–190)7 20 Aug 73 90 37 20 423 24 6 41 (0–146)8 19 Aug 70 49 0 0 — —9 13 Aug 76 80 0 0 — —10 13 Aug 76 80 0 0 — —
a Mean 6 SD (range); based only on observations separated by 1 day. Sample sizes: 1 (14), 2 (16), 3 (13), 4 (13), 5 (22), 6 (26), and 7 (16).
NOTES AND FIELD REPORTS 115

can only feed in water (e.g., Apalone mutica and A.spinifera; Doody 1995). Perhaps for hatchlings of the more
terrestrial species, it is only necessary to eventually move to
water for hibernation. Wood turtle hatchlings in New
Jersey spent 4–12 weeks on land where they fed and grew.
Our findings are consistent with those of Tuttle and Carroll
(1997, 2005). They found that G. insculpta hatchlings in
New Hampshire could take as long as 26 days to enter a
brook, and would sometimes move away from the nearest
brook rather than toward it. They also found that of 12
turtles that were tracked using fluorescent powder from
their nest to water, transit times averaged 6.5 days (range
1–24 days). Similarly, E. blandingii hatchlings in Nova
Scotia have also been found to tarry on their nest to water
journey and even to actively avoid large bodies of water
adjacent to their nests in favor of more distant, shallower
waters (Standing et al. 1997; McNeil et al. 2000). In
Massachusetts, E. blandingii hatchlings moved more
directly to water, but the nests were near wetlands and
transit time was as long as 9 days (mean 2.9 days; Butler
and Graham 1995).
For the few aquatic species that can and do feed on
land, there is no immediate need to enter water for feeding;
although, desiccation and predation are still potential
threats. At least 7 of the 10 neonate G. insculpta that we
radiotracked remained primarily terrestrial following
emergence, and they fed and grew during the period they
spent on land. While an increase in mass might be
attributed to water gain, the increase in carapace length
indicates that growth was occurring prior to hibernation.
Our study and those of Tuttle and Carroll (1997, 2005)
found that hatchlings spent the night in forms. All 3
studies found most hatchling activity to occur in the
morning, and activity to be stimulated by rainfall. These
observations are consistent with avoidance of potential
desiccation associated with higher midday temperatures, as
is our finding that adult turtles are more active at higher
temperatures, which would not pose as great a threat of
desiccation to them because of their larger size. Ernst
(1968) noted that young turtles, including G. insculpta,
experienced greater water loss than older individuals in
laboratory experiments and suggested that this difference
was due to the greater surface to mass ratio of smaller
individuals. In addition, Tuttle and Carroll (2005) reported
that at least one hatchling made a ‘‘beeline’’ for a brook,
indicating that remaining on land for protracted periods
after emergence is not an inviolable rule. Three of the 10
hatchlings that we released were not located again, and it is
possible that they were either taken by predators, were lost
due to transmitter failure, and/or they moved directly to
water and then moved far enough downstream to be out of
receiver range.
The average time spent on land by 12 G. insculptahatchlings in New Hampshire that were followed to water
was 6.5 days, with a maximum of 24 days; another was
found still on land after 26 days (Tuttle and Carroll 1997,
2005). At our New Jersey site, the mean time spent on land
for the 3 hatchlings followed to water was substantially
longer (mean ¼ 43 days, maximum ¼ 62 days). Since the
climate is more moderate in New Jersey than New
Hampshire, we assume that the ultimate factor determining
movement to water is the necessity of aquatic hibernation,
and the cue to leave the terrestrial environment is falling
temperature. It has been demonstrated that extrinsic loads
may impair locomotion in turtles (Zani and Claussen
1995). Thus, transmitters could have affected the travel
rate of turtles in our study; however, the ratio of
transmitter weight to body weight did not exceed the
recommended maximum for reptiles (10%; Anonymous
1987). Furthermore, the average daily movement of turtles
in New Jersey (24 m) was the same for turtles in New
Hampshire (Tuttle and Carroll 2005).
While it is well documented that hatchlings of several
species of turtles overwinter terrestrially in or below the
nest cavity without emerging above ground, there are no
data to suggest that hatchling turtles in cold-temperate
climates that do not overwinter in the nest routinely
overwinter on land. However, terrestrial overwintering
may be possible under certain conditions for a few
individuals that do not reach aquatic hibernacula before
the advent of cold weather (Congdon et al. 1983, 2000;
Standing et al. 1997, 1999; McNeil et al. 2000; Pappas et
al. 2000; Dinkelacker et al. 2004). Now that radio-
transmitters are manufactured small enough to place on
neonatal turtles, it is possible to study the behavior of
hatchlings between the time of emergence from the nest
and their first hibernation period. Moreover, researchers
now have the capability to identify the locations and
characteristics of aquatic hibernacula, which are currently
undescribed but likely to be different from those of adults
(Reese et al. 2004; Ultsch 2006).
The terrestrial behavior of hatchling G. insculptafollowing emergence from nests in agricultural fields has
implications for the conservation and management of this
species. The prolonged stay of hatchlings in this habitat
following emergence might put them at risk of injury or
death inflicted by farm machinery if crop harvest occurs
before they have migrated to aquatic hibernacula. Injuries
and deaths caused by farm machinery have been reported
for adult G. insculpta at this location (Castellano 2007)
and elsewhere (Saumure and Bider 1998; Saumure et al.
2007). At our New Jersey site, late-maturing varieties of
corn are grown in order to delay harvest until mid-October
when both adult and neonate turtles have exited the fields.
A management scheme to delay harvesting until turtles
have entered aquatic habitat for hibernation is advised for
other locations.
Acknowledgments. — We thank M. Stepek, S. Boder,
and B. Madden for providing field assistance; P. Lynch, J.
Shreiner, and L. Hilaire of the National Park Service for
providing technical support; and J. Harding and S. Doody
for their comments on various drafts of the manuscript.
The Wildlife Conservation Society, National Park Service,
116 CHELONIAN CONSERVATION AND BIOLOGY, Volume 7, Number 1 — 2008

and John Ball Zoological Society funded this research.
Scientific research permits were obtained through the New
Jersey Department of Environmental Protection (SC
21019) and the National Park Service (DEWA-2001-
SCI-015). The animals were managed in accordance with
guidelines set forth by the Institutional Animal Care and
Use Committee of Fordham University (A3819–01).
LITERATURE CITED
ANONYMOUS. 1987. Guidelines for use of live amphibians andreptiles in field research. Lawrence, KS: American Society ofIchthyologists and Herpetologists, The Herpetologists’League, Society for the Study of Amphibians and Reptiles.
BARTON, A.J. AND PRICE, J.W., SR. 1955. Our knowledge of thebog turtle, Clemmys muhlenbergii, surveyed and augmented.Copeia 1955:159–165.
BUECH, R.R., NELSON, M.D., HANSON, L.G., AND EWERT, M.A.2004. Clemmys insculpta (wood turtle). Hatchling Failure.Herpetological Review 35:54.
BUTLER, B.O. AND GRAHAM, T.E. 1995. Early post-emergencebehavior and habitat selection in hatchling Blanding’s turtles,Emydoidea blandingii, in Massachusetts. Chelonian Conser-vation and Biology 1:187–196.
CAHN, A.R. 1937. The turtles of Illinois. Illinois BiologicalMonographs 35:1–218.
CASTELLANO, C.M. 2007. Ecology and conservation of the woodturtle at Delaware Water Gap National Recreation Area. Ph.D.Dissertation, Fordham University, Bronx, NY.
CONGDON, J.D., NAGLE, R.D., KINNEY, O.M., OSENTOSKI, M.,AVERY, H.W., VAN LOBEN SELS, R.C., AND TINKLE, D.W. 2000.Nesting ecology and embryo mortality: implications forhatching success and demography of Blanding’s turtles(Emydoidea blandingii). Chelonian Conservation and Biology3:569–579.
CONGDON, J.D., TINKLE, D.W., BREITENBACH, G.C., AND VAN
LOBEN SELS, R.C. 1983. Nesting ecology and hatching successin the turtle Emydoidea blandingii. Herpetologica 39:417–429.
DINKELACKER, S.A., COSTANZO, J.P., IVERSON, J.B., AND LEE, R.E.2004. Cold-hardiness and dehydration resistance of hatchlingBlanding’s turtles (Emydoidea blandingii): implications foroverwintering in a terrestrial habitat. Canadian Journal ofZoology 82:594–600.
DOODY, J.S. 1995. A comparative nesting study of two syntopicspecies of softshell turtles (Apalone mutica and Apalonespinifera) in southcentral Louisiana. Master’s Thesis, South-eastern Louisiana University, Hammond, LA.
ERNST, C.H. 1968. Evaporative water-loss relationships of turtles.Journal of Herpetology 2:159–161.
ERNST, C.H., LOVICH, J.E., AND BARBOUR, R.W. 1994. Turtles ofthe United States and Canada. Washington, DC: SmithsonianInstitution Press, 578 pp.
FARRELL, R.F. AND GRAHAM, T.E. 1991. Ecological notes on theturtle Clemmys insculpta in northwestern New Jersey. Journalof Herpetology 25:1–9.
FILORAMO, N.I. AND JANZEN, F.J. 2002. An experimental study ofthe influence of embryonic water availability, body size, andclutch on survivorship of neonatal red-eared sliders, Tra-chemys scripta elegans. Herpetologica 58:67–74.
FINKLER, M.S., KNICKERBOCKER, D.L., AND CLAUSSEN, D.L. 2000.Influence of hydric conditions during incubation and popula-tion on overland movement of neonatal snapping turtles.Journal of Herpetology 34:452–455.
GIBBONS, J.W. AND NELSON, D.H. 1978. The evolutionary
significance of delayed emergence from the nest by hatchling
turtles. Evolution 32:297–303.
GRAHAM, T. 1997. Effective predator excluders for turtle nests.
Herpetological Review 28:76.
JANZEN, F.J., TUCKER, J.K., AND PAUKSTIS, G.L. 2000a. Experi-
mental analysis of an early life-history stage: selection on size
of hatchling turtles. Ecology 8:2290–2304.
JANZEN, F.J., TUCKER, J.K., AND PAUKSTIS, G.L. 2000b. Experi-
mental analysis of an early life-history stage: avian predation
selects for larger body size of hatchling turtles. Journal of
Evolutionary Biology 13:947–954.
KOLBE, J.J. AND JANZEN, F.J. 2001. The influence of propagule
size and maternal nest-site selection on survival and behaviour
of neonate turtles. Functional Ecology 15:772–781.
KOLBE, J.J. AND JANZEN, F.J. 2002. Experimental analysis of an
early life-history stage: water loss and migrating hatchling
turtles. Copeia 2002:220–226.
MCNEIL, J.A., HERMAN, T.B., AND STANDING, K.L. 2000.
Movement of hatchling Blanding’s turtles (Emydoideablandingii) in Nova Scotia in response to proximity to open
water: a manipulative experiment. Chelonian Conservation
and Biology 3:611–617.
PAPPAS, M.J., BRECKE, B.J., AND CONGDON, J.D. 2000. The
Blanding’s turtles (Emydoidea blandingii) of Weaver Dunes,
Minnesota. Chelonian Conservation and Biology 3:557–568.
PARREN, S.G. AND RICE, M.A. 2004. Terrestrial overwintering of
hatchling turtles in Vermont. Northeastern Naturalist 11:
229–233.
REESE, S.A., ULTSCH, G.R., AND JACKSON, D.C. 2004. Lactate
accumulation, glycogen depletion, and shell composition of
hatchling turtles during simulated hibernation. Journal of
Experimental Biology 207:2889–2895.
SAUMURE, R.A. AND BIDER, J.R. 1998. Impact of agricultural
development on a population of wood turtles (Clemmysinsculpta) in southern Quebec, Canada. Chelonian Conserva-
tion and Biology 3:37–45.
SAUMURE, R.A., HERMAN, T.B., AND TITMAN, R.D. 2007. Effects of
haying and agricultural practices on a declining species: The
North American wood turtle, Glyptemys insculpta. Biological
Conservation 135:581–591.
STANDING, K.L., HERMAN, T.B., HURLBURT, D.D., AND MORRISON,
I.P. 1997. Postemergence behaviour of neonates in a northern
peripheral population of Blanding’s turtle, Emydoidea blan-dingii, in Nova Scotia. Canadian Journal of Zoology 75:
1387–1395.
STANDING, K.L., HERMAN, T.B., AND MORRISON, I.P. 1999. Nesting
ecology of Blanding’s turtle, (Emydoidea blandingii) in Nova
Scotia, the northeastern limit of the species’ range. Canadian
Journal of Zoology 77:1609–1614.
TUCKER, J.K. 2000. Body size and migration of hatchling turtles:
inter- and intraspecific comparisons. Journal of Herpetology
34:541–546.
TUTTLE, S.E. AND CARROLL, D.M. 1997. Ecology and natural
history of the wood turtle (Clemmys insculpta) in southern
New Hampshire. Linnaeus Fund Research Report. Chelonian
Conservation and Biology 2:447–449.
TUTTLE, S.E. AND CARROLL, D.M. 2005. Movements and behavior
of hatchling wood turtles (Glyptemys insculpta). Northeastern
Naturalist 12:331–348.
ULTSCH, G.R. 1989. Ecology and physiology of hibernation and
overwintering among freshwater fishes, turtles, and snakes.
Biological Reviews 64:435–516.
ULTSCH, G.R. 2006. The ecology of overwintering among turtles:
NOTES AND FIELD REPORTS 117
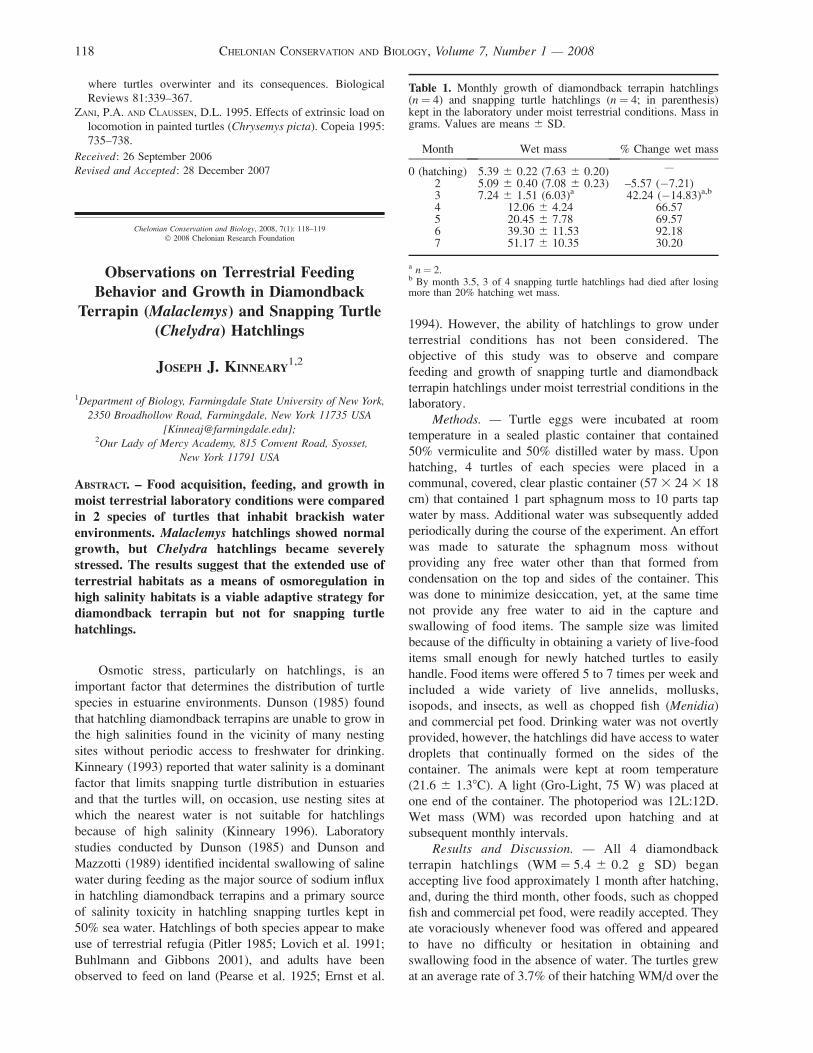
where turtles overwinter and its consequences. Biological
Reviews 81:339–367.
ZANI, P.A. AND CLAUSSEN, D.L. 1995. Effects of extrinsic load on
locomotion in painted turtles (Chrysemys picta). Copeia 1995:
735–738.
Received: 26 September 2006
Revised and Accepted: 28 December 2007
Chelonian Conservation and Biology, 2008, 7(1): 118–119
� 2008 Chelonian Research Foundation
Observations on Terrestrial FeedingBehavior and Growth in Diamondback
Terrapin (Malaclemys) and Snapping Turtle(Chelydra) Hatchlings
JOSEPH J. KINNEARY1,2
1Department of Biology, Farmingdale State University of New York,
2350 Broadhollow Road, Farmingdale, New York 11735 USA
[[email protected]];2Our Lady of Mercy Academy, 815 Convent Road, Syosset,
New York 11791 USA
ABSTRACT. – Food acquisition, feeding, and growth inmoist terrestrial laboratory conditions were comparedin 2 species of turtles that inhabit brackish waterenvironments. Malaclemys hatchlings showed normalgrowth, but Chelydra hatchlings became severelystressed. The results suggest that the extended use ofterrestrial habitats as a means of osmoregulation inhigh salinity habitats is a viable adaptive strategy fordiamondback terrapin but not for snapping turtlehatchlings.
Osmotic stress, particularly on hatchlings, is an
important factor that determines the distribution of turtle
species in estuarine environments. Dunson (1985) found
that hatchling diamondback terrapins are unable to grow in
the high salinities found in the vicinity of many nesting
sites without periodic access to freshwater for drinking.
Kinneary (1993) reported that water salinity is a dominant
factor that limits snapping turtle distribution in estuaries
and that the turtles will, on occasion, use nesting sites at
which the nearest water is not suitable for hatchlings
because of high salinity (Kinneary 1996). Laboratory
studies conducted by Dunson (1985) and Dunson and
Mazzotti (1989) identified incidental swallowing of saline
water during feeding as the major source of sodium influx
in hatchling diamondback terrapins and a primary source
of salinity toxicity in hatchling snapping turtles kept in
50% sea water. Hatchlings of both species appear to make
use of terrestrial refugia (Pitler 1985; Lovich et al. 1991;
Buhlmann and Gibbons 2001), and adults have been
observed to feed on land (Pearse et al. 1925; Ernst et al.
1994). However, the ability of hatchlings to grow under
terrestrial conditions has not been considered. The
objective of this study was to observe and compare
feeding and growth of snapping turtle and diamondback
terrapin hatchlings under moist terrestrial conditions in the
laboratory.
Methods. — Turtle eggs were incubated at room
temperature in a sealed plastic container that contained
50% vermiculite and 50% distilled water by mass. Upon
hatching, 4 turtles of each species were placed in a
communal, covered, clear plastic container (57 3 24 3 18
cm) that contained 1 part sphagnum moss to 10 parts tap
water by mass. Additional water was subsequently added
periodically during the course of the experiment. An effort
was made to saturate the sphagnum moss without
providing any free water other than that formed from
condensation on the top and sides of the container. This
was done to minimize desiccation, yet, at the same time
not provide any free water to aid in the capture and
swallowing of food items. The sample size was limited
because of the difficulty in obtaining a variety of live-food
items small enough for newly hatched turtles to easily
handle. Food items were offered 5 to 7 times per week and
included a wide variety of live annelids, mollusks,
isopods, and insects, as well as chopped fish (Menidia)
and commercial pet food. Drinking water was not overtly
provided, however, the hatchlings did have access to water
droplets that continually formed on the sides of the
container. The animals were kept at room temperature
(21.6 6 1.38C). A light (Gro-Light, 75 W) was placed at
one end of the container. The photoperiod was 12L:12D.
Wet mass (WM) was recorded upon hatching and at
subsequent monthly intervals.
Results and Discussion. — All 4 diamondback
terrapin hatchlings (WM ¼ 5.4 6 0.2 g SD) began
accepting live food approximately 1 month after hatching,
and, during the third month, other foods, such as chopped
fish and commercial pet food, were readily accepted. They
ate voraciously whenever food was offered and appeared
to have no difficulty or hesitation in obtaining and
swallowing food in the absence of water. The turtles grew
at an average rate of 3.7% of their hatching WM/d over the
Table 1. Monthly growth of diamondback terrapin hatchlings(n ¼ 4) and snapping turtle hatchlings (n ¼ 4; in parenthesis)kept in the laboratory under moist terrestrial conditions. Mass ingrams. Values are means 6 SD.
Month Wet mass % Change wet mass
0 (hatching) 5.39 6 0.22 (7.63 6 0.20) —
2 5.09 6 0.40 (7.08 6 0.23) –5.57 (�7.21)3 7.24 6 1.51 (6.03)a 42.24 (�14.83)a,b
4 12.06 6 4.24 66.575 20.45 6 7.78 69.576 39.30 6 11.53 92.187 51.17 6 10.35 30.20
a n ¼ 2.b By month 3.5, 3 of 4 snapping turtle hatchlings had died after losingmore than 20% hatching wet mass.
118 CHELONIAN CONSERVATION AND BIOLOGY, Volume 7, Number 1 — 2008

230-day test period (Table 1). Straight-line carapace length
increased to 6.4 6 0.05 cm SD by the end of this period.
These data show that hatchling terrapins are capable of
normal growth (Ernst and Barbour 1972) when kept in the
laboratory under terrestrial conditions. It is suggested that,
in addition to their complex suite of behavioral and
physiological responses to high salinity environments
(summarized in Davenport et al. 2005), extended use of
terrestrial habitats by hatchlings and juveniles may be a
viable strategy for dealing with osmotic stress in the field.
As a group, the snapping turtle hatchlings lost 7.2%
WM after 60 days, compared with a WM loss of 5.57% for
the diamondback terrapin hatchlings over the same period.
By contrast, however, the snapping turtles showed little
interest in the variety of foods offered and were never
observed feeding. Three of 4 died after losing more than
20% of their initial WM during the first 3.5 months of the
experiment. The remaining animal, which appeared
severely stressed, was placed in enough tap water to cover
the carapace on day 113. This specimen immediately
accepted food after being placed in water and continued to
feed underwater, eventually regaining its vigor. Although
snapping turtle hatchlings can be induced to accept and
swallow food in the absence of water ( pers. obs.), the
results of this study suggest they are maladapted in terms
of food acquisition, feeding, and growth in terrestrial
habitats. When considering their high degree of water
permeability and evaporative water loss (Dunson 1986;
Finkler 2001), the extended use of even very moist
terrestrial habitats in high salinity environments is
probably not a realistic alternative for these animals.
Acknowledgments. — I would like to thank W.
Dunson, S. McDowell, and D. Wilhoft for comments on
an original draft of the manuscript. This work was drawn,
in part, from a dissertation submitted to Rutgers University
in partial fulfillment of the requirements for a PhD degree.
Partial funding was provided through grants from the
Lerner-Gray Fund for Marine Research, American
Museum of Natural History, and the James D. Anderson
Memorial Research Fund (Rutgers University). Comments
by Michael S. Finkler are greatly appreciated.
LITERATURE CITED
BUHLMANN, K.A. AND GIBBONS, J.W. 2001. Terrestrial habitat use
by aquatic turtles from a seasonally fluctuating wetland:implications for wetland conservation boundaries. ChelonianConservation and Biology 4(1):115–127.
DAVENPORT, J., GLASSPOOL, A.F., AND KITSON, L. 2005. Occur-rence of diamondback terrapins, Malaclemys terrapin, on
Bermuda: native or introduced? Chelonian Conservation andBiology 4(4):956–959.
DUNSON, W.A. 1985. Effects of water salinity and food saltcontent on growth and sodium efflux of hatchling diamond-
back terrapins. Physiological Zoology 58(6):736–747.DUNSON, W.A. 1986. Estuarine populations of the snapping turtle
(Chelydra) as a model for the evolution of marine adaptationsin reptiles. Copeia 3:741–756.
DUNSON, W.A. AND MAZZOTTI, F.J. 1989. Salinity as a limitingfactor in the distribution of reptiles in Florida Bay: a theory forthe estuarine origin of marine snakes and turtles. Bulletin ofMarine Science 44(1):229–244.
ERNST, C.H. AND BARBOUR, R.H. 1972. Turtles of the UnitedStates. Lexington, KY: University Press of Kentucky, 347 pp.
ERNST, C.H., LOVICH, J.E., AND BARBOUR, R.H. 1994. Turtles ofthe United States and Canada. Washington, D.C.: SmithsonianInstitution Press, 578 pp.
FINKLER, M.S. 2001. Rates of water loss and estimates of survivaltime under varying humidity in juvenile snapping turtles(Chelydra serpentina). Copeia 2:521–525.
KINNEARY, J.J. 1993. Salinity relations of Chelydra serpentina ina Long Island estuary. Journal of Herpetology 27:441–446.
KINNEARY, J.J. 1996. The origin of marine turtles: a pluralistic viewof evolution. Chelonian Conservation and Biology 2(1):73–78.
LOVICH, J.E., TUCKER, A.D., KLING, D.E., GIBBONS, J.W., AND
ZIMMERMAN, T.D. 1991. Behavior of hatchling diamondbackterrapins (Malaclemys terrapin) released in a South Carolinasalt marsh. Herpetological Review 22:81–83.
PEARSE, A.S., LEPKOVSKY, S., AND HINTZE, L. 1925. The growthand chemical composition of three species of turtles fed onrations of pure foods. Journal of Morphology and Physiology41(1):191–216.
PITLER, R. 1985. Malaclemys terrapin terrapin (Northerndiamondback terrapin). Behavior. Herpetological Review16(3):82.
Received: 28 August 2006
Revised and Accepted: 5 January 2008
Chelonian Conservation and Biology, 2008, 7(1): 119–124� 2008 Chelonian Research Foundation
Ecology of the Bushmanland Tent Tortoise(Psammobates tentorius verroxii)
in Southern Namibia
P.L. CUNNINGHAM1,3, AND A. SIMANG
2
1Department of Nature Conservation, Polytechnic of Namibia,
P/Bag 13388, Windhoek, Namibia
[[email protected]];2Department of Biology, Humboldt University, Berlin, Germany
[[email protected]]3Present Address: King Khalid Wildlife Research Center,
Thumamah, PO Box 61681, Riyadh, 11575, Saudi Arabia
ABSTRACT. – Tortoises are the group of reptiles mostunder threat in Namibia and are poorly researched,with little understanding of their basic ecology. Thispaper investigates some aspects of the ecology offemale Bushmanland tent tortoises (Psammobatestentorius verroxii) in southern Namibia, specificallytheir movement, home range, activity pattern, diet,resting site selection, and orientation.
The ecology of Psammobates tentorius verroxii is
poorly known (Boycott and Bourquin 2000), and despite
NOTES AND FIELD REPORTS 119

its wide range, it is not easily found and often occurs at
low densities (Branch 1989; Branch 1998). Virtually
nothing is known of the feeding habits of P. tentoriusverroxii; although, Branch (1998) stated that they are
known to feed on certain small succulents, and Boycott
and Bourquin (2000) included Mesembryanthemums and
Crassulas in their diet. Although the diet of a similar
species, P. oculiferus, has been published (Rall and Fairall
1993), this study on P. tentorius verroxii contributes to the
understanding of a generally poorly known southern
African tortoise and will assist with its protection.
Study Site. — This study was conducted between
February 2003 and August 2004 on the farm Velloor
approximately 80 km south of Karasburg and 20 km north
of the Orange River (288340S, 198110E, elevation 800 m)
in southern Namibia. Although the farm is 40,000 ha in
size, the tortoises were located and studied close to the
farm house in an area approximately 500 ha in size. The
general vegetation type is classified as Dwarf Shrub
Savanna (Giess 1971) or Nama Karoo biome (Lovegrove
1999) and is dominated by Stipagrostis species grasses,
Rhigozum trichotomum and Eriocephalus spp. shrubs, and
Acacia erioloba trees along the ephemeral drainage lines.
Annual precipitation occurs primarily as thundershowers
during summer months with an annual average rainfall of
50–100 mm (Van der Merwe 1983; Mendelsohn et al.
2002). Average daily minimum and maximum tempera-
tures for the coldest and hottest months range between 38–
48C and 368–378C, respectively (Van der Merwe 1983;
Mendelsohn et al. 2002). The dominant soils in the area
are eutric Leptosols with a low water holding capacity and
often subject to droughts (Mendelsohn et al. 2002).
Methods. — Four female tortoises were located on 28
February 2003 by scouring the general area specifically
targeting likely resting places. Radiotransmitters each
weighing 10 g (2% of average body weight) were attached
using glue and clear silicon to the side of the carapace so
as not to affect any mating attempts. Tortoises were visited
monthly (dependent on authors’ availability) to determine
home range with foraging observations being conducted
for a few days each month during the warmer months.
These transmitters were left on until 31 August 2004,
when they were removed.
Tortoise movement was estimated in 2 ways. The first
was during direct observations while conducting foraging
observations—i.e., the total distance traveled was mea-
sured with a measuring tape (m) after the tortoise had
become active until assuming a resting position. The
second was by plotting the positions of the resting
positions and then estimating the direct distance between
resting positions with the aid of a GPS.
The home range was determined by plotting the
positions of the resting places (/1, n ¼ 14; /2, n ¼ 28; /
3, n ¼ 26; and /4, n ¼ 16) with the aid of a GPS and then
using the Minimum Convex Polygon option in the animal
movement analysis ARCVIEW extension to determine the
home range.
Direct observations were conducted during summer
(i.e., when tortoises were most active—March, April,
September, October, November, and December 2003 and
January to April 2004) to determine their activity pattern.
They were also visited during the winter months, but very
little movement and activity was evident during this time.
Tortoise activity was categorized into active (moving and
foraging) versus passive (resting). The temperature was
measured at the start and end of a particular activity period
(during morning and afternoon observations) with a
thermometer at 30-cm height in the shade.
Daily foraging data (during morning and afternoon
observations) were obtained from one study animal at a
time after first locating the individual before it became
active and then following it throughout the day at a
distance of approximately 5 m. When a tortoise was
observed feeding, the plant species and number of bites
per species was recorded. Binoculars (8 3 40) were used
to facilitate observations. Plants utilized were immediately
identified where possible or samples collected for later
identification or verification. A total of 590 minutes (/
1 ¼ 10 days, /2 ¼ 22 days, /3 ¼ 28 days, and /4 ¼ 14
days) were spent on foraging observations.
Data on resting places (i.e., plant species or terrain
features used as shelter) and resting orientation were
collected throughout the year. The latter was included to
determine if tortoises were selecting for a certain
orientation for thermoregulatory purposes. A resting place
was classified as an ‘‘open area’’ if the tortoise was not
physically in contact with or underneath vegetation (i.e.,
. 10 cm away).
A rapid survey of the vegetation (species composi-
tion) was conducted within the general area utilized by the
tortoises by identifying plant species at 1-m intervals along
2 3 200 m transects in the area.
Results. — Four female P. tentorius verroxii were
followed from sunrise to sunset on 5 consecutive days
during 1–5 March 2003. During this period they moved an
average distance of 81.2 m (SD ¼ 71.57 m, range 6.5–190
m) and 91.1 m (SD ¼ 76.44 m, range 12–169 m) during
morning and afternoon observations, respectively. There
was a significant difference between morning and
afternoon foraging distances (one-way ANOVA, df ¼ 9,
F ¼ 0.05, p ¼ 0.84). The longest distances covered in a
session were 190 m (morning) and 169 m (afternoon). The
mean average distance (straight line) that the 4 females had
moved away from their respective release sites (i.e., after
fitting the transmitters) after a period of 18 months was
855 m (SD ¼ 642 m, range 350-1750 m). The mean
(n ¼ 82) average distance that the 4 females moved
between resting places was 100 m (SD ¼ 178 m, range
0–1117 m) with no significant difference observed
between individuals (one-way ANOVA, df ¼ 2,
F ¼ 2.18, p ¼ 0.096); although, the sample size was low.
The mean average home range as determined
throughout the study period (i.e., summer months, as
tortoises did not move much during the winter months) for
120 CHELONIAN CONSERVATION AND BIOLOGY, Volume 7, Number 1 — 2008

the 4 females with radiotransmitters (n ¼ 84 resting
places) was 31.97 ha. It is certain that some movements
were missed, but it was clear that the tortoises stayed
within a certain area and did not venture far from this area.
As a result of male tortoises not initially being found, no
formal study was conducted on them, but subsequent
limited data indicated a home range of 6.65 ha (SD: 4.5 ha)
(n ¼ 4) for males.
Nine tortoises observed (5 female and 4 male—
including the 4 radiotracked females originally located)
had a distinctive bimodal activity pattern during summer
with peak foraging activity between 0730 and 0900 hours
(Fig. 1). Foraging started and stopped during the morning
with mean ambient temperatures of 26.28C (SD ¼ 2.778C,
range 228–298C) and 29.48C (SD ¼ 2.418C, range 268–
328C), respectively. A lesser mode of activity was
observed in the afternoon between 1630 and 1900 hours
(Fig. 1). Foraging started and stopped during the afternoon
with mean ambient temperatures of 33.48C (SD ¼ 1.528C,
range 328–368C) and 30.28C (SD ¼ 1.488C, range 288–
328C), respectively.
The 4 female tortoises spent an average 72 minutes
(SD ¼ 38.9 minutes) and 51 minutes (SD ¼ 24.7 minutes)
active during morning and afternoon observations during
summer, respectively. No significant difference was
observed for time spent active between morning and
afternoon activity periods (one-way ANOVA, df ¼ 2,
F ¼ 1.05, p ¼ 0.36). Average activity levels during
summer over 24 hours were 8.5% active (AM ¼ 5% and
PM ¼ 3.5%) and 91.5% inactive. Winter activity levels
were almost nonexistent except during occasional fog
when tortoises became active.
A total of 18 different food items, of which 17 were
plant matter (the other item eaten included weathered
bone), were included in the diet of the 4 female tortoises
during summer observations.
Grasses were the most utilized food item as
determined by frequency of visit (51.2%) followed by
herbs, bulbs, and succulents (41.9%), trees and shrubs
(2.3%), other plant matter (2.3%), and bone (2.3%).
However, herbs, bulbs, and succulents were the most
utilized food item as determined by frequency of bite
(56.9%) followed by grasses (35.2%), other plant matter
(7.1%), bone (0.6%), and trees and shrubs (0.2%). The
most utilized plant species as determined by frequency of
visit were the grasses Stipagrostis obtusa and S. uniplumis,
followed by unidentifiable herb seedlings (Table 1). The
most sought after plant species determined by frequency of
bite were S. obtusa, Anacampseros albissima, unidentifi-
able herb seedlings, and Trachyandra saltii (Table 1). The
top 4 food items selected by the 4 female tortoises in terms
of frequency of visit/plant and frequency of bite/plant were
responsible for 74.4% and 71.3% of all the observations,
respectively (Table 1).
Eight tortoises observed (5 female and 3 male—
including the 4 females originally located) used a variety
of resting sites (Table 2) and included 15 shrub species, 3
tree species, and 2 grass species. Shrubs as resting places
were favored, followed by holes under trees and shrubs,
and thirdly under trees alone (Table 2). Resting places
used during this study indicated that 90.5% of the trees and
36.4% of the shrubs had thorns. Holes used as resting
places were almost exclusively (97%) located under
vegetation with thorns.
Tortoise orientation while in a resting place varied
between morning and afternoon during summer. Tortoise
orientation was mostly towards the north (41%, including
northeast and northwest) and east (32%, including
Figure 1. Activity pattern for 5 female and 4 male P. tentoriusverroxii during summer (i.e., warmer months: March, April,September, October, November, December 2003 and January toApril 2004) in southern Namibia (n ¼ 9).
Table 1. Food selection as determined by frequency of visit/plant and frequency of bite/plant for 4 female P. tentorius verroxii insouthern Namibia. All food items were available throughout the summer.a
SpeciesFrequency ofvisit/plant % Rank
Frequency ofbites/plant % Rank
Stipagrostis ciliate 4.7 6 1.2 8S. obtuse 25.6 1 22.9 1S. uniplumis 20.9 2 11.2 4Anacampseros albissima 2.3 7 12.9 2Bone 2.3 7 0.5 9Euphorbia sp. 9.3 4 11 5Rhigozum trichotomum 2.3 7 0.2 10Tribulus terrestris 7 5 8.8 6Trachyandra saltii 4.7 6 11.4 3Unidentifiable herb seedlings 18.6 3 12.9 2Unidentifiable windblown leaves and seeds 2.3 7 7 7
a Top 4 food items are bolded.
NOTES AND FIELD REPORTS 121

northeast and southeast) during morning observations
(Table 3 and Figure 2). Orientation during the heat of the
day (i.e. after the morning foraging period) was mainly in
an easterly and southerly direction (50%—including
northeast and southeast). These positions were usually
left during the afternoon foraging period with new resting
places located during the late afternoons. Orientation
during winter did not change during the day due to the
inactivity of the individuals during this period, with most
tortoises (60%) orientated towards the east (including
northeast and southeast) and north (Table 3).
The vegetation in the general area utilized by the
tortoises is dominated by perennial Stipagrostis grasses (S.obtusa, 30% and S. uniplumis, 12%) with only 6% of the
vegetation comprised of thorny species (Rhigozum tri-chotomum, 3.5%; Acacia mellifera, 2%, and Protaspar-agus ssp., 0.5%).
Discussion. — Female P. tentorius verroxii were
sedentary, as indicated by the distances covered while
foraging, distance from release site after 18 months,
distance moved between resting places, and home range
size. Foraging also does not occur on a daily basis during
the summer and is possibly influenced by food availability,
food consumed the previous day, and local environmental
conditions.
The activity pattern of P. tentorius verroxii was
typically bimodal and affected by ambient temperature.
Ramsay et al. (2002) indicated that Chersina angulata, a
tortoise common in the southwestern Cape in South
Africa, followed a bimodal activity pattern as an
adaptation to high ambient temperatures, an activity that
would assist the animal in maintaining its water balance.
Lambert (1981) stated that the activity mode of Testudograeca became bimodal when ambient temperatures rose
above 288C. Similarly, Kinixys spekii is inactive when
ambient temperatures exceed 298C (Hailey and Coulson
1996). This bimodal activity would thus be even more of
an advantage to P. tentorius verroxii from southern
Namibia due to the general higher average ambient
temperatures experienced there. Female P. tentoriusverroxii stop foraging and seek shade when mean ambient
temperatures reach 29.48C (SD ¼ 2.418C) during the
morning. This is slightly higher than documented for C.angulata from the southwestern Cape (28.78C) (Ramsay et
al. 2002) and in the eastern Cape (28.58C) (Els 1989).
Table 2. Resting sites during summer for 5 female and 3 male P.tentorius verroxii individuals in southern Namibia.
Species Observations %
TreesAcacia erioloba 4Acacia mellifera 17Boscia foetida 4Total 25 18.7
ShrubsAdenolobus gariepensis 4Eriocephalus sp. 3Galenia africana 3Kleinia longiflora 4Lycium sp. 6Malvacaea sp. 2Pentzia sp. 7Phyoptelum spinosum 2Protasparagus ssp. 1Rhigozum trichotomum 10Rhus undulata 1Salsola sp. 1Zygophylum rigidum 5Zygophylum rectofractum 3Aizoon schellenbergii 1Total 53 39.6
GrassesStipagrostis obtusa 3S. uniplumis 4Total 7 5.2
Open space 18 13.4In holeUnder Acacia mellifera 1Under Boscia foetida 1Under Lycium sp. 15Under Rhigozum trichotomum 14Total 31 23.1
134 100
Table 3. Orientation of the posterior part of the carapace of 5female and 4 male P. tentorius verroxii individuals in southernNamibia while resting.
Orientation AM PM
SummerNorth 22 11South 5 7East 17 12West 11 12Northeast 1 3Northwest 1 0Southeast 1 1Southwest 1 0
WinterNorth 1 1a
South 3 3a
East 3 3a
Northeast 1 1a
Southeast 2 2a
a Tortoises were inactive on the days that their orientations were recorded.
Figure 2. Orientation of the posterior part of the carapace of 5female and 4 male P. tentorius verroxii individuals duringsummer (AM and PM) in southern Namibia while resting(n ¼ 9).
122 CHELONIAN CONSERVATION AND BIOLOGY, Volume 7, Number 1 — 2008

Afternoon foraging usually ceased around sunset; al-
though, some individuals were observed still being active
after sunset. This probably occurs when extreme daytime
temperatures prevent tortoises from foraging before sunset.
During winter the 4 female P. tentorius verroxii were
not very active with the exception being during fog. On
one occasion when fog occurred during winter (9 August
2003) all 4 individuals were observed away from cover in
the open with a lot of local activity observed as indicated
by their tracks. This was possibly due to the tortoises ‘‘fog
collecting’’ as described by Branch (1998) and Boycott
and Bourquin (2000). Although fog incidences are
relatively infrequent in southern Namibia (5–10 days
annually) (Mendelsohn et al. 2002) the above-mentioned
activity indicates that P. tentorius verroxii may actively
utilize moisture from fog when available.
Holes were not utilized as hiding places by the 4
females under observation during winter as compared to
23.1% (n ¼ 31) of the total observations as resting places
during summer. Holes are possibly not as important for
thermoregulation during winter as during hot summer
days.
This study indicates a variety of plants being utilized
by female tortoises, including the importance of grasses in
their diet during periods of below-average rainfall. Rall
and Fairall (1993) confirmed the tendency to utilize
grasses during unfavorable periods for P. oculifer, a
similar-sized species also inhabiting dry areas in southern
Africa. Stipagrostis obtusa is the most important plant
species included in the diet of the 4 female P. tentoriusverroxii as observed by frequency/visit and frequency/bite.
This small perennial climax grass is one of the best grazing
grasses for livestock in the arid regions of southern Africa
(Van Oudtshoorn 1999) and has a relatively high nutritive
value. It remains relatively palatable and well utilized by
animals even when dry (Muller 1984). Herbs, bulbs, and
succulents are sought after as observed by frequency/bite.
The succulent Anacampseros albissima (known as ‘‘skil-
padkos’’—tortoise food in Afrikaans) and Trachyandrasaltii were the second and third most sought after plant
species as observed by frequency/bite, although not very
common throughout the area. These plants are usually
consumed entirely when encountered. It is suggested that
P. tentorius verroxii may feed more on annuals (e.g.,
forbs) when encountered, but due to low rainfall
throughout the study area/period, annuals were sparse,
and they thus had to utilize the available perennial grasses
more.
Tortoises utilized a variety of plants as shelters when
resting; although, thorny plants were used more often
(36% of shrubs and 84% of trees used as resting places are
thorny), which probably assists with defense and or
thermoregulation as most thorny plants also present better
shade (denser growth form, bigger leaves) during summer.
Furthermore, thorny plants make up a small percentage
(6%) of the vegetation in the general area utilized by the
tortoises, suggesting that these plants are selected. Holes
under bushes (23%) were also used, which would possibly
further assist with defense and thermoregulation. The use
of holes during this study was only observed during
summer during an exceptionally warm period with
daytime ambient temperatures reaching 408C. Branch
(1998) stated that tortoises are known to burrow into
sandy soil at the base of low shrubs emerging after the
onset of rains. The use of resting places (i.e., site selection)
and holes as resting places (i.e., to what extent are these
utilized, do they dig these themselves or utilize existing
holes) should be investigated further.
Orientation of the carapace during summer was
mainly in a northerly and easterly direction during
morning observations, which could suggest that P.tentorius verroxii position themselves when going into a
resting site the previous evening. This is probably to
enable them to reach an optimum temperature quickly
before the heat of the day to commence foraging while still
relatively cool in the morning. Orientation away from the
sun (i.e., easterly and southerly direction) during the heat
of the day is probably to avoid overheating during this
period. Orientation of the carapace during winter towards
the north and east (70%) is probably similar to that as
suggested during summer.
Although P. tentorius verroxii inhabits an extremely
marginal habitat in southern Namibia, the species seem
well adapted to handle the adverse environmental
conditions; although, the effect that climate change
(aridification) may have is unknown. However, the
relatively sedentary lifestyle, slow reproductive rate
(Branch 1998; Boycott and Bourquin 2000; Cunningham
et al. 2004), and anthropogenic factors (e.g., road kills and
habitat alteration by livestock overgrazing) makes the
species susceptible to local extinctions. Illegal collecting
and/or indiscriminate utilization by humans for food
exacerbates its fate and are thus condemned.
Acknowledgments. — Our sincere appreciation to the
Polytechnic of Namibia for their financial support, Nico
and Marne Strauss of the farm Velloor for their generous
hospitality, Ministry of Environment and Tourism for
issuing the research and collecting permit (No. 609/2002
and 719/2003), and the National Botanical Research
Institute for identifying some of the plant specimens.
Johan le Roux from the Ministry of Environment and
Tourism and Tony Robertson assisted with determining
home range.
LITERATURE CITED
BOYCOTT, R.C. AND BOURQUIN, O. 2000. The Southern African
Tortoise Book. Hilton, South Africa: O. Bourquin, 228 pp.
BRANCH, B. 1989. Psammobates tentorius (Tent Tortoise; Starred
Tortoise; Union Jack Tortoise). In: Swingland, I.R. and
Klemens, M.W. (Eds.). The Conservation Biology of
Tortoises. Occasional papers of the IUCN Species Survival
Commission (SSC) No.5. IUCN Species Survival Commis-
sion: Gland, Switzerland, 91–93 pp.
NOTES AND FIELD REPORTS 123

BRANCH, B. 1998. Field Guide to Snakes and other Reptiles ofSouthern Africa. Cape Town, South Africa: Struik Publishers(Pty) Ltd., 399 pp.
CUNNINGHAM, P.L., SIMANG, A., AND SCHLEICHER, A. 2004.
Testudinidae: Psammobates tentorius verroxii (Bushmanlandtent tortoise): clutch size. African Herp News 37:19–20.
ELS, S.F. 1989. Ecophysiological studies on the tortoise,Chersina angulata. PhD Dissertation, University of Port
Elizabeth, Port Elizabeth, South Africa.GIESS, W. 1971. A preliminary vegetation map of South West
Africa. Dinteria 4:1–114.
HAILEY, A. AND COULSON, I.M. 1996. Temperature and thetropical tortoise Kinixys spekii: constraints on activity leveland body temperature. Journal of Zoology 240:523–536.
LAMBERT, M.R.K. 1981. Temperature, activity and field sightingin the Mediterranean spur-thighed or common garden tortoiseTestudo graeca. Biological Conservation 21:39–54.
LOVEGROVE, B. 1999. The Living Deserts of Southern Africa.
Vlaeberg, South Africa: Fernwood Press, 224 pp.MENDELSOHN, J., JARVIS, A., ROBERTS, C., AND ROBERTSON, T.
2002. Atlas of Namibia. A Portrait of the Land and its People.Cape Town, South Africa: David Philip Publishers, 200 pp.
MULLER, M.A.N. 1984. Grasses of South West Africa/Namibia.Windhoek, Namibia: John Meinert Publishers (Pty) Ltd., 287pp.
RALL, M. AND FAIRALL, N. 1993. Diets and food preferences oftwo South African tortoises Geochelone pardalis andPsammobates oculifer. African Journal of Wildlife Research23(3):63–70.
RAMSAY, S.L., HOFMEYR, M.D., AND JOSHUA, Q.I. 2002. Activitypatterns of the angulate tortoise (Chersina angulata) onDassen Island, South Africa. Journal of Herpetology 36:169–176.
VAN DER MERWE, J.H. 1983. National Atlas of South West Africa.Windhoek, Namibia: National Book Printers, 113 pp.
VAN OUDTSHOORN, F. 1999. Guide to Grasses of Southern Africa.Pretoria, South Africa: Briza Publications, 288 pp.
Received: 9 March 2006
Revised and Accepted: 23 January 2008
Chelonian Conservation and Biology, 2008, 7(1): 124–128� 2008 Chelonian Research Foundation
Nesting Behavior in Three-Toed Box Turtles(Terrapene carolina triunguis) Following
Oxytocin-Induced Oviposition
JOHN L. CARR1, MARTHA ANN MESSINGER
2,
AND GEORGE M. PATTON2
1Department of Biology and Museum of Natural History, University
of Louisiana at Monroe, Monroe, Louisiana 71209-0520 USA
[[email protected]];22022 Gemini Drive, Bastrop, Louisiana 71220-3467 USA
ABSTRACT. – Between 1997 and 2001, we observednesting behavior following oxytocin-induced oviposi-tion in 10 three-toed box turtles. Oviposition precedednesting behavior by 0.5–17 days. Three turtles
oviposited subsequent clutches (without oxytocininduction) a mean of 30 days after the oxytocininjections but only 22 days after they constructedempty nests. The mean internesting interval was 21days between consecutive ovipositions without oxyto-cin induction by these 3 females in the same andsubsequent seasons.
Oxytocin is a hormone used to induce muscular
contractions of the oviduct in many reptiles. Oxytocin is
apparently not present in reptilian pituitaries, but the
presence of the hormones arginine vasotocin (AVT) and
mesotocin has been confirmed (see Ewert and Legler
[1978] and references therein). Oxytocin, AVT, and
mesotocin are all neurohypophysial polypeptides (La
Pointe 1977; Ewert and Legler 1978). Although AVT
and mesotocin appear to be the primary source of oxytocic
activity in turtles, oxytocin can be used to induce
oviposition in turtles, where it has been used extensively
in field and laboratory-based reproductive studies (Ewert
and Legler 1978; Congdon and Gibbons 1985; Feldman
2007) and in veterinary applications to relieve dystocia
(Highfield 1990, 1996; Frye 1991; Plumb 2002).
Nesting behavior has been observed in several turtle
species when gravid females were allowed access to a
suitable substrate following oxytocin injection (Ewert and
Legler 1978; Ewert 1979). Ewert and Legler (1978)
suggested oxytocin injection as a potentially useful means
of studying nesting behavior; although, they noted it was
erratic in occurrence, even with the same individuals. They
also noted one instance in which the injection of a
nongravid, female Rhinoclemmys pulcherrima led to
digging behavior. Subsequently, several reports of nesting
behavior occurring after oviposition was induced with
oxytocin have appeared, including in emydids, Chrysemyspicta (Iverson and Smith 1993) and Trachemys scriptaelegans (Tucker et al. 1995; Tucker 2000; Feldman 2007),
and Australian chelids (Chelodina expansa and Emydurasignata; McCosker 2002). This behavior has been reported
as occurring up to 2 weeks after induction with oxytocin in
T. scripta elegans (Feldman 2007), or 15 to 21 days in the
chelids (McCosker 2002).
During the course of reproductive studies of the three-
toed box turtle, Terrapene carolina triunguis, we were
able to make careful observations of nesting behavior after
oxytocin-induced oviposition. These observations, the first
for this species, were made in a relatively controlled
situation, as were those of Feldman (2007), rather than in
the field (Tucker et al. 1995; McCosker 2002).
Materials and Methods. — Between 1997 and 2001, 8
female T. carolina triunguis were collected from roads in
Louisiana and Arkansas. When found, the turtles were
returned to the lab in Monroe where they were palpated or
radiographed and determined to be gravid. Veterinary-
grade oxytocin (20 IU/mL) was administered intramuscu-
larly (thigh) at approximately 1–2 IU/50 g body weight as
124 CHELONIAN CONSERVATION AND BIOLOGY, Volume 7, Number 1 — 2008

recommended by Ewert and Legler (1978). The time of
injection was recorded to the nearest 5 minutes, after
which the turtle was placed in a bucket of water on a wire
mesh platform, which allowed us to collect the eggs
undamaged. Eggs were usually oviposited within 3–4
hours, but occasionally it was necessary to administer a
second dose of oxytocin (turtles 1 and 10). After egg
laying, females were maintained in the lab in a dry,
uncluttered plastic or cardboard container at room
temperature. Turtles 1–8 were released at our study site
2–6 days after oxytocin injection. The outdoor study site in
Bastrop, Louisiana is a 31 3 34 m semi-natural habitat
described in Messinger and Patton (1995). All females at
the study site received the same treatment in food, water,
and shelter allocation. Handling was kept to a minimum
except in case of illness or injury. Turtles were identified
by individual head, leg, and shell characteristics.
Also, 3 females residing at our Bastrop study site
developed dystocia (egg binding), providing the opportu-
nity for additional observations (one of these 3 was also
one of the original 8 wild-caught specimens—turtle 3).
When we suspected dystocia based on atypical behavior,
the turtle was confirmed to be gravid by radiograph and
administered oxytocin. The turtle then was returned
immediately to the outdoor enclosure where oviposition
took place.
During the nesting season, we made repeated trips
throughout the day, evening, and early hours of darkness
looking for signs of nesting. Most nesting takes place
beginning in late afternoon and evening, with completion
often occurring after dark. When signs of nesting were
observed, we made frequent visits to follow its progress.
The time when the female was noticed covering the nest
was recorded to the nearest 0.5 hour. Because of variation
in the duration of nest covering and since the entire nesting
sequence was not observed, the time to nest completion
may be short by as many as 2 hours. Elapsed time between
the oxytocin injection and nest covering was rounded to
the nearest half hour; this measure is used as an indication
of the degree of dissociation between the time of
oviposition and nest construction. Nest sites were marked
and excavated later. We excavated nest cavities to
ascertain the physical structure of the cavities, and to
document the presence of eggs. Dates of subsequent
nesting by these same females also were recorded.
Results. — Injection with oxytocin lead to oviposition
in all 11 cases involving 10 individual females, and this
was followed by typical nesting behavior, i.e., oviposition
and nesting behavior were not associated. Other than the
cases detailed here, nesting behavior and oviposition
always occur in association with one another. Data on
timing of injection and nesting are found in Table 1. The
range of values for elapsed time was from less than one
day (12 hours) to more than 17 days (417 hours) (mean¼191 hours [8 days]).
For the 8 wild-caught females, the elapsed time
between oxytocin injection and nest covering ranged from
131 to 417 hours (mean ¼ 234.5 hours [9.8 days]). This
elapsed time includes a mean of 3.1 days spent in the lab
before transfer to the study site during which time a
suitable nesting substrate was not available. The 3
dystocia-affected turtles (Table 1) had been residents of
the study site for at least a year. Although a suitable
nesting substrate was available immediately following
their oxytocin injection, none of the 3 dystocia-affected
females dug a nest in response to oxytocin induction; eggs
were deposited on the surface of the ground. The mean
elapsed time for these 3 was 76.0 hours (3.2 days) between
oxytocin administration and nest covering. The elapsed
time was significantly greater for the wild-caught group
than the dystocia group (t ¼ 3.011, p ¼ 0.024, df ¼ 6).
The nests of all oxytocin-injected females were typical
of nests constructed by gravid T. carolina triunguis,
including the duration of behaviors and the physical
dimensions of the nests. All nests were closed using
surface litter and soil from the excavated nest cavity
(Messinger and Patton 1995), but there were no eggs in the
nest. From the time of their arrival at the study site until
after nests were completed, the behavior of the 8 wild-
caught females was typical of gravid T. carolina triunguis,
Table 1. Timing of events related to oxytocin injections and nesting behavior in T. carolina triunguis.
Female no. Injection dateInjectiontime (h)
Date movedto study site
Date of emptynest construction
Time when coveringempty nest (h)
Elapsed time frominjection to covering (h)
Wild-caught group
1 10 Jun 1997 1555 12 Jun 16 Jun 1997 2200 150.52 18 Jun 1997 0950 22 Jun 26 Jun 1997 2330 206.03 3 Jun 1998 1430 5 Jun 8 Jun 1998 0130 131.04 13 Jun 1999 1350 16 Jun 20 Jun 1999 2130 176.05 30 Apr 2000 1230 4 May 12 May 2000 2300 295.06 25 Jun 2001 1530 1 Jul 6 Jul 2001 2300 271.57 18 Jun 2001 1025 20 Jun 5 Jul 2001 1930 417.08 10 Jul 2001 1400 12 Jul 19 Jul 2001 2300 225.0
Dystocia group
3 9 Aug 1997 1155 1989 9 Aug 1997 2330 12.09 29 Jun 2001 1300 1998 5 Jul 2001 1000 141.0
10 24 Jul 2001 1330 2000 27 Jul 2001 2330 75.0
NOTES AND FIELD REPORTS 125

as was that of the 3 dystocia-group females following
oxytocin-induced oviposition.
There were two other circumstances when dissocia-
tion between oviposition and nesting was observed. Turtle
9 excavated and covered a complete nest that had no eggs
while she was suffering from dystocia 4 days before she
received the oxytocin injection detailed in Table 1. One
other female (11) constructed and covered 7 empty nests
sequentially over a 2-year period in 1998 and 1999. She
was never observed to oviposit a clutch; although, in all
other respects, her nesting behavior appeared normal.
Nesting interval data for 3 of the wild-caught females
that oviposited a subsequent clutch in the same nesting
season as the oxytocin-induced oviposition are presented
in Table 2. The time between oxytocin-induced oviposi-
tion and subsequent oviposition averaged 30.0 days.
Internesting intervals calculated from the date of empty
nest construction (following the oxytocin-induced ovipo-
sition) to the subsequent nesting closely coincided with all
subsequent internesting intervals recorded for the 3
individuals (21.7 vs. 20.9 days).
Discussion. — Oviposition coinciding with nesting
behavior is well established in turtles, except for a few
species that oviposit without construction of a nest
(Kuchling 1999). The typical behavioral sequence includes
nest-site selection, nest-site preparation, egg-cavity con-
struction, oviposition, and nest covering (Ehrenfeld 1979;
Kuchling 1999). This behavioral sequence is associated
with a complex set of physiological events involving
gonadal hormones, neurohypophysial hormones, and
peripheral neuronal regulation (Feldman 2007). Sea turtles
are known to exhibit consecutive spikes of 2 neurohypo-
physial hormones, AVT and neurophysin, preceding two
prostaglandin peaks (PGF and PGE2) during oviposition
(Owens 1997; Kuchling 1999). The generality of this
specific series of physiological events with respect to turtle
oviposition is not established; although, it seems likely to
play a role in the highly stereotypical nesting behavior of
chelonians (Ehrenfeld 1979). For sea turtles that oviposit
multiple clutches in one season, ovulation of subsequent
clutches occurs within approximately 48 hours after
nesting and is correlated with surges of luteinizing
hormone and progesterone (Licht 1982; Owens 1997).
Administration of oxytocin to gravid T. carolinatriunguis led to atypical behavior in which oviposition and
nesting behaviors were decoupled, a phenomenon termed
‘‘false nesting’’ by Tucker et al. (1995). Rather than
coinciding, oviposition preceded nesting behavior by
anywhere from 12 to 417 hours, and the elapsed time
between these 2 events could be extended by withholding
a suitable nesting substrate (i.e., time spent in the lab).
These observations are in accord with previous reports for
deirochelyine emydids (Iverson and Smith 1993; Tucker et
al. 1995; Feldman 2007) and chelids (McCosker 2002),
and may indicate a susceptibility of many chelonians after
the administration of oxytocin. Tucker et al. (1995)
suggested that oxytocin induced the post-ovipositional
nesting behavior. We agree with McCosker (2002),
however, that this is not likely a cause and effect
relationship since the oxytocin concentration in the blood
should drop continuously post-injection as it is metabo-
lized by the liver and kidneys (Plumb 2002). In mammals,
the half-life of oxytocin is measured in minutes (Plumb
2002), yet we recorded elapsed times between oxytocin
injection and nesting behavior in hours and days.
The dissociation between oviposition and nesting
behavior following oxytocin injection indicates that a
complete sequence of nesting behavior is not dependent on
the presence of eggs in the oviduct(s), nor the actual
oviposition of eggs. Other than the 11 nesting events by 10
individuals reported here, 2 additional sets of observations
support this hypothesis (this is out of a total of 1060
nesting events by 79 females over an 11-year period,
1996–2006). In one case, a female with dystocia went
through an entire nesting behavioral sequence to produce
an empty nest before receiving oxytocin. Another female
maintained at the study site for several years appeared
physically and behaviorally normal and was never
administered oxytocin, yet she was observed on 7
occasions to exhibit a complete set of nesting behaviors
that lead to typical nest cavities but without eggs. She did
this at regular intervals typical of the interclutch interval
for T. carolina triunguis (Messinger and Patton 1995).
These observations support the hypothesis of McCosker
(2002) and Feldman (2007) that the ‘‘normal nesting-
related hormonal sequence’’ does not occur when oxytocin
is administered to obtain eggs, and thus the female returns
to the behavioral task of nesting at a later time when that
hormonal sequence can play out. Extension of this idea
suggests that subsequent clutches in the same nesting
season will be delayed by the elapsed time between
oxytocin administration and completion of the nesting
Table 2. Data on internesting intervals for wild-caught female T. carolina triunguis that oviposited a subsequent clutch in the sameseason as the oxytocin-induced clutch.
Female no.Date of nextoviposition
Interval since oxytocin-induced oviposition (d)
Interval since emptynest construction (d)
Subsequent intervals
Mean (d) SD n range (d)
2 13 Jul 1997 24 17 19.7 3.2 15 16–264 8 Jul 1999 25 18 23.0 6.3 5 18–346 5 Aug 2001 41 30 20.0 4.2 2 17–23
Total 30.0 21.7 20.9 16–34
126 CHELONIAN CONSERVATION AND BIOLOGY, Volume 7, Number 1 — 2008
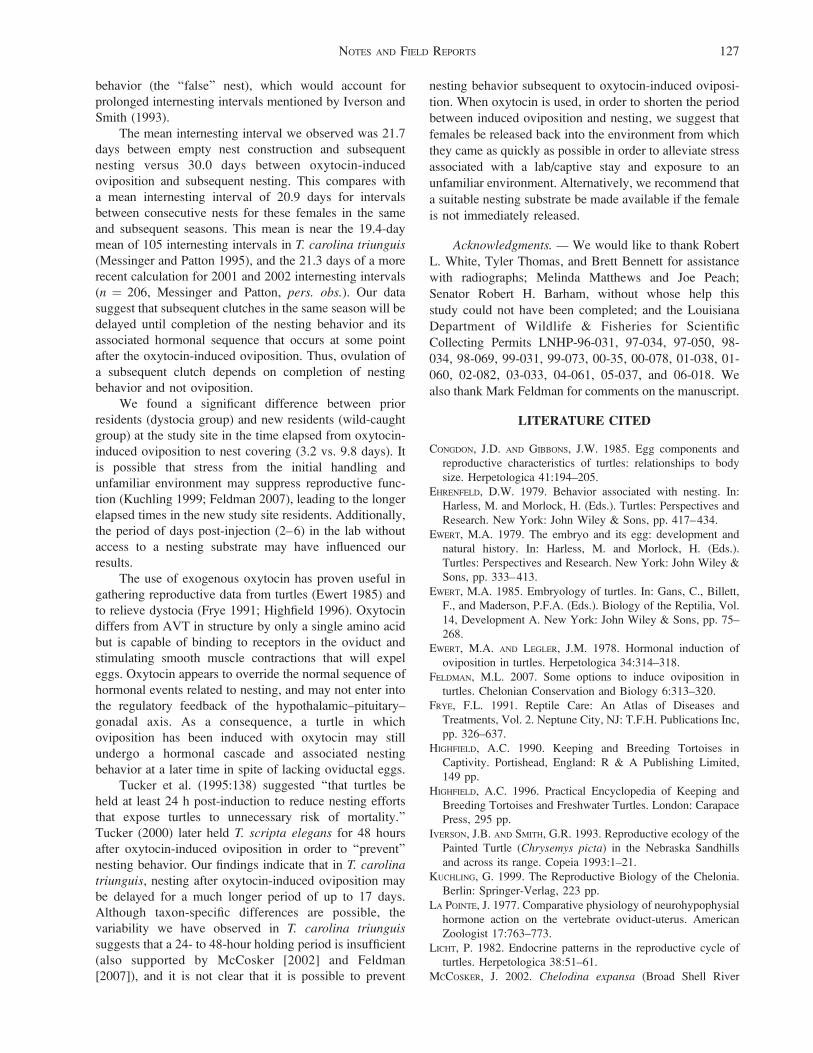
behavior (the ‘‘false’’ nest), which would account for
prolonged internesting intervals mentioned by Iverson and
Smith (1993).
The mean internesting interval we observed was 21.7
days between empty nest construction and subsequent
nesting versus 30.0 days between oxytocin-induced
oviposition and subsequent nesting. This compares with
a mean internesting interval of 20.9 days for intervals
between consecutive nests for these females in the same
and subsequent seasons. This mean is near the 19.4-day
mean of 105 internesting intervals in T. carolina triunguis(Messinger and Patton 1995), and the 21.3 days of a more
recent calculation for 2001 and 2002 internesting intervals
(n ¼ 206, Messinger and Patton, pers. obs.). Our data
suggest that subsequent clutches in the same season will be
delayed until completion of the nesting behavior and its
associated hormonal sequence that occurs at some point
after the oxytocin-induced oviposition. Thus, ovulation of
a subsequent clutch depends on completion of nesting
behavior and not oviposition.
We found a significant difference between prior
residents (dystocia group) and new residents (wild-caught
group) at the study site in the time elapsed from oxytocin-
induced oviposition to nest covering (3.2 vs. 9.8 days). It
is possible that stress from the initial handling and
unfamiliar environment may suppress reproductive func-
tion (Kuchling 1999; Feldman 2007), leading to the longer
elapsed times in the new study site residents. Additionally,
the period of days post-injection (2–6) in the lab without
access to a nesting substrate may have influenced our
results.
The use of exogenous oxytocin has proven useful in
gathering reproductive data from turtles (Ewert 1985) and
to relieve dystocia (Frye 1991; Highfield 1996). Oxytocin
differs from AVT in structure by only a single amino acid
but is capable of binding to receptors in the oviduct and
stimulating smooth muscle contractions that will expel
eggs. Oxytocin appears to override the normal sequence of
hormonal events related to nesting, and may not enter into
the regulatory feedback of the hypothalamic–pituitary–
gonadal axis. As a consequence, a turtle in which
oviposition has been induced with oxytocin may still
undergo a hormonal cascade and associated nesting
behavior at a later time in spite of lacking oviductal eggs.
Tucker et al. (1995:138) suggested ‘‘that turtles be
held at least 24 h post-induction to reduce nesting efforts
that expose turtles to unnecessary risk of mortality.’’Tucker (2000) later held T. scripta elegans for 48 hours
after oxytocin-induced oviposition in order to ‘‘prevent’’nesting behavior. Our findings indicate that in T. carolinatriunguis, nesting after oxytocin-induced oviposition may
be delayed for a much longer period of up to 17 days.
Although taxon-specific differences are possible, the
variability we have observed in T. carolina triunguissuggests that a 24- to 48-hour holding period is insufficient
(also supported by McCosker [2002] and Feldman
[2007]), and it is not clear that it is possible to prevent
nesting behavior subsequent to oxytocin-induced oviposi-
tion. When oxytocin is used, in order to shorten the period
between induced oviposition and nesting, we suggest that
females be released back into the environment from which
they came as quickly as possible in order to alleviate stress
associated with a lab/captive stay and exposure to an
unfamiliar environment. Alternatively, we recommend that
a suitable nesting substrate be made available if the female
is not immediately released.
Acknowledgments. — We would like to thank Robert
L. White, Tyler Thomas, and Brett Bennett for assistance
with radiographs; Melinda Matthews and Joe Peach;
Senator Robert H. Barham, without whose help this
study could not have been completed; and the Louisiana
Department of Wildlife & Fisheries for Scientific
Collecting Permits LNHP-96-031, 97-034, 97-050, 98-
034, 98-069, 99-031, 99-073, 00-35, 00-078, 01-038, 01-
060, 02-082, 03-033, 04-061, 05-037, and 06-018. We
also thank Mark Feldman for comments on the manuscript.
LITERATURE CITED
CONGDON, J.D. AND GIBBONS, J.W. 1985. Egg components and
reproductive characteristics of turtles: relationships to body
size. Herpetologica 41:194–205.
EHRENFELD, D.W. 1979. Behavior associated with nesting. In:
Harless, M. and Morlock, H. (Eds.). Turtles: Perspectives and
Research. New York: John Wiley & Sons, pp. 417–434.
EWERT, M.A. 1979. The embryo and its egg: development and
natural history. In: Harless, M. and Morlock, H. (Eds.).
Turtles: Perspectives and Research. New York: John Wiley &
Sons, pp. 333–413.
EWERT, M.A. 1985. Embryology of turtles. In: Gans, C., Billett,
F., and Maderson, P.F.A. (Eds.). Biology of the Reptilia, Vol.
14, Development A. New York: John Wiley & Sons, pp. 75–
268.
EWERT, M.A. AND LEGLER, J.M. 1978. Hormonal induction of
oviposition in turtles. Herpetologica 34:314–318.
FELDMAN, M.L. 2007. Some options to induce oviposition in
turtles. Chelonian Conservation and Biology 6:313–320.
FRYE, F.L. 1991. Reptile Care: An Atlas of Diseases and
Treatments, Vol. 2. Neptune City, NJ: T.F.H. Publications Inc,
pp. 326–637.
HIGHFIELD, A.C. 1990. Keeping and Breeding Tortoises in
Captivity. Portishead, England: R & A Publishing Limited,
149 pp.
HIGHFIELD, A.C. 1996. Practical Encyclopedia of Keeping and
Breeding Tortoises and Freshwater Turtles. London: Carapace
Press, 295 pp.
IVERSON, J.B. AND SMITH, G.R. 1993. Reproductive ecology of the
Painted Turtle (Chrysemys picta) in the Nebraska Sandhills
and across its range. Copeia 1993:1–21.
KUCHLING, G. 1999. The Reproductive Biology of the Chelonia.
Berlin: Springer-Verlag, 223 pp.
LA POINTE, J. 1977. Comparative physiology of neurohypophysial
hormone action on the vertebrate oviduct-uterus. American
Zoologist 17:763–773.
LICHT, P. 1982. Endocrine patterns in the reproductive cycle of
turtles. Herpetologica 38:51–61.
MCCOSKER, J. 2002. Chelodina expansa (Broad Shell River
NOTES AND FIELD REPORTS 127
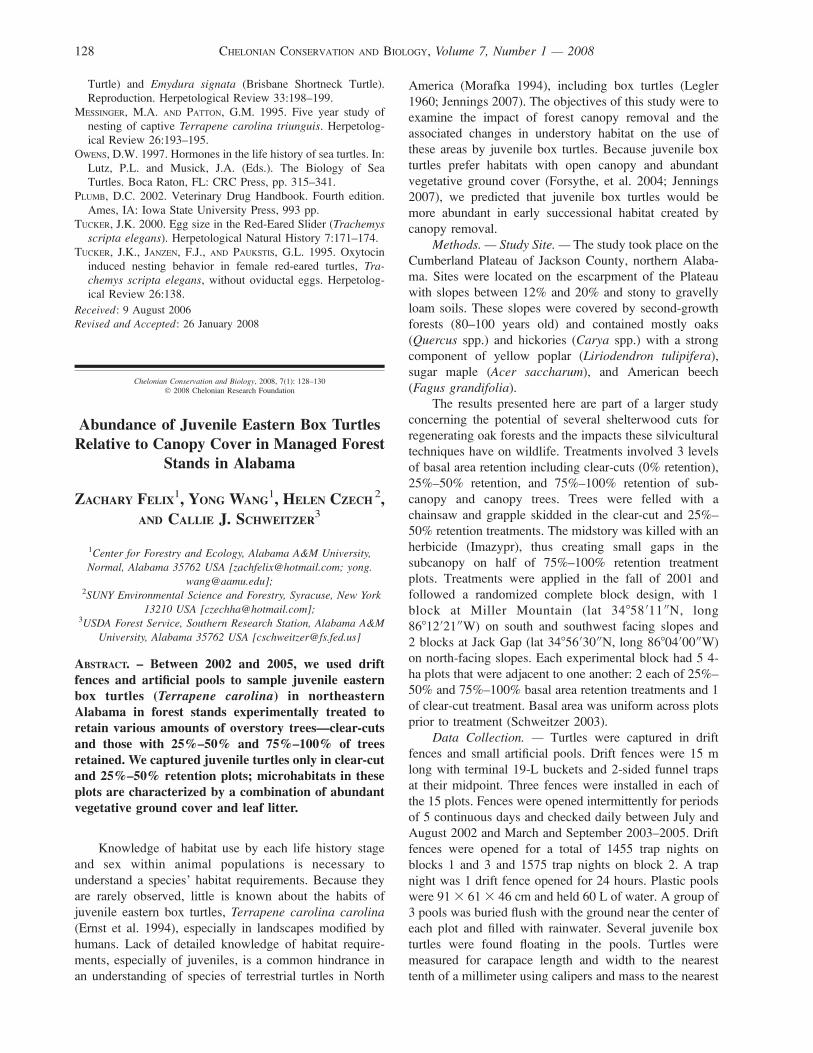
Turtle) and Emydura signata (Brisbane Shortneck Turtle).Reproduction. Herpetological Review 33:198–199.
MESSINGER, M.A. AND PATTON, G.M. 1995. Five year study of
nesting of captive Terrapene carolina triunguis. Herpetolog-ical Review 26:193–195.
OWENS, D.W. 1997. Hormones in the life history of sea turtles. In:
Lutz, P.L. and Musick, J.A. (Eds.). The Biology of SeaTurtles. Boca Raton, FL: CRC Press, pp. 315–341.
PLUMB, D.C. 2002. Veterinary Drug Handbook. Fourth edition.
Ames, IA: Iowa State University Press, 993 pp.
TUCKER, J.K. 2000. Egg size in the Red-Eared Slider (Trachemysscripta elegans). Herpetological Natural History 7:171–174.
TUCKER, J.K., JANZEN, F.J., AND PAUKSTIS, G.L. 1995. Oxytocin
induced nesting behavior in female red-eared turtles, Tra-chemys scripta elegans, without oviductal eggs. Herpetolog-
ical Review 26:138.
Received: 9 August 2006
Revised and Accepted: 26 January 2008
Chelonian Conservation and Biology, 2008, 7(1): 128–130� 2008 Chelonian Research Foundation
Abundance of Juvenile Eastern Box TurtlesRelative to Canopy Cover in Managed Forest
Stands in Alabama
ZACHARY FELIX1, YONG WANG
1, HELEN CZECH2,
AND CALLIE J. SCHWEITZER3
1Center for Forestry and Ecology, Alabama A&M University,
Normal, Alabama 35762 USA [[email protected]; yong.
[email protected]];2SUNY Environmental Science and Forestry, Syracuse, New York
13210 USA [[email protected]];3USDA Forest Service, Southern Research Station, Alabama A&M
University, Alabama 35762 USA [[email protected]]
ABSTRACT. – Between 2002 and 2005, we used driftfences and artificial pools to sample juvenile easternbox turtles (Terrapene carolina) in northeasternAlabama in forest stands experimentally treated toretain various amounts of overstory trees—clear-cutsand those with 25%–50% and 75%–100% of treesretained. We captured juvenile turtles only in clear-cutand 25%–50% retention plots; microhabitats in theseplots are characterized by a combination of abundantvegetative ground cover and leaf litter.
Knowledge of habitat use by each life history stage
and sex within animal populations is necessary to
understand a species’ habitat requirements. Because they
are rarely observed, little is known about the habits of
juvenile eastern box turtles, Terrapene carolina carolina(Ernst et al. 1994), especially in landscapes modified by
humans. Lack of detailed knowledge of habitat require-
ments, especially of juveniles, is a common hindrance in
an understanding of species of terrestrial turtles in North
America (Morafka 1994), including box turtles (Legler
1960; Jennings 2007). The objectives of this study were to
examine the impact of forest canopy removal and the
associated changes in understory habitat on the use of
these areas by juvenile box turtles. Because juvenile box
turtles prefer habitats with open canopy and abundant
vegetative ground cover (Forsythe, et al. 2004; Jennings
2007), we predicted that juvenile box turtles would be
more abundant in early successional habitat created by
canopy removal.
Methods. — Study Site. — The study took place on the
Cumberland Plateau of Jackson County, northern Alaba-
ma. Sites were located on the escarpment of the Plateau
with slopes between 12% and 20% and stony to gravelly
loam soils. These slopes were covered by second-growth
forests (80–100 years old) and contained mostly oaks
(Quercus spp.) and hickories (Carya spp.) with a strong
component of yellow poplar (Liriodendron tulipifera),
sugar maple (Acer saccharum), and American beech
(Fagus grandifolia).
The results presented here are part of a larger study
concerning the potential of several shelterwood cuts for
regenerating oak forests and the impacts these silvicultural
techniques have on wildlife. Treatments involved 3 levels
of basal area retention including clear-cuts (0% retention),
25%–50% retention, and 75%–100% retention of sub-
canopy and canopy trees. Trees were felled with a
chainsaw and grapple skidded in the clear-cut and 25%–
50% retention treatments. The midstory was killed with an
herbicide (Imazypr), thus creating small gaps in the
subcanopy on half of 75%–100% retention treatment
plots. Treatments were applied in the fall of 2001 and
followed a randomized complete block design, with 1
block at Miller Mountain (lat 34858 011 00N, long
8681202100W) on south and southwest facing slopes and
2 blocks at Jack Gap (lat 3485603000N, long 8680400000W)
on north-facing slopes. Each experimental block had 5 4-
ha plots that were adjacent to one another: 2 each of 25%–
50% and 75%–100% basal area retention treatments and 1
of clear-cut treatment. Basal area was uniform across plots
prior to treatment (Schweitzer 2003).
Data Collection. — Turtles were captured in drift
fences and small artificial pools. Drift fences were 15 m
long with terminal 19-L buckets and 2-sided funnel traps
at their midpoint. Three fences were installed in each of
the 15 plots. Fences were opened intermittently for periods
of 5 continuous days and checked daily between July and
August 2002 and March and September 2003–2005. Drift
fences were opened for a total of 1455 trap nights on
blocks 1 and 3 and 1575 trap nights on block 2. A trap
night was 1 drift fence opened for 24 hours. Plastic pools
were 91 3 61 3 46 cm and held 60 L of water. A group of
3 pools was buried flush with the ground near the center of
each plot and filled with rainwater. Several juvenile box
turtles were found floating in the pools. Turtles were
measured for carapace length and width to the nearest
tenth of a millimeter using calipers and mass to the nearest
128 CHELONIAN CONSERVATION AND BIOLOGY, Volume 7, Number 1 — 2008

tenth of a gram using Pesola spring scales, given a unique
notch on marginal scutes (Cagle 1939), and immediately
released at the site of capture.
The microhabitat features measured along 20-m line
transects at each drift fence location during late summer in
2002–2005 included percent cover of leaf litter, vegetative
ground cover, slash, and coarse woody debris and percent
canopy cover above 3 m. Microhabitat features were
averaged across sampling locations within each of the 15
plots and across years. We used analysis of variance
(ANOVA) to compare number of juvenile turtles captured
per trap night across treatment levels and Tukey tests to
separate means, with a , 0.10 accepted for significance.
We chose this relaxed a because of the low replication and
high levels of variation usually found in large-scale
ecological studies such as this one (deMaynadier and
Hunter 1995). Turtle captures were square-root trans-
formed to better meet assumptions of ANOVA (Zar 1999).
Results. — A total of 20 juvenile box turtles were
captured. Five of these were found in pools and 15 in drift
fences. No juvenile turtles were recaptured. Turtles ranged
between 31.5- and 112.9-mm carapace length and were
captured between April and September (Table 1). The
largest turtle included in these analyses approached the
carapace length of sexually mature males (Dodd 2004) but
showed no secondary sexual characteristics.
Relative abundance of juvenile box turtles differed
among treatments (F2,10¼ 14.08, p ¼ 0.001) and was
highest in clear-cut and 25%–50% retention treatments
(Fig. 1). No turtles were captured in the high-retention
treatment (75%–100% retention). Tree removal treatments
created a gradient from closed-canopy stands with low
coverage of vegetation, coarse woody debris, and slash to
open-canopy stands with dense understory vegetation,
slash, and woody debris at the ground level (Fig. 1). All
juvenile turtles were captured in open-canopy stands.
Discussion. — It appears that the relative abundance
of juvenile eastern box turtles is affected by canopy tree
removal. Juveniles were never captured or observed in
closed-canopy stands. The removal of more than 75%
overhead canopy resulted in the growth of a dense ground
covering (. 80%) of herbaceous and woody vegetation
and an increase in slash and coarse woody debris
associated with the cutting operations. At our sites, the
stand was thinned to at least 16 m2/ha (70 feet2/acre) of
basal area to achieve this level of canopy cover.
The relative abundance of juvenile turtles was related
to the increase in the habitat features described previously.
Although possibly a correlation, we hypothesize that the
treatments created suitable habitat for juvenile box turtles
by opening the forest canopy. Presence of juvenile box
turtles could be related to food resources: increased
production of vegetative growth is likely accompanied
by increased biomass of dietary items such as fruits and
leaves (Greenberg et al. 2007). In 2002, air temperatures
were on average 1.58C higher on clear-cuts than controls,
soil temperatures were 38C higher, and both showed a
positive gradient associated with increasing tree removal
(Felix et al. 2003). Increased heat and food availability
may be required to meet metabolic demands during the
rapid growth of early life stages (Dodd 2004). Alterna-
tively, increased numbers of juvenile turtles could be
related to cover requirements. Although juvenile box
turtles could find cover in the plentiful, deep leaf litter in
closed canopy, they may prefer a combination of litter and
the abundant vegetative ground cover, slash, and coarse
woody debris in cut plots. Juvenile Florida box turtles (T.c. bauri) used areas with thick understory vegetation and
leaf litter during movements (Jennings 2003) and were
found most frequently beneath dense understory vegeta-
tion under leaf litter or other organic debris (Jennings
2007). Hatchling eastern box turtles in Illinois were found
in an open-canopy grassy field with abundant herbaceous
and woody vegetation. Within these habitats, turtles
preferred microhabitats with less canopy closure and
herbaceous vegetation and more leaf litter than random
locations (Forsythe et al. 2004). Based on these observa-
tions, it appears that important features of juvenile box
turtle habitat include open canopy, abundant vegetative
ground cover, and leaf litter.
Table 1. Relative abundance and size (average 6 standard error) of juvenile eastern box turtles captured in Jackson County Alabama,2003–2005. None were captured in the 75%–100% canopy retention treatment.
Treatment Relative abundance (turtles/trap night) Carapace length (mm) Carapace width (mm) Mass (g)
Clear-cut 0.002 6 0.0008 48.2 6 5.0 42.2 6 4.1 24.4 6 9.825%–50% retention 0.001 6 0.0004 57.7 6 6.8 43.9 6 2.5 55.1 6 25.5
Figure 1. Relative abundance of juvenile box turtles capturedand percent cover of 5 microhabitat categories in each of 3 basalarea retention treatments 2002–2005, Jackson County, Alabama.Bars represent average number of juvenile turtles captured pertrap night, and lines show 4-year averages for percent cover ofmicrohabitat features. Error bars are 6 1 standard error.
NOTES AND FIELD REPORTS 129

This information is only 1 small puzzle piece in
determining habitat requirements of eastern box turtles.
For example, T. c. bauri show ontogenetic shifts in habitat
use (Hamilton 2000), and adult turtles use different habitat
than that of juveniles. Flitz and Mullin (2006) showed that
adult females use different habitat types while nesting than
in other seasons. At our study sites, canopy tree removal
increased the relative abundance of juveniles. Increased
relative abundance could be the result of differential
habitat use by nesting females or juveniles. Flitz and
Mullin (2006) showed that adult females tend to select
relatively open habitats while nesting than at other times.
If nesting habitat is limited in closed-canopy forests, tree
removal might increase recruitment by increasing avail-
ability of suitable nest sites. The amount of benefit gained
would depend, in part, on the balance of the amount of
open- and closed-canopy habitat required by juveniles and
adults and the interactions of these habitat types with other
demographic features of the population. For example,
edges created by forest openings support higher predator
populations such as raccoons (Dijak et al. 2000), leading to
greater predation on box turtle nests, juveniles, and adults
(Temple 1987) than in nonecotonal areas. Optimal size and
number of forest openings can be determined only with
additional information on habitat requirements and home
range size of adult and juvenile turtles as well as impacts
of openings on survival of all life stages.
Acknowledgments. — We would like to thank all who
helped in the field, including D. Lamfrom, C. Smith, and I.
Guenther. The research described in this paper has been
funded in part by the United States Environmental
Protection Agency (EPA) under the Greater Research
Opportunities Program. The EPA has not officially
endorsed this publication, and the views expressed
herein may not reflect the views of the EPA. This
manuscript was improved thanks to the comments of
Alison Hamilton Jennings, Steve Mullin, and C. Kenneth
Dodd. Thanks also to Mead for application of treatments
and access to lands and to the Alabama Department of
Conservation of Natural Resources and Stevenson Lands
Company for access to their lands.
LITERATURE CITED
CAGLE, F.R. 1939. A system for marking turtles for futureidentification. Copeia 1939:170–173.
DEMAYNADIER, P.G. AND HUNTER, M.L., JR. 1995. The relationshipbetween forest management and amphibian ecology: a review ofthe North American literature. Environmental Reviews 3:230–261.
DIJAK, W.D., THOMPSON, F.R., III, AND THOMPSON, F.R. 2000.
Landscape and edge effects on the distribution of mammalian
predators in Missouri. Journal of Wildlife Management 64(1):
209–216.
DODD, C.K., JR. 2004. North American Box Turtles: A Natural
History. Norman: University of Oklahoma Press, 231 pp.
ERNST, C.H., LOVICH, J.E., AND BARBOUR, R.W. 1994. Turtles of
the United States and Canada. Washington D.C.: Smithsonian
Institution Press, 578 pp.
FELIX, Z.I., WANG, Y., AND SCHWEITZER, C.J. 2003. Relationships
between herpetofaunal community structure and varying levels
of overstory tree retention in northern Alabama. In: Connor,
K.F. (Ed.). Proceedings of the 12th Biennial Southern
Silvicultural Conference. Gen. Tech. Rep. SRS-71. Asheville,
NC: US Department of Agriculture, Forest Service, Southern
Research Station, 7–10 pp.
FLITZ, B. AND MULLIN, S.J. 2006. Nest-site selection in the eastern
box turtle, Terrapene carolina carolina, in Illinois. Chelonian
Conservation and Biology 5:309–312.
FORSYTHE, P., FLITZ, B., AND MULLIN, S.J. 2004. Radiotelemetry
and post-emergent habitat selection of neonate box turtles
(Emydidae:Terrapene carolina) in Central Illinois. Herpeto-
logical Review 35(4):333–335.
GREENBERG, C.H., LEVEY, D.J., AND LOFTIS, D.L. 2007. Fruit
production in mature and recently regenerated forests of the
Appalachians. Journal of Wildlife Management 71(2):321–335.
HAMILTON, A.M. 2000. Evidence for ontogenetic shifts in box
turtles: activity patterns, movements, and use of microenvi-
ronments and habitats by juvenile Terrapene carolina bauri,on Egmont Key, Florida. MS Thesis, University of Florida,
Gainesville, FL.
JENNINGS, A.H. 2003. Daily and seasonal activity patterns and
movement of juvenile box turtles (Terrapene carolina bauri)on Egmont Key, Florida. Chelonian Conservation and Biology
4:578–587.
JENNINGS, A.H. 2007. Use of habitats and microenvironments by
juvenile Florida box turtles, Terrapene carolina bauri, on
Egmont Key. Herpetologica 63(1):1–10.
LEGLER, J.M. 1960. Natural history of the ornate box turtle,
Terrapene ornata ornata Agassiz. University of Kansas
Publications, Museum of Natural History 8:417–476.
MORAFKA, D.A. 1994. Neonates: missing links in the life histories
of North American tortoises. Fish and Wildlife Research 13:
161–174.
SCHWEITZER, C.J. 2003. First-year response of an upland
hardwood forest to five levels of overstory tree retention. In:
Connor, K.F. (Ed.). Proceedings of the 12th Biennial Southern
Silvicultural Research Conference. Gen. Tech. Rep. SRS-71.
Asheville, NC: US Department of Agriculture, Forest Service,
Southern Research Station, 287–291 pp.
TEMPLE, S.A. 1987. Predation on turtle nests increases near
ecological edges. Copeia 1987(1):250–252.
ZAR, J.H. 1999. Biostatistical Analysis. 4th edition. Upper Saddle
River, NJ: Prentice Hall.
Received: 6 September 2006
Revised and Accepted: 31 January 2008
130 CHELONIAN CONSERVATION AND BIOLOGY, Volume 7, Number 1 — 2008

Chelonian Conservation and Biology, 2008, 7(1): 131–135
� 2008 Chelonian Research Foundation
A Mitochondrial DNA Phylogeny of ExtantSpecies of the Genus Trachemys with
Resulting Taxonomic Implications
JACOB T. JACKSON1, DAVID E. STARKEY
2,
ROBERT W. GUTHRIE3, AND
MICHAEL R.J. FORSTNER1
1Biology Department, Texas State University, 601 University Drive,
San Marcos, Texas 78666 USA
[[email protected]; [email protected]];2Department of Biology, University of Central Arkansas, Conway,
Arkansas 72035 USA [[email protected]];3Guthrie Turtles, Birmingham, Alabama 35244 USA
ABSTRACT. – The phylogenetic relationships among taxawithin the emydid genus Trachemys have largelyremained unresolved. A 768-basepair fragment ofND4, as well as the histidine, serine, and leucine tRNAswere sequenced from 18 of 26 of the extant species andsubspecies of Trachemys. The aligned sequences wereanalyzed using maximum parsimony, maximum like-lihood, and Bayesian methods. The results support thetaxonomy of the genus as proposed by Seidel.
The genus Trachemys is a speciose group of turtles in
the family Emydidae. Species of this genus are spread
throughout North, Central, and South America as well as
the Caribbean Islands. Most members of this genus were
historically placed into the ambiguously defined T. scriptacomplex, which has been attributed to the fact that few
members of this genus are sympatric (Seidel 2002). More
recent studies have argued that some, if not many, of
these are likely to actually be species rather than
subspecies (Stephens and Wiens 2003). If the species
designation of many of the subspecies is correct, then the
interspecific relationships within this genus are largely
unresolved, and a more comprehensive phylogenetic
analysis of the genus is needed to resolve these issues
(Seidel et al. 1999; Seidel 2002). This is especially true in
the case of the T. scripta complex (Seidel et al. 1999;
Stephens and Wiens 2003). We use the taxonomy
proposed by Seidel (2002) to avoid confusion among
historical species and subspecies.
In this study, mitochondrial DNA sequence data from
the NADH 4 region and flanking tRNAs of 52 individuals
of 18 of the 26 extant species and subspecies in Trachemyswere analyzed by maximum parsimony, maximum
likelihood, and Bayesian analysis methods. Our explicit
goal was to provide an mtDNA phylogeny, which includes
sequence data for a majority of the currently described
taxa. Particular emphasis was given to the North American
species group, specifically the relationship and validity of
Trachemys gaigeae.
Methods. — Blood samples were collected from wild
caught, pet trade, and zoo animals by various individuals
(mainly MRJF, DES, and James Dixon; for a list of
specimens, see Appendix 1). Remaining blood and/or
DNA samples are in the MRJ Forstner Frozen Tissue
Collection at Texas State University San Marcos.
Blood was isolated from each individual and stored in
blood storage buffer (100 mM Tris pH 8.0, 100 mM
Na2EDTA, 10 mM NaCl, and 1% SDS) at �808C until
needed. DNA was extracted from blood using the
proteinase K protocol of Maniatis et al. (1982), as
modified by Hillis and Davis (1986). The primers used
in polymerase chain reaction amplification were obtained
from Arevalo et al. (1994). The primers ND4 and leucine
were chosen because they show a high degree of
conservation within turtle sequences. Additionally, this
region has been shown to be phylogenetically informative
in squamates (Arevalo et al. 1994; Forstner et al. 1995). A
992-basepair fragment of mtDNA was amplified by these
primers and contained the last 768 bases of the ND4 gene
and the tRNAs histidine, serine, and leucine. Sequencing
reactions were performed using the Applied Bio-Systems
(ABI) Dideoxy termination cycle sequencing kit in
conjunction with an ABI 373A automated sequencer.
All sequences were aligned using MacClade 4
(Madison and Madison 2003). All sequences from individ-
uals of the same species that were identical were collapsed
into a single sequence, again using MacClade. This resulted
in a data set of 54 individual sequences from 20 taxa. All
sequences used in this analysis were accessioned into NCBI
GenBank (see Appendix 1). A partition homogeneity test
was conducted using PAUP* 4b10 (Swofford 2002) to
determine if it would be necessary to partition the tRNAs
and the protein coding fragment of ND4. Modeltest 3.5
(Posada and Crandall 1998) was used to determine the
appropriate model of sequence evolution for this data set
under the Akaike Information Center (AIC) criteria (Posada
and Buckley 2004) with 4 different outgroup arrangements.
The outgroups tested were Testudo kleinmanni only;
Testudo and Pseudemys texana; Testudo, Heosemys,
Sacalia, and Callagur; and finally Pseudemys, Testudo,
Heosemys, Sacalia, and Callagur. Neighbor joining
analyses were conducted using Maximum Likelihood
Estimate (MLE) distance settings corresponding to the
results of the model selection process for each outgroup
arrangement, and the results were compared in order to
ascertain sensitivity of the data to outgroup selection. All 4
outgroup arrangements resulted in the selection of the same
model in Modeltest 3.5 (GTRþG) and produced analogous
neighbor joining topologies using MLE distances. Thus, the
data set was not sensitive to outgroup selection and a single
outgroup arrangement was chosen (Testudo kleinmanni and
Pseudemys texana), providing a distantly related taxon, as
well as a proximal sister taxon within the same family.
NOTES AND FIELD REPORTS 131
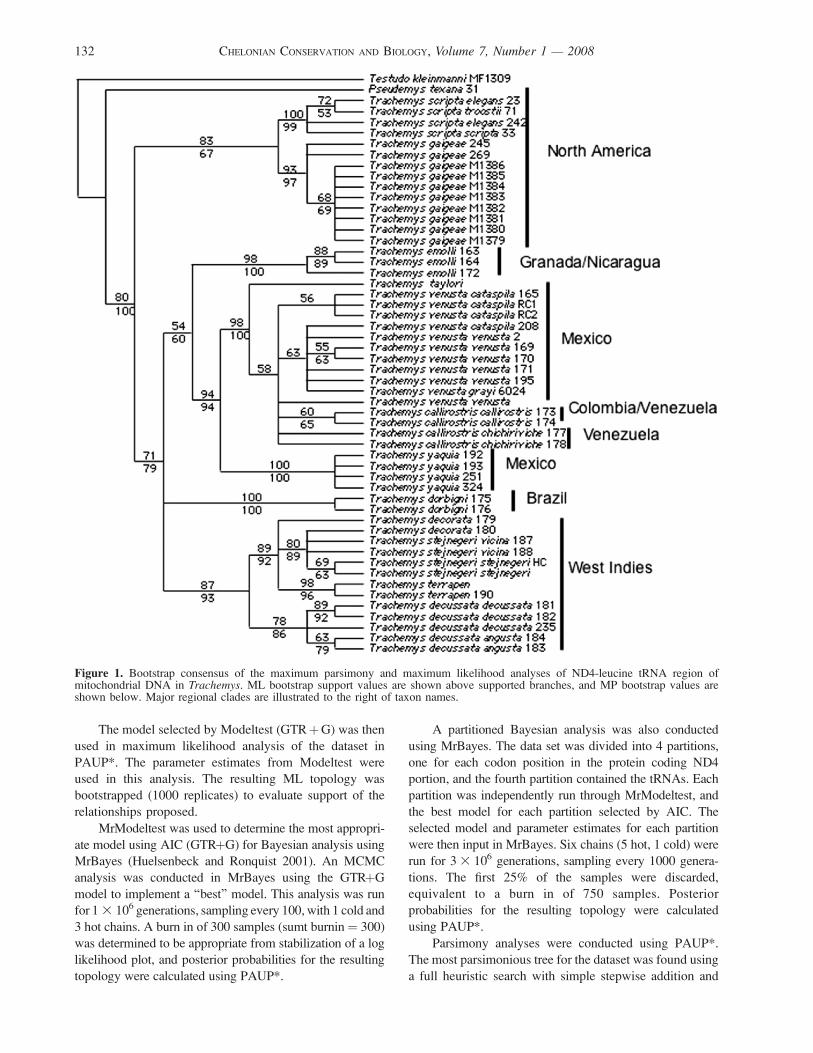
The model selected by Modeltest (GTRþG) was then
used in maximum likelihood analysis of the dataset in
PAUP*. The parameter estimates from Modeltest were
used in this analysis. The resulting ML topology was
bootstrapped (1000 replicates) to evaluate support of the
relationships proposed.
MrModeltest was used to determine the most appropri-
ate model using AIC (GTRþG) for Bayesian analysis using
MrBayes (Huelsenbeck and Ronquist 2001). An MCMC
analysis was conducted in MrBayes using the GTRþG
model to implement a ‘‘best’’ model. This analysis was run
for 1 3 106 generations, sampling every 100, with 1 cold and
3 hot chains. A burn in of 300 samples (sumt burnin¼ 300)
was determined to be appropriate from stabilization of a log
likelihood plot, and posterior probabilities for the resulting
topology were calculated using PAUP*.
A partitioned Bayesian analysis was also conducted
using MrBayes. The data set was divided into 4 partitions,
one for each codon position in the protein coding ND4
portion, and the fourth partition contained the tRNAs. Each
partition was independently run through MrModeltest, and
the best model for each partition selected by AIC. The
selected model and parameter estimates for each partition
were then input in MrBayes. Six chains (5 hot, 1 cold) were
run for 3 3 106 generations, sampling every 1000 genera-
tions. The first 25% of the samples were discarded,
equivalent to a burn in of 750 samples. Posterior
probabilities for the resulting topology were calculated
using PAUP*.
Parsimony analyses were conducted using PAUP*.
The most parsimonious tree for the dataset was found using
a full heuristic search with simple stepwise addition and
Figure 1. Bootstrap consensus of the maximum parsimony and maximum likelihood analyses of ND4-leucine tRNA region ofmitochondrial DNA in Trachemys. ML bootstrap support values are shown above supported branches, and MP bootstrap values areshown below. Major regional clades are illustrated to the right of taxon names.
132 CHELONIAN CONSERVATION AND BIOLOGY, Volume 7, Number 1 — 2008
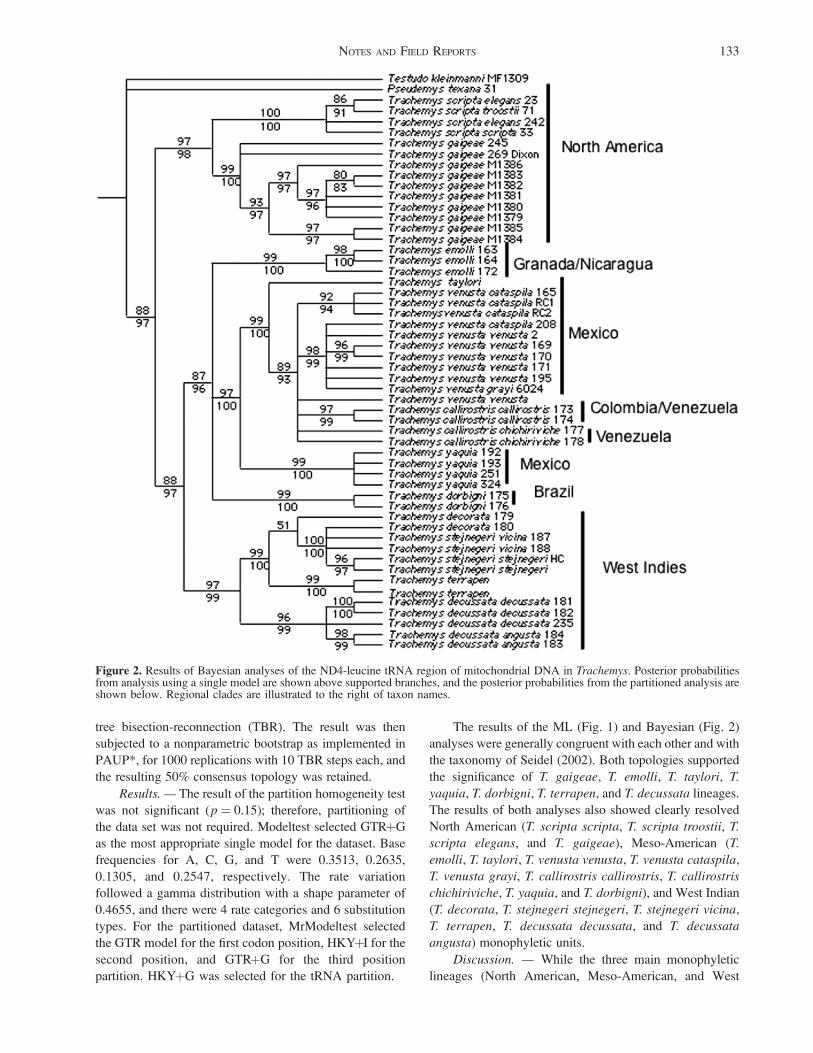
tree bisection-reconnection (TBR). The result was then
subjected to a nonparametric bootstrap as implemented in
PAUP*, for 1000 replications with 10 TBR steps each, and
the resulting 50% consensus topology was retained.
Results. — The result of the partition homogeneity test
was not significant (p ¼ 0.15); therefore, partitioning of
the data set was not required. Modeltest selected GTRþG
as the most appropriate single model for the dataset. Base
frequencies for A, C, G, and T were 0.3513, 0.2635,
0.1305, and 0.2547, respectively. The rate variation
followed a gamma distribution with a shape parameter of
0.4655, and there were 4 rate categories and 6 substitution
types. For the partitioned dataset, MrModeltest selected
the GTR model for the first codon position, HKYþI for the
second position, and GTRþG for the third position
partition. HKYþG was selected for the tRNA partition.
The results of the ML (Fig. 1) and Bayesian (Fig. 2)
analyses were generally congruent with each other and with
the taxonomy of Seidel (2002). Both topologies supported
the significance of T. gaigeae, T. emolli, T. taylori, T.
yaquia, T. dorbigni, T. terrapen, and T. decussata lineages.
The results of both analyses also showed clearly resolved
North American (T. scripta scripta, T. scripta troostii, T.
scripta elegans, and T. gaigeae), Meso-American (T.
emolli, T. taylori, T. venusta venusta, T. venusta cataspila,
T. venusta grayi, T. callirostris callirostris, T. callirostris
chichiriviche, T. yaquia, and T. dorbigni), and West Indian
(T. decorata, T. stejnegeri stejnegeri, T. stejnegeri vicina,
T. terrapen, T. decussata decussata, and T. decussata
angusta) monophyletic units.
Discussion. — While the three main monophyletic
lineages (North American, Meso-American, and West
Figure 2. Results of Bayesian analyses of the ND4-leucine tRNA region of mitochondrial DNA in Trachemys. Posterior probabilitiesfrom analysis using a single model are shown above supported branches, and the posterior probabilities from the partitioned analysis areshown below. Regional clades are illustrated to the right of taxon names.
NOTES AND FIELD REPORTS 133
Indian) apparent in the results of these analyses are
generally consistent with the results of other studies (Seidel
2002; Stephens and Wiens 2003), there are some incon-
gruences regarding the relationships among some species.
The analysis of Stephens and Wiens (2003) placed T.gaigeae in a clade with species from South America and
Mexico, while our analysis places this taxon as more
closely related to the North American T. scripta complex,
and as part of the monophyletic North American lineage.
Our placement of T. gaigeae is strongly supported by both
the MP and ML bootstrap values and Bayesian posterior
probabilities from both partitioned and nonpartitioned
analyses (Figs. 1 and 2).
Together with the concept of the evolutionarily
significant unit (Ryder 1986; Moritz 1994), which in
some cases is the equivalent of a ‘‘species’’ (Moritz 1994),
our analysis supports the species status of T. gaigeae as
proposed by several authors (Weaver and Rose 1967;
Ward 1984; Seidel et al. 1999; Seidel 2002). Our intention
here, however, is to recognize this lineage as unique and
worthy of treatment as a unit for conservation, rather than
contribute to the overabundance of literature arguing the
appropriate criteria for species definition.
Our study failed to resolve the T. venusta and T.callirostris species complexes of Seidel (2002). However,
the lack of phylogenetic resolution does not provide an
inherent default hypothesis, and therefore Seidel’s taxon-
omy is provisionally retained as we feel that this makes the
most use of all available data. These ambiguous
relationships may eventually be resolved as more data
are collected and analyzed.
In conclusion, it appears that when mtDNA data are
considered, the taxonomy of Trachemys proposed by
Seidel (2002) is the most reasonable for the genus. The
proposed species status of T. gaigeae (Weaver and Rose
1967; Ward 1984; Seidel et al. 1999; Seidel 2002) is also
supported by our data. In our evaluation of the specific
status for this taxon, we have sought to use historical
evaluations in conjunction with supported results from our
current mtDNA hypothesis. In our support for T. gaigeae,
we explicitly acknowledge our failure to more broadly
evaluate the remaining potential evolutionarily significant
units within this genus (Moritz 1994). This decision was
made in keeping with the recent voucher paper (Lehn et al.
2007) in which we agree that significant systematic
decisions should not be completed in the absence of
traditional voucher specimens. We would still suggest,
however, that the proposed taxonomy of Seidel (2002)
represents the best current working taxonomy of Tra-chemys. This taxonomic arrangement does the most to
preserve the diversity contained within the genus by
recognizing diagnosable lineages as unique.
Acknowledgments. — We would like to thank Francis
Rose, Todd Swannack, B. Shaffer, and J. Parham for
review, comments, and suggestions used in the
manuscript. We also thank S.K. Davis and T. Guerra for
their long support of this project. We sincerely appreciate
the efforts by those maintaining many of these taxa over
many years in captivity, allowing us access to those
collections, and their helpful discussions on the
systematics of these animals. Finally, without the
assistance and collaboration of the Texas Cooperative
Wildlife Collection, Texas Parks and Wildlife Department,
and New Mexico Department of Game and Fish we could
not have completed the work. This work was supported in
part by funding from the United States Geological Survey
and the National Park Service to MRJF.
LITERATURE CITED
AREVALO, E., DAVIS, S.K., AND SITES, J.W. 1994. Mitochondrial
DNA sequence divergence and phylogenetic relationshipsamong eight chromosome races of the Sceloporous grammicus(Phrynosomatidae) in Central Mexico. Systematic Biology 43:
387–418.
FORSTNER, M.R.J., DAVIS, S.K., AND AREVALO, E. 1995. Support
for the hypothesis of Anguimorph ancestry for the suborder
Serpentes from phylogenetic analysis of mitochondrial DNA
sequences. Molecular Phylogenetics and Evolution 4:93–102.
HILLIS, D.M. AND DAVIS, S.K. 1986. Evolution of ribosomal
DNA: fifty million years of recorded history in the frog genus
Rana. Evolution 40:1275–1288.
HUELSENBECK, J.P. AND RONQUIST, F. 2001. MRBAYES: bayesianinference of phylogenetic trees. Bioinformatics 17:754–755.
LEHN, C., DAS, I., FORSTNER, M.R.J., AND BROWN, R.M. 2007.
Responsible vouchering in turtle research: an introduction and
recommendations. Chelonian Research Monographs 4:
147–156.
MADISON, W.P. AND MADISON, D.R. 2003. MacClade 4: Analysis
of phylogeny and character evolution. Version 4.06. Sunder-
land, MA: Sinauer Associates, 503 pp.
MANIATIS, T., FRITSCH, E.F., AND SAMBROOK, J. 1982. Molecular
cloning: a laboratory manual. Cold Spring Harbor, NY: Cold
Spring Harbor Press, 545 pp.
MORITZ, C. 1994. Defining evolutionary significant units for
conservation. Trends in Ecology and Evolution 9:373–375.
POSADA, D. AND BUCKLEY, T.R. 2004. Model selection and model
averaging in phylogenetics: advantages of Akaike InformationCriterion and Bayesian approaches over likelihood ratio tests.
Systematic Biology 53:793–808.
POSADA, D. AND CRANDALL, K.A. 1998. Modeltest: testing the
model of DNA substitution. Bioinformatics 14:817–818.
RYDER, O. 1986. Species conservation and systematics: the
dilemma of subspecies. Trends in Ecology and Evolution 1:
9–10.
SEIDEL, M.E. 2002. Taxonomic observations on extant species
and subspecies of slider turtles, genus Trachemys. Journal of
Herpetology 36:285–292.
SEIDEL, M.E., STUART, J.N., AND DEGENHARDT, W.G. 1999.
Variation and species status of slider turtles (Emydidae:
Trachemys) in the Southwestern United States and adjacent
Mexico. Herpetologica 55:470–487.
STEPHENS, P.R. AND WIENS, J.J. 2003. Ecological diversification
and phylogeny of emydid turtles. Biological Journal of theLinnean Society 79:577–610.
SWOFFORD, D.L. 2002. PAUP*: phylogenetic analysis using
parsimony (*and other methods), v4.10b. Sunderland, MA:
Sinauer, 140 pp.
134 CHELONIAN CONSERVATION AND BIOLOGY, Volume 7, Number 1 — 2008

WARD, J.P. 1984. Relationships of chrysemyd turtles of North
America (Testudines: Emydidae). Special Publications The
Museum Texas Tech University 21:1–50.
WEAVER, W.G. AND ROSE, F.R. 1967. Systematics, fossil history,
and evolution of the genus Chrysemys. Tulane Studies in
Zoology 14:63–73.
Received: 21 March 2007
Revised and Accepted: 1 February 2008
Appendix 1. Specimen data for all taxa. Texas samples were collected under permission of the Texas Parks and Wildlife DepartmentSPR-0290–022. Captive samples maintained under ESC8945 (PC1) and Tennessee collection made under license 2504378. Livingvoucher material will be deposited into the Texas Cooperative Wildlife Collection (Texas A&M University) as available after normalmortality of the individuals.
Name
GenBankaccession no. Location Collection Museum no.
Pseudemys texana 31 DQ338475 Colorado R., Travis Co., TX Texas CooperativeWildlife Collection
TCWC 72324
Trachemys decorata 179 DQ338515 Pet trade Private collection 1 Living voucherT. decorata 180 DQ338516 Pet trade Blood onlyT. decussata angusta 183 DQ388521 Grand Cayman Released Photo voucherT. decussata angusta 184 DQ388520 Grand Cayman Released Photo voucherT.s decussata decussata 181 DQ338517 Pet trade Private collection 1 Living voucherT. decussata decussata 182 DQ338518 Pet trade Private collection 1 Living voucherT. decussata decussata 235 DQ338519 Pet trade Blood onlyT. dorbigni 175 DQ338513 Uruguay Private collection 1 Living voucherT. dorbigni 176 DQ338514 Uruguay Private collection 1 Living voucherT. gaigeae 245 DQ338480 Rio Grande R., Dona Ana Co., NM Texas Cooperative
Wildlife CollectionTCWC 72425
T. gaigeae 269 DQ338481 Rio Grande R., Dona Ana Co., NM Texas CooperativeWildlife Collection
TCWC 86270
T. gaigeae M1379 DQ338489 Black Gap WMA, Brewster Co., TX Released Photo voucherT. gaigeae M1380 DQ338488 Black Gap WMA, Brewster Co., TX Released Photo voucherT. gaigeae M1381 DQ338487 Black Gap WMA, Brewster Co., TX Released Photo voucherT. gaigeae M1382 DQ338486 Black Gap WMA, Brewster Co., TX Released Photo voucherT. gaigeae M1383 DQ338485 Black Gap WMA, Brewster Co., TX Released Photo voucherT. gaigeae M1384 DQ338484 Black Gap WMA, Brewster Co., TX Released Photo voucherT. gaigeae M1385 DQ338483 Black Gap WMA, Brewster Co., TX Released Photo voucherT. gaigeae M1386 DQ338482 Black Gap WMA, Brewster Co., TX Released Photo voucherT. callirostris callirostris 173 DQ338504 Pet trade Private collection 1 Living voucherT. callirostris callirostris 174 DQ338505 Pet trade Private collection 1 Living voucherT. venusta cataspila 165 DQ338494 Northern Mexico Private collection 1 Living voucherT. venusta cataspila 208 DQ338495 Northern Mexico Private collection 1 Living voucherT. venusta cataspila RC1 DQ338496 Unknown Blood onlyT. venusta cataspila RC2 DQ338497 Unknown Blood onlyT. callirostris chichiriviche 177 DQ338506 Venezuela Private collection 1 Living voucherT. callirostris chichiriviche 178 DQ338507 Venezuela Private collection 1 Living voucherT. scripta elegans 23 DQ338476 Rio Grande R., Cameron Co., TX Texas Cooperative
Wildlife CollectionTCWC 72426
T. scripta elegans 242 DQ338477 Rio Grande R., Cameron Co., TX Photo voucherT. emolli 163 DQ338490 Pet trade Private collection 1 Living voucherT. emolli 164 DQ338491 Pet trade Private collection 1 Living voucherT. emolli 172 DQ338492 Panama Private collection 1 Living voucherT. scripta scripta 33 DQ338478 Flint R., Dougherty Co., GA Texas Cooperative
Wildlife CollectionTCWC 72278
T. scripta troostii 71 DQ338479 Tennessee R., Bradley Co., TN Blood onlyT. venusta venusta 169 DQ338500 Cozumel, Mexico Private collection 1 Living voucherT. venusta venusta 170 DQ338501 Lake Bacalar, Belize Private collection 1 Living voucherT. venusta venusta 171 DQ338502 Lake Bacalar, Belize Private collection 1 Living voucherT. venusta venusta 195 DQ338503 New River, Belize Private collection 1 Living voucherT. yaquia 192 DQ338509 Mexico Private collection 1 Living voucherT. yaquia 193 DQ338510 Mexico Private collection 1 Living voucherT. yaquia 251 DQ338511 Mexico Private collection 2 Living voucherT. venusta grayi 6024 DQ338508 Unknown Blood onlyT. stejnegeri stejnegeri DQ338527 Caguas, Puerto Rico Private collection 1 Living voucherT. stejnegeri stejnegeri HC DQ338526 Caguas, Puerto Rico Private collection 2 Living voucherT. stejnegeri vicina 187 DQ338524 San Domingo, Dominican Republic Private collection 1 Living voucherT. stejnegeri vicina 188 DQ338525 San Domingo, Dominican Republic Private collection 1 Living voucherT. taylori DQ338493 Unknown Private collection 2 Living voucherT. terrapen DQ338522 Ocho Rios, Jamaica Private collection 1 Living voucherT. terrapen 190 DQ338523 Ocho Rios, Jamaica Private collection 1 Living voucherT. venusta venusta DQ338498 New River, Belize Blood onlyT. venusta venusta 2 DQ338499 New River, Belize Blood onlyT. yaquia 324 DQ338512 Mexico Private collection 2 Living voucher
NOTES AND FIELD REPORTS 135
Chelonian Conservation and Biology, 2008, 7(1): 136–141
� 2008 Chelonian Research Foundation
Dietary Observations on the Asian SoftshellTurtle (Amyda cartilaginea) from Sarawak,
Malaysian Borneo
KAREN A. JENSEN1
AND INDRANEIL DAS1
1Institute of Biodiversity and Environmental Conservation,
Universiti Malaysia Sarawak, 94300, Kota Samarahan, Sarawak,
Malaysia [kitti_ [email protected]; [email protected]]
ABSTRACT. – We examined the diet of Amyda cartilagi-nea from 2 localities in Sarawak: Loagan BunutNational Park and Balai Ringin. The most commonlyfound items in stomach contents, when using percent-age frequency of occurrence, were plant material(77%) and unknown vertebrate parts (55%). Fecalanalysis indicated similar results: plant material(100%), unknown vertebrate parts (84%), fish (69%),and unknown arthropods (62%). Results indicate thatA. cartilaginea is an opportunistic omnivore.
The Asian softshell turtle (Amyda cartilaginea) is a
large, locally widespread trionychid from the lowlands of
tropical Southeast Asia (Fig. 1). Its currently known range
is from northeast India; Myanmar; Thailand; Laos;
Vietnam; Cambodia; Malaysia; Singapore; Indonesia;
and the islands of Borneo, Sumatra, Java, Lombok,
Sulawesi; and some of the smaller associated islands
(Ernst and Barbour 1989; Cox et al. 1998; Lim and Das
1999; Pawar and Choudhury 2000). In Sarawak, on
Malaysian Borneo, A. cartilaginea inhabits a variety of
freshwater types, including clear or muddy rivers, lowland
peat swamps, ponds, and irrigation canals (Lim and Das
1999).
Little is known about the natural history of A.cartilaginea, and information on its diet is largely
anecdotal. As part of a larger ecological study of
freshwater turtles of Sarawak, information on the diet of
this species was obtained from stomach contents and feces.
The primary study area was Loagan Bunut National Park
(coordinates for the park headquarters are at lat 038440N,
long 11480901700E; datum wgs84), located in the northern
part of Sarawak. Field work was concentrated at the park
(description of area and its herpetofauna in Das and Jensen
2006). In addition, 2 visits were made to Balai Ringin (lat
018030N, long 1108450E), a fishing village ca. 2-hour drive
from Kuching, Sarawak’s capital city. Both sites are
located within peat swamp forests. Loagan Bunut National
Park contains the only freshwater floodplain lake in
Sarawak (Sayer 1991), and encompasses 650 ha2 at its
maximum level. The lake is completely dry during periods
of prolonged drought. The lake dries up annually, between
3 and 6 times, usually in the months of February, May, and
June.
Methods. — The study described here was conducted
between May 2004 and April 2005. A variety of collecting
techniques, as previously described for freshwater turtles
in the literature, were attempted to see which was the most
effective for capturing A. cartilaginea. Hoop traps,
commonly used to catch freshwater turtles in the Western
hemisphere (Frazer et al. 1990; Legler 1960; Vogt 1980)
were used. Native hoop traps, called bubu, were also used,
in addition to another local fishing device called a
selembau, which comprised a special system of scoops
and nets attached to long poles. The device is stretched
across a river or stream, scooping up whatever comes into
contact with it (Fig. 2). Manual capture, otherwise known
as muddling (Cagle 1942), was an effective albeit labor-
intensive method of capturing softshell turtles. The
technique involves wading through streams and probing
areas of sand or mud and among roots with a stick, hands,
or feet and could only be accomplished during times of
low water level.
Dietary analysis was conducted based on both
stomach and fecal samples of living specimens. Dissection
of stomachs to examine contents was not possible in this
study because all turtles are protected under the Sarawak
Wildlife Protection Ordinance (Sarawak Government
Gazette 1998). Within 1 hour after returning from the
field, stomachs were flushed by using the method
developed by Legler (1977), which incorporated the
modifications of Fields et al. (2000). Turtles were kept
in plastic basins, which were 60 cm in diameter and 30 cm
in depth, with some water. They were kept under
observation until they defecated, usually 24 to 48 hours,
and were released afterward at the place of capture. Each
sample (stomach content or fecal matter) was washed in
water by using a mesh strainer of 0.2-mm mesh size. These
samples were immediately preserved in 70% ethanol for
study.
Contents of the stomach and fecal samples were
examined separately for each turtle. Types of food were
sorted under low magnification by using an Olympus
SZX9 dissecting microscope. The presence of each dietary
group was recorded to the lowest identifiable taxon,
typically to ordinal level of classification. In addition, 2
categories were used: unknown arthropods and unknown
vertebrates. Any unidentifiable part of an insect or any
other arthropod, i.e., wing, claw, etc., was grouped into the
first category. The unknown vertebrates category repre-
sented any part known to be from a vertebrate, i.e., bone
fragments, but unclassifiable further. The volume of each
kind was determined by the displacement of water in either
a 5-mL or 25-mL graduated cylinder, as described by Moll
and Legler (1971). Descriptive analysis of data that
pertained to contents of stomachs and fecal samples were
expressed in 2 ways:
136 CHELONIAN CONSERVATION AND BIOLOGY, Volume 7, Number 1 — 2008

Percentage frequency of occurrence
¼ Number of turtles in which a given food item was found3 100
Number of individuals that provided samples
Total percentage of food volume
¼ Volume of diet category3over all individuals
Volume of all diet categories over all individuals
We tested for correlation between body size and the
different food categories and volume found of either
stomach contents or fecal matter by using the Pearson
correlation test. Data were log-transformed. Analyses were
performed by using SPSS for Windows ver. 10.1.
Results. — In total, 18 animals were obtained, which
comprised 3 juveniles, 9 females, and 6 males. Juveniles
did not provide stomach samples and yielded little in terms
of fecal matter and therefore, were excluded from the
dietary analysis. Only 9 adult animals (4 males and 5
females) provided stomach contents; whereas, 13 animals
(5 males and 8 females) provided fecal samples. Only 7
turtles provided both stomach contents and feces; whereas,
6 animals provided feces only, and 2 animals provided
only stomach contents. Parasitic nematodes were found in
1 female and 2 male turtles, all from Loagan Bunut
National Park. Furthermore, sand- or gravel-type substrate
was found in all fecal samples. It is assumed that these
items were not intentionally ingested and consequently
were excluded from further analysis.
All 15 turtles that provided either stomach samples,
feces, or both were captured evenly during the different
seasons. Five animals, all female, were caught during the
end of the northeast monsoon (wet season), which extends
from November to March. All 5 had eaten plants, 4 had
also eaten unknown vertebrates, and 3 had taken various
arthropods and had fish parts in either their stomach or
fecal samples. Five animals (3 male, 2 female) were
captured during the southwest monsoon (dry season),
which occurs from June to September. Four had plants in
their stomach or fecal samples; 3 had fish and unknown
vertebrate material; and only 1 provided arthropod parts.
In the nonmonsoonal period (April, October), 5 animals (3
male, 2 female) were also caught. All animals had plant
material and fish parts in their fecal or stomach samples; 4
animals had insect parts and parts of an unidentifiable
vertebrate.
In total, 60% (n ¼ 9) of turtles obtained in this study
provided stomach contents. In all, 66% (n ¼ 4) of the
males provided stomach contents; whereas, 55% (n ¼ 5)
of the females provided stomach contents. They consisted
of both aquatic and terrestrial plants, invertebrates, and the
remains of fish. Muscle tissues and bone fragments from
unidentifiable vertebrate species also occurred in stomach
contents. Seven of the 9 samples contained plant material;
although, only 5 samples contained animal parts. Fre-
quency of occurrence of animals found in the stomach
contents included unknown arthropods (1 female), drag-
onflies (Odonata) (1 female), spiders (Arachnida) (1
female), teleost fishes (Pisces) (1 female, 1 male), and
unknown vertebrate remains (2 females, 3 males).
Percentage of volume within stomach contents is
presented in Table 1. Plant material was present in 33% of
the stomach samples; whereas, unknown vertebrate parts
represented 48% of the total volume of stomach contents.
The remaining percentages were teleost fishes (7%),
unknown arthropod remains (4%), Odonata, and Arachni-
da, each comprised 4% of total volume. Percentage
frequency of occurrence for food items found in stomachs
of both male and female A. cartilaginea is presented in
Fig. 3.
A Pearson correlation test was used to determine the
relationship between body size and the number of
identifiable prey types in the stomach. No correlation
(r ¼ –0.313, p ¼ 0.412) was observed between these
contents and body mass, which indicated that larger turtles
would not necessarily take a greater type of dietary
resources. The largest mass of an individual that provided
stomach contents was 4 kg. Turtles contained food from 1
to 3 prey items in their stomachs. A Pearson correlation
test was also used to check for any relationship between
body size and the volume of stomach contents. There was
Figure 1. Adult female Amyda cartilaginea (field number KJ–31).
Figure 2. A native trap, known as selembau, comprising asystem of scoops and nets attached to long poles and set across ariver, used for catching everything from fish to turtles.
NOTES AND FIELD REPORTS 137

no correlation (r ¼ –0.518; p ¼ 0.153) between these 2
variables.
Of the 15 adult turtles obtained, 13 (87%) provided
fecal samples. Five (83%) of the males provided fecal
samples; whereas, 8 (89%) of the females provided fecal
samples. Items found in fecal samples expressed in
frequency of occurrence are summarized in Table 2. They
consisted of plant material (100%), arthropod remains
(62%), flies (Diptera) (7.7%), beetles (Coleoptera) (7.7%),
ants (Hymenoptera) (23%), dragonflies (Odonata) (7.7%),
snails (Gastropoda) (7.7%), teleost fish (Pisces) (69%),
birds (Aves) (7.7%), and unknown vertebrates (84%). The
percentage frequency of occurrence of prey items found in
feces is summarized for both sexes pooled in Fig. 4.
The percentage of volume of total contents in the fecal
samples is presented in Table 2. Plant material had a total
percentage volume of 56%, followed by teleost fish at
16%. Unknown vertebrates followed at 14% of the total
volume, with birds at 6%, miscellaneous unidentifiable
arthropods at 4%, Hymenoptera at 1%, and Diptera,
Coleoptera, Odonata, and Gastropods each at , 1%. The
small sample size does not permit statistical testing, but
there seems to be no difference between the dietary
preferences between males and females. All males and
females that provided fecal samples contained plant
materials. Three of the 5 males provided had insect parts;
whereas, 5 of the 8 females had the same. Four of the 5
males provided unknown vertebrate material; whereas, 6
of the 8 females did the same. Interesting items recovered
were bird feathers and bones found in a single adult male
(field number KJ–126).
Similar to the results of the stomach contents, no
correlation (r ¼ 0.005, p ¼ 0.987) was found between
body mass and the number of identifiable prey items,
which indicated that larger animals would not necessarily
harvest a greater number of prey resource types. The
largest animal that provided fecal matter for analysis was a
female (field number KJ–31), which weighed 18 kg.
Similar to the results of the stomach contents, there was no
correlation (r ¼ –0.101; p ¼ 0.742) between body size and
the volume of fecal matter.
Discussion. — Overall, there appears to be a dearth of
studies on diets of wild softshell turtles (reviewed by Moll
and Moll 2004), perhaps because of their large size (hence,
difficulty in capture and manipulation) and their presumed
rarity or at least low densities relative to other organisms
of similar size. Collection of large sets of field data on A.cartilaginea is difficult in Sarawak, where this species is
actively hunted for food by nearly all indigenous peoples,
and the species may consequently have become trap shy or
otherwise not easily captured. In addition, it appears to be
an extremely elusive animal. Although it may not move
great distances, it cannot be seen from above or in the
water, which is highly turbid (19–50 cm at Loagan Bunut
National Park, 29–39 cm at Balai Ringin), and hence, with
low or no visibility, the carapace color being either brown
or black, apparently does not bask, at least on land, and
does not enter hoop nets. Therefore, obtaining large data
sets for this species is difficult and expensive.
Table 1. Stomach contents of 9 Amyda cartilaginea from Sarawak, collected between May 2004 to April 2005.a
Food item
Malesn ¼ 5
Femalesn ¼ 4
Totaln ¼ 9
Total% volumen % n % n %
Plants 4 100 3 60 7 77 33Unknown Arthropoda 0 0 1 20 1 11 4Odonata 0 0 1 20 1 11 4Arachnida 0 0 1 20 1 11 4Pisces 1 25 1 20 2 22 7Unknown Vertebrata 3 75 2 40 5 55 48
a Also see Fig. 3.
Figure 3. Total percentage frequency of occurrence food items instomachs of both sexes of Amyda cartilaginea.
Figure 4. Total percentage frequency of occurrence food items infeces of both sexes of Amyda cartilaginea.
138 CHELONIAN CONSERVATION AND BIOLOGY, Volume 7, Number 1 — 2008

The dominant foods found in both stomach and fecal
analysis were plant materials, followed by unknown
vertebrates, which indicated that A. cartilaginea is an
omnivore. Tendencies toward omnivory were reported for
another softshell turtle, Trionyx triunguis (see Branch
1988; Ernst and Barbour 1989), and the tendency to feed
upon carcasses is known from other softshell species (Das
1995, Aspideretes gangeticus and Aspideretes hurum;
Taskavak and Atatur 1998, Rafetus euphraticus; Akani
et al. 2001, T. triunguis). Identifiable terrestrial vertebrates
were found in 1 fecal sample in this study. Several white
feathers, along with bone and muscle tissue that belonged
to an indeterminate bird were recovered from an adult
male. These remains may have come from an intermediate
egret (Egretta intermedia) because this is the only bird
species found at Loagan Bunut National Park with
completely white plumage (Laman et al. 2006). Turtles
have been known to take birds off the water surface for
food. Pryor (1996) observed a Chelydra serpentina taking
a semi-palmated sandpiper (Calidris pusilla) from the
water’s surface. In this article, Pryor also reviewed other
accounts of C. serpentina predation on birds: laughing gull
(Larus atricilla), lesser yellowlegs (Tringa flavipes), and
possibly Forster’s tern (Sterna forsteri), all migratory sea
or shore birds. Unspecified species of birds have also been
recorded in the diet of Trionyx triunguis (Gramentz 2005).
It is possible that the our softshell turtle took the
intermediate egret off the water surface as it was foraging.
Intermediate egrets are migratory birds and come to the
wetlands of Borneo seasonally and at Loagan Bunut when
water and fish are plentiful in the lake. This may represent
a larger variety of food sources for these turtles during
certain periods. Whether A. cartilaginea is preying upon
terrestrial birds, as well as animal carcasses, it could be
considered a keystone species in its contribution to
recycling nutrients in the peat swamp ecosystem.
Results of the Pearson correlation test indicated that
there was no correlation between body size and the
number and volume of identifiable prey items in the
stomach. Although the sample size was small (n ¼ 9),
these results may be related to problems with the stomach-
flushing technique. It would be a safe assumption that
larger turtles consume larger amounts of food. However,
this was not what we found in our study. In fact, the largest
sample (0.7 mL) was provided by a turtle that weighed 1.1
kg. Stomach flushing success is often inversely propor-
tional to the size of turtle, and the volume of water injected
with a hand-operated syringe may be insufficient for large
animals (Legler 1977; Demuth and Buhlmann 1997).
Without dissection, it is impossible to know whether
failure to dislodge food from the stomach means that the
stomach is empty or the technique is ineffective.
Sexual and ontogenetic differences in diet in the
species remain unknown and appear to be negligible, but
the sample in this study did not permit appropriate
statistical testing. In addition, data were unavailable for
juvenile turtles. Such differences have been highlighted in
other trionychids, such as Apalone mutica (Plummer and
Farrar 1981). In several other freshwater turtle species,
there is a well-documented shift from carnivory to
herbivory with increasing body size: Trachemys scripta(Clark and Gibbons 1969; Hart 1983), Emydura krefftii(Georges 1982), Pangshura tentoria (Das 1985), and
Chelonia mydas (Bjorndal 1985). Further sampling with a
wide range of size classes is needed to answer these
questions.
There was no correlation between body mass and the
number of prey items, nor between body mass and the
volume of fecal matter. The sample size did not permit
quantitative analysis of any seasonal differences. Seasonal
differences in rainfall and water availability may influence
the diet and behavior of turtles, especially in places where
streams dry out completely, and turtles may be forced to
aestivate or perhaps burrow and remain underground in a
quiescent state (Jensen and Das 2008). Changes in the
water level may influence feeding behavior, especially in
areas where many of the streams dry out completely.
During these periods, turtles were found buried in mud.
All 3 individuals located in mud were found at Loagan
Bunut National Park in small streams, buried at 0.3- to 0.5-
m depth in wet mud in previously submerged stream
banks. A smaller number of turtles may have had insects in
Table 2. Fecal sample of 13 Amyda cartilaginea from Sarawak, collected between May 2004 through April 2005.a
Food item
Malesn ¼ 5
Femalesn ¼ 8
Totaln ¼ 13
Total% volumen % n % n %
Plants 5 100 8 100 13 100 56Unknown Arthropoda 3 60 5 62.5 8 62 4Diptera 0 0 1 12.5 1 7.7 ,1Hymenoptera 1 20 2 25 3 23 1Coleoptera 1 20 0 0 1 7.7 ,1Odonata 0 0 1 12.5 1 7.7 ,1Gastropoda 0 0 1 12.5 1 7.7 ,1Pisces 5 100 4 50 9 69 16Aves 1 20 0 0 1 7.7 6Unknown Vertebrata 4 80 6 80 10 84 14
a Also see Fig. 4.
NOTES AND FIELD REPORTS 139

their diet during the dry season because aquatic insects
tend to breed during the wet season and, consequently, are
less likely to be available during this period. Conversely,
as the water levels decrease, fish are confined to smaller
areas, which make them more easily harvestable prey for
turtles. In addition, during the dry season, there is a large
die-off of fish at Loagan Bunut; therefore, some of the fish
intake may be from scavenging. Although the samples
were small, these data are a noteworthy addition to the
knowledge of the ecology of this turtle species.
Acknowledgments. — This project was made possible
through financial support from Chelonian Research
Foundation’s Linnaeus Fund, British Chelonia Group
Conservation Grant, Idea Wild, Universiti Malaysia
Sarawak (‘‘The herpetofauna of Loagan Bunut’’;
fundamental grant number 1/94/441/2004[179] and
‘‘Studies on the natural history and systematics of the
herpetofauna of peat swamp forest of Sarawak, East
Malaysia’’; fundamental grant number 1/26/303/
2002[40]), the UNDP–GEF (‘‘Conservation and
Sustainable Use of Tropical Swamp Forests and
Associated Wetland Ecosystems,’’ UNDP–GEF Funded
Project MAL/99/G31). A special thanks to Datin Eileen
Yen Ee Lee and Margarita Naming from the Sarawak
Biodiversity Centre for providing research permit
(Research Agreement number SBC–RA–0073–KAJ and
Research Permit number SBC–RP–0085–KAJ). We also
thank Lai Khim Kuet and Bolhan Budeng from the
Sarawak Forestry Department for providing permission to
survey freshwater turtles in Sarawak (permit number
03697). Special thanks for Abang Arabi of the Sarawak
Forestry Corporation and his staff at Loagan Bunut
National Park, specifically, Sam Pasan, park warden, for
permission and use of equipment; Jok Ngau for sharing his
knowledge of freshwater turtles and the Loagan Bunut
wetland system and his family’s hospitality, as well as
many hot meals; and Gilin Gasing for all the those long
hours in the field to help catch turtles. Finally, we are
grateful to 2 anonymous reviewers for comments on an
earlier version of the manuscript.
LITERATURE CITED
AKANI, G.C., CAPIZZI, D., AND LUISSELLI, L. 2001. Diet of the
softshell turtle, Trionyx triunguis, in an Afrotropical forested
region. Chelonian Conservation and Biology 4:200–201.
BJORNDAL, K.A. 1985. Nutritional ecology of sea turtles. Copeia
1985(3):736–751.
BRANCH, B. 1988. Field Guide to the Snakes and Other Reptiles
of Southern Africa. London: New Holland Publishers, 144 pp.
CAGLE, F.R. 1942. Turtle populations in southern Illinois. Copeia
1942(3):155–162.
CLARK, D.B. AND GIBBONS, J.W. 1969. Dietary shift in the turtle,
Pseudemys scripta (Schoepff), from youth to maturity. Copeia
1969(4):704–706.
COX, M.J., VAN DIJK, P.P., NABHITABHATA, J., AND THIRAKHUPT, K.
1998. A Photographic Guide to Snakes and Other Reptiles of
Peninsular Malaysia, Singapore and Thailand. Sanibel Island,FL: Ralph Curtis, 144 pp.
DAS, I. 1985. Indian Turtles: A Field Guide. Calcutta: WorldWide Fund for Nature—India (Eastern Region), 119 pp.
DAS, I. 1995. Turtles and Tortoises of India. Bombay: OxfordUniversity Press, 176 pp.
DAS, I. AND JENSEN, K.A. 2006. The herpetofauna of LoaganBunut. In: Tuen, A.A., Sayok, A.K., Toh, A.N., and Noweg,G.T. (Eds.). Scientific Journey Through Borneo: LoaganBunut. A Scientific Expedition on the Physical, Chemical,Biological, and Sociological Aspects. Kuala Lumpur and KotaSamarahan: Peat Swamp Forest Project, UNDP/GEF funded(MAL/99/G31), Sarawak Forest Department and Institute ofBiodiversity and Environmental Conservation, UniversitiMalaysia Sarawak. pp. 131–154.
DEMUTH, J.P. AND BUHLMANN, K.A. 1997. Diet of the turtleDeirochelys reticularia on the Savannah River site, SouthCarolina. Journal of Herpetology 31:450–453.
ERNST, C.H. AND BARBOUR, R.W. 1989. Turtles of the World.Washington, DC: Smithsonian Institution Press, 313 pp.
FIELDS, J.R., SIMPSON, T.R., MANNING, R.W., AND ROSE, R.L.2000. Modifications of the stomach flushing technique forturtles. Herpetological Review 31:32–33.
FRAZER, N.B., GIBBONS, J.W., AND OWENS, T.J. 1990. Turtletrapping: preliminary tests of conventional wisdom. Copeia1990(4):1150–1152.
GEORGES, A. 1982. Diet of the Australian freshwater turtleEmydura krefftii (Chelonia: Chelidae), in an unproductivelentic environment. Copeia 1982(2):331–336.
GRAMENTZ, D. 2005. Die Nilweichschildkrote Trionyx triunguis.Frankfurt am Main: Edition Chimaira, 166 pp.
HART, D.R. 1983. Dietary and habitat shift with size of red-earedturtles (Pseudemys scripta) in a southern Louisiana popula-tion. Herpetologica 39:285–290.
JENSEN, K.A. AND DAS, I. 2008. Observations on the influence ofseasonality, lunar cycles, and weather condition on freshwaterturtle activity in Sarawak, East Malaysia (Borneo). AsiaticHerpetological Research 11:37–42.
LAMAN, C.J., GAWIN, D.F.A., AND RAHMAN, M.A. 2006.Quantifying the diversity of avifauna at Loagan BunutNational Park. In: Tuen, A.A., Sayok, A.K., Toh, A.N., andNoweg, G.T. (Eds.). Scientific Journey Through Borneo:Loagan Bunut. A Scientific Expedition on the Physical,Chemical, Biological, and Sociological Aspects. KualaLumpur and Kota Samarahan: Peat Swamp Forest Project,UNDP/GEF funded (MAL/99/G31), Sarawak Forest Depart-ment and Institute of Biodiversity and EnvironmentalConservation, Universiti Malaysia Sarawak. pp. 163–172.
LEGLER, J.M. 1960. A simple and inexpensive device for trappingaquatic turtles. Utah Academy Proceedings 37:63–66.
LEGLER, J.M. 1977. Stomach flushing: a technique for cheloniandietary studies. Herpetologica 3:281–284.
LIM, B.L. AND DAS, I. 1999. Turtles of Borneo and PeninsularMalaysia. Kota Kinabalu: Natural History Publications, xii þ151 pp.
MOLL, E.O. AND LEGLER, J.M. 1971. The life history of aNeotropical slider turtle, Pseudemys scripta (Schoepff), inPanama. Bulletin of the Los Angeles County, Museum ofNatural History (11):1–102.
MOLL, D. AND MOLL, E.O. 2004. The Ecology, Exploitation, andConservation of River Turtles. New York: Oxford UniversityPress, x þ 393 pp.
PAWAR, S.S. AND CHOUDHURY, B.C. 2000. An inventory ofchelonians from Mizoram, north-east India: new records andsome observations on threats. Hamadryad 25(2):144–158.
140 CHELONIAN CONSERVATION AND BIOLOGY, Volume 7, Number 1 — 2008

PLUMMER, M.V. AND FARRAR, D.B. 1981. Sexual dietary
differences in a population of Trionyx muticus. Journal of
Herpetology 15:175–179.
PRYOR, G.S. 1996. Observations of shorebird predation by
snapping turtles in eastern Lake Ontario. Wilson Bulletin
108(1):190–192.
SARAWAK GOVERNMENT GAZETTE. 1998. Laws of Sarawak. Chapter
26. Wildlife Protection Ordinance, 1998. Kuching, Malaysia:
Percetakan Nasional Malaysia Berhad, 46 pp.
SAYER, J. 1991. Rainforest Buffer Zones. Guidelines for Protected
Area Managers. Cambridge, UK: IUCN Forest Conservation
Programme, 94 pp.
TASKAVAK, E. AND ATATUR, M.K. 1998. Distribution and habitats
of the Euphrates softshell turtle, Rafetus euphraticus, in
southeastern Anatolia, Turkey, with observations on biology
and factors endangering its survival. Chelonian Conservation
and Biology 3(1):20–30.
VOGT, R.C. 1980. New methods for trapping aquatic turtles.
Copeia 1980(2):368–371.
Received: 10 April 2006
Revised and Accepted: 10 February 2008
Chelonian Conservation and Biology, 2008, 7(1): 141–145
� 2008 Chelonian Research Foundation
Hematological Parameters, PlasmaPolypeptide Profiles, and Human Anti-
Cancer Bioactivity of Testudo graeca andTestudo horsfieldii Plasma
ELIE K. BARBOUR1, NAGY S. ABOU CHAKRA
1,
LINA JABER1, PIA A. NEHME
1, HOUSSAM SHAIB1,
NADA USAYRAN2, RIYAD SADEK
3, AND
HALA GALI-MUHTASIB3
1Department of Animal Sciences, Faculty of Agricultural and Food
Sciences, American University of Beirut, PO Box 11-0236,
Riad El Solh 11072020, Beirut, Lebanon
[Elie K. Barbour: [email protected];
Nagy S. Abou Chakra: [email protected];
Lina Jaber: [email protected];
Pia A. Nehme: [email protected];
Houssam Shaib: [email protected]];2Department of Animal Production, Faculty of Agricultural
Sciences, Lebanese University, Sin-El Fil, Lebanon
[[email protected]];3Biology Department, Faculty of Arts and Sciences, American
University of Beirut, Beirut, Lebanon
[Riyad Sadek: [email protected];
Hala Gali-Muhtasib: [email protected]]
ABSTRACT. – We documented differential blood cellcounts and plasma polypeptide profiles in Testudograeca and T. horsfieldii raised in captivity in Lebanon,and investigated bioactivity of T. graeca plasma againsta human colon cancer cell line (HCT-116). Thepercentage of red blood cells, thrombocytes, hetero-phils, basophils, lymphocytes, monocytes, and eosino-
phils did not differ significantly between the speciesduring winter or spring. The total number of plasmapolypeptides differed between the species, with 2additional polypeptide bands in T. horsfieldii. Plasmafrom T. graeca significantly affected the percentageproliferation and percentage viability of human cancercell line HCT-116.
Tortoises have become widely popular as pets but
they are facing extinction (Behler 1997; Barzyk 1999;
Altherr and Freyer 2000) because of the increased pet trade
(Jenkins 1995; Yiming and Dianmo 1998) and habitat
destruction, mainly by expansion of intensive agriculture
(Shrestha 1997; Thirakhupt and Van Dijk 1997; Lagarde et
al. 2002). Two different tortoise species (Testudinidae)
were included in this study: Testudo graeca, the Mediter-
ranean spur-thighed tortoise, and Testudo horsfieldii, the
Horsfield’s or steppe tortoise (Ernst and Barbour 1989).
The establishment of baseline data on hematologic
parameters, such as differential blood cell count and serum
polypeptides is of importance in programs that target the
conservation of threatened tortoise species because serum
polypeptide patterns are often used in the differentiation of
various species, subspecies, and races of different animals
(Lykakis 1971; Taylor and Jacobson 1981; Lawrence and
Hawkey 1986). In addition, such hematologic data can
help veterinarians and pathologists document any devia-
tion from baseline data, which could help in disease
diagnosis. Dangerfield et al. (1976) reported that lipopro-
tein patterns in serum or plasma samples taken from a
wide range of mammals, birds, and reptiles differ among
each other and are further greatly modified by oviparity.
Moreover, establishing baseline data of the hematologic
parameters and serum polypeptide profiles of tortoises
facing extinction will aid in captive breeding programs and
possible repatriation (Behler 1997; Barzyk 1999; Altherr
and Freyer 2000).
Anticancer effects of various animal tissues were
previously reported, including the shell of T. graeca(Bayazit 2004; Bayazit and Khan 2005). Furthermore,
studies on human serum revealed the presence of the
tumor necrosis factor, a class of cytokines known to
induce apoptosis in transformed cells (Walczak et al.
1999). Such information led us to hypothesize a possible
role of Testudo spp. plasma in defense against human
cancer cells. In addition, traditional Chinese medicine
attributes many benefits to various tissues derived from
turtles and tortoises, including anticancer effects (Guynup
2005). Most of these beliefs have not been scientifically
tested. This research hopefully will shed some light on this
largely unexplored field.
To our knowledge, there is no previous work that
established baseline data of plasma polypeptide bands and
differential blood cell count in T. graeca and T. horsfieldii.This study provides the first such data. In addition, no
study of bioactivity of T. graeca plasma against human
NOTES AND FIELD REPORTS 141
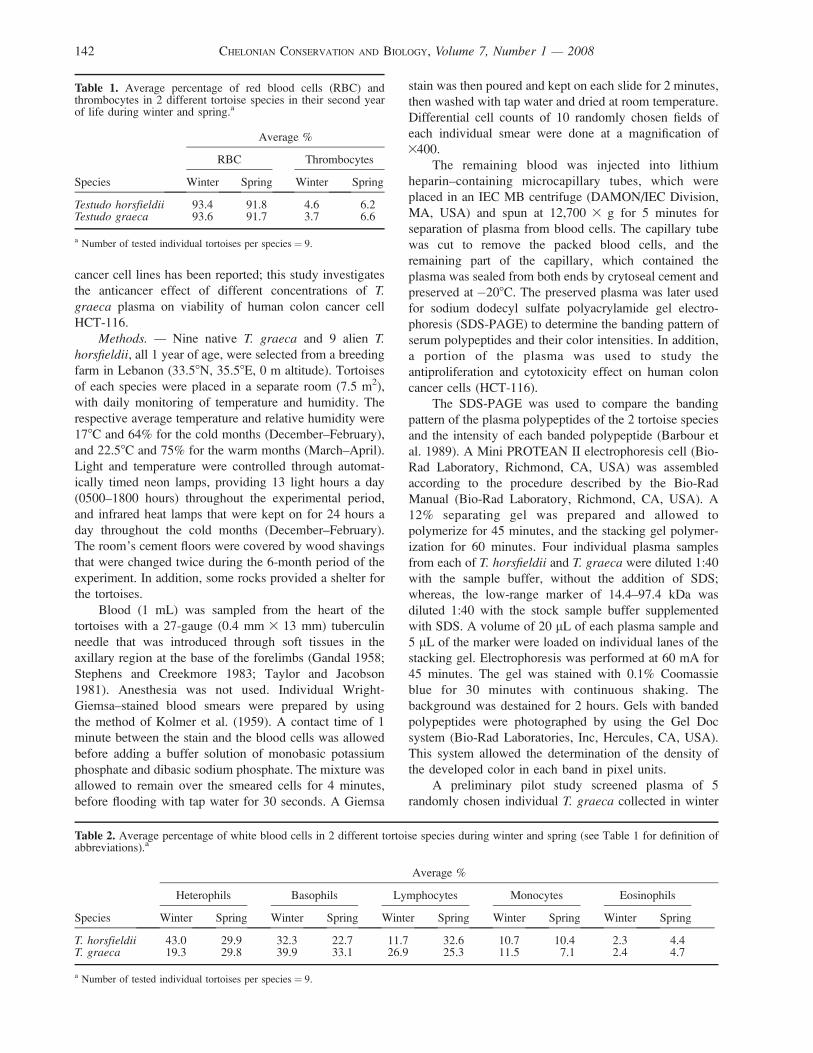
cancer cell lines has been reported; this study investigates
the anticancer effect of different concentrations of T.graeca plasma on viability of human colon cancer cell
HCT-116.
Methods. — Nine native T. graeca and 9 alien T.horsfieldii, all 1 year of age, were selected from a breeding
farm in Lebanon (33.58N, 35.58E, 0 m altitude). Tortoises
of each species were placed in a separate room (7.5 m2),
with daily monitoring of temperature and humidity. The
respective average temperature and relative humidity were
178C and 64% for the cold months (December–February),
and 22.58C and 75% for the warm months (March–April).
Light and temperature were controlled through automat-
ically timed neon lamps, providing 13 light hours a day
(0500–1800 hours) throughout the experimental period,
and infrared heat lamps that were kept on for 24 hours a
day throughout the cold months (December–February).
The room’s cement floors were covered by wood shavings
that were changed twice during the 6-month period of the
experiment. In addition, some rocks provided a shelter for
the tortoises.
Blood (1 mL) was sampled from the heart of the
tortoises with a 27-gauge (0.4 mm 3 13 mm) tuberculin
needle that was introduced through soft tissues in the
axillary region at the base of the forelimbs (Gandal 1958;
Stephens and Creekmore 1983; Taylor and Jacobson
1981). Anesthesia was not used. Individual Wright-
Giemsa–stained blood smears were prepared by using
the method of Kolmer et al. (1959). A contact time of 1
minute between the stain and the blood cells was allowed
before adding a buffer solution of monobasic potassium
phosphate and dibasic sodium phosphate. The mixture was
allowed to remain over the smeared cells for 4 minutes,
before flooding with tap water for 30 seconds. A Giemsa
stain was then poured and kept on each slide for 2 minutes,
then washed with tap water and dried at room temperature.
Differential cell counts of 10 randomly chosen fields of
each individual smear were done at a magnification of
3400.
The remaining blood was injected into lithium
heparin–containing microcapillary tubes, which were
placed in an IEC MB centrifuge (DAMON/IEC Division,
MA, USA) and spun at 12,700 3 g for 5 minutes for
separation of plasma from blood cells. The capillary tube
was cut to remove the packed blood cells, and the
remaining part of the capillary, which contained the
plasma was sealed from both ends by crytoseal cement and
preserved at �208C. The preserved plasma was later used
for sodium dodecyl sulfate polyacrylamide gel electro-
phoresis (SDS-PAGE) to determine the banding pattern of
serum polypeptides and their color intensities. In addition,
a portion of the plasma was used to study the
antiproliferation and cytotoxicity effect on human colon
cancer cells (HCT-116).
The SDS-PAGE was used to compare the banding
pattern of the plasma polypeptides of the 2 tortoise species
and the intensity of each banded polypeptide (Barbour et
al. 1989). A Mini PROTEAN II electrophoresis cell (Bio-
Rad Laboratory, Richmond, CA, USA) was assembled
according to the procedure described by the Bio-Rad
Manual (Bio-Rad Laboratory, Richmond, CA, USA). A
12% separating gel was prepared and allowed to
polymerize for 45 minutes, and the stacking gel polymer-
ization for 60 minutes. Four individual plasma samples
from each of T. horsfieldii and T. graeca were diluted 1:40
with the sample buffer, without the addition of SDS;
whereas, the low-range marker of 14.4–97.4 kDa was
diluted 1:40 with the stock sample buffer supplemented
with SDS. A volume of 20 lL of each plasma sample and
5 lL of the marker were loaded on individual lanes of the
stacking gel. Electrophoresis was performed at 60 mA for
45 minutes. The gel was stained with 0.1% Coomassie
blue for 30 minutes with continuous shaking. The
background was destained for 2 hours. Gels with banded
polypeptides were photographed by using the Gel Doc
system (Bio-Rad Laboratories, Inc, Hercules, CA, USA).
This system allowed the determination of the density of
the developed color in each band in pixel units.
A preliminary pilot study screened plasma of 5
randomly chosen individual T. graeca collected in winter
Table 1. Average percentage of red blood cells (RBC) andthrombocytes in 2 different tortoise species in their second yearof life during winter and spring.a
Species
Average %
RBC Thrombocytes
Winter Spring Winter Spring
Testudo horsfieldii 93.4 91.8 4.6 6.2Testudo graeca 93.6 91.7 3.7 6.6
a Number of tested individual tortoises per species¼ 9.
Table 2. Average percentage of white blood cells in 2 different tortoise species during winter and spring (see Table 1 for definition ofabbreviations).a
Average %
Species
Heterophils Basophils Lymphocytes Monocytes Eosinophils
Winter Spring Winter Spring Winter Spring Winter Spring Winter Spring
T. horsfieldii 43.0 29.9 32.3 22.7 11.7 32.6 10.7 10.4 2.3 4.4T. graeca 19.3 29.8 39.9 33.1 26.9 25.3 11.5 7.1 2.4 4.7
a Number of tested individual tortoises per species¼ 9.
142 CHELONIAN CONSERVATION AND BIOLOGY, Volume 7, Number 1 — 2008

and another 6 collected in spring for comparison of their
antitumor bioactivities in human cancer cell lines. HCT-
116 human colon cancer cells were grown in RPMI 1640
at 378C in a 5% CO2
incubator. The HCT-116 cell culture
medium was supplemented with 100 units/mL penicillin,
100 lg/mL streptomycin, and 10% fetal bovine serum.
The seeding of the HCT-116 cells in 6-well plates was at
the level of 2.0 3 104 cells in 100-lL wells, incubated for
24 hours at 378C before treatment with tortoise plasma.
Triplicates of each tortoise plasma, diluted to 5%, were
each applied in 5-lL volumes on the HCT-116 cell
culture. The percentage HCT-116 cell proliferation and
percentage viability were determined by using the
respective Cell Titer 96 nonradioactive cell proliferation
assay and the Cytotox 96 nonradioactive cytotoxicity
assay, according to the instructions of the manufacturer
(Promega Corp, Madison, WI, USA) (Moravec 1994). The
proliferation assay is an MTT (Methyl Thiazolyl Tetrazo-
lium)-based method that measures the ability of metabol-
ically active cells to convert tetrazolium salt into a
formazan product, and its absorbance is recorded at 570
nm. The Cytotox 96 assay quantitatively measures the
lactate dehydrogenase (LDH), a stable cytosolic enzyme
that is released upon cell lysis. Released LDH in culture
supernatants is measured with a coupled enzymatic assay,
which results in the conversion of a tetrazolium salt into a
red formazan product, the absorbance of which is recorded
at 490 nm. Control wells were included in each of the 2
assays by depriving the HCT-116 from contact with
tortoise plasma, thus establishing 2 reference points of
100% proliferation and 100% viability, respectively. A
second investigation compared the effect of 3 different
concentrations of tortoise plasma (5%, 10%, and 15%) of 7
randomly chosen individual T. graeca on the average
percentage viability of HCT-116 human colon cancer
cells. Each concentration of each individual plasma sample
was run in triplicate. Controls were included, and the
viability assay was performed as described above.
Computerized statistical analysis was performed by
using the MSTAT software (MSTATC, 1991, Michigan
State University, MI, USA). The experimental design was
of a 2-factor completely randomized structure. One-way
analysis of variance of the different measured parameters
was performed. Means were then separated by Duncan’s
multiple range test (a ¼ 0.05).
Results and Discussion. — Results showed no
significant difference ( p . 0.05) between T. horsfieldiiand T. graeca in the percentage of red blood cells (RBC),
thrombocytes, heterophils, basophils, lymphocytes, mono-
cytes, and eosinophils in either winter or spring (Tables 1
and 2). Others (Taylor and Jacobson 1981; Lawrence and
Hawkey 1986) have shown a drop in the RBC and
leukocyte count at the beginning of hibernation (fall
season), a period that is not included in this study. Future
work should include the 4 seasons of the year and other
years in the life of tortoises. The absence of a significant
difference between the hematologic parameters obtained in
this experiment could be related to the slight difference in
the average temperature and relative humidity between
winter (December–February) and spring (March–May). In
Table 3. Averagea intensity of different plasma polypeptidebands in 2 different tortoise species (see Table 1 for definition ofabbreviations).
Bandedpolypeptide
(kDa)
Average intensity of eachpolypeptide band in pixel units
SEMT. horsfieldii T. graecab
26.1 179.0c 0.0d —29 200.7 208.8 8.4342.1 130.4 92.8 14.544.5 126.4c 67.3d 14.2266.3 111.2 117.5 14.5668.3 131.3c 0.0d —98.4 158.2 160.6 17.14
102.8 157.7 198.5 19.83103.8 167.6 209.4 21.96
a Average of 4 T. graeca and 4 T. horsfieldii plasma samples.b A value of 0.0 indicates the absence of band.c,d Average intensities-pixels in a row, followed by different superscriptsare significantly different ( p , 0.05).
Figure 1. Comparison of plasma polypeptide profile of Testudohorsfieldii and Testudo graeca. Four individual plasma samples(lanes 1–4) of each species were run on individual lanes (20 ll/lane). The marker’s protein bands and their molecular weight inKDa are on the left lane labeled ‘‘M’’.
NOTES AND FIELD REPORTS 143

addition, the average temperature in this study for the
winter season was relatively high compared with other
conditions mentioned in other studies, namely that of
Lawrence and Hawkey (1986) who conducted their
experiment in Britain where winter temperatures are
significantly lower.
The respective intensities in pixel units of each of the
9 banded plasma polypeptides in T. horsfieldii vs. T.graeca are presented in Table 3. There were some
statistical differences in the intensities of certain polypep-
tide bands when compared with the 2 species. The
presence of 9 banded polypeptides in each of 4 plasma
individual serum samples of T. horsfieldii (lanes 1–4) is
shown in Fig. 1; however, each of the 4 individual plasma
samples of T. graeca showed only 7 banded polypeptides
(Fig.1, lanes 1–4). Plasma polypeptide profiles can be
used as support for the differentiation of animal species
(Lykakis 1971; Dangerfield et al. 1976). This new finding
of the presence of 2 additional polypeptide bands in T.horsfieldii, namely, the 26.1 kDa and 68.3 kDa bands,
enables us to add this character as differentiating this
species from T. graeca. The existence of these 2
polypeptide bands in T. horsfieldii needs further investi-
gation for its genetic basis, and the biological function of
these 2 polypeptides.
Results of the study on the bioactivity of T. graecaplasma on HCT-116 human colon cancer cells showed that
a concentration of 5% plasma collected in the winter
induced significant differences ( p , 0.05) in percentage
proliferation and percentage viability of the targeted
human colon cancer cells (Table 4). The range of cancer
cell percentage proliferation induced by the 6 individuals
of T. graeca widened to 46.37%–99.96%. A significant
difference in impact of plasma on cancer cell line viability
was also present in the winter; however, the range was
narrower, at 94.84%–99.27%. In contrast, the plasma
collected during spring did not show significant variation
among the individuals regarding both the percentage
proliferation and the percentage viability ( p . 0.05)
(Table 4). Moreover, the average impact of all individual
plasma on percentage proliferation and percentage viabil-
ity of cancer cells did not differ significantly between the
winter and spring ( p . 0.05).
These preliminary data need further investigation to
uncover the reason behind the significant differences
among individuals of T. graeca regarding the impact of the
plasma collected in the winter season on the percentage
proliferation and percentage viability of human colon
cancer cells. As the concentration of the plasma collected
from 7 individual T. graeca increased from 5% to 15%, the
percentage viability of the cancer cells was significantly
reduced, from 76.95% to 53.23% ( p , 0.05) (Fig. 2).
This anticancer effect was clearly a plasma concentration-
dependent relationship. Future investigations will target
the anticancer-amplification mechanisms in tortoise plas-
ma that could result in more significant reduction of
percentage viability of HCT-116 human colon cancer cells
and will also focus on identification of the anticancer
factor present in certain individuals of T. graeca.
LITERATURE CITED
ALTHERR, S. AND FREYER, D. 2000. Asian turtles are threatened byextinction. Turtle and Tortoise Newsletter. The Newsletter ofChelonian Conservationists and Biologists 1:7–11.
BARBOUR, E.K., NEWMANN, J.A., SASIPREEYAJAN, J., CAPUTA, A.C.,AND MUNEER, M.A. 1989. Identification of the antigeniccomponents of the virulent Mycoplasma gallisepticum inchickens: their role in differentiation from the vaccine strain(F). Veterinary Immunology and Immunopathology 21:197–206.
BARZYK, J. 1999. Turtles in crisis: the Asian food markets.Tortoise Trust www.tortoisetrust.org (July 9, 2008).
BAYAZIT, V. 2004. Cytotoxic effect of some animal and vegetableextracts and some chemicals on liver and colon carcinoma andmyosarcoma. Saudi Medical Journal 25(2):156–163.
Table 4. Impact of the 5% concentration of T. graeca (TG)tortoise plasma collected in winter and spring on HCT-116 coloncancer cells (see Table 1 for definition of abbreviations).
Season Tortoise
Effect of 5% plasma concentrationon HCT-116 cancer cell line
% Proliferationa % Viabilitya
Winter TG1 46.37c 94.84d
TG2 81.51c,d 98.59b
TG3 95.91c 96.34c
TG4 58.04d,e 96.11c
TG5 99.96c 99.27a
Average 76.36 97.03Spring TG1 86.05 72.68
TG2 88.29 60.53TG3 92.04 64.88TG4 95.17 97.74TG5 86.49 95.16TG6 120.39 59.30
Average 94.74 75.04
a Percentage proliferation and viability were obtained as averages ofeffects of triplicates of each tortoise plasma.b,c,d,e Average percentages within a column that are followed by differentsuperscripts are significantly different ( p , 0.05).
Figure 2. The average impact of 3 different plasma concentra-tions (Control, 5, 10 and 15%; x-axis) of 7 T. graeca plasmasamples on the average % viability (y-axis) of HCT-116 coloncancer cell lines. Average percent viability columns with differentletters, differ significantly ( p , 0.05).
144 CHELONIAN CONSERVATION AND BIOLOGY, Volume 7, Number 1 — 2008

BAYAZIT, V. AND KHAN, K.M. 2005. Anticancerogen activities ofbiological and chemical agents on lung carcinoma, breastadenocarcinoma and leukemia in rabbits. Journal of theChemical Society of Pakistan 27(4):413–422.
BEHLER, J. L. 1997. Troubled time for turtles (foreword). In: VanAbbema, J. (Ed.), Proceedings: Conservation, Restoration, andManagement of Tortoises and Turtles—An InternationalConference, July 1993, State University of New York,Purchase. New York: New York Turtle and Tortoise Society,pp. xviii–xxii. http://nytts.org/proceedings/behler.htm (July 9,2008).
DANGERFIELD, W.G., FINLAYSON, R., MYATT, G., AND MEAD, M.G.1976. Serum lipoproteins and atherosclerosis in animals.Atherosclerosis 25 (1):95–106.
DIFCO MANUAL. 1964. Michigan: Difco Laboratories, pp. 1–350.ERNST, C.H. AND BARBOUR, R.W. 1989. Turtles of the World.
Washington, D.C.: Smithsonian Institution Press, pp. 314.GANDAL, C.P. 1958. Cardiac punctures in anesthetized turtles.
Zoologica (43):93–94.GUYNUP, S. 2005. Turtle triage. Wildlife Conservation 108(2):
36–41.JENKINS, M. 1995. Tortoises and freshwater turtles: the trade in
Southeast Asia. Cambridge, UK: TRAFFIC International.KOLMER, A.J., SPAULDING, E.H., AND ROBINSON, H.W. 1959.
Approved Laboratory Technic. New York: Appleton-Century-Crofts.
LAGARDE, F., BONNET, X., NAGY, K., HENEN, B., CORBIN, J., AND
NAULLEAU, G. 2002. A short spring before a long jump: theecological challenge to the steppe tortoise (Testudo horsfiel-dii). Canadian Journal of Zoology 80(3):493–502.
LAWRENCE, K. AND HAWKEY, C. 1986. Seasonal variations inhaematological data from Mediterranean tortoises (Testudograeca and Testudo hermanni) in captivity. Research inVeterinary Science 40:225–230.
LYKAKIS, J. 1971. Serological and immunochemical comparisonof turtle blood proteins: serum proteins and hemoglobins.Comparative Biochemistry and Physiology, part B: Biochem-istry and Molecular Biology 39(1):83–84.
MORAVEC, R. 1994. Total cell quantitation using the Cytotox96TM non-radioactive cytotoxicity assay. Promega Notes 45:11–12.
SHRESHTA, T.K. 1997. Status, Biology, Conservation, andManagement of Tortoises and Turtles in the HimalayanFoothills of Nepal. In: Van Abbema, J. (Ed.), Proceedings:Conservation, Restoration, and Management of Tortoises andTurtles—An International Conference. New York: New YorkTurtle and Tortoise Society, pp. 278–286.
STEPHENS, G.A. AND CREEKMORE, J.S. 1983. Blood collection bycardiac punctures in conscious turtles. Copeia 1983:522–523.
TAYLOR, R.W. AND JACOBSON, E.R. 1981. Hematology and serumchemistry of the Gopher Tortoise, Gopherus polyphemus.Comparative Biochemistry and Physiology 72:425–428.
THIRAKHUPT, K. AND VAN DIJK, P.P. 1997. The Turtles of WesternThailand—Pushed to the Edge by Progress. Proceedings:Conservation, Restoration, and Management. Tortoises andTurtles—An International Conference, New York. Turtle andTortoise Society. United States Department of AgriculturalResearch Service. Report of the Salmonella enteritidis TaskForce for Research, pp. 1–34.
WALCZAK, H., MILLER, R.E., ARIAIL, K., GLINIAK, B., GRIFFITH,T.S., KUBIN, M., CHIN, W., JONES, J., WOODWARD, A., LE, T.,SMITH, C., SMOLAK, P., GOODWIN, R.G., RAUCH, C.T., SCHUH,J.C.L., AND LYNCH, D.H. Tumoricidal activity of tumornecrosis factor-related apoptosis-inducing ligand in vivo.1999. Nature Medicine 5(2):157–163.
YIMING, M. AND DIANMO, L. 1998. The dynamics of trade in livewildlife across the Guangxi border between China andVietnam during 1993–1996 and its control strategies.Biodiversity and Conservation 7:895–914.
Received: 7 February 2006
Revised and Accepted: 25 March 2008
Chelonian Conservation and Biology, 2008, 7(1): 145–149� 2008 Chelonian Research Foundation
Homing in the Red-Eared Slider(Trachemys scripta elegans) in Illinois
JOHN K. TUCKER1
AND JAMES T. LAMER1,2
1Great Rivers Field Station, Illinois Natural History Survey,
8450 Montclaire Avenue, Brighton, Illinois 62012-2032 USA
[[email protected]; [email protected]];2Present Address: Department of Biological Sciences, Western
Illinois University, 1 University Circle, Macomb, Illinois 61455 USA
ABSTRACT. – We recaptured 40 of 69 (58%) female red-eared sliders (Trachemys scripta elegans) that had beenmoved 3 km from Swan Lake to Long Lake in west-central Illinois. Twenty-one of 33 (63.6%) controlturtles that were not moved from Swan Lake wererecaptured. The similarity in recapture rates betweencontrol and experimental turtles suggests that statis-tically all translocated turtles returned to Swan Lakeregardless of the actual percentage recaptured. Wealso found that males were less likely than females tomake cross-river movements between backwaters ofthe Illinois River. The frequency of cross-rivermovements in sliders was small, only 86 recaptures(0.8%) out of a total of 10,373 recaptures made from19,018 trapped turtles marked and released at ourstudy areas between 1994 and 2006.
Many turtle species are known to exhibit homing
behavior, i.e., return to their original site of capture after
release elsewhere. Homing behavior includes natal homing
during which turtles return to their natal sites from long
distances (Bowen and Karl 1996; Valenzuela 2001). This
type of homing behavior is an important feature in sea
turtle life histories (Avens et al. 2003; Bowen et al. 2004).
Sea turtles also migrate long distances between their
foraging areas and nesting sites (i.e., beach fidelity) with
considerable accuracy (Limpus et al. 1992; Tripathy and
Pandav 2007). However, the degree to which homing
ability is expressed has been shown to vary in freshwater
turtles (e.g., Cagle 1944; Williams 1952; Freedberg et al.
2005; Smar and Chambers 2005). It has been suggested
that homing may have important impacts on fitness and
even on sex ratio (Freedberg and Wade 2001; Valenzuela
and Janzen 2001). Generally turtles that demonstrate nest
site fidelity must have some sort of homing ability in order
NOTES AND FIELD REPORTS 145

to return to a preferred nest site. Nest site fidelity has been
reported in many freshwater turtle species (e.g., Congdon
et al. 1983; Jackson and Walker 1997; Freedberg et al.
2005) including the red-eared slider (Trachemys scriptaelegans) (Tucker 2001).
Research conducted at the Great Rivers Field Station
has focused on many aspects of the biology of the red-
eared slider. An important finding has been that females
from the western side of the Illinois River lay fewer but
larger eggs than do those from habitats on the eastern side
of the Illinois River (Tucker et al. 1998). The basis for this
difference is unknown, but a reasonable hypothesis is that
females in each area are responding to local edaphic
conditions and not that they have evolved different optimal
egg sizes. To test this hypothesis during 1999, we
translocated females from the western side of the river to
the eastern side. Female sliders from Swan Lake (western
side of the river and producers of few but large eggs) were
moved to Long Lake (eastern side of the river where
females produce more but smaller eggs). Our goal was to
expose Swan Lake turtles to Long Lake conditions and
examine their reproductive output. Here we report the
homing behavior of female sliders after being translocated
from one side of the river to the other. The effect of turtle
size on the degree of mobility among sliders is not
understood. Although the influence of size on mobility is
not a focus of this study, we did record and compare sizes
during the course of the study.
Methods and Materials. — All translocated females
(N¼69) were initially captured in late June near the end of
the nesting season in 1999 at nesting areas near Swan Lake
(Tucker et al. 1998). Some (N ¼ 40) were recaptures of
females previously marked and others were first captured
in 1999 (N ¼ 29). We recorded carapace length, plastron
length, carapace height, carapace width, and gravid mass
of captured turtles (Tucker et al. 1998). Holes were drilled
in the marginal scutes to uniquely mark each individual.
All gravid females had oviposition induced using oxytocin
(Tucker et al. 1998, 2007). All were then kept captive for a
minimum of 72 hours to reduce the incidence of false
nesting (Tucker et al. 1995). All 69 females were then
released into a ditch that nesting females from Long Lake
routinely traversed to reach their nesting area (see Tucker
2000 and Fig. 1). An additional 33 females first caught in
1999 in Swan Lake were returned to Swan Lake to serve
as a control group.
Individuals were recaptured in 2 ways. Most were
recaptured while they were attempting to nest. Nesting
areas (Fig. 1) were visited daily during the nesting season
from 2000 to 2006 (see Tucker and Warner [1999] for
details on nesting areas). Others were recaptured in aquatic
traps set between 2003 and 2006. Baited hoop traps were
used and were employed a minimum of 15 days per year at
Swan Lake (2003–2006), Gilbert Lake (2003–2006), and
Long Lake (2001–2006). We used a minimum of 10 traps
in Swan Lake, Gilbert Lake, and Long Lake during each
trapping period. Traps were also placed along the channel
border of the Illinois River outside Swan Lake and outside
Gilbert Lake. We used a minimum of 5 traps on each side
of the river. This trapping could only be done occasionally
when periods of stable river stages could be predicted.
Rising river water levels could submerge channel border
traps and cause drowning.
Cross-river movements were recorded during mark
and recapture trapping conducted between 2001 and 2006
in order to compare them to homing in females. Each turtle
was uniquely marked and then measured and weighed as
above. All were released at their original capture location
excepting the 69 females translocated from Swan Lake to
Long Lake. Cross-river movements were recorded for
males and females. The distance between Gilbert Lake and
Swan Lake is 1 km compared to 3 km between Long Lake
and Swan Lake (Fig. 1). The frequency that each sex made
such movements was compared using chi-square analysis.
Recapture frequency was also compared using chi-square
analysis. Means were compared with the nonparametric
Kruskal–Wallis test or the Wilcoxon two-sample test,
which ever was appropriate. All statistics were performed
using SAS for Windows (SAS Institute 2000).
Results. — Between 2000 and 2006, we made 2005
captures of nesting females at the nesting areas associated
with Long Lake and 899 captures of nesting females at
nesting areas associated with Swan Lake (Fig. 1).
Trapping at Swan Lake from 2003 to 2006 resulted in
7035 captures of females; whereas, trapping at Long Lake
from 2001 to 2006 yielded 8086 captures of females. The
nesting area captures and trap captures resulted in
recapture of 40 of the 69 females (58%) that we
translocated to Long Lake and in recaptures of 21 of 33
Figure 1. Map of the study area showing locations of Long Lake,Gilbert Lake, and Swan Lake.
146 CHELONIAN CONSERVATION AND BIOLOGY, Volume 7, Number 1 — 2008

control females (63.6%). The proportion of recaptured
females among those translocated and the controls did not
differ (v2 ¼ 0.46, df ¼ 1, p ¼ 0.6060). All of the recap-
tures of translocated females were made at Swan Lake
nesting areas (N ¼ 32) or in traps set in Swan Lake
(N ¼ 8). No translocated females were recaptured at Long
Lake. Recaptured translocated females (N ¼ 40), translo-
cated females that were not recaptured (N ¼ 29), and
control females that were not translocated (N ¼ 33) did not
vary in any measure of size (Table 1; Kruskal–Wallis tests
for each trait, p . 0.05). Size details for these 102 females
are in Table 1. During these same years we made a total of
16,294 captures of male turtles (7932 at Long Lake and
9267 at Swan Lake). Males and females caught at Swan
Lake were larger than males and females caught at Long
Lake (Table 2; Wilcoxon two-sample tests for each trait,
p , 0.0001).
Based on our trapping results, males were less likely
than females to make cross-river movements between
Gilbert Lake and Swan Lake. Only 31 males (out of
16,294 captures of males) vs. 55 females (out of 18,025
captures of females) were observed crossing the Illinois
River between Gilbert Lake and Swan Lake. The female
bias was statistically significant (v2 ¼ 6.70, 1 df,
p ¼ 0.0097) indicating that more females than males made
this trip. In contrast, 22 turtles (9 males and 13 females)
that were initially marked in Swan Lake between 2000 and
2006 were later recaptured in Long Lake. No turtles that
were initially marked in Long Lake were subsequently
recaptured in Swan Lake.
Discussion. — Homing ability is clearly well
developed in adult female red-eared sliders (Trachemysscripta elegans). Not only did they return to their original
capture sites, but statistically, essentially all of them did.
The lack of difference in recapture rates between
translocated females and the control group strongly
suggests that nearly all translocated turtles returned to
Swan Lake. We note that in previous studies of homing,
no reference group or control was used. Consequently,
without a control group, it is not possible to estimate the
proportion of translocated turtles that homed. Instead, only
the proportion of those recaptured can be determined. No
inferences can be made about those turtles not recaptured
without a control group. Ours is the first homing study of
turtles to use a control group.
This high rate of return is likely not due to turtles
including both lakes in their home ranges. During the
course of the study, we found only 22 turtles that had
moved from Swan Lake to Long Lake out of 19,018
captures that we made. Turtles originally marked in Long
Lake were never recaptured in Swan Lake. Management
practices could explain this one-way movement. In Long
Table 1. Descriptive statistics for female red-eared sliders (Trachemys scripta elegans).
Variablea
Recaptured translocatedfemales (N ¼ 40)
Translocated but notrecaptured (N ¼ 29) Control females (N ¼ 33)
Mean (SD) Range Mean (SD) Range Mean (SD) Range
Carapace length 231 (13.4) 196–257 231 (15.1) 191–266 229 (14.1) 205–259Plastron length 215 (12.5) 184–244 215 (14.1) 183–244 216 (13.0) 189–245Carapace width 170 (7.8) 151–187 171 (9.7) 145–195 168 (9.4) 153–189Carapace height 92 (6.8) 71–112 91 (7.3) 78–105 89 (6.6) 75–104Mass 1906 (327) 1260–2650 1889 (335) 1160–2790 1753 (308) 1260–2470
a Measures of length, width, and height are in millimeters and mass is given in grams.
Table 2. Descriptive statistics for male and female red-eared sliders (Trachemys scripta elegans) caught at Long Lake and Swan Lake.
Variablea
Long Lake females Long Lake males
N Mean (SD) Range N Mean (SD) Range
Carapace length 10,091 189 (51.3) 30–296 7931 157 (41.7) 36–261Plastron length 10,091 177 (47.0) 28–268 7931 143 (36.0) 34–240Carapace width 10,091 142 (34.2) 30–218 7931 118 (26.3) 34–191Carapace height 10,091 73 (20.4) 15–123 7931 57 (14.3) 16–101Mass 10,002 1193 (711.8) 6.2–3100 7930 637 (410.5) 10.5–2300
Swan Lake females Swan Lake males
Variablea N Mean (SD) Range N Mean (SD) Range
Carapace length 7934 207 (38.9) 43–276 9266 189 (29.1) 62–260Plastron length 7934 193 (35.5) 41–257 9266 171 (24.6) 60–231Carapace width 7934 155 (26.3) 41–210 9266 138 (18.4) 56–187Carapace height 7934 79 (15.8) 20–120 9266 68 (10.3) 20–120Mass 7915 1388 (586.2) 40–3100 9264 953 (346.0) 40–2420
a Measures of length, width, and height are in millimeters and mass is given in grams.
NOTES AND FIELD REPORTS 147

Lake, water is not drawn down, but portions of Swan Lake
are dewatered each year. We frequently see turtles crossing
from Swan Lake to the Illinois River during such events.
Apparently most of these turtles move to the nearest
available backwater (Gilbert Lake, Fig. 1). Thus it seems
unlikely that our Swan Lake females would have been in
Long Lake before. It should also be noted that 32 of these
females not only returned to Swan Lake but they also
returned to the same nesting area from which they had
been removed. Nest site fidelity has been previously
demonstrated for slider females from Long Lake (Tucker
2001).
These same management practices may also cause the
size differences between turtles from Swan Lake and Long
Lake. The basis for the difference is that young turtles (2–4
years old) are much less common among turtles trapped in
Swan Lake; whereas, these young turtles make up a large
portion of the turtles trapped in Long Lake. Underlying
differences in recruitment rates may explain the apparent
difference in age structure, and we continue to study
recruitment at both lakes. Habitat differences between the
2 lakes are many. Swan Lake does not have submersed
aquatic vegetation, and a levee borders one side of the
lake. The levee has little cover for juvenile turtles, and the
lake has large numbers of predatory birds that line the
banks and moist-soil units when portions of the lake are
drawn down. In contrast, Long Lake has extensive cover
in the form of emergent vegetation and shrubs that extend
into the lake. Moreover, submersed aquatic vegetation is
present in parts of the lake. Finally, Long Lake is not
dewatered on a regular basis.
Similar to map turtles (Freedberg et al. 2005), female
sliders have well developed homing ability. Nest site fidelity
is also well developed in slider females (Tucker 2001). Well
developed homing ability and nest site fidelity were used as
evidence of natal homing by Freedberg et al. (2005). It could
be possible that that natal homing is part of the life history
strategy of the slider because sliders and map turtles have
similar patterns of homing and nest site fidelity.
Our experiment concentrated only on adult females,
and we did not attempt to translocate juveniles or males.
Males and young turtles may or may not be as adept at
homing as adult females. Smar and Chambers (2005)
found that male stinkpots (Sternotherus odoratus) were
more likely than females to home after translocation. Adult
sliders are mobile, and the Illinois River is not a barrier as
we recaptured turtles that moved from one side of the river
to the other. Interestingly, we found females more likely to
make this journey than males.
Generally, male sliders are known to be more mobile
than females possibly because increased mobility may
enhance mating opportunities (Morreale et al. 1984; Parker
1984). Moreover, male sliders have larger home ranges
than do female sliders (Schubauer et al. 1990). Our
observations do not necessarily contradict these findings.
We did not determine home ranges and males may have
larger home ranges in our study area as well. Nonetheless,
one other study of sliders found that males make fewer
long-distance moves (Bodie and Semlitsch 2000).
Moreover, the cross-river movements we observed are
extrapopulational (Gibbons et al. 1990). We suspect that
females move in response to low water levels. The water
level in Gilbert Lake is often lowered during summer
months to encourage growth of moist-soil vegetation.
Females seem to respond to draw downs by seeking
deeper water sites and may be more likely to leave than
males. Females return each year during the nesting season
due to their nest site fidelity (Tucker 2001) making them
more likely to be captured on both sides of the river
(Tucker 2001).
The frequency of cross-river movements in sliders
should be kept in perspective. They represent only 86
recaptures (0.8%) out of a total of 10,373 recaptures made
from 19,018 trapped turtles marked and released at our
study areas between 1994 and 2006. Sliders seem not to be
nearly as mobile as riverine turtles such as map turtles
(Freedberg et al. 2005). These map turtles identified as
Graptemys kohnii returned from as far away as 6 km
within 1–2 days of translocation. The female sliders that
we studied also were capable of rapid movements. One
individual was found making a false nesting attempt (see
Tucker et al. 1995) at the Swan Lake nesting area within
48 hours of its release some 3 km away. This recapture
was not counted in our totals, but it demonstrated that
females could rapidly return from Long Lake.
The ease with which sliders can cross the Illinois
River stands in contrast to the barrier presented by other
rivers to turtle dispersal. Bodie and Semlitsch (2000)
found that turtles, including sliders, were apparently
unable to cross the Missouri River. Turtles, however,
regardless of species inhabiting backwater lakes or
riverside lentic habitats, cannot be assumed to be limited
in their mobility by lotic habitats. Only comprehensive
trapping surveys on both sides of rivers can determine
their impact on movements of aquatic turtles.
Acknowledgments. — This is contribution number 22
of the National Great Rivers Research and Education
Center. Collecting was done under Illinois Department of
Natural Resources scientific permit authorization to J.K.
Tucker. Collecting at Long Lake was made possible by
Neil Booth (Illinois Department of Natural Resources) at
the Mississippi River State Fish and Wildlife Area in
Rosedale, Illinois. Access to Swan Lake and Gilbert Lake
was made possible by John Mabery (US Fish and Wildlife
Service) at the Two Rivers National Wildlife Refuge-
Brussels District. We also thank Jim Beasley, Beasley Fish
of Grafton, Illinois, for providing bait.
LITERATURE CITED
AVENS, L., BRAUN-MCNEILL, J., EPPERLEY, S., AND LOHMANN, K.J.
2003. Site fidelity and homing behavior in juvenile loggerhead
turtles (Caretta caretta). Marine Biology 143:211–220.
148 CHELONIAN CONSERVATION AND BIOLOGY, Volume 7, Number 1 — 2008

BODIE, J.R. AND SEMLITSCH, R.D. 2000. Spatial and temporal use
of floodplain habitats by lentic and lotic species of aquatic
turtles. Oecologia (Berlin) 122:138–146.
BOWEN, B.W., BASS, A.L., CHOW, S.-M., BOSTROM, M., BJORNDAL,
K.A., BOLTEN, A.B., OKUYAMA, T., BOLKER, B.M., EPPERLEY,
S., LACASELLA, E., SHAVER, D., DODD, M., HOPKINS-MURPHY,
S.R., MUSICK, J.A., SWINGLE, M., RANKIN-BARANSKY, K., TEAS,
W., WITZELL, W.N., AND DUTTON, P.H. 2004. Natal homing in
juvenile loggerhead turtles (Caretta caretta). Molecular
Ecology 13:3797–3808.
BOWEN, B.W. AND KARL, S.A. 1996. Population structure,
phylogeography, and molecular evolution. In: Lutz, P.L. and
Musick, J.A. (Eds.). Biology of Sea Turtles. Boca Raton, FL:
CRC Press, pp. 29–50.
CAGLE, F.R. 1944. Home range, homing behavior, and migration
in turtles. University of Michigan Museum of Zoology
Miscellaneous Publications 61:1–34.
CONGDON, J.D., TINKLE, D.W., BREITENBACH, G.L., AND VAN LOBEN
SELS, R.C. 1983. Nesting ecology and hatching success in the
turtle, Emydoidea blandingi. Herpetologica 39:417–429.
FREEDBERG, S., EWERT, M.A., RIDENHOUR, B.J., NEIMAN, M., AND
NELSON, C.E. 2005. Nesting fidelity and molecular evidence
for natal homing in the freshwater turtle, Graptemys kohnii.Proceedings of the Royal Society B 272:1345–1350.
FREEDBERG, S. AND WADE, M.J. 2001. Cultural inheritance as a
mechanism for population sex-ratio bias in reptiles. Evolution
55:1049–1055.
GIBBONS, J.W., GREENE, J.L., AND CONGDON, J.D. 1990. Temporal
and spatial movement patterns of sliders and other turtles. In:
Gibbons, J.W. (Ed.). Life History and Ecology of the Slider
Turtle. Washington, D.C.: Smithsonian Institution Press, pp.
201–215.
JACKSON, D.R. AND WALKER, R.N. 1997. Reproduction in the
Suwannee cooter, Pseudemys concinna suwanniensis. Bulletin
of the Florida Museum of Natural History 41:69–167.
LIMPUS, C.J., MILLER, J.D., PARMENTER, C.J., REIMER, D., MCLA-
CHLAN, N., AND WEBB, R. 1992. Migration of green (Cheloniamydas) and loggerhead (Caretta caretta) turtles to and from
eastern Australian rookeries. Wildlife Research 19:347–358.
MORREALE, S.J., GIBBONS, J.W., AND CONGDON, J.D. 1984.
Significance of activity and movement in the yellow-bellied
slider turtle (Pseudemys scripta). Canadian Journal of Zoology
62:1038–1042.
PARKER, W.S. 1984. Immigration and dispersal of slider turtles
(Pseudemys scripta) in Mississippi farm ponds. American
Midland Naturalist 112:280–293.
SAS INSTITUTE. 2000. SAS for Windows. Cary, NC: SAS
Institute.
SCHUBAUER, J.P., GIBBONS, J.W., AND SPOTILA, J.R. 1990. Home
range and movement patterns of slider turtles inhabiting Par
Pond. In: Gibbons, J.W. (Ed.). Life History and Ecology of the
Slider Turtle. Washington, D.C.: Smithsonian Institution
Press, pp. 223–232.
SMAR, C.M. AND CHAMBERS, R.M. 2005. Homing behavior of
musk turtles in a Virginia Lake. Southeastern Naturalist 4:
527–532.
TRIPATHY, B. AND PANDAV, B. 2007. Beach fidelity and
internesting movements of olive ridley turtles (Lepidochelysolivacea) at Rushikulya, India. Herpetological Conservation
and Biology 3:40–45.
TUCKER, J.K. 2000. Annual variation in hatchling size in the red-
eared turtle (Trachemys scripta elegans). Herpetologica 56:
8–13.
TUCKER, J.K. 2001. Nesting red-eared sliders (Trachemys scripta
elegans) exhibit fidelity to their nesting areas. Journal of
Herpetology 35:661–664.
TUCKER, J.K., JANZEN, F.J., AND PAUKSTIS, G.L. 1995. Oxytocin
induced nesting behavior in females of the red-eared turtle,
Trachemys scripta elegans, without oviductal eggs. Herpeto-
logical Review 26:138.
TUCKER, J.K., JANZEN, F.J., AND PAUKSTIS, G.L. 1998. Variation in
carapace morphology and reproduction in the red-eared slider
Trachemys scripta elegans. Journal of Herpetology 32:
294–298.
TUCKER, J.K., THOMAS, D.L., AND ROSE, J. 2007. Oxytocin dosage
in turtles. Chelonian Conservation and Biology 6:321–324.
TUCKER, J.K. AND WARNER, D.A. 1999. Microgeographic
variation in response of red-eared slider (Trachemys scriptaelegans) embryos to similar incubation environments. Journal
of Herpetology 33:549–557.
VALENZUELA, N. 2001. Genetic differentiation among nesting
beaches in the highly migratory giant river turtle (Podocnemisexpansa) from Colombia. Herpetologica 57:48–57.
VALENZUELA, N. AND JANZEN, F.J. 2001. Nest-site philopatry and
the evolution of temperature-dependent sex determination.
Evolutionary Ecology Research 3:779–794.
WILLIAMS, J.E. 1952. Homing behavior of the painted turtle and
musk turtle in a lake. Copeia 1952:977–987.
Received: 28 August 2006
Revised and Accepted: 29 March 2008
Chelonian Conservation and Biology, 2008, 7(1): 149–155
� 2008 Chelonian Research Foundation
Role of Trapping in Detection of a Small BogTurtle (Glyptemys muhlenbergii) Population
ANN BERRY SOMERS1
AND
JENNIFER MANSFIELD-JONES2
1Biology Department, PO Box 26170,
University of North Carolina at Greensboro, Greensboro,
North Carolina 27402-6170 USA [[email protected]];2Biology Department, 222 Life Sciences, University of Louisville,
Louisville, Kentucky 40292 USA [[email protected]]
ABSTRACT. – We used data collected from a small butincreasing population of bog turtles to evaluate thesurveying methods for detecting such a small popula-tion and the level of trapping effort required toreliably detect it. Trapping with unbaited trapsdetected this small population more reliably and withless investigator-time investment than did widely usedvisual and manual search techniques. This populationwas most easily detected in May and June, but we stillneeded more than 9000 trap-hours of trapping effortto reach a 95% likelihood of capturing one of theturtles present. Based on our results, we suggest astandard of 20 traps per hectare for 20 days (a 20–20rule) as an effort level that has a very high likelihoodof detecting such small but potentially viable popula-tions.
NOTES AND FIELD REPORTS 149

The bog turtle, Glyptemys muhlenbergii, formerly
assigned to the genus Clemmys (Holman and Fritz 2001),
is declining throughout its range as a result of habitat
destruction and alteration. Bog turtles are naturally
vulnerable to loss of small wetlands because they occur
in discrete and isolated populations (Ernst 2001). The
turtle is now protected as threatened or endangered in all
12 US states of occurrence. In 1997, the northern
population was federally listed as threatened and the
southern population was listed as threatened by similarity
of appearance (USFWS 1997a, b).
Surveys are being conducted throughout the range of
the bog turtle to assess potential sites for various reasons.
Natural areas inventories are being conducted by state
agencies to assess the quality of habitat and the presence of
rare species. Nongovernmental entities, e.g., Project Bog
Turtle, conduct surveys to identify new sites and to
determine the conservation status of the turtles throughout
the south. Developers also initiate surveys in sites
scheduled for projects to satisfy the regulatory obligation
for mitigation, to establish the need for buffer areas, or
justify project modifications. Since the bog turtle was
federally listed in 1997, there has been an increased
demand for surveys to meet regulatory obligations.
When potential bog turtle sites are slated for
development, surveyors are called upon to make a
determination as to the presence or absence of these
animals. In the experience of ABS, these requests come at
all times of year and are often purported to be urgent. The
searching-probing method, also known as the visual search
method, is the most common method of detecting bog
turtles (Smith 1994; Herman 1994). This method is
described as a phase 2 survey in the Guidelines for Bog
Turtle Surveys in the Bog Turtle Northern Population
Recovery Plan (USFWS 2001). Researchers follow turtle
tracks, look for basking turtles, and seek concealed
animals by groping in the mud with their hands or probing
with wooden sticks. Phase 2 surveys are conducted
between 15 April and 15 June, and compliance with the
protocol requires intensive investment of search time
under defined weather conditions. Trapping is an addi-
tional method of surveying for bog turtles. Fahey (1992,
1998) first used this method in the south in the late 1980s.
Most recent researchers have used trapping to some
degree, usually in sites that look promising or in historic
sites that have not yielded turtles by using the phase 2
survey method. Sites under permit review that are
surveyed without finding evidence of bog turtles may
then be destroyed.
Demographic data remain largely unavailable for most
sites, but indications are that most populations are small
(Table 1). In addition, bog turtles are difficult to detect
because they are small, rare, cryptically colored, and
behaviorally inconspicuous. It is probable that some sites
that do contain turtles, especially those with small
populations, are being overlooked. The question then
arises: how and when should potential sites be examined to
minimize the chances of overlooking a potentially viable
population of bog turtles?
Under one commonly used evaluation system (Kle-
mens 1993; USFWS 2001), sites occupied by as few as 6–
10 turtles are regarded as ‘‘potentially viable’’ or ‘‘fair’’ if
other habitat factors are favorable. To avoid the loss of
such small populations through poorly timed or insuffi-
ciently intensive search, it is important to investigate the
likelihood of detecting such small populations with
commonly used search techniques. We drew upon data
collected in the course of a habitat-use study of a small
population of bog turtles of not less than 7 animals to
explore this issue. By using data collected from 1993 to
2001, we compared the effectiveness of 2 common search
techniques (searching-probing vs. trapping), determined
the best season for such survey work, compared the
detection success at this site with that for a larger
population, and estimated the level of trapping effort
required to reliably detect this small group.
Methods. — The Sites. — S3 is a complex of wetlands
on a privately owned farm in the Piedmont region of North
Carolina, approximately 450 m (1500 ft) above sea level.
There are 3 very small and distinct wetland patches
contained within a diameter of about 0.5 km and separated
by a gravel-and-cobble dominated stream. Together they
amount to 1.025 ha of wetlands suitable for bog turtles.
Survey work at the site began in May of 1993. Based on
extensive survey effort, we are confident that the
population size, including both adults and hatchlings
recruited during the study, was 7 turtles in 1993 and 13 in
2001. According to the habitat and population factors
presented in Klemens (1993), the S3 site ranks as
‘‘possibly viable’’ among 3 ranks: ‘‘viable’’, ‘‘possibly
viable’’, or ‘‘nonviable’’. These categories were later
revised to ‘‘good’’, ‘‘fair’’, and ‘‘poor’’ (USFWS 2001).
G2 is also on a privately owned farm located in the
Piedmont in North Carolina. Although configured some-
what differently, the size of the wet area suitable for bog
turtles is similar to that of S3. A study conducted during an
overlapping time period (Green 1994, 1995, 1996) resulted
in 48 turtles being captured at the site (Herman 1999), and
the actual population is undoubtedly larger. G2 ranks as
‘‘viable’’ or ‘‘good’’ on the Klemens assessment scale.
Capture Methods. — Turtles were captured by using
visual searches, probing, and handmade unbaited traps.
Traps were shaded, placed in shallow water, and checked
every 24–48 hours. Captured bog turtles were permanently
marked and released at the point of capture. Traps were
used in S3 for slightly more than 175,000 trap-hours over
the 8-year period (1 trap-hour ¼ 1 trap in site for 1 hour).
In 1993 and 1994, traps were distributed across the 3
patches of S3. After 1995, traps were placed in areas
where turtles were expected, and areas that had been
nonproductive in the past were avoided. Visual search
times were estimated and recorded at the end of each visit.
Time invested by the workers tending traps was also
estimated.
150 CHELONIAN CONSERVATION AND BIOLOGY, Volume 7, Number 1 — 2008

Data Analysis. — For comparison of the phase 2
techniques with trapping, a turtle yield value was
computed for each calendar month of effort at the site as
the number of turtles captured per hour of investigator
time. The calendar year was divided into 2-month
categories to achieve a statistically useful number of yield
values for each time category. Two-way analysis of
variance (ANOVA) was used to examine the effect of time
period and capture technique.
For a comparison of trapping success between sites,
we aggregated trap hours on a monthly basis:
Monthly trap-hours ¼ number of traps pre-
sent 3 hours of trap effort for month
We compared effectiveness of trapping turtles in S3
(N ¼ 7–15) and G1 (N ¼ 48þ). Because of inter-year
variation in turtle activity from weather conditions, only
periods of simultaneous study were compared. Trapping
occurred on both sites simultaneously during 4 months
(June 1993, May 1994, June 1994, and June 1995). A
Mann-Whitney U-test was used to compare trapping
success, expressed as turtles/trap-hour, across the 2 sites.
To evaluate the intensity of trapping effort needed to
detect the small S3 population, we computed the
cumulative trap-hours that led up to each successful
trapping event. We began either from the initial placement
of traps in the site for the first capture or from the previous
trap capture in the site. Sometimes two or more turtles
were captured on the same day in the same or different
traps. In these cases, all were assigned cumulative trap-
hours from the most recent capture, rather than treating the
second and subsequent turtles as requiring zero trap-hours
for their capture. We transformed these data logarithmi-
cally to achieve a normal distribution and used the
transformed data to calculate a cumulative trap-hour effort
that would encompass 95% of this distribution. We
performed this analysis on the whole data set and on a
subset of captures that occurred within May and June
during the 1993–1995 time frame in case improved trap
placement late in the study influenced the time required.
We also derived an alternative estimator of the
trapping effort necessary to detect the S3 population
through an inverse prediction procedure. By using May
and June data only, we modeled the number of turtles
captured during a calendar month as a function of the trap-
hours of trapping effort in the site during that calendar
month. We then obtained a 95% confidence interval for the
trap-hours needed to capture a single turtle. Because
capture of one animal would suffice to confirm presence at
the site, the upper bound of the 95% confidence interval
represents the trapping effort required for this probability
of detecting the population.
The R system (R Development Core Team 2005) was
used for all statistical operations described.
Results. — Technique and Season at S3. — Trapping
was much more effective than visual searching for
detecting bog turtles at S3 (Fig. 1). Locating turtles by
phase 2 methods at the S3 site required an average of 27.4
search hours per turtle captured for the years 1993 to 1997
and 2000. No turtles were captured this way in 1998 or
1999. Effects of both bimonthly category ( p ¼ 0.006) and
capture technique ( p , 0.001) were highly significant,
and the trapping proved to be a more effective investment
of the investigator’s time. May and June were the most
rewarding times to search for turtles by any method at this
site.
Locating bog turtles remained difficult at S3 during
May and June compared with G2 (Fig. 2). Trapping effort
per turtle capture at S3 site for the period of overlap
averaged 2600 trap-hours per turtle trapped as opposed to
an average of 176 trap-hours at the G2 site. Average
trapping success during the 4 months of concurrent effort
was more than an order of magnitude lower at S3
(3.05 3 10�4 turtles/trap-hour) than at G2 (6.38 3 10�3
turtles/trap-hour). Despite the small sample size, the
intersite difference was statistically significant (p ¼0.021).
Detection of the Small Population at S3. — The
number of turtles trapped in a calendar month at S3
depended on the trapping time invested, as well as the
month of the year. Turtles were not captured during every
month of active work at the site. During 7 of the 23 months
in which trapping was conducted, no turtles were caught; in
3 of those months . 1000 trap-hours were invested
without success. Analysis of the cumulative trap presence
times leading up to each S3 capture indicated that the
average (log-transformed) capture occurred at 1820 trap-
hours overall. In the subset of May and June effort early in
the study, the corresponding value was 1850 trap-hours.
The upper bound of the range into which a new capture was
95% likely to fall throughout the study was 9286 trap-hours
across the entire study, or 10,079 trap-hours for the May-
June subset of the data from early in the study.
The inverse prediction approach applied to May and
June data yielded a much larger estimate, 18,645 trap-
hours (Fig. 3). Two points that represented May and June
of 1999, a drought year, had a very large effect on this
analysis. Eliminating these 2 points from the inverse
prediction yielded an investment of 10,550 trap-hours for a
Table 1. Most bog turtle populations are small.
Study State Population size
Buhlmann et al. 1997 Virginia , 20 individuals in most sitesHerman and Tryon 1997 North Carolina � 35 turtles per ha in most sitesErnst 2001 Not specified usually , 50 individuals
NOTES AND FIELD REPORTS 151
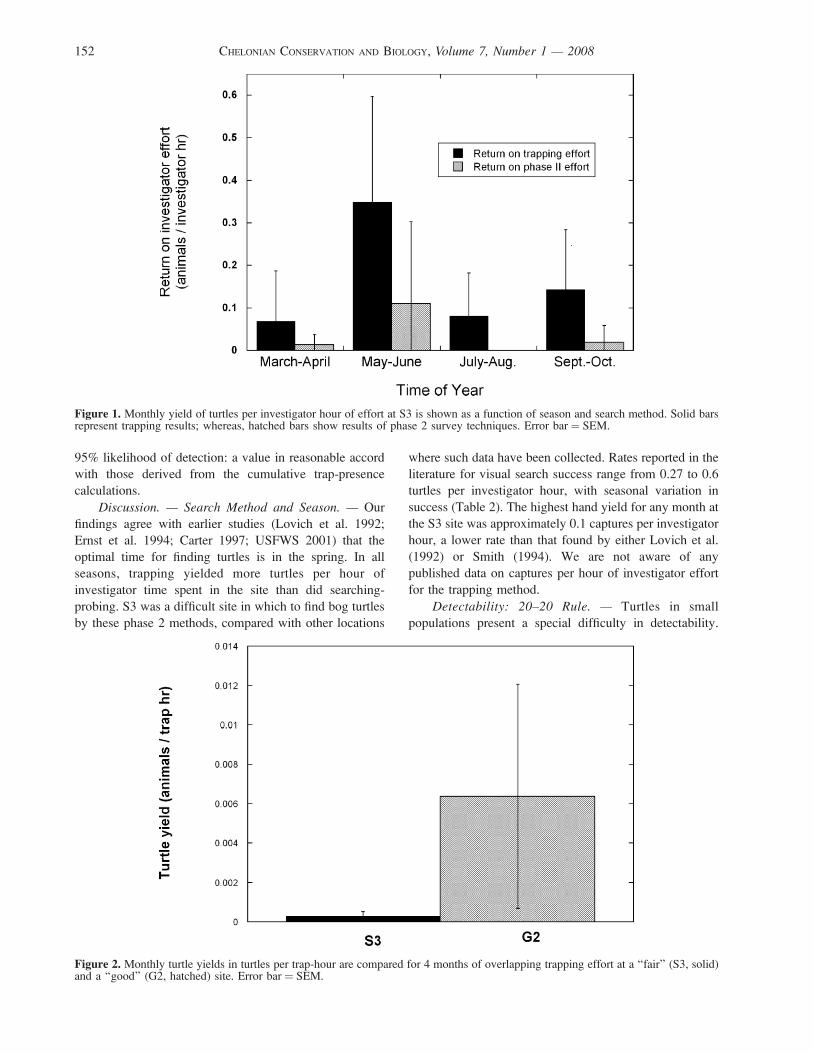
95% likelihood of detection: a value in reasonable accord
with those derived from the cumulative trap-presence
calculations.
Discussion. — Search Method and Season. — Our
findings agree with earlier studies (Lovich et al. 1992;
Ernst et al. 1994; Carter 1997; USFWS 2001) that the
optimal time for finding turtles is in the spring. In all
seasons, trapping yielded more turtles per hour of
investigator time spent in the site than did searching-
probing. S3 was a difficult site in which to find bog turtles
by these phase 2 methods, compared with other locations
where such data have been collected. Rates reported in the
literature for visual search success range from 0.27 to 0.6
turtles per investigator hour, with seasonal variation in
success (Table 2). The highest hand yield for any month at
the S3 site was approximately 0.1 captures per investigator
hour, a lower rate than that found by either Lovich et al.
(1992) or Smith (1994). We are not aware of any
published data on captures per hour of investigator effort
for the trapping method.
Detectability: 20–20 Rule. — Turtles in small
populations present a special difficulty in detectability.
Figure 1. Monthly yield of turtles per investigator hour of effort at S3 is shown as a function of season and search method. Solid barsrepresent trapping results; whereas, hatched bars show results of phase 2 survey techniques. Error bar ¼ SEM.
Figure 2. Monthly turtle yields in turtles per trap-hour are compared for 4 months of overlapping trapping effort at a ‘‘fair’’ (S3, solid)and a ‘‘good’’ (G2, hatched) site. Error bar ¼ SEM.
152 CHELONIAN CONSERVATION AND BIOLOGY, Volume 7, Number 1 — 2008

Results of this study suggests that small populations of
turtles in potential sites may easily go undetected when
using only visual searches. According to our cumulative
trap-hour analysis, a minimum of roughly 9000 trap-hours
per ha of trapping effort in May and June is needed to have
95% confidence of detecting a population of bog turtles of
the size reported in this study (N ‹10). The considerably
larger value obtained from our inverse prediction approach
was heavily influenced by 2 data points (Fig. 3), which
represented May and June of 1999, a very dry year.
Omission of these points may be justified if we assume
that no responsible surveyor would attempt to evaluate an
unknown potential site in a year as dry as 1999 was in the
North Carolina Piedmont. The approximately 10,500 trap-
hour value obtained by eliminating these outliers appears
reasonable because the cumulative trap-hour analysis
could not include unsuccessful efforts. Because the effort
levels derived from these 2 methods are roughly
equivalent to setting 20 traps for 20 days in May and
June, we call this our ‘‘20–20 rule’’. The influence of 1999
on the data suggests that detecting the S3 population
during a drought would require much more than a 20–20
effort.
Detection failures represent a serious problem for bog
turtle conservation because such a large proportion of the
known sites are occupied by relatively few animals.
Herman and Tryon (1997) determined that only 23% of the
sites in the southern range of the turtle could be considered
‘‘viable’’. Viability was defined in that study as a
population of 30 or more individuals with sufficient core
habitat and evidence of reproduction or recruitment. When
using a similar suite of characteristics as outlined in
Klemens (1993), USFWS (2001) combined occurrences
into population assessment sites (PAS) for evaluation and
concluded that only 38% of ranked sites (104 of 275) in
the northern range of the turtle could be considered
‘‘good’’. By using the same PAS method of aggregating
sites to assess the populations in the south, Herman (2003)
concluded that 50% ranked as ‘‘good’’.By any reckoning, the sites that can be considered
‘‘good’’ or ‘‘viable’’ deserve protection. Because the
majority of the known bog turtle sites rank below this
level, identification and protection will also be needed for
some of the ‘‘possibly viable’’ or ‘‘fair’’ sites. Caughley
and Gunn (1996) provide convincing evidence that
adequate conservation plans require the preservation of
Figure 3. The number of bog turtle captures during May and June trapping attempts are plotted as a function of trapping time inthousand trap-hours invested during that calendar month. The regression line is forced through the origin.
Table 2. Effectiveness of visual searching varies widely among published reports.
StudyTurtles per
investigator hour Time of year
Lovich et al. (1992) North Carolina 0.27 Mar–DecSmith (1994) Maryland 0.6a late Apr to early JulSomers and Mansfield-Jones (present study) 0.04 Mar–Oct
a Approximate rate, calculated from data reported on time to first capture.
NOTES AND FIELD REPORTS 153
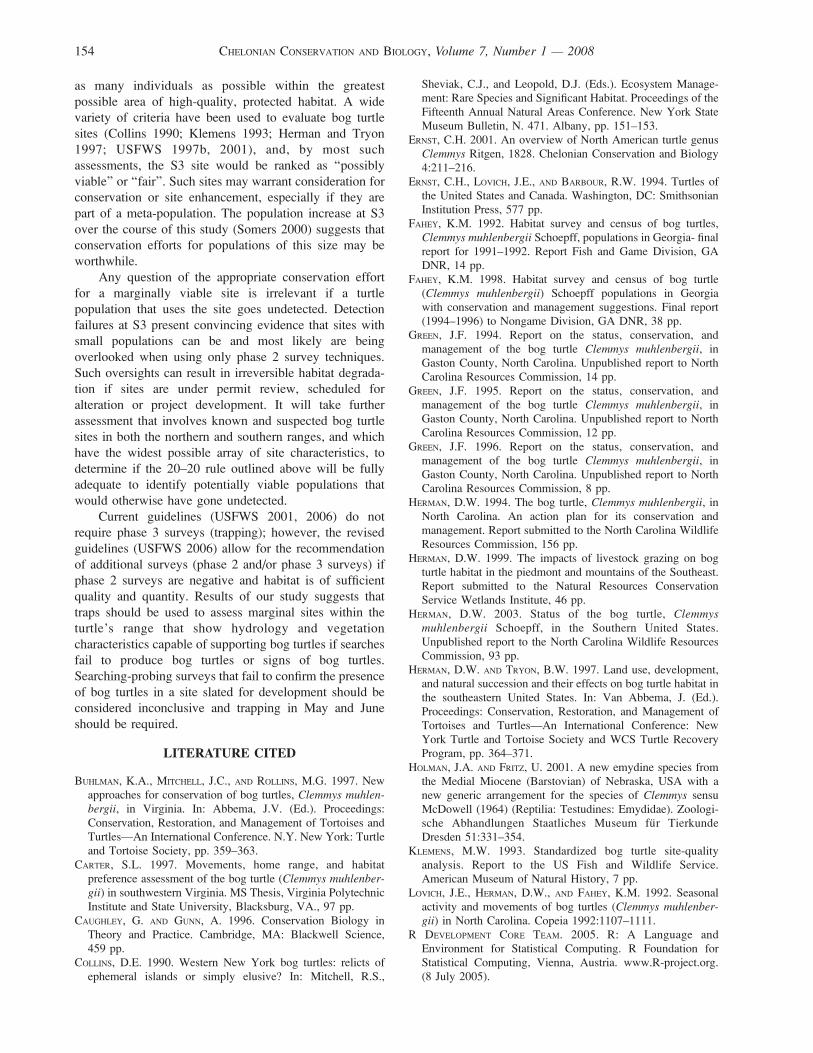
as many individuals as possible within the greatest
possible area of high-quality, protected habitat. A wide
variety of criteria have been used to evaluate bog turtle
sites (Collins 1990; Klemens 1993; Herman and Tryon
1997; USFWS 1997b, 2001), and, by most such
assessments, the S3 site would be ranked as ‘‘possibly
viable’’ or ‘‘fair’’. Such sites may warrant consideration for
conservation or site enhancement, especially if they are
part of a meta-population. The population increase at S3
over the course of this study (Somers 2000) suggests that
conservation efforts for populations of this size may be
worthwhile.
Any question of the appropriate conservation effort
for a marginally viable site is irrelevant if a turtle
population that uses the site goes undetected. Detection
failures at S3 present convincing evidence that sites with
small populations can be and most likely are being
overlooked when using only phase 2 survey techniques.
Such oversights can result in irreversible habitat degrada-
tion if sites are under permit review, scheduled for
alteration or project development. It will take further
assessment that involves known and suspected bog turtle
sites in both the northern and southern ranges, and which
have the widest possible array of site characteristics, to
determine if the 20–20 rule outlined above will be fully
adequate to identify potentially viable populations that
would otherwise have gone undetected.
Current guidelines (USFWS 2001, 2006) do not
require phase 3 surveys (trapping); however, the revised
guidelines (USFWS 2006) allow for the recommendation
of additional surveys (phase 2 and/or phase 3 surveys) if
phase 2 surveys are negative and habitat is of sufficient
quality and quantity. Results of our study suggests that
traps should be used to assess marginal sites within the
turtle’s range that show hydrology and vegetation
characteristics capable of supporting bog turtles if searches
fail to produce bog turtles or signs of bog turtles.
Searching-probing surveys that fail to confirm the presence
of bog turtles in a site slated for development should be
considered inconclusive and trapping in May and June
should be required.
LITERATURE CITED
BUHLMAN, K.A., MITCHELL, J.C., AND ROLLINS, M.G. 1997. Newapproaches for conservation of bog turtles, Clemmys muhlen-bergii, in Virginia. In: Abbema, J.V. (Ed.). Proceedings:
Conservation, Restoration, and Management of Tortoises andTurtles—An International Conference. N.Y. New York: Turtleand Tortoise Society, pp. 359–363.
CARTER, S.L. 1997. Movements, home range, and habitatpreference assessment of the bog turtle (Clemmys muhlenber-gii) in southwestern Virginia. MS Thesis, Virginia PolytechnicInstitute and State University, Blacksburg, VA., 97 pp.
CAUGHLEY, G. AND GUNN, A. 1996. Conservation Biology inTheory and Practice. Cambridge, MA: Blackwell Science,459 pp.
COLLINS, D.E. 1990. Western New York bog turtles: relicts ofephemeral islands or simply elusive? In: Mitchell, R.S.,
Sheviak, C.J., and Leopold, D.J. (Eds.). Ecosystem Manage-ment: Rare Species and Significant Habitat. Proceedings of theFifteenth Annual Natural Areas Conference. New York StateMuseum Bulletin, N. 471. Albany, pp. 151–153.
ERNST, C.H. 2001. An overview of North American turtle genusClemmys Ritgen, 1828. Chelonian Conservation and Biology4:211–216.
ERNST, C.H., LOVICH, J.E., AND BARBOUR, R.W. 1994. Turtles ofthe United States and Canada. Washington, DC: SmithsonianInstitution Press, 577 pp.
FAHEY, K.M. 1992. Habitat survey and census of bog turtles,Clemmys muhlenbergii Schoepff, populations in Georgia- finalreport for 1991–1992. Report Fish and Game Division, GADNR, 14 pp.
FAHEY, K.M. 1998. Habitat survey and census of bog turtle(Clemmys muhlenbergii) Schoepff populations in Georgiawith conservation and management suggestions. Final report(1994–1996) to Nongame Division, GA DNR, 38 pp.
GREEN, J.F. 1994. Report on the status, conservation, andmanagement of the bog turtle Clemmys muhlenbergii, inGaston County, North Carolina. Unpublished report to NorthCarolina Resources Commission, 14 pp.
GREEN, J.F. 1995. Report on the status, conservation, andmanagement of the bog turtle Clemmys muhlenbergii, inGaston County, North Carolina. Unpublished report to NorthCarolina Resources Commission, 12 pp.
GREEN, J.F. 1996. Report on the status, conservation, andmanagement of the bog turtle Clemmys muhlenbergii, inGaston County, North Carolina. Unpublished report to NorthCarolina Resources Commission, 8 pp.
HERMAN, D.W. 1994. The bog turtle, Clemmys muhlenbergii, inNorth Carolina. An action plan for its conservation andmanagement. Report submitted to the North Carolina WildlifeResources Commission, 156 pp.
HERMAN, D.W. 1999. The impacts of livestock grazing on bogturtle habitat in the piedmont and mountains of the Southeast.Report submitted to the Natural Resources ConservationService Wetlands Institute, 46 pp.
HERMAN, D.W. 2003. Status of the bog turtle, Clemmysmuhlenbergii Schoepff, in the Southern United States.Unpublished report to the North Carolina Wildlife ResourcesCommission, 93 pp.
HERMAN, D.W. AND TRYON, B.W. 1997. Land use, development,and natural succession and their effects on bog turtle habitat inthe southeastern United States. In: Van Abbema, J. (Ed.).Proceedings: Conservation, Restoration, and Management ofTortoises and Turtles—An International Conference: NewYork Turtle and Tortoise Society and WCS Turtle RecoveryProgram, pp. 364–371.
HOLMAN, J.A. AND FRITZ, U. 2001. A new emydine species fromthe Medial Miocene (Barstovian) of Nebraska, USA with anew generic arrangement for the species of Clemmys sensuMcDowell (1964) (Reptilia: Testudines: Emydidae). Zoologi-sche Abhandlungen Staatliches Museum fur TierkundeDresden 51:331–354.
KLEMENS, M.W. 1993. Standardized bog turtle site-qualityanalysis. Report to the US Fish and Wildlife Service.American Museum of Natural History, 7 pp.
LOVICH, J.E., HERMAN, D.W., AND FAHEY, K.M. 1992. Seasonalactivity and movements of bog turtles (Clemmys muhlenber-gii) in North Carolina. Copeia 1992:1107–1111.
R DEVELOPMENT CORE TEAM. 2005. R: A Language andEnvironment for Statistical Computing. R Foundation forStatistical Computing, Vienna, Austria. www.R-project.org.(8 July 2005).
154 CHELONIAN CONSERVATION AND BIOLOGY, Volume 7, Number 1 — 2008
SMITH, S.A. 1994. Report on the status of the bog turtle Clemmysmuhlenbergii in Maryland. Unpublished report submitted tothe US Fish and Wildlife Service, 9 pp.
SOMERS, A.B. 2000. A population of bog turtles in the piedmontof North Carolina: habitat preferences, capture methodefficacy, conservation initiatives, and site enhancement.Report to United States Natural Resources ConservationService, Wetlands Science Institute, 103 pp.
U.S. FISH AND WILDLIFE SERVICE. 1997a. Proposed rule to list thenorthern population of the bog turtle as threatened and thesouthern population as threatened due to similarity ofappearance. Federal Register 62:4229–4239.
U.S. FISH AND WILDLIFE SERVICE. 1997b. Endangered and
threatened wildlife and plants; final rule to list the northern
population of the bog turtle as threatened and the southern
population as threatened due to similarity of appearance.
Federal Register 62:59605–59623.
U.S. FISH AND WILDLIFE SERVICE. 2001. Bog turtle (Clemmys
muhlenbergii), northern population recovery plan. Hadley,
MA., 109 pp.
U.S. FISH AND WILDLIFE SERVICE. 2006. Guidelines for bog
turtle surveys (revised). www.fws.gov/northeast/nyfo/es/
BT%20SURVEY_April%202006.pdf. (6 June 2006).
Received: 9 November 2006
Revised and Accepted: 7 April 2008
NOTES AND FIELD REPORTS 155