Did Romanization impact Gallic pig morphology? New insights from molar geometric morphometrics
10
Did Romanization impact Gallic pig morphology? New insights from molar geometric morphometrics Colin Duval a, b, * ,S ebastien Lepetz b , Marie-Pierre Horard-Herbin a , Thomas Cucchi b, c a CNRS, UMR7324, Cit es, territoires, environnement et soci et es (CITERES), Laboratoire Arch eologie et Territoires, Universit e François-Rabelais, MSH Villes et Territoires, BP 60449, 37204, Tours, France b CNRS, UMR 7209, Arch eozoologie, Arch eobotanique: Soci et es, Pratiques et Environnements, Mus eum national d'Histoire naturelle, D ep. EGB, 55 rue Buffon, CP 56, 75005, Paris, France c Department of Archaeology, University of Aberdeen, St. Mary's Building, Elphinstone Road, United Kingdom article info Article history: Received 7 August 2014 Received in revised form 10 February 2015 Accepted 2 March 2015 Available online 11 March 2015 Keywords: Archaeozoology Iron Age Roman period Gaul Italy Molar shape Morphological and phenotypic changes Local and regional diversity abstract In Western Europe, at the turn of our era, the emergence of the Roman economic and agropastoral model is considered as the trigger for morphological changes experienced by livestock. This assumption is now undermined, reviving questions of the origin and mechanism of these changes as well as the influence of Gaul's agricultural particularities in the process. To investigate this question we used a geometric morphometric approach to study the phenotypic relationships of almost 600 dental remains of pigs (Sus scrofa domesticus) from 11 Gallic and Italian sites, and pinpoint evidence of Roman or indigenous signature on the livestock. The comparison of these different samples allowed us to demonstrate that the link between the Roman and Gallic pigs is weak, and, more importantly, that each of the two territories seem to follow its own livestock management model. Furthermore, each region or settlement within Gaul adopted their own particular pastoral or supplying strategies; apart from two urban sites of central Gaul which showed clear phenotypic relationships with southern populations. These results suggest that the pigs' morphology depended mainly on agricultural and economic characteristics of the different territories, within Gaul and Italy, except perhaps on some urban sites with different supply strategies. It seems, therefore, that the changing economic environment impacted both provinces independently, or at least differently, since it cannot be excluded that there may have been some commercial relationships between them. © 2015 Elsevier Ltd. All rights reserved. 1. Introduction In recent years, the changes in growth and form of domestic herds from the Roman Empire have been extensively investigated by zooarchaeologists (cf. for example Albarella et al., 2008; MacKinnon, 2010; Colominas et al., 2013). In Gaul, these morpho- logical changes are attested long before the Roman Conquest, as early as the end of the Iron Age (between the 4th and the 1st century BC). During this period, the livestock's morphology appeared to differ from one region to another (administrative regions or valleys e see Duval et al., 2012) and, at least for the Northern Gaul (Duval et al., 2013), phenotypic changes happened as early as La T ene C (about 260e150 BC). Later (between the 2nd and the end of the 1st c. BC, depending on the region), according to studies mainly performed on cattle and horse, the emergence of the Roman economic and agropastoral practices will lead to the ac- celeration of morphological changes and the emergence of a new diversity of forms and growth patterns (cf. for example Johnstone, 2004; MacKinnon, 2010; Duval et al., 2012). Unfortunately these studies were unable to provide answers about the precise causes and mechanisms of this phenotypic differences and changes, and overlooked one of key component of Gaul's domestic livestock: the pig. The morphological change in Gallic pigs over time is still poorly documented due to the lack of large conducive samples (although this could be overcome by the use of the LSI method e see for example Duval et al., forthcoming). One of the reasons is that pigs * Corresponding author. CNRS, UMR7324, Cit es, territoires, environnement et soci et es (CITERES), Laboratoire Arch eologie et Territoires, Universit e François- Rabelais, MSH Villes et Territoires, BP 60449, 37204, Tours, France. E-mail addresses: [email protected] (C. Duval), [email protected] (S. Lepetz), [email protected] (M.-P. Horard-Herbin), [email protected] (T. Cucchi). Contents lists available at ScienceDirect Journal of Archaeological Science journal homepage: http://www.elsevier.com/locate/jas http://dx.doi.org/10.1016/j.jas.2015.03.004 0305-4403/© 2015 Elsevier Ltd. All rights reserved. Journal of Archaeological Science 57 (2015) 345e354
-
Upload
univ-tours -
Category
Documents
-
view
6 -
download
0
Transcript of Did Romanization impact Gallic pig morphology? New insights from molar geometric morphometrics

lable at ScienceDirect
Journal of Archaeological Science 57 (2015) 345e354
Contents lists avai
Journal of Archaeological Science
journal homepage: http : / /www.elsevier .com/locate/ jas
Did Romanization impact Gallic pig morphology? New insights frommolar geometric morphometrics
Colin Duval a, b, *, S�ebastien Lepetz b, Marie-Pierre Horard-Herbin a, Thomas Cucchi b, c
a CNRS, UMR7324, Cit�es, territoires, environnement et soci�et�es (CITERES), Laboratoire Arch�eologie et Territoires, Universit�e François-Rabelais,MSH Villes et Territoires, BP 60449, 37204, Tours, Franceb CNRS, UMR 7209, Arch�eozoologie, Arch�eobotanique: Soci�et�es, Pratiques et Environnements, Mus�eum national d'Histoire naturelle, D�ep. EGB,55 rue Buffon, CP 56, 75005, Paris, Francec Department of Archaeology, University of Aberdeen, St. Mary's Building, Elphinstone Road, United Kingdom
a r t i c l e i n f o
Article history:Received 7 August 2014Received in revised form10 February 2015Accepted 2 March 2015Available online 11 March 2015
Keywords:ArchaeozoologyIron AgeRoman periodGaulItalyMolar shapeMorphological and phenotypic changesLocal and regional diversity
* Corresponding author. CNRS, UMR7324, Cit�es, tsoci�et�es (CITERES), Laboratoire Arch�eologie et TerrRabelais, MSH Villes et Territoires, BP 60449, 37204,
E-mail addresses: [email protected] (C. [email protected] (M.-P. Hor(T. Cucchi).
http://dx.doi.org/10.1016/j.jas.2015.03.0040305-4403/© 2015 Elsevier Ltd. All rights reserved.
a b s t r a c t
In Western Europe, at the turn of our era, the emergence of the Roman economic and agropastoral modelis considered as the trigger for morphological changes experienced by livestock. This assumption is nowundermined, reviving questions of the origin and mechanism of these changes as well as the influence ofGaul's agricultural particularities in the process. To investigate this question we used a geometricmorphometric approach to study the phenotypic relationships of almost 600 dental remains of pigs (Susscrofa domesticus) from 11 Gallic and Italian sites, and pinpoint evidence of Roman or indigenoussignature on the livestock. The comparison of these different samples allowed us to demonstrate that thelink between the Roman and Gallic pigs is weak, and, more importantly, that each of the two territoriesseem to follow its own livestock management model. Furthermore, each region or settlement withinGaul adopted their own particular pastoral or supplying strategies; apart from two urban sites of centralGaul which showed clear phenotypic relationships with southern populations. These results suggest thatthe pigs' morphology depended mainly on agricultural and economic characteristics of the differentterritories, within Gaul and Italy, except perhaps on some urban sites with different supply strategies. Itseems, therefore, that the changing economic environment impacted both provinces independently, or atleast differently, since it cannot be excluded that there may have been some commercial relationshipsbetween them.
© 2015 Elsevier Ltd. All rights reserved.
1. Introduction
In recent years, the changes in growth and form of domesticherds from the Roman Empire have been extensively investigatedby zooarchaeologists (cf. for example Albarella et al., 2008;MacKinnon, 2010; Colominas et al., 2013). In Gaul, these morpho-logical changes are attested long before the Roman Conquest, asearly as the end of the Iron Age (between the 4th and the 1stcentury BC). During this period, the livestock's morphologyappeared to differ from one region to another (administrative
erritoires, environnement etitoires, Universit�e François-Tours, France.), [email protected] (S. Lepetz),ard-Herbin), [email protected]
regions or valleys e see Duval et al., 2012) and, at least for theNorthern Gaul (Duval et al., 2013), phenotypic changes happened asearly as La T�ene C (about 260e150 BC). Later (between the 2nd andthe end of the 1st c. BC, depending on the region), according tostudiesmainly performed on cattle and horse, the emergence of theRoman economic and agropastoral practices will lead to the ac-celeration of morphological changes and the emergence of a newdiversity of forms and growth patterns (cf. for example Johnstone,2004; MacKinnon, 2010; Duval et al., 2012). Unfortunately thesestudies were unable to provide answers about the precise causesand mechanisms of this phenotypic differences and changes, andoverlooked one of key component of Gaul's domestic livestock: thepig.
The morphological change in Gallic pigs over time is still poorlydocumented due to the lack of large conducive samples (althoughthis could be overcome by the use of the LSI method e see forexample Duval et al., forthcoming). One of the reasons is that pigs

C. Duval et al. / Journal of Archaeological Science 57 (2015) 345e354346
were widely consumed in Gaul but often at a very young age;therefore most of their bones' remains are unfused, hamperingreliable osteometric analysis. A second one is the high fragmenta-tion of pigs' remains due to butchering practices and post-depositional taphonomy, preventing accurate morphometricinvestigation. Complete dental remains, however, prove to be theultimate phenotypic marker to investigate changes in pig pop-ulations over large samples, both spatially and temporally.
Thanks to the recent development of geometric morphometricapproaches applied to the dental remains of suids (Cucchi et al.,2009, 2011; Evin et al., 2013), we can now investigate the impor-tant questions regarding the impact of Romanization on pigmorphology in Gaul from the 4th c. BC to the 3rd c. AD. Was pighusbandry in Gaul influenced by the introduction of animals fromRoman centers or rather by the zootechnic improvement of localherds? What was the extent of contact between Gaul and Italy, andin particular, the degree of Rome's influence over the Galliczootechnical improvements? And finally, how diverse was thedental morphology of Gallic pigs?
2. Material and methods
2.1. The archaeological sites
The analysis of pig dental morphotypes in Gaul is based on theform (size and shape) of 599 second lower molars (M2) usinggeometric morphometrics (Table 1). The molar tooth was chosenprincipally because it has been identified as an efficient phenotypicmarker to track population histories (Ervynck et al., 2007; Rowley-Conwy, Dobney, 2007; Albarella et al., 2009; Cucchi et al., 2011;Evin et al., 2015), and is well represented within archaeologicalassemblages. In the samples studied, the first lower molar of pigs(slaughtered primarily around 1e2 years) is often greatly worn,
Table 1Archaeological samples studied with their site name, their membership to the different Rospan, the sample size per individual chronological context and the latitudinal position of eis displayed in Population ID and will be used in the text, tables and figures. Chronologica
Site names Roman provinces Chronology n te
Glisy e Les Terres de Ville A: Gallia Belgica 3rd c. BC 49Ribemont-sur-Ancre 1st c. BC 54
third quarterof the 2nd c. AD
36
Amiens/Samarobriva e Palaisdes Sports
1st c. AD 50
Levroux e Les Ar�enes B: Gallia Lugdunensisand Aquitania
phase 1 (200e150 BC) 33phase 2 (150e100 BC) 13phase 3 (150e100 BC) 54phase 4 (100e80 BC) 19phase 5 (20 BC to 14 AD) 13
Saint-Marcel/Argentomagus end of the 1st c. BC to theend of the 1st c. AD
44
Tours/Caesarodunum 1st c. AD 272nd c. AD 20
Lattes/Lattara C: Gallia Narbonensis 5th c. BC 44th c. BC 223rd c. BC 82nd c. BC 131st c. BC 91st c. AD 14
Nîmes/Nemausus from the 1st to the 3rd c. AD 20Aix-en-Provence/Aquae
Sextiae e ZAC SextiusMirabeau
second half of the 2nd c. AD 36
Musarna D: Italy peninsula from the 3rd to the 1st c. BC 24Rome e Vigna Barberini 2nd c. AD 37
with the third lower molar still either not completely formed orerupted. The material studied come from 11 sites (9 from Gallicterritory and 2 from Italy) in order to compare dental phenotypes ofpigs from Gaul and the Italian peninsula (Fig. 1). In order to assess alarge area of Gaul, and allow the distinction of regional morpho-types within this territory, the sites chosen came from threedistinct geographic areas: (1) Gallia Belgica, (2) between GalliaLugdunensis and Aquitania, and (3) Narbonensis (Fig. 1). This sam-pling strategy cover a large latitudinal gradient (from an oceanic toa Mediterranean climate) which superimposed over importantdisparities in administrative status and cultural and agropastoralidiosyncrasies; all of which could have contributed to the diversityin pig morphology. In order to cover both the Gallic and Romanperiods, we selected well dated sites with large sample sizes fromeach area. Where possible, we selected sites with a long chrono-logical time span in order to track size and shape changes over thedifferent periods. The time span covered by the sites of GalliaBelgica (under Roman influence from the end of the 1st c. BC) ex-tends from the 3rd c. BC to the 2nd c. AD, from the 2nd c. BC to the2nd c. AD for Gallia Lugdunensis and Aquitania (conquered from theend of the 1st century AD too), and from the 5th c. BC to the 3rd c.AD for Gallia Narbonensis (occupied since the 2nd century BC); thetwo Italian sites date from the 3rd to 1st c. BC (Musarna) and 2nd c.AD (Rome).
In the northern region (A), the samples studied come from threesites (situated less than 10 km apart): the rural settlement of Glisy(3rd c. BC), the Gallic, then later a Roman sanctuary, of Ribemont-sur-Ancre (1st c. BC and 2nd c. AD) and the city of Amiens/Samar-obriva (1st c. AD). In the centre of Gaul (B) we choose three othersites (situated more than 100 km apart): the Gallic village of Lev-roux (200 BC to 14 AD) where pig husbandry seemed to be pre-ponderant (Horard-Herbin, 1997; Fr�emondeau, 2012), the Romanagglomeration of Argentomagus (1st c. AD) and the city of Tours/
man provinces divided into four geographic areas (A, B, C and D), their chronologicalach site. Each chronological context is considered as a population sample whose labell factor provides the grouping factor used to test the temporal effect.
eth Chronologicalfactor
Population ID Latitude Reference
3BC GLI 3BC 49.88 Auxiette (unpublished)1BC RIB 1BC 49.96 M�eniel (unpublished)2AD RIB 2AD Fercoq du Leslay
and Lepetz (2008)1AD AMI 1AD 49.89 Lepetz (2010)
2BC LEV 1 46.98 Horard-Herbin (1997)2BC LEV 22BC LEV 31BC LEV 41BC LEV 51AD ARG 1AD 46.6 Rodet-Belarbi (1989)
1AD TOURS 1AD 47.39 Poupon (unpublished)2AD TOURS 2AD
5BC LAT 5BC 43.57 Colomer and Gardeisen (1992);Gardeisen (1999, 2003, 2008, 2009);Renaud (2012)
4BC LAT 4BC3BC LAT 3BC2BC LAT 2BC1BC LAT 1BC1AD LAT 1AD2AD NIM 2AD 43.84 Forest (unpublished)2AD AIX 2AD 43.53 Leguilloux (1997)
2BC MUS 2BC 42.42 Tagliacozzo (unpublished)2AD ROM 2AD 41.89 Lepetz (unpublished)
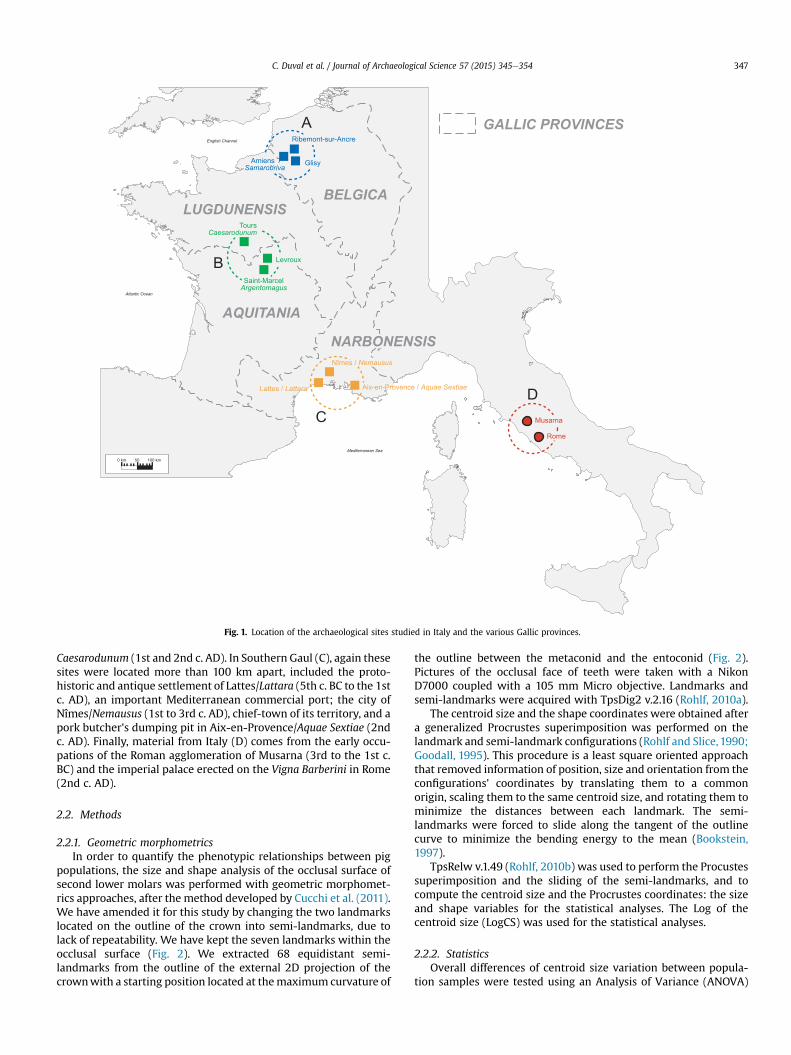
Fig. 1. Location of the archaeological sites studied in Italy and the various Gallic provinces.
C. Duval et al. / Journal of Archaeological Science 57 (2015) 345e354 347
Caesarodunum (1st and 2nd c. AD). In Southern Gaul (C), again thesesites were located more than 100 km apart, included the proto-historic and antique settlement of Lattes/Lattara (5th c. BC to the 1stc. AD), an important Mediterranean commercial port; the city ofNîmes/Nemausus (1st to 3rd c. AD), chief-town of its territory, and apork butcher's dumping pit in Aix-en-Provence/Aquae Sextiae (2ndc. AD). Finally, material from Italy (D) comes from the early occu-pations of the Roman agglomeration of Musarna (3rd to the 1st c.BC) and the imperial palace erected on the Vigna Barberini in Rome(2nd c. AD).
2.2. Methods
2.2.1. Geometric morphometricsIn order to quantify the phenotypic relationships between pig
populations, the size and shape analysis of the occlusal surface ofsecond lower molars was performed with geometric morphomet-rics approaches, after the method developed by Cucchi et al. (2011).We have amended it for this study by changing the two landmarkslocated on the outline of the crown into semi-landmarks, due tolack of repeatability. We have kept the seven landmarks within theocclusal surface (Fig. 2). We extracted 68 equidistant semi-landmarks from the outline of the external 2D projection of thecrownwith a starting position located at themaximum curvature of
the outline between the metaconid and the entoconid (Fig. 2).Pictures of the occlusal face of teeth were taken with a NikonD7000 coupled with a 105 mm Micro objective. Landmarks andsemi-landmarks were acquired with TpsDig2 v.2.16 (Rohlf, 2010a).
The centroid size and the shape coordinates were obtained aftera generalized Procrustes superimposition was performed on thelandmark and semi-landmark configurations (Rohlf and Slice,1990;Goodall, 1995). This procedure is a least square oriented approachthat removed information of position, size and orientation from theconfigurations' coordinates by translating them to a commonorigin, scaling them to the same centroid size, and rotating them tominimize the distances between each landmark. The semi-landmarks were forced to slide along the tangent of the outlinecurve to minimize the bending energy to the mean (Bookstein,1997).
TpsRelw v.1.49 (Rohlf, 2010b) was used to perform the Procustessuperimposition and the sliding of the semi-landmarks, and tocompute the centroid size and the Procrustes coordinates: the sizeand shape variables for the statistical analyses. The Log of thecentroid size (LogCS) was used for the statistical analyses.
2.2.2. StatisticsOverall differences of centroid size variation between popula-
tion samples were tested using an Analysis of Variance (ANOVA)

Fig. 2. Occlusal view of the M2 with the main cusps nomenclature above and the localization of the landmarks (black points) and semi-landmarks (white points) below.
C. Duval et al. / Journal of Archaeological Science 57 (2015) 345e354348
and the pairwise comparisonwith the associated Tuckey's HSD test,for which sample sizes are not required to be equal. The graphicaldisplay of molar size variation among population samples wasperformed using box-plots.
The molar shape differences amongst the population sampleswere tested using a one-way Multivariate Analysis of Variance(MANOVA) (Pillai's test). Due to the relatively small number ofspecimens, and compared to the large number of variables gener-ated by shape analyses, we used the dimensionality reductionmethod with Principal Components analysis proposed byM. Baylacand M. Friess (2005). To display the differences among the variouspopulation samples both spatially and temporally, we used a Ca-nonical Variate Analysis (CVA): a multigroup form of discriminantanalysis, and a phenogram using the unrooted neighbor joiningalgorithm (NJ) computed fromMahalanobis distances between thepopulation's mean shape. For the sake of better readability of pat-terns of molar shape differentiation, the CVA only displays graph-ically the populationmean shapes with their interval of confidence.The association of the different discriminant axes allows a deeperperception of the structure of variation and increased flexibility,welcome in the context of an analysis where factors of variation areintertwined and follow different directions. This representationsystem is consistent with the idea that it is necessary to multiply
the angles, and not to lead too rigid an approach. Dental shapechanges along the discriminant axes of the CVA were visualized bycomputation of the deformations along the discriminant axes bymultivariate regression (Monteiro, 1999).
To test whether geography and chronology influenced the pat-terns of the molar centroid size and shape variation, and interactedwith the population differences we used two-way ANOVA andMANOVA respectively. The geographic factor is defined by the fourareas (A, B, C and D) and the chronological factor is displayed inTable 1.
Finally, considering the large distribution of our samples andknowing the influence of abiotic parameters (precipitation, tem-peratures, etc.) over the dental morphology of mammals (Caumul,Polly, 2005; McGuire, 2010; Cucchi et al., 2014), we wanted toassess how much the environmental differences among the sitescontributed to the molar size and shape variation of the pigs andinfluenced their differentiation. We used the coordinates of thelatitudinal position of each archaeological site as a useful proxy ofthe environmental differences among the sites since latitudinalpositions reflect both the climatic and ecological parameters of aregion. We tested the dependence of size and shape variation withthe latitudinal position using univariate (LogCS) and multivariate(Procrustes coordinates) regressions respectively, associated with a

C. Duval et al. / Journal of Archaeological Science 57 (2015) 345e354 349
permutation test of 10,000 rounds. The latitudinal values per eachsites (Table 1) where obtained from the World Geodetic System1984.
Statistical analyses were performed using R v.2.13.1 (R Devel-opment Core Team 2011), with the ade 4 (Dray and Dufour, 2007),ape (Paradis et al., 2004) and Rmorph libraries (Baylac, 2012), aswell as MorphoJ software version 1.05c (Klingenberg, 2011).
3. Results
3.1. Geographical, environmental and chronological variation of thecentroid size of pig molars
Overall, ANOVA found highly significant differences in M20
centroid size among the pig samples (F¼ 4.873, df¼ 17, P < 0.0001),however, these differences are not significantly influenced by theenvironmental distances over the large geographical distribution ofthe archaeological samples (Table 2).
Two way ANOVA found a highly significant geographic effectover the molar centroid size variation (F ¼ 15.0656, df ¼ 3,P < 0.0001) but a low chronological one (F ¼ 2.8452, df ¼ 8,P ¼ 0.0042), and a slight interaction between the geographic andthe chronological effects (F ¼ 3.7324, df ¼ 5, P ¼ 0.0025). Despitethe significant differences of centroid size (among populationsamples, geography and chronology), the distribution of the vari-ation illustrated by the box-plot (Fig. 3) reveals a lack of stronggeographical or chronological trend with a very constant M2centroid size of the population samples of our dataset. This trendwas confirmed by the pairwise comparison (Table 3) which onlyfound significant differences for the smallest specimens fromBelgica (GLI 3BC and RIB 1BC), LAT 2BC and Italy (MUS 2BC and ROM2AD) and for the largest ones from LAT 1AD and especially TOURS2AD.
However, even if most of these differences are not significant,we can see that the molar centroid size for the Gallic period (3rd to1st c. BC) is smaller than during the Roman period (1st to 3rd c. AD),for population samples from Belgica and Lugdunensis/Aquitania(Fig. 3), with an increase between La T�ene and the Roman period.This observation conforms with results obtained from teeth andlimb bones measurements, in Gaul and other regions, for the pigand all other domestic species (Lepetz, 1996a, 1996b; MacKinnon,2001, 2010; Albarella et al., 2008; Colominas et al., 2013; Duvalet al., forthcoming). In contrast, the situation for southern sites isless clear. All the population samples from Gaul have a mean molarcentroid size greater than the Italian pigs, although no significantdifferences have been observed (see Table 3). Hence, molar sizevariation already shows regional idiosyncrasies with different dy-namics of morphological changes across regions. Although thethree studied areas do not differ by the molar centroid size of theirpigs, we observed some differences in their variation through time.There is also a strong local identity, insofar as in selected areas, sizeincrease appears clearly for sites for where both Gallic and Romanpopulations were studied (Ribemont-sur-Ancre/Tours/Lattes).Thanks to the long chronological record of the molar centroid sizein Lattes, we can also observe a trend towards size reduction fromthe 5th c. BC to the 1st c. BC followed by an increase towards the 1stc. AD. This same size reduction, indicative of a size reduction in thepig itself, is also observable between themiddle La T�ene site of Glisy
Table 2Linear and multivariate regression models testing for influence of latitudinal factors on M
Total sum of squares Predicted sum of squa
Size (Log CS) 0.00017924 0.00000011Shape (Procrustes coordiantes) 0.00087742 0.00013758
and the final La T�ene site of Ribemont-sur-Ancre (Gallia Belgica).This is consistent with data from other domestic species in France(M�eniel, 1984) who reached their global minimum at the end of theIron Age. For these specimens, whose morphological variations aresmall, the centroid size of the second lower molars seems todescribe briefly a coherent evolutionary scheme, observed in post-cranial skeleton morphometrics (Duval, unpublished PhD).
For Italian pigs, the trend is not driven towards a size increasebut a decline. Even though not the case in Gaul, this trend is notexceptional since the same observation has already been made forCatalan pig teeth and bone size between the Iron Age and the Ro-man period (Colominas and Sa~na, 2009). But most importantly,Italian centroid size values are inferior to other samples across allperiods. It is interesting to see that Italian animals, which arepresumably those who influenced the morphological evolution ofthe Gallic pigs, are, even when compared to samples from the LaT�ene period, the smallest. It appears, therefore, that molar centroidsize does not provide any insight into the influence of Italian overGallic stock.
3.2. Molar shape diversity of Gallic pigs and their relationship withItalian populations
Molar shape differences among the Gallic and Italian populationsamples of our study were highly significant (Pillai ¼ 1.6898,F ¼ 1.6594, P < 0.0001), and their phenotypic relationships presentsignificant geographic (Pillai¼ 0.52823, F¼ 4.0358, P < 0.0001) andchronological (Pillai¼ 0.64115, F¼ 1.6621, P < 0.0001) structurationwhich interact (Pillai ¼ 0.36760, F ¼ 1.5047, P ¼ 0.0003). Thegeographic pattern of the shape variation is not significantlyinfluenced by the environmental differences between the sites (seeTable 2).
The phenotypic relationships between the populations meanshapes, depicted by the NJ phenogram (Fig. 4), evidenced a stronglocal and regional differentiation, downplaying the time factor. Thepopulation samples from the different phases of Levroux displaytight phenotypic relationships, just like the two samples ofRibemont-sur-Ancre, and those of Tours. On a larger scale, it appearsthat all the sites of Belgica are grouped, like the Italian ones. As withthe centroid sizes, molar shapes from the southern Gaul samples aremuch more diverse, supporting further the specificity of thisgeographic area. Despite the strong geographic influence over theM2
0 shape variation, other factors seem to have driven the molarshape pattern of our dataset. Indeed, the phenogram displays thedichotomy between the relationships among the Gallic sites of thenorth and the center (Levroux), and the relationships among thesites of Southern Gaul, Italy and Roman sites of center Gaul (GalliaLugdunensis and Aquitania). Strikingly, the urban sites of Tours andArgentomagus, in the center of Gaul, dating from the 1st and 2nd c.AD, are neither relatedwith northern samples of Belgica norwith themost geographically close population samples of Levroux, but arestrongly branchedwithin theNarbonensis' samples. Such phenotypicrelationships suggest either a strong genetic influence of southernstock in the make up of the herds of these two urban sites, or supplystrategies reliant mainly on southern rather than local stocks.
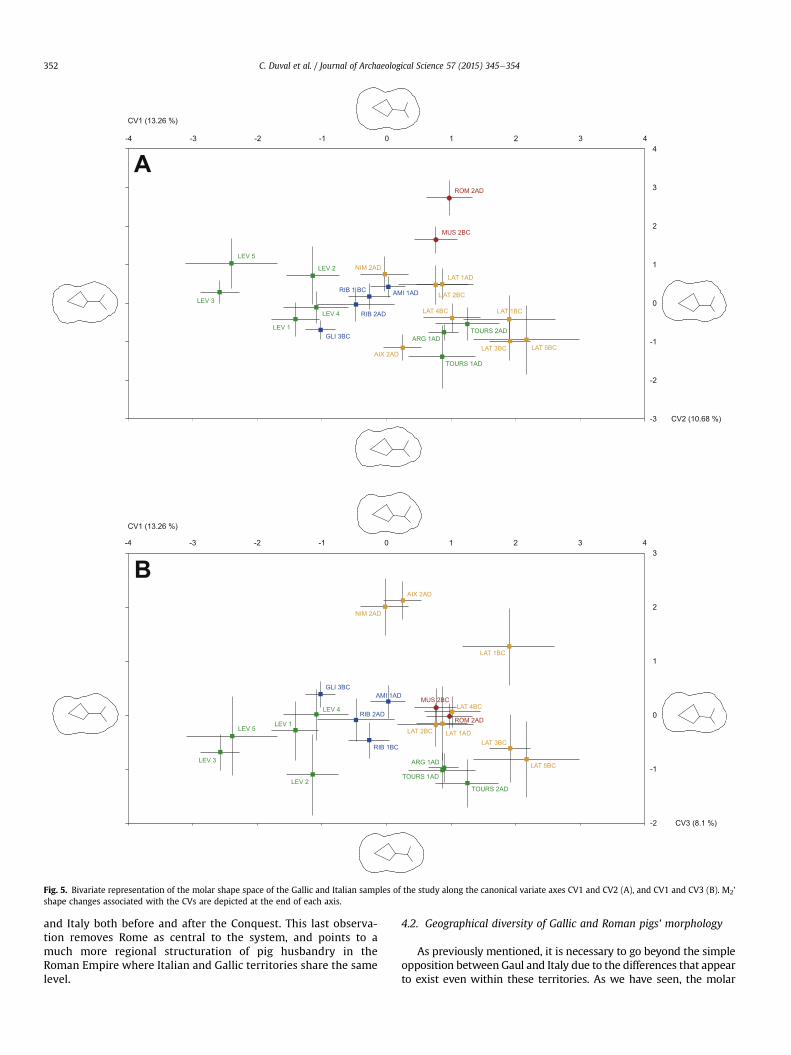
The association of the first two discriminant axes of the CVA(Fig. 5A) supports most of the observations raised from the phe-nogram, and also provides greater insight into the phenotypic
2 size and shape.
res Residual sum of squares Percentage predicted Permutation P
0.00017913 0.06 0.9380.0007399 15.68 0.091

Fig. 3. Box-plot of M2 Log transformed centroid size summarizing molar size variation in the studied samples. Inside the boxes, the horizontal line marks the median of the sample.The length of each box shows the range within the central 50% (upper and lower limits of boxes represents the 25 and 75 percent quartiles). The whiskers show the range of valuesthat fall within the inner fences. Circles represent outlier values. The notch displayed around the median gives roughly a 95% confidence interval for the difference in two medians.The red horizontal bar materializes the position of the mean size of Roman samples. (For interpretation of the references to color in this figure legend, the reader is referred to theweb version of this article.)
C. Duval et al. / Journal of Archaeological Science 57 (2015) 345e354350
relationships of the Gallic and Italian samples. One of the maindirections of differentiation in the molar shape discriminant spacedisplayed along CV1 separate clearly the morphotypes of Levrouxand Belgica from those of Narbonensis, Italy and the Roman urbansites of Tours and Argentomagus. Furthermore, the figure highlightsthe local and regional consistency and continuity, with the com-bination of all phases of Levroux, Tours, Lattes, and on a larger scale,the Gallic sites of area A, the Italian ones (area D), and finally, theRoman ones from the center of Gaul (area B).
The second major axis of differentiation (CV2) helps answerquestions regarding the influence of Roman stock into Gaul's di-versity. The clustering of the dental morphotype along CV2 high-lights the divergence of Italian morphotypes from the Gallic ones;while the more recent of the two Italian sites (Vigna Barberini)displays greater divergence fromGallic samples than theMusarna'sone. This clearly suggests the development of specific herding and
Table 3Post hoc Tukey HSD test for pairwise comparison between population samples. Probabilitthreshold) ones in gray.
RIB 1 BC AMI 1AD RIB 2AD LEV 2BCto 1AD
ARG1AD
TOURS1AD
TOURS2AD
GLI 3 BC 1 1 0.996 1 1 0.921 0.006RIB 1 BC 0.954 0.601 0.903 0.847 0.253 0AMI 1AD 1 1 1 1 0.085RIB 2AD 1 1 1 0.4LEV 2BC to 1AD 1 1 0.133ARG 1AD 1 0.183TOURS 1AD 0.765TOURS 2ADLAT 5BCLAT 4BCLAT 3BCLAT 2BCLAT 1BCLAT 1ADNIM 2ADAIX 2ADMUS 2BC
husbandry practices peculiar to Italy and completely disconnectedfrom Gaul, rather than the intended standardization of the animalmorphologies at the time of the Roman Conquest. Such hypothesisis further strengthened by the contrast between the molar centroidsize reduction of Italian pigs and its stability and increase in Gallicpigs. Such discrepancy in the molar size change indicates that thepigs of the two territories (Gaul and Italian peninsula) originatedfrom different populations with different physical and phenotypiccharacteristics and evolution.
Finally, the differentiation along CV3 reveals three relevantpatterns (Fig. 5B). The first is the huge differentiation of the 2nd c.AD urban sites of Nîmes (chief-town) and Aix-en-Provence(butcher's shop), suggesting possibly particular supply strategies.The second shows that despite their phenotypic proximity, theRoman sites from the area B are clustered and slightly differentfrom the southern ones, suggesting that despite a clear influence,
ies p values displayed in the upper right triangle with the significant (below the 0.05
LAT5BC
LAT4BC
LAT3BC
LAT2BC
LAT1BC
LAT1AD
NIM2AD
AIX2AD
MUS 2BC ROM2AD
0.997 0.989 1 1 1 0.597 1 0.992 1 0.9970.629 0.492 0.962 0.992 0.976 0.059 0.904 0.524 1 11 1 1 1 1 0.972 1 1 0.999 0.8261 1 1 1 1 1 1 1 0.931 0.361 1 1 1 1 0.99 1 1 0.997 0.7241 1 1 1 1 0.996 1 1 0.992 0.6341 1 1 0.995 0.999 1 1 1 0.656 0.1130.373 0.505 0.076 0.035 0.059 0.976 0.132 0.473 0.001 0
1 1 1 1 1 1 1 0.942 0.3861 1 1 1 1 1 0.876 0.27
1 1 0.965 1 1 1 0.8471 0.891 1 1 1 0.944
0.947 1 1 1 0.8860.99 1 0.267 0.02
1 0.997 0.7260.894 0.295
1

Fig. 4. Unrooted neighbor joining phenogram computed on D-Mahalanobis between group mean shapes. Colours correspond to the four roman provinces displayed in Fig. 1.
C. Duval et al. / Journal of Archaeological Science 57 (2015) 345e354 351
the pigs of central Gaul kept their particularities. The third, inter-estingly, links the Italian settlements with the port site of Lattes(from at least the 4th c. B.C.). Their proximity supports the idea of acertain geographical coherence, and raises the question of a rela-tionship that potentially existed between the largest city of theRoman Empire and the commercial ports of the Mediterraneancoast, long before the Roman Conquest.
4. Discussion
4.1. Rome's influence on Gallic pig morphology
According to geometric morphometrics of pig dental phenotype,the relations between Rome and Gaul is weak, contrary towhat wasthought previously. There are three important trends echoing thisobservation: firstly, the molar centroid size of Italian pigs is smallerthan that of Gallic pigs during both the Iron Age and Roman period;secondly, this size reduces over time while it increases in Gaul andfinally, there are clear shape differences between Italian and Gallicpigs which become increasingly evident.
These facts testify to the breeding of animals with distinctphysical characteristics, and to the implementation and develop-ment of different husbandry practices in the two territories (Gauland Italy). It seems that far from realizing complete uniformityacross the Roman Empire (born from an Italian epicenter), we arepresented with two contrasting agropastoral entities with complexinternal logics.
There is, however, additional evidence which both supports andrefutes this theory. The molars centroid size and shape shows a linkbetween the Italian herds and those from southern Gaul, particu-larly those from Lattes. This link appears not to be related toenvironmental proximities between the two provinces. In contrast,it attests more to the possible cultural and agropastoral proximityof the two territories, as well as sustained relationships (probably at
a commercial level) between Gallic ports around the Mediterra-nean coast and Italy. This phenotypic proximity between Italian andGallic pigs from Lattes evidenced well before the Conquest, andexcludes de facto the idea of the development of Roman influenceover Gallic livestock during the takeover of Rome on conqueredterritories. In addition, this connection does not exist at all fornorthern sites which experienced a completely independentevolution.
The clear phenotypic distinction between animals of the Italianpeninsula (at least in Rome) and most of Gallic ones, calls intoquestion the previously assumed link between the Gallic and Ro-man herds. Consequently, Italian husbandry methods seem to havehad no influence on the development of a new form of Gallic animalthat evolved entirely according to their own mechanisms, which issupported by post-cranial measurements (Duval, unpublished PhD)showing that Italian pigs are significantly smaller and undergo adelayed size increase compared to the Gallic ones. We can assume,therefore, that the morphological change of Gallic pigs results fromthe establishment of a new model, devised entirely by Gallicbreeders, applied solely to Gallic livestock (at least for the mostnorthern regions) and completely independent from the Italianmodel; a phenomenon also suggested for cattle husbandry (Duvalet al., 2012, 2013).
However, we cannot totally exclude some relations betweenGaul and Italy in terms of livestock trade and management, sinceother trading posts, or zones of influence, outside of Rome andthe Latium, could have had much closer links with Gaul. Indeedtexts from Latin agronomists stipulate that the Po Valley and thesouth of the Italian peninsula were much more suited to hus-bandry than the vicinity of Rome (Polybe, 1970, 2.15; Strabon,1967, 5.1.12; or Jaillette, 2012). Moreover, the shape proximitybetween Italian pigs, those from Narbonensis, and the Romanones from the centre of Gaul, could reflect the existence of a largescale and consistent supply area, encompassing southern Gaul
-3
-2
-1
0
1
2
3
4-4 -3 -2 -1 0 1 2 3 4
GLI 3BC
LAT 4BC
ARG 1ADTOURS 2AD
LAT 3BC
TOURS 1AD
LAT 5BC
LAT 1BC
AIX 2AD
L AT 2BC
LAT 1AD
MUS 2BC
ROM 2AD
NIM 2AD
LEV 1
AMI 1AD
RIB 2AD
RIB 1 BC
LEV 5
LEV 3
LEV 4
LEV 2
-2
-1
0
1
2
3-4 -3 -2 -1 0 1 2 3 4
CV3 (8.1 %)
CV1 (13.26 %)
LAT 4BC
LAT 2BC LAT 1AD
MUS 2BC
ROM 2ADLEV 1LEV 5
LEV 3
LEV 4
LEV 2
LAT 1BC
LAT 3BC
LAT 5BCARG 1AD
TOURS 2AD
TOURS 1AD
GLI 3BC
NIM 2AD
RIB 2AD
AMI 1AD
RIB 1BC
AIX 2AD
CV1 (13.26 %)
CV2 (10.68 %)
A
B
Fig. 5. Bivariate representation of the molar shape space of the Gallic and Italian samples of the study along the canonical variate axes CV1 and CV2 (A), and CV1 and CV3 (B). M2'shape changes associated with the CVs are depicted at the end of each axis.
C. Duval et al. / Journal of Archaeological Science 57 (2015) 345e354352
and Italy both before and after the Conquest. This last observa-tion removes Rome as central to the system, and points to amuch more regional structuration of pig husbandry in theRoman Empire where Italian and Gallic territories share the samelevel.
4.2. Geographical diversity of Gallic and Roman pigs' morphology
As previously mentioned, it is necessary to go beyond the simpleopposition between Gaul and Italy due to the differences that appearto exist even within these territories. As we have seen, the molar
C. Duval et al. / Journal of Archaeological Science 57 (2015) 345e354 353
centroid size of pigs increased in northern and central France, whileremaining constant in southern animals and decreasing in Italianherds. These trends, without being significantly influenced by theenvironmental differences among sites, not only oppose Gallic andItalian herds, but also those of the southern and the northern half ofGaul. In this way, the territory seems to be segmented into severalareas where pastoral characteristics differ. These growth dynamicswere recorded for cattle in the north of Gaul (Duval et al., 2012), yetonly affected the growth speed, intensity and magnitude. If moresouthern territories are included, other patterns such as size stag-nation or decrease appear. These particularities of the south of Gauland Italy appear to be in keeping with the agropastoral specificitiesof these regions. The southern peculiarities may reflect, for example,a contrast between the early conquered Narbonensis and the rest ofGaul in terms of growth pattern; or a strong regional identity withinan agropastoral strategy more reliant on caprines than suids(Leguilloux and Lepetz, 1996).
However, the most important confirmation provided by ourstudy is the local and regional origin of the Gallic pigs from theRoman period. This phenotypic persistence before and after theRoman Conquest is supported by previous analyses conducted oncattle bones (Duval et al., 2013). This hypothesis suggests that eachlocality drove the morphological changes of their own herds attheir own pace, according to available resources, the chosen eco-nomic strategy and, to a much lesser extent, environmental char-acteristics. This trend is particularly noticeable in the north of Gaul,where the proximate sites studied delivered extremely close dentalforms. Italy was not an exception to the rule, and far from influ-encing the Gallic model, had a very different logic adapted to itsown cultural and agropastoral context. This new analysis therefore,appears to confirm not only the phenotypic and morphologicaldiversity of livestock in Gaul, but across the whole Empire.
With this in mind, it can be argued that the Roman model couldhave driven the economic need for change, but that the farmersthemselves (regardless of regional boundaries and based onindigenous breeds, at least for pigs) exploited and transformedavailable livestock on site through the application of new farmingmethods. This evolution seems to have been principally zootech-nical (improved nutrition, animal protection, mating selection) andprobably without genetic transfer from exogenous livestock or newhusbandry techniques. The influence of Rome, therefore, did notaffect the animals directly or the expression of change, but acted asthe catalyzer within these different native economic models.
4.3. Phenotypic diversity: reflective of a differential supply?
Certain results have also allowed the further study of site supply.The northern sites, due to their close proximity, were able to rely on ashared pig husbandry catchment area with an economy centered ona common territory. However, other areas provide more ambiguousinformation. In the remote sites of the centre and south of Gaul,differences in the animal's shape were generated despite a strongregional structure. The Roman sites of area B, for example, are clearlydistinct from Iron Age Levroux. The peculiarity of Levroux could bedue to its status, as it was regarded as a centralized hub for thepreparation and sale of pigs from numerous surrounding farms(Fr�emondeau et al., 2013). Similarly, the sites of Nîmes (chief-town ofits territory) and Aix-en-Provence (butcher shop which specializedin pork), held an important and specific position in the supply chainwhich could explain the uniqueness of their herds.
5. Conclusion
In light of this study, our initial purpose to confront Gaul andItaly, driven by a strong historiographical tradition, seems to be
irrelevant. It appears that the confrontation of these two territoriesis not supported on any agropastoral ground. In contrast, analysisreveals a much higher complexity, reflecting the heterogeneity ofthe people within the Trans- and Cisalpine, or across other prov-inces. Beyond these entities, there is a more restricted fragmenta-tion of which we can not reasonably draw boundaries, but whichrelies on a strong local breeding strategy. There is no origin orgradient of geographical progression to find, therefore, but ratherthe expression of a local cultural and agropastoral reality, whichaffected the herd management strategies and, subsequently, theanimal's morphology. Consequently, within the context of achanging economic environment across the Empire, each territory,relying on local herds and according to its own abilities (livestockcharacteristics, feeding resources, skills) and its economic growthpropensity has agreed to make a change in its husbandry practices.For this reason, the Empire must not be considered as a sum ofconfronting provinces, but rather as a conglomeration of relativelyautonomous, and regionally identifiable territories, all of whichwere affected by a global model.
Acknowledgments
We are most grateful to No€el Mah�eo (Amiens M�etropole), EricBinet (Amiens M�etropole), Yoann Zotna (Conseil g�en�eral de laSomme) and his team, St�ephane Gaudefoy (INRAP Nord Picardie),Olivier Buchsenschutz (CNRS), Isabelle Fauduet (CNRS), PhilippeBrunet (SRA R�egion Centre), Christiane Sire (DRAC Centre), VianneyForest (INRAP M�editerran�ee), Nuria Nin (Ville d'Aix-en-Provence),Armelle Gardeisen (CNRS) and the team of the Centre arch-�eologique de Lattes, and finally Vincent Jolivet (CNRS) for allowingus access to the samples analysed in our study.
References
Albarella, U., Dobney, K., Rowley-Conwy, P., 2009. Size and shape of the Eurasianwild boar (Sus scrofa), with a view to the reconstruction of its Holocene history.Environ. Archaeol. 14 (2), 103e136.
Albarella, U., Johnstone, C., Vickers, K., 2008. The development of animal husbandryfrom the Late Iron Age to the end of the Roman period: a case study from South-East Britain. J. Archaeol. Sci. 35, 1828e1848. Elsevier.
Baylac, M., 2012. Rmorph: a R Geometric and Multivariate Morphometrics Library.Baylac, M., Friess, M., 2005. Fourier descriptors, Procrustes superimposition, and
data dimensionality: an example of cranial shape analysis in modern humanpopulations. In: Slice, D.E. (Ed.), Modern Morphometrics in Physical Anthro-pology. University of Chicago, Chicago, pp. 145e166.
Bookstein, F.L., 1997. Landmarks methods for forms without landmarks: morpho-metrics of group differences in outline shape. Med. Image Anal. 1, 225e243.
Caumul, R., Polly, P.D., 2005. Phylogenetic and environmental components ofmorphological variation: skull, mandible and molar shape in Marmots (Mar-mota, Rodentia). Evolution 59 (11), 2460e2472.
Colomer, A., Gardeisen, A., 1992. Premier bilan sur la consommation des animauxd'�elevage et de chasse dans la ville de Lattara (fin du IVe av. n. �e.- milieu du 1er s.de n. �e.). Lattara 5, 91e110.
Colominas, L., Sa~na, M., 2009. Animal husbandry in the North-East of Catalonia fromthe 1st to the 5th Century AD: improvement and importation. Stud. WorldRoman Period 4, 9e26.
Colominas, L., Schlumbaum, A., Sa~na, M., janvier 2013. The impact of the RomanEmpire on animal husbandry practices: study of the changes in cattlemorphology in the north-east of the Iberian Peninsula through osteometric andancient DNA analyses. Archaeol. Anthropol. Sci. http://dx.doi.org/10.1007/s12520-013-0116-9, 16 p.
Cucchi, T., Barnett, R., Martinkova, N., Renaud, S., Renvoise, E., Evin, A., Sheridan, A.,Mainland, I., Wickham-Jones, C., Tougard, C., Quere, J.-P., Pascal, M., Pascal, M.,Heckel, G., O'Higgins, P., Searle, J.B., Dobney, K.M., 2014. The changing pace ofinsular life: 5000 years of microevolution in the Orkney vole (Microtus arvalisorcadensis). Evolution 68 (10), 2804e2820.
Cucchi, T., Fujita, M., Dobney, K., 2009. New insights into pig taxonomy, domesti-cation and human dispersal in island south east Asia : molar shape analysis ofSus remains from Niah Caves, Sarawak. Int. J. Osteoarchael. 19, 508e530.
Cucchi, T., Hulme-Beaman, A., Yuan, J., Dobney, K., 2011. Early Neolithic pigdomestication at Jiahu, Henan Province, China: clues frommolar shape analysesusing geometric morphometric approaches. J. Archaeol. Sci. 38, 11e22.
Dray, S., Dufour, A.B., 2007. The ade4 package: implementing the duality diagramfor Ecologists. J. Stat. Softw. 22 (4). American Statistical Association, 20 p.
C. Duval et al. / Journal of Archaeological Science 57 (2015) 345e354354
Duval, C. �Evolution et diversit�e de la forme du cochon entre l’age du Fer et lap�eriode moderne en Gaule et en France. R�egionalisme, acquisitions zoo-techniques et implications historiques., Universit�e François-Rabelais, Tours(Unpublished PhD).
Duval, C., Fr�emondeau, D., Lepetz, S., Horard-Herbin, M.-P., 2014. L'�elevage du porc :un savoir-faire gaulois ? Apport crois�e des �etudes isotopique et ost�eom�etriquedes os de cochon. In: Blancquaert, G., Malrain, F. (Eds.), �Evolution des soci�et�esgauloises du second age du Fer, entre mutations internes et influences externes,Actes du 38e colloque international de l’AFEAF (Amiens, 29 mai-1er juin 2014).Revue Arch�eologique de Picardie n� sp�ecial (forthcoming).
Duval, C., Horard-Herbin, M.-P., Lepetz, S., 2013. Morphological changes in domesticcattle in Gaul, from the second century BC to the fifth century AD: diversity ofherds in the Seine valley (France) and northern Gaul. J. Archaeol. Sci. 40,3977e3990.
Duval, C., Lepetz, S., Horard-Herbin, M.-P., 2012. Diversit�e des cheptels et diversi-fication des morphotypes bovins dans le tiers nord-ouest des Gaules entre la finde l'age du Fer et la p�eriode romaine. Gallia 69e2, 79e114. CNRS �Editions.
Ervynck, A., Lentacker, A., Müldner, G., Richard, M., Dobney, K., 2007. An investi-gation into the transition from forest dwelling pigs to farm animals in medievalFlanders, Belgium. In: Albarella, U., Dobney, K., Ervynck, A., Rowley-Conwy, P.(Eds.), Pigs and Humans 10,000 Years of Interaction. Oxford University Press,Oxford, pp. 171e196.
Evin, A., Cucchi, T., Cardini, A., Strand Vidarsdottir, U., Larson, G., Dobney, K., 2013.The long and winding road: identifying pig domestication through molar sizeand shape. J. Archaeol. Sci. 40, 735e743.
Evin, A., Flink, L.G., Balasescu, A., Popovici, D., Andreescu, R., Bailey, D., Mirea, P.,Laz�ar, C., Boroneant, A., Bonsall, C., Vidarsdottir, U.S., Brehard, S., Tresset, A.,Cucchi, T., Larson, G., Dobney, K., 2015. Unravelling the complexity of domes-tication: a case study using morphometrics and ancient DNA analyses ofarchaeological pigs from Romania. Philos. Trans. R. Soc. B Biol. Sci. 370.
Fercoq du Leslay, G., Lepetz, S., 2008. Manger dans les sanctuaires : salaisons etviande fraîche �a Ribemont-sur-Ancre. In: Lepetz, S., Van Andringa, W. (Eds.),Arch�eologie du sacrifice animal en Gaule romaine. Rituels et pratiques ali-mentaires, Arch�eologie des Plantes et des Animaux, 2. �Editions Monique Mer-goil, Montagnac, pp. 201e206.
Fr�emondeau, D., 2012. Rythmes saisonniers des �elevages porcins arch�eologiques :propositions pour un protocole d'analyse isotopique (Unpublished PhD thesis).Mus�eum national d'Histoire naturelle, Paris, 436 and 121 p.
Fr�emondeau, D., Horard-Herbin, M.-P., Ughetto-Monfrin, J., Balasse, M., 2013.L'alimentation des troupeaux porcins et la production de viande �a Levroux LesAr�enes (Indre) : une analyse isotopique. In: Colin, A., Verdin, F. (Eds.), L'age duFer en Aquitaine et sur ses marges. Mobilit�e des hommes, diffusion des id�ees,circulation des biens dans l'espace europ�een �a l'age du Fer, Actes du 35e col-loque international de l'AFEAF (Bordeaux, 2-5 juin 2011), pp. 747e752.
Gardeisen, A., 1999. Economie de production animale et exploitation du milieu aucours du quatri�eme si�ecle avant notre �ere. Lattara 12, 537e568.
Gardeisen, A., 2003. Contribution de l'arch�eozoologie des grands mammif�eres �al'�etude d'un espace ouvert en contexte urbain. La zone 123 (Lattes/Saint-Sau-veur, H�erault). In: Buxo, R., Chabal, L., Gardeisen, A. (Eds.), La place 123 deLattara. Recherches pluridisciplinaires sur un espace urbain du IVe s. avant notre�ere, Lattara 16, pp. 169e184.
Gardeisen, A., 2008. Terrestres ou volants : les animaux dans la ville antique deLattes. In: Janin, T., Py, M. (Eds.), Lattara/Lattes (H�erault). Nouveaux acquis,nouvelles questions sur une ville protohistorique et romaine. Gallia, 65CNRS�editions, Paris, pp. 185e192.
Gardeisen, A., 2009. Gestion des animaux de bouche au cours du Ve s. av. notre �eredans le Midi m�editerran�een (-475/-375) : un aperçu lattois. Lattara 21, 419e428.
Goodall, C.R., 1995. Procrustes methods in the statistical analysis of shape revisited.In: Mardia, K.V., Gill, C.A. (Eds.), Current Issues in Statistical Shape Analysis.University of Leeds Press, Leeds, pp. 18e33.
Horard-Herbin, M.-P., 1997. Le village celtique des Ar�enes �a Levroux. L'�elevage et lesproductions animales dans l'�economie de la fin de l'Age du Fer, Levroux 4. Rev.Arch�eol. Centre, 12e suppl�ement, 206 p.
Jaillette, P., 2012. SUILLA PECORA AD VRBEM ITER FACIVNT. In: Crogiez-P�etrequin, S., Jaillette, P. (Eds.), Soci�et�e, �Economie, Administration dans le CodeTh�eodosien. Presses Universitaires du Septentrion, Lille, pp. 405e425.
Johnstone, C.J., 2004. A Biometric Study of Equids in the RomanWorld (UnpublishedPhD thesis). University of York, Department of Archaeology, York, 500 p.
Klingenberg, C., 2011. Morphoj: an integrated software package for geometricmorphometrics. Mol. Ecol. Resour. 11, 353e357.
Leguilloux,M.,1997. Aproposde la charcuterie enGaule romaine. Un exemple �a Aix-en-Provence (ZAC Sextius-Mirabeau). Gallia 54, 239e259. CNRS �editions, Paris.
Leguilloux, M., Lepetz, S., 1996. L'�elevage en Narbonnaise et en Gaule du nord :continuit�es ou ruptures ». In: Fiches, J.-L. (Ed.), Le IIIe si�ecle en Gaule Narbon-naise. Donn�ees r�egionales sur la crise de l'Empire, Actes de la table ronde duGDR 954, Aix-en-Provence, La Baume, 15e16 septembre 1995, Sophia Antipolis.�Editions APDC, pp. 257e275.
Lepetz, S., 1996a. Effets de la romanisation sur l'�elevage dans les �etablissementsruraux du Nord de la Gaule. L'exemple de l'augmentation de la stature desanimaux domestiques. Rev. Arch�eol. Picardie n� sp�ecial 11, 317e325.
Lepetz, S., 1996b. L'animal dans la soci�et�e gallo-romaine de la France du nord. Rev.Arch�eol. Picardie n� sp�ecial 12, 174 p.
Lepetz, S., 2010. Pratiques alimentaires dans un quartier d'Amiens au Ier si�ecle. Lesrestes osseux animaux du site “Le Palais des Sports”. In: Binet, E. (Ed.), Evolutiond'une insula de Samarobriva au haut-Empire - Les fouilles du “Palais des sports/Coliseum” �a Amiens (Somme), Revue Arch�eologique de Picardie, Amiens, n�
sp�ecial, 27, pp. 409e422.MacKinnon, M., 2001. High on the hog: linking zooarchaeological, literary, and
artistic data for pig breeds in Roman Italy. Am. J. Archaeol. 105 (4), 649e673.MacKinnon, M., 2010. Cattle ‘breed’ variation and improvement in Roman Italy:
connecting the zooarchaeological and ancient textual evidence. WorldArchaeol. 42 (1), 55e73.
McGuire, J.L., 2010. Geometric morphometrics of vole (Microtus californicus)dentition as a new paleoclimate proxy: shape change along geographic andclimatic clines. Quat. Int. 212 (2), 198e205.
M�eniel, P., 1984. Contribution �a l'histoire de l'�elevage en Picardie du N�eolithique �a lafin de l'age du Fer. Rev. arch�eol. Picardie num�ero sp�ecial, Soci�et�e de Pr�ehistoiredu Nord et de Picardie, Amiens, 56 p.
Monteiro, L.R., 1999. Multivariate regression models and geometric morphometrics:the search for causal factors in the analysis of shape. Syst. Biol. 48, 192e199.
Paradis, E., Claude, J., Strimmer, K., 2004. APE: analyses of phylogenetics and evo-lution in R language. Bioinformatics 20, 289e290.
Polybe, 1970. Histoires, Livre II. Traduction P. P�edech, Association Guillaume Bud�e.Collection des Universit�es de France, Les Belles Lettres, Paris, p. 123.
Renaud, A., 2012. Alimentation carn�ee et gestion des populations animales sur leterritoire de la cit�e de Nîmes (H�erault et Gard, II�eme s. av. - II�eme s. ap. J.-C.).Universit�e Paul Val�ery - Montpellier III, UMR5140 e Laboratoire d'Arch�eologiedes Soci�et�es M�editerran�eenne, Montpellier, 699 p. (PhD manuscript).
Rodet-Belarbi, I., 1989. La faune �a Argentomagus : �elevage, artisanats, rites. Uni-versit�e de Paris I e Panth�eon e Sorbonne, 596 p. (PhD manuscript).
Rohlf, F.J., 2010a. TpsDig 2 e Thin Plate Spline Digitizer. Ecology and Evolution. StateUniversity at Stony Brook, NY. http://life.bio.sunysb.edu/morph/.
Rohlf, F.J., 2010b. TpsRelw 1.49 e Thin Plate Spline Relative Warp. Ecology andEvolution. State University at Stony Brook, NY. http://life.bio.sunysb.edu/morph/.
Rohlf, F.J., Slice, D., 1990. Extensions of the procrustes method for the optimal su-perimposition of landmarks. Syst. Biol. 39, 40e59.
Rowley-Conwy, P., Dobney, K., 2007. Wild boar and domestic pigs in Mesolithic andNeoloithic southern Scandinavia. In: Albarella, U., Dobney, K., Ervynck, A.,Rowley-Conwy, P. (Eds.), Pigs and Humans 10,000 Years of Interaction. OxfordUniversity Press, Oxford, pp. 131e155.
Strabon, 1967. G�eographie, Livre V. L'Italie, Traduction F. Lasserre, AssociationGuillaume Bud�e. Collection des Universit�es de France, Les Belles Lettres, Paris,pp. 39e121.