Analysis of High Molar Mass Branched Polybutadienes by SEC- MALLS and AF4-MALLS
13
Analysis of High Molar Mass Branched Polybutadienes by SEC- MALLS and AF4-MALLS Ashwell C. Makan, † Tino Otte, ‡,§ and Harald Pasch* ,† † Department of Chemistry and Polymer Science, University of Stellenbosch, Private Bag X1, Matieland 7602, South Africa ‡ Postnova Analytics GmbH, Max-Planck-Strasse 14, 86899 Landsberg, Germany ABSTRACT: Industrial polybutadienes synthesized by Zie- gler−Natta catalysts may exhibit very high molar masses, significant degrees of branching, and gel species. Such samples were analyzed by size exclusion chromatography (SEC) and asymmetric flow field-flow fractionation (AF4). Both fractio- nation techniques were coupled to a multiangle laser light scattering (MALLS) detector as well as a refractive index (RI) detector. The initial results obtained from SEC measurements completely contradicted the processing behavior of the materials. SEC seemed not to be suitable for accurate characterization of these materials. SEC separation was strongly influenced by coelution of linear (low molar mass) and branched (high molar mass) macromolecules, shear degradation of the larger macromolecules, and filtration of the gel fraction. For this reason the polybutadienes were subsequently analyzed by AF4 in order to compare the results and identify the limitations of SEC. The results showed that, as a specialized tool, AF4 can be used for the extended and more accurate analysis of synthetic rubber materials, especially in the case of very high molar masses. SEC is not suitable for such samples because it does not properly address the high molar mass fraction and the branched macromolecules. ■ INTRODUCTION Polymeric materials with useful properties and well-defined molecular characteristics have become increasingly important for various applications in lightweight construction, 1 alternative sources of energy, 2−4 drug delivery, 5,6 and automotive industry. 7 The characterization of complex polymeric materials requires accurate analytical techniques that address the various parameters of molecular heterogeneity. Among them, size exclusion chromatography (SEC) is the most prominent method for the analysis of molar mass distributions (MMD). 8−13 SEC coupled to a concentration detector such as a refractive index (RI) or ultraviolet (UV) detectors together with well-characterized calibration standards (e.g., polystyrene) are commonly used for the determination of relative molar mass values. These are then termed apparent molar masses or e.g. polystyrene-equivalent molar masses and have a limited accuracy. 14,15 The most frequently used molar mass averages are M w , M n , and M p . When SEC is coupled to molar mass sensitive detectors such as light scattering detectors, absolute molar masses and radii of gyration (R g ) may be deter- mined. 16−18 When a viscometer detector is used, molar masses are determined through universal calibration 19−22 or directly using the Goldwasser approach. 23−25 Additional information regarding molecular conformation and branching can be elucidated 26−30 making molar mass sensitive detectors more useful compared to the classical approach where a calibration curve is needed. 31,32 Unfortunately, SEC has limitations when it comes to the analysis of very high molar mass and highly branched macromolecules. When analyzing such materials by SEC poor separation, shear degradation and coelution of linear and branched macromolecules of low and high molar masses, respectively, can be observed. 9,10,33 Very strong shear forces in the stationary phase or at the column frits cause degradation of high molar mass macromolecules, 10,30,34−39 resulting in wrong molar mass determinations. Another problem is the late elution effect in SEC which is a common occurrence for excessively branched macromolecules. Coelution takes place due to a portion of the highly branched species being retained unusually long on the stationary phase as compared to the corresponding linear macromolecules. 28,30,31,38,40−44 In addition, having the same hydrodynamic volume but different coil densities, linear and branched macromolecules will show different molar mass− radius of gyration behavior. 3,9,26,27 Based on some of these disadvantages, alternative separation methods are required that minimize shear degradation and coelution effects. Received: April 17, 2012 Revised: May 30, 2012 Published: June 7, 2012 Article pubs.acs.org/Macromolecules © 2012 American Chemical Society 5247 dx.doi.org/10.1021/ma3007812 | Macromolecules 2012, 45, 5247−5259
Transcript of Analysis of High Molar Mass Branched Polybutadienes by SEC- MALLS and AF4-MALLS

Analysis of High Molar Mass Branched Polybutadienes by SEC-MALLS and AF4-MALLSAshwell C. Makan,† Tino Otte,‡,§ and Harald Pasch*,†
†Department of Chemistry and Polymer Science, University of Stellenbosch, Private Bag X1, Matieland 7602, South Africa‡Postnova Analytics GmbH, Max-Planck-Strasse 14, 86899 Landsberg, Germany
ABSTRACT: Industrial polybutadienes synthesized by Zie-gler−Natta catalysts may exhibit very high molar masses,significant degrees of branching, and gel species. Such sampleswere analyzed by size exclusion chromatography (SEC) andasymmetric flow field-flow fractionation (AF4). Both fractio-nation techniques were coupled to a multiangle laser lightscattering (MALLS) detector as well as a refractive index (RI)detector. The initial results obtained from SEC measurementscompletely contradicted the processing behavior of thematerials. SEC seemed not to be suitable for accuratecharacterization of these materials. SEC separation wasstrongly influenced by coelution of linear (low molar mass)and branched (high molar mass) macromolecules, sheardegradation of the larger macromolecules, and filtration ofthe gel fraction. For this reason the polybutadienes weresubsequently analyzed by AF4 in order to compare the resultsand identify the limitations of SEC. The results showed that, asa specialized tool, AF4 can be used for the extended and moreaccurate analysis of synthetic rubber materials, especially in the case of very high molar masses. SEC is not suitable for suchsamples because it does not properly address the high molar mass fraction and the branched macromolecules.
■ INTRODUCTIONPolymeric materials with useful properties and well-definedmolecular characteristics have become increasingly importantfor various applications in lightweight construction,1 alternativesources of energy,2−4 drug delivery,5,6 and automotiveindustry.7 The characterization of complex polymeric materialsrequires accurate analytical techniques that address the variousparameters of molecular heterogeneity. Among them, sizeexclusion chromatography (SEC) is the most prominentmethod for the analysis of molar mass distributions(MMD).8−13 SEC coupled to a concentration detector suchas a refractive index (RI) or ultraviolet (UV) detectors togetherwith well-characterized calibration standards (e.g., polystyrene)are commonly used for the determination of relative molarmass values. These are then termed apparent molar masses ore.g. polystyrene-equivalent molar masses and have a limitedaccuracy.14,15 The most frequently used molar mass averagesare Mw, Mn, and Mp. When SEC is coupled to molar masssensitive detectors such as light scattering detectors, absolutemolar masses and radii of gyration (Rg) may be deter-mined.16−18 When a viscometer detector is used, molar massesare determined through universal calibration19−22 or directlyusing the Goldwasser approach.23−25
Additional information regarding molecular conformationand branching can be elucidated26−30 making molar mass
sensitive detectors more useful compared to the classicalapproach where a calibration curve is needed.31,32
Unfortunately, SEC has limitations when it comes to theanalysis of very high molar mass and highly branchedmacromolecules. When analyzing such materials by SEC poorseparation, shear degradation and coelution of linear andbranched macromolecules of low and high molar masses,respectively, can be observed.9,10,33 Very strong shear forces inthe stationary phase or at the column frits cause degradation ofhigh molar mass macromolecules,10,30,34−39 resulting in wrongmolar mass determinations. Another problem is the late elutioneffect in SEC which is a common occurrence for excessivelybranched macromolecules. Coelution takes place due to aportion of the highly branched species being retained unusuallylong on the stationary phase as compared to the correspondinglinear macromolecules.28,30,31,38,40−44 In addition, having thesame hydrodynamic volume but different coil densities, linearand branched macromolecules will show different molar mass−radius of gyration behavior.3,9,26,27 Based on some of thesedisadvantages, alternative separation methods are required thatminimize shear degradation and coelution effects.
Received: April 17, 2012Revised: May 30, 2012Published: June 7, 2012
Article
pubs.acs.org/Macromolecules
© 2012 American Chemical Society 5247 dx.doi.org/10.1021/ma3007812 | Macromolecules 2012, 45, 5247−5259

Field-flow fractionation (FFF) has been widely investigatedover the years, and several publications have proven that FFF isa useful technique for the characterization of polymers. FFFenables the existing molar mass range for size separation to beextended and offers the possibility to analyze a wide variety ofmacromolecules and particles ranging from the nanometer tothe micrometer size with high resolution.10,45−47 FFF consistsof a family of subtechniques, and in each case separation isachieved by applying an external field which is perpendicular tothe longitudinal or inlet flow.45−47 In the present case,asymmetric flow field-flow fractionation (AF4) will be used.Some of the most significant advantages of FFF over SEC are(1) no stationary phase is present, so shear degradation isstrongly minimized,45,48 (2) the very low surface area of theaccumulation wall in FFF avoids unwanted adsorption andsecondary separation effects,45,49 (3) filtration is not necessary,since an open channel is used,35,50 (4) the exclusion limit is atleast 2 orders higher than in the case of SEC,45 (5) complexmixtures of suspended particles, gels, and soluble polymers canbe analyzed in one measurement,45 and (6) the workingconditions are conducive for the analysis of sensitive moleculesthat degrade easily.48 AF4 has been applied in various fields,ranging from synthetic and biological macromolecules toparticles of different natures.45 Studies of AF4 coupled tolight scattering detection have been used extensively in recentyears for in-depth investigations of structural parameters inaddition to absolute molar mass detection.51 Intensive studieshave been done in aqueous52−56 and nonaqueous35,41,57 mobilephases. Since FFF is based on an empty channel configuration,sample filtration is not required and, therefore, it is possible tofractionate and identify gel containing species.58−61
In the present work AF4- and SEC-MALLS are used tofractionate and analyze polybutadienes regarding molar massand branching. So far, the molar masses and hydrodynamicsizes of synthetic and natural rubbers have been characterizedby SEC,34,62−65 thermal FFF (ThFFF),33,60,66−70,72 andAF4.35,71,73 Organo-soluble polymers have been investigatedpredominantly by ThFFF since no membranes are used, and nosignificant interaction or adsorption takes place between samplemolecules and the plates of the empty channel. Only a fewaqueous applications on ThFFF have been reported.74−76
ThFFF has been used for synthetic organo-soluble polymersespecially in the elastomeric field where ultrahigh molar mass(UHMM) polymer fractions might be present as well asinsoluble gel fractions. The elastomeric fractions may also bebranched which will influence the structure−property relation-ship of these polymeric materials. Acrylonitrile−butadiene−styrene resins were separated by Shiundu et al. in THF in orderto separate the soluble polymer fraction from the insoluble gelfraction.60 Similarly, van Asten was able to separatepolybutadienes of different molar masses from each other intoluene.77 In addition, three polymers with similar hydro-dynamic volumes but different chemistries were successfullyseparated proving that ThFFF can separate according tohydrodynamic volume as well as chemical composition. Severalother elastomeric rubbers have been investigated byThFFF.33,48,58,59,66,68
SBS and PB rubbers among others are some of the fewelastomeric polymers already analyzed by AF4. SBR rubbershave been investigated, and it was shown that it is possible toseparate free and functionalized SBR from each other.71 Thepresence of branching and gel species in ultrahigh molar masspolybutadienes were successfully identified which in contrast
was not possible in SEC due to shear degradation, filtration,and abnormal elution behavior caused by coelution of branchedpolymers together with their regular eluting linear counter-parts.35 Based on the few applications mentioned above FFF,AF4 and ThFFF appear to be superior tools in areas where SECfails.In the present work industrial polybutadiene samples
synthesized using Ziegler−Natta catalysts78−80 were analyzedvia AF4- and SEC-MALLS. Different properties of thesematerials were measured, in particular the effect of branchingand dissolution time upon the elution behavior.
■ EXPERIMENTAL SECTIONMaterials and Sample Preparation. Polystyrene samples used
for calibration purposes were obtained from Fluka (Sigma-Aldrich,South Africa), with molar masses Mw of 62, 250, and 1000 kg/mol,respectively, and were dissolved in HPLC grade THF (Sigma-Aldrich,South Africa). The concentrations of the polystyrene samples were 3mg/mL (62 and 250 kg/mol) and 1 mg/mL (1000 kg/mol),respectively. These concentrations were used for both SEC and AF4measurements. Each polystyrene sample was dissolved at roomtemperature for 4 h without adding a stabilizer.
The polybutadiene samples used in the study were materials ofBayer, Leverkusen, Germany, having high cis contents with differentdispersities and various degrees of branching (Table 1).
The polybutadiene samples were dissolved in HPLC grade THFwith a concentration of ∼3 mg/mL. Butylated hydroxytoluene (BHT)obtained from Sigma-Aldrich (South Africa) was added as a stabilizer(1 mg/mL) to prevent oxidative degradation of the polymers. Thebasic dissolution procedure was to dissolve the samples for 16 h atroom temperature followed by 4 h of heating at 50 °C. This was notthe optimal dissolution procedure as will be discussed later. Thespecific refractive index increment (dn/dc) of polystyrene andpolybutadiene in THF were 0.18481 and 0.13282 mL/g, respectively.
SEC and AF4 Instrumentation Setup. The experiments wereperformed on an ambient temperature AF4-Instrument (AF2000,Postnova Analytics, Landsberg/Germany) which was coupled to aMALLS (Dawn DSP, Wyatt Technology, Santa Barbara, CA)(wavelength 632.8 nm, 25 °C) and a RI detector (PN 3140, PostnovaAnalytics, Landsberg/Germany). The channel was connected to threedifferent pumps (tip, focus, and cross-flow) while the injection portwas equipped with a manual injection valve (Rheodyne, Rohnert Park,CA). A regenerated cellulose membrane was installed for the AF4channel with an average molar mass cutoff of 10 or 5 kg/mol,respectively. The Mylar spacer used for definition of the channelheight had a thickness of 350 μm. The SEC setup consisted of a set oftwo PL Gel columns (mixed B and mixed C) in series. The inlet of themixed B column was connected to the tip pump while the outlet of themixed C column was connected to the detectors (MALLS and RI). Aschematic setup of the instrument is shown in Figure 1. A mixture ofboth column types was chosen to ensure proper separation of low(mixed C, 5 μm particles) and medium−high molar mass components(mixed B, 10 μm particles) of the samples. In addition, a mixed A
Table 1. Characteristics of PB 1−6 As Given by theManufacturera
sample catalyst branching dispersity gel
PB 1 Nd low broad noPB 2 Nd low broad noPB 3 Co low broad noPB 4 Nd low broad noPB 5 Co high broad noPB 6 Nd low broad yes
aSamples were polymerized with different ZN catalysts, varying inMooney viscosity, branching, gel, and dispersities.
Macromolecules Article
dx.doi.org/10.1021/ma3007812 | Macromolecules 2012, 45, 5247−52595248

column (20 μm particles) was used for comparison purposes. For theanalysis of the recovery, the RI calibration constant was determined byanalyzing the RI peak obtained from injecting a PS standard of 33 kg/mol. This calibration constant was checked again with a 62 kg/mol PSstandard. The calculated RI calibration constant was 1.016 × 10⁻⁴.Analysis Conditions for AF4. The samples were introduced into
the channel by manual injection with a flow rate of 0.2 mL/min for atime of 4 min (Figure 2). The low inlet flow rate was used to preventshear degradation. While the samples were injected, the cross-flow wasconstant at 8.5 mL/min and the focus flow automatically adjusted to8.8 mL/min to maintain a constant detector flow rate of 0.5 mL/min.
The focus flow causes the injected sample to accumulate in a narrowconcentration band minimizing band broadening and longitudinaldiffusion. After injection the focus flow rapidly decreased to zero(transition), while the tip flow increased up to 9 mL/min. After 2.5min, the tip flow and the cross-flow decreased by an exponential decayfunction to a value of 0.51 and 0.01 mL/min, respectively (elutionstep).
In a further investigation polystyrenes and polybutadienes wereanalyzed by making use of cross-flow B (Figure 2). The exponentialchange in the cross-flow profile was the same as in the case of cross-flow A, but instead of 8.8 mL/min, a starting cross-flow of 5.5 mL/minwas used.
■ RESULTS AND DISCUSSION
SEC and AF4 Method Validation Using PolystyreneStandards. Both SEC and AF4 separation systems were testedand compared based on the separation of polystyrene standardswith known molar masses (62, 250, and 1000 kg/mol). In SECone PL gel mixed C column was used for the separation of thepolystyrene mixture to avoid shear effects. The calibration,normalization, and determination of the correct interdetectordelay between MALLS and RI were conducted by making useof narrow disperse polystyrene (33 kg/mol) being an isotropicscatterer. The peak maxima of the RI and MALLS signals wereoverlaid giving a delay volume of 0.175 mL.
Figure 1. AF4 instrumentation setup at Stellenbosch University with a cross-section view of the channel at the bottom and inset of how the SECcolumns are connected to the tip pump when the channel is not in use.
Figure 2. Cross-flow profiles of cross-flows A and B.
Macromolecules Article
dx.doi.org/10.1021/ma3007812 | Macromolecules 2012, 45, 5247−52595249
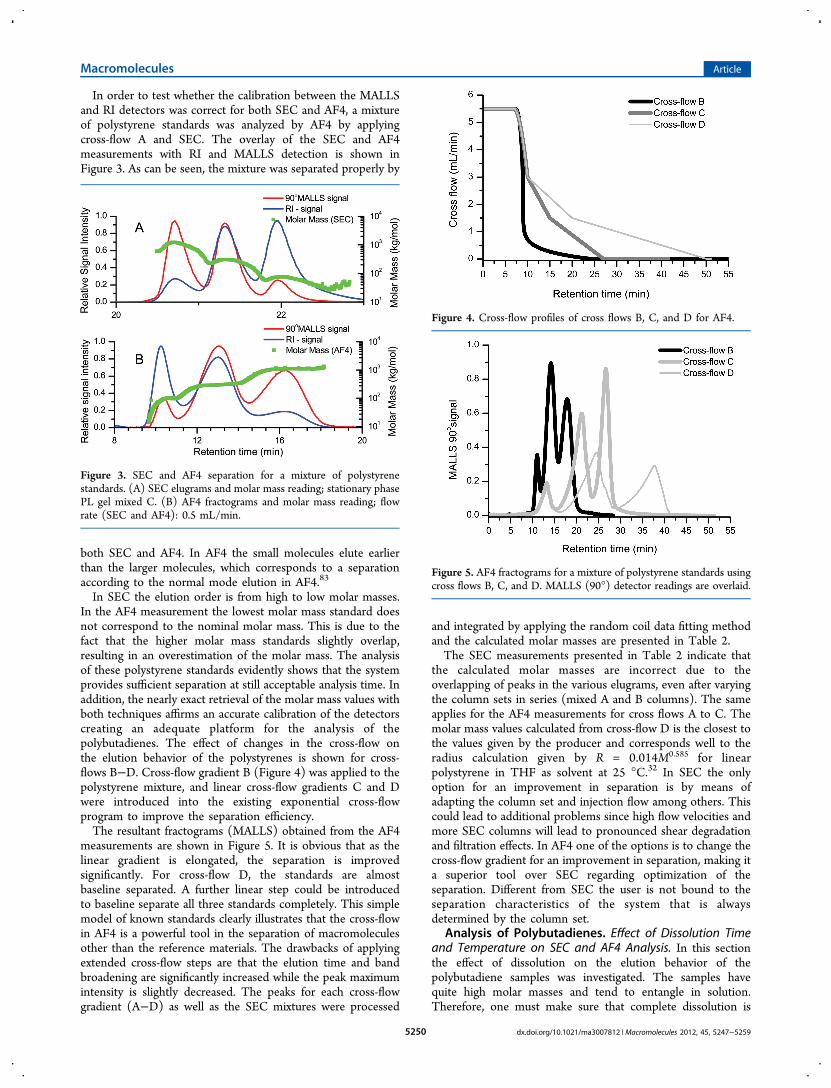
In order to test whether the calibration between the MALLSand RI detectors was correct for both SEC and AF4, a mixtureof polystyrene standards was analyzed by AF4 by applyingcross-flow A and SEC. The overlay of the SEC and AF4measurements with RI and MALLS detection is shown inFigure 3. As can be seen, the mixture was separated properly by
both SEC and AF4. In AF4 the small molecules elute earlierthan the larger molecules, which corresponds to a separationaccording to the normal mode elution in AF4.83
In SEC the elution order is from high to low molar masses.In the AF4 measurement the lowest molar mass standard doesnot correspond to the nominal molar mass. This is due to thefact that the higher molar mass standards slightly overlap,resulting in an overestimation of the molar mass. The analysisof these polystyrene standards evidently shows that the systemprovides sufficient separation at still acceptable analysis time. Inaddition, the nearly exact retrieval of the molar mass values withboth techniques affirms an accurate calibration of the detectorscreating an adequate platform for the analysis of thepolybutadienes. The effect of changes in the cross-flow onthe elution behavior of the polystyrenes is shown for cross-flows B−D. Cross-flow gradient B (Figure 4) was applied to thepolystyrene mixture, and linear cross-flow gradients C and Dwere introduced into the existing exponential cross-flowprogram to improve the separation efficiency.The resultant fractograms (MALLS) obtained from the AF4
measurements are shown in Figure 5. It is obvious that as thelinear gradient is elongated, the separation is improvedsignificantly. For cross-flow D, the standards are almostbaseline separated. A further linear step could be introducedto baseline separate all three standards completely. This simplemodel of known standards clearly illustrates that the cross-flowin AF4 is a powerful tool in the separation of macromoleculesother than the reference materials. The drawbacks of applyingextended cross-flow steps are that the elution time and bandbroadening are significantly increased while the peak maximumintensity is slightly decreased. The peaks for each cross-flowgradient (A−D) as well as the SEC mixtures were processed
and integrated by applying the random coil data fitting methodand the calculated molar masses are presented in Table 2.The SEC measurements presented in Table 2 indicate that
the calculated molar masses are incorrect due to theoverlapping of peaks in the various elugrams, even after varyingthe column sets in series (mixed A and B columns). The sameapplies for the AF4 measurements for cross flows A to C. Themolar mass values calculated from cross-flow D is the closest tothe values given by the producer and corresponds well to theradius calculation given by R = 0.014M0.585 for linearpolystyrene in THF as solvent at 25 °C.32 In SEC the onlyoption for an improvement in separation is by means ofadapting the column set and injection flow among others. Thiscould lead to additional problems since high flow velocities andmore SEC columns will lead to pronounced shear degradationand filtration effects. In AF4 one of the options is to change thecross-flow gradient for an improvement in separation, making ita superior tool over SEC regarding optimization of theseparation. Different from SEC the user is not bound to theseparation characteristics of the system that is alwaysdetermined by the column set.
Analysis of Polybutadienes. Effect of Dissolution Timeand Temperature on SEC and AF4 Analysis. In this sectionthe effect of dissolution on the elution behavior of thepolybutadiene samples was investigated. The samples havequite high molar masses and tend to entangle in solution.Therefore, one must make sure that complete dissolution is
Figure 3. SEC and AF4 separation for a mixture of polystyrenestandards. (A) SEC elugrams and molar mass reading; stationary phasePL gel mixed C. (B) AF4 fractograms and molar mass reading; flowrate (SEC and AF4): 0.5 mL/min.
Figure 4. Cross-flow profiles of cross flows B, C, and D for AF4.
Figure 5. AF4 fractograms for a mixture of polystyrene standards usingcross flows B, C, and D. MALLS (90°) detector readings are overlaid.
Macromolecules Article
dx.doi.org/10.1021/ma3007812 | Macromolecules 2012, 45, 5247−52595250
achieved prior to SEC and AF4 analysis. After an initialdissolution step of 16 h at ambient temperature followed by 4 hof heating, polybutadienes PB 1−3 were measured by SEC tosee whether the samples have been dissolved completely. Foreach sample the recovery from the SEC system was measuredby comparing the RI signals after injection into the SECcolumn. The RI calibration constant was determined byanalyzing the RI peak obtained from injecting a PS standardof 33 kg/mol. This calibration constant was checked again witha 62 kg/mol PS standard. The calculated RI calibrationconstant was 1.016 × 10⁻⁴. Blockage of the SEC columns wasprevented by filtering the samples with a 0.45 μm filter prior toinjection. Only 10% of the injected mass was recovered as isshown in Table 3, indicating that after the initial dissolution
step a large percentage of the samples not completely dissolved.As a result of incomplete dissolution, a large part of themacromolecules was probably present in solution as swollen gelparticles and was filtered off or trapped in the SEC column.For a further improvement of the sample preparation, the
samples were dissolved for another 48 h at ambient
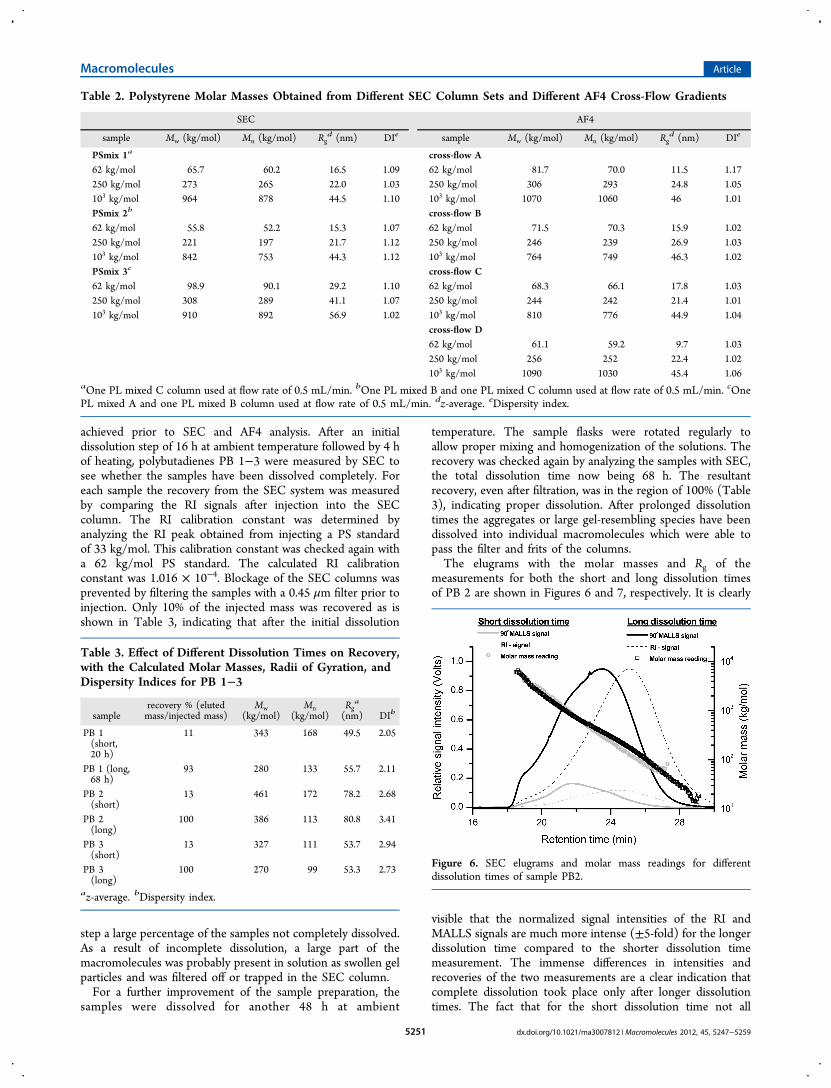
temperature. The sample flasks were rotated regularly toallow proper mixing and homogenization of the solutions. Therecovery was checked again by analyzing the samples with SEC,the total dissolution time now being 68 h. The resultantrecovery, even after filtration, was in the region of 100% (Table3), indicating proper dissolution. After prolonged dissolutiontimes the aggregates or large gel-resembling species have beendissolved into individual macromolecules which were able topass the filter and frits of the columns.The elugrams with the molar masses and Rg of the
measurements for both the short and long dissolution timesof PB 2 are shown in Figures 6 and 7, respectively. It is clearly
visible that the normalized signal intensities of the RI andMALLS signals are much more intense (±5-fold) for the longerdissolution time compared to the shorter dissolution timemeasurement. The immense differences in intensities andrecoveries of the two measurements are a clear indication thatcomplete dissolution took place only after longer dissolutiontimes. The fact that for the short dissolution time not all
Table 2. Polystyrene Molar Masses Obtained from Different SEC Column Sets and Different AF4 Cross-Flow Gradients
SEC AF4
sample Mw (kg/mol) Mn (kg/mol) Rgd (nm) DIe sample Mw (kg/mol) Mn (kg/mol) Rg
d (nm) DIe
PSmix 1a cross-flow A62 kg/mol 65.7 60.2 16.5 1.09 62 kg/mol 81.7 70.0 11.5 1.17250 kg/mol 273 265 22.0 1.03 250 kg/mol 306 293 24.8 1.05103 kg/mol 964 878 44.5 1.10 103 kg/mol 1070 1060 46 1.01PSmix 2b cross-flow B62 kg/mol 55.8 52.2 15.3 1.07 62 kg/mol 71.5 70.3 15.9 1.02250 kg/mol 221 197 21.7 1.12 250 kg/mol 246 239 26.9 1.03103 kg/mol 842 753 44.3 1.12 103 kg/mol 764 749 46.3 1.02PSmix 3c cross-flow C62 kg/mol 98.9 90.1 29.2 1.10 62 kg/mol 68.3 66.1 17.8 1.03250 kg/mol 308 289 41.1 1.07 250 kg/mol 244 242 21.4 1.01103 kg/mol 910 892 56.9 1.02 103 kg/mol 810 776 44.9 1.04
cross-flow D62 kg/mol 61.1 59.2 9.7 1.03250 kg/mol 256 252 22.4 1.02103 kg/mol 1090 1030 45.4 1.06
aOne PL mixed C column used at flow rate of 0.5 mL/min. bOne PL mixed B and one PL mixed C column used at flow rate of 0.5 mL/min. cOnePL mixed A and one PL mixed B column used at flow rate of 0.5 mL/min. dz-average. eDispersity index.
Table 3. Effect of Different Dissolution Times on Recovery,with the Calculated Molar Masses, Radii of Gyration, andDispersity Indices for PB 1−3
samplerecovery % (elutedmass/injected mass)
Mw(kg/mol)
Mn(kg/mol)
Rga
(nm) DIb
PB 1(short,20 h)
11 343 168 49.5 2.05
PB 1 (long,68 h)
93 280 133 55.7 2.11
PB 2(short)
13 461 172 78.2 2.68
PB 2(long)
100 386 113 80.8 3.41
PB 3(short)
13 327 111 53.7 2.94
PB 3(long)
100 270 99 53.3 2.73
az-average. bDispersity index.
Figure 6. SEC elugrams and molar mass readings for differentdissolution times of sample PB2.
Macromolecules Article
dx.doi.org/10.1021/ma3007812 | Macromolecules 2012, 45, 5247−52595251

macromolecules are properly dissolved yet and someentanglements are still present is also visible in the Rg plotgiven in Figure 7. While for the long dissolution period Rgdecreases monotonically with increasing elution time, this is notthe case for the short dissolution period. In this case anupswing of the Rg reading is observed. This effect will bediscussed later in the article. The molar mass distribution isobtained by extrapolation of the molar mass vs retention timeplot and is represented by a differential molar mass plot. TheMMD for both short and long dissolution times closely overlapas shown in Figure 8.
The cumulative weight fraction plots of both measurementsare overlaid before and after extrapolation. It is visible that thedifferent dissolution procedures have only a minor impact onthe very low and high molar mass fractions which is one of thereasons why the improper dissolution is hard to identify just bycomparison of the average molar mass values, radii, anddispersities as shown in Table 3. Consequently, longerdissolution times of minimum 68 h were used as a basis forthe analysis of all other polybutadiene samples since theyprovided more reliable results with regard to sample recoveryand reproducibility.
In another example (PB 4), the effect of dissolution wasinvestigated by comparing SEC and AF4 results. The samplewas treated similar to the previous one. In this exampledifferent heating steps and filtering were applied to investigatethe effect of dissolution and heating upon elution behavior.Figure 9 shows the SEC elugram using the 90° MALLS signal
and the molar mass reading. Measurements were taken afterfiltration with a 0.45 μm filter 1 and 3 days after the initialsample treatment and after a second heating step of 5 h. Anadditional measurement after the second heating step was takenwith a 0.20 μm filter. Both 1 and 3 days after initial heattreatment (thick black and gray lines) a strong noise signal isobserved at the high molar mass side in the MALLS signalwhich is possibly due to very small amounts of large gel-resembling species present in solution. Their concentration istoo small to be detected by the RI detector (Figure 10).The assumption is made that these gel-resembling species
might be not cross-linked macromolecules but entangledmacromolecules that are only partially dissolved. The decreaseof the noise with increasing heating or dissolution time is aclear indication that this assumption is correct. After 3 days(thick gray line) of dissolution the noise decreased compared tothe measurement after 1 day (thick black line). Themeasurement taken after the second heating step (thin blackline) also suggests an increasing amount of properly dissolvedmacromolecules. The measurement after filtration with a 0.20μm filter (thin gray line) shows almost no noise present in thelight scattering signal. This is a possible indication that most ofthe gel-resembling species were filtered off or got stuck on theinlet frit of the column.35 The corresponding RI signals and Rgreadings of the SEC measurement shown in Figure 10. Thesmooth RI curves do not show any noise or peaks at an elutiontime of about 21 min, emphasizing the low sensitivity of the RIdetector for elution slices containing large macromolecules thatare very low in concentration.58,68 At high retention times boththe molar mass and Rg vs retention time plots (Figures 9 and10) show abnormal SEC behavior.35,84 In Figure 9, the molarmass shows a minor increase at high elution time for the
Figure 7. SEC elugrams and Rg readings for short and long dissolutiontimes of sample PB2.
Figure 8. Cumulative weight and molar mass distribution of PB2 atshort and long dissolution times. Symbols □ and △ arenonextrapolated data while all the other plots are fitted with fit ordersgiven in parentheses.
Figure 9. SEC elugrams of PB 4 with MALLS signal and molar massreadings.
Macromolecules Article
dx.doi.org/10.1021/ma3007812 | Macromolecules 2012, 45, 5247−52595252
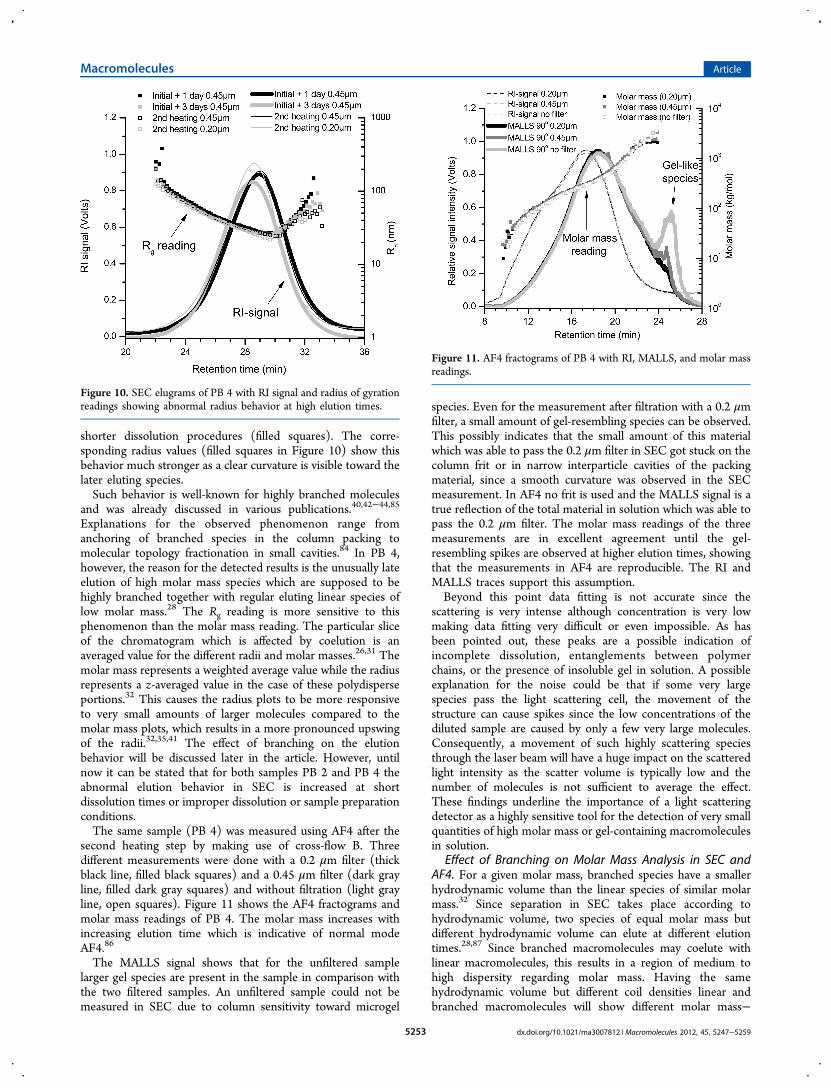
shorter dissolution procedures (filled squares). The corre-sponding radius values (filled squares in Figure 10) show thisbehavior much stronger as a clear curvature is visible toward thelater eluting species.Such behavior is well-known for highly branched molecules
and was already discussed in various publications.40,42−44,85
Explanations for the observed phenomenon range fromanchoring of branched species in the column packing tomolecular topology fractionation in small cavities.84 In PB 4,however, the reason for the detected results is the unusually lateelution of high molar mass species which are supposed to behighly branched together with regular eluting linear species oflow molar mass.28 The Rg reading is more sensitive to thisphenomenon than the molar mass reading. The particular sliceof the chromatogram which is affected by coelution is anaveraged value for the different radii and molar masses.26,31 Themolar mass represents a weighted average value while the radiusrepresents a z-averaged value in the case of these polydisperseportions.32 This causes the radius plots to be more responsiveto very small amounts of larger molecules compared to themolar mass plots, which results in a more pronounced upswingof the radii.32,35,41 The effect of branching on the elutionbehavior will be discussed later in the article. However, untilnow it can be stated that for both samples PB 2 and PB 4 theabnormal elution behavior in SEC is increased at shortdissolution times or improper dissolution or sample preparationconditions.The same sample (PB 4) was measured using AF4 after the
second heating step by making use of cross-flow B. Threedifferent measurements were done with a 0.2 μm filter (thickblack line, filled black squares) and a 0.45 μm filter (dark grayline, filled dark gray squares) and without filtration (light grayline, open squares). Figure 11 shows the AF4 fractograms andmolar mass readings of PB 4. The molar mass increases withincreasing elution time which is indicative of normal modeAF4.86
The MALLS signal shows that for the unfiltered samplelarger gel species are present in the sample in comparison withthe two filtered samples. An unfiltered sample could not bemeasured in SEC due to column sensitivity toward microgel
species. Even for the measurement after filtration with a 0.2 μmfilter, a small amount of gel-resembling species can be observed.This possibly indicates that the small amount of this materialwhich was able to pass the 0.2 μm filter in SEC got stuck on thecolumn frit or in narrow interparticle cavities of the packingmaterial, since a smooth curvature was observed in the SECmeasurement. In AF4 no frit is used and the MALLS signal is atrue reflection of the total material in solution which was able topass the 0.2 μm filter. The molar mass readings of the threemeasurements are in excellent agreement until the gel-resembling spikes are observed at higher elution times, showingthat the measurements in AF4 are reproducible. The RI andMALLS traces support this assumption.Beyond this point data fitting is not accurate since the
scattering is very intense although concentration is very lowmaking data fitting very difficult or even impossible. As hasbeen pointed out, these peaks are a possible indication ofincomplete dissolution, entanglements between polymerchains, or the presence of insoluble gel in solution. A possibleexplanation for the noise could be that if some very largespecies pass the light scattering cell, the movement of thestructure can cause spikes since the low concentrations of thediluted sample are caused by only a few very large molecules.Consequently, a movement of such highly scattering speciesthrough the laser beam will have a huge impact on the scatteredlight intensity as the scatter volume is typically low and thenumber of molecules is not sufficient to average the effect.These findings underline the importance of a light scatteringdetector as a highly sensitive tool for the detection of very smallquantities of high molar mass or gel-containing macromoleculesin solution.
Effect of Branching on Molar Mass Analysis in SEC andAF4. For a given molar mass, branched species have a smallerhydrodynamic volume than the linear species of similar molarmass.32 Since separation in SEC takes place according tohydrodynamic volume, two species of equal molar mass butdifferent hydrodynamic volume can elute at different elutiontimes.28,87 Since branched macromolecules may coelute withlinear macromolecules, this results in a region of medium tohigh dispersity regarding molar mass. Having the samehydrodynamic volume but different coil densities linear andbranched macromolecules will show different molar mass−
Figure 10. SEC elugrams of PB 4 with RI signal and radius of gyrationreadings showing abnormal radius behavior at high elution times.
Figure 11. AF4 fractograms of PB 4 with RI, MALLS, and molar massreadings.
Macromolecules Article
dx.doi.org/10.1021/ma3007812 | Macromolecules 2012, 45, 5247−52595253

radius of gyration behavior. For linear macromolecules Rg willincrease proportionally with molar mass. This effect is loweredor might not be the case for branched macromolecules. If thebranching density increases, then for the same molar mass Rgdecreases. This will result in a decreased slope of the Rg vs Mplot for samples that are branched over the whole mass range.Samples that show significant branching only for the high molarmass molecules often show a decrease of the Rg vs M slope forthe high molar mass fractions.87
A second effect which is often found for branched material isthe abnormal upswing of the radius and (to a lesser extent) themolar mass at low elution times in SEC-MALLS. This effect isalso visible for sample PB 5 (Figures 12 and 13). The reason for
the reincrease is the abnormal late coelution of large and highmolar mass molecules together with regular eluting smallmolecules of low molar mass. Species which differ highly inmolar mass and size are coeluting which was proven forpolyethylene samples by fractionation of the late eluting partfrom SEC and reinjection of the fraction in FFF.84
Low and high molar mass molecules can be isolated byproper FFF separation provided that their hydrodynamicvolumes are different. In addition, no interactions are observed
between the polybutadiene molecules and the cellulosemembrane. However, care must be taken to avoid membranefouling which would affect the separation.Until now, the reason for the upswing in SEC is not
completely clear. Since the effect is preferably found forbranched material,28,38,40,42−44,85 the branching seems to be oneof the reasons for the abnormal late elution of largemacromolecules. In addition, the presence of small linearmacromolecules and large excessively branched material mightfurther increase the dispersity effect, therefore resulting in thedifferences between the detected molar mass and Rg valueswhich are weight (w)- and z-averages for disperse fractions,respectively. Consequently, the bigger the dispersity effects ofthe late-elution fractions, the higher the impact of the differentaveraging of Rg and M.The degree of branching from SEC-MALLS is typically
calculated by the interpretation of the slope in theconformation plot which is the relationship between Rg andmolar mass (Figure 14).28 Because of the upswing effect in the
SEC plot, calculations related to branching will be falsified(slope of 0.36 in Figure 14) since the coelution effect leads towrong values of the slope. Two overlapping effects both relatedto branching are observed in this case. First a decrease in theRg−M slope is visible for (1) partially branched molecules athigh molar masses and (2) fully branched moleculesthroughout the molar mass range. Second, the upcurling ofRg at high elution times/low molar masses which is related tobranching but cannot be correlated since the reincreasing radiiare due to the high polydispersity of the size fractions in thispart of the conformation plot. Consequently, the effect cannotbe assigned to a change of shape or density of the polymer coilsince this would only be possible if proper separation with sizefractions that are monodisperse in hydrodynamic volume areobtained. The upswing influences the regular molecularcontraction as described in the first effect. Thus, SEC may bevery sensitive toward branching since upswing and molecularcontraction get visible, but a data evaluation is not possible dueto the coexistence of a huge variety of effects caused bybranching.Table 4 shows the calculated molar masses and radii for the
upswing in Figures 12 and 13. The extrapolated values are also
Figure 12. MALLS signals of SEC and AF4 with molar mass readingsoverlaid, sample PB 5.
Figure 13. MALLS signals of SEC and AF4 with Rg readings overlaid,sample PB 5.
Figure 14. Conformation plots (Rg vs molar mass) for SEC (graysquares) and AF4 (black squares) of sample PB 5. MMD of SEC (grayline, extrapolated) and AF4 (black line) are overlaid.
Macromolecules Article
dx.doi.org/10.1021/ma3007812 | Macromolecules 2012, 45, 5247−52595254

calculated by applying a linear fit to the molar mass and Rg plotsin SEC, giving the values that are estimated if no upswing waspresent. As can be seen, the extrapolated molar mass and Rgvalues are smaller than in the case of the calculation withoutextrapolation. In AF4, no stationary phase is present, whichavoids these unwanted irregularities (black lines, black filledsquares in Figures 12 and 13). The effects of shear degradationand coelution are minimized, and the resultant branchingcalculations can be achieved accurately (Figure 14, gray linesand squares). Cross-flow A was applied for this measurement,and the slope observed in the conformation plot for AF4 was
0.43, which is below the reference value of 0.588 for linearmolecules.87 The reduced slope indicates that long chainbranching was present in the sample. The conformation plot aswell as the MMD in Figure 14 shows that in AF4 much highermolar masses are detected compared to the measurement inSEC.Higher molar masses are also confirmed in Table 4 for both
the filtered and unfiltered samples in AF4. This decrease inmolar mass in SEC is possibly an indication that sheardegradation and/or removal of ultrahigh molar masscomponents of the sample caused by the stationary phaseoccurred. The MMD in Figure 14 also shows that lower molarmasses are obtained for the SEC measurement if extrapolationis applied. This was due to the polymer chains above the molarmass cutoff of the membrane being able to pass through thepores of the membrane. The cutoff value (10 kg/mol) is anaveraged value; therefore, it is possible that higher molar massfractions can be lost through the membrane as well. The lowerrecoveries observed for the AF4 measurements compared toSEC in Table 4 supports the analogy made.Additionally, it can be speculated that improper dissolution,
and as a consequence, the presence of compact and onlypartially dissolved agglomerates of multiple polymer chains maylead to increased late elution behavior in SEC. As a result, theywill elute late, and thus they will be masked due to the localmass and radius average effects. Finally, the species are invisiblein the MMD and overall molar mass/radius average values. It isknown that dissolution irregularities could cause polymerstructures to behave like branched or even highly branchedspecies since the contact points of the different polymer chainswill act like physical branching points, and thus they could also
Table 4. Calculated Molar Masses, Radii, and DispersityIndices of PB5 from SEC and AF4a
sample
recovery %(eluted/injected
mass)Mw
(kg/mol)Mn
(kg/mol)Rgb
(nm) DIc
PB 5 (SEC,filter)
97 450 154 69.1 2.9
PB 5 (SEC,extrapolated)
420 103 60.9 4.1
PB 5 (AF4,filter)
87 920 187 141.4 4.9
PB 5 (AF4, nofilter)
89 982 204 161.1 4.8
PB 5 (AF4, re-injection1)
465 160 122.5 2.9
PB 5 (AF4, re-injection2
490 168 121.7 2.9
aFiltering was done with a 0.45 μm filter. The collected fractions of thelate eluting fraction in SEC were re-injected in AF4 without filtering.bz-average. cDispersity index.
Figure 15. Upswing elugram from SEC vs AF4 of the collected fractions for PB 5: (A) Molar mass readings showing that the lower molar masses aremasked in SEC due to coelution compared to AF4. (B) Cumulative molar mass plot confirming the missing low molar mass fraction in SEC, butpresent in the collected fractions measured in AF4. The Rg−M relationships of the two distributions observed in (A) are overlaid in (B).
Macromolecules Article
dx.doi.org/10.1021/ma3007812 | Macromolecules 2012, 45, 5247−52595255
undergo the second separation mechanism which is oftenclaimed to be a reason for late elution.35 This observation issupported by the increased upswing phenomenon of molarmass and radius for sample PB 2 and PB 4 if poor dissolutionconditions were applied.The late eluting fraction in PB 4 (retention time of 26−31
min) was fractionated multiple times in order to investigatewhether or not artifacts were present in the interpretation ofthe SEC data. The late eluting fractions were combined andevaporated at room temperature to obtain a concentrationsufficient for reinjection. The combined late eluting fractionwas reinjected into AF4 in duplicate and compared to the initialSEC measurement. Figure 15 shows the molar mass,cumulative weight fraction, and conformation (Rg vs M)plots. In this case a membrane with a cutoff of 5 kg/mol wasused.Figure 15A shows that lower and higher molar masses were
observed in AF4 compared to the SEC measurements. Thelower molar mass molecules are well separated from the highermolar masses in AF4, resulting in smaller values being detectedcompared to SEC. In SEC the low molar masses were maskedby the upswing observed in the molar mass and radii plotscaused by the coelution of normal linear eluting species withbranched species, respectively. The most remarkable observa-tion is that molar masses as high as 50 000 kg/mol weredetected in the collected fractions reinjected in AF4, confirmingthe presence of large structures of high molar masses present inthe late eluting fraction. In SEC molar masses only up to 10 000kg/mol were detected since this is the exclusion limit of themixed B column.The molar mass plots in AF4 also show two distinct molar
mass regions which is an indication that different species arepresent in the late eluting SEC fraction, possibly a combinationof linear, branched, and gel species. The cumulative molar massplot in Figure 15B confirms the detection of much lower molarmasses in AF4 compared to SEC. The weight fraction ofpolymer chains above 100 kg/mol is ∼70% of the collectedfraction. This indicates that a significant amount of high molarmass species eluted later than expected, either due tobranching, retardation of high molar mass species in thepores of the stationary phase (slalom chromatography), or acombination of the two.49,88 Similar work has been done for theinvestigation of the late eluting fraction of branched polyolefinsusing high temperature SEC/AF4-MALLS analysis of low-density polyethylene.84 The conformation plots of thereinjected fractions are presented in Figure 15B. Two distinctslopes are clearly visible for the two observed molar massregions in Figure 15A. The first slope resembles molar massspecies up to 400 kg/mol that are highly branched (slope =0.34) while the second slope of 0.14 is indicative of very highmolar mass species which are spherical and compact in nature.These species are most likely highly cross-linked gel materialpresent in very small amounts. The fact that the molar massincreases without a significant change in size supports thisstatement. The molar mass values observed in the measure-ments before (SEC, AF4) and after (AF4) fractionation areshown in Table 4. The average molar mass (Mw) is in theregion of 500 kg/mol, which is well above 80 kg/mol, the valuewhere the upswing in SEC initiated (Figure 15A). The presenceof late eluting branched species together with high molar massmaterial is validated by the observed values in Table 4.It has to be mentioned, however, that the direct comparison
of the small fraction in Figure 14 with the results of Figure 15
might also suffer partially from unsufficient resolution.Therefore, the determination of Rg is challenging in thisregime. To overcome this problem, the use of a membranehaving a lower cutoff might be helpful.
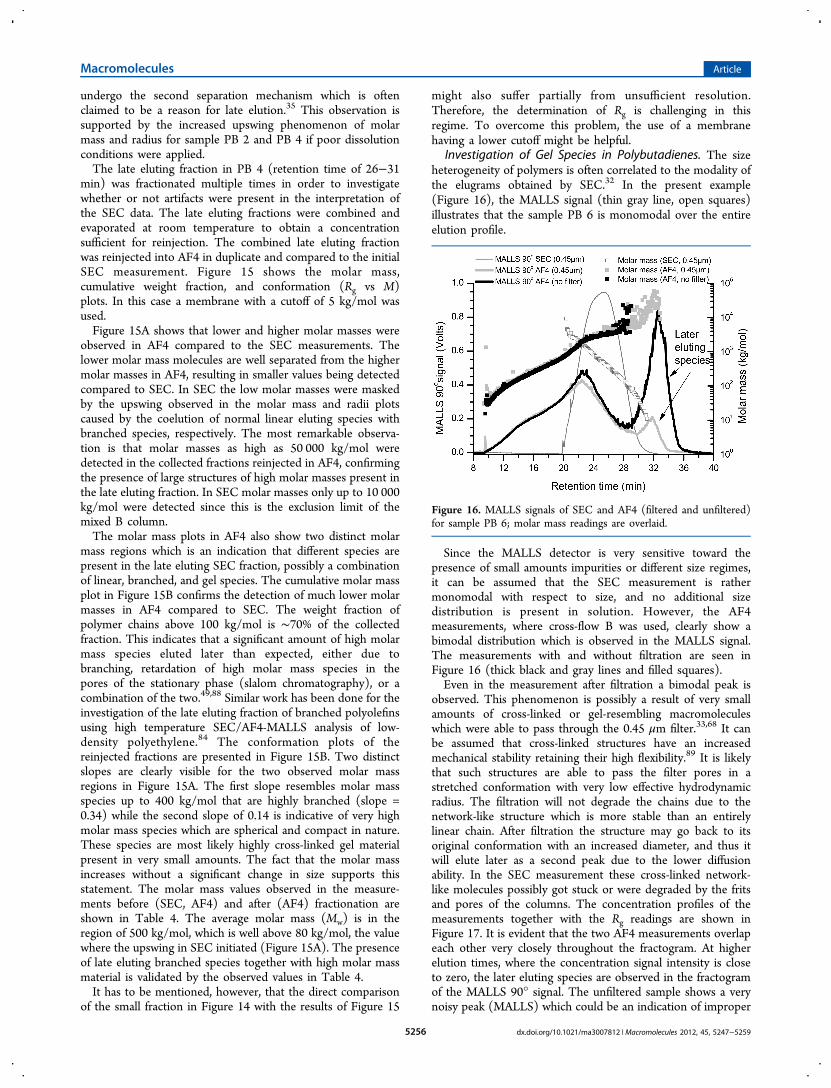
Investigation of Gel Species in Polybutadienes. The sizeheterogeneity of polymers is often correlated to the modality ofthe elugrams obtained by SEC.32 In the present example(Figure 16), the MALLS signal (thin gray line, open squares)illustrates that the sample PB 6 is monomodal over the entireelution profile.
Since the MALLS detector is very sensitive toward thepresence of small amounts impurities or different size regimes,it can be assumed that the SEC measurement is rathermonomodal with respect to size, and no additional sizedistribution is present in solution. However, the AF4measurements, where cross-flow B was used, clearly show abimodal distribution which is observed in the MALLS signal.The measurements with and without filtration are seen inFigure 16 (thick black and gray lines and filled squares).Even in the measurement after filtration a bimodal peak is
observed. This phenomenon is possibly a result of very smallamounts of cross-linked or gel-resembling macromoleculeswhich were able to pass through the 0.45 μm filter.33,68 It canbe assumed that cross-linked structures have an increasedmechanical stability retaining their high flexibility.89 It is likelythat such structures are able to pass the filter pores in astretched conformation with very low effective hydrodynamicradius. The filtration will not degrade the chains due to thenetwork-like structure which is more stable than an entirelylinear chain. After filtration the structure may go back to itsoriginal conformation with an increased diameter, and thus itwill elute later as a second peak due to the lower diffusionability. In the SEC measurement these cross-linked network-like molecules possibly got stuck or were degraded by the fritsand pores of the columns. The concentration profiles of themeasurements together with the Rg readings are shown inFigure 17. It is evident that the two AF4 measurements overlapeach other very closely throughout the fractogram. At higherelution times, where the concentration signal intensity is closeto zero, the later eluting species are observed in the fractogramof the MALLS 90° signal. The unfiltered sample shows a verynoisy peak (MALLS) which could be an indication of improper
Figure 16. MALLS signals of SEC and AF4 (filtered and unfiltered)for sample PB 6; molar mass readings are overlaid.
Macromolecules Article
dx.doi.org/10.1021/ma3007812 | Macromolecules 2012, 45, 5247−52595256
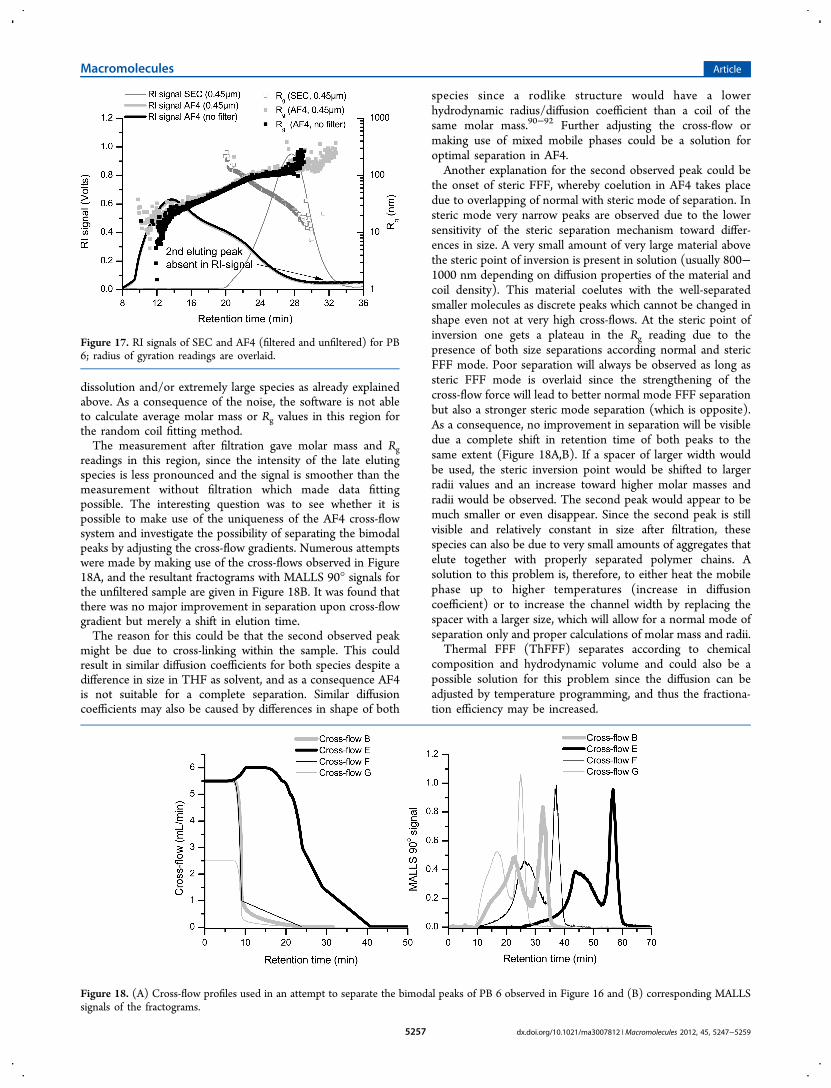
dissolution and/or extremely large species as already explainedabove. As a consequence of the noise, the software is not ableto calculate average molar mass or Rg values in this region forthe random coil fitting method.The measurement after filtration gave molar mass and Rg
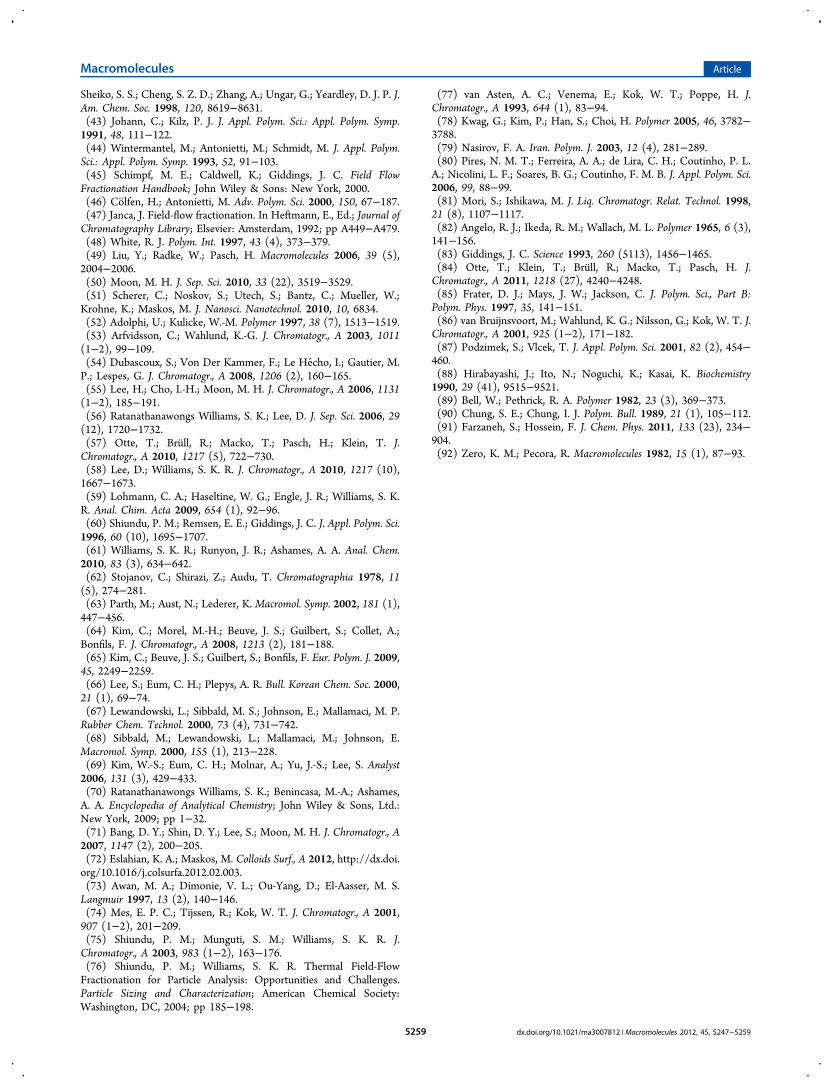
readings in this region, since the intensity of the late elutingspecies is less pronounced and the signal is smoother than themeasurement without filtration which made data fittingpossible. The interesting question was to see whether it ispossible to make use of the uniqueness of the AF4 cross-flowsystem and investigate the possibility of separating the bimodalpeaks by adjusting the cross-flow gradients. Numerous attemptswere made by making use of the cross-flows observed in Figure18A, and the resultant fractograms with MALLS 90° signals forthe unfiltered sample are given in Figure 18B. It was found thatthere was no major improvement in separation upon cross-flowgradient but merely a shift in elution time.The reason for this could be that the second observed peak
might be due to cross-linking within the sample. This couldresult in similar diffusion coefficients for both species despite adifference in size in THF as solvent, and as a consequence AF4is not suitable for a complete separation. Similar diffusioncoefficients may also be caused by differences in shape of both
species since a rodlike structure would have a lowerhydrodynamic radius/diffusion coefficient than a coil of thesame molar mass.90−92 Further adjusting the cross-flow ormaking use of mixed mobile phases could be a solution foroptimal separation in AF4.Another explanation for the second observed peak could be
the onset of steric FFF, whereby coelution in AF4 takes placedue to overlapping of normal with steric mode of separation. Insteric mode very narrow peaks are observed due to the lowersensitivity of the steric separation mechanism toward differ-ences in size. A very small amount of very large material abovethe steric point of inversion is present in solution (usually 800−1000 nm depending on diffusion properties of the material andcoil density). This material coelutes with the well-separatedsmaller molecules as discrete peaks which cannot be changed inshape even not at very high cross-flows. At the steric point ofinversion one gets a plateau in the Rg reading due to thepresence of both size separations according normal and stericFFF mode. Poor separation will always be observed as long assteric FFF mode is overlaid since the strengthening of thecross-flow force will lead to better normal mode FFF separationbut also a stronger steric mode separation (which is opposite).As a consequence, no improvement in separation will be visibledue a complete shift in retention time of both peaks to thesame extent (Figure 18A,B). If a spacer of larger width wouldbe used, the steric inversion point would be shifted to largerradii values and an increase toward higher molar masses andradii would be observed. The second peak would appear to bemuch smaller or even disappear. Since the second peak is stillvisible and relatively constant in size after filtration, thesespecies can also be due to very small amounts of aggregates thatelute together with properly separated polymer chains. Asolution to this problem is, therefore, to either heat the mobilephase up to higher temperatures (increase in diffusioncoefficient) or to increase the channel width by replacing thespacer with a larger size, which will allow for a normal mode ofseparation only and proper calculations of molar mass and radii.Thermal FFF (ThFFF) separates according to chemical
composition and hydrodynamic volume and could also be apossible solution for this problem since the diffusion can beadjusted by temperature programming, and thus the fractiona-tion efficiency may be increased.
Figure 17. RI signals of SEC and AF4 (filtered and unfiltered) for PB6; radius of gyration readings are overlaid.
Figure 18. (A) Cross-flow profiles used in an attempt to separate the bimodal peaks of PB 6 observed in Figure 16 and (B) corresponding MALLSsignals of the fractograms.
Macromolecules Article
dx.doi.org/10.1021/ma3007812 | Macromolecules 2012, 45, 5247−52595257

■ CONCLUSIONS
The AF4-MALLS-RI separation technique was successfullyimplemented for very high molar mass polybutadienes.Comparisons of SEC with AF4 using polystyrene standardsas reference materials were in good agreement with theexpected values. The versatility of the cross-flow field in AF4 isan invaluable tool for the optimization of separation as wasshown for the mixture of polystyrene standards. As a result, thecorrect molar mass and radius information can be obtained inthe case of perfect separation. SEC analysis of polybutadienesshowed overlapping effects of chain fragmentation andentanglements of large molecules, while the coelution of largemacromolecules together with regularly eluting species ofsmaller molar mass causes problems with regard to calculatingthe correct molar mass and radius distributions.In contrast, AF4 analysis of the polybutadienes showed a
number of advantages over SEC, especially in the case of veryhigh molar mass, branched and gel-containing samples. Becauseof the higher exclusion limit and absence of a stationary phasein AF4, accurate molar mass and radius distributions can becalculated for the branched or ultrahigh molar mass speciessince coelution due to branching or shear degradation isminimized. The collection of the coeluting fraction andreinjection in AF4 confirmed the presence of high molarmass species, which is an important step for SEC-MALLSinterpretations of data in future. AF4 is also a valuable tool forinvestigating the dissolution process compared to SEC wherefiltration is necessary. The MALLS detector is very sensitive tohigh molar mass species; therefore, as a result of the emptychannel in AF4 it was possible to analyze very small amounts ofgel species without filtering the samples. The experimentsindicate that it is possible to use AF4 as a special tool for theextended analysis of synthetic rubber materials especially in thecase of very high molar mass or excessive branching. In futurethe new information from AF4 could offer the possibility toexplain some differences in the processing behavior of suchsamples.
■ AUTHOR INFORMATION
Corresponding Author*E-mail: [email protected].
Present Address§Hamilton Bonaduz AG, Via Crusch 8, 7402 Bonaduz,Switzerland.
NotesThe authors declare no competing financial interest.
■ ACKNOWLEDGMENTS
We acknowledge Freeworld Coatings, PPS Insurance, and theNational Research Foundation (NRF) for financial support. Wegreatly thank Robert Bruell for providing the polybutadienesamples.
■ REFERENCES(1) Halliwell, S. Polymers in Building and Construction; RapraTechnology Ltd.: Shawbury, UK, 2002.(2) Gurunathan, K.; Murugan, A. V.; Marimuthu, R.; Mulik, U. P.;Amalnerkar, D. P. Mater. Chem. Phys. 1999, 61 (3), 173−191.(3) Heeger, A. J. Synth. Met. 2001, 125 (1), 23−42.(4) Mark, J. E. Polymer Data Handbook; Oxford University Press:New York, 1999.
(5) Grayson, A. C. R.; Choi, I. S.; Tyler, B. M.; Wang, P. P.; Brem,H.; Cima, M. J.; Langer, R. Nat. Mater. 2003, 2 (11), 767−772.(6) Yoon, H.-J.; Jang, W.-D. J. Mater. Chem. 2010, 20 (2), 211−222.(7) Narula, C. K.; Allison, J. E.; Bauer, D. R.; Gandhi, H. S. Chem.Mater. 1996, 8 (5), 984−1003.(8) Striegel, A. M. Anal. Bioanal. Chem. 2008, 390, 303.(9) Kostanski, L. K.; Keller, D. M.; Hamielec, A. E. J. Biochem. Bioph.Methods 2004, 58 (2), 159−186.(10) Messaud, F. A.; Sanderson, R. D.; Runyon, J. R.; Otte, T.; Pasch,H.; Williams, S. K. R. Prog. Polym. Sci. 2009, 34 (4), 351−368.(11) Striegel, A. M.; Kirkland, J. J.; Yau, W. W.; Bly, D. D. ModernSize Exclusion Chromatography, 2nd ed.; Wiley: Hoboken, NJ, 2009; p494.(12) Gaborieau, M.; Castignolles, P. Anal. Bioanal. Chem. 2011, 399,1413.(13) Trathnigg, B. Size-Exclusion Chromatography of Polymers; JohnWiley & Sons, Ltd.: New York, 2006.(14) Netopilik, M.; Kratochvil, P. Polymer 2003, 44, 3431.(15) Guillaneuf, Y.; Castignolles, P. J. Polym. Sci., Part A: Polym.Chem. 2008, 46, 897.(16) Podzimek, S. J. Chromatogr., A 1994, 677 (1), 21−24.(17) Gray-Weale, A. A.; Cave, R. A.; Gilbert, R. G. Biomacromolecules2009, 10 (9), 2708−2713.(18) Mendrek, B.; Trzebicka, B. Eur. Polym. J. 2009, 45 (7), 1979−1993.(19) Pang, S.; Rudin, A. Polymer 1992, 33, 1949..(20) Striegel, A. M.; Krejsa, M. R. J. Polym. Sci., Part B: Polym. Phys.2000, 38, 3120.(21) Garamszegi, L.; Nguyen, T. Q.; Plummer, C. J. G.; Manson, J. A.E. J. Liq. Chromatogr. Relat. Technol. 2003, 26, 207.(22) Gaborieau, M.; Nicolas, J.; Save, M.; Charleux, B.; Vairon, J.-P.;Gilbert, R. G.; Castignolles, P. J. Chromatogr., A 2008, 1190, 215.(23) Yau, W. W.; Rementer, S. W. J. Liq. Chromatogr. 1990, 13, 627.(24) Goldwasser, J. M. ACS Symp. Ser. 1993, 521, 243.(25) Harrison, C. A.; Mourey, T. H. J. Appl. Polym. Sci. 1995, 56, 211.(26) Podzimek, S. J. Appl. Polym. Sci. 1994, 54 (1), 91−103.(27) Kastanek, A.; Podzimek, S.; Dostal, J.; Simek, L.; Bohdanecky,M. Polymer 2000, 41 (8), 2865−2870.(28) Podzimek, S.; Vlcek, T.; Johann, C. J. Appl. Polym. Sci. 2001, 81(7), 1588−1594.(29) Zagar, E.; Zigon, M.; Podzimek, S. Polymer 2006, 47 (1), 166−175.(30) Angoy, M.; Bartolome, M. I.; Vispe, E.; Lebeda, P.; Jimenez, M.V.; Perez-Torrente, J. J.; Collins, S.; Podzimek, S. Macromolecules2010, 43 (15), 6278−6283.(31) Wyatt, P. J. Anal. Chim. Acta 1993, 272 (1), 1−40.(32) Podzimek, S. Light Scattering, Size Exclusion Chromatography andAsymmetric Flow Field Flow Fractionation: Powerful Tools for theCharacterization of Polymers, Proteins and Nanoparticles; John Wiley &Sons: New York, 2011.(33) Lee, S.; Molnar, A. Macromolecules 1995, 28 (18), 6354−6356.(34) Aust, N. J. Biochem. Biophys. Methods 2003, 56, 323−334.(35) Otte, T.; Pasch, H.; Macko, T.; Brull, R.; Stadler, F. J.; Kaschta,J.; Becker, F.; Buback, M. J. Chromatogr., A 2011, 1218 (27), 4257−4267.(36) Slagowski, E. L.; Fetters, L. J.; McIntyre, D. Macromolecules1974, 7 (3), 394−396.(37) Zammit, M. D.; Davis, T. P.; Suddaby, K. G. Polymer 1998, 39(23), 5789−5798.(38) Stadler, F. J.; Kaschta, J.; Munstedt, H.; Becker, F.; Buback, M.Rheol. Acta 2009, 48, 479−490.(39) Cave, R. A.; Seabrook, S. A.; Gidley, M. J.; Gilbert, R. G.Biomacromolecules 2009, 10 (8), 2245−2253.(40) Gerle, M.; Fischer, K.; Roos, S.; Muller, A. H. E.; Schmidt, M.Macromolecules 1999, 32, 2629−2637.(41) Mes, E. P. C.; de Jonge, H.; Klein, T.; Welz, R. R.; Gillespie, D.T. J. Chromatogr., A 2007, 1154 (1−2), 319−330.(42) Percec, V.; Ahn, C. H.; Cho, W. D.; Jamieson, A. M.; Kim, J.;Leman, T.; Schmidt, M.; Gerle, M.; Moller, M.; Prokhorova, S. A.;
Macromolecules Article
dx.doi.org/10.1021/ma3007812 | Macromolecules 2012, 45, 5247−52595258
Sheiko, S. S.; Cheng, S. Z. D.; Zhang, A.; Ungar, G.; Yeardley, D. J. P. J.Am. Chem. Soc. 1998, 120, 8619−8631.(43) Johann, C.; Kilz, P. J. J. Appl. Polym. Sci.: Appl. Polym. Symp.1991, 48, 111−122.(44) Wintermantel, M.; Antonietti, M.; Schmidt, M. J. Appl. Polym.Sci.: Appl. Polym. Symp. 1993, 52, 91−103.(45) Schimpf, M. E.; Caldwell, K.; Giddings, J. C. Field FlowFractionation Handbook; John Wiley & Sons: New York, 2000.(46) Colfen, H.; Antonietti, M. Adv. Polym. Sci. 2000, 150, 67−187.(47) Janca, J. Field-flow fractionation. In Heftmann, E., Ed.; Journal ofChromatography Library; Elsevier: Amsterdam, 1992; pp A449−A479.(48) White, R. J. Polym. Int. 1997, 43 (4), 373−379.(49) Liu, Y.; Radke, W.; Pasch, H. Macromolecules 2006, 39 (5),2004−2006.(50) Moon, M. H. J. Sep. Sci. 2010, 33 (22), 3519−3529.(51) Scherer, C.; Noskov, S.; Utech, S.; Bantz, C.; Mueller, W.;Krohne, K.; Maskos, M. J. Nanosci. Nanotechnol. 2010, 10, 6834.(52) Adolphi, U.; Kulicke, W.-M. Polymer 1997, 38 (7), 1513−1519.(53) Arfvidsson, C.; Wahlund, K.-G. J. Chromatogr., A 2003, 1011(1−2), 99−109.(54) Dubascoux, S.; Von Der Kammer, F.; Le Hecho, I.; Gautier, M.P.; Lespes, G. J. Chromatogr., A 2008, 1206 (2), 160−165.(55) Lee, H.; Cho, I.-H.; Moon, M. H. J. Chromatogr., A 2006, 1131(1−2), 185−191.(56) Ratanathanawongs Williams, S. K.; Lee, D. J. Sep. Sci. 2006, 29(12), 1720−1732.(57) Otte, T.; Brull, R.; Macko, T.; Pasch, H.; Klein, T. J.Chromatogr., A 2010, 1217 (5), 722−730.(58) Lee, D.; Williams, S. K. R. J. Chromatogr., A 2010, 1217 (10),1667−1673.(59) Lohmann, C. A.; Haseltine, W. G.; Engle, J. R.; Williams, S. K.R. Anal. Chim. Acta 2009, 654 (1), 92−96.(60) Shiundu, P. M.; Remsen, E. E.; Giddings, J. C. J. Appl. Polym. Sci.1996, 60 (10), 1695−1707.(61) Williams, S. K. R.; Runyon, J. R.; Ashames, A. A. Anal. Chem.2010, 83 (3), 634−642.(62) Stojanov, C.; Shirazi, Z.; Audu, T. Chromatographia 1978, 11(5), 274−281.(63) Parth, M.; Aust, N.; Lederer, K. Macromol. Symp. 2002, 181 (1),447−456.(64) Kim, C.; Morel, M.-H.; Beuve, J. S.; Guilbert, S.; Collet, A.;Bonfils, F. J. Chromatogr., A 2008, 1213 (2), 181−188.(65) Kim, C.; Beuve, J. S.; Guilbert, S.; Bonfils, F. Eur. Polym. J. 2009,45, 2249−2259.(66) Lee, S.; Eum, C. H.; Plepys, A. R. Bull. Korean Chem. Soc. 2000,21 (1), 69−74.(67) Lewandowski, L.; Sibbald, M. S.; Johnson, E.; Mallamaci, M. P.Rubber Chem. Technol. 2000, 73 (4), 731−742.(68) Sibbald, M.; Lewandowski, L.; Mallamaci, M.; Johnson, E.Macromol. Symp. 2000, 155 (1), 213−228.(69) Kim, W.-S.; Eum, C. H.; Molnar, A.; Yu, J.-S.; Lee, S. Analyst2006, 131 (3), 429−433.(70) Ratanathanawongs Williams, S. K.; Benincasa, M.-A.; Ashames,A. A. Encyclopedia of Analytical Chemistry; John Wiley & Sons, Ltd.:New York, 2009; pp 1−32.(71) Bang, D. Y.; Shin, D. Y.; Lee, S.; Moon, M. H. J. Chromatogr., A2007, 1147 (2), 200−205.(72) Eslahian, K. A.; Maskos, M. Colloids Surf., A 2012, http://dx.doi.org/10.1016/j.colsurfa.2012.02.003.(73) Awan, M. A.; Dimonie, V. L.; Ou-Yang, D.; El-Aasser, M. S.Langmuir 1997, 13 (2), 140−146.(74) Mes, E. P. C.; Tijssen, R.; Kok, W. T. J. Chromatogr., A 2001,907 (1−2), 201−209.(75) Shiundu, P. M.; Munguti, S. M.; Williams, S. K. R. J.Chromatogr., A 2003, 983 (1−2), 163−176.(76) Shiundu, P. M.; Williams, S. K. R. Thermal Field-FlowFractionation for Particle Analysis: Opportunities and Challenges.Particle Sizing and Characterization; American Chemical Society:Washington, DC, 2004; pp 185−198.
(77) van Asten, A. C.; Venema, E.; Kok, W. T.; Poppe, H. J.Chromatogr., A 1993, 644 (1), 83−94.(78) Kwag, G.; Kim, P.; Han, S.; Choi, H. Polymer 2005, 46, 3782−3788.(79) Nasirov, F. A. Iran. Polym. J. 2003, 12 (4), 281−289.(80) Pires, N. M. T.; Ferreira, A. A.; de Lira, C. H.; Coutinho, P. L.A.; Nicolini, L. F.; Soares, B. G.; Coutinho, F. M. B. J. Appl. Polym. Sci.2006, 99, 88−99.(81) Mori, S.; Ishikawa, M. J. Liq. Chromatogr. Relat. Technol. 1998,21 (8), 1107−1117.(82) Angelo, R. J.; Ikeda, R. M.; Wallach, M. L. Polymer 1965, 6 (3),141−156.(83) Giddings, J. C. Science 1993, 260 (5113), 1456−1465.(84) Otte, T.; Klein, T.; Brull, R.; Macko, T.; Pasch, H. J.Chromatogr., A 2011, 1218 (27), 4240−4248.(85) Frater, D. J.; Mays, J. W.; Jackson, C. J. Polym. Sci., Part B:Polym. Phys. 1997, 35, 141−151.(86) van Bruijnsvoort, M.; Wahlund, K. G.; Nilsson, G.; Kok, W. T. J.Chromatogr., A 2001, 925 (1−2), 171−182.(87) Podzimek, S.; Vlcek, T. J. Appl. Polym. Sci. 2001, 82 (2), 454−460.(88) Hirabayashi, J.; Ito, N.; Noguchi, K.; Kasai, K. Biochemistry1990, 29 (41), 9515−9521.(89) Bell, W.; Pethrick, R. A. Polymer 1982, 23 (3), 369−373.(90) Chung, S. E.; Chung, I. J. Polym. Bull. 1989, 21 (1), 105−112.(91) Farzaneh, S.; Hossein, F. J. Chem. Phys. 2011, 133 (23), 234−904.(92) Zero, K. M.; Pecora, R. Macromolecules 1982, 15 (1), 87−93.
Macromolecules Article
dx.doi.org/10.1021/ma3007812 | Macromolecules 2012, 45, 5247−52595259