Hare And Tortoise 2013
39
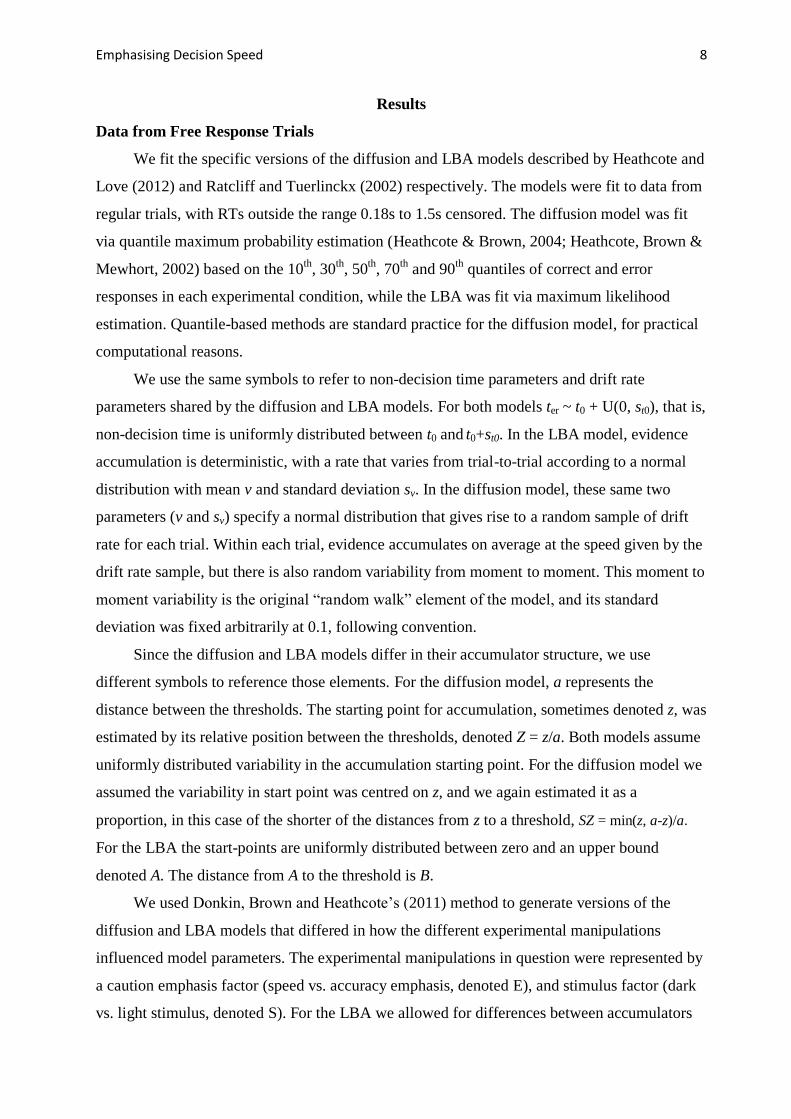
Emphasising Decision Speed 1 The Hare and the Tortoise: Emphasizing speed can change the evidence used to make decisions. Babette Rae 1 , Andrew Heathcote 1 , Chris Donkin 2 , Lee Averell 1 and Scott Brown 1 1 School of Psychology, University of Newcastle, Australia 2 School of Psychology, University of New South Wales, Australia Address correspondence to: Babette Rae School of Psychology University of Newcastle Callaghan NSW 2308 Australia Ph: (+61) 2 4921 6959 Email: [email protected]
-
Upload
newcastle-au -
Category
Documents
-
view
2 -
download
0
Transcript of Hare And Tortoise 2013

Emphasising Decision Speed 1
The Hare and the Tortoise: Emphasizing speed can change
the evidence used to make decisions.
Babette Rae1, Andrew Heathcote
1, Chris Donkin
2, Lee Averell
1 and Scott Brown
1
1 School of Psychology, University of Newcastle, Australia
2 School of Psychology, University of New South Wales, Australia
Address correspondence to:
Babette Rae
School of Psychology
University of Newcastle
Callaghan NSW 2308
Australia
Ph: (+61) 2 4921 6959
Email: [email protected]

Emphasising Decision Speed 2
Abstract
Decision-makers effortlessly balance the need for urgency against the need for caution.
Theoretical and neurophysiological accounts have explained this tradeoff solely in terms of the
quantity of evidence required to trigger a decision (the “threshold”). This explanation has also
been used as a benchmark test for evaluating new models of decision-making, but the
explanation itself has not been carefully tested against data. We rigorously test the assumption
that emphasizing decision speed vs. decision accuracy selectively influences only decision
thresholds. In data from a new brightness discrimination experiment we found that emphasising
decision speed over decision accuracy not only decreases the amount of evidence required for a
decision, but also decreases the quality of information being accumulated during the decision
process. This result was consistent for two leading decision-making models, and in a model-
free test. We also found the same model-based results in archival data from a lexical decision
task (reported by Wagenmakers et al. 2008) and new data from a recognition memory task. We
discuss implications for theoretical development, and applications.
Key words: Evidence accumulation, speed accuracy tradeoff, response time, decision-making,
sequential sampling

Emphasising Decision Speed 3
Quantitative theories of decision-making have provided insights not only into the
cognitive processes that underpin choice, but also into the associated neurophysiology and
dozens of different topics in applied and clinical settings (e.g., Churchland, Kiani & Shadlen,
2008; Forstmann et al., 2008; Gold & Shadlen, 2007; Ratcliff & McKoon, 1995; Ratcliff &
Smith, 2004; Roitman & Shadlen, 2002; Rouder, 2000; Shurman, Horan & Neuchterlein,
2005). There are several successful theories of simple decision-making that differ in detail but
share a common framework, called “sequential sampling” – the idea that information from the
environment is steadily accumulated until sufficient evidence has been gathered to make a
decision. Even though the models differ in detail, they often agree on substantive questions of
interpretation (Donkin, Brown, Heathcote & Wagenmakers, 2011).
Ratcliff’s (1978) diffusion model (see also Ratcliff & Smith, 2004) is the most influential
and widely-applied sequential sampling model. It describes stimulus processing as the noisy
accumulation of evidence over time, and it applies to tasks in which a participant decides
quickly between two alternatives, such as whether a stimulus is brighter or darker than average.
The diffusion process accumulates evidence about the stimulus by drifting between two
thresholds - representing the two alternatives - with a response initiated when the accumulated
evidence reaches either threshold. The three key components of the diffusion model are (1) the
speed of information processing, quantified by drift rate, v; (2) the response threshold,
quantified by the separation between the boundaries, a; and (3) the time taken for things other
than the actual decision-making, such as stimulus encoding and response execution, quantified
by the non-decision parameter, ter.
The linear ballistic accumulator (LBA: Brown & Heathcote, 2008) is a sequential
sampling model of the “accumulator” class, with each choice alternative represented by a
separate evidence accumulator. Analogous to Ratcliff’s diffusion model, the LBA assumes that
evidence gathers in each accumulator according to a drift rate parameter, and that a response is
initiated as soon as the first accumulator reaches a threshold. In both models responses can be
slowed in several different ways: by a threshold increase, by a decrease in the quality of
information, and hence the rate of accumulation, or when non-decision time increases.
Part of the success of sequential-sampling models arises from their ability to separate
the influences of different latent (not directly observed) cognitive processes that are conflated
in observed data. There ability has theoretical and practical implications. For example, older
adults typically make slower decisions than younger adults; analysis with sequential sampling
models has shown that this slowdown is often due to increased caution rather than poorer
quality information (a change in threshold, not drift rate: Ratcliff, Thapar & McKoon, 2007,

Emphasising Decision Speed 4
2010, 2011; Forstmann et al., 2011). This result exemplifies “selective influence”, the idea that
changes in a particular cognitive process (e.g., older adults are more cautious) are captured in
the model by changes in just one model parameter (the threshold). Other examples of applied
implications include workload capacity (Eidels, Donkin, Brown & Heathcote, 2010), alcohol
use (van Ravenzwaaij, Dutilh &Wagenmakers, 2012), sleep deprivation (Ratcliff & Van
Dongen, 2011), and consumer choice (Hawkins, Marley, Heathcote, Flynn, Louviere & Brown,
in press).
Selective influence is not just a useful property for data analysis, it has also been used
as a test of the models themselves. For example, Ratcliff and Rouder (1998) found that a
manipulation of stimulus difficulty selectively influenced drift rates while a caution
manipulation selectively influenced thresholds, and they interpreted this as evidence in favour
of their model. There have been numerous other reports of selective influence. Ho, Brown and
Serences (2009) found that changes in the response modality were captured by their model’s
non-decision time parameter. Voss, Rothermund and Voss (2004) reported a sequence of
experiments that confirmed selective influence of several different experimental manipulations
on key components of the diffusion model.
Following Ratcliff and Rouder’s (1998) precedent, Usher and McClelland (2001) and
Brown and Heathcote (2005, 2008) took pains to establish that their new theories of decision-
making provided the same account of selective influence as the diffusion model. Thus, one
initial benchmark test used to judge new models was the demonstration that caution
manipulations selectively influenced threshold parameters. The usefulness of this test was
supported by dozens of different applied studies that reported successful fits to data from
experimental manipulations of decision caution through selective changes in only the models’
threshold parameters (e.g., Forstmann et al., 2011; Hawkins, Brown, Steyvers &
Wagenamakers, 2012; Ratcliff & Rouder, 1998; Ratcliff, Thapar & McKoon, 2007; Starns &
Ratcliff, 2010; Usher & McClelland, 2001; Wagenmakers, Ratcliff, Gomez & McKoon, 2008).
However, in amongst the many studies that report selective influence of caution
manipulations on decision thresholds, there have been hints that something more complex
might be afoot. Vandekerckhove, Tuerlinckx and Lee (2008) replicated Ratcliff and Rouder’s
(1998) analyses in a Bayesian framework and reached quite a different conclusion, that the
manipulation of caution was best described in the diffusion model by changes in both threshold
and drift rate. Heathcote and Love (2012) identified a similar result in their LBA analysis of
lexical decision data collected by Wagenmakers et al. (2008). Starns, Ratcliff and McKoon

Emphasising Decision Speed 5
(2012, pp. 14-15) found similar evidence in favour of the idea that drift rates are improved
under accuracy emphasis.
Our aim here was to carefully test the selective influence assumption about caution in a
variety of experimental paradigms. This test is important for both theoretical and practical
reasons. From a theoretical viewpoint, the assumption of selective influence has become a
yardstick with which to judge new theories. If the assumption is unwarranted, then we may
have been misguided before. From a practical viewpoint, evidence accumulation models are
used frequently to understand decision-making in domains from consumer choice to short-term
memory, from the effects of alcohol to sleep deprivation and depression. If the assumption of
selective influence has been wrongly applied, it is possible that we have been misled in some of
these analyses.
Previous support for the assumption that response caution selectively influences decision
threshold has been drawn from studies in which data were analysed under an a priori
assumption of selective influence. Support for the assumption was then inferred from the
ability of the model to adequately fit the data. This approach ignores the question of whether a
different model – one that does not assume selective influence – might provide much better
agreement with the data. We report an experiment that manipulates caution via instructions that
either emphasize the speed or accuracy of responding. This experiment provides the basis for a
set of converging model-based tests, and a model-free test. Our model-based analyses begin by
identifying relatively unconstrained versions of the diffusion and LBA models that provide an
accurate account of the major trends in the distribution of response times (RT) for correct and
incorrect choices. One model-based test compares drift rate parameter estimates to determine
whether they differ significantly between speed and accuracy emphasis conditions.
Further, four model-based tests compared the least constrained models to models that
impose the selective influence assumption by constraining the different emphasis conditions to
share the same drift rate estimates (“constrained models”). Because they are less flexible, the
constrained models necessarily have greater misfit than the least constrained models. We
examine the constrained model graphically to see if they miss any major trends in our data, and
use the 2 distributed deviance measure to test whether the increase in misfit is statistically
reliable. We also compared constrained and unconstrained models using BIC and AIC
(Bayesian and Akaike Information Criteria: Myung & Pitt, 1997). These measures balance
goodness-of-fit against complexity, quantified by the number of free parameters. Due to the
way it quantifies complexity, and for data sets of the size we consider, BIC tends to select

Emphasising Decision Speed 6
simpler models with fewer parameters than does AIC. Even so, the results of BIC and AIC
mostly agree in the analyses below. When they do not agree, the interested reader should refer
to Wagenmakers and Farrell (2004, p.194-195) for a comparison (see also Burnham &
Anderson, 2002 and Kass & Raftery, 1995).
Our model-free test was based on response deadline trials, in which a signal prompted
participants to make immediate choices. Meyer, Irwin, Osman and Kounios (1988) used
response deadlines to examine the accumulation of evidence before a regular (i.e., participant-
initiated) decision would have been made. Response deadline procedures have a long history in
the study of decision-making models (McElree & Dosher, 1989; Wickelgren, 1977). Meyer et
al.’s procedure randomly intermixes deadline trials with regular decision-making trials. We
used their paradigm to look for differences in evidence accumulation speed between different
caution conditions.
If caution affects only the threshold (the selective influence assumption), processing
should be identical in the speed-emphasis and accuracy-emphasis conditions prior to a decision
threshold being reached. Hence the accuracy of deadline responses made before the threshold
is crossed should be unaffected by caution. Alternatively, if caution affects the information
extracted from the stimulus (i.e., drift rate), cognitive processing will differ from stimulus
onset, and the accuracy of deadline responses will differ with caution. Although deadline
accuracy has the potential to provide model-free evidence, in practice that evidence can be
confounded by decision processes that reach threshold before the response signal (Ratcliff,
1988, 2006). To address this problem we also performed a model-based analysis on the
deadline data.
Method
Participants
Forty-nine participants were recruited from a first year psychology pool and from the
general university population. Participants were reimbursed at a rate of $15 per hour or given
course credit. Data from 15 participants were rejected because more than 10% of their
responses were faster than 0.18s or slower than 1.5s. Although rejecting 15 participants from
49 is a higher exclusion rate than for other cognitive experiments, the random-deadline task we
used is very demanding on participants. For example, when developing this task, Meyer et al.
(1988) found it necessary to train their participants for six hours before data collection.

Emphasising Decision Speed 7
Stimuli
Stimuli were 64 x 64 pixel (2.5cm x 2.5cm) patches, similar to those used by Ratcliff and
Rouder (1998). Each pixel was either black or white. There were two categories of stimuli:
pixels in light squares had a 53% probability of being white, and pixels in a dark square had a
47% chance of being white. Presentation of stimuli on a computer screen was made dynamic
by repeatedly cycling through four squares, chosen at random from a pre-generated set of 50
squares from each category. Cycling occurred at a rate of 0.015s per square, and continued
until a response was made.
Procedure
On each trial, participants had to choose whether the stimulus was predominately light or
dark, by pressing D or L on the keyboard, respectively. A randomly selected 20% of trials
included a response signal; the appearance of red asterisks above and below the stimulus
signalled the need to respond immediately. Asterisks on the response signal trials appeared at
lags of 0.04s, 0.12s, 0.2s, 0.25s, 0.3s or 0.4s after the presentation of the stimulus. Participants
were instructed to respond within 0.3s of the presentation of the asterisks. On the remaining
80% of trials, participants had up to 5s to respond.
The caution manipulation occurred in alternating blocks of trials, beginning with
accuracy emphasis in the first block. At the beginning of accuracy-emphasis blocks
“RESPOND ACCURATELY” appeared on the screen until participants pressed the space bar.
In speed-emphasis blocks, “RESPOND QUICKLY” appeared in the same manner. In the
accuracy-emphasis condition, feedback was given for correct or incorrect responses:
“CORRECT” (in green font) or “INCORRECT” (in red font), respectively. In the speed-
emphasis condition, in addition to the accuracy feedback, feedback was also given on response
time. In regular decision trials, if response time was slower than 0.5s, “TOO SLOW” appeared
on the screen. In response deadline trials, if the response time was more than 0.3s after the
appearance of the asterisks, the feedback “BAD TIME” was given, while if the response was
within 0.3s the feedback “GOOD TIME” was given.
To improve compliance with the difficult procedure, we used a part-task training method.
Participants began by practicing regular trials for approximately 30 minutes. Response deadline
trials were then introduced in a 15 minute practice period, where only the three slowest lags
were used. The main test phase followed, with 20 participants completing one one-hour session
and the remaining 29 participants completing two-one hour sessions within a three-day period.
There were 14 blocks of 104 trials in each one-hour session.
Emphasising Decision Speed 8
Results
Data from Free Response Trials
We fit the specific versions of the diffusion and LBA models described by Heathcote and
Love (2012) and Ratcliff and Tuerlinckx (2002) respectively. The models were fit to data from
regular trials, with RTs outside the range 0.18s to 1.5s censored. The diffusion model was fit
via quantile maximum probability estimation (Heathcote & Brown, 2004; Heathcote, Brown &
Mewhort, 2002) based on the 10th
, 30th
, 50th
, 70th
and 90th
quantiles of correct and error
responses in each experimental condition, while the LBA was fit via maximum likelihood
estimation. Quantile-based methods are standard practice for the diffusion model, for practical
computational reasons.
We use the same symbols to refer to non-decision time parameters and drift rate
parameters shared by the diffusion and LBA models. For both models ter ~ t0 + U(0, st0), that is,
non-decision time is uniformly distributed between t0 and t0+st0. In the LBA model, evidence
accumulation is deterministic, with a rate that varies from trial-to-trial according to a normal
distribution with mean v and standard deviation sv. In the diffusion model, these same two
parameters (v and sv) specify a normal distribution that gives rise to a random sample of drift
rate for each trial. Within each trial, evidence accumulates on average at the speed given by the
drift rate sample, but there is also random variability from moment to moment. This moment to
moment variability is the original “random walk” element of the model, and its standard
deviation was fixed arbitrarily at 0.1, following convention.
Since the diffusion and LBA models differ in their accumulator structure, we use
different symbols to reference those elements. For the diffusion model, a represents the
distance between the thresholds. The starting point for accumulation, sometimes denoted z, was
estimated by its relative position between the thresholds, denoted Z = z/a. Both models assume
uniformly distributed variability in the accumulation starting point. For the diffusion model we
assumed the variability in start point was centred on z, and we again estimated it as a
proportion, in this case of the shorter of the distances from z to a threshold, SZ = min(z, a-z)/a.
For the LBA the start-points are uniformly distributed between zero and an upper bound
denoted A. The distance from A to the threshold is B.
We used Donkin, Brown and Heathcote’s (2011) method to generate versions of the
diffusion and LBA models that differed in how the different experimental manipulations
influenced model parameters. The experimental manipulations in question were represented by
a caution emphasis factor (speed vs. accuracy emphasis, denoted E), and stimulus factor (dark
vs. light stimulus, denoted S). For the LBA we allowed for differences between accumulators

Emphasising Decision Speed 9
corresponding to dark vs. light responses in the A and B parameters. This response factor
(denoted R) allows the LBA to capture effects such as response bias (e.g., a bias to respond
light by having a lower threshold, B, for the light accumulator). Effects of the response factor
on A and B LBA parameters are analogous, respectively, to the Z and SZ factors in the
diffusion model. In the LBA we also allowed for differences in drift rate parameters due to the
match between a stimulus and an accumulator. For example, the mean drift rate for a bright
stimulus will be higher for the bright (i.e., matching) accumulator than the dark (i.e.,
mismatching) accumulator. Changing parameter values across the match factor (denoted M)
allows the LBA to capture the effect of the stimulus on accuracy depending on the difference
between the “matching” drift rate and the “mismatching” drift rate. In the diffusion model there
is no corresponding factor, as the diffusion drift rate is analogous to the difference between
matching and mismatching LBA drift rates.
Tables 1 and 2 denote different diffusion and LBA model versions by indicating the
factors that affect each parameter, with an entry of “-” indicating a common value was
estimated for all conditions. Where a parameter might be influenced by more than one factor
we fit all possible orders of interactions among the factors as well as main effects. The least
constrained (most complex) models that we fit are shown in the top row of each table. We
made the conventional assumption that sv=1 for the LBA. For both models we instantiated the
notion of selective influence in the most lenient sense possible: the assumption of selective
influence was operationalized as the assumption that drift rate parameters – and only drift rate
parameters - were not influenced by the response caution factor (E). For both models we also
estimated a contamination probability parameter, p, for the proportion of trials on which
participants made an unbiased guess with an RT that was uniformly distributed over the range
from the fastest RT that was not censored (0.18s) to the longest RT that was not censored
(1.5s)1. Estimates of p were allowed to differ between speed and accuracy emphasis conditions.
For the diffusion model, we fit all models from the most complex to the least complex
(where all parameters were equal across all conditions), resulting in 1023 models to be
analysed for each participant’s data. For the LBA model, there were 255 models per
1Ratcliff and Tuerlinckx (2002) modelled contamination in a similar manner, but assumed that the accuracy of
contaminated trials equalled that of non-contaminated trials. We assume chance accuracy because this seemed
more consistent with the idea that contaminated responses produced by a different process than uncontaminated
responses. We found a low and equal overall level of contamination with the most flexible versions of both
diffusion and LBA models that we fit (1.8%). However, some participants had appreciably higher levels; in
particular both models estimated 13% contamination on average for one participant. Higher contamination likely
reflects the difficult nature of the task and some carry-over effects from deadline to regular trials.

Emphasising Decision Speed 10
participant, because we did not consider variants in which the M factor was dropped (without
this, the model is forced to predict chance accuracy). Model variants were fit starting from the
simplest, with the best fits of simpler models providing starting points for fits of more complex
models.
Table 1.
Diffusion model results. D (Deviance), AIC and BIC were calculated by summing deviance and the number of
model parameters (k) for fits to individual participants and the number of data points per participant over
participants. Values for these statistics in the table have the deviance for the least constrained model subtracted,
and cannot be compared between Tables 1 and 2 because of differences in calculation (see text). The AIC and BIC
selected models have minimum AIC and BIC values within the full set of models (rows 2 and 3), or within the set
of model where caution does not influence drift rate parameters (rows 5 and 6). Table entries of E and S describe
which factors influenced each parameter, and dashes (“-“) signify parameters that were constant across all
factors.
Variant a v sv Z SZ t0 st0 p k D AIC BIC
Least Constrained E E, S E, S E E E E E 20 0 1360 5030
AIC Selected E E, S S - E E E - 16 102 1190 4126
BIC Selected E E, S - - - E - - 13 545 1430 3815
Selective Caution Effect E S S E E E E E 16 500 1588 4524
AIC Selected E S S E - E E E 15 512 1532 4285
BIC Selected E S - E - E - - 12 963 1780 3981
a – the distance between the thresholds
v – mean drift rate
sv – standard deviation of drift rate
Z – the starting point for accumulation that was estimated by its relative position between the thresholds
SZ –an estimated proportion of the shorter of the distances from z (the centre of the start point variability) to
threshold.
t0 – the lower bound of the uniformly distributed non-decision time
st0 – the width of the uniformly distributed non-decision time
p – a contamination probability parameter, for the proportion of trials on which participants made an unbiased
guess with an RT that was uniformly distributed over the non-censoring range
E – speed vs. accuracy emphasis
S – dark vs. light stimulus manipulation

Emphasising Decision Speed 11
Table 2.
LBA model results. D (Deviance), AIC and BIC were calculated by summing deviance and the number of model
parameters (k) for fits to individual participants and the number of data points per participant over participants.
Values for these statistics in the table have the deviance for the least constrained model subtracted and cannot be
compared between Tables 1 and 2 because of differences in calculation (see text). The AIC and BIC selected
models have minimum AIC and BIC values within the full set of models (rows 2 and 3), or within the set of model
where caution does not influence drift rate parameters (rows 5 and 6). Table entries of E,S,R,M describe which
factors influenced each parameter, and dashes (“-“) signify parameters that were constant across all factors.
Variant B A v t0 p k D AIC BIC
Least Constrained E, R E, R E, S, M E E 21 0 1428 7835
AIC Selected R E, R E, S, M E E 19 82 1374 7170
BIC Selected R R E, M E - 12 1193 2009 5670
Selective Caution Effect E, R E, R S, M E E 17 848 2004 7190
AIC Selected E, R E, R S, M E E 17 848 2004 7190
BIC Selected E E, R M - E 12 1646 2462 6122
B – the distance from the upper bound of the start-point distribution (which begins at zero) to the threshold
A – the upper bound of the start-point distribution (which begins at zero)
v – mean drift rate
t0 – the lower bound of the uniformly distributed non-decision time
st0 – the width of the uniformly distributed non-decision time
p – a contamination probability parameter, for the proportion of trials on which participants made an unbiased
guess with an RT that was uniformly distributed over the non-censoring range
E – the parameter changes with speed vs. accuracy emphasis
R – the parameter changes between the dark and light response accumulators
S – the parameter changes between dark vs. light stimuli
M – the parameter takes on one value for accumulators whose response matches the stimulus and a different value
for accumulators whose response fails to match the stimulus
Tables 1 and 2 show the results of the model fitting for the diffusion and LBA models,
respectively. For example, the second entry on the top row of Table 1 reads “E,S”, which
means that the drift rate parameter (see column heading, “v”) was influenced by factors E and
S, in this particular model variant (the least constrained model – see row label). The least
constrained variants of the models (top rows in Tables 1 and 2) naturally fit the data best, but
these models did not provide the best descriptions of the data because of their complexity, as
shown by their higher BIC and AIC values. We divided the model variants into those that
respected the selective influence assumption (i.e., no effect of speed vs. accuracy emphasis on
drift rate parameters) and those that did not. Both BIC and AIC indicated that the best models
for these data were models that did not respect the selective influence assumption. That is, the
models with the best (smallest) AIC and BIC values in Tables 1 and 2 all include an effect of
speed vs. accuracy emphasis (factor E) on the drift rate parameter (v). This effect was quite
pronounced. The best of the models that respected the selective influence assumption, shown in

Emphasising Decision Speed 12
the lower halves of Tables 1 and 2, always had much poorer BIC and AIC values, with
differences of more than 166 in all cases.
Tables 1 and 2 do not allow direct comparison of the goodness-of-fit of the diffusion vs.
LBA models. This is because the deviance, AIC and BIC values are based on maximum
likelihood values for the LBA model, but quantile-based pseudo-likelihoods for the diffusion
model (see Speckman & Rouder, 2004, for a discussion). To provide some comparison, we
calculated, for each participant, likelihood-ratio G2 measures of misfit based on the observed
(O) and predicted (E) frequencies of responses between the quantiles: ∑ ( ⁄ ) .
Consistent with the slightly better fit for the LBA than diffusion evident in Figures 1 and 2,
misfit summed over participants for the LBA (G2 = 5469) was less than for diffusion (G
2 =
6238). Similar results were obtained for Pearson’s χ2
Figures 1 and 2 illustrate the differences between the models in accounting for the data,
for the diffusion and LBA models, respectively. All variants of both models adequately account
for RT distributions (center and right column in each figure), but imposing the selective
influence assumption causes a clear mis-fit for decision accuracy (left column). Even though
the fit to the RT distributions is generally quite good, there is a tendency for both models to
predict a greater degree of skew than observed in RT for incorrect responses, although for the
LBA this is only the case under accuracy emphasis.

Emphasising Decision Speed 13
Figure 1: Diffusion model fits. Decision accuracy (left column) and RT distributions for correct (middle column)
and error responses (right column). For RT distributions, the lines from bottom to top correspond to 10th, 50
th and
90th percentiles. In all panels, the data are shown by solid lines and symbols and diffusion model fits by open
symbols and dotted lines. Data points are accompanied by 95% within-subject confidence intervals (Morey, 2008).
The top row shows fits of the “Least Constrained” model specified in Table 1. The bottom row shows fits of the
“Selective Caution Effect” model specified in Table 1.
We confirmed that imposing the selective influence assumption caused a statistically
reliable decrease in goodness of fit by applying a 2 test to the difference in fit between the two
nested models. This test indicated that the increase in misfit was highly significant for both the
diffusion model, 2(136) = 500, p <.001, and the LBA model,
2(136) = 848, p <.001. Note
that for the diffusion model this test is approximate because of the quantile estimation method
(see Speckman & Rouder, 2004), but it nevertheless provides converging evidence with the
AIC and BIC model selection methods.

Emphasising Decision Speed 14
Figure 2: LBA model fits. Decision accuracy (left column) and RT distributions for correct (middle column) and
error responses (right column). For RT distributions, the lines from bottom to top correspond to 10th, 50
th and 90
th
percentiles. In all panels, the data are shown by solid lines and symbols and LBA model fits by open symbols and
dotted lines. Data points are accompanied by 95% with-subject confidence intervals (Morey, 2008). The top row
shows fits of the “Least Constrained” model specified in Table 1. The bottom row shows fits of the “Selective
Caution Effect” model specified in Table 2.
The bottom rows of Figures 1 and 2 show the fits of the least constrained models that
assume a selective influence of caution (i.e., the “Selective Caution Effect” models in Tables 1
and 2). Imposing the selective influence assumption on the effect of caution has little effect on
the quality of fits to RT distribution. However, the selective influence assumption causes both
models to clearly underestimate the difference in accuracy between speed emphasis and
accuracy emphasis conditions, particularly for the LBA.
Another way to investigate the selective influence assumption is to compare drift rate
parameters estimated from the speed-emphasis and accuracy-emphasis conditions, which are
shown in Table 3, for the least constrained model fits. For the LBA, mean drift rates (v) were
higher when there was a match between the stimulus and response than when there was a
mismatch, F(1,33) = 91, p<.001. Contrary to the assumption of selective influence, this
difference was larger under accuracy emphasis than speed emphasis (interaction F(1,33) =
29.7, p <.001). The same was true for the diffusion model, with higher mean drift rates under
accuracy emphasis than speed emphasis, F(1,33) = 17.4, p <.001. This interacted with stimulus
Emphasising Decision Speed 15
type, F(1,33) = 11.2, p <.005, due to a larger emphasis effect for dark than light stimuli. The
diffusion rate variability parameter (sv) was fairly constant across conditions with no effects
approaching significance (ps > .4).
Table 3.
Drift rate parameter estimates from the least constrained diffusion and LBA models.
Speed Emphasis Accuracy Emphasis
Model Parameter Dark Light Dark Light
Diffusion v 0.132 0.188 0.217 0.212
Diffusion sv 0.093 0.078 0.093 0.061
LBA v (match) 3.29 3.56 3.65 3.84
LBA v (mismatch) 2.18 2.07 1.46 1.46
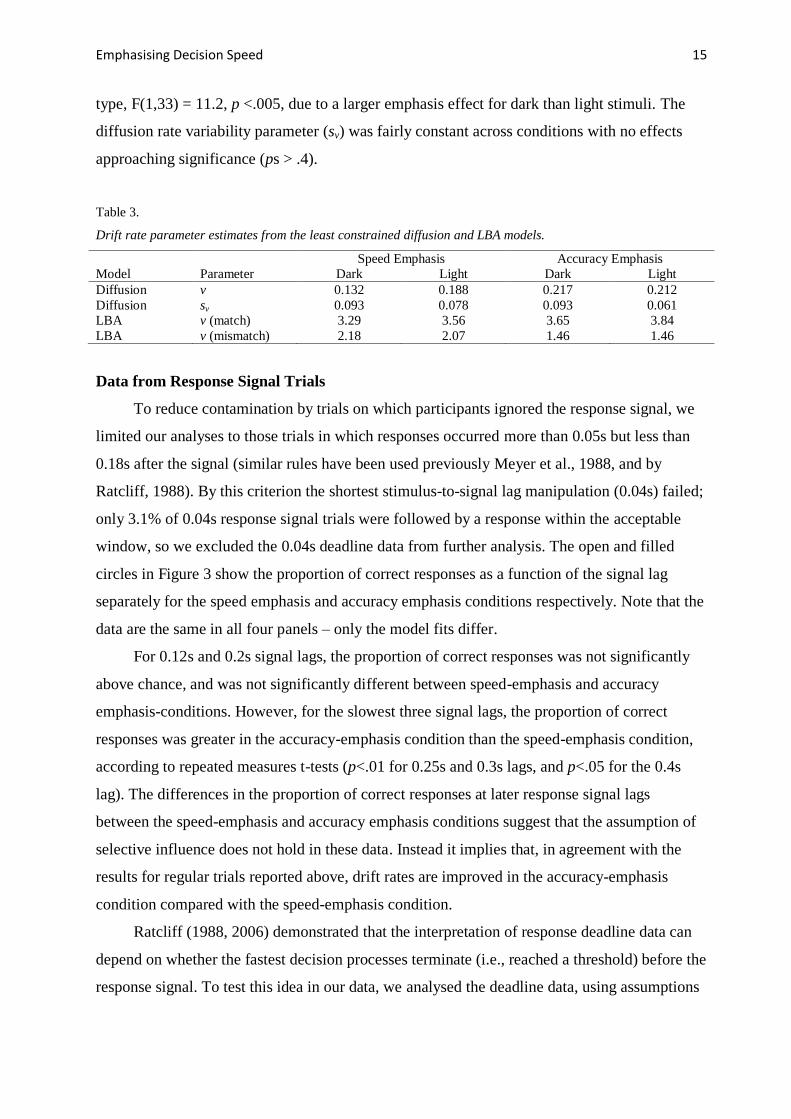
Data from Response Signal Trials
To reduce contamination by trials on which participants ignored the response signal, we
limited our analyses to those trials in which responses occurred more than 0.05s but less than
0.18s after the signal (similar rules have been used previously Meyer et al., 1988, and by
Ratcliff, 1988). By this criterion the shortest stimulus-to-signal lag manipulation (0.04s) failed;
only 3.1% of 0.04s response signal trials were followed by a response within the acceptable
window, so we excluded the 0.04s deadline data from further analysis. The open and filled
circles in Figure 3 show the proportion of correct responses as a function of the signal lag
separately for the speed emphasis and accuracy emphasis conditions respectively. Note that the
data are the same in all four panels – only the model fits differ.
For 0.12s and 0.2s signal lags, the proportion of correct responses was not significantly
above chance, and was not significantly different between speed-emphasis and accuracy
emphasis-conditions. However, for the slowest three signal lags, the proportion of correct
responses was greater in the accuracy-emphasis condition than the speed-emphasis condition,
according to repeated measures t-tests (p<.01 for 0.25s and 0.3s lags, and p<.05 for the 0.4s
lag). The differences in the proportion of correct responses at later response signal lags
between the speed-emphasis and accuracy emphasis conditions suggest that the assumption of
selective influence does not hold in these data. Instead it implies that, in agreement with the
results for regular trials reported above, drift rates are improved in the accuracy-emphasis
condition compared with the speed-emphasis condition.
Ratcliff (1988, 2006) demonstrated that the interpretation of response deadline data can
depend on whether the fastest decision processes terminate (i.e., reached a threshold) before the
response signal. To test this idea in our data, we analysed the deadline data, using assumptions

Emphasising Decision Speed 16
similar to Ratcliff’s, using diffusion and LBA model fits from the regular, free response trials.
This provides a strong test of the models, similar to cross-validation methods, by requiring
them to accommodate data from some conditions using parameters estimated from different
conditions (see Busemeyer & Wang, 2000, for a general treatment of this approach as a model-
selection method).
The model fits from the regular, free-response trials allowed the models to predict both
the probability of a decision being reached prior to a response signal and the probability of
those early decisions being correct. Combined with the assumption that responses on the
remaining signal trials were uninformed guesses, with 50% accuracy, this enabled us to
generate model predictions for accuracy on deadline trials. We estimated one new free
parameter for the response signal trials: a perceptual delay reflecting the time taken to notice
the response signal (ter,signal). Estimates of the perceptual delay averaged across participants
were 0.064s and 0.062s for the least constrained selective caution effect diffusion models.
Corresponding LBA estimates were 0.04s and 0.057s respectively.
The solid and dashed lines in Figure 3 show the model predictions. The upper panels
show predictions from the diffusion model, and the lower panel shows predictions from the
LBA model. For each model, the left-hand panels show predictions from the least constrained
model that imposes the selective caution effect assumption, and the right-hand panels show
predictions based on parameters from the best model chosen by BIC from all models fit. All
models fit well for the 0.2s and 0.4s lags. However, despite the BIC selected models using
fewer parameters (see Tables 1 & 2), they provide a much better fit at the 0.25s and 0.3s lags.
Recall that, for both the diffusion and LBA, BIC selected models allowed caution to influence
drift rates, so a greater proportion of responses are correct at these shorter lags under accuracy
emphasis because the higher drift rates have allowed more information to accrue. When
caution is not allowed to influence drift rates accuracy is under-predicted at these shorter lags,
but greater accuracy can be accommodated at the longest lag because enough time has passed
for a sufficient proportion of early-terminating decisions (with greater than chance accuracy) to
occur. As a final check, we repeated the model-based analyses allowing the responses on the
unfinished trials to be “informed” guesses, for which the response issued reflects the current
state of the evidence accumulation process. As also observed by Ratcliff (1988), this made
little difference to the results.

Emphasising Decision Speed 17
Figure 3. Proportion of correct responses as a function of the signal lag for speed emphasis and accuracy emphasis
in data (symbols), and corresponding predictions for the Diffusion and LBA models (lines). Error bars represent
one standard error, calculated on a within-subjects basis, for the comparison between speed- vs. accuracy-
emphasis (Morey, 2008). The x-axis positions of the speed- and accuracy-emphasis data are offset slightly, for
clarity only.
The models predict increasing response accuracy on the signal trials with increasing
signal lag. However, at very long lags (beyond those used in our experiment) the models
actually predict decreasing response accuracy. This occurs because very long signal lags lead
to a situation in which almost all responses are made before the signal. The only trials in which
responses will be observed after the signal (within the acceptable window) are those for which
the particular drift rate samples are very weak, leading to very slow responses with close to
chance level accuracy.

Emphasising Decision Speed 18
The Effect of Emphasizing Decision Speed on Lexical Evidence
The brightness discrimination experiment above showed that emphasising decision speed
changes the evidence derived from perceptual processes, but is this also true when the evidence
is derived from cognitive processes? We investigated this question in linguistic processing by
applying our analyses of regular (free response) trials to lexical decision task data reported by
Wagenmakers, Ratcliff, Gomez and McKoon (2008, their Experiment 1). These analyses also
test the possibility that our results are specific to the particular speed-accuracy tradeoff
instructions we employed, or to situations in which accuracy is relatively low as it was in our
experiment (around 70%). In contrast, Wagenmakers et al. reported accuracy above 90% in
many conditions. They manipulated speed- vs. accuracy-emphasis factorially with a four-level
stimulus-type factor (S), made up of three types of words: very-low frequency (vlf), low
frequency (lf) and high frequency (hf) and nonwords (nw). Heathcote and Love (2012) report
fits of the LBA model to these data and observed a clear failure of selective influence; a model
with drift rate parameters fixed over emphasis conditions could not account the effect of
instructions on accuracy (this model fit is shown in the lower panels of Figure 4). The top
panels in Figure 4 show model fits, also reported by Heathcote and Love, in which drift rate
parameters were allowed to vary with emphasis, resulting in much better fits to data.
Confirming the impression from Figure 4, both BIC and AIC model selection supported an
emphasis effect on variability in drift rates (sv; see Heathcote & Love’s Table 1). Hence, we
conclude that the LBA model supports the conclusion that emphasising decision speed can
influence the evidence derived from linguistic processes.

Emphasising Decision Speed 19
Figure 4. LBA model fits to Wagenmakers et al.’s (2008) data. Response accuracy (left column), and RT
distributions for correct responses (middle column) and error responses (right column). For RT distributions, the
lines from bottom to top correspond to 10th, 50
th and 90
th percentiles. In all panels, the data are shown by solid
lines and symbols and LBA model fits by dotted lines and open symbol.. Model fits are averaged over participants
and stimulus conditions. Data points are accompanied by 95% with-subject confidence intervals (Morey, 2008).
The top row shows fits of the “Least Constrained” model for which the E (speed emphasis) factor could affect
drift rate parameters. (The top row fits come from Table 1 in Heathcote & Love, 2012). The bottom row shows
fits of the “Selective Caution Effect” model that removes the effect of E on v and sv parameters.
To investigate whether the diffusion model supports the same conclusions as the LBA
model for Wagenmakers et al.’s (2008) data, we used the same free-response-data fitting
methods as with our perceptual data, with one exception. In preliminary investigations we
found little evidence of contamination and so we report fits with only a single estimated
contamination probability parameter (p), rather than allowing separate estimates for each speed
and accuracy emphasis condition: estimates of the contamination proportion were less than 1%
on average.

Emphasising Decision Speed 20
Table 4.
Diffusion model results for fits to Wagenmakers et al.’s (2008) data. D (Deviance), AIC and BIC were calculated
by summing deviance and the number of model parameters (k) for fits to individual participants and the number of
data points per participant over participants. Values for these statistics in the table have the deviance for the least
constrained model subtracted. The AIC and BIC selected models have minimum AIC and BIC values within the
full set of models (rows 2 and 3), or within the set of model where caution does not influence drift rate parameters
(rows 5 and 6).
Variant a v sv Z SZ t0 st0 k D AIC BIC
Least Constrained E E, S E, S E E E E 27 0 918 3362
AIC Selected E E, S S E E E E 23 66 848 2930
BIC Selected E S - - E E - 14 635 1111 2378
Selective Caution Effect E S S E E E E 19 237 883 2603
AIC Selected E S S E - E E 19 237 883 2603
BIC Selected E S - E - E - 14 635 1111 2378
S – lexical stimulus manipulation with four levels (high, low and very low word frequency and nonwords)
For definitions of other quantities see Table 1.
Table 4 reports model selection results similarly to Tables 1 and 2. As always, the least
constrained model (top row) had the best fit to data (deviance) but did not provide the most
parsimonious description of the data, as shown by BIC and AIC. According to AIC, the best
model for these data was one that did not respect the selective influence assumption. However,
BIC did select a model that respected the selective influence assumption. To further investigate
this tension, we once again compared the decrease in goodness of fit resulting from imposing
the selective influence assumption, using nested model likelihood ratio tests against a 2
distribution. As before, the reduction in fit of the diffusion model with the selective influence
assumption was highly significant, 2(136) = 237, p <.001.
Figure 5 shows goodness of fit of the diffusion model to the lexical decision data. As
before, the key is in accommodating the difference in response accuracy between the speed and
accuracy emphasis conditions (left panels). With the selective influence assumption imposed
(lower row), the diffusion model does not accommodate this difference nearly as well as when
the assumption is relaxed (upper row).

Emphasising Decision Speed 21
Figure 5. Diffusion model fits to Wagenmakers et al.’s (2008) data. Response accuracy (left column), and RT
distributions for correct responses (middle column) and error responses (right column). For RT distributions, the
lines from bottom to top correspond to 10th, 50
th and 90
th percentiles. In all panels, the data are shown by solid
lines and symbols and diffusion model fits by dotted lines and open symbols. Model fits are averaged over
participants and stimulus conditions. Data points are accompanied by 95% with-subject confidence intervals
(Morey, 2008). The top row shows fits of the “Least Constrained” model specified in Table 4. The bottom row
shows fits of the “Selective Caution Effect” model specified in Table 4
Table 5 contains the drift rate parameter estimates from the least constrained diffusion
and LBA models. Although the main effect of emphasis on the rate (v) parameter was not
significant, F<1, a failure of selective influence was indicated by a significant interaction
between emphasis and stimulus type, F(3, 48) = 4.46, = .53, p = .03. The interaction was
caused by the effect of emphasis on drift rate being mostly confined to the most difficult low
frequency stimuli; an ANOVA restricted to estimates for these stimuli showed a significant
main effect, F(1,16) = 6.94, p = .02. This interaction of selective influence with stimulus class
may explain why BIC failed to pick an on-average effect of selective influence. Stronger
effects were evident for the LBA model. The main effect of emphasis on mean drift rate (v)
was significant for both the matching accumulator, F(1,16) = 23.7, p < .001, and the
mismatching accumulator, F(1,16) = 15.9, p = .001. The main effect of emphasis on drift rate

Emphasising Decision Speed 22
standard deviation was also significant for the mismatching accumulator, F(1,16) = 24.8,
p<.001, but it was the interaction with stimulus type that was significant for the matching
accumulator, F(3,16) = 4.78, = .95, p = .006, with the drift rate for accuracy emphasis being
greater than the drift rate for speed emphasis for the high frequency words whereas the
opposite was so for the other three types of stimuli.
Table 5.
Drift rate parameter estimates from the least constrained diffusion and LBA models fit to Wagenmakers et al.’s
(2008) data.
Model Parameter Emphasis High Frequency Low Frequency Very-low Frequency Nonword
LBA v(match) Accuracy 2.81 2.40 2.16 2.49
LBA v(match) Speed 3.39 2.97 2.76 3.14
LBA v(mismatch) Accuracy 0.19 0.27 0.36 0.12
LBA v(mismatch) Speed 0.91 1.05 1.33 0.78
LBA sv(match) Accuracy 0.69 0.67 0.73 0.73
LBA sv(match) Speed 0.64 0.70 0.77 0.76
LBA sv(mismatch) Accuracy 1.00 1.06 1.22 0.90
LBA sv(mismatch) Speed 1.43 1.53 1.55 1.38
Diffusion v Accuracy 0.609 0.350 0.243 0.287
Diffusion v Speed 0.634 0.307 0.187 0.302
Diffusion sv Accuracy 0.235 0.141 0.169 0.093
Diffusion sv Speed 0.241 0.135 0.205 0.079
The results of the LBA model analyses indicate a failure of the selective caution effect
assumption for the lexical decision data. The results of the diffusion model analysis were less
strong, but nevertheless there was some evidence that the selective influence assumption has to
be abandoned in order to improve goodness of fit, particularly for the error rates. Although the
failure of selective influence is less marked for the diffusion than LBA model – consistent with
our results from the perceptual paradigm – even for the diffusion model the majority of the
evidence rejects the selective caution effect assumption: imposing selective influence clearly
underestimates the error rate effect, is rejected by AIC model selection, and there are
significant effects of emphasis on mean drift rate parameter estimates.
The Effect of Emphasizing Decision Speed on Mnemonic Evidence
The brightness discrimination and lexical decision experiments showed that emphasising
decision speed changes the evidence derived from both perceptual and lexical processes, but
does this extend to evidence derived from episodic memory? Our new experiment further tests
the generality of our findings over different speed and accuracy emphasis instructions and in a

Emphasising Decision Speed 23
third accuracy range (80% in our recognition memory task, compared with 70% in the
perceptual experiment and 90% in lexical decisions).
Method
Participants
Forty eight students from the University of Newcastle, Australia, participated in the
experiment in return for course credit. One participant was excluded from further analysis due
to very low accuracy, less than 55% overall. For the remaining 47 participants overall accuracy
ranged from 63% to 93%.
Stimuli
Stimuli consisted of 1648 words with both frequency and concreteness ratings in the
MRC psycholinguistic database (Coltheart, 1981). Of these words, 48 were used to construct a
set of two study-test lists for practice, and the remainder to construct a set of 16 experimental
study-test lists. Within the practice and experimental sets, words were allocated to lists and
ordered randomly for each participant. In practice lists, 12 words were studied and 24 tested. In
experimental lists, 56 words were studied and 100 tested. The first four and last four study
words acted, respectively, as primacy and recency “buffers”. Two of the primacy and two of
the recency buffers were randomly selected for testing, whereas all of the remaining study
words were tested. Responses to buffer words were not analysed.
Procedure
Testing took place in two one-hour sessions on different days. The first session consisted
of the two practice lists, one with speed and one with accuracy emphasis instructions and eight
experimental lists. The second session used the other eight experimental lists. In each session
speed and accuracy instructions were alternated between lists, with half of the participants
beginning with speed and half with accuracy in session one, with the opposite order in session
two. Participants were told that approximately half of the test words were studied on the last
list (old words) and half not (new words).
Stimuli were presented on a computer screen and responses collected through the
computer keyboard. Half of the participants responded old by pressing “z” key and new by
pressing “/”, with the opposite assignment for the remaining participants. Words were studied
one at a time, being present on the screen for 1 second, preceded and followed by blank screens
for 0.15 and 0.25 seconds. Following study, a screen informed the participants of the type of
the next test (speed or accuracy). Each test word stayed on the screen until a response was
made or 6 seconds elapsed, in which case ‘TIME LIMIT EXCEEDED! NO RESPONSE

Emphasising Decision Speed 24
RECORDED!” was displayed. In speed blocks “TOO SLOW” was displayed after a response
slower than 0.65 seconds and “TOO FAST” after a response faster than 0.25 seconds. In
accuracy blocks “CORRECT” was displayed after correct responses and “INCORRECT” after
incorrect responses.
Results
As for the lexical decision data, preliminary investigations found little evidence of
contamination: estimates of the contamination proportion 4% on average for diffusion and 1%
for LBA. Thus, we report fits with only a single estimated contamination probability parameter
(p), rather than allowing separate estimates for each speed and accuracy emphasis condition.
Tables 6 and 7 report model selection results for the diffusion and LBA models respectively,
using the same format as in earlier analyses. For the least constrained models of both types,
speed vs. accuracy emphasis (E) was allowed to affect all parameters except rate variability
(sv). Allowing rate variability to vary with emphasis hardly improved fit and did not change
model selection results, but did lead to unstable parameter estimates for some participants,
which is why we exclude those models. For the diffusion model, both drift rate parameters (v
and sv) were allowed to vary with stimulus (S, i.e., studied or old test words vs. unstudied or
new test words). For the LBA model, threshold (B) was allowed to vary with the response
accumulator factor (R), and both drift rate parameters were allowed to vary with the stimulus-
accumulator match (M) factor and mean drift rate (v) was allowed to vary with the stimulus
(S). Allowing sv to vary with the stimulus did not improve fit much or change model selection
results and again led to unstable parameter estimates for some participants.
The top three rows of Tables 6 and 7 show that BIC and AIC both rejected the selective
influence assumption for the diffusion and LBA models, respectively. The reduction in fit
between the least constrained and selective influence models was also highly significant for
both the diffusion model, 2(94) = 2528, p <.001, and the LBA model,
2(94) = 1731, p <.001

Emphasising Decision Speed 25
Table 6.
Diffusion model results for fits to recognition memory data. D (Deviance), AIC and BIC were calculated by
summing deviance and the number of model parameters (k) for fits to individual participants and the number of
data points per participant over participants. Values for these statistics in the table have the deviance for the least
constrained model subtracted, and cannot be compared between Tables 6 and 7 due to differences in estimation
procedures. The AIC and BIC selected models have minimum AIC and BIC values within the full set of models
(rows 2 and 3), or within the set of model for which caution does not influence drift rate parameters (rows 5 and
6).
Variant a v sv Z SZ t0 st0 k D AIC BIC
Least Constrained E E, S S E E E E 17 0 1598 6673
AIC Selected E E, S S E E E E 17 0 1598 6673
BIC Selected E E, S S E E E E 17 0 1598 6673
Selective Caution Effect E S S E E E E 15 2528 3938 8416
AIC Selected E S S E E E E 15 2528 3938 8416
BIC Selected E S - - E E - 12 3291 4419 8001
S – mnemonic stimulus manipulation with two levels (test item either previously studied or not)
For definitions of other quantities see Table 1.
Table 7.
LBA model results for fits to recognition memory data. D (Deviance), AIC and BIC were calculated by summing
deviance and the number of model parameters (k) for fits to individual participants and the number of data points
per participant over participants. Values for these statistics in the table have the deviance for the least
constrained model subtracted, and cannot be compared between Tables 6 and 7 due to differences in estimation
procedures. The AIC and BIC selected models have minimum AIC and BIC values within the full set of models
(rows 2 and 3), or within the set of model for which caution does not influence drift rate parameters (rows 5 and
6).
Variant B A v sv t0 k D AIC BIC
Least Constrained E, R E E, S, M M E 18 0 1692 8874
AIC Selected E, R E E, S, M M E 18 0 1692 8874
BIC Selected R - E, M M E 11 1089 2123 6512
Selective Caution Effect E, R - S, M M - 12 1731 2859 7647
AIC Selected E, R - S, M M - 12 1731 2859 7647
BIC Selected E - S, M M - 10 2212 3152 7142
S – mnemonic stimulus manipulation with two levels (test item either previously studied or not)
For definitions of other quantities see Table 2.

Emphasising Decision Speed 26
Figure 6. Diffusion model fits to recognition memory data. Response accuracy (left column), and RT distributions
for correct responses (middle column) and error responses (right column). For RT distributions, the lines from
bottom to top correspond to 10th
, 50th and 90
th percentiles. In all panels, the data are shown by solid lines and
symbols and diffusion model fits by open symbols and dotted lines. Model fits are averaged over participants and
stimulus conditions. Data points are accompanied by 95% with-subject confidence intervals (Morey, 2008). The
top row shows fits of the “Least Constrained” model specified in Table 6. The bottom row shows fits of the
“Selective Caution Effect” model specified in Table 6.
Figures 6 and 7 show the goodness of fit of the diffusion and LBA models, respectively,
to the recognition memory data. For both models, the fit of the least constrained model is quite
accurate, except for slower error responses. Once again, the assumption of selective influence
causes the models not to be able to fit the difference in response accuracy between the speed
and accuracy emphasis conditions (left panels). With the selective influence assumption
imposed (lower row), neither model can accommodate this difference as well as when the
assumption is relaxed (upper row). Once again this failure is most marked for the diffusion
model, although selective influence also causes problems in RT, for both slow correct
responses in the speed condition and fast error responses in the accuracy condition.

Emphasising Decision Speed 27
Figure 7. LBA model fits to recognition memory data. Response accuracy (left column), and RT distributions for
correct responses (middle column) and error responses (right column). For RT distributions, the lines from bottom
to top correspond to 10th, 50
th and 90
th percentiles. In all panels, the data are shown by solid lines and symbols and
diffusion model fits by open symbols and dotted lines. Model fits are averaged over participants and stimulus
conditions. Data points are accompanied by 95% with-subject confidence intervals (Morey, 2008). The top row
shows fits of the “Least Constrained” model specified in Table 7. The bottom row shows fits of the “Selective
Caution Effect” model specified in Table 7.
Figures 6 and 7 show the goodness of fit of the diffusion and LBA models, respectively,
to the recognition memory data. For both models, the fit of the least constrained model is quite
accurate, except for the slowest of the incorrect responses (top line in right panels). Once again,
assuming selective influence causes the models to underestimate the difference in response
accuracy between the speed and accuracy emphasis conditions (left panels). With the selective
influence assumption imposed (lower row), neither model can accommodate this difference as
well as when the assumption is relaxed (upper row). Once again this failure is most marked for
the LBA model, although selective influence also causes problems in fits to error RTs for both
models.
Table 8 shows the drift rate parameter estimates for least constrained diffusion and
LBA models. There was a significant interaction between stimulus (new vs. old) and emphasis,

Emphasising Decision Speed 28
F(1,46) = 4.43, p = 0.04, due to a significantly higher drift rate for new stimuli under accuracy
than speed emphasis, F(1,46) = 6.13, p = .02, but no significant difference for old stimuli, F <
1. For the LBA model there was a significant three way interaction between stimulus, emphasis
and match, F(1,46) = 13.2, p < .001. This occurred because the difference between match and
mismatch rates (analogous to drift rate in the diffusion model) was smaller under speed (0.85)
than accuracy (1.58) emphasis, F(1,46) = 33.4, p < .001, with this difference being larger for
new stimuli (0.82 vs. 2) than old stimuli (0.88 vs. 1.16). Hence, both models supported an
effect of emphasis on drift rate that was strongest for new stimuli.
Table 8.
Drift rate parameter estimates from the least constrained diffusion and LBA models fit to our recognition data.
Speed Emphasis Accuracy Emphasis
Model Parameter New Old New Old
Diffusion v 0.216 0.298 0.245 0.286
LBA v(match) 3.48 3.58 4.03 3.78
LBA v(mismatch) 2.66 2.70 2.03 2.62
Discussion
The results of both the diffusion and LBA model analyses indicate a failure of the
selective caution effect assumption for the recognition memory data. Once again the failure of
selective influence was larger for the LBA model than the diffusion model, but for both models
all of our tests – AIC, BIC, 2 and significance tests on the least constrained model parameter
estimates – supported a failure of the selective influence assumption. As for the perceptual and
lexical paradigms the strongest effect of imposing selective influence was to underestimate the
effect of speed vs. accuracy emphasis instructions on observed error rates. Further, in the
diffusion model fit to the recognition memory data, the selective influence assumption also
caused some problems with the fit for the RT data. In agreement with findings for the lexical
decision experiment the effect of emphasis on rates interacted with stimulus, being greatest for
new stimuli in recognition memory.
Starns et al. (2012) reported evidence based on BIC for a failure of selective influence
(slower drift rates in the speed than accuracy emphasis condition) in fits of the diffusion model
to their recognition memory data. They noted that the average RT in their speed condition was
very fast (526 ms), which they attributed to practice, as their participants performed 20
sessions. Starns et al. suggested that the fast RTs for their speed condition may have weakened
mnemonic evidence, and so decreased drift rates, by impairing participants’ ability to form

Emphasising Decision Speed 29
effective retrieval cues. They contrasted (p.14) the considerably faster RTs for their speed
condition (526 ms) with the 580 ms RTs in Ratcliff, Thapar and McKoon’s (2004) for their
young participants in their speed condition and concluded that Ratcliff et al’s data supported
the selective influence assumption for the diffusion model because of their participant’s overall
longer RTs.
However, it is possible that neither practice nor extremely fast RTs explain the difference
in selective influence, as Ratcliff et al. (2004) did not report any test of selective influence and
there is evidence of substantial misfit for their model (see their Figure 3). Our recognition
memory experiment used only two sessions and mean RT even in our speed-emphasis
condition was slower than in Starns et al. (2012, 0.55 seconds). This suggests that neither
extensive practice nor the fast RTs in the speed condition of Starns et al.’s participants may be
necessary for a failure of the selective caution effect assumption. Regardless, their suggestion
that compromised retrieval-cue encoding is the cause remains viable, as discuss further below.
General Discussion
One of the most useful features of decision-making models is that they tease apart the
effects of different cognitive changes that might otherwise be confused. This feature has
proven useful in applied studies, for example in understanding the cognitive effects of aging
(Forstmann et al., 2011; Ratcliff, Thapar & McKoon, 2006a, 2006b, 2007, 2011) alcohol use
(van Ravenzwaaij et al., 2012), sleep deprivation (Ratcliff & Van Dongen, 2011), and practice
(Heathcote & Hayes, 2012). The ability to attribute different cognitive effects to different
model parameters has even been taken as evidence in favour of the models themselves, and
subsequently as a benchmark test that new decision-making theories must pass. Data from our
three experiments using very different cognitive tasks and converging analytic procedures
provide strong evidence against one of the most fundamental assumptions of selective
influence: the assumption that changes in decision caution can be explained by changes in the
amount of evidence required to trigger a decision, without positing changes in the quality of
that evidence.
Using two different decision-making models, diffusion and LBA models, we found that
that an emphasis on accurate decision making led to both an increase in the amount of evidence
required to trigger a decision and an increase in the quality of evidence extracted from the
stimulus. In the parlance of evidence accumulation models, speed-accuracy tradeoffs
influenced both the decision threshold (or boundary separation) and the drift rate. Our findings
depart from dozens of prior studies, all of which modelled the effects of speed-accuracy

Emphasising Decision Speed 30
manipulations without changes in drift rate parameters, by allowing changes only in the
amount of evidence required to trigger a decision, and sometimes in the time taken for non-
decision processes such as button pressing. Our results do not provide evidence against the
models themselves, but rather against the way the models are linked with data. This changes
the approach that ought to be taken in the many applications of evidence accumulation models
to clinical and cognitive investigations.
It is possible that the difference between our finding and prior work can be explained by
the approach taken to model selection. Most previous studies have used a confirmatory
approach, where the selective influence of speed-accuracy tradeoffs on threshold parameters is
assumed a priori, and good fits to data are taken as support for the assumption. In contrast, we
directly compared models that did, and did not, make the assumption of selective influence,
and we found better support for the latter sort. Reassuringly, our findings align with some
previous studies that have tested the assumption of selective influence. Vanderkerchove et al.
(2008) and Starns et al. (2012) used Ratcliff’s diffusion model and found that speed-emphasis
instructions sometimes led to lower drift rate estimates than accuracy-emphasis instructions in
a recognition memory task. Heathcote and Love (2012) found the same result in an LBA
analysis of Wagenmakers et al.’s (2008) data. However, our results differ from some very new
results reported by Starns and Ratcliff (in press). Starns and Ratcliff examined the effects of
speed vs. accuracy emphasis on drift rates in a variety of data sets (see their Table 1) and found
no evidence that drift rates varied as a function of emphasis.
All these previous results, combined with our own, rule out several hypotheses about
what conditions might cause drift rate differences between speed-emphasis and accuracy-
emphasis conditions. Nevertheless, some plausible hypotheses remain consistent with all the
results so far. For example, it may be that very fast responses under speed stress are the key
element (Starns and Ratcliff’s data sets did not have such responses). Alternatively, it may be
that a large difference in the accuracy of responses under speed vs. accuracy emphasis is key.
These hypotheses are the subject of ongoing research.
Theoretical Implications
Our results raise the question of how a decision maker might change the quality of
information extracted from the stimulus in response to speed vs. accuracy emphasis
instructions. One hypothesis is suggested by prior studies showing that the information
extracted from a decision stimulus can change in quality during the course of a single decision.
Ratcliff and McKoon (1989, also Gronlund & Ratcliff, 1989) analysed data from a recognition

Emphasising Decision Speed 31
memory task in which participants sometimes had to judge whether an item had previously
been studied (item recognition) and sometimes had to judge whether a pair of previously-
studied items had been studied together, or in different pairings. They observed that
information about item recognition became available earlier in a decision than information
about associative recognition. Cohen and Nosofsky (2003) identified similar effects through
experimental manipulation of stimulus structure in a multi-dimensional categorisation task,
finding that information from one dimension was usually processed earlier than information
from other dimensions. In some cases, this effect could lead to information favouring opposite
responses to accumulate early vs. late in the decision process. Smith and Ratcliff (2009)
identified related changes in the nature of information extracted from a stimulus during the
course of simple perceptual decisions.
These findings bear a suggestive relationship to ours: when decision times are
shortened (e.g., by emphasizing response speed rather than accuracy), the type of information
being accumulated could change, because less of the later-arriving information would be
available. Because of the unitary nature of our stimuli, it is not obvious what kinds of
information might be accumulated in early vs. late processing, but many hypotheses are
plausible. For example, in our Experiment 1, perhaps small patches of the perceptual stimuli
are processed early – leading to greater variability between stimulus samples, and so lower drift
rates – and these patches are only later integrated into more informative global precepts. Starns
et al. (in press) suggest a similar explanation for their finding that drift rates were lower under
speed emphasis than accuracy emphasis in a recognition memory task. Starns et al. attributed
the lower drift rates to compromised retrieval cues in the very fast decisions made under speed-
emphasis, and noted that this fits with recent memory models, some of which assume that
memory probes have few active features early in a test trial, with additional features filling in
over time (Diller, Nobel, & Shiffrin, 2001; Malmberg, 2008; see p. 19 of Starns et al. for more
detail).
These ideas hinge on the assumption that the quality of information extracted from the
environment improves systematically during a decision, such that faster decisions will
necessarily be based on poorer information than slow decisions. Hence, these ideas are
consistent with a broader notion of selective influence in the sense of assuming that the
information extracted from the stimulus at any given time during a decision is not influenced
by speed-accuracy tradeoffs. That is, even though the rate of information extraction might
change during a decision, this change is identical in the speed and accuracy emphasis
conditions.
Emphasising Decision Speed 32
A more radical hypothesis allows the information extracted from the stimulus at all
moments during decision-making to differ between speed-emphasis and accuracy-emphasis
conditions. Even this more radical assumption is not without precedent. One possibility is that
average information quality is decreased under speed-emphasis purely because some decision-
makers, on some trials, resort to uninformed guessing. Although simple, this explanation is
hard to reconcile with data from high-accuracy experiments with small differences between
speed- and accuracy-emphasis conditions, in which the assumption of selective influence
nevertheless fails (e.g., Vanderkerchove et al., 2008).
Recent studies of the neurobiology of simple decisions suggest two further possibilities.
Firstly, Ho, Brown, van Maanen, Forstman, Wagenmakers and Serences (2012) examined fine
perceptual discriminations, similar to the brightness task used here. For such tasks, neurons in
lower visual cortex have simple tuning functions: each responds maximally to a preferred
stimulus, with outputs that decrease with distance from the preferred stimulus. The particular
bell-shape of the tuning curve leads to the curious property that the most active neurons (those
tuned to prefer the presented stimulus magnitude, “on-tuned”) are not the most informative
neurons on which to base a decision. Instead, the most informative neurons are those tuned
slightly away from the presented stimulus (“off-tuned”: Scolari & Serences, 2009). Ho et al.
showed that, when decision accuracy was emphasized, responses were best predicted by
activity of the most informative off-tuned neurons, but when decision speed was emphasized,
responses were better predicted by the activity of the less informative, but more active, on-
tuned neurons. This suggests that decision-makers might base their evidence accumulation on
different neural inputs under speed vs. accuracy emphasis, with accuracy emphasis resulting in
slower, but more informative information being accrued than speed emphasis. This suggestion
which agrees with single-cell recordings from monkeys (Heitz & Schall, 2012) in which
neurons in regions implicated in decision-making increased their firing rates differently
depending on whether speed or accuracy was emphasized.
Secondly, Ratcliff, Hasegawa, Hasegawa, Smith, and Segraves (2007) recorded firing
directly from the cells of monkeys who were performing a simple decision task, and identified
the firing rate of those cells with the process of evidence accumulation. They noted a brief
period when evidence accumulates indiscriminately, in favour of both responses, just after
stimulus presentation. This phenomenon could correspond to a period of low-drift rate
accumulation early during the decision process, which is consistent with our results, as
discussed above.

Emphasising Decision Speed 33
Limitations and Further Research
Our model selection methods, although a substantial advance over not testing the
assumption of selective influence at all, are still far from optimal. Reassuringly, the model
selection methods we employed mostly provided converging evidence, but these methods do
not employ state of the art mechanisms for assessing the relative complexity of different
theories (e.g., AIC and BIC simply count the number of estimated parameters in a model to
measure its complexity). New Bayesian approaches to evidence accumulation models open up
the possibility of using much more sophisticated model selection methods. Vandekerckhove et
al. (2008), re-analysed data reported by Ratcliff and Rouder (1998) using Monte-Carlo
methods to sample from posterior distributions for the parameters, and based their model
selection on analyses of parameter estimates. With these methods, Vandekerckhove et al. came
to a conclusion similar to ours.
A limitation of our analyses, and of evidence accumulation models in general, is that
measurements of drift rates confound the effects of better information accumulation with the
effects of faster information accumulation. The improved drift rates observed under accuracy
emphasis reflect more diagnostic information being accumulated sooner, but this could equally
well occur because all information is being accumulated faster (i.e. faster evidence
accumulation overall), or because higher quality information is being accumulated (but without
an overall increase in rate).
Evidence accumulation models, and the assumption of selective influence, have been
applied to data from dozens of different paradigms. We found evidence against the assumption
using data from perceptual decisions, lexical decisions and recognition memory decisions.
Further investigation will be required to determine if other paradigms yield similar evidence.
Two notable features of the data from our brightness discrimination task were the low overall
accuracy rates (around 70%), and the very large differences in accuracy rate between speed-
emphasis and accuracy-emphasis conditions (about 17%). It is tempting to speculate that these
conditions are prerequisites for a failure of the selective influence of caution. However, our
analyses of Wagenmakers et al.’s (2008) lexical decision data speak against this idea.
Wagenmakers et al.’s data had high accuracy (around 90%) with a smaller difference between
speed and accuracy emphasis (about 10%), but still showed a failure of the selective influence
hypothesis. Similarly, Vanderkerchove et al.’s (2008) analysis reached similar conclusions to
ours, but using data from Ratcliff and Rouder (1998) that included many conditions with
almost perfect accuracy, and very small changes between speed- and accuracy-emphasis
conditions (less than 5%). Again, further investigation will be required to determine if there are

Emphasising Decision Speed 34
particular conditions under which caution does not influence the rate at which information is
accumulated. However, our results do clearly indicate that there are at least some conditions
and paradigms where this assumption cannot be safely made.
Conclusions
A common assumption in both the development and application of decision-making
theories is that changes in decision caution (fast and careless vs. slow and careful) are due to
changes in the amount of evidence required to trigger a decision, and are not due to changes in
the nature of the evidence. Our data challenge this assumption. The most immediate
implication is that applications of decision-making models to data should not assume selective
influence by fiat, but should instead use model selection methods to see if the assumption is
warranted in each data set. A more far-reaching conclusion is that theoretical development in
simple decision-making may have been a little more heavily influenced than needed though the
use of the selective influence assumption as a benchmark test. This could warrant the
reinvestigation of some earlier theoretical conclusions about competing models.

Emphasising Decision Speed 35
References
Brown, S., & Heathcote, A. (2005). A ballistic model of choice response time. Psychological
Review, 112(1), 117–128.
Brown, S.D., & Heathcote, A. (2008). The simplest complete model of choice reaction time:
Linear ballistic accumulation. Cognitive Psychology, 57, 153-178.
Burnham, K. P. & Anderson, D. R. (2002). Model Selection and Inference: A Practical
Information-Theoretic Approach. New York: Springer.
Busemeyer, J. R., & Wang, Y. I. (2000). Model comparisons and model selections based on
generalization criterion methodology. Journal of Mathematical Psychology, 44, 171-189.
Cohen, A.L. & Nosofsky, R.M. (2003). An extension of the exemplar-based random-walk
model to separable-dimension stimuli. Journal of Mathematical Psychology, 47, 150–
165.
Coltheart, M. (1981). The MRC Psycholinguistic Database. Quarterly Journal of Experimental
Psychology, 33A, 497-505.
Churchland, A.K., Kiani, R. & Shadlen, M.N. (2008). Decision-making with multiple
alternatives. Nature Neuroscience. 11(6), 693-702.
Diller, D. E., Nobel, P. A., & Shiffrin, R. M. (2001). An ARC–REM model for accuracy and
response time in recognition and recall. Journal of Experimental Psychology: Learning,
Memory, and Cognition, 27, 414–435.
Donkin, C., Brown, S.D. & Heathcote, A. (2011). Drawing conclusions from choice response
time models: a tutorial. Journal of Mathematical Psychology, 55, 140-151.
Donkin, C., Brown, S., Heathcote, A. & Wagenmakers, E-J. (2011). Diffusion versus linear
ballistic accumulation: Different models but the same conclusions about psychological
processes? Psychonomic Bulletin & Review, 18, 61-69.
Eidels, A., Donkin, C., Brown, S. D., & Heathcote, A. (2010). Converging measures of
workload capacity. Psychonomic bulletin & review, 17(6), 763-771.
Forstmann, B.U., Dutilh, G., Brown, S., Neumann, J., von Cramon, D.Y., Ridderinkhof, K.R.
& Wagenmakers, E.J. (2008). Striatum and pre-SMA facilitate decision-making under
time pressure. Proceedings of the National Academy of Sciences, 105(45), 17,538-
17,542.
Forstmann, B.U., Tittgemeyer, M., Wagenmakers, E.-J., Derrfuss, J., Imperati, D., & Brown,
S.D. (2011). The speed-accuracy tradeoff in the elderly brain: A structural model-based
approach. Journal of Neuroscience, 31(47), 17242-17249.
Emphasising Decision Speed 36
Gold, J.I. & Shadlen, M.N. (2007). The neural basis of decision making. Annual Review of
Neuroscience, 30, 535-74.
Gronlund, S.D. & Ratcliff, R. (1989). Time course of item and associative information:
Implications for global memory models. Journal of Experimental Psychology: Learning,
Memory, and Cognition, 15, 846-858.
Hawkins, G., Brown, S. D., Steyvers, M., & Wagenmakers, E.-J. (2012). Context effects in
multi-alternative decision making: Empirical data and a Bayesian model. Cognitive
Science, 36, 498-516.
Hawkins, G. E., Marley, A. A. J., Heathcote, A., Flynn, T. N., Louviere, J. J., & Brown, S. D.
(in press). Integrating cognitive process and descriptive models of attitudes and
preferences. Cognitive Science.
Heathcote, A. & Hayes, B. (2012). Diffusion versus Linear Ballistic Accumulation: Different
models for response time with different conclusions about psychological mechanisms?
Canadian Journal of Experimental Psychology, 66,125-136.
Heathcote, A., & Brown, S.D. (2004). Reply to Speckman and Rouder: A theoretical basis for
QML. Psychonomic Bulletin and Review, 11, 577.
Heathcote, A., Brown, S.D. & Mewhort, D.J.K. (2002). Quantile Maximum Likelihood
Estimation of Response Time Distributions. Psychonomic Bulletin and Review, 9,
394-401.
Heathcote, A. & Love, J. (2012). Linear deterministic accumulator models of simple choice.
Frontiers in Cognitive Science, 3, 292.
Heitz, R.P & Schall, J.D. (2012). Neural Mechanisms of Speed-Accuracy Tradeoff. Neuron,
76, 616-628.
Ho, T.C., Brown, S.D., van Maanen L., Forstmann, B.U. Wagenmakers, E.-J. & Serences, J.T.
(2012). The optimality of sensory processing during the speed-accuracy tradeoff. Journal
of Neuroscience, 32(23), 7992-8003.
Ho, T.C., Brown, S. & Serences, J.T. (2009). Domain General Mechanisms of Perceptual
Decision Making in Human Cortex. The Journal of Neuroscience, 29(27), 8675–8687.
Kass, R. E. & Raftery, A. E. (1995). Bayes Factors. Journal of the American Statistical
Association, 90(430), 773-795.
Malmberg, K. J. (2008). Recognition memory: A review of the critical findings and an
integrated theory for relating them. Cognitive Psychology, 57, 335–384.

Emphasising Decision Speed 37
McElree, B. & Dosher, B.A. (1989). Serial position and set size in short-term memory: The
time course of recognition. Journal of Experimental Psychology: General, 118(4), 346-
373.
Meyer, D.E., Irwin, D.E., Osman, A.M. & Kounios, J. (1988). The dynamics of cognition and
action: Mental processes inferred from speed-accuracy decomposition. Psychological
Review, 95(2), 183-237.
Morey, R. D. (2008) Confidence Intervals from Normalized Data: A correction to Cousineau
(2005). Tutorials in Quantitative Methods in Psychology, 4, 61-64.
Myung, I. J., & Pitt, M. A. (1997). Applying Occam's razor in modeling cognition: A Bayesian
approach. Psychonomic Bulletin & Review, 4 , 79-95.
Ratcliff, R. (1978). A theory of memory retrieval. Psychological Review, 85(2), 59-108.
Ratcliff, R. (1988). Continuous versus discrete information processing: Modeling the
accumulation of partial information. Psychological Review, 95, 238-255.
Ratcliff, R. (2006). Modeling Response Signal and Response Time Data. Cognitive
Psychology, 53, 195-237.
Ratcliff, R., Hasegawa, Y.T., Hasegawa, Y.P., Smith, P.L., & Segraves, M.A. (2007). Dual
diffusion model for single-cell recording data from the superior colliculus in a brightness-
discrimination task. Journal of Neurophysiology, 97, 1756-1774.
Ratcliff, R. & McKoon, G. (1989). Similarity information versus relational information:
Differences in the time course of retrieval. Cognitive Psychology, 21, 139-155.
Ratcliff, R., & McKoon, G. (1995). Sequential effects in lexical decision: Tests of compound
cue retrieval theory. Journal of Experimental Psychology: Learning, Memory, and
Cognition, 21, 1380-1388.
Ratcliff, R., & Rouder, J.N. (1998). Modeling response times for two-choice decisions.
Psychological Science, 9, 347-356.
Ratcliff, R. & Smith, P.L. (2004). A comparison of sequential sampling models for two-choice
reaction time. Psychological Review, 111, 333-367.
Ratcliff, R., Thapar, A., & McKoon, G. (2004). A diffusion model analysis of the effects of
aging on recognition memory. Journal of Memory and Language, 50, 408–424.
Ratcliff, R., Thapar, A., & McKoon, G. (2006a). Aging and individual differences in rapid two-
choice decisions. Psychonomic Bulletin and Review, 13, 626-635.
Ratcliff, R., Thapar, A., & McKoon, G. (2006b). Aging, practice, and perceptual tasks: A
diffusion model analysis. Psychology and Aging, 21, 353-371.

Emphasising Decision Speed 38
Ratcliff, R., Thapar, A., & McKoon, G. (2007). Application of the diffusion model to tw-
choice tasks for adults 75-90 years old. Psychology and Aging, 22, 56-66.
Ratcliff, R., Thapar, A., & McKoon, G. (2010). Individual differences, aging, and IQ in two-
choice tasks. Cognitive Psychology, 60, 127-157.
Ratcliff, R., Thapar, A., & McKoon, G. (2011). Effects of aging and IQ on item and associative
memory. Journal of Experimental Psychology: General, 140, 464-487.
Ratcliff, R., & Tuerlinckx, F. (2002). Estimating parameters of the diffusion model:
Approaches to dealing with contaminant reaction times and parameter variability.
Psychonomic Bulletin and Review, 9, 438-481.
Ratcliff, R. & Van Dongen, H.P.A. (2011). A diffusion model for one-choice reaction time
tasks and the cognitive effects of sleep deprivation. Proceedings of the National
Academy of Sciences, 108, 11285-11290.
Roitman, J.D. & Shadlen, M.N. (2002). Response of Neurons in the Lateral Intraparietal Area
during a Combined Visual Discrimination Reaction Time Task. Journal of Neuroscience,
22(21), 9475-9489.
Rouder, J. N. (2000). Assessing the roles of change discrimination and accumulation: Evidence
for a hybrid model of perceptual decision-making in luminance discrimination. Journal
of Experimental Psychology: Human Perception and Performance. 26, 259-368.
Scolari, M. & Serences, J.T. (2009). Adaptive allocation of attentional gain. Journal of
Neuroscience, 29(38), 11933-42.
Shurman, B., Horan, W.P. & Neuchterlein, K.H. (2005). Schizophrenia patients demonstrate a
distinctive pattern of decision-making impairment on the Iowa Gambling Task.
Schizophrenia Research, 72, 215-224.
Smith, P. L., & Ratcliff, R. (2009). An integrated theory of attention and decision making in
visual signal detection. Psychological Review, 116, 283-317.
Speckman, P. L., & Rouder J. N. (2004). A comment on Heathcote, Brown, and Mewhort’s
QMLE method for response time distributions. Psychonomic Bulletin & Review, 11, 574-
576.
Starns, J.J., & Ratcliff, R. (2010). The effects of aging on the speed-accuracy compromise:
Boundary optimality in the diffusion model. Psychology and Aging, 25, 377-390.
Starns, J.J., Ratcliff, R., & McKoon, G. (2012). Evaluating the unequal-variability and dual-
process explanations of zROC slopes with response time data and the diffusion
model. Cognitive Psychology, 64, 1-34.

Emphasising Decision Speed 39
Starns, J.J. & Ratcliff, R. (in press). Validating the unequal-variance assumption in recognition
memory using response time distributions instead of ROC functions: A diffusion model
analysis. Journal of Memory and Language.
Usher, M. & McClelland, J. L. (2001). The time course of perceptual choice: The leaky,
competing accumulator model. Psychological Review, 108(3), 550-592.
Vanderkerckhove, J., Tuerlinckx, F. & Lee, M.D. (2008). A Bayesian approach to diffusion
process models of decision-making. In V. Sloutsky, B. Love & K. McRae (Eds.),
Proceedings of the 30th Annual Conference of the Cognitive Science Society, pp. 1429-
1434. Austin, TX: Cognitive Science Society.
van Ravenzwaaij, D., Dutilh, G., & Wagenmakers, E.-J. (2012). A diffusion model
decomposition of the effects of alcohol on perceptual decision
making. Psychopharmacology, 219, 1017-1025.
Voss, A., Rothermund, K. & Voss, J. (2004). Interpreting the parameters of the diffusion
model: An empirical validation. Memory & Cognition, 32(7), 1206-1220.
Wagenmakers, E-J., Ratcliff, R., Gomez, P., & McKoon, G. (2008). A diffusion model account
of criterion shifts in the lexical decision task. Journal of Memory and Language, 58, 140-
159.
Wagenmakers, E.-J., & Farrell, S. (2004). AIC model selection using Akaike weights.
Psychonomic Bulletin & Review, 11, 192-196.
Wickelgren, W.A. (1977). Speed-accuracy tradeoff and information processing dynamics. Acts
Psychologica, 41, 67-85.