Technical note: geometric morphometrics and sexual dimorphism of the greater sciatic notch in adults...
8
Technical Note: Geometric Morphometrics and Sexual Dimorphism of the Greater Sciatic Notch in Adults From Two Skeletal Collections: The Accuracy and Reliability of Sex Classification Jana Velem ınsk a, 1 *V aclav Kraj ıc ˇ ek, 1,2 J an Dupej, 2 Jorge A. Gom ez-Vald es, 3 Petr Velem ınsk y, 4 Alena Sefc ˇ akov a, 5 Josef Pelik an, 2 Gabriela S anchez-Mejorada, 3 and Jaroslav Br ˚ u zek 1,6 1 Department of Anthropology and Human Genetics, Faculty of Science, Charles University in Prague, Prague 12844, Czech Republic 2 Department of Software and Computer Science Education, Faculty of Mathematics and Physics, Charles University in Prague, Prague 11800, Czech Republic 3 Departamento de Anatom ıa, Facultad de Medicina, Universidad Nacional Aut onoma de M exico, Circuito Interior, Ciudad Universitaria, Coyoac an, Distrito Federal 04510, M exico 4 Department of Anthropology, National Museum, Prague 11579, Czech Republic 5 Department of Anthropology, Slovak National Museum, Bratislava 81006, Slovak Republic 6 A3P-PACEA, UMR 5199 CNRS, University Bordeaux I, Talence 33405, France KEY WORDS shape analysis; hip bone; sex assessment; curve segmentation; SVM learn- ing model ABSTRACT The greater sciatic notch (GSN) is one of the most important and frequently used characteristics for determining the sex of skeletons, but objective assessment of this characteristic is not without its difficulties. We tested the robustness of GSN sex classification on the basis of geo- metric morphometrics (GM) and support vector machines (SVM), using two different population samples. Using pho- tographs, the shape of the GSN in 229 samples from two assemblages (documented collections of a Euroamerican population from the Maxwell Museum, University of New Mexico, and a Hispanic population from Universidad Nacio- nal Aut onoma de M exico, Mexico City) was segmented automatically and evaluated using six curve representa- tions. The optimal dimensionality for each representation was determined by finding the best sex classification. The classification accuracy of the six curve representations in our study was similar but the highest and concurrently homologous cross-validated accuracy of 92% was achieved for a pooled sample using Fourier coefficient and Legendre polynomial methods. The success rate of our classification was influenced by the number of semilandmarks or coeffi- cients and was only slightly affected by GSN marginal point positions. The intrapopulation variability of the female GSN shape was significantly lower compared with the male variability, possibly as a consequence of the intense selection pressure associated with reproduction. Males were misclassified more often than females. Our results show that by using a suitable GSN curve represen- tation, a GM approach, and SVM analysis, it is possible to obtain a robust separation between the sexes that is stable for a multipopulation sample. Am J Phys Anthropol 152:558–565, 2013. V C 2013 Wiley Periodicals, Inc. The pelvic bone as a whole is the most reliable sex indicator in the human skeleton (Ferembach et al., 1980; Buikstra and Ubelaker, 1994; Bass, 1995) but some parts of it are more susceptible to damage than others. How- ever, the greater sciatic notch (GSN) is a very well- preserved morphological structure within this bone that shows a high degree of sexual dimorphism (SD) in human populations (Walker, 2005). The existence of GSN shape differences between males and females is caused by a sex-linked adaptation of the pelvis for loco- motion and reproduction in the context of a large brain size and encephalization of the fetus during evolution (Hager, 1996; Simpson et al., 2008; Ruff, 2010). Numer- ous techniques of sex estimation using GSN as a single sex indicator have been proposed, but efforts to improve them continue to the present day. The success of methods for evaluation of SD is usually assessed based on the accuracy of sex classification. How- ever, because of the considerable variability in the adult GSN, the accuracy of sex determination based on sepa- rate visual and subjective ratings is low, only achieving an accuracy of approximately 70–80% (Washburn, 1948; Rogers and Saunders, 1994). Measurement of GSN width alone is a poor sex discriminator (MacLaughlin and Bruce, 1985). Other linear variables and indices are com- plicated by variable definitions (MacLaughlin and Bruce, 1985; Novotn y, 1986; Hager, 1996; Bruzek, 2002; Walker, Grant sponsor: MSM; Grant number: 0021620843; Grant sponsor: GACR; Grant number: 206=07=0699; Grant sponsor: GAUK; Grant number: 1388213; Grant sponsor: Ministry of Culture of the Czech Republic (DKRVO National Museum, Prague); Grant number: 00023272. *Correspondence to: Jana Velem ınsk a, Department of Anthropol- ogy and Human Genetics, Faculty of Science, Charles University in Prague, Vinic ˇn a 7, 12844 Prague 2, Czech Republic. E-mail: [email protected] Received 14 December 2012; accepted 28 August 2013 DOI: 10.1002/ajpa.22373 Published online 30 September 2013 in Wiley Online Library (wileyonlinelibrary.com). Ó 2013 WILEY PERIODICALS, INC. AMERICAN JOURNAL OF PHYSICAL ANTHROPOLOGY 152:558–565 (2013)
Transcript of Technical note: geometric morphometrics and sexual dimorphism of the greater sciatic notch in adults...
Technical Note: Geometric Morphometrics and SexualDimorphism of the Greater Sciatic Notch in Adults FromTwo Skeletal Collections: The Accuracy and Reliabilityof Sex Classification
Jana Velem�ınsk�a,1* V�aclav Kraj�ıcek,1,2 J�an Dupej,2 Jorge A. Gom�ez-Vald�es,3 Petr Velem�ınsk�y,4
Alena �Sefc�akov�a,5 Josef Pelik�an,2 Gabriela S�anchez-Mejorada,3 and Jaroslav Bru�zek1,6
1Department of Anthropology and Human Genetics, Faculty of Science, Charles University in Prague, Prague12844, Czech Republic2Department of Software and Computer Science Education, Faculty of Mathematics and Physics,Charles University in Prague, Prague 11800, Czech Republic3Departamento de Anatom�ıa, Facultad de Medicina, Universidad Nacional Aut�onoma de M�exico, Circuito Interior,Ciudad Universitaria, Coyoac�an, Distrito Federal 04510, M�exico4Department of Anthropology, National Museum, Prague 11579, Czech Republic5Department of Anthropology, Slovak National Museum, Bratislava 81006, Slovak Republic6A3P-PACEA, UMR 5199 CNRS, University Bordeaux I, Talence 33405, France
KEY WORDS shape analysis; hip bone; sex assessment; curve segmentation; SVM learn-ing model
ABSTRACT The greater sciatic notch (GSN) is one ofthe most important and frequently used characteristics fordetermining the sex of skeletons, but objective assessmentof this characteristic is not without its difficulties. We testedthe robustness of GSN sex classification on the basis of geo-metric morphometrics (GM) and support vector machines(SVM), using two different population samples. Using pho-tographs, the shape of the GSN in 229 samples from twoassemblages (documented collections of a Euroamericanpopulation from the Maxwell Museum, University of NewMexico, and a Hispanic population from Universidad Nacio-nal Aut�onoma de M�exico, Mexico City) was segmentedautomatically and evaluated using six curve representa-tions. The optimal dimensionality for each representationwas determined by finding the best sex classification. Theclassification accuracy of the six curve representations in
our study was similar but the highest and concurrentlyhomologous cross-validated accuracy of 92% was achievedfor a pooled sample using Fourier coefficient and Legendrepolynomial methods. The success rate of our classificationwas influenced by the number of semilandmarks or coeffi-cients and was only slightly affected by GSN marginalpoint positions. The intrapopulation variability of thefemale GSN shape was significantly lower compared withthe male variability, possibly as a consequence of theintense selection pressure associated with reproduction.Males were misclassified more often than females. Ourresults show that by using a suitable GSN curve represen-tation, a GM approach, and SVM analysis, it is possible toobtain a robust separation between the sexes that is stablefor a multipopulation sample. Am J Phys Anthropol152:558–565, 2013. VC 2013 Wiley Periodicals, Inc.
The pelvic bone as a whole is the most reliable sexindicator in the human skeleton (Ferembach et al., 1980;Buikstra and Ubelaker, 1994; Bass, 1995) but some partsof it are more susceptible to damage than others. How-ever, the greater sciatic notch (GSN) is a very well-preserved morphological structure within this bone thatshows a high degree of sexual dimorphism (SD) inhuman populations (Walker, 2005). The existence ofGSN shape differences between males and females iscaused by a sex-linked adaptation of the pelvis for loco-motion and reproduction in the context of a large brainsize and encephalization of the fetus during evolution(Hager, 1996; Simpson et al., 2008; Ruff, 2010). Numer-ous techniques of sex estimation using GSN as a singlesex indicator have been proposed, but efforts to improvethem continue to the present day.
The success of methods for evaluation of SD is usuallyassessed based on the accuracy of sex classification. How-ever, because of the considerable variability in the adultGSN, the accuracy of sex determination based on sepa-rate visual and subjective ratings is low, only achievingan accuracy of approximately 70–80% (Washburn, 1948;
Rogers and Saunders, 1994). Measurement of GSN widthalone is a poor sex discriminator (MacLaughlin andBruce, 1985). Other linear variables and indices are com-plicated by variable definitions (MacLaughlin and Bruce,1985; Novotn�y, 1986; Hager, 1996; Bruzek, 2002; Walker,
Grant sponsor: MSM; Grant number: 0021620843; Grant sponsor:GACR; Grant number: 206=07=0699; Grant sponsor: GAUK; Grantnumber: 1388213; Grant sponsor: Ministry of Culture of the CzechRepublic (DKRVO National Museum, Prague); Grant number:00023272.
*Correspondence to: Jana Velem�ınsk�a, Department of Anthropol-ogy and Human Genetics, Faculty of Science, Charles University inPrague, Vinicn�a 7, 12844 Prague 2, Czech Republic.E-mail: [email protected]
Received 14 December 2012; accepted 28 August 2013
DOI: 10.1002/ajpa.22373Published online 30 September 2013 in Wiley Online Library
(wileyonlinelibrary.com).
� 2013 WILEY PERIODICALS, INC.
AMERICAN JOURNAL OF PHYSICAL ANTHROPOLOGY 152:558–565 (2013)
2005; Takahashi, 2006) and their contribution to sexdetermination is either not significant (Akpan et al.,1998) or provides poor results (Steyn and Iscan, 2008).Even though the length of the anterior and posteriorchords (Singh and Potturi, 1978) and their proportionsare useful parameters for determining SD (Novotn�y,1981; Hager, 1996), classic morphometry does not offer asatisfactory solution for sex determination.
The aim of this study was to find a method for accu-rately classifying the sex of pelvic bones using photo-graphs of the GSN from two known-sex contemporaryskeletal collections of Euroamerican and Hispanic popu-lations. By applying GM techniques, we aimed to answerthe following questions: 1) Which method of curve repre-sentation is the most appropriate for sex assessment? 2)What is the optimal number of semiland-marks=coefficients for this purpose? 3) Is the proposedclassification function population-specific or broadlyapplicable (better classification for pooled samples)?
MATERIALS
The study was based on the GM evaluation of twosamples of identified adult skeletons. The choice of theosteological collections was made bearing in mind that,in contemporary forensic anthropology, applying Euroa-merican sexing criteria provides poor accuracy whenapplied to Hispanics (Spradley et al., 2008).
The first sample consisted of 114 photographs of adulthuman pelvic bones (57 males and 57 females) from thedocumented collection of Euroamericans of the MaxwellMuseum (MM) at the University of New Mexico, Albu-querque (Komar and Grivas, 2008). The average chrono-logical age of the sample was 53 years for males and 70years for females.
The second sample consisted of Hispanics from theOsteological Collection of the Universidad NacionalAut�onoma de M�exico (UNAM1), at the Anthropology Sec-tion, Department of Anatomy, School of Medicine(G�omez-Vald�es et al., 2012). This sample consisted of 115photographs of adult human pelvic bones (55 femalesand 60 males). The chronological age of the UNAM col-lection is not known, but the age had been estimated (inmultiples of 5 years) from the cadavers by anatomistsprior to dissection. The average estimated age was 40years for males and 55 years for females.
METHODS
Shape analysis was based on 2D GM evaluation (Zelditchet al., 2004) of outlines (Sheets et al., 2006) from photo-graphs of the GSN (G�omez-Vald�es et al., 2012). A NikonE5000 camera was used for both samples, and the stand-ard distance between the subject and the lens was 0.8 m.
The coxal bones were photographed in a standardposition, with the camera fixed on a tripod in a specificposition relative to the bone. Each bone was placed on atable with the auricular surface facing upward. Thecoxal bone therefore rested on its dorsal side (touchpoints: 1) iliac crest, 2) the area of the posterior superioriliac spine, and 3) acetabular margin or=and ischial
tuberosity), with the pubis facing upward, and the pho-tographs were taken with the camera lens parallel tothe table. The axes of the camera lens were centered onthe maximum depth of the sciatic notch (Steyn et al.,2004; Pretorius et al., 2006; Gonzalez et al., 2009). Pho-tography of 20 coxal bones was repeated to evaluateintraobserver error which could be associated with coxalbone orientation.
Automatic segmentation of the notch curve from digi-tal photographs was the first important step in con-structing a digital curve representation. The GSN curvewas defined as the bone contour connecting two standar-dized landmarks (Novotn�y, 1981; Bruzek, 2002). Land-mark A was located at the tip of the piriform tubercle(Singh and Potturi, 1978; Kelley, 1979); in the case of itsabsence, the top of the posterior inferior iliac spine wasused (Novotn�y, 1981; Bruzek, 2002; Gonz�alez et al.,2007). Landmark B was positioned at the base of theischial spine. This structure is frequently broken off(Kelley, 1979) but its base is generally preserved (Fig. 1).
The automatic segmentation procedure used an edgedetection filter and shortest path algorithm (Martelli,1976; Barrett and Mortensen, 1997). The algorithmswere fine-tuned to one-pixel accuracy, which was suffi-cient considering the high resolution of the digitalimages. The result of the segmentation was a sequenceof 2D points that lay along the edge of the bone (bone–background interface). F5ffigk
i50, where f0 is identical toA and fk is identical to B. For data normalization, weused the Bookstein transformation (Dryden and Mardia,1998), that is, each curve was aligned (translated,scaled, and rotated) so that landmark A lay at the originand landmark B at [1, 0].
Six different curve approximation representationswere used (Fig. 1) to analyze the shape of the GSN.These approximations were built on the following basicprinciples.
1. Methods based on the use of three semilandmarks (A,B, C). A semilandmark is a procedurally generatedpoint along the curve that is regarded as a landmarkin the subsequent analysis (Sheets et al., 2006). InMethod A, semilandmarks were placed along thecurve in such a way that the angle formed by a semi-landmark, the center point between landmarks A andB and the adjacent semilandmark, was always con-stant. In Method B, semilandmarks were placed atconstant curvilinear increments along the curve,recording their locations. Method C worked similarlyto Method A but only recorded distances of the semi-landmarks from the center point.
2. Hierarchical curve decomposition was represented bya normal polyline method (Method D). This involvedmeasurement of perpendicular distances from a seriesof polyline segment center points to the curve up to aparticular level of a hierarchical subdivision (Fig. 1d)(inspired by the method of Guskov et al., 2000).
3. Two integral transformation-based approachesallowed us to work with geometric information in thefrequency domain. Method E was based on Fouriercoefficients and Method F on Legendre polynomials.The detailed methodology is described in Rieger andvan Vliet (2004).
Each method was applied to the entire set (229 speci-mens) multiple times in order to extract shape represen-tations with different numbers of values. The optimal
1Study of the UNAM collection was carried out following the estab-lished norms for items 4 and 5 from the third chapter of the Regula-tions for Safety and Coordination of Health Research of the NationalAutonomous University of Mexico Legislation (www.info4.juridicas.nam.mx/unijus).
SEXUAL DIMORPHISM OF THE GREATER SCIATIC NOTCH 559
American Journal of Physical Anthropology

dimensionality for each representation was determinedby finding the best sex determinations.
The evaluation of measurement error was twofold.First, we evaluated the error due to repeated bone imag-ing and landmark placement on curve representationvariables in a subsample of 20 bones following theapproach of Gonzalez et al. (2009), by calculating theintraclass correlation coefficient (ICC). Second, we eval-uated the effect of imprecision in the placement of land-marks A and B on sex classification, shifting themrandomly along the curve in each specimen. These shiftsfollowed a Gaussian distribution with a variance of 1%and 10% of the original curve length.
The discrimination potential of all the proposed curverepresentations was evaluated using an SVM learningmodel (Cortes and Vapnik, 1995; Izenman, 2008). SVMis equivalent to the more frequently used linear discrim-inant analysis (LDA) (Maroco et al., 2011).
The results of classification using SVM were expressedin the form of the success rate, as the percentage of cor-rectly classified specimens. To obtain objective resultsthat described the correct classification of the whole pop-ulation, cross-validation (leave-one-out) was applied.
The parameter space of a particular representationwas difficult to visualize directly because of its highdimensionality and dependence between individual vari-ables. The standard approach to analyzing multidimen-sional data visually with GM is to apply principalcomponent analysis (PCA) and visualize the scores ofthe first few principal components (PC). Specimens ofdifferent groups occupy different areas of PCA space ifthey differ in shape.
The statistical significance of differences between pop-ulations was tested using the parametric Hotelling’s T2
test and its nonparametric alternative (Campbell andCurran, 2009), with 10,000 permutations on bare repre-sentation data or their PCA scores, as needed. To testdifferences in population variances, the permutationvariant of the analog of Levene’s test which measuresmultivariate homogeneity of variance was used (Ander-son, 2006).
All methods used were computed using Morphome3cssoftware (version 2.0, Faculty of Mathematics and Physics,Charles University in Prague, Czech Republic, 2012) andthe R software package (version 2.15.2, R Foundation forStatistical Computing, Vienna, Austria, 2012).
RESULTS
The results of the most successful sex classificationswith respect to the number of semiland-marks=coefficients for all the proposed curve representa-tions are presented in Table 1. The classificationaccuracies of all six curve representations of the GSNevaluated in the pooled sample were comparable, withdifferences not exceeding 2% (from 90.4% to 92.1%). Thisdifference represented only four successfully classifiedindividuals out of the total number of 229 individuals.The highest accuracy was achieved using Methods Eand F (both approximately 92%), but this accuracy wasnot stable in relation to the number of coefficientsincluded. Semilandmark methods (A–C) were slightlyless accurate (approximately 90%), but they were muchless dependent on the number of landmarks.
Fig. 1. GSN homologous landmarks and six curve representations of the GSN shape. Landmark A is located on the tip of thepiriform tubercle (in the case of its absence, the top of the posterior inferior iliac spine); landmark B is at the base of the ischialspine. (a) Method A: semilandmarks form equal angles with the center point. (b) Method B: semilandmarks equidistant to thecurve arc. (c) Method C: distances to the center point of Method A semilandmarks. (d) Method D: normal polyline (subdivisionscheme). The recorded coefficient nij represents the length of jih normal on the ith level of subdivision. (e) Method E, Fourier coef-ficients of circular harmonics. GSN shape reconstruction using only five Fourier coefficients is shown. (f) Method F, Legendre coeffi-cients of circular harmonics. GSN shape reconstruction using only eight Legendre coefficients is shown.
560 J. VELEM�INSK�A ET AL.
American Journal of Physical Anthropology
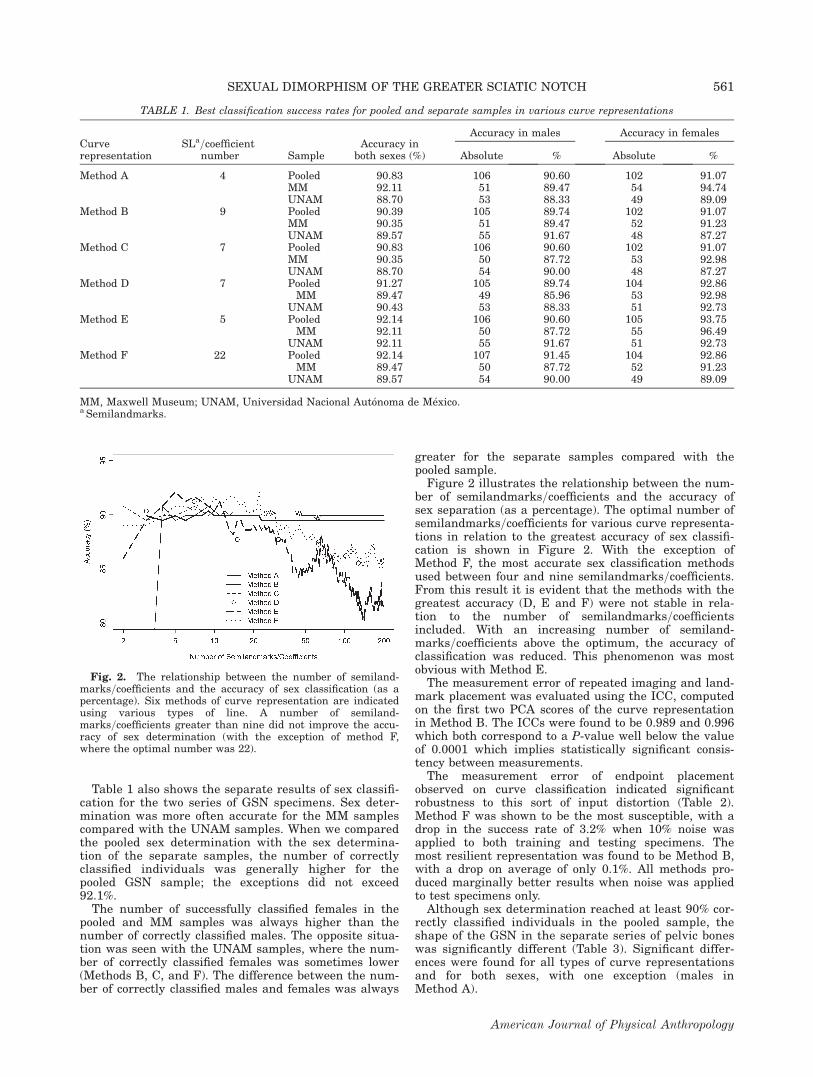
Table 1 also shows the separate results of sex classifi-cation for the two series of GSN specimens. Sex deter-mination was more often accurate for the MM samplescompared with the UNAM samples. When we comparedthe pooled sex determination with the sex determina-tion of the separate samples, the number of correctlyclassified individuals was generally higher for thepooled GSN sample; the exceptions did not exceed92.1%.
The number of successfully classified females in thepooled and MM samples was always higher than thenumber of correctly classified males. The opposite situa-tion was seen with the UNAM samples, where the num-ber of correctly classified females was sometimes lower(Methods B, C, and F). The difference between the num-ber of correctly classified males and females was always
greater for the separate samples compared with thepooled sample.
Figure 2 illustrates the relationship between the num-ber of semilandmarks=coefficients and the accuracy ofsex separation (as a percentage). The optimal number ofsemilandmarks=coefficients for various curve representa-tions in relation to the greatest accuracy of sex classifi-cation is shown in Figure 2. With the exception ofMethod F, the most accurate sex classification methodsused between four and nine semilandmarks=coefficients.From this result it is evident that the methods with thegreatest accuracy (D, E and F) were not stable in rela-tion to the number of semilandmarks=coefficientsincluded. With an increasing number of semiland-marks=coefficients above the optimum, the accuracy ofclassification was reduced. This phenomenon was mostobvious with Method E.
The measurement error of repeated imaging and land-mark placement was evaluated using the ICC, computedon the first two PCA scores of the curve representationin Method B. The ICCs were found to be 0.989 and 0.996which both correspond to a P-value well below the valueof 0.0001 which implies statistically significant consis-tency between measurements.
The measurement error of endpoint placementobserved on curve classification indicated significantrobustness to this sort of input distortion (Table 2).Method F was shown to be the most susceptible, with adrop in the success rate of 3.2% when 10% noise wasapplied to both training and testing specimens. Themost resilient representation was found to be Method B,with a drop on average of only 0.1%. All methods pro-duced marginally better results when noise was appliedto test specimens only.
Although sex determination reached at least 90% cor-rectly classified individuals in the pooled sample, theshape of the GSN in the separate series of pelvic boneswas significantly different (Table 3). Significant differ-ences were found for all types of curve representationsand for both sexes, with one exception (males inMethod A).
TABLE 1. Best classification success rates for pooled and separate samples in various curve representations
Curverepresentation
SLa=coefficientnumber Sample
Accuracy inboth sexes (%)
Accuracy in males Accuracy in females
Absolute % Absolute %
Method A 4 Pooled 90.83 106 90.60 102 91.07MM 92.11 51 89.47 54 94.74UNAM 88.70 53 88.33 49 89.09
Method B 9 Pooled 90.39 105 89.74 102 91.07MM 90.35 51 89.47 52 91.23UNAM 89.57 55 91.67 48 87.27
Method C 7 Pooled 90.83 106 90.60 102 91.07MM 90.35 50 87.72 53 92.98UNAM 88.70 54 90.00 48 87.27
Method D 7 Pooled 91.27 105 89.74 104 92.86MM 89.47 49 85.96 53 92.98
UNAM 90.43 53 88.33 51 92.73Method E 5 Pooled 92.14 106 90.60 105 93.75
MM 92.11 50 87.72 55 96.49UNAM 92.11 55 91.67 51 92.73
Method F 22 Pooled 92.14 107 91.45 104 92.86MM 89.47 50 87.72 52 91.23
UNAM 89.57 54 90.00 49 89.09
MM, Maxwell Museum; UNAM, Universidad Nacional Aut�onoma de M�exico.a Semilandmarks.
Fig. 2. The relationship between the number of semiland-marks=coefficients and the accuracy of sex classification (as apercentage). Six methods of curve representation are indicatedusing various types of line. A number of semiland-marks=coefficients greater than nine did not improve the accu-racy of sex determination (with the exception of method F,where the optimal number was 22).
SEXUAL DIMORPHISM OF THE GREATER SCIATIC NOTCH 561
American Journal of Physical Anthropology
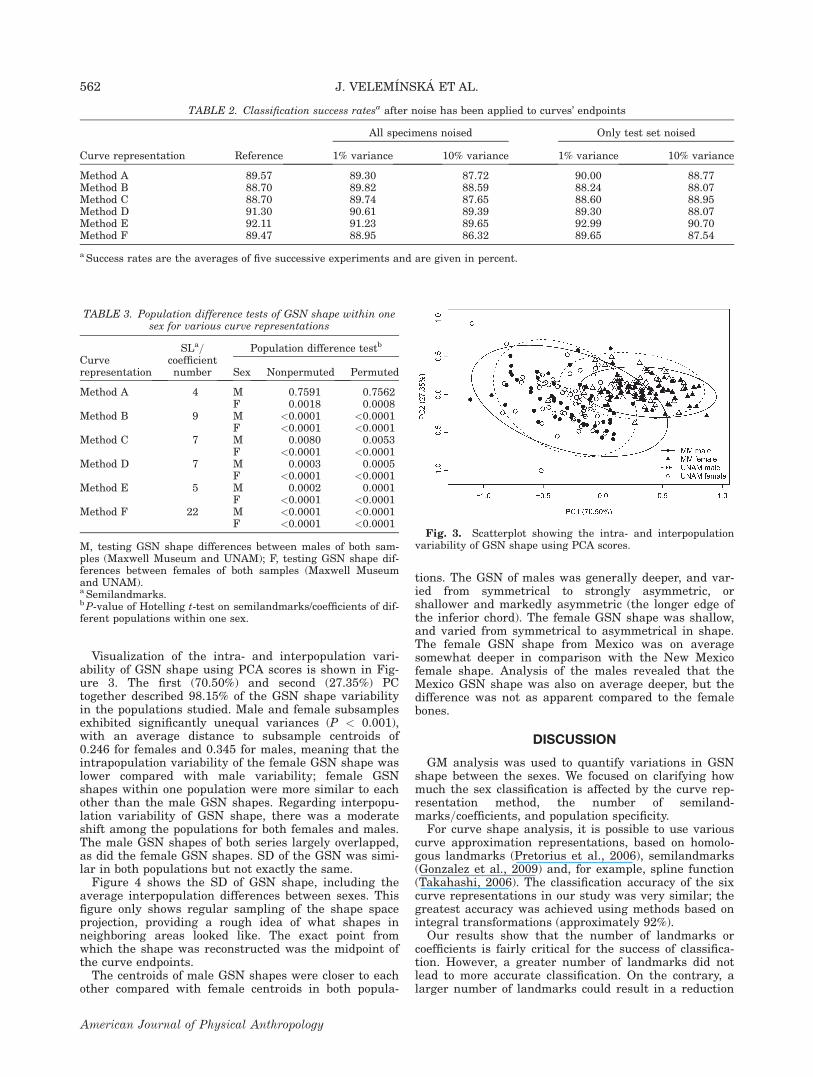
Visualization of the intra- and interpopulation vari-ability of GSN shape using PCA scores is shown in Fig-ure 3. The first (70.50%) and second (27.35%) PCtogether described 98.15% of the GSN shape variabilityin the populations studied. Male and female subsamplesexhibited significantly unequal variances (P < 0.001),with an average distance to subsample centroids of0.246 for females and 0.345 for males, meaning that theintrapopulation variability of the female GSN shape waslower compared with male variability; female GSNshapes within one population were more similar to eachother than the male GSN shapes. Regarding interpopu-lation variability of GSN shape, there was a moderateshift among the populations for both females and males.The male GSN shapes of both series largely overlapped,as did the female GSN shapes. SD of the GSN was simi-lar in both populations but not exactly the same.
Figure 4 shows the SD of GSN shape, including theaverage interpopulation differences between sexes. Thisfigure only shows regular sampling of the shape spaceprojection, providing a rough idea of what shapes inneighboring areas looked like. The exact point fromwhich the shape was reconstructed was the midpoint ofthe curve endpoints.
The centroids of male GSN shapes were closer to eachother compared with female centroids in both popula-
tions. The GSN of males was generally deeper, and var-ied from symmetrical to strongly asymmetric, orshallower and markedly asymmetric (the longer edge ofthe inferior chord). The female GSN shape was shallow,and varied from symmetrical to asymmetrical in shape.The female GSN shape from Mexico was on averagesomewhat deeper in comparison with the New Mexicofemale shape. Analysis of the males revealed that theMexico GSN shape was also on average deeper, but thedifference was not as apparent compared to the femalebones.
DISCUSSION
GM analysis was used to quantify variations in GSNshape between the sexes. We focused on clarifying howmuch the sex classification is affected by the curve rep-resentation method, the number of semiland-marks=coefficients, and population specificity.
For curve shape analysis, it is possible to use variouscurve approximation representations, based on homolo-gous landmarks (Pretorius et al., 2006), semilandmarks(Gonzalez et al., 2009) and, for example, spline function(Takahashi, 2006). The classification accuracy of the sixcurve representations in our study was very similar; thegreatest accuracy was achieved using methods based onintegral transformations (approximately 92%).
Our results show that the number of landmarks orcoefficients is fairly critical for the success of classifica-tion. However, a greater number of landmarks did notlead to more accurate classification. On the contrary, alarger number of landmarks could result in a reduction
TABLE 2. Classification success ratesa after noise has been applied to curves’ endpoints
Curve representation Reference
All specimens noised Only test set noised
1% variance 10% variance 1% variance 10% variance
Method A 89.57 89.30 87.72 90.00 88.77Method B 88.70 89.82 88.59 88.24 88.07Method C 88.70 89.74 87.65 88.60 88.95Method D 91.30 90.61 89.39 89.30 88.07Method E 92.11 91.23 89.65 92.99 90.70Method F 89.47 88.95 86.32 89.65 87.54
a Success rates are the averages of five successive experiments and are given in percent.
TABLE 3. Population difference tests of GSN shape within onesex for various curve representations
Curverepresentation
SLa=coefficientnumber
Population difference testb
Sex Nonpermuted Permuted
Method A 4 M 0.7591 0.7562F 0.0018 0.0008
Method B 9 M <0.0001 <0.0001F <0.0001 <0.0001
Method C 7 M 0.0080 0.0053F <0.0001 <0.0001
Method D 7 M 0.0003 0.0005F <0.0001 <0.0001
Method E 5 M 0.0002 0.0001F <0.0001 <0.0001
Method F 22 M <0.0001 <0.0001F <0.0001 <0.0001
M, testing GSN shape differences between males of both sam-ples (Maxwell Museum and UNAM); F, testing GSN shape dif-ferences between females of both samples (Maxwell Museumand UNAM).a Semilandmarks.b P-value of Hotelling t-test on semilandmarks/coefficients of dif-ferent populations within one sex.
Fig. 3. Scatterplot showing the intra- and interpopulationvariability of GSN shape using PCA scores.
562 J. VELEM�INSK�A ET AL.
American Journal of Physical Anthropology

in the success of sex determination (Fig. 2). Methodswith semilandmarks were less dependent on the numberincluded. In a broader sense, sampling effects may playa very important role, particularly if the sample sizesare small relative to the number of variables (van Varkand Schaafsma, 1992).
In order to compare the shapes of GSN arcs effectively,a Bookstein transformation was preferred over the morepopular Procrustes analysis. It seems that this choice isone of the major reasons for the better results shownhere compared to those obtained in our previous study(G�omez-Vald�es et al., 2012). Another reason, followingthe recommendation of Mitteroecker and Bookstein(2011), was the use of SVM with a radial basis kernelinstead of the suggested quadratic discriminant analysis(QDA). A radial basis kernel allows very complex spacepartitioning, and SVM enforces generalization byemploying a maximum margin criterion so that over-fitting is avoided.
The error measurement analysis of repeated imagingrevealed high accuracy with respect to extracted fea-tures, which is consistent with Gonz�alez et al. (2009).The error in measurement caused by initial positioningof marginal GSN points influences the success of classifi-cation (Biwasaka et al., 2012). In our study, interferenceof the fluctuation of landmark A and B localization withclassification was tested by modeling endpoint positionnoise. Our methods seemed to be resilient in this sense,as the reduction of classification success varied onlyfrom 0.1% to 3.2% in the case of the addition of a maxi-mum of 10% noise.
Much more important was the explanation for thebehavior of the dataset in terms of classification robust-ness. The pooled sample of the two populations led to abetter classification or homogeneous accuracy than theseparate samples. It appears that increasing the
variability caused an increase in the robustness ofclassification. A similar effect was observed by Murailet al. (2005), who found a high success rate for sex deter-mination[0] in a pooled multiethnic sample.
Both populations used in this study, Hispanic andEuroamerican, live geographically close to each otherbut at the same time are biologically different. In theUnited States, the Hispanic population represents thesecond largest population group; the majority of His-panics in the United States originate from Mexico, andindividuals originating from Mexico, Central America,and Latin America derive genes primarily from Spanishand Native American sources (Guardado-Estrada et al.,2008; Spradley et al., 2008; Tise et al., 2013). Accordingto Spradley et al. (2008), the use of Euroamerican sexingcriteria gives poor results when applied to Hispanics.Nevertheless, some studies indicate that pelvic SD fol-lows a general pattern for all human populations, andthis is reflected in the nonspecificity of the methods forsex determination (Murail et al., 2005; Steyn and Patri-quin, 2009).
The success of classification for the pooled set raisesthe question of population specificity in classification. Itis possible that some differences remain even after sizenormalization. According to Bruzek (2002), one morpho-functional pelvic complex (such as the GSN) can be func-tionally compensated for by higher levels of dimorphismin other morphofunctional pelvic complexes (such asischiopubic proportions). This fact could provide anexplanation for the significant but slight differences inGSN depth of our samples.
Walker pointed out that both males and females dyingat younger ages (before age 50) tend to have a more fem-inine morphology than older people, with the differencebeing more strongly apparent in males. Our results arepartly in concordance with Walker (2005) because 86%of misclassified (more feminine) males were youngerthan 50 years. Significant GSN shape differencesbetween population samples are probably not related toaverage age. Although the average age of individualsfrom Mexico was about 14 years younger, their GSNshape was on average slightly deeper compared with theNew Mexico individuals of both sexes.
Another finding was that male GSN variability wasgreater compared with female variability because femalepelvic morphology is known to be less variable than thatof males (Tague, 1989) due to female reproductive func-tion. In our study, males were misclassified more oftenthan females in the pooled and MM samples, which is inagreement with many previous studies (Meindl et al.,1985; Tague, 1989; Takahashi, 2006). The classificationof females was better in 83% of the evaluated modelsthan it was for males (in 100% of the models for pooledsamples).
A fundamental aspect of determining the sex of skele-tal remains is the ability to apply a technique developedsuccessfully for one population to another populationand achieve comparable levels of accuracy (Wilson et al.,2011). When the GSN shape was tested, GM provided amore robust sex classification than other methods (Pre-torius et al., 2006; Gonzalez et al., 2009). Although ourfindings were obtained using optimal parameters ofcurve representation, suitable methodology, and two dif-ferent population samples, our results should be testedusing other identified skeletal collections, as their accu-racy could be influenced by the various degrees of SDrepresented within each population.
Fig. 4. Visualization of the SD of GSN shape in relation tointra- and interpopulation variability using PCA scores. Inorder to visualize shapes corresponding to specimens occupyingcertain areas of this projection of the shape space, we usedMethod B parameterized by 32 landmarks, which gave usdetailed shapes of the GSN curve according to an arbitraryposition in the shape space projection. The symbols are takenfrom Figure 3; the gray color corresponds to individuals, thedark color indicates the position of the average male and femaleGSN shapes. Increased characteristic differences betweenfemales can be seen on the opposite ends of an elongated imagi-nary diagonal line going through the centroids of both femalepopulations.
SEXUAL DIMORPHISM OF THE GREATER SCIATIC NOTCH 563
American Journal of Physical Anthropology
CONCLUSIONS
GM analysis showed that sex-linked shape variationin the human GSN allows a more consistent and accu-rate rate of male and female classification than tradi-tional morphometrics. The success of classification isinfluenced by the number of semilandmarks or coeffi-cients and is only slightly affected by GSN marginalpoint positions. For the semilandmark-based methods,the optimal number of semilandmarks varied from fourto nine; the highest degree of accuracy (92%) wasachieved for pooled samples of subjects of Euroamericanand Hispanic ancestry using an integral transformationapproach based on Fourier coefficients (5 coefficients) orLegendre polynomials (22 coefficients).
These results suggest that sex determination based onthe shape of the GSN is population nonspecific. How-ever, the classification rate is lower using the shape ofthe GSN rather than the pelvic bone as a whole becausethe overall SD is the sum of its parts. Misclassificationis usually more frequent in males because the femaleGSN is less variable and more homogeneous as a resultof the reproductive pressures on pelvic morphology.
ACKNOWLEDGMENTS
The authors thank Heather Joy Hecht Edgar, Curator ofHuman Osteology of the Maxwell Museum of Anthropol-ogy (University of New Mexico), for access to the skeletalcollection. Christopher Ruff, the associate editor, and twoanonymous reviewers provided very helpful comments forimprovements to the manuscript. The authors thankTom�a�s Z�amecn�ık for participating in implementation ofthe methods. We thank Compuscript Ltd for the Englishrevision of the manuscript.
LITERATURE CITED
Akpan TB, Igiri AO, Singh SP. 1998. Greater sciatic notch insex differentiation in Nigerian skeletal samples. Afr J MedMed Sci 27:43–46.
Anderson MJ. 2006. Distance-based tests for homogeneity ofmultivariate dispersions. Biometrics 62:245–253.
Barrett WA, Mortensen EN. 1997. Interactive live-wire bound-ary extraction. Med Image Analysis 1:331–341.
Bass WM. 1995. Human osteology: a laboratory and field man-ual of the human skeleton. Columbia: Missouri ArchaeologicalSociety.
Biwasaka H, Aoki Y, Sato K, Tanijiri T, Fujita S, Dewa K,Yoshioka K, Tomabechi M. 2012. Analyses of sexual dimor-phism of reconstructed pelvic computed tomography imagesof contemporary Japanese using curvature of the greater sci-atic notch, pubic arch and greater pelvis. Forensic Sci Int219:288.e1–e8.
Bruzek J. 2002. A method for visual determination of sex, usingthe human hip bone. Am J Phys Anthropol 117:157–168.
Buikstra JE, Ubelaker DH. 1994. Standards for data collectionfrom human skeletal remains. Fayetteville: Arkansas Archeo-logical Survey.
Campbell GP, Curran JM. 2009. The interpretation of elementalcomposition measurements from forensic glass evidence III.Sci Justice 49:2–7.
Cortes C, Vapnik V. 1995. Support vector networks. Mach Learn20:273–297.
Dryden IL, Mardia KV. 1998. Statistical shape analysis. Chi-chester; New York: John Wiley & Sons.
Ferembach J, Schwidetzky I, Stloukal M. 1980. Recommenda-tions for age and sex diagnoses of skeletons. J Hum Evol 9:517–549.
G�omez-Vald�es JA, Quinto-S�anchez M, Men�endez Garmendia A,Veleminska J, S�anchez-Mejorada G, Bruzek J. 2012.
Comparison of methods to determine sex by evaluating thegreater sciatic notch: visual, angular and geometric morpho-metrics. Forensic Sci Int 221:156.e1–e7.
Gonz�alez PN, Bernal V, Ivan Perez S, Barrientos G. 2007. Anal-ysis of dimorphic structures of the human pelvis: its implica-tions for sex estimation in samples without referencecollections. J Archaeol Sci 34:1720–1730.
Gonzalez PN, Bernal V, Perez SI. 2009. Geometric morphomet-ric approach to sex estimation of human pelvis. Forensic SciInt 189:68–74.
Guardado-Estrada M, Queipo G, Meraz-R�ıos M, Berumen-Campos J. 2008. Diversidad gen�etica en la poblaci�on mexi-cana: utilizaci�on de marcadores de ADN. Rev Med Hosp GenMex 71:162–174.
Guskov I, Vidimce K, Sweldens W, Schr€oder P. 2000. Normalmeshes. In: Proceedings of the 27th annual conference oncomputer graphics and interactive techniques. New York:ACM Press. p 95–102.
Hager LD. 1996. Sex differences in the sciatic notch of greatapes and modern humans. Am J Phys Anthropol 99:287–300.
Izenman AJ. 2008. Modern multivariate statistical techniquesregression, classification, and manifold learning. New York:Springer.
Kelley MA. 1979. Parturition and pelvic changes. Am J PhysAnthropol 51:541–546.
Komar DA, Grivas C. 2008. Manufactured populations: what docontemporary reference skeletal collections represent? A com-parative study using the Maxwell Museum documented col-lection. Am J Phys Anthropol 137:224–233.
MacLaughlin SM, Bruce MF. 1985. A simple univariate tech-nique for determining sex from fragmentary femora: its appli-cation to a Scottish short cist population. Am J PhysAnthropol 67:413–417.
Maroco J, Silva D, Rodrigues A, Guerreiro M, Santana I, deMendonca A. 2011. Data mining methods in the prediction ofdementia: a real-data comparison of the accuracy, sensitivityand specificity of linear discriminant analysis, logistic regres-sion, neural networks, support vector machines, classificationtrees and random forests. BMC Res Notes 4:299.
Martelli A. 1976. An application of heuristic search methods toedge and contour detection. Commun ACM 19:73–83.
Meindl RS, Lovejoy CO, Mensforth RP, Don Carlos L. 1985.Accuracy and direction of error in the sexing of the skeleton:implications for paleodemography. Am J Phys Anthropol 68:79–85.
Mitteroecker P, Bookstein F. 2011. Linear discrimination, ordi-nation, and the visualization of selection gradients in modernmorphometrics. Evol Biol 38:100–114.
Murail P, Bruzek J, Hou€et F, Cunha E. 2005. DSP: a tool forprobabilistic sex diagnosis using worldwide variability in hip-bone measurements. Bull Mem Soc Anthropol Par 17:167–176.
Novotn�y V. 1981. Pohlavn�ı rozdily a identifikace pohlavip�anevn�ı kosti [Sex differences and identification of sex in pel-vic bone]. Ph.D. Thesis. Brno: Purkyn�e Univerzity.
Novotn�y V. 1986. Sex determination of the pelvic bone: a systemapproach. Anthropologie 24:197–206.
Pretorius E, Steyn M, Scholtz Y. 2006. Investigation into theusability of geometric morphometric analysis in assessment ofsexual dimorphism. Am J Phys Anthropol 129:64–70.
Rieger B, van Vliet LJ. 2004. A systematic approach to nD ori-entation representation. Image Vision Comput 22:453–459.
Rogers T, Saunders S. 1994. Accuracy of sex determinationusing morphological traits of the human pelvis. J Forensic Sci39:1047–1056.
Ruff C. 2010. Body size and body shape in early hominins—implications of the Gona pelvis. J Hum Evol 58:166–178.
Sheets HD, Covino KM, Panasiewicz JM, Morris SR. 2006.Comparison of geometric morphometric outline methods inthe discrimination of age-related differences in feather shape.Front Zool 3:15.
Simpson SW, Quade J, Levin NE, Butler R, Dupont-Nivet G,Everett M, Semaw S. 2008. A female Homo erectus pelvisfrom Gona, Ethiopia. Science 322:1089–1092.
564 J. VELEM�INSK�A ET AL.
American Journal of Physical Anthropology
Singh S, Potturi BR. 1978. Greater sciatic notch in sex determi-nation. J Anat 125:619–624.
Spradley MK, Jantz RL, Robinson A, Peccerelli F. 2008. Demo-graphic change and forensic identification: problems in metricidentification of Hispanic skeletons. J Forensic Sci 53:21–28.
Steyn M, Iscan MY. 2008. Metric sex determination from thepelvis in modern Greeks. Forensic Sci Int 179:86.e1–e6.
Steyn M, Patriquin ML. 2009. Osteometric sex determinationfrom the pelvis—does population specificity matter? ForensicSci Int 191:113.e1–e5.
Steyn M, Pretorius E, Hutten L. 2004. Geometric morphometricanalysis of the greater sciatic notch in South Africans. Homo54:197–206.
Tague RG. 1989. Variation in pelvic size between males andfemales. Am J Phys Anthropol 80:59–71.
Takahashi H. 2006. Curvature of the greater sciatic notch insexing the human pelvis. Anthropol Sci 114:187–191.
Tise ML, Spradley MK, Anderson BE. 2013. Postcranial sexestimation of individuals considered Hispanic. J Forensic Sci58 (Suppl 1):S9–S14.
van Vark G, Schaafsma W. 1992. Advances in the quantitativeanalysis of skeletal morphology. In: Saunders SR, KatzenbergMA, editors. Skeletal biology of past peoples: research meth-ods. New York: Wiley-Liss. p 225–257.
Walker PL. 2005. Greater sciatic notch morphology: Sex, age,and population differences. Am J Phys Anthropol 127:385–391.
Washburn SL. 1948. Sex differences in the pubic bone. Am JPhys Anthropol 6:199–207.
Wilson LAB, Cardoso HFV, Humphrey LT. 2011. On the reliabil-ity of a geometric morphometric approach to sex determina-tion: a blind test of six criteria of the juvenile ilium. ForensicSci Int 206:35–42.
Zelditch M, Swiderski DL, Sheets HD. 2004. Geometric morpho-metrics for biologists: a primer. London: Elsevier AcademicPress.
SEXUAL DIMORPHISM OF THE GREATER SCIATIC NOTCH 565
American Journal of Physical Anthropology