Relationships between diffuse CO 2 emissions and volcanic activity on the island of Vulcano (Aeolian...
10
Abstract Measurements of CO 2 flux from the ground were periodically carried out on the island of Vulcano (Aeolian Islands, Italy) between 1984 and 1994. Three high-flux areas were identified at the foot of the volcanic cone (La Fossa), either inside or very close to the main village. Effect of the choice of the sampling grid was eval- uated. A different sampling grid resulted in similar distri- bution patterns, but with different CO 2 fluxes. Therefore, the absolute estimate of the total flux from the investigat- ed area includes a large degree of uncertainty, but repeated measurements with permanent sampling sites are accurate and can detect small changes. No correlation of the flux with atmospheric parameters was found at sites with high fluxes. Some periods characterized by high CO 2 fluxes were observed, and a close correlation was found between the gas emissions from the ground and other geochemical and geophysical parameters such as temperature, chemical composition, steam, and SO 2 flux from fumaroles, seismic energy release, and ground deformations. The results show that major temporal variations of diffuse CO 2 flux are related to variations in volcanic activity. Keywords CO 2 · Flux measurements · Gas emissions · Soil gas · Volcanic activity · Vulcano Introduction Diffuse CO 2 emission from the ground is a common phe- nomenon that is found over large areas of active volcanoes (Carbonnelle et al. 1985; Baubron et al. 1990; Allard et al. 1991; Allard 1992; Chiodini et al. 1996, 1998). The CO 2 might be derived from a degassing magmatic body that has been saturated or over-saturated with carbon dioxide and/or by the thermo-metamorphism of carbon- ates. Therefore, any change of diffuse gas emission rate in space and time should reflect changes in the state of the feeding system and could be a useful indicator of the evolution of volcanic activity (Badalamenti et al. 1988, 1991; Baubron et al. 1991; Sorey et al. 1998). Systematic measurements of CO 2 flux from the ground were carried out from 1984 on the island of Vulcano (Aeolian Islands, Italy) in order to explore the relationship between gas emissions from the ground and volcanic ac- tivity. La Fossa cone (391 m a.s.l.) is the currently active crater on the island of Vulcano and it has formed inside the Caldera della Fossa floor over the last 6,000 years (Fig. 1). Several eruptions of this volcano have been char- acterized by frequent transitions from phreatomagmatic to magmatic activity (De Astis et al. 1997; Dellino and La Volpe 1997). Since the last eruption, lasting from 1888–1890, the volcanic system has been characterized by fumarolic activity on the northern rim of La Fossa cone and at its base along the beach on the north-east of the is- land. Temperature and the discharge flux of fumaroles, the chemical and isotopic composition of underground waters, seismic energy release and ground deformations show time variations (Barberi et al. 1991). In this study, we investigated two major aspects of diffuse CO 2 degassing. The first aim of the study was to evaluate the influence of sampling grid geometry and atmospheric conditions on the estimate of the CO 2 flux from the ground. The second aspect addressed the corre- lation between variations in CO 2 flux from the ground and other geochemical and geophysical parameters related to the volcanic activity on Vulcano. Measurement method and area under investigation Measurements of CO 2 fluxes from the ground were carried out using the Gurrieri and Valenza (1988) method; Editorial responsibility: H. Shinohara I.S. Diliberto · S. Gurrieri ( ✉ ) Istituto Nazionale di Geofisica e Vulcanologia, Sezione di Palermo, V. Ugo La Malfa 153-90146 Palermo, Italy e-mail: [email protected] Fax: +39-91-6809449 M. Valenza Dipartimento di Chimica e Fisica della Terra ed Applicazioni, V. Archirafi, 36 Palermo, Italy Bull Volcanol (2002) 64:219–228 DOI 10.1007/s00445-001-0198-6 RESEARCH ARTICLE Iole Serena Diliberto · Sergio Gurrieri Mariano Valenza Relationships between diffuse CO 2 emissions and volcanic activity on the island of Vulcano (Aeolian Islands, Italy) during the period 1984–1994 Received: 6 January 2000 / Accepted: 4 December 2001 / Published online: 13 February 2002 © Springer-Verlag 2002
-
Upload
independent -
Category
Documents
-
view
2 -
download
0
Transcript of Relationships between diffuse CO 2 emissions and volcanic activity on the island of Vulcano (Aeolian...

Abstract Measurements of CO2 flux from the groundwere periodically carried out on the island of Vulcano(Aeolian Islands, Italy) between 1984 and 1994. Threehigh-flux areas were identified at the foot of the volcaniccone (La Fossa), either inside or very close to the mainvillage. Effect of the choice of the sampling grid was eval-uated. A different sampling grid resulted in similar distri-bution patterns, but with different CO2 fluxes. Therefore,the absolute estimate of the total flux from the investigat-ed area includes a large degree of uncertainty, but repeatedmeasurements with permanent sampling sites are accurateand can detect small changes. No correlation of the fluxwith atmospheric parameters was found at sites with highfluxes. Some periods characterized by high CO2 fluxeswere observed, and a close correlation was found betweenthe gas emissions from the ground and other geochemicaland geophysical parameters such as temperature, chemicalcomposition, steam, and SO2 flux from fumaroles, seismicenergy release, and ground deformations. The resultsshow that major temporal variations of diffuse CO2 fluxare related to variations in volcanic activity.
Keywords CO2 · Flux measurements · Gas emissions ·Soil gas · Volcanic activity · Vulcano
Introduction
Diffuse CO2 emission from the ground is a common phe-nomenon that is found over large areas of active volcanoes(Carbonnelle et al. 1985; Baubron et al. 1990; Allard et
al. 1991; Allard 1992; Chiodini et al. 1996, 1998). TheCO2 might be derived from a degassing magmatic bodythat has been saturated or over-saturated with carbondioxide and/or by the thermo-metamorphism of carbon-ates. Therefore, any change of diffuse gas emission ratein space and time should reflect changes in the state ofthe feeding system and could be a useful indicator of theevolution of volcanic activity (Badalamenti et al. 1988,1991; Baubron et al. 1991; Sorey et al. 1998).
Systematic measurements of CO2 flux from the groundwere carried out from 1984 on the island of Vulcano (Aeolian Islands, Italy) in order to explore the relationshipbetween gas emissions from the ground and volcanic ac-tivity. La Fossa cone (391 m a.s.l.) is the currently activecrater on the island of Vulcano and it has formed insidethe Caldera della Fossa floor over the last 6,000 years(Fig. 1). Several eruptions of this volcano have been char-acterized by frequent transitions from phreatomagmatic tomagmatic activity (De Astis et al. 1997; Dellino and LaVolpe 1997). Since the last eruption, lasting from1888–1890, the volcanic system has been characterized byfumarolic activity on the northern rim of La Fossa coneand at its base along the beach on the north-east of the is-land. Temperature and the discharge flux of fumaroles, thechemical and isotopic composition of underground waters,seismic energy release and ground deformations showtime variations (Barberi et al. 1991).
In this study, we investigated two major aspects ofdiffuse CO2 degassing. The first aim of the study was toevaluate the influence of sampling grid geometry andatmospheric conditions on the estimate of the CO2 fluxfrom the ground. The second aspect addressed the corre-lation between variations in CO2 flux from the groundand other geochemical and geophysical parameters relatedto the volcanic activity on Vulcano.
Measurement method and area under investigation
Measurements of CO2 fluxes from the ground werecarried out using the Gurrieri and Valenza (1988) method;
Editorial responsibility: H. Shinohara
I.S. Diliberto · S. Gurrieri (✉ )Istituto Nazionale di Geofisica e Vulcanologia,Sezione di Palermo, V. Ugo La Malfa 153-90146 Palermo, Italye-mail: [email protected]: +39-91-6809449
M. ValenzaDipartimento di Chimica e Fisica della Terra ed Applicazioni,V. Archirafi, 36 Palermo, Italy
Bull Volcanol (2002) 64:219–228DOI 10.1007/s00445-001-0198-6
R E S E A R C H A RT I C L E
Iole Serena Diliberto · Sergio GurrieriMariano Valenza
Relationships between diffuse CO2 emissionsand volcanic activity on the island of Vulcano (Aeolian Islands, Italy)during the period 1984–1994Received: 6 January 2000 / Accepted: 4 December 2001 / Published online: 13 February 2002© Springer-Verlag 2002

this measures the CO2 concentration (Cd) in a mixture ofair and soil gases with the device shown in Fig. 2. Pump-ing at a constant flow rate, the CO2 concentration of themixture inside the probe reaches a constant value, whichis proportional to CO2 flux from the ground. Calibrationof the method was performed in the laboratory withapparatus that simulates a natural degassing system withknown soil conditions (e.g. porosity and permeability)and known CO2 flux (Fig. 3). When a steady state ofCO2 flux was reached, the Cd was measured.
These experiments were conducted both with fine-grained silicic sands, which were collected from theisland of Vulcano, and with coarse-grained carbonatesands, with permeabilities of 24 and 32 darcy, respec-tively. The Cd values were proportional to the CO2 fluxes(Fig. 4) following the relationship of φ=k×Cd, where φ isthe flux of CO2 (cm s–1), Cd is the concentration of CO2(%vol) and k is a constant, which depends on the geometryand depth of the probe, flow rate of the pump and soilpermeability. The estimated k was 3.9×10⁻⁴ for the givensets of parameters (Fig. 4). The difference in the perme-ability of 24 and 32 darcy has a negligible effect on theconstant k. Constant k could be different at permeabilitiesthat differ from the above range. This fact could be asource of potential error, which is difficult to evaluate
because of the lack of permeability measurements atsome sites of the explored area. However, this errormight not alter our discussion in this study because soilpermeability at most of the high-flux areas, such as A, Band C (Fig. 1), ranges from 25 to 40 darcy, which is
220
Fig. 1 Distribution of the sites for measuring CO2 flux. The perma-nent sampling sites are shown by solid circles with a site number.The triangles refer to the temporary sites (see text). Areas A, B,and C show the distribution of the high flux areas (see text)
Fig. 2 The system used to measure CO2 flux from soils inVulcano (Gurrieri and Valenza 1988). A probe with a 2.2-cmdiameter was inserted into the ground at a depth of 45 cm. a Tubefor air inlet; b filter; c pump; d infrared spectrophotometer; e holefor soil–gas inlet
Fig. 3 Apparatus used to calibrate the method for measuring CO2flux from soil

similar to our laboratory experiments (Gurrieri et al.2000). Furthermore, soil permeability is almost constantat each site; therefore, the uncertainty in permeabilitydoes not affect the evaluation of temporal variations inCO2 fluxes. Large contrasts in soil permeability couldaffect the distribution of CO2 flux from the ground. Astudy of soil permeability in the investigated area is stillin progress, but the preliminary results suggest that thespatial distribution of CO2 flux does not show any corre-lation with soil permeability (Gurrieri et al. 2000; Camardaet al. 2000, personal communication).
The CO2 flux measurements were repeated ten timeson 27 December 1994 at four sites, 17, 23, 2 and 4(Table 1), in order to evaluate the reproducibility of the
method. In some cases the probe was left inserted in thesoil during the repeated measurements and in others theprobe was extracted and reinserted in the soil beforeeach measurement (Table 1). No difference was ob-served between the two cases. Larger errors were foundat sites with lower fluxes and these might be attributed tothe low resolution of the IR spectrophotometer in thelow concentration range.
Field measurements on Vulcano were carried outaround the western foot of La Fossa cone (Fig. 1). Thisarea is located inside the Caldera della Fossa and itincludes the main village on the island of Vulcano. Thearea is covered by pyroclastics from La Fossa cone andpartially by alluvium and beach deposits. Intense CO2emissions emanating from the ground and boreholeshave been observed over the last 20 years. For example,withered vegetation and dead animals were found in anarea of more than 0.5 km2, which included area B, in1984 (Fig. 1; Badalamenti et al. 1984, 1988). As manytourists (up to 10,000) visit this area during summer, thegas hazard in the village of Vulcano Porto is of majorconcern.
Between 1989 and 1994, 79 surveys were carried outin order to locate anomalous areas of CO2 emissions andto detect CO2 flux variations with time. The flux wasmeasured at 51 sites, located at intervals of 200 m(Fig. 1). Measurements were usually conducted once amonth and the sampling frequency was increased to oncea week (from July to September 1994) or twice a day(5–11 July 1994) for short periods.
Before investigating the relationships between timevariations in gas emissions from the ground and volcanicactivity, we evaluated the effects of atmospheric varia-tions and the selection and density of the sampling siteson the flux measurements. The mean CO2 fluxes werecalculated for each survey and the mean value was con-sidered to be a more representative parameter than thesingle values measured at each site. The mean filters therandom variations that can be caused by the characteristicsand the conditions of an individual location. We shouldfollow the advice of Klusmann (1993, p. 124), “the userof surface geochemistry must keep in mind that generalpatterns are of primary importance. The user should notfocus on individual sample locations”.
Sampling site and aerial distribution of anomalies
Significant errors in the flux evaluation can be caused bythe selection and density of the sampling sites. In general,a necessary condition for determining the characteristicsof anomalies (such as shape, intensity and mean value) isthat the sampling interval is one-order of magnitude lessthan the size of the anomaly (Davis 1973). However,these intervals cannot be decided without informationabout the size of the anomalous areas. Therefore, thereliability of the location of the anomalous area wastested by comparing the results obtained from two differentsets of sampling sites. The sampling sites were similarly
221
Fig. 4 Relationships between CO2 flux (φCO2) and the dynamicconcentration of CO2 (Cd). The open circles refer to the resultswith pyroclastic sand (24 darcy) and the triangles to those withcarbonate sand (32 darcy). The regression line was calculated withdata from both pyroclastic and carbonate sand
Table 1 Results of the repeated measurements of the CO2 flux(cm s–1) at sites 17, 23, 2, and 4. All measurements wereperformed in a single day (27 December 1994). The measure-ments were repeated ten times for each site. Some statisticalparameters are also shown. The error was calculated as:
. The parameter CV is the coefficientof variation that is a dimensionless measure of dispersion:CV=standard deviation/mean
Sites 23 17 2 4
8.19×10⁻⁵a 1.76×10⁻⁵a 2.73×10⁻⁴a 4.68×10⁻⁴a
7.80×10⁻⁵ 1.56×10⁻⁵ 2.83×10⁻⁴ 4.78×10⁻⁴
8.19×10⁻⁵ 1.56×10⁻⁵ 2.83×10⁻⁴ 4.78×10⁻⁴
7.80×10⁻⁵ 1.56×10⁻⁵ 2.83×10⁻⁴ 4.88×10⁻⁴
8.19×10⁻⁵ 1.76×10⁻⁵ 2.73×10⁻⁴ 4.88×10⁻⁴
8.19×10⁻⁵ 1.56×10⁻⁵ 2.83×10⁻⁴ 4.68×10⁻⁴
8.00×10⁻⁵ 1.76×10⁻⁵ 2.73×10⁻⁴ 4.88×10⁻⁴
8.19×10⁻⁵ 1.56×10⁻⁵ 2.73×10⁻⁴ 4.88×10⁻⁴
7.80×10⁻⁵ 1.56×10⁻⁵a 2.83×10⁻⁴ 4.88×10⁻⁴
8.00×10⁻⁵a 1.56×10⁻⁵a 2.83×10⁻⁴a 4.78×10⁻⁴a
Range 3.90×10⁻⁶ 1.95×10⁻⁶ 9.75×10⁻⁶ 1.95×10⁻⁵
CV 0.02 0.06 0.02 0.02Mean 8.03×10⁻⁵ 1.62×10⁻⁵ 2.79×10⁻⁴ 4.81×10⁻⁴
Standard 1.79×10⁻⁶ 9.42×10⁻⁷ 5.03×10⁻⁶ 8.03×10⁻⁶
DeviationError (%) 4.9 12.0 3.5 4.1
a Measurements with the probe extracted and reinserted in the soil(see text)

distributed with the same density, but one set wasdisplaced about 100 m north-west of the other (Fig. 1).The CO2 flux measurements for the comparison were per-formed within a few hours in order to minimize potentialvariations in weather conditions and/or volcanic activity.This was possible because each measurement requiresless than 3 min. Data obtained from the two sets ofsampling sites highlighted the same anomalous areas(primarily A and C in Fig. 1). However, the comparativemeasurements resulted in different mean CO2 fluxes.The mean flux estimated with the temporary sites(3.7×10⁻⁴ cm s–1) was about five times higher thanthe value obtained with permanent sampling sites(0.8×10⁻⁴ cm s–1)(5). This result suggests that only theorder of magnitude of the mean flux is significant withthis sampling density. In contrast, repeated measurementsat fixed sites show that the error inherent to the method issmall (Table 1, Fig. 6a). Therefore, changes in degassingactivity can be detected with a small error by measuringthe CO2 flux at the fixed sets of sampling sites.
Atmospheric effects on gas emissionsfrom the ground
Because gas emissions from the ground can be influ-enced by atmospheric conditions (Fukuda et al. 1955;Hinkle 1990; Klusmann 1993), an analysis of CO2 fluxdata was performed to evaluate the influence of atmo-spheric parameters. A direct comparison between CO2soil fluxes and atmospheric pressure was carried out.The mean fluxes of CO2 were relatively constant be-tween 5 and 10 July 1994, whereas atmospheric pressure
increased with time (Fig. 6). The linear correlation coeffi-cient between the atmospheric pressure and mean CO2flux was low (r=0.37). The correlation between the CO2flux values and the atmospheric pressure was also smallat individual sites.
222
Fig. 5a,b Contour maps of themeasured CO2 flux. The num-bers show decimal logarithmsof the CO2 flux (cm s–1). a Thepermanent measurement sites(circles in Fig. 1); b the tempo-rary sites (triangles in Fig. 1)
Fig. 6 a Variation of the mean CO2 flux values measured from5 to 10 July 1994. b Variation of the atmospheric pressure duringthe same period

In order to investigate the effect of rainfall, we com-pared the variations in CO2 flux measured at each sitewith rainfall, and no correlation was found (Fig. 7). Thiswas also confirmed by the low linear correlation coeffi-cients between monthly rainfall and mean CO2 flux andbetween monthly rainfall and CO2 flux measured at eachsite (Table 2). This result also agrees with previous studieson the effects of rainfall on soil gas emissions. Hinkle(1990) and Werner and Brantley (2000) noted that rain-fall has a short-term effect on soil gas emissions. Soilflux drops with precipitation as soil capping occurs, butthis effect lasts for less than 1 day after the rain has
stopped because of the high permeability of volcanicsoil. The measurements discussed in this paper werecarried out for ≥2 days after the rainfall; therefore, theinfluence of the rainfall on CO2 flux from the ground canbe ignored in this study.
A spectral analysis was applied to the time series ofthe measured CO2 fluxes from the ground in order toevaluate the predominant periodic components. As usual,the linear trend was calculated (when present) for eachseries and subtracted from original data (Davis 1973).The spectra for monthly rainfall and temperature(Fig. 8b, c) indicate one dominant component with afrequency of 0.083, which is a seasonal variation
. Several sites characterized by low to middleflux (sites 6, 10, 18, 34, 38, 41, 44 and 81) showed apredominant component with a frequency of 0.083
223
Fig. 7 Variation of monthly rainfall, CO2 fluxes measured at sites3, 4, 8, 12, 13, 32, 42, 46 and 47, and mean CO2 flux
Table 2 Linear correlationcoefficient (r) between rainfalland CO2 fluxes measured ateach site
Site r Site r Site r Site r Site r Site r
Mean 0.15 11 0.23 20 –0.18 27 0.00 38 –0.04 46 0.062 –0.04 12 –0.17 21 0.06 28 0.12 39 0.26 47 0.013 –0.12 13 –0.03 22 0.02 29 0.28 40 0.10 80 0.274 0.00 14b –0.24 23 0.35 30 0.21 41 0.50 81 0.356 0.30 15 –0.04 24 0.42 32 0.13 41b 0.37 82 0.227 0.24 16 –0.12 25 0.01 33 0.39 42 0.29 83 –0.108 –0.08 17 0.18 26 –0.04 34 0.35 43 –0.10 84 0.089 –0.05 18 0.36 27 0.00 35 0.12 44 –0.35 85 –0.05
10 0.58 19 0.13 26 –0.04 36 0.28 45 0.01 86 0.24
Fig. 8a–f Power spectral density of time series. The compositegraph shows the spectra of a mean CO2 fluxes, b temperature,c rain and d the filtered series of mean flux. The filtered serieswas obtained by subtracting a 1-year moving average from theoriginal series to amplify the periodic components by periodsequal or less than 1 year. As with the original series a, the seasonalcomponent in the residual series is still negligible (see text). e, f Thespectra of CO2 fluxes measured at sites 6 and 12, respectively
(Fig. 8e), whereas the sites located inside the high fluxarea (Fig. 1, areas A, B, C) did not show any predomi-nant component (Fig. 8f). Mean CO2 flux did not havethe seasonal component and its spectrum is similar tothat of the high-flux sites (Fig. 8a, f). Both showed onlyone dominant component that has a wavelength equal tothe length of the entire period of observation. In order toevaluate high-frequency components, the 1-year movingaverage was subtracted from the original data and given
as the filtered spectrum (Fig. 8d). The moving averageserves as a low frequency pass filter. If this movingaverage is subtracted from the original data, we obtaina. filtered series where the high frequency compo-nents with periods equal or less than a 1-year intervalhave been amplified. Notwithstanding this filteringprocedure, the seasonal component is still negligible(Fig. 8d).
224
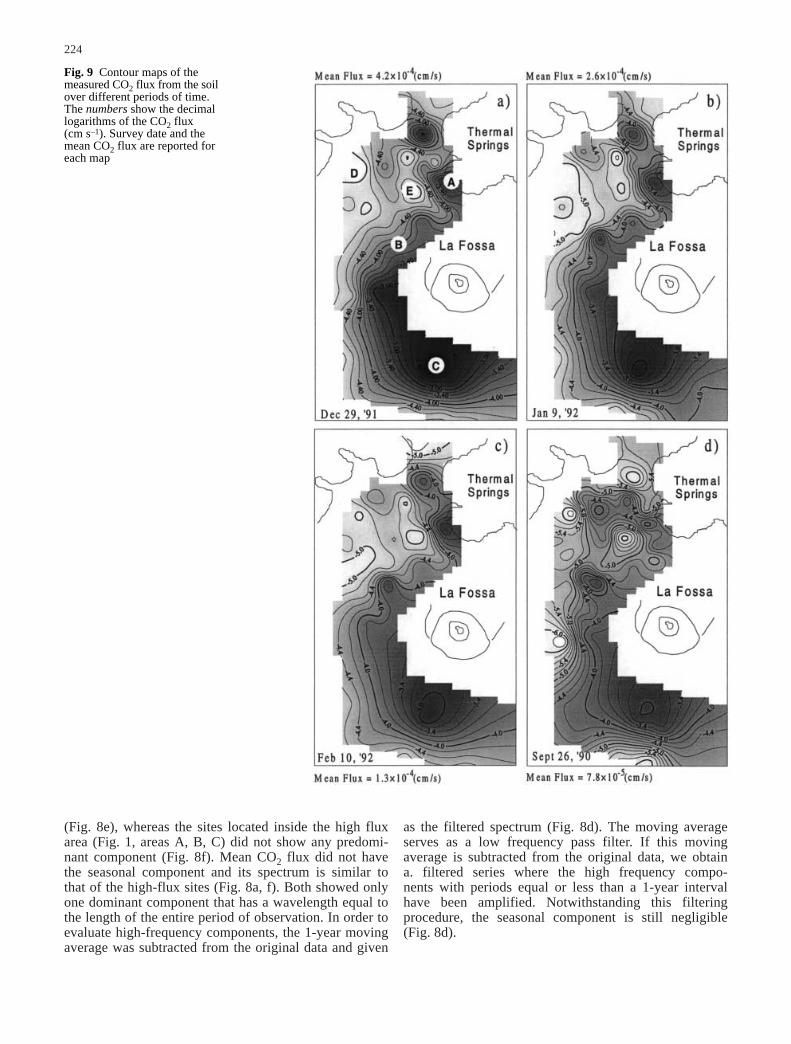
Fig. 9 Contour maps of themeasured CO2 flux from the soilover different periods of time.The numbers show the decimallogarithms of the CO2 flux(cm s–1). Survey date and themean CO2 flux are reported foreach map

Discussion
In order to discuss correlation with volcanic activities,temporal variation of the mean CO2 flux was considered,but not that at each location. This is because the meanvalue is more sensitive to the variations affecting all theinvestigated areas, such as those relating to volcanicactivity and less sensitive to the variations relating to thefeatures of each sampling location. As shown on Fig. 8,and discussed in the text, some sites have a seasonalcomponent and others do not. A few sites show somecorrelation with variation in the CO2 content offumarolic gases; some others seem less related. Suchvarious responses at different sites to different parametersis a common finding in natural systems such as volcanoes.Furthermore an apparent time delay between sites couldbe recognized in a few cases, although the monthly sam-pling frequency does not allow more detailed analyses.For this reason, we have not discussed any correlationbetween single measurement sites and volcanic activity.
The measured CO2 flux ranges from 10–6 to10–2 cm s–1 and it is characterized by a log-normal distri-bution. The highest CO2 fluxes have been measured inareas A, B and C at the base of La Fossa cone (Fig. 1).The flux from these areas is sensitive to changes in vol-canic activity, as will be discussed later. Previous studiesbased on the isotopic and chemical compositions of soilgases have already highlighted these areas (Bertrami etal. 1984; Badalamenti et al. 1988, 1991; Cannata et al.1988; Baubron et al. 1990; Carapezza and Diliberto1993; D’Alessandro and Parello 1997). Their δ13CCO2ranges from –3 to +0.9‰ (Pee Dee Belemnitella), therebysuggesting the contribution of deep magmatic CO2(Cannata et al. 1988; Capasso et al. 1997). On the contrary,the western part of the explored area was characterizedby low CO2 fluxes. In this area, CO2 fluxes are generallyless sensitive to variations in volcanic activity, and
δ13CCO2 ranges from –21.8 to –12.5, suggesting a signifi-cant contribution of organic carbon (Cannata et al.1988). Figure 9a–d shows the distribution of CO2 fluxesat four periods of different mean CO2 fluxes. The meanflux in December 1991 (Fig. 9a) was the maximum valuemeasured during this study, whereas September 1990(Fig. 9d) gives the minimum flux. Notwithstanding thelarge differences in the mean flux, the locations of theareas characterized by both the highest (Fig 9a, areas A,B and C) and lowest fluxes (Fig. 9a, areas D and E) are
225
Fig. 10 Cumulative probability plot for mean CO2 fluxes, plottedfrom low to high values. The horizontal arrow indicates theinflection point at 1.6×10⁻⁴ cm s–1. The thick solid lines indicatethe two populations
Fig. 11a–h Variations in mean CO2 fluxes from soils and othergeochemical and geophysical parameters measured on Vulcanobetween 1984–1994. a Mean CO2 fluxes from soils. Thedot–dashed line shows the boundary value (1.6×10⁻⁴ cm s–1)between two populations, whereas the thick dashed line is the 1-yearmoving average (see text). b Areal dilatation pattern computedfrom the distance variation recorded on the northern sector ofVulcano (Barberi et al. 1994). c Temperature of the fumaroleslocated on the rim of La Fossa cone (Capasso et al. 1993). d CO2concentration of the gases emitted from the same fumaroles(Capasso et al. 1993). e Total steam flux from fumaroles of La Fossacone (Italiano and Nuccio 1992; Italiano et al. 1994; Bukumirovicet al. 1997). f Cumulative energy release computed by earthquakeswith M>1.8, occurring beneath La Fossa cone (Montalto 1994).g Oxygen fugacity calculated from the composition of gas emittedfrom the fumaroles of La Fossa cone (Capasso et al. 1996). Thevalues are expressed as differences from the nickel–nickel oxidebuffer at the same temperature of gases. h SO2 flux from fumarolesof La Fossa cone (Barberi et al. 1994)

similar. For example, areas D and E are always character-ized by very low fluxes, even if the CO2 flux in these areasincreased from 1×10⁻⁶ (Fig. 9d) to 1×10⁻⁵ cm s–1 (Fig. 9a).
The cumulative probability diagram (Tennant andWhite 1959) of the mean CO2 fluxes indicates thepresence of two populations with a boundary value of1.6×10–4 cm s–1 (Fig. 10). Over 30% of surveys are char-acterized by high mean-flux values and a period of higherCO2 flux from the ground has been identified from 1990to 1992 (Fig. 11). During this period, strong variations inother geochemical and geophysical parameters occurredon the island of Vulcano (Fig. 11). These peaks high-lighted a significant increase in the volcanic activity ofVulcano (Badalamenti et al. 1986; Barberi et al. 1991;Italiano and Nuccio 1992; Montalto et al. 1994).
The ground deformation observed at the beginning of1990 in the northern part of the island (Fig. 11b; Barberi
et al. 1994) has been interpreted as a contraction of LaFossa area. The mean CO2 flux increased during thisperiod and reached a maximum value in December 1991.Similar trends were observed in temperature (Fig. 11c),CO2 content (Fig. 11d) and steam flux (Figs. 11e and12), all of which were measured in the fumarolic field atthe top of La Fossa cone (Italiano et al. 1994; Capasso etal. 1996). A decrease in the oxygen fugacity of fumarolicgases (Fig. 11g) was also observed until the end of 1991.This trend suggests an increase in the contribution of thedeep magmatic source, which agrees with all the above-mentioned trends. During the same period, a majorincrease in the seismic energy release beneath La Fossacone (Montalto 1994) was also observed. (Fig. 11f).Variation of cumulative seismic energy and CO2 fluxshow similar shapes with an increase in their derivativesafter June 1990 (Fig. 13). At the beginning of 1992, aninversion in this tendency was observed in the mean CO2fluxes, temperature and oxygen fugacity of the fumarolicgases of La Fossa cone (Fig. 11a, c, g). This evidencesuggests that time variations in these parameters werecaused by a common process related to volcanic activity,thereby indicating a decrease in volcanic activity. MeanCO2 flux from the ground has also been compared withSO2 flux from the fumaroles of La Fossa cone (Fig. 14).The data were divided into two subgroups: the firstincluded the fluxes from 1988 to November 1993, andthe second covered the period from December 1993 toDecember 1994. Both groups show a linear correlationwith different CO2/SO2 slopes. The variation suggeststhat CO2/SO2 ratio in the magmatic gas supplied beforethe end of 1993 was higher than that supplied during thefollowing period. This agrees with variation in theCO2/total sulphur ratio in fumarolic gases from La Fossacone (Capasso et al. 1996).
Conclusion
Flux measurements carried out on the island of Vulcanoover a 10-year period (1984–1994) have allowed us toclarify various aspects of CO2 emissions from theground. They have revealed large variations in the investi-gated parameter that have exceeded measurement errorand seasonal variations. The CO2 flux is extremely vari-able in space, with differences up to some orders of
226
Fig. 12 Variation in total steam flux from La Fossa cone (Italianoand Nuccio 1992; Italiano et al. 1994; Bukumirovic et al. 1997)and mean CO2 fluxes measured in the same month
Fig. 13 Cumulative curves of CO2 flux and seismic energy releaseagainst time. The cumulative CO2 fluxes were calculated by the
following equation: , where ti–ti–1
is the number of days between the two surveys, φmean(i) is themean flux of the ith survey (g cm–2 day–1) and φcum is the totalamount of CO2 (g cm–2)
Fig. 14 Mean soil CO2 fluxes plotted against SO2 fluxes measuredby Cospec during the period 1988–1994 (Barberi et al. 1994).Linear correlation coefficients for the two trends are shown by R
magnitude within distances of 200 m. Therefore, thechoice of the sampling locations greatly influences theevaluation of gas fluxes from the whole investigatedarea. Although the absolute value includes a large uncer-tainty, the temporal variation of CO2 flux from theground measured at permanent sampling sites have smallrelative errors. Variations of CO2 fluxes from the groundat sites characterized by high fluxes do not depend onchanges of atmospheric conditions, but they are relatedto volcanic activity. The mean CO2 flux does not haveany correlation with rain and atmospheric pressure. Onthe contrary, high correlations were found between themean CO2 flux from the ground and geochemical andgeophysical parameters related to volcanic activities (gascompositions, steam and SO2 fluxes from fumaroles,seismic energy release and ground deformations). In par-ticular, the inverse relationship between mean CO2 flux-es and the oxygen fugacity of fumarolic gases suggests adeep magmatic origin for the CO2 emitted from theground. Previous studies of the isotopic composition ofcarbon in soil gases (Capasso et al. 1997) agree with thisassumption. The present study shows that the mean CO2flux from the ground is a useful parameter in evaluatingchanges in the activity of this volcanic system.
Acknowledgements The authors are very grateful to F. Di Gangi,S. Francofonte, G. Riccobono and G. Sansone for their help withfield measurements and technical support. Thanks are also due tothe Servizio Idrologico del Genio Civile, which provided meteoro-logical data, and to J.O. Davies who proof-read the paper. Finally,we are indebted to our anonymous reviewers and Dr. HiroshiShinohara because their suggestions have vastly improved earlydrafts of this manuscript. This study was financially supported byGruppo Nazionale per la Vulcanologia CNR Italy.
References
Allard P (1992) Diffuse degassing of Carbon dioxide throughvolcanic systems: observed facts and implications. Rep GeolSurv Jpn 279:7–11
Allard P, Carbonnelle J, Dajlevic D, Le Bronec J, Morel P, RobeMC, Maurenas J, Faivre Pierret R, Martin D, Sabroux JC,Zettwoog P (1991) Eruptive and diffuse emissions of CO2from Mount Etna. Nature 351:387–391
Badalamenti B, Gurrieri S, Hauser S, Tonani F, Valenza M (1984)Considerazioni sulla concentrazione e sulla composizioneisotopica della CO2 presente nelle manifestazioni naturali enell’atmosfera dell’isola di Vulcano. Rend Soc It Min Petrol39:367–378
Badalamenti B, Falsaperla S, Neri G, Nuccio PM, Valenza M(1986) Confronto preliminare tra dati sismici e geochimicinell’area Lipari–Vulcano. Consiglio Nazionale RicercheGruppo Nazionale Vulcanol Bollettino 1:37–47
Badalamenti B, Gurrieri S, Hauser S, Parello F, Valenza M (1988)Soil CO2 output in the island of Vulcano during the period1984–1988: surveillance of gas hazard and volcanic activity.Rend Soc It Miner Petrol 43:893–899
Badalamenti B, Gurrieri S, Hauser S, Parello F, Valenza M (1991)Changes in the soil CO2 output at Vulcano island during thesummer 1988. Acta Vulcanol 1:219–221
Barberi F, Neri G, Valenza M, Villari L (1991) 1987–1990 unrestat Vulcano. Acta Vulcanol 1:95–106
Barberi F, Bertagnini A, Landi P (1994) Volcanology and chemistryof earth’s interior Italian research activity (1991–1994) reportto IAVCEI. Suppl Boll Geofis Teorica Appl 36:636–736
Baubron JC, Allard P, Toutain JP (1990) Diffuse volcanic emissionsof carbon dioxide from Vulcano island, Italy. Nature 344:51–53
Baubron JC, Allard P, Sabroux JC, Tedesco D, Toutain JP (1991)Soil gas emanations as precursory indicators of volcaniceruptions. J Geol Soc Lond 148:571–576
Bertrami R, Antrodicchia E, Luzi C (1984) Prospezione dei gasnel suolo nell’Isola di Vulcano. Rend Soc It Miner Petrol 39:343–353
Bukumirovic T, Italiano F, Nuccio PM (1997) The evolution of ageological system: the support of a GIS for geochemicalmeasurements at the fumarole field of Vulcano, Italy. J VolcanolGeotherm Res 79:253–263
Cannata S, Hauser S, Parello F, Valenza M (1988) Caratterizzazioneisotopica dell’anidride carbonica presente nelle manifestazionigassose dell’isola di Vulcano. Rend Soc It Miner Petrol 43:153–161
Capasso G, Inguaggiato S, Nuccio PM, Pecoraino G, Sortino F(1993) Compositional evolution of the fumarolic gases emittedat the crater of Vulcano during 1987–1993. IndependentPublishers Group World Organization of Volcano Observatoriesmeeting, Guadalupe, December 1993, pp 109–126
Capasso G, Inguaggiato S, Nuccio PM, Pecoraino G, Sortino F(1996) Change in composition of La Fossa crater fumaroles.Acta Vulcanol 8:208–209
Capasso G, Favara R, Inguaggiato S (1997) Chemical features andisotopic composition of gaseous manifestations on VulcanoIsland (Aeolian Island, Italy): an interpretative model of fluidcirculation. Geochim Cosmochim Acta 61:3425–3440
Carapezza ML, Diliberto IS (1993) Helium and CO2 soil degassing.Acta Vulcanol 3:273–276
Carbonnelle J, Dajlevic D, Le Bronec J, Morel P, Obert JC,Zettwoog P (1985) Etna: composantes sommitales et parietalesdes emission de gaz carbonique, vol 108. Bull ProgrammeInterdisciplinaire de Recherche sur la Prévision et la Surveillancedes Eruptions Volcaniques – Centre National de la RechercheScientifique
Chiodini G, Frondini F, Raco B (1996) Diffuse emissions of CO2from the Fossa crater, Vulcano Island (Italy). Bull Volcanol58:41–50
Chiodini G, Cioni R, Guidi M, Raco B, Marini L (1998) Soil CO2flux measurements in volcanic and geothermal areas. ApplGeochem 13:543 552
D’Alessandro W, Parello F (1997) Soil gas prospection of He,222Rn and CO2: Vulcano Porto area, Aeolian Islands, Italy.Appl Geochem 12:213–224
Davis JC (1973) Statistics and data analysis in geology. Wiley,New York, pp 287–305, 249–276
De Astis G, La Volpe L, Peccerillo A, Civetta L (1997) Volcano-logical and petrological evolution of Vulcano island (Aeolianarc, southern Tyrrenian Sea). J Geophys Res 102:8021–8050
Dellino P, La Volpe L (1997) Stratigrafia, dinamiche eruttive edeposizionali, scenario eruttivo e valutazioni di pericolosita’ aLa Fossa di Vulcano. In: La Volpe L, Dellino P, Nuccio PM,Privitera E, Sbrana A (eds) Progetto Vulcano Risultati delleattivita’ di ricerca 1993–1995. Consiglio Nazionale delleRicerche – Gruppo Nazionale per la Vulcanologia, Pisa,pp 214–237
Fukuda H (1955) Air and vapor movement in soil due to windgustiness. Soil Sci 79:249–258
Gurrieri S, Valenza M (1988) Gas transport in natural porousmedium: a method for measuring CO2 flows from the groundin volcanic and geothermal areas. Rend Soc It Mineral Petrol43:1151–1158
Gurrieri S, Camarda M, Riccobono G, Valenza M (2000) Relation-ships between soil permeability and diffuse degassing involcanic areas. Suppl EOS Trans Am Geophys Union 81:F1317
Hinkle ME (1990) Factors affecting concentrations of helium andcarbon dioxide in soil gases. In: Geochemistry of gaseouselements and compounds. Theophrastus Publications, Athens,pp 421–447
227

Klusmann RW (1993) Soil gases and related methods for naturalresource exploration. Wiley, New York
Italiano F, Nuccio PM (1992) Volcanic steam output directlymeasured in fumaroles: the observed variations at VulcanoIsland, Italy, between 1983 and 1987. Bull Volcanol 54:623–630
Italiano F, Nuccio PM, Pecoraino G (1994) Fumarolic gas outputat La Fossa di Vulcano crater. Acta Vulcanol 6:39–40
Montalto A (1994) Seismic events at Vulcano (Italy) during1988–1992. J Volcanol Geotherm Res 60:193–206
Sorey ML, Evans WC, Kennedy BM, Farrar CD, Hinsworth LJ,Hausback B (1998) Carbon dioxide and helium emissionsfrom a reservoir of magmatic gas beneath Mammouth mountain,California. J Geophys Res 103:15303–15323
Tennant CB, White ML (1959) Study of the distribution of somegeochemical data. Econ Geol 54:538–550
Werner C, Brantley SL (2000) CO2 emissions related to theYellowstone volcanic system 2. Statistical sampling, totaldegassing, and transport mechanism. J Geophys Res 105:10831–10846
228