Modeling ground deformations of Panarea volcano hydrothermal/geothermal system (Aeolian Islands,...
13
RESEARCH ARTICLE Modeling ground deformations of Panarea volcano hydrothermal/geothermal system (Aeolian Islands, Italy) from GPS data Alessandra Esposito & Marco Anzidei & Simone Atzori & Roberto Devoti & Guido Giordano & Grazia Pietrantonio Received: 3 April 2009 / Accepted: 5 January 2010 / Published online: 25 February 2010 # Springer-Verlag 2010 Abstract Panarea volcano (Aeolian Islands, Italy) was considered extinct until November 3, 2002, when a submarine gas eruption began in the area of the islets of Lisca Bianca, Bottaro, Lisca Nera, Dattilo, and Panarelli, about 2.5 km east of Panarea Island. The gas eruption decreased to a state of low degassing by July 2003. Before 2002, the activity of Panarea volcano was characterized by mild degassing of hydrothermal fluid. The compositions of the 2002 gases and their isotopic signatures suggested that the emissions originated from a hydrothermal/geothermal reservoir fed by magmatic fluids. We investigate crustal deformation of Panarea volcano using the global position- ing system (GPS) velocity field obtained by the combina- tion of continuous and episodic site observations of the Panarea GPS network in the time span 1995–2007. We present a combined model of Okada sources, which explains the GPS results acquired in the area from December 2002. The kinematics of Panarea volcano show two distinct active crustal domains characterized by different styles of horizontal deformation, supported also by volcanological and structural evidence. Subsidence on order of several millimeters/year is affecting the entire Panarea volcano, and a shortening of 10 −6 year −1 has been estimated in the Islets area. Our model reveals that the degassing intensity and distribution are strongly influenced by geophysical-geochemical changes within the hydrothermal/ geothermal system. These variations may be triggered by changes in the regional stress field as suggested by the geophysical and volcanological events which occurred in 2002 in the Southern Tyrrhenian area. Keywords GPS monitoring . Model . Gas eruption . Active volcanism . Aeolian arc Introduction Crustal deformation measurements are among the most sensitive and reliable indicators to evaluate the volcanic hazard related to volcanic unrest (Dvorak and Dzurisen 1997) caused by magma emplacement and/or fluid migra- tion (Gottsmann et al. 2007). A clear link for the hydrothermal fluid contribution to geophysical signals has been found in several volcanoes (Todesco et al. 2004; Tikku et al. 2006). On November 3, 2002, a gas eruption began about 2.5 km offshore East of Panarea Island (Aeolian Islands, Italy; Fig. 1a, c, d). Submarine craters opened at the top of a ∼2.3 km 2 shallow rise of the seafloor, between −2 and −30 m below sea level in the area surrounded by the islets of Panarelli, Lisca Bianca, Bottaro, Lisca Nera, and Dattilo (hereinafter as the “Islets area”; Fig. 1a, c; Anzidei and Esposito 2003; Anzidei et al. 2005; Esposito et al. 2006). The degassing of Panarea on November 3 followed a sequence of geophysical and volcanological events which occurred in the southern Tyrrhenian zone (Anzidei et al. 2003; Esposito et al. 2006): the 6 September offshore earthquake (Ml=5.6) between Palermo and Ustica Island, Editorial responsibility: M. Ripepe A. Esposito (*) : M. Anzidei : S. Atzori : R. Devoti : G. Pietrantonio Istituto Nazionale di Geofisica e Vulcanologia, Via di Vigna Murata 605, 00143 Rome, Italy e-mail: [email protected] G. Giordano Dipartimento Scienze Geologiche, Università Roma Tre, L.go S. L. Murialdo 1, 0146 Rome, Italy Bull Volcanol (2010) 72:609–621 DOI 10.1007/s00445-010-0346-y
Transcript of Modeling ground deformations of Panarea volcano hydrothermal/geothermal system (Aeolian Islands,...
RESEARCH ARTICLE
Modeling ground deformations of Panarea volcanohydrothermal/geothermal system (Aeolian Islands, Italy)from GPS data
Alessandra Esposito & Marco Anzidei & Simone Atzori &Roberto Devoti & Guido Giordano & Grazia Pietrantonio
Received: 3 April 2009 /Accepted: 5 January 2010 /Published online: 25 February 2010# Springer-Verlag 2010
Abstract Panarea volcano (Aeolian Islands, Italy) wasconsidered extinct until November 3, 2002, when asubmarine gas eruption began in the area of the islets ofLisca Bianca, Bottaro, Lisca Nera, Dattilo, and Panarelli,about 2.5 km east of Panarea Island. The gas eruptiondecreased to a state of low degassing by July 2003. Before2002, the activity of Panarea volcano was characterized bymild degassing of hydrothermal fluid. The compositions ofthe 2002 gases and their isotopic signatures suggested thatthe emissions originated from a hydrothermal/geothermalreservoir fed by magmatic fluids. We investigate crustaldeformation of Panarea volcano using the global position-ing system (GPS) velocity field obtained by the combina-tion of continuous and episodic site observations of thePanarea GPS network in the time span 1995–2007. Wepresent a combined model of Okada sources, whichexplains the GPS results acquired in the area fromDecember 2002. The kinematics of Panarea volcano showtwo distinct active crustal domains characterized bydifferent styles of horizontal deformation, supported alsoby volcanological and structural evidence. Subsidence onorder of several millimeters/year is affecting the entirePanarea volcano, and a shortening of 10−6year−1 has been
estimated in the Islets area. Our model reveals that thedegassing intensity and distribution are strongly influenced bygeophysical-geochemical changes within the hydrothermal/geothermal system. These variations may be triggered bychanges in the regional stress field as suggested by thegeophysical and volcanological events which occurred in2002 in the Southern Tyrrhenian area.
Keywords GPSmonitoring .Model . Gas eruption .
Active volcanism . Aeolian arc
Introduction
Crustal deformation measurements are among the mostsensitive and reliable indicators to evaluate the volcanichazard related to volcanic unrest (Dvorak and Dzurisen1997) caused by magma emplacement and/or fluid migra-tion (Gottsmann et al. 2007). A clear link for thehydrothermal fluid contribution to geophysical signals hasbeen found in several volcanoes (Todesco et al. 2004;Tikku et al. 2006).
On November 3, 2002, a gas eruption began about 2.5 kmoffshore East of Panarea Island (Aeolian Islands, Italy;Fig. 1a, c, d). Submarine craters opened at the top of a∼2.3 km2 shallow rise of the seafloor, between −2 and −30 mbelow sea level in the area surrounded by the islets ofPanarelli, Lisca Bianca, Bottaro, Lisca Nera, and Dattilo(hereinafter as the “Islets area”; Fig. 1a, c; Anzidei andEsposito 2003; Anzidei et al. 2005; Esposito et al. 2006).The degassing of Panarea on November 3 followed asequence of geophysical and volcanological events whichoccurred in the southern Tyrrhenian zone (Anzidei et al.2003; Esposito et al. 2006): the 6 September offshoreearthquake (Ml=5.6) between Palermo and Ustica Island,
Editorial responsibility: M. Ripepe
A. Esposito (*) :M. Anzidei : S. Atzori : R. Devoti :G. PietrantonioIstituto Nazionale di Geofisica e Vulcanologia,Via di Vigna Murata 605,00143 Rome, Italye-mail: [email protected]
G. GiordanoDipartimento Scienze Geologiche, Università Roma Tre,L.go S. L. Murialdo 1,0146 Rome, Italy
Bull Volcanol (2010) 72:609–621DOI 10.1007/s00445-010-0346-y

the 27 October onset of the paroxysmal eruption at Mt. Etna,and the 28 December eruption at Stromboli (Fig. 1b).
Until November 2002, the presence of a hydrothermal/geothermal system at Panarea was interpreted in terms ofpost-volcanic phenomena caused by fluid circulation due tocooling of a magmatic source (Romano 1973; Bellia et al.1986, 1987; Gabbianelli et al. 1990; Italiano and Nuccio1991; Calanchi et al. 1995; Anzidei 2000). A deep and ashallow zone were recognized (Italiano and Nuccio 1991;Calanchi et al. 1995). However, gas eruptions of similarintensity to the 2002 eruption had not been previouslyobserved during the last century (Mercalli 1883). Gascompositions and isotopic signatures suggested that the2002 emissions originated from a hydrothermal/geothermalreservoir fed by seawater and magmatic fluids (Caliro et al.2004; Chiodini et al. 2006; Capaccioni et al. 2005, 2007).Geomorphological evidences of past phreatic explosions,such as that of November 2002, have been found in therelics of several craters on the seafloor, revealed bymultibeam bathymetry (Anzidei et al. 2005), as well as bygeological investigations (Esposito et al. 2006). Intensehydrothermal activity was also evident in the Islets area.
Prior to the 2002 event, one global positioning system(GPS) station was present on Panarea Island as part of theTyrgeonet Mediterranean GPS network (Anzidei et al.
1995). After November 2002, a dedicated GPS networkwas planned and set up to monitor the short-term surfaceand subsurface dynamics at Panarea volcano. In this paper,we show and discuss results from GPS data from 1995 to2007, which include the discontinuous data from the singlestation for the pre-eruption period and seven non-continuous and two continuously monitoring stations forthe post-eruption period. We estimate the active strain anddiscuss the relationship between the deformation processesrelated to the hydrothermal/geothermal system and theregional and local tectonic setting. We use an elastic Okadamodel to fit the GPS velocity field to explain the presentevolution of the hydrothermal/geothermal system in thepost-eruption stage.
Structural and volcanic setting
Panarea Island is located on the eastern sector of theAeolian volcanic arc, located along the margin of theSouthern Tyrrhenian Sea, facing the Calabrian-Peloritanmountain chain to the southeast and the abyssal Marsilibasin to the northwest (Barberi et al. 1973; Beccaluva et al.1985). The Aeolian volcanoes comprise of seven majorislands (Alicudi, Filicudi, Salina, Lipari, Vulcano, Panarea,
Fig. 1 a Location of the 2002 gas eruption (DTM from Anzidei et al.2006). b Structural sketch map of the Southern Tyrrhenian Sea andAeolian Islands (after De Astis et al. 2003; TL Tindari-Letojanni faultsystem, SA Sisifo-Alicudi fault system). Also shown are thechronology and location of eruptions and earthquakes during late
2002. c Aerial view of Panarea Island and the archipelago. The arrowindicates the location of major emission point to the SW of Bottaro. dThe gas rose to the sea surface forming bubbles some meters indiameter
610 Bull Volcanol (2010) 72:609–621

and Stromboli) and several seamounts (Fig. 1b) emplacedon a 15–20-km thick continental crust. Their products havebeen dated between 1.3 Myr and the present (De Astis et al.2003 and reference therein). Volcanism started during thePliocene, in connection with the subduction of the Ionianlithosphere beneath the Calabrian Arc. Structural, seismo-logical, geodetic, and geochemical data suggest that sincethe Pleistocene, the southeastern propagation of theTyrrhenian rifting and the western margin roll-back havebeen controlled by the NNW–SSE fault system (Tindari-Letojanni fault system), and different styles of riftingprocesses have been recognized (Gvirtzman and Nur1999, 2001; Faccenna et al. 2001; De Astis et al. 2003).Recent regional geodetic data show maximum straincontraction axes with a N–S trend off of Sicily and in thewestern portion of the Aeolian Islands and a minor NW–SEextension in the eastern Aeolian Islands (Hollenstein et al.2003; D'Agostino and Selvaggi 2004; Pondrelli et al. 2004;Esposito 2007). The transition from compressional toextensional regime happens through an area with transten-sional deformation clustering along the NNW-trendingTindari-Letojanni fault system which runs across the centralAeolian Islands (D'Agostino and Selvaggi 2004; Pondrelliet al. 2004; Serpelloni et al. 2005; Esposito 2007). PanareaIsland is located on the eastern active sector of theAeolian volcanic arc, which also includes StromboliIsland and the Lamentini, Alcione, and Palinuro sea-mounts. A prevailing NNE to NE-trending fault systemaffects the Panarea and Stromboli Islands (Gabbianelli etal. 1993; De Astis et al. 2003).
Panarea volcano is the emergent portion of a submarinestratovolcano ∼1,600 m high and ∼18 km across (Gabbianelliet al. 1993; Gamberi et al. 1997; Favalli et al. 2005)characterized by a large and ellipsoidal shaped platform, at∼100 m. The emergent portion of this platform formsPanarea Island (421 ma.s.l.) and the small archipelago withthe islets of Basiluzzo, Dattilo, Panarelli, Lisca Bianca,Bottaro, Lisca Nera, and Le Formiche (Fig. 1a). Panarea andthe Islets are made of high-K calcalkaline, andesite to daciteand rhyolite rocks, lava domes, plugs, coulees, and lavaflows, interbedded with subordinated pyroclastic depositsalso of external provenance. Age ranges from 149±5 to 54±8 ka (Calanchi et al. 1999; Lucchi et al. 2007). Recently, theyoungest age of the Panarea dome complex was determinedat 20±2 ka (Dolfi et al. 2007). The outcropping lava units onthe Islets area are characterized by a variable degree ofhydrothermal alteration that have heavily modified theirmechanical parameters (Cas et al. 2007). Gravimetricmeasurements revealed the existence of a positive localgravimetric anomaly between the islet of Basiluzzo and theisland of Panarea (Gabbianelli et al. 1990). Cocchi et al.(2008) estimated a negative magnetic anomaly betweenPanarea and the Islets area. In the Islets area, a positive
residual magnetic anomaly is present. A NE-trending gravityminimum, centered on the west of Panarea, was alsomeasured (Cocchi et al. 2008).
Before November 2002, Panarea volcano had beenundergoing active subsidence at 1.87 mm year−1 for thelast 2,000 years (Tallarico et al. 2003) and continuousexhalative activity from several fumaroles located bothinland and offshore (La Calcara, Punta Levante, and LiscaBianca–Bottaro, in Fig. 1a).
Panarea volcano shows faults and fractures with a prevail-ing NE–NNE trend and minor NW trend (Gabbianelli et al.1990, 1993; De Astis et al. 2003). During the 2002 gaseruption (Anzidei et al. 2005; Esposito et al. 2006, 2008),two fracture systems opened on the seafloor in the degassingarea: NNE–SSW and NW–SE trending (Anzidei et al. 2005;Esposito et al. 2006; Esposito 2007).
GPS networks and data analysis
The Panarea GPS network includes seven non-continuousstations and two continuous stations (Fig. 2). Two of thenon-continuous stations are located on Panarea Island(PANA-PA3D; PCOR) and the others on the Islets area(BA3D, LIBI, BOTT, LINE, and PNRL; Fig. 2 and Table 1;Anzidei et al. 2003; Esposito et al. 2008). BA3D, BOTT,LINE, PNRL, and PA3D stations were established after the2002 gas eruption, while PANA station is part of theTyrrhenian Geodetic Network (Anzidei et al. 1995) andLIBI and PCOR of the IGMI network (Surace 1993).
Only PANA station, which is located ∼2.5 km west ofthe degassing zone, was repeatedly occupied during fivedistinct campaigns before 2002 (Figs. 2a and 3). So far,most of the GPS data were collected within the 2002–2006time span (Table 1), after the gas eruption. After the 2004campaign, PANA was replaced by PA3D, located on thesame building at a distance of ∼3 m.
The two continuous stations were installed at PanareaIsland (CPAN) and at Lisca Bianca Islet (LI3D; Figs. 2aand 3) on May 2004, and they are included in the RINGnetwork (Selvaggi et al. 2006). The non-continuous stationsof Panarea network was repeatedly measured every6 months in the 2002–2006 time span using observationwindows of 48–120 h periods in each campaign (Table 1).
We analyzed the GPS data set (1995–2007) of thePanarea network together with some southern Italian andEuropean EUREF permanent sites using the Bernese GPSsoftware v.5.0 (Dach et al. 2007). Daily loosely constrainedsolutions were generated for each campaign and latercombined with ∼10 years of loosely constrained solutionsof a regional network of continuous stations in Italy, andsurrounding regions, provided routinely by the INGV(Serpelloni et al. 2007). To assure a reliable combination,
Bull Volcanol (2010) 72:609–621 611
nine continuous anchor IGS sites (Fig. 2b) were alwaysincluded in all daily solutions. To express the time series in astable reference frame, the Panarea solutions were combinedwith other available clusters whose networks cover a largepart of the European region (Serpelloni et al. 2007). Thisstrategy allowed us to obtain a daily Helmert transformationon the ITRF2005 reference system (Altamimi et al. 2007),based on 20 common sites. The combined daily solutionswere then transformed into the ITRF2005 reference systemby estimating four parameters: three translations and a scale
factor. Fitting the ITRF2005 time series, we estimated sitevelocities together with periodic signals, eventual steps,always using the complete covariance matrix. To properlycalibrate the formal errors, the standard errors were rescaled,according to the procedure proposed by Williams (2003).
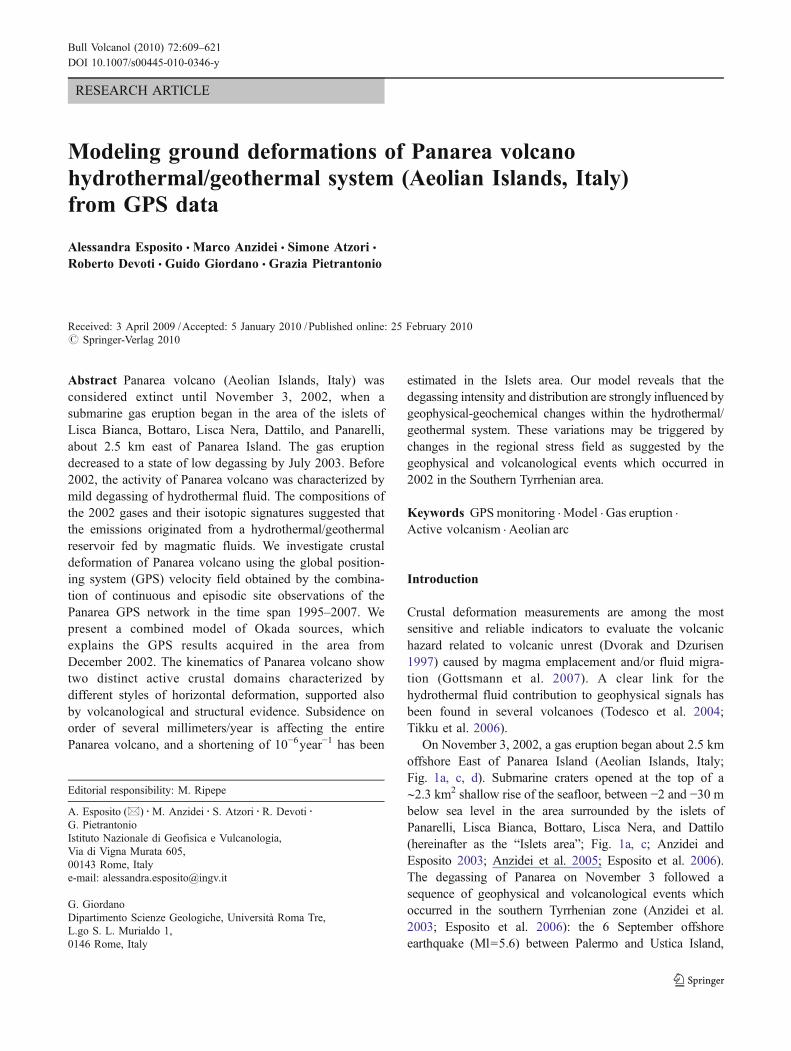
The velocity field with respect to the fixed Eurasianplate (Table 2) suggests a complex kinematic framework,where regional tectonics and local volcanic and tectonicdeformations coexist. Comparing the residual velocityfield relative to the Panarea network barycenter (Panarea
Table 1 Non-continuous stations of Panarea network: observation history, networks
1995 1996 1997 1998 1999 2000 2001 2002 2003 2004 2005 2006
1 BA3D ● ● ● ● ● ● ● Panarea
2 BOTT ● ● ● ● ● ● ● Panarea
3 LI3Da ● ● Panarea
4 LIBI ● ● ● ● ● ● ● ● ● IGM
5 LINE ● ● ● ● ● ● ● Panarea
6 PA3D ● ● ● ● ● ● Panarea
7 PANA ● ● ● ● ● ● ● ● ● Tyrgeonet
8 PCOR ● ● ● ● ● ● ● ● IGM
9 PNRL ● ● ● ● ● ● ● Panarea
a Permanent site from May 2004
● Campaign measurements
Fig. 2 a Panarea global positioning system (GPS) network. GPSvelocities with 1σ uncertainties relative to Panarea reference frame. Fitof four Okada sources (green arrows) and comparison between
estimated GPS velocities. b Anchor IGS sites. c GPS sites on theCalabrian Arc rigid block. d Principal axes of the horizontal strain ratetensor and associated 1σ error calculated from relative velocity fields
612 Bull Volcanol (2010) 72:609–621
reference frame) with the one computed with respect to theCalabrian Arc rigid block (Gvirtzman and Nur 1999,2001; Doglioni et al. 2001; D'Agostino and Selvaggi2004), defined by the GPS sites PORO, CELL, VLSG,
and MSRU (Fig. 2c), did not reveal any significantdifference (0.39±0.25 mm/year) in the deformation fieldof Panarea. We therefore concluded that adopting thePanarea reference frame would allow to describe the local
-0.05
0
0.05PA3D
UP
(m
) -7.4 ± 0.9 mm/yr
-0.02
0
0.02
E (
m)
2.1 ± 0.2 mm/yr
2003 2004 2005 2006 2007-0.02
0
0.02
N (
m) -1.0 ± 0.2 mm/yr
-0.05
0
0.05BOTT
UP
(m
) -6.4 ± 1.4mm/yr
-0.02
0
0.02
E (
m) -0.9 ± 0.3 mm/yr
-0.02
0
0.02
N (
m)
2.9 ± 0.4 mm/yr
-0.05
0
0.05BA3D
UP
(m
) -4.7 ± 1.5 mm/yr
-0.02
0
0.02
E (
m) -0.1 ± 0.3 mm/yr
-0.02
0
0.02
N (
m) -0.2 ± 0.4mm/yr
CPAN
-7.0 ± 0.4 mm/yr
1.4± 0.1 mm/yr
2003 2004 2005 2006 2007
3.3 ± 0.1 mm/yr
LI3D
-7.4 ± 0.6 mm/yr
-1.9 ± 0.1 mm/yr
2.8 ± 0.1 mm/yr
PNRL -5.5 ± 2.3 mm/yr
2.4 ± 0.5 mm/yr
-0.1 ± 0.6 mm/yr
PCOR -1.8 ± 1.7 mm/yr
0.7 ± 0.4 mm/yr
2003 2004 2005 2006 2007
3.7 ± 0.4 mm/yr
LIBI
-3.1 ± 1.6 mm/yr
-2.4± 0.4 mm/yr
2.7 ± 0.47 mm/yr
LINE -9.2 ± 1.9 mm/yr
-0.6 ± 0.4 mm/yr
1.8 ± 0.5 mm/yr
-0.05
0
0.05PANA pre 2002 gas eruption
UP
(m
)
-6.7 ± 1.3 mm/yr
-0.02
0
0.02
E (
m) -1.5 ± 0.00 mm/yr
1996 1998 2000-0.04
0
0.04
N (
m)
3.4 ± 0.00 mm/yr
PANA post 2002 gas eruption
-7.4 ± 0.9 mm/yr
2.1 ± 0.2 mm/yr
2003 2004
-1.0 ± 0.2 mm/yr
PANA complete time series
1996 1998 2000 2002 2004
a
b
Time (years)
Time (years)
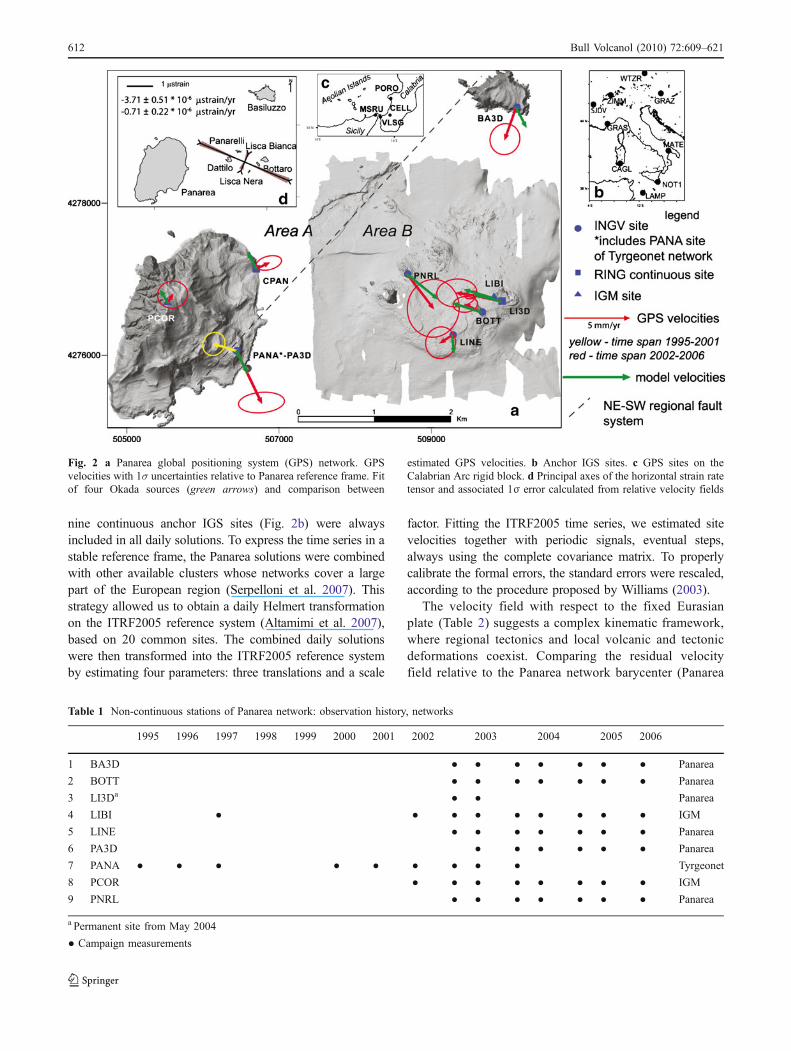
Fig. 3 Coordinate time series of Panarea global positioning systemnetwork relative to Eurasia reference frame. The vertical linerepresents the estimated step. Formal error 1σ. Inside each box, rateis shown. a Coordinate time series of PANA station pre- and post-2002 gas eruption in time span 1995–2004. PANA time series show a
clear offset between 2000 and 2002. b Coordinate time series of thetwo continuous and the seven non-continuous stations in time span2002.8–2007.5. The station of LI3D recorded a horizontal displace-ment in the middle of 2005 (from June 18 to 19)
Bull Volcanol (2010) 72:609–621 613

magmatic and tectonic deformation from the regionaldeformation.
Velocity and strain rate fields
The GPS time series shown in Fig. 3 are relative to thefixed Eurasian plate. A general subsiding trend affects allthe stations of the Panarea network with values rangingfrom −3 to −9 mm/year, with the exception of PCORstation. The latter is placed on the west sector of PanareaIsland and does not show any vertical motion.
PANA is the only GPS station observed before 2002(Fig. 3a); hence, we used its data to test the possibility of achange in the subsidence rate caused by the gas eruption.After November 2002, PANA was occupied during threedifferent campaigns in December 2002, May 2003, and May2004. Our analysis does not reveal any significant change inthe rate of the Up component of PANA, before and after the2002 gas eruption (−6.7±1.3 mm/year before November2002; −7.4±0.9 mm/year after November 2002). A relevantfeature recorded in the PANA time series, a 4.2±0.1-cmuplift, occurred between June 2000 and November 2002,probably during the 2002 gas eruption.
Another puzzling discontinuity occurred at LI3D con-tinuous station, located on Lisca Bianca Islet (Fig. 3b). Aninstantaneous step in the horizontal components, of 12.1±
0.7 mm in the SE direction, was recorded between the 18thand the 19th of June 2005. The inspection of this site didnot reveal any manipulation or failure of the receiver-antenna equipment, and the GPS data were continuouslyrecorded during the event. Neither did the sky plot (i.e., theintrinsic noise of each single GPS satellite range observa-tion) reveal any anomaly during the entire month of June2005. For these reasons, we argue that the signal recordedby LI3D is related to volcano dynamics. In the same time,the other continuous station, CPAN, did not recorded ahorizontal displacement, indicated by an offset in timeseries (Fig. 3b).
The velocity field of the Panarea volcano with respectto the Panarea reference frame is shown in Fig. 2a.PANA is the only site that was measured before the 2002gas eruption and where the pre- and post-event velocitycan be estimated. Before the gas eruption, its velocity waslow (1.8±1.3 mm/year) and WNW trending. Just after thegas eruption, it changed abruptly in direction andmagnitude, pointing towards SSE.
The horizontal velocity field, within the 2002–2007 timespan, subdivides the Panarea volcano into two differentparts, which are separated by a major NE-trending faultsystem revealed by bathymetric surveys (Gabbianelli et al.1990; Gamberi et al. 1997; Anzidei et al. 2005). We labeled“Area A” the one corresponding to the NW portion ofPanarea Island and “Area B” the one corresponding to the
Table 2 Global positioning system site positions, velocities, and 1σ uncertainties
SITEID lon (°) lat (°) East (mm/year) σE (mm/year) North (mm/year) σN (mm/year) Up (mm/year) σUp (mm/year)
Relative to Eurasia
BA3D 15.12 38.66 −0.1 1.1 −0.2 1.2 −4.7 2.9
BOTT 15.11 38.64 −0.9 0.9 2.9 0.6 −6.4 1.1
CPAN 15.08 38.64 1.3 1 3.3 0.6 −7 0.9
LI3D 15.14 38.64 −1.9 0.5 2.8 0.3 −7.4 0.4
LIBI 15.14 38.64 −2.4 1.5 2.7 1.1 −3.1 2.4
LINE 15.11 38.63 −0.6 1.1 1.8 1.2 −9.2 2.8
PANA-PA3D 15.07 38.63 2.1 1.7 −1 0.8 −7.3 2.7
PCOR 15.06 38.64 0.7 1.1 3.7 1 −1.8 3
PNRL 15.1 38.64 2.4 2 −0.1 2.2 −5.5 5.3
Relative to Panarea reference frame
BA3D 15.12 38.66 −0.9 1.1 −2.4 1.2 −4.7 2.9
BOTT 15.11 38.64 −1.2 0.9 0.6 0.6 −6.4 1.1
CPAN 15.08 38.64 0.9 1 0.4 0.6 −7 0.9
LI3D 15.14 38.64 −2.3 0.5 0.5 0.3 −7.4 0.4
LIBI 15.14 38.64 −2.7 1.5 0.4 1.1 −3.1 2.4
LINE 15.11 38.63 −0.9 1.1 −0.6 1.2 −9.2 2.8
PANA-PA3D 15.07 38.63 1.9 1.7 −3.9 0.8 −7.3 2.7
PCOR 15.06 38.64 0.4 1.1 0.6 1 −1.8 3
PNRL 15.1 38.64 2 2 −2.6 2.2 −5.5 5.3
614 Bull Volcanol (2010) 72:609–621
Islets area and the SE portion of Panarea Island (Fig. 2).The velocities of Area B are roughly convergent towardsthe 2002–2003 degassing area.
The horizontal strain rate estimated by STRAINGPSsoftware (Pietrantonio and Riguzzi 2004) of Area B is shownin Fig. 2d. The current deformation of the Islets area showscontraction at 3.7±0.5 μstrain/year with a WNW trend.
Modeling of GPS data
Esposito et al. (2006) interpreted the 2002 gas eruption interms of an accumulation at depth of pressurized gas from asteady or quasi-steady release of gas from a deep magmaticsource, probably a cooling magma body, and from theperiodic release of the overpressure when the tensile strengthof the overlying rocks is overcome either by the increasedinternal pressure or by external changes in the tectonic stress.
Starting with this qualitative model of Panarea volcano,we analytically modeled the GPS results collected between2002, after the November crisis, and 2007.
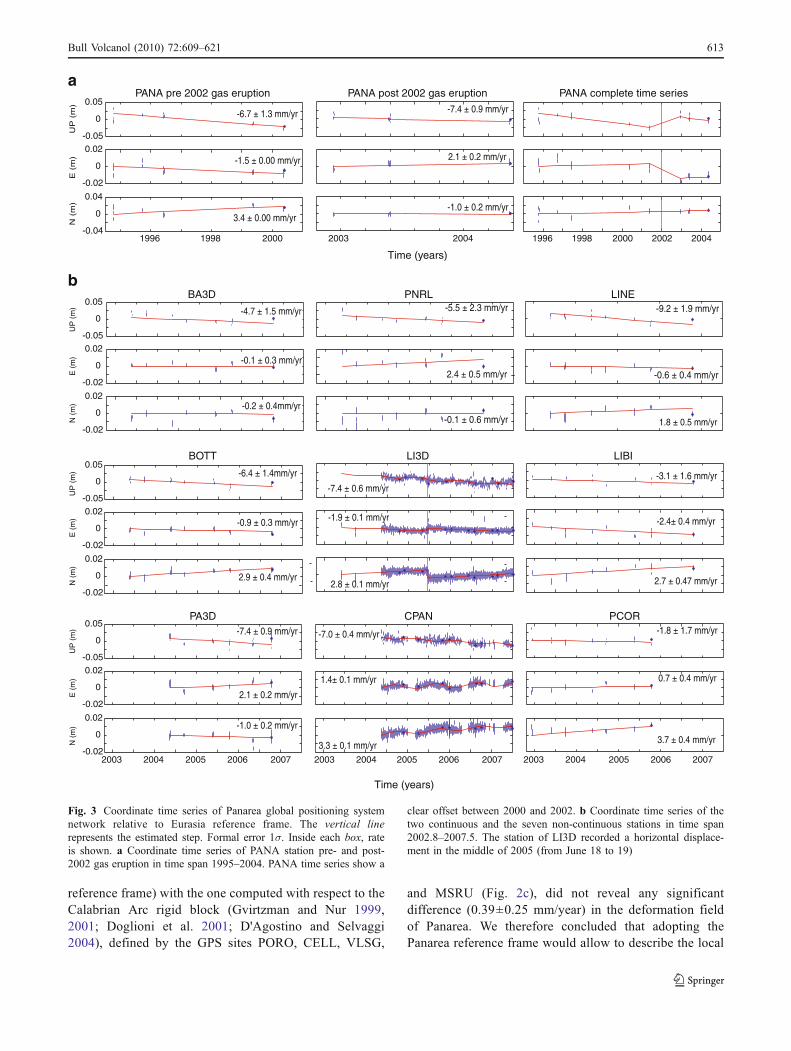
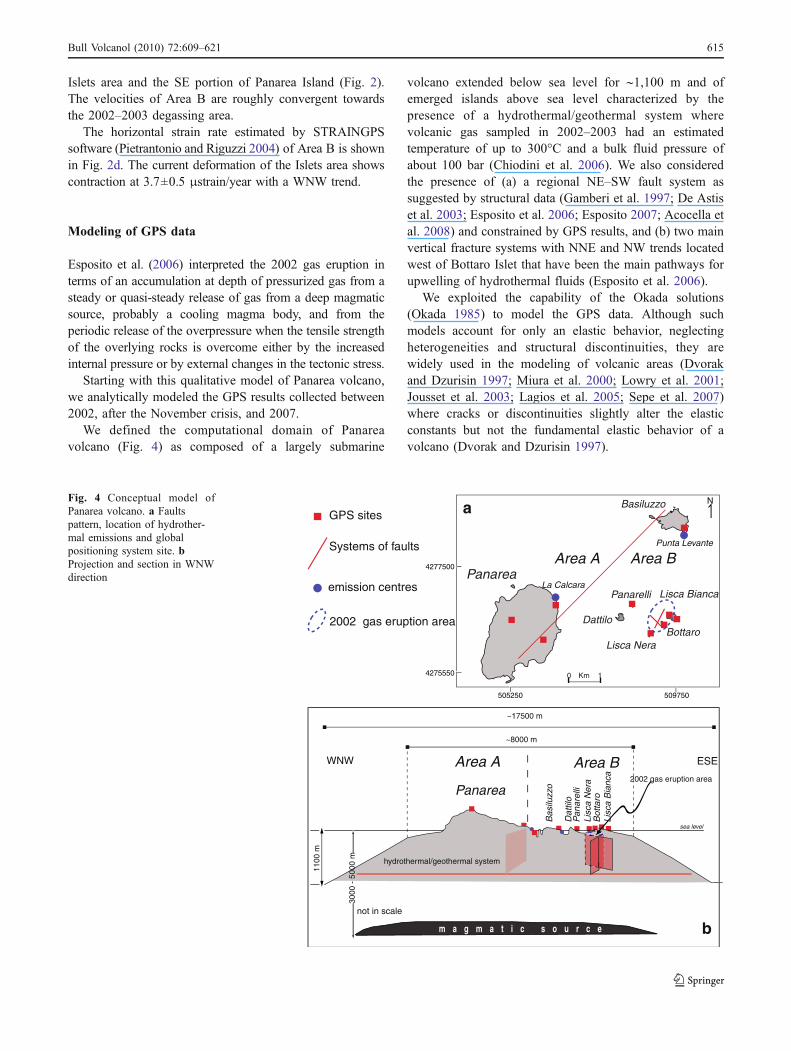
We defined the computational domain of Panareavolcano (Fig. 4) as composed of a largely submarine
volcano extended below sea level for ∼1,100 m and ofemerged islands above sea level characterized by thepresence of a hydrothermal/geothermal system wherevolcanic gas sampled in 2002–2003 had an estimatedtemperature of up to 300°C and a bulk fluid pressure ofabout 100 bar (Chiodini et al. 2006). We also consideredthe presence of (a) a regional NE–SW fault system assuggested by structural data (Gamberi et al. 1997; De Astiset al. 2003; Esposito et al. 2006; Esposito 2007; Acocella etal. 2008) and constrained by GPS results, and (b) two mainvertical fracture systems with NNE and NW trends locatedwest of Bottaro Islet that have been the main pathways forupwelling of hydrothermal fluids (Esposito et al. 2006).
We exploited the capability of the Okada solutions(Okada 1985) to model the GPS data. Although suchmodels account for only an elastic behavior, neglectingheterogeneities and structural discontinuities, they arewidely used in the modeling of volcanic areas (Dvorakand Dzurisin 1997; Miura et al. 2000; Lowry et al. 2001;Jousset et al. 2003; Lagios et al. 2005; Sepe et al. 2007)where cracks or discontinuities slightly alter the elasticconstants but not the fundamental elastic behavior of avolcano (Dvorak and Dzurisin 1997).
m a g m a t i c s o u r c e
~17500 m
sea level
Panarea
Bas
iluzz
o
Dat
tilo
Bot
taro
Lisc
a B
ianc
a
Lisc
a N
era
Pan
arel
li
hydrothermal/geothermal system
~8000 m
3000
- 5
000
m
ESEWNW
not in scale
1100
m
2002 gas eruption area
4275550
4277500
509750505250
PanareaLisca Bianca
BottaroLisca Nera
Panarelli
Dattilo
Basiluzzo N
0 1Km
Area A Area B
Area A Area B
Systems of faults
emission centres
Punta Levante
La Calcara
2002 gas eruption area
a
b
GPS sites
Fig. 4 Conceptual model ofPanarea volcano. a Faultspattern, location of hydrother-mal emissions and globalpositioning system site. bProjection and section in WNWdirection
Bull Volcanol (2010) 72:609–621 615
To reproduce the realistic hydrothermal/geothermalsystem (Fig. 4), we carefully set up a system of fourtensile/shear sources, partially constrained (see Table 3) bythe geochemical, volcanological, and structural remarksillustrated above.
The depth of the pressure source is assessed to bebetween 800 and 900 m, accounting for the geochemicaldata (Chiodini et al. 2006). The NE major regional faultsystem, dipping 70° with an azimuth of 45° from the north(Gamberi et al. 1997; De Astis et al. 2003; Esposito 2007;Acocella et al. 2008), is considered to have an infinitelength to avoid the unrealistic border effects; finally, thetwo vertical fracture systems, NNE (27°) and NW (135°)located at Islets area, are modeled with two segments oflength 1,100 and 800 m, respectively (Esposito et al. 2006).
For the retrieval of the source parameters left free (Table 3),we used a non-linear inversion algorithm based on theLevenberg–Marquardt least-square approach (Levenberg1944; Marquardt 1963) and its implementation in theMINPACK library (Moré et al. 1980). This algorithm is anefficient combination of the gradient descent and the Gauss–Newton algorithms (Press et al. 1992), and the best-fitconfiguration of the parameter vector m is found byminimization of a cost function of the type:
# 2 mð Þ ¼ 1
N
XN
i
di;obs � di;mod mð Þs i
� �2
where, for the ith point, dobs are the observed data, dmod(m)are the predicted data based on the model m, and σi are thestandard deviations coming from the GPS data processing.
Our results (Table 3) show that the source that best fitsthe GPS velocities during post-eruption stage is acomposite by inflation/deflation of a hydrothermal/geo-thermal system combined with movement along theregional NE–SW fault and displacements of the fracturesystems at the 2002 degassing area.
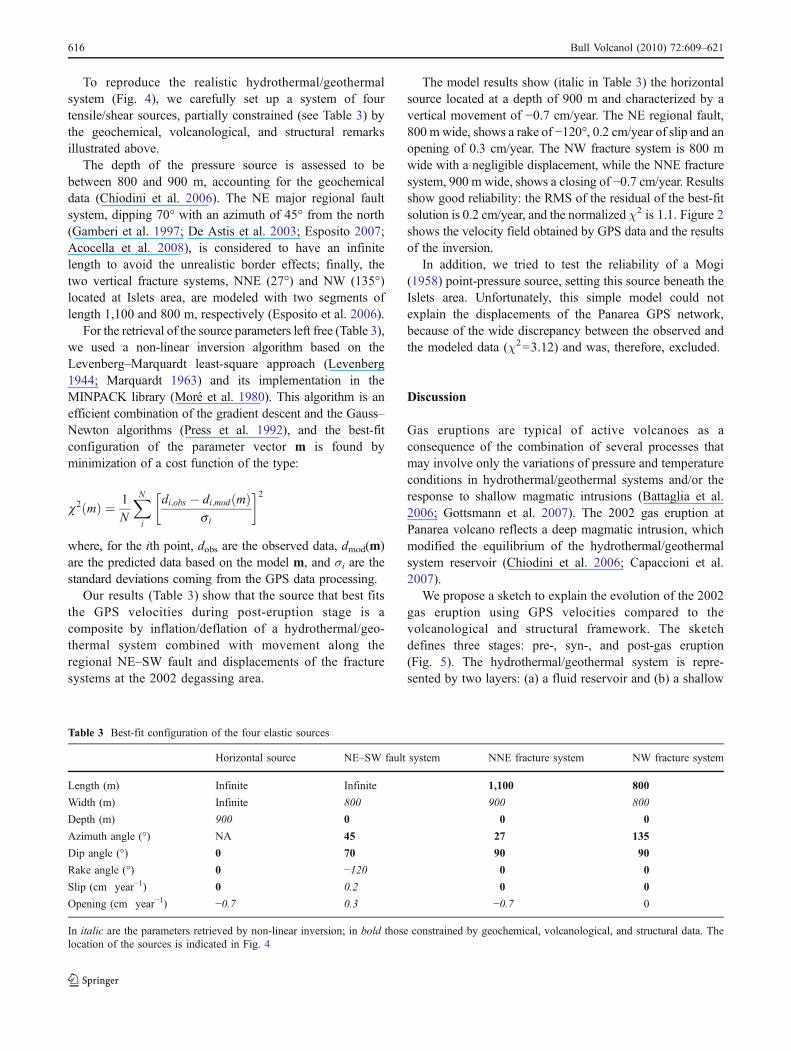
The model results show (italic in Table 3) the horizontalsource located at a depth of 900 m and characterized by avertical movement of −0.7 cm/year. The NE regional fault,800 mwide, shows a rake of −120°, 0.2 cm/year of slip and anopening of 0.3 cm/year. The NW fracture system is 800 mwide with a negligible displacement, while the NNE fracturesystem, 900 m wide, shows a closing of −0.7 cm/year. Resultsshow good reliability: the RMS of the residual of the best-fitsolution is 0.2 cm/year, and the normalized χ2 is 1.1. Figure 2shows the velocity field obtained by GPS data and the resultsof the inversion.
In addition, we tried to test the reliability of a Mogi(1958) point-pressure source, setting this source beneath theIslets area. Unfortunately, this simple model could notexplain the displacements of the Panarea GPS network,because of the wide discrepancy between the observed andthe modeled data (χ2=3.12) and was, therefore, excluded.
Discussion
Gas eruptions are typical of active volcanoes as aconsequence of the combination of several processes thatmay involve only the variations of pressure and temperatureconditions in hydrothermal/geothermal systems and/or theresponse to shallow magmatic intrusions (Battaglia et al.2006; Gottsmann et al. 2007). The 2002 gas eruption atPanarea volcano reflects a deep magmatic intrusion, whichmodified the equilibrium of the hydrothermal/geothermalsystem reservoir (Chiodini et al. 2006; Capaccioni et al.2007).
We propose a sketch to explain the evolution of the 2002gas eruption using GPS velocities compared to thevolcanological and structural framework. The sketchdefines three stages: pre-, syn-, and post-gas eruption(Fig. 5). The hydrothermal/geothermal system is repre-sented by two layers: (a) a fluid reservoir and (b) a shallow
Table 3 Best-fit configuration of the four elastic sources
Horizontal source NE–SW fault system NNE fracture system NW fracture system
Length (m) Infinite Infinite 1,100 800
Width (m) Infinite 800 900 800
Depth (m) 900 0 0 0
Azimuth angle (°) NA 45 27 135
Dip angle (°) 0 70 90 90
Rake angle (°) 0 −120 0 0
Slip (cm year−1) 0 0.2 0 0
Opening (cm year−1) −0.7 0.3 −0.7 0
In italic are the parameters retrieved by non-linear inversion; in bold those constrained by geochemical, volcanological, and structural data. Thelocation of the sources is indicated in Fig. 4
616 Bull Volcanol (2010) 72:609–621
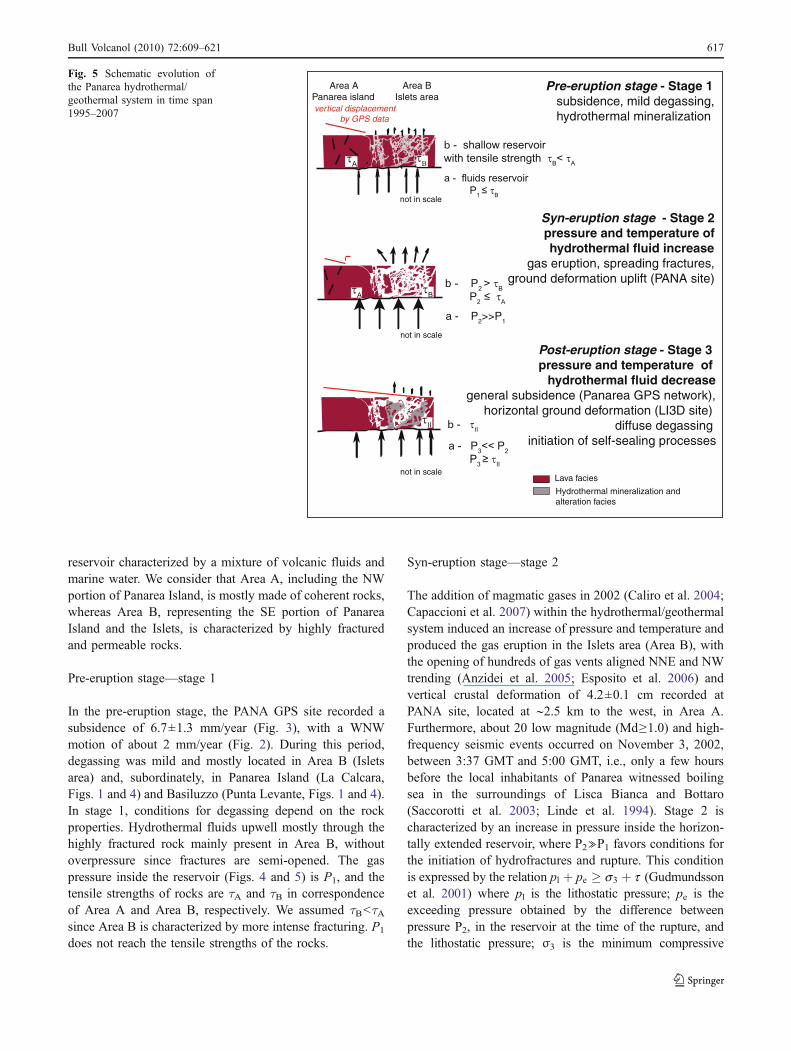
reservoir characterized by a mixture of volcanic fluids andmarine water. We consider that Area A, including the NWportion of Panarea Island, is mostly made of coherent rocks,whereas Area B, representing the SE portion of PanareaIsland and the Islets, is characterized by highly fracturedand permeable rocks.
Pre-eruption stage—stage 1
In the pre-eruption stage, the PANA GPS site recorded asubsidence of 6.7±1.3 mm/year (Fig. 3), with a WNWmotion of about 2 mm/year (Fig. 2). During this period,degassing was mild and mostly located in Area B (Isletsarea) and, subordinately, in Panarea Island (La Calcara,Figs. 1 and 4) and Basiluzzo (Punta Levante, Figs. 1 and 4).In stage 1, conditions for degassing depend on the rockproperties. Hydrothermal fluids upwell mostly through thehighly fractured rock mainly present in Area B, withoutoverpressure since fractures are semi-opened. The gaspressure inside the reservoir (Figs. 4 and 5) is P1, and thetensile strengths of rocks are τA and τB in correspondenceof Area A and Area B, respectively. We assumed τB<τAsince Area B is characterized by more intense fracturing. P1
does not reach the tensile strengths of the rocks.
Syn-eruption stage—stage 2
The addition of magmatic gases in 2002 (Caliro et al. 2004;Capaccioni et al. 2007) within the hydrothermal/geothermalsystem induced an increase of pressure and temperature andproduced the gas eruption in the Islets area (Area B), withthe opening of hundreds of gas vents aligned NNE and NWtrending (Anzidei et al. 2005; Esposito et al. 2006) andvertical crustal deformation of 4.2±0.1 cm recorded atPANA site, located at ∼2.5 km to the west, in Area A.Furthermore, about 20 low magnitude (Md≥1.0) and high-frequency seismic events occurred on November 3, 2002,between 3:37 GMT and 5:00 GMT, i.e., only a few hoursbefore the local inhabitants of Panarea witnessed boilingsea in the surroundings of Lisca Bianca and Bottaro(Saccorotti et al. 2003; Linde et al. 1994). Stage 2 ischaracterized by an increase in pressure inside the horizon-tally extended reservoir, where P2≫P1 favors conditions forthe initiation of hydrofractures and rupture. This conditionis expressed by the relation pl þ pe � s3 þ t (Gudmundssonet al. 2001) where pl is the lithostatic pressure; pe is theexceeding pressure obtained by the difference betweenpressure P2, in the reservoir at the time of the rupture, andthe lithostatic pressure; σ3 is the minimum compressive
Lava facies
Hydrothermal mineralization and alteration facies
not in scale
Area BIslets area
Pre-eruption stage - Stage 1subsidence, mild degassing,hydrothermal mineralization
Area APanarea islandvertical displacement
by GPS data
not in scale
a - P2>>P1
Syn-eruption stage - Stage 2pressure and temperature of hydrothermal fluid increase
gas eruption, spreading fractures,ground deformation uplift (PANA site)
not in scale
Post-eruption stage - Stage 3pressure and temperature of
hydrothermal fluid decreasegeneral subsidence (Panarea GPS network),
horizontal ground deformation (LI3D site) diffuse degassing
initiation of self-sealing processes
Fig. 5 Schematic evolution ofthe Panarea hydrothermal/geothermal system in time span1995–2007
Bull Volcanol (2010) 72:609–621 617

(considered positive) principal stress, acting perpendicular tothe fractures; and τ is the tensile strength of the rocks (τA andτB at Area A and Area B, respectively). Normally, ruptureand initiation of hydrofractures occur when pe reaches thetensile strength of the local rocks (Gudmundsson et al.2001).
Post-eruption stage—stage 3
GPS data collected after the gas eruptive event in the2002–2007 time span (Fig. 3) show a general subsidencewith a mean rate from −3 to −9 mm/year. This subsidenceis likely to be associated with degassing of the hydrother-mal/geothermal system, though a rate of subsidencespread over the region of the Aeolian Islands is present(Bonaccorso 2002; Mattia et al. 2008). The planarvelocities of Area B are roughly convergent towards the2002 degassing area (Fig. 2). The pre-eruption conditions,in terms of flux intensity and geochemical characters, wererestored in a relatively short time as suggested by Capaccioniet al. (2007). Gas pressure decreased (P3≪P2), and thedegassing became located only along the principal locationsof vents opened during the gas eruption within Area B.
Post-eruptive conditions may also involve the discharge ofhydrothermal fluids through opened fractures at Area Bcausing a progressive closure of some fractures by self-sealing processes induced by the progressive drop of pressureand temperature (Gudmundsson 1999; Gudmundsson et al.2001; Olsen and Scholz 1998; Cas et al. 2007) and changingthe intrinsic value τ of the tensile strength of the rocks.
Continuous GPS data collected at the Islets area havealso shown a clear and very rapid deformation withhorizontal, but not vertical, displacements at the LiscaBianca site (Fig. 3).
According to the results of the Okada model (Table 3),the decrease in fluid pressure ΔP that occurred passing fromstage 2 to stage 3 can be determined by using the relation(Gudmundsson 1999):
ΔP ¼ ΔW � E2L 1� n2ð Þ
where ΔW is the modeled displacement, E is Young'smodulus of the rocks in Area B, L is the length of themodeled faults, and 3 is Poisson's ratio of the rocks.
Assuming that the static Young's modulus of the basaltic-dacite outcropping in Area B is E=15 GPa, �=0.25(Gudmundsson 1999; Schultz 1995), and ΔW and L aregiven by the Okada modeling (Table 3), we obtain adecreased fluid pressure of 0.05 MPa for the NNE systemand negligible variations for the NW source.
This rough estimate of the pressure suggests that thepresent-day degassing of the Panarea hydrothermal/geo-
thermal system is mainly controlled by the NW faultssystem present in Area B. At any rate, the effects ofpressure and temperature changes within the hydrothermal/geothermal fluids are distributed throughout Panarea vol-cano, as shown by the subsidence trend and by thehorizontally extended reservoir model (Table 2 and Figs. 2and 5).
The scenario proposed by the modeling of post-eruption stage deformations is consistent with GPSpattern velocities and with tectonic and volcanic data.Velocity patterns can generally be interpreted in terms ofsimple source geometries that represent sills, dikes, orplugs. The migration of hot fluid inside the hydrother-mal/geothermal system plays a role to magnitude andgeometry of ground surface displacements in volcanicsystems (e.g., Todesco et al. 2003, 2004; Battaglia et al.2006; Hurwitz et al. 2007). Our model results point out therole of NE- and NW-trending fractures as the mainpathways for the gas exhalation in the Islets area andidentify the crucial role of the regional discontinuity NE–SW located between Panarea island and Islets area(Gamberi et al. 1997; De Astis et al. 2003; Esposito etal. 2006; Esposito 2007; Acocella et al. 2008). TheNovember 2002 gas eruption can be interpreted as theevolution of a hydrothermal system fed by a deep sourceof magmatic fluids capable to build up pressure andtemperature at some shallow level where the migration offluids causes periodically the tensional strength of theconfining rocks to be overcome, allowing the suddenrelease of the pressurized gas.
The relationship between earthquake and volcanoeruption was revealed by certain statistical analysis ofevents of global scale (Newhall and Dzurisin 1988;Linde and Sacks 1998). In events with Ml≥8, the seismicwave produced by the earthquake may disturb (a) themagma reservoir, leading to eruption, and (b) the status ofthe regional stress by changing it.
The November 3, 2002 gas eruption followed theearthquake (Ml 5.6) of September 6 between Palermo andUstica Island, correlating with several aftershocks, thestrongest of which, Ml 4.3 (Azzaro et al. 2004; Rovelli etal. 2004), and with the onset of the strong eruption at MtEtna on October 27. It preceded the paroxysmal eruption atStromboli that began December 28 and finished with anexplosion on April 5, 2003. The Palermo earthquakechanged the regional strain and triggered the reservoirs ofthree volcanoes (Walter et al. 2009). The eastern portion ofthe Aeolian Islands is characterized by an extensionalregional strain consistent with a greater vulnerability to thedynamic triggering (Hill 2008). A similar sequence ofevents occurred in the Southern Tyrrhenian area in 1865(Esposito et al. 2006; Billi and Funiciello 2008) as reportedby Mercalli (1883).
618 Bull Volcanol (2010) 72:609–621
Conclusion
The implementation and monitoring of the Panarea localGPS network have allowed to define a detailed pattern ofdeformation, unknown before the 2002 gas eruption.Results from the local GPS network are mainly sensitiveto the local deformation field rather than the extensionalregional deformation field recognized in the eastern sectorof the Aeolian Islands.
Two different kinematic domains have been recognizedin the Panarea volcano, separated by the regional NE–SWfault: Area A, which includes NW portion of PanareaIsland, and Area B, which includes the Islets area and SEportion of Panarea Island. In the Islets area, a shorteningWNW trend in the order of 10−6year−1 has been estimatedwithin the 2002–2007 time span. GPS results (2002–2007)have been modeled by an elastic, homogenous, isotropichalf-space system strongly influenced and related tohydrothermal/geothermal fluid migration. The best-fittingmodel for GPS data collected at post-eruption stage wasfound through a combination of Okada sources. One wideand horizontally extended reservoir simulates the source ofpressure within the hydrothermal/geothermal system, at adepth of ∼900 m. The upwelling of gas along the NNE- andNW-trending fractures at Islets area on 2002–2003 wasfavored by tectonic setting and the mechanical property ofrocks. The present-day WNW shortening is consistent withclosing along NNE fractures, as suggested by the Okadamodel. The overpressure data suggests that, presently, thedegassing of the Panarea hydrothermal/geothermal systemis mainly controlled by NW fracture systems.
We also believe that the continuous and generalsubsidence trend observed during the 1995–2007 time spanis mainly due to a decrease of the thermo-baric conditionswithin the hydrothermal/geothermal system, although also asubsidence in the region of the Aeolian Islands isrecognized (Bonaccorso 2002; Mattia et al. 2008).
The November 3, 2002 degassing was triggered bychanges in the extensional regional strain oriented NW–SEin the eastern Aeolian arc. Modeling of GPS data alsoprovides new indications on the regional NE–SW faultsystem that has an oblique kinematics, suggesting anadditional component of dextral shear and a predominantlyNW–SE normal extension observed by structural data. Theextension value estimated by the model (0.3 cm/year) isconsistent with the value <100 nanostrain/year (D'Agostinoand Selvaggi 2004; Esposito 2007) recognized in theeastern Aeolian arc.
The continuous GPS data recording on the Islets area hasallowed to monitor the evolution of the degassing phases,evidencing that horizontal quasi-instantaneous displacementoccurred on June 2005 at Lisca Bianca Islet. Such displace-ment is characterized by aseismic spreading and/or cracks
closure, while vertical displacement has not been recorded.This sudden offset is recorded only at LI3D continuousstation. We suppose that it may be connected to a very localfracture system rather than a signal of broader tectonic origin,probably due to migration of pressurized fluids that exert anadditional pore pressure over country rocks.
The GPS Panarea network is a powerful tool tounderstand the ground deformations at a local scale, in theshort and long-term, due to fluid migration in thehydrothermal/geothermal systems. Therefore, the Panareavolcano deserves the same monitoring and hazard assess-ment effort of any active volcano located nearby humansettlements. In particular, the most critical scenario, of thepotential hazard, is related to phreatic eruptions that mayoccur offshore as well as on the inhabited island of Panarea.
Acknowledgments Funding of this research came from the ItalianCivil Protection Agency. We thank Nicolas Fournier for theconstructive comments to improve the manuscript.
References
Acocella V, Neri M, Walter T (2008) Structural features of Panareavolcano in the frame of the Aeolian arc (Italy): implications forthe 2002–2003 unrest. J Geodyn 47:288–292. doi:10.1016/j.jog.2009.01.004
Altamimi Z, Collilieux X, Legrand J, Garayt B, Boucher C (2007)ITRF2005: a new release of the international terrestrial referenceframe based on time series of station positions and earthorientation parameters. J Geophys Res 112:B09401.doi:10.1029/2007jb004949
Anzidei M (2000) Rapid bathymetric surveys in marine volcano areas:a case study in Panarea area. Phys Chem Earth 25:77–80
Anzidei M, Esposito A (2003) New insights from resolutionbathymetric surveys in the Panarea volcanic complex. http://www.cosis.net/abstracts/EAE03/05923/EAE03-J-05923.pdf
Anzidei M, Baldi P, Casula G, Riguzzi F, Surace L (1995) La reteTyrgeonet. Suppl Bol Geod Sc Aff LIV, 2 Istituto GeograficoMilitare Italiano
Anzidei M, Esposito A, Serpelloni E, Baldi P, Benini A, Giordano G(2003) GPS and bathymetric surveys in the Panarea volcaniccomplex (Aeolian Island, Italy). GNV General Assembly, Roma,9–11 June 2003
Anzidei M, Esposito A, Bortoluzzi G, De Giosa F (2005) The highresolution bathymetric map of the exhalative area of PanareaAeolian islands, Italy. Ann Geophys 48:899–921
Anzidei M, Baldi P, Fabris M (2006) Integrazione di dati fotogram-metrici, LIDAR e batimetrici nell' arcipelago delle isole Eolie.Boll Soc Ital Fotogramm Topogr 1:13–26
Azzaro R, Barbano MS, Camassi R, D'Amico S, Mostaccio A,Piangiamore G, Scarfì L (2004) The earthquake of 6 September2002 and the seismic history of Palermo (Northern Sicily, Italy):implications for the seismic hazard assessment of the city. JSeismol 8:525–543
Barberi F, Gasparini P, Innocenti F, Villari L (1973) Volcanism of theSouthern Tyrrhenian sea and its geodynamic implications. JGeophys Res 78:5221–5232
Battaglia M, Troise C, Obrizzo F, Pingue F, De Natale G (2006)Evidence for fluid migration as the source of deformation at
Bull Volcanol (2010) 72:609–621 619
Campi Flegrei caldera (Italy). Geophys Res Lett 33:L01307.doi:10.1029/2005GL024904
Beccaluva L, Gabbianelli G, Lucchini F, Rossi L, Savelli C (1985)Petrology and K/Ar ages of volcanic dredged from the Aeolianseamounts: implications for geodynamic eruption of the southernTyrrhenian basin. Earth Planet Sci Lett 74:187–208
Bellia S, Carapezza ML, Italiano F, Nuccio PN (1986) Caratteristichedelle emissioni geotermiche sottomarine ad Est di Panarea (IsoleEolie). Proceedings of the V Italian Conference GNGTS 1191-1202
Bellia S, Italiano F, Nuccio PN (1987) Le strutture sommerse ad est diPanarea Isole Eolie: definizione di una loro natura antropica sullabase di studi mineralogici, petrografici e geochimici. I.G.F. C.N.R, Palermo, 3
Billi A, Funiciello R (2008) Concurrent eruptions at Etna, stromboli,and vulcano: casualty or causality? Ann Geophys 51:655–725
Bonaccorso A (2002) Ground deformation of the southern sector ofthe Aeolian Islands volcanic arc from geodetic data. Tectono-physics 351:181–192
Calanchi N, Capaccioni B, Martini M, Tassi F, Valentini L (1995)Submarine gas-emission from Panarea Island Aeolian Archipelago:distribution of inorganic and organic compounds and inferencesabout source conditions. Acta Vulcanol 7:43–48
Calanchi N, Tranne CA, Lucchini F, Rossi PL, Villa IM (1999)Explanatory notes to the geological map (1:10.000) of Panarea andBasiluzzo islands (Aeolian arc. Italy). Acta Vulcanol 11:223–243
Caliro S, Caracausi A, Chiodini G, Ditta M, Italiano F, Longo M,Minopoli C, Nuccio PM, Paonita A, Rizzo A (2004) Evidence ofa new magmatic input to the quiescent volcanic edifice ofPanarea, Aeolian Islands, Italy. Geophys Res Lett 31:L07619.doi:10.1029/2003GL019359
Capaccioni B, Tassi F, Vaselli D, Tedesco D, Rossi PL (2005) TheNovember 2002 degassing event at Panarea Island (Italy): theresults of a 5 months geochemical monitoring program. AnnGeophys 48:755–765
Capaccioni B, Tassi F, Vaselli D, Tedesco D, Poreda R (2007)Submarine gas burst at Panarea Island (Southern Italy) on 3November 2002: a magmatic versus hydrothermal episode. JGeophys Res 112:B05201. doi:10.1029/2006jb004359
Cas RAF, Giordano G, Esposito A, Balsamo F (2007) Hydrothermalbreccia textures and processes: Lisca Bianca Islet, Panarea,Aeolian Islands, Italy. Breccia Symposium – Economic GeologyRes. Unit, James Cook University, Townsville (Australia) 2007
Chiodini G, Caliro S, Caramanna G, Granirei D, Monopoli C, MorettiR, Perotta L, Ventura G (2006) Geochemistry of submarinegaseous emission of Panarea Aeolian Islands, Southern Italy:magmatic vs. hydrothermal origin and implications for volcanicsurveillance. Pure Appl Geophys 163:759–780. doi:10.1007/s00024-006-0037-y
Cocchi L, Caratori Tontini F, Carmisciano C, Stefanelli P, Anzidei M,Esposito A, Del Negro C, Greco F, Napoli R (2008) Lookinginside the Panarea Island (Aeolian Archipelago, Italy) by gravityand magnetic data. Ann Geophys 55:25–38
Dach R, Hugentobler U, Fridez P, Meindl M (2007) Bernese GPSsoftware version 5.0 AIUB
D'Agostino N, Selvaggi G (2004) Crustal motion along the Eurasia-Nubia plate-boundary in the Calabrian Arc and Sicily and activeextension in the Messina Straits from GPS measurements. JGeophys Res 109:B11402. doi:10.1029/2004 JB002998
De Astis G, Ventura G, Vilardo G (2003) Geodymamic significance ofthe Aeolian volcanism (Southern Tyrrhenian Sea, Italy) in lightof structural, seismological and geochemical data. Tectonics22:1040. doi:10.1029/2003TC001506
Doglioni C, Innocenti F, Mariotti G (2001) Why Mt Etna? Terra Nova13:25–31
Dolfi D, de Rita D, Cimarelli C, Mollo S, Soligo M, Fabbri M (2007)Dome growth rates, eruption frequency and assessment of
volcanic hazard: insights from new U/Th dating of the Panareaand Basiluzzo dome lavas and pyroclastics, Aeolian Islands,Italy. Quat Int 162–163:182–194
Dvorak J, Dzurisin D (1997) Volcano geodesy: the search for magmareservoirs and the formation of eruptive vents. Rev Geophys35:343–384
Esposito A (2007) Studio della deformazione geodetica delle IsoleEolie con particolare riferimento al vulcano di Panarea. PhDthesis, Alma Mater Studiorum, University of Bologna, Italy
Esposito A, Giordano G, Anzidei M (2006) The 2002–2003submarine gas eruption at Panarea volcano Aeolian Islands,Italy: volcanology of the seafloor and implications for the hazardscenario. Mar Geol 227:119–134
Esposito A, Anzidei M, Pesci A, Pietrantonio G, Giordano G(2008) Evidence of active deformation of the Panarea volcano(Aeolian Island, Italy) from GPS data. J Volcanol GeothermRes (in press)
Faccenna C, Becker TW, Lucente FP, Jolivet L, Rossetti F (2001)History of subduction and back-arc extension in the centralMediterranean. Geophys J Int 145:809–820
Favalli M, Kartson D, Mazzuoli R, Pareschi MT, Ventura G (2005)Volcanic geomorphology and tectonics of the Aeolian archipelagoSouthern Italy based on integrated DEM data. Bull Volcanol68:157–170
Gabbianelli G, Gillot PY, Lanzafame G, Romagnoli C, Rossi PL(1990) Tectonic and volcanic evolution of Panarea (AeolianIsland, Italy). Mar Geol 92:312–326
Gabbianelli G, Romagnoli C, Rossi PL, Calanchi N (1993) Marinegeology of Panarea–Stromboli area, Aeolian Archipelago, South-eastern Tyrrhenian sea. Acta Vulcanol 3:11–20
Gamberi F, Marani PM, Savelli C (1997) Tectonic volcanic andhydrothermal features of submarine portion of Aeolian arc(Tyrrhenian Sea). Mar Geol 140:167–181
Gottsmann J, Carniel R, Coppo N, Wooller L, Hautmann S, Rymer H(2007) Oscillations in hydrothermal systems as a source ofperiodic unrest at caldera volcanoes: multiparameter insightsfrom Nisyros. Greece. Geophys Res Lett 34:L07307.doi:10.1029/2007gl029594
Gudmundsson A (1999) Fluid overpressure and stress drop in faultzones. Geophys Res Lett 26:115–118
Gudmundsson A, Berg SS, Lyslo KB, Skurtveit E (2001) Fracturenetworks and fluid transport in active fault zones. J Struct Geol23:343–353
Gvirtzman Z, Nur A (1999) The formation of Mount Etna as theconsequence of slab rollback. Nature 401:782–785
Gvirtzman Z, Nur A (2001) Residual topography, lithosphericstructure and sunken slabs in the central Mediterranean. EarthPlanet Sci Lett 187:117–130
Hill DP (2008) Dynamic stresses, coulomb failure, and remote triggering.Bull Seismol Soc Am 98:66–92. doi:10.1785/0120070049
Hollenstein CH, Kahle HG, Geiger A, Jenny S, Goes S, Giardini D(2003) New GPS constraints on the Africa-Eurasia plate boundaryzone in southern Italy. Geophys Res Lett 30(18):1935. doi:10.1029/2003GL017554
Hurwitz S, Christiansen LB, Hsieh PA (2007) Hydrothermal fluidflow and deformation in large calderas: inferences from nume-rical simulations. J Geophys Res 112:B02206. doi:10.1029/2006JB004689
Italiano F, Nuccio PM (1991) Geochemical investigations of subma-rine volcanic exhalations to the east Panarea, Aeolian Islands,Italy. J Volcanol Geotherm Res 46:125–141
Jousset P, Mori H, Okada H (2003) Elastic models for the magmaintrusion associated with the 2000 eruption of Usu Volcano,Hokkaido, Japan. J Volcanol Geotherm Res 125:81–106
Lagios E, Sakkas V, Parcharidis I, Dietrich V (2005) Grounddeformation of Nisyros Volcano (Greece) for the period 1995–
620 Bull Volcanol (2010) 72:609–621
2002: Results from DInSAR and DGPS observations. BullVolcanol 68:201–214. doi:10.1007/s00445-005-0004-y
Levenberg K (1944) A method for the solution of certain non-linearproblems in least squares. Q Appl Math 2:164–168
Linde AT, Sacks IS (1998) Triggering of volcanic eruptions. Nature395:888–890
Linde AT, Sacks IS, Johnston MJS, Hill DP, Bilham RG (1994)Increased pressure from rising bubbles as a mechanism forremotely triggered seismicity. Nature 371:408–410
Lowry AR, Hamburger MW, Meerten CM, Ramo G (2001) GPSmonitoring of crustal deformation at Taal Volcano, Philippines. JVolcanol Geotherm Res 105:35–47
Lucchi F, Tranne CA, Calanchi N, Keller J, Rossi PL (2007)Geological map of Panarea and minor islets (Aeolian Islands).University of Bologna, University of Freiburg and INGV, L.A.C.Firenze
Marquardt D (1963) An algorithm for least-squares estimation ofnonlinear parameters, SIAM. J Appl Math 11:431–441
Mattia M, Palano M, Bruno V, Cannavò F, Bonaccorso A, Gresta S(2008) Tectonic features of the Lipari–Vulcano complex (Aeolianarchipelago, Italy) from 10 years (1996–2006) of GPS data. TerraNova 20:370–377
Mercalli G (1883) Vulcani e fenomeni Vulcanici. In: Negri G,Stoppani A, Mercalli G (eds) Geologia d'Italia. Arnoldo ForniPress, Sala Bolognese, p 374
Miura S, Ueki S, Sato T, Tachibana K, Hamaguchi H (2000) Crustaldeformation associated with the 1998 seismo-volcanic crisis ofIwate Volcano, Northeastern Japan, as observed by a dense GPSnetwork. Earth Planet Space 52:1003–1008
Mogi K (1958) Relations between eruptions of various volcanoes andthe deformation of the ground surface around them. Bull EarthqRes Inst Univ Tokyo 36:99–134
Moré JJ, Garbow BS, Hillstrom KE (1980) User guide forMINPACK-1, Argonne National Laboratory, Rep ANL-80-74
Newhall CG, Dzurisin D (1988) Historical unrest at large calderas ofthe world. US Geol Surv Bull 1855:19–20
Okada Y (1985) Surface deformation due to shear and tensile faults ina half-space. Bull Seismol Soc Am 75:1135–1154
Olsen MP, Scholz C (1998) Healing and sealing of a simulated faultgouge under hydrothermal conditions: implications for faulthealing. J Geophys Res 103(B4):7421–7430
Pietrantonio G, Riguzzi F (2004) Three-dimensional strain tensorestimation by GPS observations: methodological aspects andgeophysical applications. J Geodyn 38:1–18
Pondrelli S, Piromallo C, Serpelloni E (2004) Convergence vs. retreatin southern Tyrrhenian Sea: insights from kinematics. GeophysRes Lett 31:L06611. doi:10.1029/2003GL019223
Press WH, Teukolsky S, Vetterling WT, Flannery BP (1992)Numerical recipes in C. Cambridge University Press, Cambridge
Romano R (1973) Le isole di Panarea e Basiluzzo. Riv Min Sicil 139–141:49–86
Rovelli A, Vuan A, Mele G, Priolo E, Boschi E (2004) Rarelyobserved shortperiod (5–10 s) suboceanic Rayleigh wavespropagating across the Tyrrhenian Sea. Geophys Res Lett 31:L22605. doi:10.1029/2004GL021194
Saccorotti G, Galluzzo D, La Rocca M, Del Pezzo E, Patanè D (2003)Attività sismica registrata a Panarea. In “Convenzione DPC-INGV per lo studio e il monitoraggio dello Stromboli e Panarea”.Istituto Nazionale di Geofisica e Vulcanologia, Repertorio n.427del 20.6.2003. Relazione sull'attività 2003
Schultz RA (1995) Limits on strength and deformation properties ofjointed basaltic rock masses. Rock Mech Rock Eng 28:1–15
Selvaggi G, Avallone A, D' Agostino N, Abruzzese L, Anzidei M,Cantarero M, Cardinale V, Castagnozzi A, Casula G, Cecere G,Cogliano R, Criscuoli F, D' Ambrosio C, D' Anastasio E, DeMartino P, Del Mese S, De Luca G, Devoti R, Falco L, FlammiaV, Galvani A, Giovani L, Hunstrad I, Massucci A, Mattia M,Memmolo A, Migliari F, Minichiello F, Moschillo R, Obrizzo F,Palano M, Pietrantonio G, Pignone M, Pulvirenti M, Rossi M,Riguzzi F, Serpelloni E, Tammaro U, Zarrilli L (2006) La “reteintegrata nazionale GPS” (RING) dell'INGV: una infrastrutturaaperta per la ricerca scientifica. Proc ASITA 10:1749–1754,http://ring.gm.ingv.it/
Sepe V, Atzori S, Ventura G (2007) Subsidence due to crack closureand depressurization of hydrothermal systems: a case study fromMt Epomeo (Ischia Island, Italy). Terra Nova 19:127–132.doi:10.1111/j.1365-3121.2006.00727
Serpelloni E, Anzidei M, Baldi P, Casula G, Galvani A (2005) Crustalvelocity and strain-rate fields in Italy and surrounding regions:new results from the analysis of permanent and non-permanentGPS networks. Geophys J Int 161:861–880. doi:10.1111/j.1365-246X.2005.02618.x
Serpelloni E, Cavaliere A, Pietrantonio G, Galvani A, Esposito A,Sepe V, Devoti R, Riguzzi F (2007) Data analysis of permanentGPS sites (RING) Italy. Eos Trans AGU, 88(52), Fall MeetAbstract G21C-0659
Surace L (1993) Il progetto IGM95. Boll Geod Sci Affini 3:220–230Tallarico A, Dragoni M, Anzidei M, Esposito A (2003) Modeling
long-term round deformation due to the cooling of a magmachamber: case of Basiluzzo island, Aeolian islands, Italy. JGeophys Res 108:2568. doi:10.1029/2002 JB002376
Tikku AA, McAdoo DC, Schenewerk MS, Willoughby EC (2006)Temporal fluctuations of microseismic noise in yellowstone'supper geyser basin from a continuous gravity observation.Geophys Res Lett 33:L11306. doi:10.1029/2006gl026113
Todesco M, Rutqvist, J, Pruess, K, Oldenburg, C (2003). Multi-phasefluid circulation and ground deformation: a new perspective onbradyseismic activity at the Phlegrean Fields (Italy). In: Proceed-ings of the 28th Workshop on Geothermal Research Engineering,Stanford, CA, USA
Todesco M, Rutqvist J, Chiodini G, Pruess K, Oldenburg CM (2004)Modeling of recent volcanic episodes at Phlegrean Fields Italy:geochemical variations and ground deformation. Geothermics33:531–547
Walter TR, Wang R, Acocella V, Neri M, Grosser H, Zschau J (2009)Simultaneous magma and gas eruptions at three volcanoes insouthern Italy: an earthquake trigger? Geology 37:251–254
Williams SDP (2003) The effect of coloured noise on theuncertainties of rates estimated from geodetic time series. JGeod 76:483–494
Bull Volcanol (2010) 72:609–621 621