Ecology, management and monitoring of grey dunes in Flanders
Journal of Arid Environments (1994) 28:95-116
Aeolian-climatic thresholds and sand dunes at the Hanford Site, south-central Washington, U.S.A.
D . R . G a y l o r d & L . D . S t e t l e r
Washington State University, Pullman, Washington 99164-2812, U.S .A .
(Received 1993, accepted July 1993)
Aeolian-climatic thresholds are quantified using time sequence analysis of 1948-87 aeolian and climatic data from the Hanford Site, south-central Washington. Calculations indicate that 30 unvegetated sand dunes will maintain their total 1987 volume if they are exposed to a climate having an average annual precipitation, wind speed, and temperature of approximately 15" 5 cm, 3" 5 m s -l, and 11'8°C, respectively. Calculations also show that if average 1948-87 climate conditions continue for the next approximately 10-15 years, the volume of unvegetated dune sand in the dunes studied will decrease by approximately 18%. Aeolian--climatic projections are based on the assumptions that there will be no major changes in human, animal, or botanical impact on the surface and no major variations from historical seasonal climatic patterns.
Keywords: aeolian; climate change; sand dunes; climatic thresholds; Holocene
Introduction
Concerns over potential global climate change (Manabe & Wetherald, 1986; Schneider, 1989; Adams et al., 1990; Aldhous, 1991) have stimulated recent investigations into the character and climatic implications of Quaternary sand dunes and other aeolian-induced modifications of the earth's surface (Lancaster, 1991; Muhs, 1991; Swinehart, 1991; Forman et al., 1992). Sand dunes have received particular attention because of their potential to mirror both long- and short-term climatic fluctuations (e.g. Ahlbrandt, 1974; Warren, 1976; Gaylord, 1982, 1990; Ahlbrandt etal., 1983; Muhs, 1985; Lancaster, 1988; Forman et al., 1992; Jorgensen, 1992) and to impact the productivity of nearby agricultural lands. Unfortunately, sand dunes preserve few indicators of the actual climatic conditions (i.e. precipitation, wind speed, and temperature) that induced and/or maintained their activity. Such climatic indicators often must be discerned from analysis of complimentary fossil, tree ring, isotope, archaeological, and glacial geologic data. However, even this complementary data may not be sufficiently complete to characterize the climatic conditions under which the dunes acted. With this problem in mind, we undertook to document aeolian-climatic interactions using a limited number of sand dunes from a climatologically well-monitored area.
This paper describes basic aeolian-climatic interactions that have occurred at the Hartford Site, south-central Washington since approximately 1948. The primary goal of this work is to identify specific climatic values at which sand dune activity has increased, decreased, or remained stable. Because of limited data, the research addresses only the most fundamental interactions between aeolian and climatic parameters. Values of these
0140-1963/94/020095 + 22 $08'00/0 © 1994 Academic Press Limited
96 D.R. GAYLORD & L. D. STETLER
aeolian and climatic parameters form the basis for what we have termed 'aeolian--climatic thresholds'. Aeolian activity is characterized by measuring sand dune heights, areas, volumes, and migration rates (primarily using air photos) from 30 unvegetated sand dunes located in the eastern third of the Hanford Site. Climatic parameters are restricted to precipitation, temperature, and wind speed data taken from Hanford Site and old Hanford townsite recording stations.
The research reported here is similar in scope to that of Lancaster (1988) who developed sand dune mobility indices for some southern African sand dunes based on characteriz- ations of moisture balance and threshold wind speeds. Our work differs from that of Lancaster (1988) in the individual treatment of fundamental climatic factors, the quanti- fication of the aeolian parameters of height, area, volume, and migration rate for individual dunes, and the time-sequence analysis of the aeolian-climatic data. To our knowledge, no similarly detailed comparisons between sand dune character and climatic data have been attempted for other North American sand dunes.
Specific interest in aeolian activity that either has affected or will affect the Hanford Site derives from questions regarding how such aeolian activity might influence the soil-water balance of 'protective barriers' being designed to store various toxic and low-level radioactive wastes for a minimum of 10 millennia (Petersen, 1989; Ligotke & Klopfer, 1990; Wing & Gee, 1990). The aeolian--climatic thresholds presented here should help address those questions.
Hanford Site overview
Physiography and geology
The Hanford Site is located in the Pasco Basin, a generally low-relief structural and topographic basin within the Yakima Fold Belt subprovince of the Columbia River Plateau Physiographic Province (Thornbury, 1965) (Fig. 1). A series of WNW- to ESE-trending
N
1 2 1 o 1 1 9 ° 1 1 7 °
WASHINGTON ~ff
(ii:iiii:i Seattle ~ _ ~ Spokane 48 °
" . . ' . .
. . • . . . . . . . • . . . " ~ . . . .
" ~ ~ j . . . . . . . . • . • . . . .
m~ia c ~ " ' " ' . " "'" " :'" " ' "'' " "" : " " '" 47¢'
e~ \.'. - . • I . " • - ' . • . • •
Colu River Plateau ~ H:a£:fiii"Site' - -.I l~[ PhysiographieProvince "~3." :?. " ~ . - - ~ - L : ~ : : - . ~ T N . 1
/ I . . • . • . " . " . " "
Figure 1. Overview map of Washington showing the location of the Hartford Site, Columbia River Plateau physiographic province, Pasco Basin, and the Columbia, Yakima and Snake Rivers.
AEOLIAN-CLIMATIC THRESHOLDS AND SAND DUNES 97
anticlinal basalt ridges and hills at Hanford rise from 500-1000 m above steep colluvial slopes, elongate synclinal valleys, and broad, low-sloping alluvial surfaces. Hanford Site geology is characterized by variably deformed Miocene to Recent volcanic and sedimentary strata. Four principal stratigraphic units are recognized at Hanford, these are, in ascending order, the Miocene Columbia River Basalt Group, Miocene (?) to Pliocene Ringold Formation, Pleistocene Hanford formation (informal) and unnamed Holocene alluvial, colluvial, and aeolian deposits.
Except for anticlinal basalt ridges and hills, most surfaces on the Hanford Site are capped with alluvial and/or aeolian sediments. Most alluvial sediments are relics from the late Pleistocene glacial outburst floods that generated the channeled scablands in eastern Washington (Mullineaux et al . , 1977; Myers et al . , 1979; Waitt, 1985; Smith, 1993. Reworking of these sediments by the wind is recorded by extensive late Quaternary aeolian accumulations across much of the Pasco Basin, including the Hanford Site. Sand dunes are the most obvious and abundant aeolian deposits and are confined primarily to the lower elevations.
N
t r . . . . .
i- F
Qa
U r~t~d~eU~ Gable Mountain
Yakima~. Qa • R ~ HMS
Hanford Site Boundary /
\
%
Qm
I Qda
--k. Scale I
5 ;Okm
W~EEB
Qa
I L- L
-I
Qm
Test Area Dunes
%
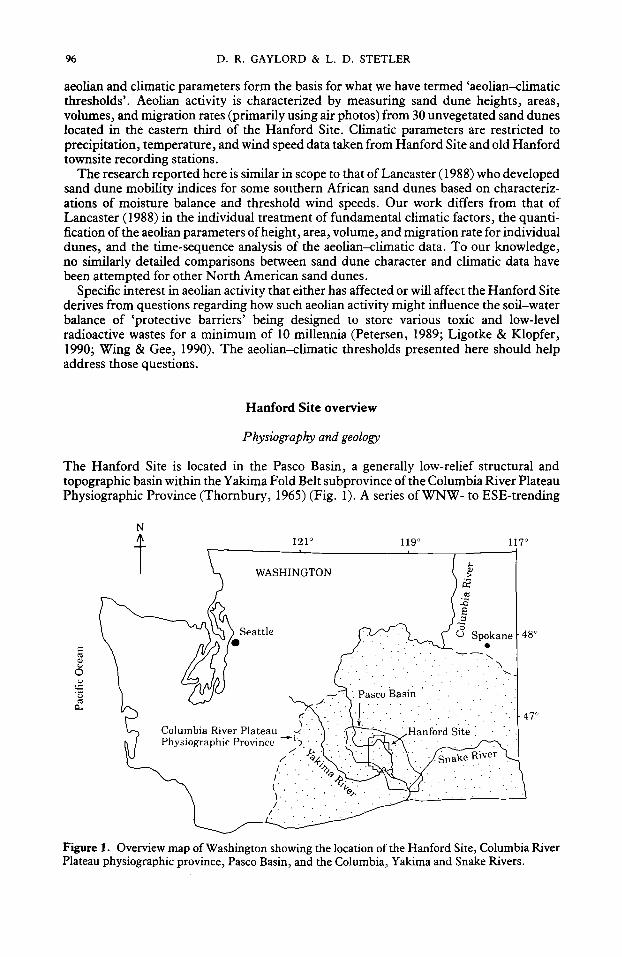
Figure 2. Geologic map showing distribution of Quaternary units on the Hanford Site. Qa is wind- scoured alluvium and bedrock with subordinate aeolian deposits; Qds is stabilized dune sand and subordinate alluvium; Qda is active, predominantly unvegetated dune sand; Qm is a complex mixture of Qa, Qds, and Qda. Map also shows active dune test areas (where aeolian parameters were measured), as well as the location of major bedrock ridges and hills (e.g. Gable Mountain, Umtanum Ridge), Wye barricade (WYEB), Hanford Meteorological Station (HMS), Old Hanford townsite, and Washington Public Power Supply System (WPPSS) site.

98 D. R. GAYLORD & L. D. STETLER
Active dune sands mantle approximately 5% of the Hanford Site and are concentrated in a 25 km 2 zone approximately 5 km north of the Washington Public Power Supply System (WPPSS) nuclear facilities west of the Columbia River and Ringold Flats (Fig. 2). Most active dunes at Hartford possess slipfaces. All active dunes have some vegetative cover which commonly is concentrated along the lower dune flanks. Sand dune morphologies reflect dominant west to east migration.
Air photo analyses indicate that active sand dune morphologies at Hanford have varied systematically since at least 1948. Active sand dunes have changed from barchan-, barchanoid ridge-, and transverse ridge dunes in the 1940s to increasingly vegetationally- controlled parabolic and blowout forms from the mid-1960s onward. Encroachment of vegetation onto the active sand dunes has proceeded primarily from peripheral areas surrounding less-vegetated, more active dune interiors. Such peripheral encroachment of vegetation is common in even the more arid, desert dune fields (McKee, 1966; Glennie, 1970; Cooke & Warren, 1973).
Climate
The Hanford Site is characterized by warm, dry summers and cool, damp winters (Liverman, 1975) reflecting the influence of the Cascade Range and Rocky Mountains on prevailing weather patterns (Kasper & Glantz, 1987). The Cascades lessen the maritime influence of the nearby Pacific Ocean and also contribute to the generally semi-arid climate of the Hanford area via a rain shadow effect. The Rocky Mountains tend to protect the region from the extreme cold and severe winter storms prevalent east of the Continental Divide.
Stone et al . , (1983) have summarized climatic data collected on and near the Hanford Site for 1912-80. Climatic data since 1980 was obtained from the Pacific Northwest Laboratory (PNL) Atmospheric Sciences Department. The most complete on-site climate record has come from the Hanford Meteorological Station (HMS) where data has been collected since December 1944. Data recorded at HMS include ambient air temperature, precipitation, barometric pressure, wind speed, and wind direction (Stone et al . , 1983). A less complete climatic record (limited to monthly ambient air temperature and precipitation) was collected at the old Hanford townsite (Fig. 2) from 1912-44.
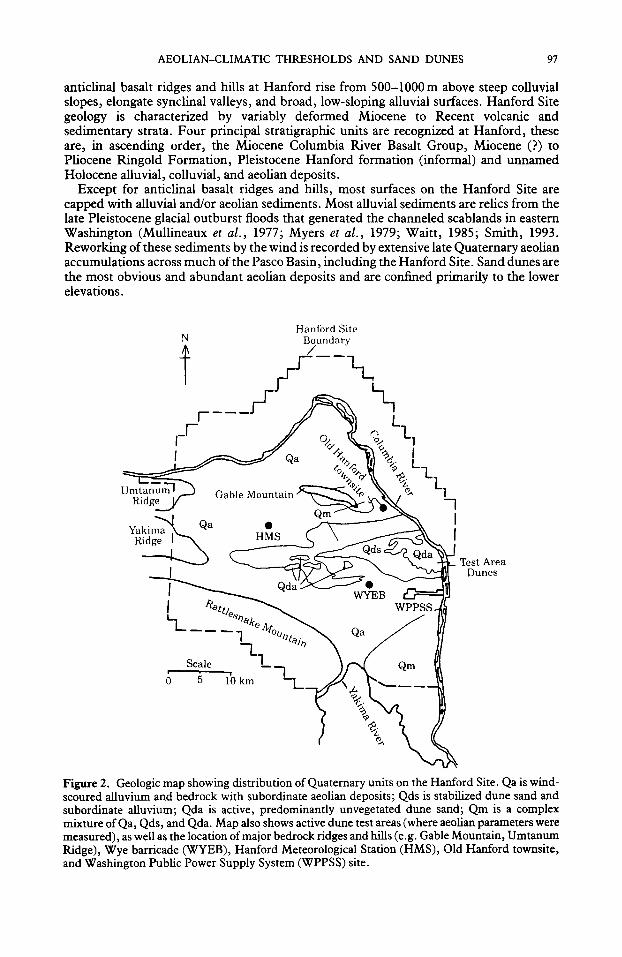
Historical (1912-87) averaged annual precipitation at Hanford is 16"0 cm, whereas the average annual precipitation from 1912-47 is 15"3 cm or 95"4% of the historical average. From 1948-87, average annual precipitation increased to 16"6cm or 104"6% of the historical average. Over 52% of the total annual precipitation normally falls between November and February while less than 12% of the total annual precipitation falls between July and September (Fig. 3).
High levels of evaporation and transpiration at Hanford promote persistently dry soils. Average annual pan evaporation is > 152 cm, average annual lake evaporation is > 100 cm (Kasper & Glantz, 1987), and average annual potential evapotranspiration, determined by the modified Thornthwaite method (Thornthwaite, 1948; Valenzuela, 1974), is approximately 48 cm. Groundwater recharge results primarily from winter precipitation (Liverman, 1975).
The historical (1912-87) average annual temperature at the Hartford Site is 11"7°C with only the January mean temperature falling below 0°C (Stone et al . , 1983). Normally, the average soil temperature measured at a depth of 0"2 cm is <0°C only during January; however, in severe winters, near-surface soils may remain frozen during all or parts of December, January, and February (Stone et al . , 1983). Temperatures of at least 0°C are normally recorded on all but 24 days of the year with days of subfreezing temperatures usually confined to between November and February. On average, the first frost occurs by 15 October and the last frost by 23 April. Temperatures in excess of 32°C typically occur by 23 May while the last 32°C temperature day usually is recorded by 13 September.
AEOLIAN-CLIMATIC THRESHOLDS AND SAND DUNES 99
v
e ~
t3.
i t
1 tl o I . . . . . . ,J F M A M ,J d A S O
Month
N D
Figure 3. Average monthly precipitation on and adjacent to the Hanford Site for the historical interval, 1912-87. Data from Stone et al. (1983) and Pacific Northwest Laboratory Hartford Meteorological Station (HMS) (Hoitink, pers. comm.).
The most complete analysis of wind character from the Hanford Site and vicinity incorporates data from all 25 stations of the Hanford Meteorology Monitoring Network (HMMN) for the period 1982-89 (Glantz et a l . , 1990). Glantz et al. (1990) reduced data for each H M M N station into frequency distribution of wind speed and direction, joint frequency distribution of atmospheric stability, and sand drift potential (a measure of effective sand-moving winds) (Fryberger, 1979). Effective sand-moving winds are defined as those necessary to initiate and sustain movement of average-sized loose sand (estimated at 0" 27 mm (1-9 @) for actively migrating Hartford sand dunes). The effective sand-moving wind at Hartford was calculated using Bagnold's (1941) empirically-tested entrainment equation:
Vz = 5"75V* log z/z0 (1)
where:
Vz = Velocity measured at some height z above the surface. 5"75 = empirically-derived constant expressing the proportionality between the
change in wind velocity and log-height. V* = Threshold shear velocity.
z = Height at which wind velocity Vz is measured. z 0 = Surface roughness factor.
Using equation (1), the effective sand moving wind measured at 15"2 m above the surface (the height of the 50 ft anemometer at HMS) is in excess of 6"7 m s -1 while the effective sand-moving wind at 9" 1 m, the height of all other H M M N anemometers, is 6"4 m s -1 Such effective sand-moving winds occur for a combined total of 39 days (approximately 940 h) at HMS and 42 days (approximately 1000 h) at the Wye barricade (WYEB), the nearest H M M N station to the most active Hartford dunes.
In general, H M M N stations from the central, western, and northwestern part of the Hartford Site record winds that are NW- and NNW-dominated. All other stations record SW- and SSW-dominated winds. This difference in airflow character between stations convinced Kasper & Glantz (1987) to rely on anemometer records from the full H M M N in order to characterize site-wide wind patterns. Unfortunately, all stations in the H M M N except wide for HMS have relatively short-term (generally less than 7 year) records. Because of the need in this study to characterize airflow for a period corresponding with air photo coverage (i.e. 1948-87), we chose to use the long-term anemometer data from the HMS as the primary wind data source. HMS wind data were compared with those from
100 D. R. GAYLORD & L. D. STETLER
0.16
~).12
().(),q
(I.04
N NE E SE Y; SW W NW
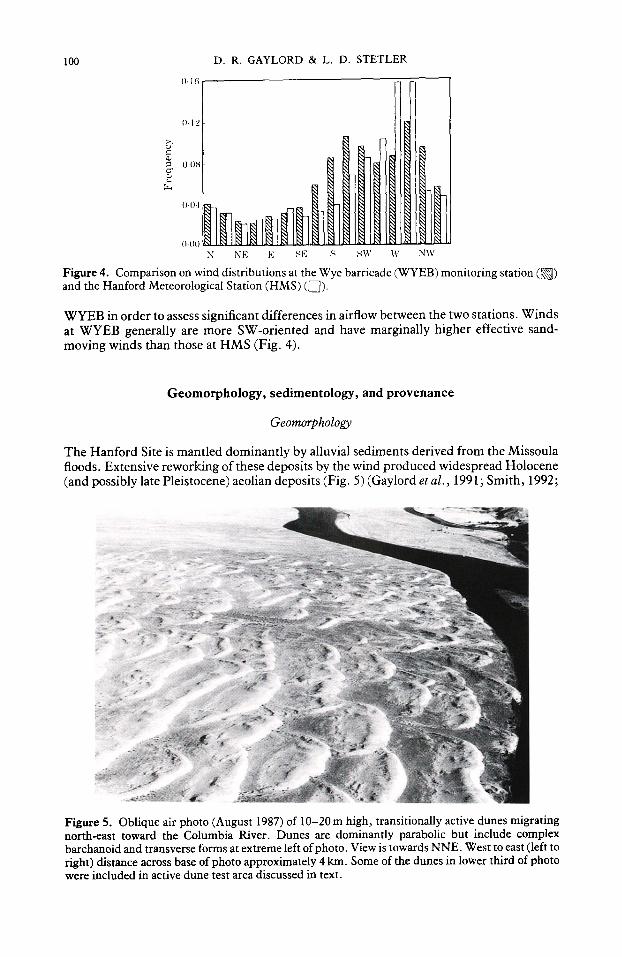
Figure 4. Comparison on wind distributions at the Wye barricade (WYFB) monitoring station ([~x-~) and the Hanford Meteorological Station (HMS) ([~).
WYEB in order to assess significant differences in airflow between the two stations. Winds at WYEB generally are more SW-oriented and have marginally higher effective sand- moving winds than those at HMS (Fig. 4).
Geomorphology, sedimentology, and provenance
Geomorphology
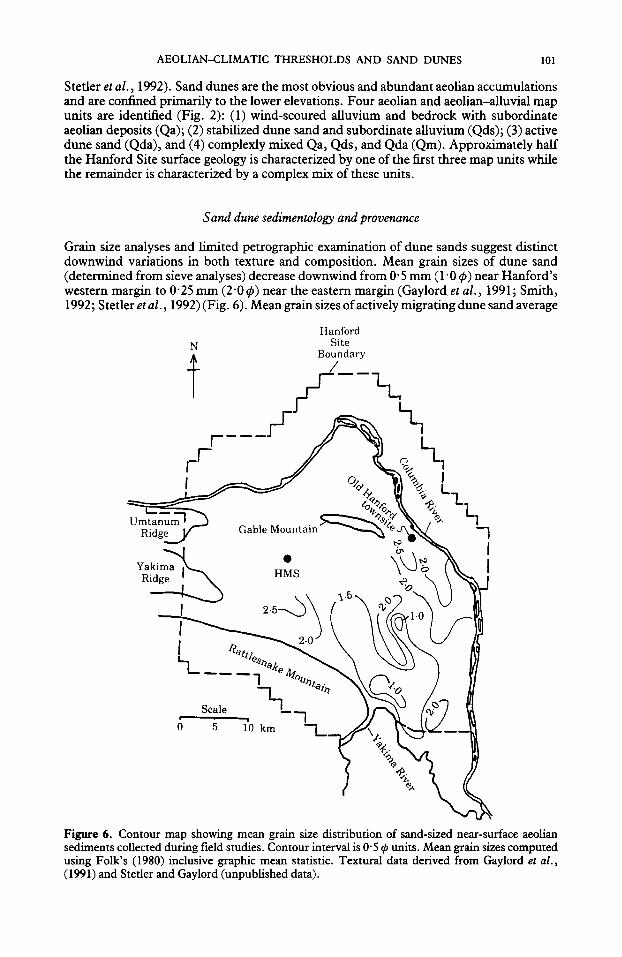
The Hanford Site is mantled dominantly by alluvial sediments derived from the Missoula floods. Extensive reworking of these deposits by the wind produced widespread Holocene (and possibly late Pleistocene) aeolian deposits (Fig. 5) (Gaylord et al., 1991; Smith, 1992;
Figure S. Oblique air photo (August 1987) of 10-20 m high, transitionally active dunes migrating north-east toward the Columbia River. Dunes are dominantly parabolic but include complex barchanoid and transverse forms at extreme left of photo. View is towards NNE. West to east (left to right) distance across base of photo approximately 4 km. Some of the dunes in lower third of photo were included in active dune test area discussed in text.
AEOLIAN--CLIMATIC THRESHOLDS AND SAND DUNES 101
Stetler et al., 1992). Sand dunes are the most obvious and abundant aeolian accumulations and are confined primarily to the lower elevations. Four aeolian and aeolian-alluvial map units are identified (Fig. 2): (1) wind-scoured alluvium and bedrock with subordinate aeolian deposits (Qa); (2) stabilized dune sand and subordinate alluvium (Qds); (3) active dune sand (Qda), and (4) complexly mixed Qa, Qds, and Qda (Qm). Approximately half the Hartford Site surface geology is characterized by one of the first three map units while the remainder is characterized by a complex mix of these units.
Sand dune sedimentology and provenance
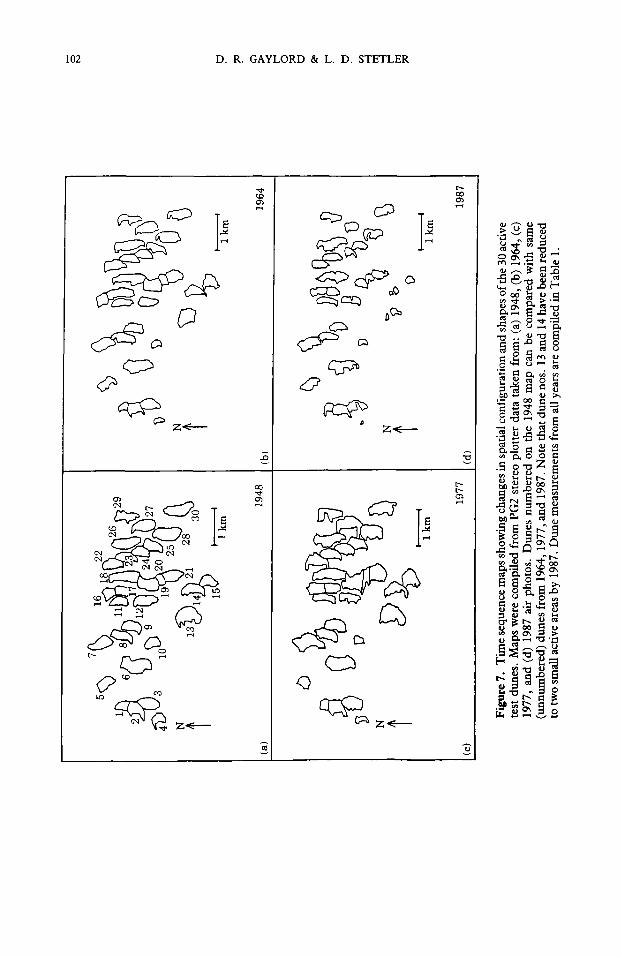
Grain size analyses and limited petrographic examination of dune sands suggest distinct downwind variations in both texture and composition. Mean grain sizes of dune sand (determined from sieve analyses) decrease downwind from 0" 5 mm (1" 0 ~b) near Hanford's western margin to 0"25 mm (2"0 $) near the eastern margin (Gaylordet al., 1991; Smith, 1992; Stetler et al., 1992) (Fig. 6). Mean grain sizes of actively migrating dune sand average
Hartford N Site
Boundary /
,F/ \
Umtanum ' ~_) Gable Mountail R i d g J
Yaki ma i ~ H@MS
- - - - - - "I ~ ° ~ o . ~
Seale - ' 7
g 1'0 km --
ox
I t-- L
h -1
I
Figure 6. Contour map showing mean grain size distribution of sand-sized near-surface aeolian sediments collected during field studies. Contour interval is 0" 5 ~b units. Mean grain sizes computed using Folk's (1980) inclusive graphic mean statistic. Textural data derived from Gaylord et al., (1991) and Stetler and Gaylord (unpublished data).
102 D . R . GAYLORD & L. D. STETLER
y ~
0
@
Z ~
~ : , - ~ r~ C : : : ~ . , ~ ~ ,L
,._,co::::: ,~d--~S_.,ds
z ~
d~
Z <
©
t ~
~ ~,~ .a..a ~ "~
"~ ~ •
• = ~ ' ~ ~
• ~
S 8 ,::,., ~X ~ ~ . ~ w~ N
i~ ,,,,,~ ,'~ .~
.~ ~-~-~
8
AEOLIAN-CLIMATIC THRESHOLDS AND SAND DUNES 103
0"27 mm (1 "9 ~) in diameter (medium-grained sand). An 'average' dune sand consists of quartz (25-30%), basaltic fragments (25-35%), feldspars (20-25%), miscellaneous crystalline, sedimentary and metamorphic lithic fragments (< 10%) and accessory mineral grains (<5%) (Smith, 1992; Stetler & Gaylord, unpublished data). Compositions vary from basaltic to quartzo-feldspathic in a downwind (west to east) direction. Preliminary assessment of provenance suggests the dune sands were derived primarily from reworking of Missoula flood sediments with minor contributions from alluvial sources (Gaylord et al., 1991; Smith, 1992; Stetler et al., 1992).
Methods and results
Active sand dune test area
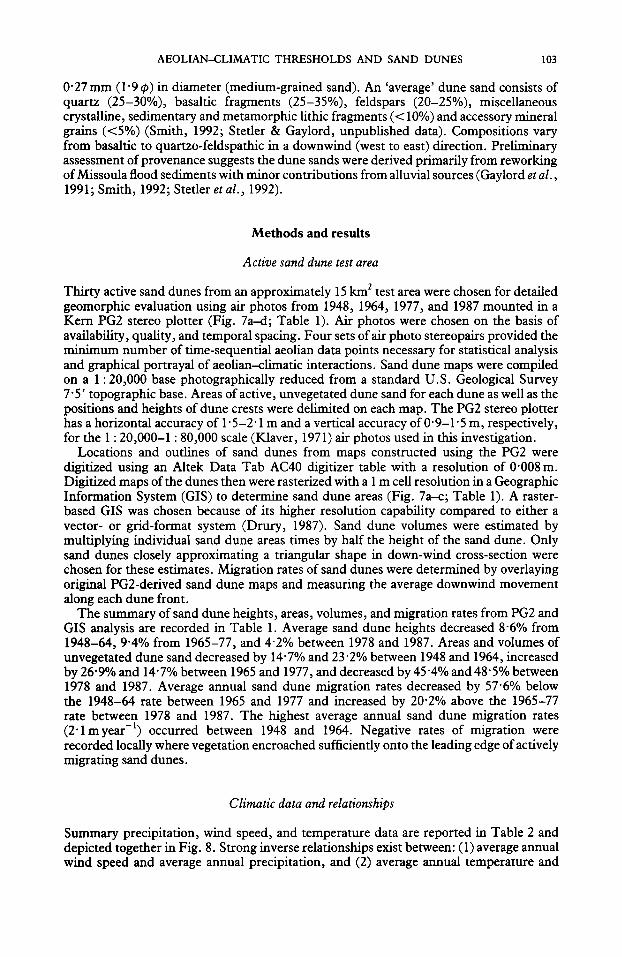
Thirty active sand dunes from an approximately 15 km 2 test area were chosen for detailed geomorphic evaluation using air photos from 1948, 1964, 1977, and 1987 mounted in a Kern PG2 stereo plotter (Fig. 7a-d; Table 1). Air photos were chosen on the basis of availability, quality, and temporal spacing. Four sets of air photo stereopairs provided the minimum number of time-sequential aeolian data points necessary for statistical analysis and graphical portrayal of aeolian-climatic interactions. Sand dune maps were compiled on a 1 : 20,000 base photographically reduced from a standard U.S. Geological Survey 7"5' topographic base. Areas of active, unvegetated dune sand for each dune as well as the positions and heights of dune crests were delimited on each map. The PG2 stereo plotter has a horizontal accuracy of 1"5-2" 1 m and a vertical accuracy of 0"9-1 "5 m, respectively, for the 1 : 20,000-1 : 80,000 scale (Klaver, 1971) air photos used in this investigation.
Locations and outlines of sand dunes from maps constructed using the PG2 were digitized using an Altek Data Tab AC40 digitizer table with a resolution of 0"008 m. Digitized maps of the dunes then were rasterized with a 1 m cell resolution in a Geographic Information System (GIS) to determine sand dune areas (Fig. 7a-c; Table 1). A raster- based GIS was chosen because of its higher resolution capability compared to either a vector- or grid-format system (Drury, 1987). Sand dune volumes were estimated by multiplying individual sand dune areas times by half the height of the sand dune. Only sand dunes closely approximating a triangular shape in down-wind cross-section were chosen for these estimates. Migration rates of sand dunes were determined by overlaying original PG2-derived sand dune maps and measuring the average downwind movement along each dune front.
The summary of sand dune heights, areas, volumes, and migration rates from PG2 and GIS analysis are recorded in Table 1. Average sand dune heights decreased 8"6% from 1948-64, 9"4% from 1965-77, and 4"2% between 1978 and 1987. Areas and volumes of unvegetated dune sand decreased by 14"7% and 23"2% between 1948 and 1964, increased by 26"9% and 14"7% between 1965 and 1977, and decreased by 45"4% and 48" 5% between 1978 and 1987. Average annual sand dune migration rates decreased by 57"6% below the 1948-64 rate between 1965 and 1977 and increased by 20"2% above the 1965-77 rate between 1978 and 1987. The highest average annual sand dune migration rates (2"lmyear -1) occurred between 1948 and 1964. Negative rates of migration were recorded locally where vegetation encroached sufficiently onto the leading edge of actively migrating sand dunes.
Climatic data and relationships
Summary precipitation, wind speed, and temperature data are reported in Table 2 and depicted together in Fig. 8. Strong inverse relationships exist between: (1) average annual wind speed and average annual precipitation, and (2) average annual temperature and

104 D. R. GAYLORD & L. D. STETLER
Table 1. Summary of sand dune areas, heights, and volumes for the 30 test
1948 1964
Area Height Volume Area Height Volume Migration Dune No. (m 2) (m) (m 3 ) (m 2 ) (m) (m 3 ) (m year -1 )
1 18941 3"9 73870 12027 4"1 49311 2"2 2 35035 5"8 203203 26917 5'7 153427 3"3 3 38 046 7-0 266 322 30 800 5" 5 167 860 2"0 4 21 885 3-7 79880 8652 2"8 23793 -1"3 5 29 360 5"3 154 140 25 140 5"6 140 784 2"9 6 68944 7"3 503291 53889 7"5 40168 1"8 7 38 395 6"9 264 926 38 419 5"9 226 672 2"7 8 32003 7"1 227221 34204 6"7 227457 2"2 9 32831 6"2 203552 28519 5"1 145447 1"9
10 24 846 3'0 73 296 I 1 622 3"6 41 258 0"9 11 24444 5"8 141 775 24334 4"8 116803 2"2 12 39867 5"8 231229 27263 3'7 99510 1"8 13 61 776 6"2 379 922 43 592 5"8 252 834 2"3 14 36647 5'5 201 559 27210 4"3 117003 1"7 15 28 131 5"4 151 907 28 247 4"8 135 586 3"1 16 21 583 3-9 84 174 21 386 6"4 135 801 2"0 17 24474 5"4 132 160 39814 5"3 211 014 2"7 18 50 617 5'8 293 579 48 857 5"3 256 499 1"9 19 44452 8"4 373 397 38900 5"6 215 895 2"7 20 14 157 4"9 69 369 14 945 5"0 73 978 3" I 21 33 472 5"6 185 770 29 872 5"7 170 270 2'6 22 32 486 5"4 173 800 31 909 5-2 165 927 2'9 23 29817 5"8 171448 24027 5"4 129746 2"1 24 26 752 4"2 112 358 24 538 4"9 120 236 1"4 25 32 723 6"4 207 791 26 234 4"6 119 365 2"0 26 46 576 6"6 305 073 46 156 5" 1 233 088 2"0 27 41 738 7"2 300 514 39447 5"8 228 793 2"3 28 55 746 9"2 510076 41 559 7"8 324 160 1"6 29 33 131 4"3 142463 28331 4"6 130323 1"9 30 50579 7"6 384400 35586 7-2 256219 1"0
Average 35 648 5"8 220 082 30 413 5"3 169 107 2" 1
average annual p rec ip i ta t ion for the air photo coverage intervals (1948-64 , 1965-77, and 1978-87). F r o m 1948-64, average prec ip i ta t ion was 104"4% of the 1948-87 average while average wind speed and t empe ra tu r e were, respect ively , 98"6% and 99"5% of the 1948-87 average. F r o m 1965-77, average prec ip i ta t ion was 87" 1% of the 1948-87 average, while average wind speed and t empera tu re were , respect ively , !04"5% and 101"9% of the 1948-87 average. F r o m 1978-87, average prec ip i ta t ion was 109"5% of the 1948-87 average, while average wind speed and t empera tu re were, respect ively , 97"8% and 98"5% of the 1948-87 average.
Average annual wind speed and average annual t empera tu re f rom Hart ford Site c l imat ic data for each of the three t ime intervals are inverse funct ions of average annual p rec ip i ta t ion for co r respond ing t ime intervals (Table 3). F o r example , average annual prec ip i ta t ion and average annual w ind speed are re la ted th rough the fol lowing equat ion:
y = [(x) ( - 0" 31) + 0"42]; r 2 = 0"99 (2)
where:
x = % dif ference of average pr_ecipitation for a given t ime interval f rom the 1948-87 average of 16"6 cm year

AEOLIAN-CLIMATIC THRESHOLDS AND SAND DUNES 105
dunes depicted in Fig. 7. Individual data sets and summary sets are shown for 1948, 1964, 1977, and 1987
1977 1987
Area Height Volume Migration Area Height Volume Migration (m 2) (m) (m 3) (m year- 1) (m 2) (m) (m 3) (m year- 1)
15 206 3"2 47 899 0"0 13 590 3"0 40 091 1"5 38625 4"4 168019 - 0 ' 8 27667 4-8 131418 0"4 42 144 5-0 210 720 -1 .5 25 830 5"4 138 191 0"9 11 184 2"9 31874 -2"8 1283 2"4 3015 0-0 19580 2"3 44055 1"5 25775 4'8 122431 0"8 63711 5"6 356782 0"0 44822 4"7 210663 0"6 59814 1"7 101684 1"1 35876 3"8 134535 1"7 35687 4.6 162376 0.6 22394 5"0 110850 1"1 39532 3"1 120573 0-1 20 175 5"9 119033 1'7 11969 4"6 54459 0"3 8346 2-8 23369 I-1 26 729 5"6 149 682 1'4 20 025 3"8 75 094 2"7 28 100 3"9 108 185 0"3 20 356 3"7 74299 1"2 67881 5"8 393710 0-0 12048 4'4 52409 -0"4 37 189 5"7 211 977 -0"2 6926 3"9 27011 0-3 40508 3"9 155956 1"4 9103 3"7 33681 1"1 31 736 5"1 161 854 2-2 19713 4"8 94622 1.3 25633 6"1 156361 1"5 16160 5"0 79992 1"2 56286 4"8 270173 1"2 39763 4"5 176945 2-2 55439 5"9 324318 0"0 16471 6"4 105414 0"7 22828 2"9 65060 1"6 10332 4"0 40811 0"4 46 972 5'6 263 043 1-7 19 868 4"6 90 399 - 1-8 38864 6"1 237070 1"8 20207 5"9 118211 0"7 31713 5"7 180764 2.0 22 197 5"2 115424 1"7 31 808 5"2 165 402 2.4 12 614 4'4 55 502 0"6 30 462 5"0 152 310 1"6 18 162 5'3 95 351 2"4 39 386 6"3 246 163 2"2 44 339 4"3 190 658 1"5 55 164 6'4 353050 0"9 19224 6-1 116305 0"2 52 367 5"8 303 729 2"0 26 623 5"8 153 082 2"3 39004 5"3 204 771 2-6 23 387 4"6 107 580 1" 1 51417 6"8 349636 1"8 29488 5"4 159235 1"8
38 160 4'8 188 673 0"8 20 803 4-6 97 806 1.0
y = % difference of avera§e wind speed for a given t ime interval f rom the 1948-87 average of 3"4 m s -
Similar ly , average annual prec ip i ta t ion and average annual t empera tu re are re la ted th rough the equat ion:
y = [(x) ( - 0 " 1 5 ) - 0"02]; r 2 = 0"99 (3)
where:
x = % difference of average pr_ecipitation for a given t ime interval f rom the 1948-87 average of 16"6 cm year
y = % difference of average t empera tu re for a given t ime interval f rom the 1948-87 average of 11"7°C
Equa t ions (2) and (3) can be used to pred ic t the change in average annual w ind speed and average annual t empera tu re resul t ing f rom changes in average annual prec ip i ta t ion over a specified t ime interval . F o r example , the average annual prec ip i ta t ion for the years 1975-80 was 16"4 cm, 1"4% below the long- te rm average. Evalua t ing (2) and (3) where - 1 " 4 is subs t i tu ted for x yields a wind speed which is 0"9% below the long- te rm
106 D.R. GAYLORD & L. D. STETLER
E
E
r-
g
'5
3O
2 5
2O
15
1 0 -
4 "
3 .5
3 -
2..5
1 9 4 0
[
1,1 I I I I I
195(1 1 9 6 0 1 9 7 0 1 9 8 0 1 9 9 0
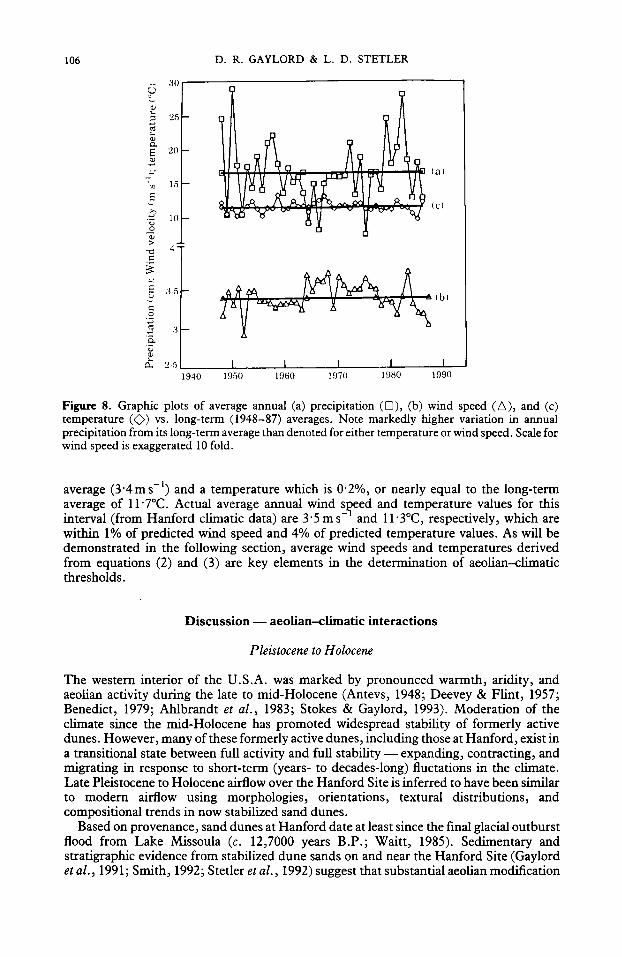
Figure 8. Graphic plots of average annual (a) precipitation ([3), (b) wind speed (A), and (c) temperature (~) vs. long-term (1948-87) averages. Note markedly higher variation in annual precipitation from its long-term average than denoted for either temperature or wind speed. Scale for wind speed is exaggerated 10 fold.
average (3"4m s -l) and a temperature which is 0"2%, or nearly equal to the long-term average of 11"7°C. Actual average annual wind s~eed and temperature values for this interval (from Hanford climatic data) are 3"5 m s - and 11"3°C, respectively, which are within 1% of predicted wind speed and 4% of predicted temperature values. As will be demonstrated in the following section, average wind speeds and temperatures derived from equations (2) and (3) are key elements in the determination of aeolian-climatic thresholds.
Discussion - - aeofian-climatic interactions
Pleistocene to Holocene
The western interior of the U.S.A. was marked by pronounced warmth, aridity, and aeolian activity during the late to mid-Holocene (Antevs, 1948; Deevey & Flint, 1957; Benedict, 1979; Ahlbrandt et al. , 1983; Stokes & Gaylord, 1993). Moderation of the climate since the mid-Holocene has promoted widespread stability of formerly active dunes. However, many of these formerly active dunes, including those at Hanford, exist in a transitional state between full activity and full stability - - expanding, contracting, and migrating in response to short-term (years- to decades-long) fluctations in the climate. Late Pleistocene to Holocene airflow over the Hanford Site is inferred to have been similar to modern airflow using morphologies, orientations, textural distributions, and compositional trends in now stabilized sand dunes.
Based on provenance, sand dunes at Hanford date at least since the final glacial outburst flood from Lake Missoula (c. 12,7000 years B.P.; Waitt, 1985). Sedimentary and stratigraphic evidence from stabilized dune sands on and near the Hanford Site (Gaylord et al. , 1991; Smith, 1992; Stetler et al. , 1992) suggest that substantial aeolian modification

AEOLIAN-CLIMATIC THRESHOLDS AND SAND DUNES 107
Table 2. Summary of average annual climatic conditions at the Hanford Site fiom 1948-87. Data fiom Stone et al. (1980) and
fiom HMS ( Hoitink, pers. comm.)
Precipitation Wind speed Temperature Year (cm year - 1 ) (m s - 1) (oc)
1948 24"7 3"2 12"3 1949 10"5 3"5 10"6 1950 29"1 3"3 11"5 1951 17"8 3"5 10"4 1952 10"6 2"9 11"4 1953 17"6 3"5 11"8 1954 14"5 3"5 12"6 1955 19"1 3"4 11"4 1956 14"2 3"4 10"4 1957 21"1 3"3 11"5 1958 22"2 3"3 11"5 1959 18"0 3"3 13"5 1960 13"8 3"3 11"3 1961 17"3 3"4 11"5 1962 15"3 3"4 12"6 1963 16"0 3"3 11"7 1964 13"7 3"7 11"8 1965 09"3 3"5 10"0 1966 15"1 3"6 12"2 1967 08"3 3"6 12"7 1968 15"1 3"8 13"2 1969 16"2 3"3 12"3 1970 16"1 3"7 11"4 1971 16"0 3"6 11"8 1972 16"2 3"5 11"9 1973 21"0 3"5 11"4 1974 13"5 3"5 12"2 1975 18"9 3"7 12"2 1976 07"6 3"6 11"4 1977 16"3 3'5 11"2 1978 16"7 3"3 11'7 1979 14" 1 3"4 11" 1 1980 24"6 3"4 11 "4 1981 17"9 3"2 11"2 1982 20"3 3"4 12"5 1983 28" 1 3"7 11 "5 1984 18"5 3'3 11"5 1985 13"0 3"2 10"6 1986 18"0 3"2 9"8 1987 12"9 3"1 12"3
Average 16"6 3"4 11 "7

108 D . R . GAYLORD & L. D. STETLER
4~
IIZ
"e
,.4
&l
~ x
e~
m I ~ . , t
~.~
~ ~ N
I I
• o °
I I
°
0
0
~J
I I I I I
I I
AEOLIAN--CLIMATIC THRESHOLDS AND SAND DUNES 109
followed deposition of the Mazama ash (c. 6700-6800 year B.P.). Redistribution of aeolian sediments following this volcanic event probably coincided with peak mid-Holocene aeolian activity and aridity recorded in other western interior dune fields including the Nebraska Sand Hills (Ahlbrandt & Fryberger, 1980; Ahlbrandt et al. , 1983; Swinehart, 1991), north-east Colorado dunes (Muhs, 1985; Forman et al. , 1992) and Wyoming high basin dunes (Ahlbrandt, 1974; Gaylord, 1982, 1990; Miller, 1986). The riming of dune field stabilizing events at Hanford is less well known but apparently occurred prior to c. 2100 year B.P. based on a radiocarbon date from bison tooth enamel contained in stabilized dune soil (Chatters & Gard, 1992).
Recent
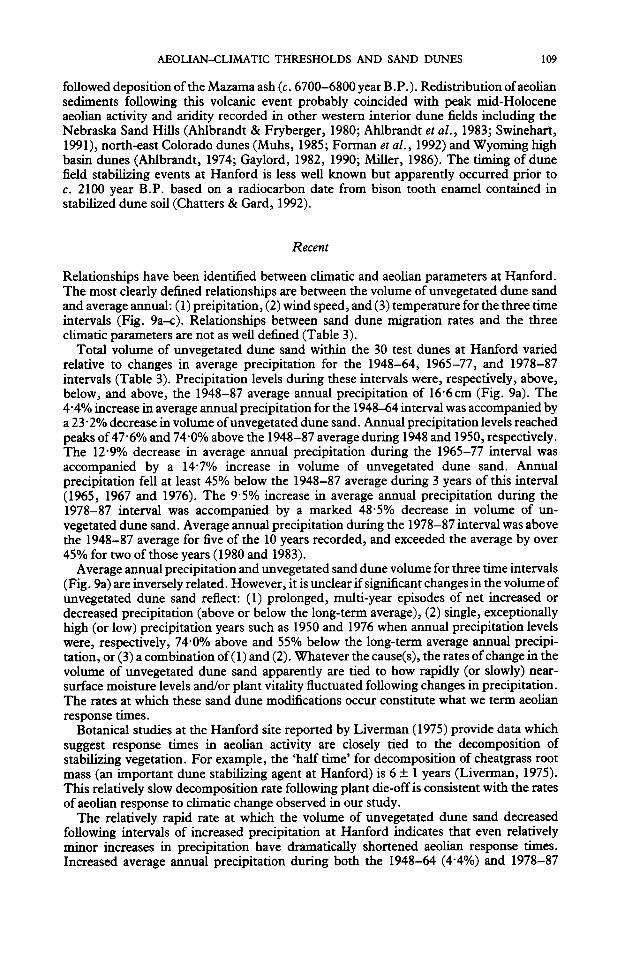
Relationships have been identified between climatic and aeolian parameters at Hartford. The most clearly defined relationships are between the volume of unvegetated dune sand and average annual: (1) preipitation, (2) wind speed, and (3) temperature for the three time intervals (Fig. 9a-c). Relationships between sand dune migration rates and the three climatic parameters are not as well defined (Table 3).
Total volume of unvegetated dune sand within the 30 test dunes at Hartford varied relative to changes in average precipitation for the 1948-64, 1965-77, and 1978-87 intervals (Table 3). Precipitation levels during these intervals were, respectively, above, below, and above, the 1948-87 average annual precipitation of 16"6 cm (Fig. 9a). The 4"4% increase in average annual precipitation for the 1948-64 interval was accompanied by a 23"2% decrease in volume of unvegetated dune sand. Annual precipitation levels reached peaks of 47"6% and 74"0% above the 1948-87 average during 1948 and 1950, respectively. The 12"9% decrease in average annual precipitation during the 1965-77 interval was accompanied by a 14"7% increase in volume of unvegetated dune sand. Annual precipitation fell at least 45% below the 1948-87 average during 3 years of this interval (1965, 1967 and 1976). The 9"5% increase in average annual precipitation during the 1978-87 interval was accompanied by a marked 48"5% decrease in volume of un- vegetated dune sand. Average annual precipitation during the 1978-87 interval was above the 1948-87 average for five of the 10 years recorded, and exceeded the average by over 45% for two of those years (1980 and 1983).
Average annual precipitation and unvegetated sand dune volume for three time intervals (Fig. 9a) are inversely related. However, it is unclear if significant changes in the volume of unvegetated dune sand reflect: (1) prolonged, multi-year episodes of net increased or decreased precipitation (above or below the long-term average), (2) single, exceptionally high (or low) precipitation years such as 1950 and 1976 when annual precipitation levels were, respectively, 74"0% above and 55% below the long-term average annual precipi- tation, or (3) a combination of (1) and (2). Whatever the cause(s), the rates of change in the volume of unvegetated dune sand apparently are tied to how rapidly (or slowly) near- surface moisture levels and/or plant vitality fluctuated following changes in precipitation. The rates at which these sand dune modifications occur constitute what we term aeolian response times.
Botanical studies at the Hanford site reported by Liverman (1975) provide data which suggest response times in aeolian activity are closely tied to the decomposition of stabilizing vegetation. For example, the 'half time' for decomposition of cheatgrass root mass (an important dune stabilizing agent at Hartford) is 6 + 1 years (Liverman, 1975). This relatively slow decomposition rate following plant die-off is consistent with the rates of aeolian response to cLimatic change observed in our study.
The relatively rapid rate at which the volume of unvegetated dune sand decreased following intervals of increased precipitation at Hanford indicates that even relatively minor increases in precipitation have dramatically shortened aeolian response times. Increased average annual precipitation during both the 1948-64 (4"4%) and 1978-87
110 D . R . GAYLORD & L. D. STETLER
A
0
X
"-6
i
E o
3 0 -
2 5 -
2 0 -
1 5 -
1 0 -
5
0 1940
I I I I 1950 1960 1970 1980
(a)
I 1990
0
x
o
E
>
7!
6
5
4
3
21 1940
I I I i
(b)
1950 1960 1970 1980 I
1990
o~ 141 x
E ~ 10 o
o
~ 6 9 ~ 4 &
(c)
I I I I 1940 1950 1960 1970 1980 1990
F igure 9. Correlat ions between annual average (a) precipi tat ion, (b) wind speed, and (c) tempera ture and changes in volume of unvegeta ted dune sand. Horizonta l lines associated wi th climatic parameters depict averages corresponding to t ime intervals of air photo coverage. Actual values used to const ruct the graphs are contained in Tables 2 and 3.

AEOLIAN-CLIMATIC THRESHOLDS AND SAND DUNES 111
intervals (9"5%) resulted in decreases in the volume of unvegetated dune sand by 23"2% and 48"5%, respectively. Apparently, increased precipitation either revived many plants that were stressed, but not yet dead, or otherwise stimulated new plant growth. Additional interdisciplinary botanical/geological study of this complex subject is warranted.
A direct relationship exists between average annual wind speed and volume of unvegetated dune sand for the three time intervals (Fig. 9b). The 1"4% and 2"2% decreases (from the 1948-87 average) in average annual wind speed during the 1948-64 and 1978-87 intervals corresponded with a 23"2% and 48"5% decrease, respectively, in the volume of unvegetated dune sand. The 4" 5% increase in average annual wind speed during the 1965-77 interval was accompanied by a 14"7% increase in volume of unvegetated dune sand. Variations in wind speed can strongly influence levels of overall sand dune activity (Cooke & Warren, 1973; Fryberger, 1979; Lancaster, 1988). Such variations would become noticeable during years of below-average precipitation when wind speeds at Hanford typically are higher.
The graph of average annual temperature vs. unvegetated dune sand volume for each of the three time intervals illustrates there is a direct relationship between these parameters (Fig. 9c). For example, the 0"5% and 1"5% decreases (from the 1948-87 average) in average annual temperature during the 1948-64 and 1978-87 intervals corresponded with a 23"2% and 48"5% decrease, respectively in the volume of unvegetated dune sand. Similarly, the 1"9% increase in average annual temperature during the 1965-77 interval was accompanied by a 14"7% increase in the volume of unvegetated dune sand. Variations in temperature affect overall sand dune mobility primarily by controlling rates of evaporation and transpiration.
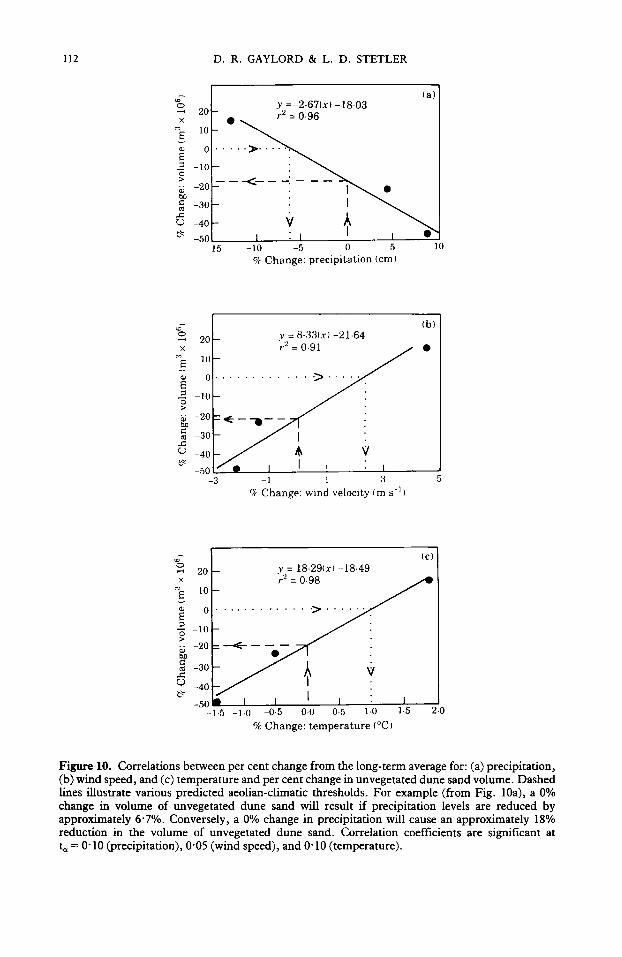
Aeolian--climatic relationships at the Hanford Site are summarized in Fig. 10(a-c). Plots of per cent change of unvegetated sand dune volume from 1948-87 vs. % change in precipitation from the historical 1912-87 average annual precipitation (Fig. 10a) indicate the average annual precipitation from 1948-87 (16" 6 cm) exceeds the amount necessary to maintain the volume of unvegetated dune sand measured in 1987 by 6"7% (1"1 cm). Ultimately, a continuation of recent precipitation levels (1948-87) will result in an approximately 18% decrease in unvegetated dune sand volume as vegetative cover expands. Based on this projection, unvegetated dune volume will approach an equilibrium state within at least 10-15 years, the approximate length of time between dune volume measurements in our investigation. Conversely, the average annual precipitation needed to maintain the 1987 volume of unvegetated dune sand is 15"5 cm (a 6"7% decrease from the 16"6 cm year -l long-term average) as depicted on Fig. 10(a).
Figures 10(b) and 10(c) illustrate that average annual wind speed and temperature from 1948-87 also are out of equilibrium with those values needed to maintain the 1987 volume of unvegetated dune sand. Since precipitation, wind speed, and temperature are interrelated via equations (2) and (3), we can calculate the average annual wind speed and temperature that corresponds to a precipitation level of 15"5 cm year- 1. Substituting - 6"5 (as 'x') into equation (2) yields a + 2"4% change in wind speed and an aeolian-climatic threshold value of 3"5 m s -1. Substituting -6 .5 as 'x' into equation (3) yields a + 1"0% change in temperature and an aeolian-climatic threshold value of 11" 8°C. Thus, assuming there are no major changes in seasonal climatic patterns, vegetation cover, animal grazing impact, or human-caused disruptions, unvegetated sand dune volumes from 1987 at Hartford could be maintained with an average annual precipitation, wind speed, and temperature of 15"5 cm, 3"5 ms -1, and 11"8°C, respectively. Together, these climatic values define an aeolian-climatic threshold at which there is a zero level of change in the unvegetated sand dune volume. It is not clear either how long it would take or if true equilibrium conditions could ever be reached between the sand dunes and the climate given the many variables involved. Nevertheless, a return to the average annual precipitation, temperature, and projected wind speed that characterized 1912-47 closely approximates these climatic conditions. Aeolian-climatic thresholds which correlate with net increases or decreases in unvegetated sand dune volume also could be determined from
112 D. R. GAYLORD & L. D. STETLER
o
x
>
20
10
0
- 1 0
- 2 0
- 3 0
- 4 0
- 5 0 - 1 5
(a) y =-2.67(x} -18.03 r 2 = 0.96
_ "--.• .~I~ ..... .
- 1 0 - 5 0 5 lO
% Change: precipitation (cm I
20 ×
E 10
o
2 - lo o
~ -20
~ -30
e'D - 4 0
-50 -3
y = 8-33(x) -21.64 r '2 = 0-91
t I I I I -1 1 3
Change: wind velocity Im s 1)
(b)
A
×
O9
¢-
20
I0
0
-I0
-20
-30
-40
-50 -1.5 -1-0 -0.5 0.0 0.5 1-0
% Change: tempera ture (°C)
(c) _ y = 18.29(x} -18.49
; - i
1.5 2 .0
Figure 10. Correlat ions be tween per cent change f rom the long-term average for: (a) precipi tat ion, (b) wind speed, and (c) t empera tu re and per cent change in unvegeta ted dune sand volume. Dashed lines i l lustrate various predic ted aeolian-climatic thresholds. For example (from Fig. lOa), a 0% change in volume of unvegeta ted dune sand will result if precipi ta t ion levels are reduced by approximately 6"7%. Conversely, a 0% change in precipi tat ion will cause an approximately 18% reduct ion in the volume of unvegeta ted dune sand. Correlat ion coefficients are significant at t~ = 0" 10 (precipitat ion), 0"05 (wind speed), and 0" 10 ( temperature) .

AEOLIAN--CLIMATIC THRESHOLDS AND SAND DUNES 113
Fig. 10(a-c). However, without additional testing of our aeolian-climatic equations and a better understanding of aeolian-botanical interactions, determination of when the unvegetated sand dune volumes would shrink to zero is problematic.
The preceding time-sequence analysis of unvegetated dune sand volume vs. precipitation, wind speed, and temperature illustrates its potential value as a tool in projecting aeolian-climatic interactions. It should be possible through such projections to identify the character of climatic variability necessary to induce aeolian activity or inactivity in other partially vegetated sand dunes similar to those at Hartford and common throughout the western interior of North America. However, because the aeolian and climatic data we used to calculate aeolian-climatic interactions are site-specific, they should be applied to other dune fields only with great caution.
The apparent linearity between aeolian and climatic parameters may seem curious given the variability of the independent components affecting an aeolian system. It must be recognized, though, that the aeolian-climatic relationships derived in the paper were necessarily simplified given the scope of the research. In addition, the limited number of volume measurements we used essentially dictated a linear fit of data points. It is quite conceivable, however, that a graph depicting aeolian-climatic relationships employing additional volume data from intervening years would define a non-linear relationship.
Comparisons between sand dune migration rates for the 30 test dunes and various climatic parameters did not yield any significant trends (Table 3). In part, the weak correlation may reflect the complexity of the dunes and their irregular mobility/stability from 1948-87. However, it also may reflect the limited number of years for which migration rates were determined.
Summary and conc lus ions
The characteristics of aeolian and climatic interactions at the Hanford Site provide a basis for evaluation of the climatic conditions which promote of diminish aeolian activity. Air photo analysis of a set of 30 actively migrating sand dunes from the eastern third of the Hartford Site (using air photo stereopairs from 1948, 1964, 1977, and 1987) illustrate marked variations in unvegetated sand dune areas, heights, volumes, and migration rates from 1948-87. Analysis of precipitation, wind speed, and temperature data from Hartford illustrates there are strong inverse relationships between average annual precipitation and both average annual wind speed and temperature for the 1948-64, 1965-77, and 1978-87 intervals. Unvegetated dune volumes decreased between 1948-64 and 1978-87, and increased between 1965-77. Sand dune migration rates calculated for the test set of 30 dunes averaged 1"4 m year-l during 1948-87 and ranged from 2" 1 m year for 1948-64 to 0"9myear -I for 1965-77, and 1"1 myear -I for 1978-1987.
Time sequence analysis of unvegetated dune sand volume vs. precipitation, wind speed, and temperature reveal well-defined aeolian-climatic relationships. Changes in average annual precipitation above or below the 1948-87 average precipitation have an inverse relationship to changes in the volume of unvegetated dune sand in the dunes studied. Conversely, values of average annual wind speed and temperature have a direct relationship to volume of unvegetated dune sand. Calculations reveal that current unvegetated sand dune volumes at Hanford could be maintained with at least a 10-15 year interval of average annual precipitation, wind speed, and temperature of 15"5cm, 3"5ms -1, and 11"8°C. These values constitute an aeolian-climatic threshold. Such a climate closely approximates conditions that characterized the 1912-47 interval. Continuation of the 1948-87 climatic trends will promote additional dune stabilization that will decrease the volume of unvegetated dune sand by at least 18% from the 1987 level. This projection assumes there are no major changes either in seasonal climatic patterns, or in other variables that influence the surface including grazing impact, botanical cover, or human-caused surface disruptions.
114 D. R. GAYLORD & L. D. STETLER
Research was supported in part by funding from U.S. Department of Energy (DOE) and Pacific Northwest Laboratory (PNL) under Contract 097718-A-L2, and by the Northwest College and University Association for Science (Washington State University) under Grant DE-FG06-89ER- 75522 with the U.S. DOE. We gratefully acknowledge the assistance of James Chatters of PNL who managed the PNL contract and made comments on an earlier version of the manuscript, Dana Hoitink who provided key climatic data from PNL, Ronald Marrs who arranged for use of the University of Wyoming PG2 stereo plotter, Grant Smith for his collaboration on Hartford aeolian research, and David Wherry for use of Washington State University GIS facilities. Krishna Jandhyala, Richard Alldredge, Michael Ligotke, and particularly Stephen Stokes provided insightful review comments.
References
Adams, R. M., Rosenzweig, C., Peart, R. M., Ritchie, J. T., McCarl, B. A., Glyer, J. D., Curry, R. B., Jones, J. W., Boote, K. J. & Allen, Jr., L. H. (1990). Global climate change and U.S. agriculture. Nature, 345:219-224.
Ahlbrandt, T. S. (1974). Dune stratigraphy, archaeology, and chronology of the Killpecker dune field. In: Wilson, M. (Ed.), Applied Geology and Archaeology: The Holocene History of Wyoming. Wyoming Geological Survey, Report of Investigations, 10:51-60.
Ahlbrandt, T. S. & Fryberger, S. G. (1980). Eolian deposits in the Nebraska Sand Hills. In: Geologic and Paleoecologic Studies of the Nebraska Sand Hills. U.S. Geological Survey Professional Paper, 1120: 1-24.
Ahlbrandt, T. S., Swinehart, J. B. & Maroney, D. G. (1983). The dynamic Holocene dune fields of the Great Plains and Rocky Mountain basins, U.S.A. In: Brookfield, M. E. & Ahlbrandt, T. S. (Eds), Eolian Sediments and Processes: Developments in Sedimentology, 38: 379-406.
Aldhous, P. (1991). 1990 warmest year on record. Science (News), 349: 186. Antevs, E. V. (1948). The Great Basin, with emphasis on glacial and postglacial times. Bulletin of the
University of Utah, 38: 168-191. Bagnold, R. A. (1941). The Physics of Blown Sand and Desert Dunes. London: Methuen and Co.
265 pp. Benedict, J. B. (1979). Getting Away From it All: A Study of Man, Mountains, and the Two-Drought
Altithermal. 26th Annual Meeting, Plains Anthropological Association, Denver, Colorado, 11 pp. Chatters, J. C. & Gard, H. A. (1992). Hanford cultural resources laboratory annual report for
FY1991. Battelle-Pacific Northwest Laboratory, PNL-8. Cooke, R. V. and Warren, A. (1973). Geomorphology in Deserts. Berkeley: University of Claifornia
Press. 374 pp. Deevey, E. S. & Flint, R. F. (1957). Postglacial hypsithermal interval. Science, 125: 182-184. Drury, S. A. (1987). Image Interpretation In Geology. London: Allen & Unwin. 243 pp. Folk, R. L. (1980). Petrology of Sedimentary Rocks. Austin, TX: Hemphill Publishing Co. 182 pp. Forman, S. L., Goetz, A. F. H. & Yuhas, R. H. (1992). Large-scale stabilized dunes on the High
Plains of Colorado: understanding the landscape response to Holocene climates with the aid of images from space. Geology, 20: 145-148.
Fryberger, S. G. (1979). Dune forms and wind regime. In: Mckee, Jr. E. D. (Ed.), A Study of Global Sands Seas. U.S. Geological Survey Professional Paper 1052: 137-170.
Gaylord, D. R. (1982). Geologic History of the Ferris Dune Field, south-central Wyoming. Geological Society of America Special Paper, 192: 65-82.
Gaylord, D. R. (1990). Holocene paleoclimatic fluctuations revealed from dune and interdune strata in Wyoming. Journal of Arid Environments, 18:123-138.
Gaylord, D. R., Stetler, L. D., Smith, G. D. & Chatters, J. C. (1991). Holocene and recent eolian activity at the Hanford Site, Washington. P N W American Geophysical Union Meeting, Richland, WA, September 18-20, 1991, A b stracts with Programs.
Glantz, C. S., Schwartz, M. N., Burk, K. W., Kasper, R. B., Ligotke, M. W. & Perrault, P. J. (1990). Climatological summary of wind and temperature data for the Hanford Meteorology Meteorology Monitoring Network. Battelle-Pacific Northwest Laboratory Technical Report PNL-7471.
Glennie, K. W. (1970). Desert Sedimentary Environments: Developments in Sedimentology. 14. New York: Elsevier. 222 pp.
AEOLIAN-CLIMATIC THRESHOLDS AND SAND DUNES 115
Jorgensen, D. W. (1992). Use of soils to differentiate dune age and to document spatial variation in aeolian activity, northeast Colorado. Journal of Arid Environments, 23: 19-34.
Kasper, R. B. & Glantz, C. S. (1987). Preliminary estimate of potential sand transport and surface wind patterns at the U.S. Department of Energy's Hartford Site. Westinghouse Hartford Report WHC-EP-0058.
Klaver, J. (1971). Practical results obtained from semi-analytical aerotriangulation with the Kern PG2. Paper presented at 1971 ASP-ACSM Fall Convention, September, 1971, San Francisco, CA. 14 pp.
Lancaster, N. (1988). Development of Linear dunes in the southwestern Kalahari, South Africa. Journal of Arid Environments, 14: 233-244.
Lancaster, N. (1991). Reaction of eolian geomorphic systems to climatic change. Geological Society of America National Meeting, San Diego CA, (October 21-24, 1991), Abstracts with Programs, 23: no. 5, p. A283.
Ligotke, M. W. & Klopfer, D. C. (1990). Soil erosion rates and mixed soil and gravel surfaces in a wind tunnel. Battelle-Pacific Northwest Laboratory Technical Publication PNL-7435.
Liverman, J. L. (1975). Final environmental statement, waste management operations, Hanford Reservation, Richland, Washington. ERDA-1538, vols 1 and 2, Energy Research and Development Administration, Washington, D.C.
Manabe, S. & Wetherald, R. T. (1986). Reduction in summer soil wetness induced by an increase in atmospheric carbon dioxide. Science, 232: 626-628.
Melton, F. A. (1940). A tentative classification of sand dunes: its application to dune history in the southern High Plains. Journal of Geology, 48:113-174.
McKee, E. D. (1966). Structures of dunes at White Sands National Monument, New Mexico (and a comparison with structures from other areas). Sedimentology, 7: 1-70.
Miller, M. E. (1986). Preliminary investigations at the Seminoe Beach Site, Carbon County, Wyoming. Wyoming Archaeologist, 29: 83-96.
Muhs, D. R. (1985). Age and paleoclimatic significance of Holocene sand dunes in northeastern Colorado. American Association of Geographers Annals, 75: 556-582.
Muhs, D. R. ( 1991). The potential response of Great Plains eolian sands to greenhouse warming and precipitation reduction. Geological Society of America National Meeting, San Diego CA, (October 21-24, 1991), Abstracts with Programs, 23: 5, p. A285.
Mullineaux, D. R., Wilcox, R. R., Ebaugh, W. F., Fryxell, R. & Rubin, M. (1977). Age of the last major scabland flood of eastern Washington, as inferred from associated ash beds of Mount St. Helens Set S. Geological Socie¢y of America, Abstracts with Programs, 9: no. 7, p. 1105.
Myers, D. W., Price, S. M., Caggiano, J. A., Cochran, M. P., Czimer, W. H., Davidson, N. J., Edwards, R. C., Fecht, K. R., Holmes, G. E., Jones, M. G., Kunk, J. R., Landon, R. D., Ledgerwood, R. K., LiUie, J. T., Long, P. E., Mitchell, T. H., Price, E. H., Reidel, S. P. & Tallman, A. M. (1979). Geologic studies of the Columbia Plateau: a status report. Rockwell Hartford Operations Report RHO-BWI-ST-4.
Petersen, K. L. (1989). The long-term climate change assessment task of the Hartford Site, Washington, Protective Barrier Development Program, Westinghouse Hartford Report WHC- SA-0537.
Schneider, S. H. (1989). The greenhouse effect: science and policy. Science, 243: 771-781. Smith, G. A. (1993). Missoula flood dynamics and magnitudes inferred from sedimentology of slack-
water deposits on the Columbia Plateau, Washington. Geological Society of Arner~a Bulletin, 105, 77-100.
Smith, G. D. (1992). Sedimentolo~y, stratigraphy, and geoarchaeology of the Tsulim Site, on the Hartford Site, Washington. M.Sc. Thesis, Washington State University. 169 pp.
Stetler, L. D., Gaylord, D. R., Smith, G. D. & Chatters, J. C. (1992). Application of Geographic Information Systems analysis to Quaternary eolian activity at the Hartford Site, Washington. Geological Society of America Cordilleran Section Meeting, Eugene, Oregon, Abstracts with Programs, 24: 83.
Stokes, S. & Gaylord, F. R. (1993). Geochronology of the Clear Creek area, Ferris dune field: A test of optical dating. Quaternary Research, 39:274-281.
Stone, W. A., Thorp, J. M., Gifford, O. P. & Hoitink, D. J. (1983). Climatological snmmary for the Hartford area. In: Myers, C. W. & Price, S. M. (Eds), Rockwell Hartford Report RHO-BWI-ST-14. Subsurface Geology of the Cold Creek Syncline.
S winehart, J. B. (1991). Holocene eolian dune activity in the Nebraska Sand Hills - -more than skin deep. Geological Society of America National Meeting, San Diego, California, (October 21-24, 1991), Abstracts with Programs, 23: no. 5, p. A284.

116 D. R. GAYLORD & L. D. STETLER
Thornbury, W. D. (1965). Regional Geomorphology of the United States. New York: John Wiley and Sons, Inc. 609 pp.
Thornthwaite, C. W. (1948). An approach toward rational classification of climate. Geographical Rev/ew, 38: 55-94.
Valenzuela, A. (1974). The behavior of evapotranspiration and evaporation equations under varying climatic conditions: Ph.D dissertation, Washington State University, Pullman, Washington, 205 pp.
Waitt, R. B. (1985). Case for periodic, colossal jokulhlaups from Pleistocene Lake Missoula. Geological Society of America Bulletin, 96: 1271-1286.
Warren, A. (1976). Morphology and sediments of the Nebraska Sand Hills in relation to Pleistocene winds and the development of aeolian bedforms. Journal of Geology, 84: 685-700.
Wing, R. N. & Gee, G. W. (1990). Hanford Site protective barrier development program. Fiscal Year 1989 highlights. Westinghouse Hanford Report WHC-EP-0318.
Copyright © 2022 FDOKUMEN