Topographic information of sand dunes as extracted from shading effects using Landsat images
ORI GIN AL PA PER
Biogeographic patterns of spiders in coastal dunesalong a gradient of mediterraneity
Jose C. Carvalho • Pedro Cardoso • Luıs C. Crespo • Sergio Henriques •
Rui Carvalho • Pedro Gomes
Received: 29 November 2010 / Accepted: 27 January 2011 / Published online: 8 February 2011� Springer Science+Business Media B.V. 2011
Abstract The Iberian Peninsula is recognized for its high levels of species richness,
rarity and endemicity. Our main aim was to study biogeographic patterns of spiders in
coastal dunes along a gradient of mediterraneity. Distance-decay of similarity, nestedness
and co-occurrence metrics were used to explore spider’ distribution patterns. A similarity
analysis was performed in order to obtain a hierarchical classification of sites. Indicator
species analysis was conducted to identify indicator species for the various clustering
levels of the site typology. The differentiation among assemblages was further explored by
non-metric multidimensional scaling (NMDS) and analysis of similarities (ANOSIM).
Assemblages’ similarity among sites decreased with climatic/geographic distance. The
observed values of nestedness metrics (T and NODF) were not significant, while the
co-occurrence metrics (C-score and Checkerboard units) were higher than expected by
chance. Cluster analysis showed that spider’ assemblages were structured along a gradient
from North to South, forming four geographically distinct clusters. ANOSIM tests and
NMDS supported the biogeographic patterns identified by cluster analysis. Several indi-
cator species were found for the different levels of the hierarchic site typology. Spider
assemblages revealed a high degree of biogeographical structure along the Atlantic coast of
the Iberian Peninsula. The coast is a ‘‘biogeographic crossroad’’, encompassing faunistic
elements of different origins. The hierarchic typology of sites is generally consistent with
the major biogeographic regions and the thermoclimatic belts recognized for the region.
J. C. Carvalho (&) � P. GomesCBMA – Molecular and Environmental Centre, Department of Biology, University of Minho,Gualtar Campus, 4710-057 Braga, Portugale-mail: [email protected]
P. CardosoSmithsonian Institution, National Museum of Natural History, Washington, DC, USA
P. Cardoso � L. C. CrespoAzorean Biodiversity Group – CITA-A, University of Azores, Angra do Heroısmo, Portugal
S. Henriques � R. CarvalhoDepartment of Biology, University of Evora, Evora, Portugal
123
Biodivers Conserv (2011) 20:873–894DOI 10.1007/s10531-011-0001-8
Our results indicate that the climatic gradient and historic factors played a key role in the
current spiders’ biogeographic patterns.
Keywords Biogeography � Mediterranean � Iberian Peninsula � Coastal dunes �Indicator species � Spiders
Introduction
The Iberian Peninsula has long been recognized for its high levels of species richness,
rarity and endemicity, being considered as one of the most important areas for conservation
included in the mediterranean biodiversity ‘‘hotspot’’ (Myers et al. 2000). Several factors
have been invoked to explain the high biodiversity of the Iberian Peninsula, such as the
particular biogeography, high environmental heterogeneity and the occurrence of impor-
tant historic events. This region comprises two distinct biogeographic regions, Eurosibe-
rian (Northern Iberia) and Mediterranean (Centre and Southern Iberia). Hence, the Iberian
Peninsula represents the southern limit of the distribution for many Eurosiberian taxa,
and the northern limit for many Mediterranean taxa (Gonzalez et al. 2009). The Iberian
Peninsula is characterized by high environmental heterogeneity due to climatic and
physiographic complexity, which are important determinants of the composition and
structure of communities (Stefanescu et al. 2004; Jimenez-Valverde and Lobo 2007).
Historic events have played also an important role in shaping current biogeographical
patterns. The Messinian Salinity Crisis (*5.5 Ma) caused the desiccation of the Medi-
terranean Sea, allowing the exchange of terrestrial animals between the Iberian Peninsula
and Northern Africa (e.g. Cabrero-Sanudo and Lobo 2006). Later, the Iberian Peninsula
played an important role as refugia during glacial-interglacial cycles of the Pleistocene,
resulting in the differentiation and speciation of many taxa (Gomez and Lunt 2007;
Jimenez-Moreno et al. 2010).
The dunes of the Atlantic coast of the Iberian Peninsula have been recognized as
a priority area for conservation due to the large number of rare or endemic species (Lomba
et al. 2008; Maltez-Mouro et al. 2010). Moreover, coastal dunes are one of the most
threatened systems due to human disturbance, such as urbanization and tourism, and
climatic changes (Meulen and Salman 1996; Heslenfeld et al. 2004). The reduction of the
current levels of biodiversity loss depends on our ability to understand the biogeographic
patterns in order to develop efficient conservation programs in the context of human usage
(Whittaker et al. 2005). This knowledge is also crucial for predicting and monitoring the
potential impacts of climate change. Invertebrate communities of coastal dunes are par-
ticularly sensitive to the potential effects of human disturbance and climatic changes, due
to the harshness of the environmental conditions (wind exposure, salt spray, high solar
radiation, extreme temperatures) where they live (Comor et al. 2008; Bonte and Maes
2008). Furthermore, being a linear and usually fragmented habitat, costal dunes pose a
problem for the dispersal of specialized species dependent on it (Bonte et al. 2004). This
linearity and fragmentation influences the source-sink dynamics of metapopulations, fur-
ther increasing the vulnerability of species (Bonte et al. 2003a).
In this work we study the biogeographic patterns of spider assemblages in coastal dunes
along the western Atlantic coast of the Iberian Peninsula. Spiders were chosen as a model
group because they are speciose, abundant, easy to sample and play an important role in
shaping terrestrial arthropod communities (Wise 1993). Spiders have been pointed as good
candidates for bioindication studies since they respond sensitively to environmental
874 Biodivers Conserv (2011) 20:873–894
123
changes and anthropogenic impacts (Marc et al. 1999; Entling et al. 2007; Finch et al.
2008; Cardoso et al. 2010). Despite their functional role in ecosystems, spiders have been
one of the most neglected groups in conservation biology and biogeography. This lack of
knowledge might have negative consequences to ensure the representativeness and com-
plementarity principles of conservation.
By using spiders as a model we intend to obtain more quantitative knowledge on the
biogeographic patterns of coastal species distribution necessary to develop efficient con-
servation strategies. Due to the strong climate gradient characteristic of the Atlantic coast
of the Iberian Peninsula and its complex geological history, we hypothesize that climate
and historic events are potential important determinants of biogeographic patterns of spider
assemblages. In this line of research, we established the following aims: (1) to identify
distribution patterns of spiders; (2) to analyse biogeographic affinities among the coastal
dunes using spiders as a model and compare these to previously described biogeographic
regions and climatic conditions; (3) to identify characteristic species for delimited regions;
(4) to relate the delimited regions with the distribution range of spider species.
Materials and methods
Study area and sampling sites
The western Atlantic coast of the Iberian Peninsula is dominated by a gradient of medi-
terraneity from North to South. The Northern coast is included in the Eurosiberian bio-
geographical region, while the Centre and South are included in the Mediterranean
biogeographical region (Costa et al. 1998; Rivas-Martınez et al. 2004a). Three thermo-
climatic belts have been recognised by the Worldwide Bioclimatic Classification System:
Temperate, Mesomediterranean and Thermomediterranean (Rivas-Martınez et al. 2004b).
Sampling was conducted in the grey dunes area of each site, i.e. interior fixed dunes
with herbaceous vegetation according to the CORINE biotope classification. Grey dunes
demand special conservation concern, being considered a priority habitat according to the
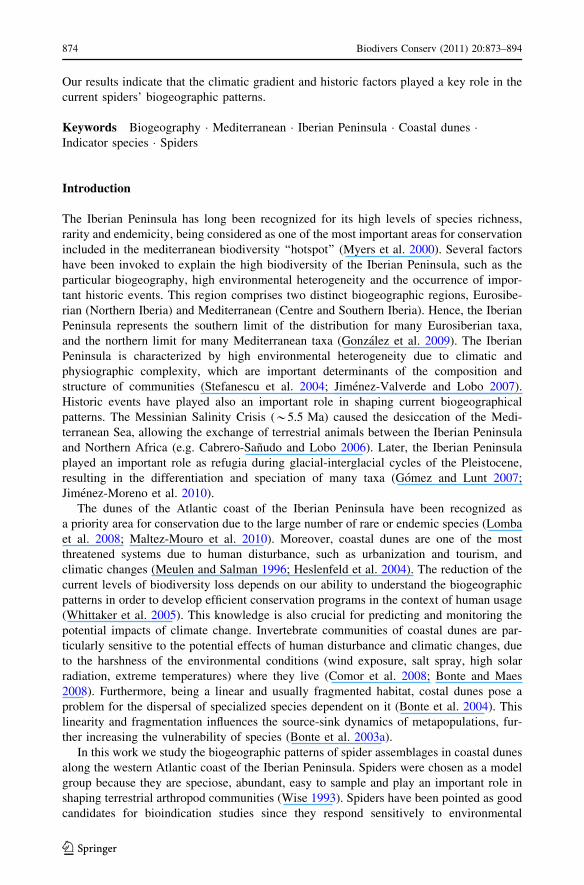
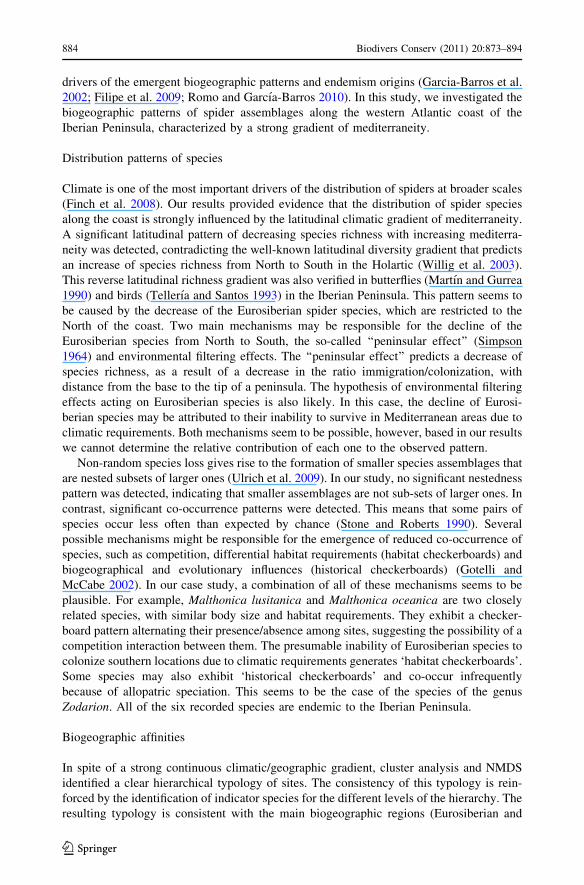
European Union Habitats Directive. Sampling took place in 18 sites, along a total distance
of 445 km of the Portuguese Atlantic coast, in 2008 and 2009 (Fig. 1). One of the most
striking geographic features of the coastline is its alignment with the latitude axis, which
results in a latitudinal climatic gradient of mediterraneity, characterized by a decrease of
precipitation and an increase of temperature and the period of summer drought, from North
to South (see Appendix 1 for the location and climatic characteristics of the studied sites).
Biological sampling design
We used a standardized and optimized semi-quantitative sampling protocol developed for
Mediterranean spiders (Cardoso et al. 2008a, b, 2009a; Cardoso 2009). Field procedures
were carried out during May and June, when spider species richness and abundance are
highest in Mediterranean ecosystems (Cardoso et al. 2007). This protocol uses different
collecting methods (e.g. pit-fall, sweeping, beating and hand collecting), however we used
only pitfall trapping due to the poor structuring of vegetation of the sampled dunes. By
adopting this methodology, we assume that our sampling target is the epigeal spiders guild
and not the entire community of spiders. Therefore, occasional catches (only singletons
and doubletons) of web-building spiders (Linyphiidae, Theridiidae and Araneidae) were
discarded. Pitfall trapping was used in previous studies, allowing a clear assessment of the
Biodivers Conserv (2011) 20:873–894 875
123

regional and local variations of spider assemblages composition of grey dunes (Bonte et al.
2003b).
At each site, a square sampling plot (100 9 100 m2) was delimited. At each plot, 48
traps were distributed in 12 groups, forming small squares (5 m wide) of 4 traps. The
groups were placed in a 4 9 3 arrangement parallel to the sea. The distance between
adjacent groups was 20 meters. Plastic cups (8 cm diameter 9 12 cm depth) were used as
pitfall traps. Cups were buried in the sand and covered with a cork plate placed 2 cm above
ground. For preservation, a solution of ethylene glycol diluted in water (1/1, v/v), with a
few drops of detergent to break surface tension, was used. The biological material was
collected after 15 days in individual bags and transported to the laboratory for triage and
identification.
By concentrating a high trap density in a short period, we avoided the so called spatial
edge effects (vagrants from other habitats types in the vicinity of the sampling place) and
phenological edge effects (mature individuals characteristic of other seasons outside the
sampled period), a common source of error in ecological studies (see Longino et al. (2002),
Scharff et al. (2003)).
Only adult spiders were identified to species level, juveniles were discarded from the
analyses. Nomenclature followed Platnick (2010).
Data analysis
For the purpose of estimating the completeness of the inventory, each group of four traps
was considered as a sample (n = 12 per sampling plot). The inventory completeness was
assessed by calculating the ratio of observed species richness to six commonly used
Mediterranean sea
Por
tuga
l Spain
North of Africa0 100
Km
N
AMOCARBELESPAPUMIN
FURTORSJAMIRQUILEIOBA
STAABRSANSTOALM
Fig. 1 Location of the sampling sites along the western Atlantic coast of the Iberian Peninsula
876 Biodivers Conserv (2011) 20:873–894
123
estimators: Chao1, Chao2, Jack1, Jack2, Boot and MMMeans. Estimator curves for each
site were obtained, based on 1000 randomizations of the species 9 12 samples data matrix,
using the EstimateS 8.2 package (Colwell 2009).
Distance-decay of similarity, nestedness and co-occurrence patterns
The distance decay of similarity was studied by regressing the similarity in species
composition between sites against the geographical distance between them (Nekola and
White 1999). Similarity in species composition was quantified with the complement of
the Williams b-3 index (i.e. 1 - b-3). We used this measure because it is particularly
robust to undersampling and is also insensitive to differences of species richness
between communities (Cardoso et al. 2009b). Distance decay regressions were fit in
log–log space to linearize the relationship between similarity and distance. A Mantel
test (Legendre and Legendre 1998) was applied to assess the significance of the dis-
tance decay of similarity.
We performed a nestedness analysis on the sites x species presence–absence matrix, in
order to verify if smaller species assemblages were a non-random subset of larger species
assemblages. The binary matrix nestedness temperature calculator (BINMATNEST) was
used to quantify the level of nestedness. The algorithm maximizes the matrix nestedness by
permuting rows and columns and a temperature T ranging from 0 (complete order) to 100
(complete disorder) is calculated (for details, see Rodrıguez-Girones and Santamarıa
(2006)). Since most nestedness metrics tend to measure some degree of nestedness, even in
matrices with a completely random pattern, we also used the Nestedness based on Overlap
and Decreasing Fill (NODF) metric that identifies these cases (Almeida-Neto et al. 2007).
NODF varies between 0 (complete disorder) and 100 (complete order).
In order to describe patterns of co-occurrence of species among sites, we calculated the
number of unique species pairs that never co-occur (CU—checkerboard units) and the
C-score (see Stone and Roberts (1990)). A simple score is computed for each pair of
species as (Ri - S)(Rj - S) where Ri and Rj are the number of sites where species i and j
occur, and S is the number of sites in which both species co-occur. The C-score corre-
sponds to the mean of the values calculated for all possible pairs of species in the matrix. If
the CU and the C-score were higher then expected by chance, then we may conclude that
species tended not to occur in the same sites.
To determine the statistical significance of the estimated nestedness and co-occurrence
metrics (T, NODF, CU and C-score), we compared the observed values with the 95%
confidence intervals produced by an appropriate random null model (1000 simulations).
Although several null models exist, we used the null model in which row and columns
sums are fixed as recommended by Ulrich et al. (2009). The analyses were performed in
the R statistical language (R Development Core Team 2009) using the package ‘‘vegan’’
(Oksanen et al. 2010).
Similarity analysis
We performed a similarity analysis in order to obtain a hierarchical classification of sites.
A distance matrix was constructed using the Bray-Curtis index as a measure of similarity.
Hierarchical agglomerative clustering was conducted on the square-root transformed dis-
tance matrix, using the Ward method as the linkage rule and the AGNES algorithm
(Kaufman and Rousseeuw 1990) implemented in the R-package ‘‘cluster’’ (Maechler
2010). AGNES calculates a coefficient, called Agglomerative Coefficient—AC, which
Biodivers Conserv (2011) 20:873–894 877
123

measures the clustering structure of the data set. AC is a dimensionless quantity, varying
between 0 (the algorithm has not found a natural structure) and 1 (a clear structure has been
found). Following Kelley et al. (1996), we used a penalty function (KGS) in order to
identify consistent and distinct clusters of sites. This method maximizes differences
between groups and cohesiveness within groups (using the species pairwise distance
matrix). The minimum of the KGS function corresponds to the optimal number of clusters.
We used the ‘kgs’ function implemented in R-package ‘maptree’ (White 2009).
Differences among the identified clusters were tested by the ANOSIM test (Clarke and
Warwick 1994; Legendre and Legendre 1998). This non-parametric technique produces an
R statistic that measures the difference of mean ranks of distance between and within
clusters. The significance of the R statistic was assessed by a permutation approach (1000
permutations).
Indicator species
Indicator species analysis (Dufrene and Legendre 1997) was performed to identify indi-
cator species for the various clustering levels of the site typology obtained in the similarity
analysis. This method provides an indicator value (IndVal) for each species, combining the
degree of specificity (abundance and distribution within clusters) and fidelity (frequency of
occurrence within a cluster). The significance of the IndVal was assessed by permutation
(1000 permutations). Species with significant (P \ 0.05) IndVals higher than 50% in a
cluster were then regarded as ‘‘indicator species’’ of that particular cluster. The analysis
was performed in the R statistical language (R Development Core Team 2009) using the
package ‘‘labdsv’’ (Roberts 2010).
Biogeographic range
A specific geographic distribution category was attributed to each species: wide-range
(included cosmopolitan, Holarctic and Palearctic species), Eurosiberian, Mediterranean
and Iberian. Mediterranean species were further divided in Northern Mediterranean
(occurring in the Iberian Peninsula and European Mediterranean countries only), Southern
Mediterranean (occurring in the Iberian Peninsula and Northern Africa) and Pan-medi-
terranean (occurring in the Iberian Peninsula, European Mediterranean countries and
Northern Africa).
Data on the distribution of each species was obtained form the World Spider catalogue
(Platnick 2010), the Fauna Europaea database (Helsdingen 2009) and the Iberian Spider
checklist (Cardoso and Moreno 2010). We also obtained information from taxonomic
specialists to complement our database (Robert Bosmans, Laboratorium voor Ecologie,
Gent, Belgium and Hisham El-Hennawy, Serket and Arachnid Collection of Egypt),
namely to identify Mediterranean species that occur in Northern Africa.
We used non-metric multidimensional scaling (NMDS) to further analyse differenti-
ation among assemblages and regional patterns of spider species. The analysis was
carried out on a Bray-Curtis distance matrix. Species scores were computed and plotted
in the ordination space to aid in the interpretation of results. Species were coded
according to their biogeographic category. The analysis was performed in the R statis-
tical language (R Development Core Team 2009) using the package ‘‘vegan’’ (Oksanen
et al. 2010).
878 Biodivers Conserv (2011) 20:873–894
123
Results
Species richness, abundance and inventory completeness
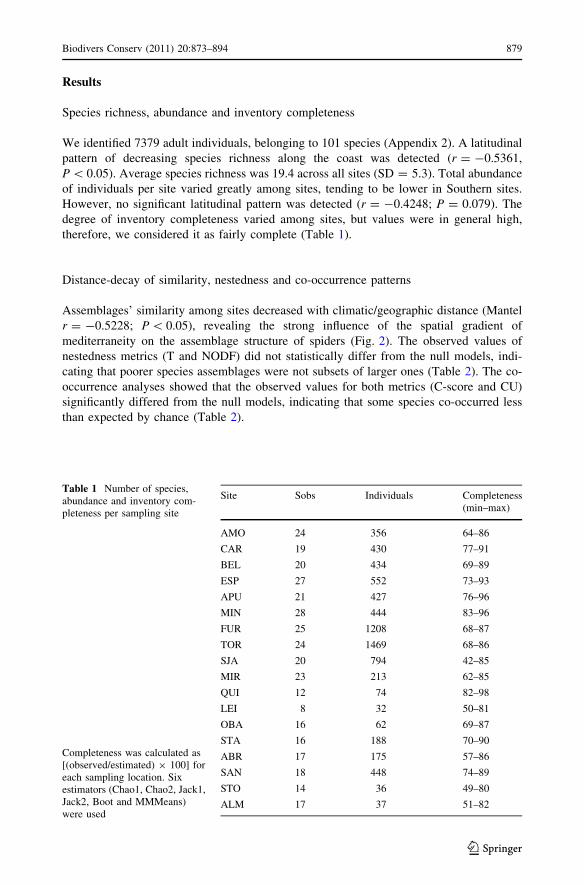
We identified 7379 adult individuals, belonging to 101 species (Appendix 2). A latitudinal
pattern of decreasing species richness along the coast was detected (r = -0.5361,
P \ 0.05). Average species richness was 19.4 across all sites (SD = 5.3). Total abundance
of individuals per site varied greatly among sites, tending to be lower in Southern sites.
However, no significant latitudinal pattern was detected (r = -0.4248; P = 0.079). The
degree of inventory completeness varied among sites, but values were in general high,
therefore, we considered it as fairly complete (Table 1).
Distance-decay of similarity, nestedness and co-occurrence patterns
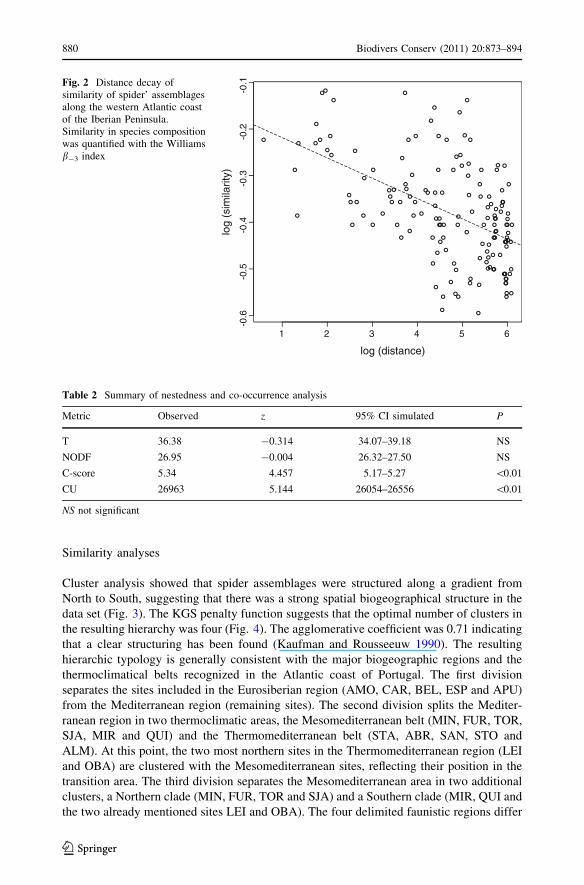
Assemblages’ similarity among sites decreased with climatic/geographic distance (Mantel
r = -0.5228; P \ 0.05), revealing the strong influence of the spatial gradient of
mediterraneity on the assemblage structure of spiders (Fig. 2). The observed values of
nestedness metrics (T and NODF) did not statistically differ from the null models, indi-
cating that poorer species assemblages were not subsets of larger ones (Table 2). The co-
occurrence analyses showed that the observed values for both metrics (C-score and CU)
significantly differed from the null models, indicating that some species co-occurred less
than expected by chance (Table 2).
Table 1 Number of species,abundance and inventory com-pleteness per sampling site
Completeness was calculated as[(observed/estimated) 9 100] foreach sampling location. Sixestimators (Chao1, Chao2, Jack1,Jack2, Boot and MMMeans)were used
Site Sobs Individuals Completeness(min–max)
AMO 24 356 64–86
CAR 19 430 77–91
BEL 20 434 69–89
ESP 27 552 73–93
APU 21 427 76–96
MIN 28 444 83–96
FUR 25 1208 68–87
TOR 24 1469 68–86
SJA 20 794 42–85
MIR 23 213 62–85
QUI 12 74 82–98
LEI 8 32 50–81
OBA 16 62 69–87
STA 16 188 70–90
ABR 17 175 57–86
SAN 18 448 74–89
STO 14 36 49–80
ALM 17 37 51–82
Biodivers Conserv (2011) 20:873–894 879
123
Similarity analyses
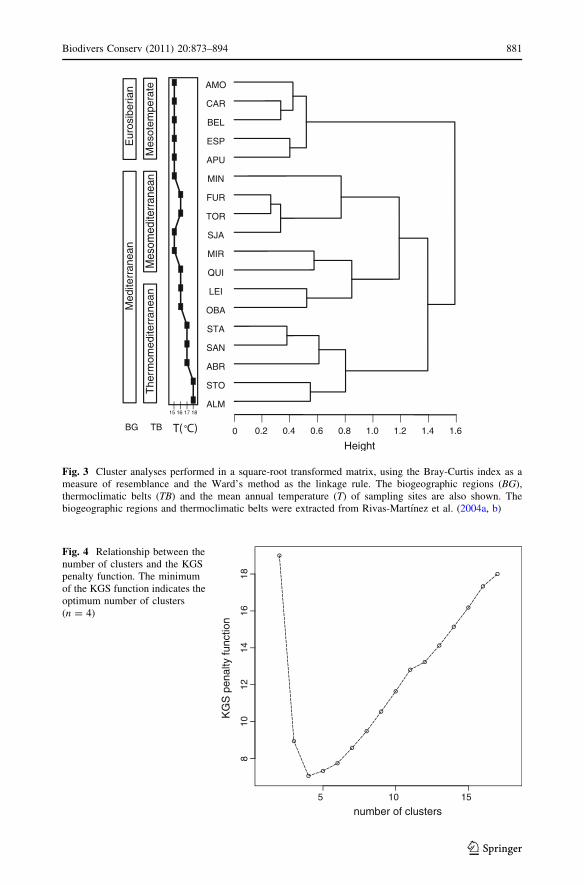
Cluster analysis showed that spider assemblages were structured along a gradient from
North to South, suggesting that there was a strong spatial biogeographical structure in the
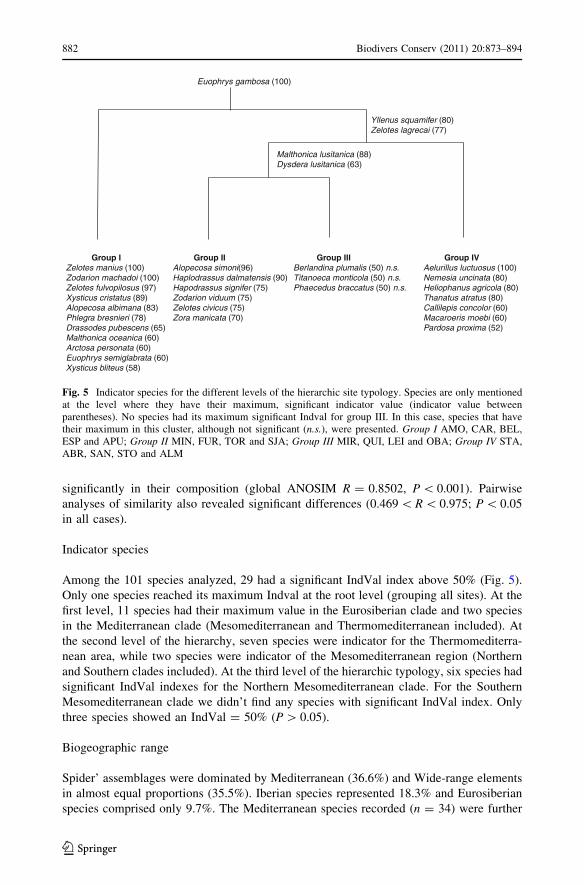
data set (Fig. 3). The KGS penalty function suggests that the optimal number of clusters in
the resulting hierarchy was four (Fig. 4). The agglomerative coefficient was 0.71 indicating
that a clear structuring has been found (Kaufman and Rousseeuw 1990). The resulting
hierarchic typology is generally consistent with the major biogeographic regions and the
thermoclimatical belts recognized in the Atlantic coast of Portugal. The first division
separates the sites included in the Eurosiberian region (AMO, CAR, BEL, ESP and APU)
from the Mediterranean region (remaining sites). The second division splits the Mediter-
ranean region in two thermoclimatic areas, the Mesomediterranean belt (MIN, FUR, TOR,
SJA, MIR and QUI) and the Thermomediterranean belt (STA, ABR, SAN, STO and
ALM). At this point, the two most northern sites in the Thermomediterranean region (LEI
and OBA) are clustered with the Mesomediterranean sites, reflecting their position in the
transition area. The third division separates the Mesomediterranean area in two additional
clusters, a Northern clade (MIN, FUR, TOR and SJA) and a Southern clade (MIR, QUI and
the two already mentioned sites LEI and OBA). The four delimited faunistic regions differ
1 2 3 4 5 6
-0.6
-0.5
-0.4
-0.3
-0.2
-0.1
log (distance)
log
(sim
ilarit
y)
Fig. 2 Distance decay ofsimilarity of spider’ assemblagesalong the western Atlantic coastof the Iberian Peninsula.Similarity in species compositionwas quantified with the Williamsb-3 index
Table 2 Summary of nestedness and co-occurrence analysis
Metric Observed z 95% CI simulated P
T 36.38 -0.314 34.07–39.18 NS
NODF 26.95 -0.004 26.32–27.50 NS
C-score 5.34 4.457 5.17–5.27 \0.01
CU 26963 5.144 26054–26556 \0.01
NS not significant
880 Biodivers Conserv (2011) 20:873–894
123
AMO
CAR
BEL
ESP
APU
MIN
FUR
TOR
SJA
MIR
QUI
LEI
OBA
STA
SAN
ABR
STO
ALM
0.2 0.4 0.6 0.8 1.0 1.2 1.4 1.6
Height0
Med
iterr
anea
nE
uros
iber
i an
Mes
otem
pera
t eM
esom
edite
rran
ean
The
rmom
edite
rran
ean
10
15
15 16 17 18
BG TB
Fig. 3 Cluster analyses performed in a square-root transformed matrix, using the Bray-Curtis index as ameasure of resemblance and the Ward’s method as the linkage rule. The biogeographic regions (BG),thermoclimatic belts (TB) and the mean annual temperature (T) of sampling sites are also shown. Thebiogeographic regions and thermoclimatic belts were extracted from Rivas-Martınez et al. (2004a, b)
5 10 15
810
1214
1618
number of clusters
KG
S p
enal
ty fu
nctio
n
Fig. 4 Relationship between thenumber of clusters and the KGSpenalty function. The minimumof the KGS function indicates theoptimum number of clusters(n = 4)
Biodivers Conserv (2011) 20:873–894 881
123
significantly in their composition (global ANOSIM R = 0.8502, P \ 0.001). Pairwise
analyses of similarity also revealed significant differences (0.469 \ R \ 0.975; P \ 0.05
in all cases).
Indicator species
Among the 101 species analyzed, 29 had a significant IndVal index above 50% (Fig. 5).
Only one species reached its maximum Indval at the root level (grouping all sites). At the
first level, 11 species had their maximum value in the Eurosiberian clade and two species
in the Mediterranean clade (Mesomediterranean and Thermomediterranean included). At
the second level of the hierarchy, seven species were indicator for the Thermomediterra-
nean area, while two species were indicator of the Mesomediterranean region (Northern
and Southern clades included). At the third level of the hierarchic typology, six species had
significant IndVal indexes for the Northern Mesomediterranean clade. For the Southern
Mesomediterranean clade we didn’t find any species with significant IndVal index. Only
three species showed an IndVal = 50% (P [ 0.05).
Biogeographic range
Spider’ assemblages were dominated by Mediterranean (36.6%) and Wide-range elements
in almost equal proportions (35.5%). Iberian species represented 18.3% and Eurosiberian
species comprised only 9.7%. The Mediterranean species recorded (n = 34) were further
Euophrys gambosa (100)
Group IVAelurillus luctuosus (100)Nemesia uncinata (80)Heliophanus agricola (80)Thanatus atratus (80)Callilepis concolor (60)Macaroeris moebi (60)Pardosa proxima (52)
Group IIIBerlandina plumalis (50) n.s.Titanoeca monticola (50) n.s.Phaecedus braccatus (50) n.s.
Malthonica lusitanica (88)Dysdera lusitanica (63)
Group IIAlopecosa simoni(96)Haplodrassus dalmatensis (90)Hapodrassus signifer (75)Zodarion viduum (75)Zelotes civicus (75)Zora manicata (70)
Group IZelotes manius (100)Zodarion machadoi (100)Zelotes fulvopilosus (97)Xysticus cristatus (89)Alopecosa albimana (83)Phlegra bresnieri (78)Drassodes pubescens (65)Malthonica oceanica (60)Arctosa personata (60)Euophrys semiglabrata (60)Xysticus bliteus (58)
Yllenus squamifer (80)Zelotes lagrecai (77)
Fig. 5 Indicator species for the different levels of the hierarchic site typology. Species are only mentionedat the level where they have their maximum, significant indicator value (indicator value betweenparentheses). No species had its maximum significant Indval for group III. In this case, species that havetheir maximum in this cluster, although not significant (n.s.), were presented. Group I AMO, CAR, BEL,ESP and APU; Group II MIN, FUR, TOR and SJA; Group III MIR, QUI, LEI and OBA; Group IV STA,ABR, SAN, STO and ALM
882 Biodivers Conserv (2011) 20:873–894
123
dissected into three geographic distributional types: Northern (38.2%), Southern (17.7%)
and Pan-mediterranean (44.1%). The significant proportion of Southern Mediterranean
elements in Portugal is illustrative of the past historical relationship between the Iberian
Peninsula and the North of Africa.
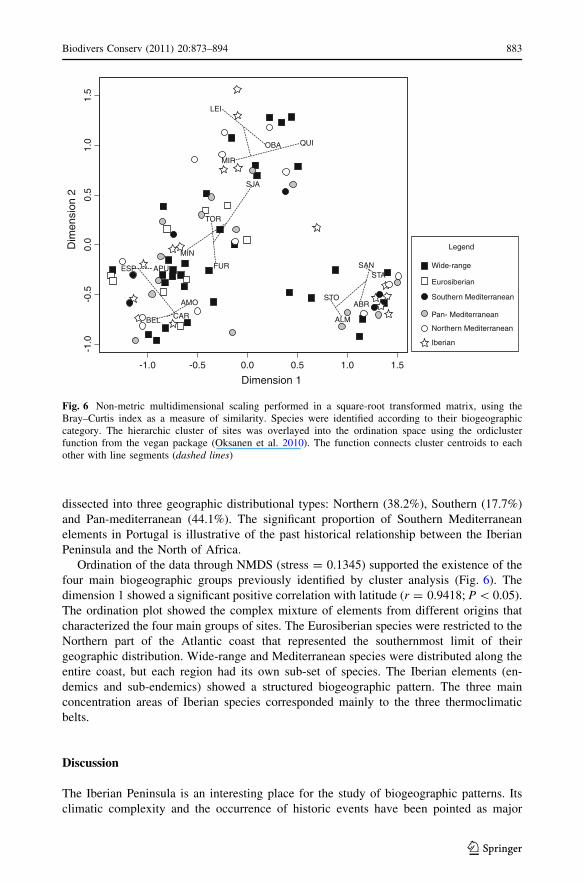
Ordination of the data through NMDS (stress = 0.1345) supported the existence of the
four main biogeographic groups previously identified by cluster analysis (Fig. 6). The
dimension 1 showed a significant positive correlation with latitude (r = 0.9418; P \ 0.05).
The ordination plot showed the complex mixture of elements from different origins that
characterized the four main groups of sites. The Eurosiberian species were restricted to the
Northern part of the Atlantic coast that represented the southernmost limit of their
geographic distribution. Wide-range and Mediterranean species were distributed along the
entire coast, but each region had its own sub-set of species. The Iberian elements (en-
demics and sub-endemics) showed a structured biogeographic pattern. The three main
concentration areas of Iberian species corresponded mainly to the three thermoclimatic
belts.
Discussion
The Iberian Peninsula is an interesting place for the study of biogeographic patterns. Its
climatic complexity and the occurrence of historic events have been pointed as major
-1.0 -0.5 0.0 0.5 1.0 1.5
-1.0
-0.5
0.0
0.5
1.0
1.5
Dimension 1
Dim
ensi
on 2
LEI
QUI
MIR
OBA
SJA
TOR
FUR
MIN
ESP APU
AMO
CARBEL
SANSTA
ABR
ALM
STO
Iberian
Northern Mediterranean
Eurosiberian
Wide-range
Legend
Pan- Mediterranean
Southern Mediterranean
Fig. 6 Non-metric multidimensional scaling performed in a square-root transformed matrix, using theBray–Curtis index as a measure of similarity. Species were identified according to their biogeographiccategory. The hierarchic cluster of sites was overlayed into the ordination space using the ordiclusterfunction from the vegan package (Oksanen et al. 2010). The function connects cluster centroids to eachother with line segments (dashed lines)
Biodivers Conserv (2011) 20:873–894 883
123
drivers of the emergent biogeographic patterns and endemism origins (Garcia-Barros et al.
2002; Filipe et al. 2009; Romo and Garcıa-Barros 2010). In this study, we investigated the
biogeographic patterns of spider assemblages along the western Atlantic coast of the
Iberian Peninsula, characterized by a strong gradient of mediterraneity.
Distribution patterns of species
Climate is one of the most important drivers of the distribution of spiders at broader scales
(Finch et al. 2008). Our results provided evidence that the distribution of spider species
along the coast is strongly influenced by the latitudinal climatic gradient of mediterraneity.
A significant latitudinal pattern of decreasing species richness with increasing mediterra-
neity was detected, contradicting the well-known latitudinal diversity gradient that predicts
an increase of species richness from North to South in the Holartic (Willig et al. 2003).
This reverse latitudinal richness gradient was also verified in butterflies (Martın and Gurrea
1990) and birds (Tellerıa and Santos 1993) in the Iberian Peninsula. This pattern seems to
be caused by the decrease of the Eurosiberian spider species, which are restricted to the
North of the coast. Two main mechanisms may be responsible for the decline of the
Eurosiberian species from North to South, the so-called ‘‘peninsular effect’’ (Simpson
1964) and environmental filtering effects. The ‘‘peninsular effect’’ predicts a decrease of
species richness, as a result of a decrease in the ratio immigration/colonization, with
distance from the base to the tip of a peninsula. The hypothesis of environmental filtering
effects acting on Eurosiberian species is also likely. In this case, the decline of Eurosi-
berian species may be attributed to their inability to survive in Mediterranean areas due to
climatic requirements. Both mechanisms seem to be possible, however, based in our results
we cannot determine the relative contribution of each one to the observed pattern.
Non-random species loss gives rise to the formation of smaller species assemblages that
are nested subsets of larger ones (Ulrich et al. 2009). In our study, no significant nestedness
pattern was detected, indicating that smaller assemblages are not sub-sets of larger ones. In
contrast, significant co-occurrence patterns were detected. This means that some pairs of
species occur less often than expected by chance (Stone and Roberts 1990). Several
possible mechanisms might be responsible for the emergence of reduced co-occurrence of
species, such as competition, differential habitat requirements (habitat checkerboards) and
biogeographical and evolutionary influences (historical checkerboards) (Gotelli and
McCabe 2002). In our case study, a combination of all of these mechanisms seems to be
plausible. For example, Malthonica lusitanica and Malthonica oceanica are two closely
related species, with similar body size and habitat requirements. They exhibit a checker-
board pattern alternating their presence/absence among sites, suggesting the possibility of a
competition interaction between them. The presumable inability of Eurosiberian species to
colonize southern locations due to climatic requirements generates ‘habitat checkerboards’.
Some species may also exhibit ‘historical checkerboards’ and co-occur infrequently
because of allopatric speciation. This seems to be the case of the species of the genus
Zodarion. All of the six recorded species are endemic to the Iberian Peninsula.
Biogeographic affinities
In spite of a strong continuous climatic/geographic gradient, cluster analysis and NMDS
identified a clear hierarchical typology of sites. The consistency of this typology is rein-
forced by the identification of indicator species for the different levels of the hierarchy. The
resulting typology is consistent with the main biogeographic regions (Eurosiberian and
884 Biodivers Conserv (2011) 20:873–894
123

Mediterranean) and the thermoclimatic belts recognized for the Atlantic coast of the
Iberian Peninsula (Rivas-Martınez et al. 2004a, b). This strong biogeographic structure
may be explained on the basis of (1) a high turnover of species caused by the steep gradient
of mediterraneity, (2) the restriction of the Eurosiberian species to the North of the country,
(3) the high geographic structure of the Iberian species (endemics and sub-endemics) and
(4) the colonization of the Iberian Peninsula by Northern African species.
Biogeographic range of species
The analysis of the geographic range of spider species indicates that the studied region is a
‘‘biogeographic crossroad’’, encompassing faunistic elements of different origins (Wide-
range, Eurosiberian, Mediterranean and Iberian). The mixture of organisms of different
origins is one of the most striking aspects of the biogeography of the Iberian Peninsula
(Cabrero-Sanudo and Lobo 2006; Gonzalez et al. 2009) and of the Mediterranean Basin
(Blondel et al. 2010). Nevertheless, the region has a predominance of Mediterranean
species, which highlights its importance as a significant reservoir of the mediterranean-type
fauna. By decomposing further the biogeographic range of Mediterranean species into
three categories (Northern, Southern and Pan-Mediterranean) we found the signature of
historic processes that shaped the current biogeographic patterns. The presence of species
only found in the Iberian Peninsula and Northern Africa is most likely a consequence of the
historic connection between the two regions (e.g. Messinian Salinity Crisis, *5.5 Ma),
which allowed the interchange of species (Jimenez-Moreno et al. 2010). One striking
feature of the spider fauna inhabiting the coast of the Iberian Peninsula is the relatively
high proportion of Iberian species (*20% of endemics and sub-endemics). This pattern
could be related to the Pleistocene climate cycles that have repeatedly increased and
decreased the areas of coastal zones, favouring the differentiation of species as repeated
fragmentation of initial areas of distribution took place over time (Blondel et al. 2010). The
geographic structure of the Iberian species distribution is congruent with the thermocli-
matic belts, suggesting an interaction between ecological factors and historic events.
However, this issue could only be clarified with more specific biogeographic studies and
incorporating phylogenetic information.
Conservation implications
Understanding the spatial patterns of biodiversity and their underlying processes is a
fundamental task for conservation biology (Whittaker et al. 2005). Delimiting distinct
biotic regions provides an important framework for setting conservation priorities. This
requires knowledge of different taxa. However, despite their functioning role in ecosys-
tems, some groups, such as spiders, are rarely taking in account in conservation policies.
From the point of view of conservation biogeography, four aspects deserve special
attention in the Western coast of the Iberian Peninsula: (1) a high number of species are
endemic or sub-endemic; (2) the coast is a biogeographic crossroad, encompassing species
from different origins, thus providing opportunities to meet the representativeness and
complementarity goals of conservation; (3) many species show their distribution limits in
this region and are most probably historically isolated lineages with evolutionary potential;
(4) many species present a small-ranged distribution along the coast and tended to be
concentrated in specific areas (indicator species), thus increasing their vulnerability to
human impacts. Although this study only focuses on the distribution patterns of spiders,
these features are probably true for other groups of invertebrates. This work provides
Biodivers Conserv (2011) 20:873–894 885
123
important baseline information that might be incorporated in future conservation and
research programmes in the Atlantic coast of Portugal.
Acknowledgments We are acknowledged to Jose Antonio Barrientos, Carmen Urones and Stano Pekar fortheir help with the taxonomic identification of some spider specimens and to Robert Bosmans and HishamEl-Hennawy for their contribution to identify Mediterranean species that occur in Northern Africa. J.C.C.express his gratitude to the Luso-American Foundation for its support (FLAD CandT Links 2010 grant).P.C. is supported by Fundacao para a Ciencia e Tecnologia (SFRH/BPD/40688/2007).
Appendix 1
See Table 3.
Appendix 2
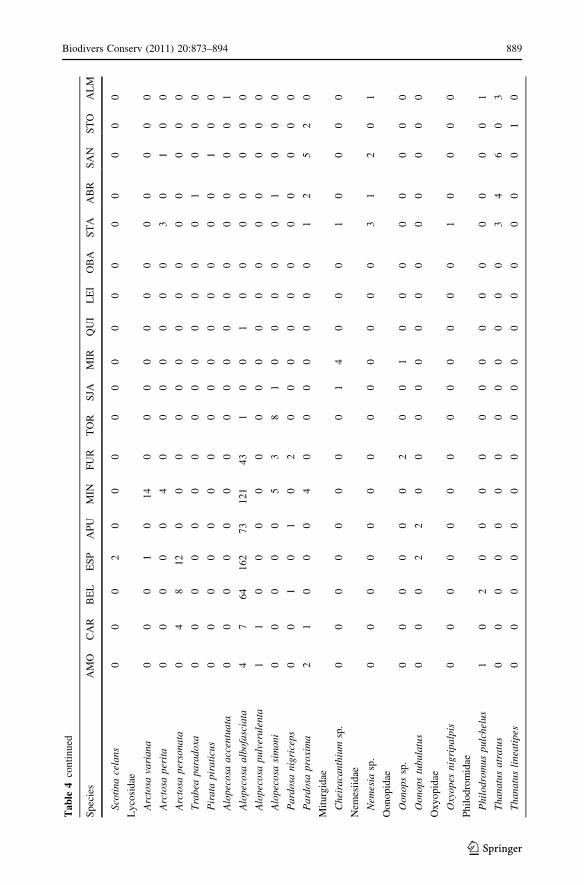
See Table 4.
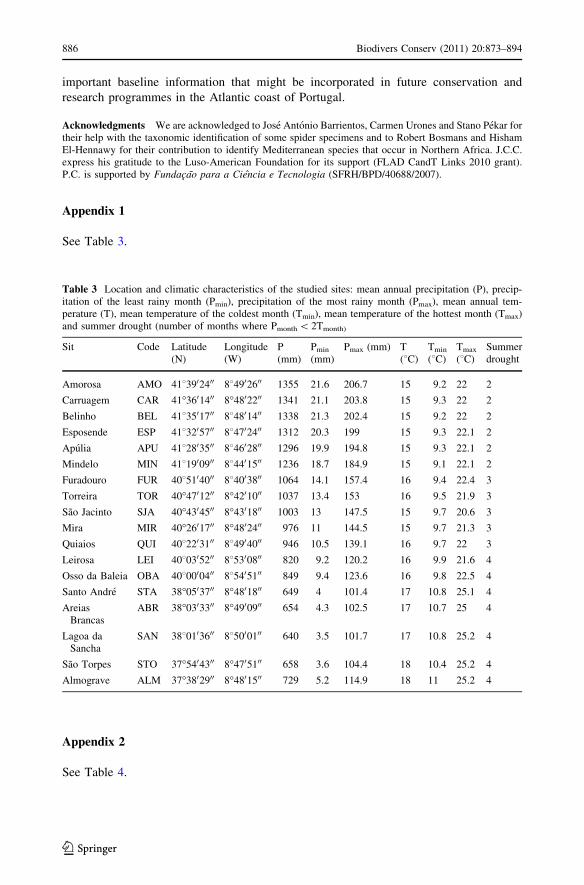
Table 3 Location and climatic characteristics of the studied sites: mean annual precipitation (P), precip-itation of the least rainy month (Pmin), precipitation of the most rainy month (Pmax), mean annual tem-perature (T), mean temperature of the coldest month (Tmin), mean temperature of the hottest month (Tmax)and summer drought (number of months where Pmonth \ 2Tmonth)
Sit Code Latitude(N)
Longitude(W)
P(mm)
Pmin
(mm)Pmax (mm) T
(8C)Tmin
(8C)Tmax
(8C)Summerdrought
Amorosa AMO 4183902400 884902600 1355 21.6 206.7 15 9.2 22 2
Carruagem CAR 41�3601400 8�4802200 1341 21.1 203.8 15 9.3 22 2
Belinho BEL 4183501700 884801400 1338 21.3 202.4 15 9.2 22 2
Esposende ESP 4183205700 884702400 1312 20.3 199 15 9.3 22.1 2
Apulia APU 4182803500 884602800 1296 19.9 194.8 15 9.3 22.1 2
Mindelo MIN 4181900900 884401500 1236 18.7 184.9 15 9.1 22.1 2
Furadouro FUR 4085104000 884003800 1064 14.1 157.4 16 9.4 22.4 3
Torreira TOR 40�4701200 8�4201000 1037 13.4 153 16 9.5 21.9 3
Sao Jacinto SJA 40�4304500 8�4301800 1003 13 147.5 15 9.7 20.6 3
Mira MIR 40�2601700 8�4802400 976 11 144.5 15 9.7 21.3 3
Quiaios QUI 4082203100 884904000 946 10.5 139.1 16 9.7 22 3
Leirosa LEI 4080305200 885300800 820 9.2 120.2 16 9.9 21.6 4
Osso da Baleia OBA 4080000400 885405100 849 9.4 123.6 16 9.8 22.5 4
Santo Andre STA 38�0503700 8�4801800 649 4 101.4 17 10.8 25.1 4
AreiasBrancas
ABR 38�0303300 8�4900900 654 4.3 102.5 17 10.7 25 4
Lagoa daSancha
SAN 3880103600 885000100 640 3.5 101.7 17 10.8 25.2 4
Sao Torpes STO 37�5404300 8�4705100 658 3.6 104.4 18 10.4 25.2 4
Almograve ALM 37�3802900 8�4801500 729 5.2 114.9 18 11 25.2 4
886 Biodivers Conserv (2011) 20:873–894
123

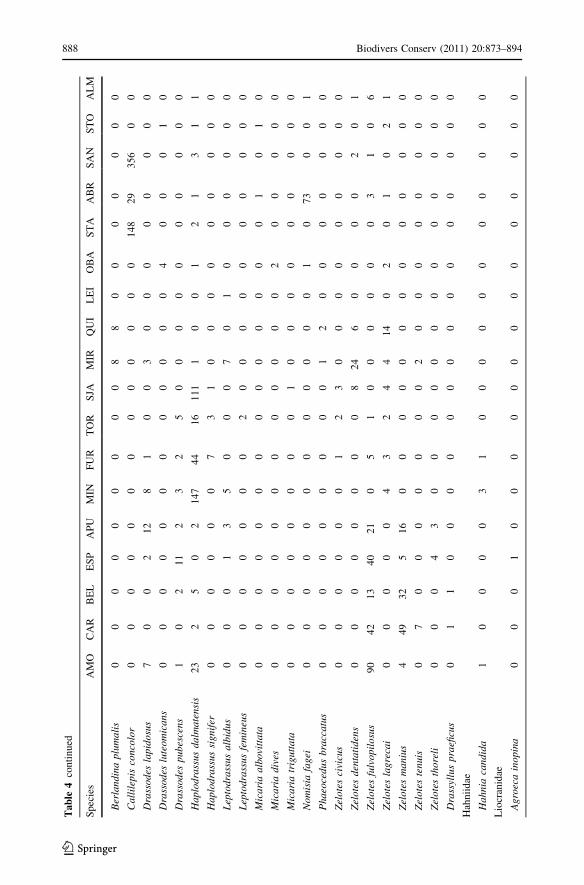
Tab
le4
Lis
to
fsp
ecie
sfo
rea
chsi
te(n
om
encl
atu
reac
cord
ing
toP
latn
ick
20
10)
Sp
ecie
sA
MO
CA
RB
EL
ES
PA
PU
MIN
FU
RT
OR
SJA
MIR
QU
IL
EI
OB
AS
TA
AB
RS
AN
ST
OA
LM
Ag
elen
idae
Ma
lth
onic
alu
sita
nic
a0
00
00
15
81
01
15
80
24
00
00
0
Ma
lth
onic
ao
cea
nic
a1
20
52
00
00
06
11
00
00
0
Ma
lth
onic
ara
mb
lae
00
02
14
00
00
00
00
00
00
Teg
ena
ria
mo
nti
gen
a0
00
03
20
00
00
90
10
00
00
0
Teg
ena
ria
sp.
12
11
16
52
00
00
00
00
00
00
00
Clu
bio
nid
ae
Clu
bio
na
vege
ta0
00
00
00
00
00
10
20
20
0
Co
rin
nid
ae
Lio
phr
uri
llu
sfl
avi
tars
is0
00
00
00
90
10
00
00
00
0
Ph
ruro
lith
us
min
imu
s0
00
00
01
00
00
00
00
00
0
Ph
ruro
lith
us
sp.
10
05
11
15
12
12
11
02
00
10
0
Dic
tyn
idae
Arc
hae
od
icty
na
am
mo
ph
ila
10
00
00
00
00
00
00
00
00
La
thys
sp.
00
00
00
00
01
00
00
00
00
Dy
sder
idae
Dys
der
acr
oca
ta0
00
02
02
00
00
00
00
00
0
Dys
der
afu
scip
es0
00
20
00
21
20
13
00
00
0
Dys
der
alu
sita
nic
a0
00
00
00
11
10
14
00
00
0
Dys
der
am
ach
ado
i0
00
00
10
00
00
00
00
00
0
Ha
rpac
tea
sp.
00
00
00
00
00
00
10
01
00
Ha
rpac
tea
sub
iasi
00
00
00
00
00
00
00
50
00
Rh
ode
scu
tive
ntr
is0
00
00
20
00
00
00
00
00
0
Ere
sidae
Ere
sus
koll
ari
10
00
00
00
00
00
00
00
00
Gn
aph
osi
dae
Biodivers Conserv (2011) 20:873–894 887
123
Tab
le4
con
tin
ued
Sp
ecie
sA
MO
CA
RB
EL
ES
PA
PU
MIN
FU
RT
OR
SJA
MIR
QU
IL
EI
OB
AS
TA
AB
RS
AN
ST
OA
LM
Ber
lan
din
ap
lum
ali
s0
00
00
00
00
88
00
00
00
0
Ca
llil
epis
con
colo
r0
00
00
00
00
00
00
14
82
93
56
00
Dra
ssod
esla
pid
osu
s7
00
21
28
10
03
00
00
00
00
Dra
ssod
eslu
teo
mic
an
s0
00
00
00
00
00
04
00
01
0
Dra
ssod
esp
ub
esce
ns
10
21
12
32
50
00
00
00
00
0
Ha
plo
dra
ssu
sd
alm
ate
nsi
s2
32
50
21
47
44
16
11
11
00
12
13
11
Ha
plo
dra
ssu
ssi
gnif
er0
00
00
07
31
00
00
00
00
0
Lep
todr
ass
usa
lbid
us0
00
13
50
00
70
10
00
00
0
Lep
todr
ass
usfe
min
eus
00
00
00
02
00
00
00
00
00
Mic
ari
aa
lbo
vitt
ata
00
00
00
00
00
00
00
10
10
Mic
ari
ad
ives
00
00
00
00
00
00
20
00
00
Mic
ari
atr
igu
tta
ta0
00
00
00
01
00
00
00
00
0
No
mis
iafa
gei
00
00
00
00
00
00
10
73
00
1
Phaeo
cedus
bra
ccatu
s0
00
00
00
00
12
00
00
00
0
Zel
ote
sci
vicu
s0
00
00
01
23
00
00
00
00
0
Zel
ote
sd
enta
tid
ens
00
00
00
00
82
46
00
00
20
1
Zel
ote
sfu
lvo
pil
osu
s9
04
21
34
02
10
51
00
00
00
31
06
Zel
ote
sla
gre
cai
00
00
04
32
44
14
02
01
02
1
Zel
ote
sm
an
ius
44
93
25
16
00
00
00
00
00
00
0
Zel
ote
ste
nui
s0
70
00
00
00
20
00
00
00
0
Zel
ote
sth
ore
li0
00
43
00
00
00
00
00
00
0
Dra
ssyl
lus
pra
eficu
s0
11
00
00
00
00
00
00
00
0
Hah
nii
dae
Ha
hn
iaca
nd
ida
10
00
03
10
00
00
00
00
00
Lio
cran
idae
Ag
roec
ain
op
ina
00
01
00
00
00
00
00
00
00
888 Biodivers Conserv (2011) 20:873–894
123
Tab
le4
con
tin
ued
Sp
ecie
sA
MO
CA
RB
EL
ES
PA
PU
MIN
FU
RT
OR
SJA
MIR
QU
IL
EI
OB
AS
TA
AB
RS
AN
ST
OA
LM
Sco
tin
ace
lans
00
02
00
00
00
00
00
00
00
Ly
cosi
dae
Arc
tosa
vari
ana
00
01
01
40
00
00
00
00
00
0
Arc
tosa
per
ita
00
00
04
00
00
00
03
01
00
Arc
tosa
per
sona
ta0
48
12
00
00
00
00
00
00
00
Tra
bea
pa
rad
oxa
00
00
00
00
00
00
00
10
00
Pir
ata
pir
ati
cus
00
00
00
00
00
00
00
01
00
Alo
pec
osa
acc
entu
ata
00
00
00
00
00
00
00
00
01
Alo
pec
osa
alb
ofa
scia
ta4
76
41
62
73
12
14
31
00
10
00
00
00
Alo
pec
osa
pu
lver
ule
nta
11
00
00
00
00
00
00
00
00
Alo
pec
osa
sim
oni
00
00
05
38
10
00
00
10
00
Pa
rdo
san
igri
cep
s0
01
01
02
00
00
00
00
00
0
Pa
rdo
sap
roxi
ma
21
00
04
00
00
00
01
25
20
Mit
urg
idae
Chei
raca
nth
ium
sp.
00
00
00
00
14
00
01
00
00
Nem
esii
dae
Nem
esia
sp.
00
00
00
00
00
00
03
12
01
Oo
no
pid
ae
Oo
no
pssp
.0
00
00
02
00
10
00
00
00
0
Oo
no
pstu
bu
latu
s0
00
22
00
00
00
00
00
00
0
Ox
yo
pid
ae
Oxy
op
esn
igri
pa
lpis
00
00
00
00
00
00
01
00
00
Ph
ilo
dro
mid
ae
Ph
ilod
rom
usp
ulc
hel
us1
02
00
00
00
00
00
00
00
1
Th
an
atu
sa
tra
tus
00
00
00
00
00
00
03
46
03
Th
an
atu
sli
nea
tipes
00
00
00
00
00
00
00
00
10
Biodivers Conserv (2011) 20:873–894 889
123

Tab
le4
con
tin
ued
Sp
ecie
sA
MO
CA
RB
EL
ES
PA
PU
MIN
FU
RT
OR
SJA
MIR
QU
IL
EI
OB
AS
TA
AB
RS
AN
ST
OA
LM
Th
an
atu
svu
lga
ris
01
12
00
00
00
00
00
00
00
00
Tib
ellu
so
blo
ng
us
00
00
00
00
10
00
00
00
00
Pis
auri
dae
Pis
au
ram
irab
ilis
21
10
00
21
00
00
00
00
10
Sal
tici
dae
Nea
eth
ace
russ
ata
00
00
00
00
00
00
03
00
00
Ael
uri
llus
v-in
sig
nit
us
00
00
07
00
00
00
00
00
00
Ael
uri
llus
luct
uosu
s0
00
00
00
00
00
00
21
33
3
Eu
op
hry
sfr
on
tali
s0
00
40
00
00
00
00
00
00
0
Eu
op
hry
sg
am
bo
sa1
71
45
17
39
13
82
51
16
18
11
01
56
16
18
88
41
21
19
8
Eu
op
hry
sse
mig
labr
ata
02
03
10
00
00
00
00
00
00
Hel
iop
han
us
ag
rico
la0
00
00
00
00
00
00
11
60
1
Ma
caro
eris
mo
ebi
00
00
00
00
00
00
01
00
12
Neo
nco
nvo
lutu
s0
00
00
10
00
00
00
00
00
0
Neo
nle
vis
00
01
03
00
00
00
10
00
00
Neo
nro
bu
stus
00
00
00
02
00
00
00
00
00
Pel
len
esg
enic
ula
tus
40
00
00
01
00
00
00
00
00
Pel
len
essp
.0
00
00
01
00
10
00
40
00
0
Ph
leg
rab
resn
ieri
61
31
88
14
10
00
00
00
00
Pse
ude
uo
ph
rys
erra
tica
00
00
00
11
00
00
00
00
02
Sa
ltic
us
pro
pin
quu
s0
01
00
00
00
00
00
00
00
0
Sit
ticu
ssa
lta
tor
02
11
01
00
02
00
00
00
00
Syn
age
les
hil
aru
lus
00
00
00
00
10
00
00
00
00
Yll
enus
squ
am
ifer
10
00
05
71
51
60
15
06
12
Th
erid
iid
ae
Ste
ato
daa
lbo
ma
cula
ta0
00
00
00
00
10
00
00
00
00
890 Biodivers Conserv (2011) 20:873–894
123

Tab
le4
con
tin
ued
Sp
ecie
sA
MO
CA
RB
EL
ES
PA
PU
MIN
FU
RT
OR
SJA
MIR
QU
IL
EI
OB
AS
TA
AB
RS
AN
ST
OA
LM
Th
om
isid
ae
Ozy
pti
lapauxi
lla
00
15
20
06
00
00
00
00
00
00
Ozy
pti
lasp
.0
00
00
00
00
00
00
00
01
1
Ozy
pti
laum
bra
culo
rum
20
00
00
00
00
00
00
00
00
Xys
ticu
sb
lite
us3
04
22
11
00
00
00
00
00
00
Xys
ticu
scr
ista
tus
43
55
92
41
10
00
00
00
00
Xys
ticu
sko
chi
00
00
01
00
00
00
00
00
00
Xys
ticu
sn
ub
ilu
s0
00
00
00
00
00
00
00
01
0
Tit
anoec
idae
Tit
an
oec
am
on
tico
la0
00
00
00
00
12
30
00
00
00
Zo
dar
iidae
Zo
da
rio
na
tla
nti
cum
00
00
01
90
00
00
00
00
00
0
Zo
da
rio
nm
ach
ado
i1
67
13
82
23
12
19
60
00
00
00
00
00
00
Zodari
on
alg
arv
ense
00
00
00
00
00
00
00
21
60
0
Zo
da
rio
nvi
du
um
00
00
00
93
81
20
55
38
12
20
00
00
00
Zo
da
rio
nsp
.1
00
00
00
00
00
07
17
00
00
0
Zo
da
rio
nsp
.2
00
00
00
00
00
00
00
81
50
2
Zo
rid
ae
Zo
ram
an
ica
ta0
00
00
01
91
00
00
00
01
0
Biodivers Conserv (2011) 20:873–894 891
123
References
Almeida-Neto M, Guimaraes PR, Lewinsohn TM (2007) On nestedness analyses: rethinking matrix tem-perature and anti-nestedness. Oikos 116:716–722
Blondel J, Aronson J, Bodiou J-Y, Boeuf G (2010) The Mediterranean region: biological diversity in spaceand time. Oxford University Press, Oxford
Bonte D, Maes D (2008) Trampling affects the distribution of specialised coastal dune arthropods. BasicAppl Ecol 9:726–734
Bonte D, Lens L, Maelfait J-P, Hoffmann M, Kuijken E (2003a) Patch quality and connectivity influencespatial dynamics in a dune wolfspider. Oecologia 135:227–233
Bonte D, Criel P, Van Thournout I, Maelfait J-P (2003b) Regional and local variation of spider assemblages(Araneae) from coastal grey dunes along the North Sea. J Biogeogr 30:901–911
Bonte D, Baert L, Lens L, Maelfait J-P (2004) Effects of aerial dispersal, habitat specialisation, andlandscape structure on spider distribution across fragmented grey dunes. Ecography 27:343–349
Cabrero-Sanudo FJ, Lobo JM (2006) Determinant variables of Iberian Peninsula Aphodiinae diversity(Coleoptera, Scarabaeoidea, Aphodiidae). J Biogeogr 33:1021–1043
Cardoso P (2009) Standardization and optimization of arthropod inventories-the case of Iberian spiders.Biodivers Conserv 18:3949–3962
Cardoso P, Moreno E (2010) The Iberian spider checklist (Araneae). Zootaxa 2495:1–52Cardoso P, Silva I, de Oliveira NG, Serrano ARM (2007) Seasonality of spiders (Araneae) in Mediterranean
ecosystems and its implications in the optimum sampling period. Ecol Entomol 32:516–526Cardoso P, Gaspar C, Pereira LC, Silva I, Henriques SS, Silva RR, Sousa P (2008a) Assessing spider species
richness and composition in Mediterranean cork oak forests. Acta Oecol 33:114–127Cardoso P, Scharff N, Gaspar C, Henriques SS, Carvalho R, Castro PH, Schmidt JB, Silva I, Szuts T, Castro
A, Crespo LC (2008b) Rapid biodiversity assessment of spiders (Araneae) using semi-quantitativesampling: a case study in a Mediterranean forest. Insect Conserv Divers 1:71–84
Cardoso P, Aranda SC, Lobo JM, Dinis F, Gaspar C, Borges PAV (2009a) A spatial scale assessment ofhabitat effects on arthropod communities of an oceanic island. Acta Oecol 35:590–597
Cardoso P, Borges PAV, Veech JA (2009b) Testing the performance of beta diversity measures based onincidence data: the robustness to undersampling. Divers Distrib 15:1081–1090
Cardoso P, Arnedo MA, Triantis KA, Borges PAV (2010) Drivers of diversity in Macaronesian spiders andthe role of species extinctions. J Biogeogr 37:1034–1046
Clarke KR, Warwick RM (1994) Change in marine communities: an approach to statistical analysis andinterpretation. Plymouth Marine Laboratory, Plymouth
Colwell RK (2009) EstimateS: statistical estimation of species richness and shared species from samples.Version 8.2. http://viceroy.eeb.uconn.edu/estimates. Persistent URL http://purl.oclc.org/estimates.Accessed 1 July 2010
Comor V, Orgeas J, Ponel P, Rolando C, Delettre YR (2008) Impact of anthropogenic disturbances on beetlecommunities of French Mediterranean coastal dunes. Biodivers Conserv 17:1837–1852
Costa JC, Aguiar C, Capelo JH, Lousa M, Neto C (1998) Biogeografia de Portugal Continental. Quercetea0:5–56
Dufrene M, Legendre P (1997) Species assemblages and indicator species definition: the need of anasymmetrical and flexible approach. Ecol Monogr 67:345–366
Entling W, Schmidt MH, Bacher S, Brandl R, Nentwig W (2007) Niche properties of Central Europeanspiders: shading, moisture, and the evolution of the habitat niche. Glob Ecol Biogeogr 16:440–448
Filipe AF, Araujo MB, Doadrio I, Angermeier PL, Collares-Pereira MJ (2009) Biogeography of Iberianfreshwater fishes revisited: the roles of historical versus contemporary constraints. J Biogeogr36:2096–2110
Finch O-D, Blick T, Schuldt A (2008) Macroecological patterns of spider species richness across Europe.Biodivers Conserv 17:2849–2868
Garcia-Barros E, Gurrea P, Lucianez MJ, Cano JM, Munguira ML, Moreno JC, Sainz H, Sanz MJ, Simon JC(2002) Parsimony analysis of endemicity and its application to animal and plant geographical distri-butions in the Ibero-Balearic region (western Mediterranean). J Biogeogr 29:109–124
Gomez A, Lunt DH (2007) Refugia within refugia: patterns of phylogeographic concordance in the IberianPeninsula. In: Weiss S, Ferrand N (eds) Phylogeography of Southern European Refugia. Springer,Dordrecht, pp 155–188
Gonzalez JA, Gayubo SF, Asıs JD, Tormos J (2009) Diversity and biogeographical significance of solitarywasps (Chrysididae, Eumeninae, and Spheciformes) at the Arribes del Duero Natural Park, Spain: theirimportance for insect diversity conservation in the Mediterranean region. Environ Entomol38:608–626
892 Biodivers Conserv (2011) 20:873–894
123
Gotelli NJ, McCabe D (2002) Species co-occurrence: a meta-analysis of J. M. Diamond’s assembly rulesmodel. Ecol 83:2091–2096
Helsdingen PJ (2009) Araneae. In: Fauna Europaea Database (Version 2009.2). http://www.european-arachnology.org. Accessed 1 July 2010
Heslenfeld P, Jungerius PD, Kijn JA (2004) European coastal dunes: ecological values, threats, opportunitiesand policy development. In: Martınez ML, Psuty N (eds) Coastal dunes: ecology and conservation.Springer-Verlag, Heidelberg, pp 335–351
Jimenez-Moreno G, Fauquette S, Suc J-P (2010) Miocene to Pliocene vegetation reconstruction and climateestimates in the Iberian Peninsula from pollen data. Rev Palaeobot Palynol 163:403–415
Jimenez-Valverde A, Lobo JM (2007) Determinants of local spider (Araneidae and Thomisidae) speciesrichness on a regional scale: climate and altitude vs. habitat structure. Ecol Entomol 32:113–122
Kaufman L, Rousseeuw PJ (1990) Finding groups in data: an introduction to cluster analysis. John Wileyand Sons, Inc., Hoboken
Kelley LA, Gardner SP, Sutcliffe MJ (1996) An automated approach for clustering an ensemble of NMR-derived protein structures into conformationally-related subfamilies. Protein Eng 9:1063–1065
Legendre P, Legendre L (1998) Numerical ecology. Elsevier, AmsterdamLomba A, Alves P, Honrado J (2008) Endemic sand dune vegetation of the Northwest Iberian Peninsula:
diversity, dynamics, and significance for bioindication and monitoring of coastal landscapes. J CoastRes 24:113–121
Longino JT, Coddington J, Colwell RK (2002) The ant fauna of a tropical rain forest: estimating speciesrichness three different ways. Ecology 83:689–702
Maechler M (2010) cluster: cluster analysis extended. In: Rousseeuw et al. R package version 1.13-1.http://cran.r-project.org. Accessed 1 July 2010
Maltez-Mouro S, Maestre FT, Freitas H (2010) Co-occurrence patterns and abiotic stress in sand-dunecommunities: their relationship varies with spatial scale and the stress estimator. Acta Oecol 36:80–84
Marc P, Canard A, Ysnel F (1999) Spiders (Araneae) useful for pest limitation and bioindication. AgricEcosyst Environ 74:229–273
Martın J, Gurrea P (1990) The peninsular effect in Iberian butterflies (Lepidoptera, Papilionoidea andHesperioidea). J Biogeogr 17:85–96
Meulen F, Salman AHPM (1996) Management of Mediterranean coastal dunes. Ocean Coast Manag30:177–195
Myers N, Mittermeier RA, Mittermeier CG, Fonseca GAB, Kent J (2000) Biodiversity hotspots for con-servation priorities. Nature 403:853–858
Nekola JC, White PS (1999) Distance decay of similarity in biogeography and ecology. J Biogeogr26:867–878
Oksanen J, Blanchet FG, Kindt R, Legendre P, O’Hara RB, Simpson GL, Solymos P, Stevens MHH,Wagner H (2010) vegan: community ecology package. R package version 1.17-3. http://cran.r-project.org. Accessed 1 July 2010
Platnick NI (2010) The world spider catalog, version 11.0. American Museum of Natural History.http://research.amnh.org/entomology/spiders/catalog/index.html. Accessed 1 July 2010
R Development Core Team (2009) R: a language and environment for statistical computing. R Foundationfor Statistical Computing, Vienna, Austria. ISBN 3-900051-07-0. http://www.r-project.org. Accessed 1July 2010
Rivas-Martınez S, Penas A, Dıaz TE (2004a) Biogeographic map of Europe. Cartographic Service.University of Leon, Leon
Rivas-Martınez S, Penas A, Dıaz TE (2004b) Bioclimatic map of Europe, thermoclimatic belts. Carto-graphic Service. University of Leon, Spain
Roberts DW (2010) labdsv: ordination and multivariate analysis for ecology. R package version 1.4-1.http://cran.r-project.org. Accessed 1 July 2010
Rodrıguez-Girones MA, Santamarıa L (2006) A new algorithm to calculate the nestedness temperature ofpresence-absence matrices. J Biogeogr 33:924–935
Romo H, Garcıa-Barros E (2010) Biogeographic regions of the Iberian Peninsula: butterflies as biogeo-graphical indicators. J Zool 282:180–190
Scharff N, Coddington JA, Griswold CE, Hormiga G, Bjørn PP (2003) When to quit? Estimating spiderspecies richness in a Northern European deciduous forest. J Arachnol 31:246–273
Simpson GG (1964) Species density of North American recent mammals. Syst Zool 12:57–73Stefanescu C, Herrando S, Paramo F (2004) Butterfly species richness in the north-west Mediterranean
Basin: the role of natural and human-induced factors. J Biogeogr 31:905–915Stone L, Roberts A (1990) The checkerboard score and species distributions. Oecologia 85:74–79
Biodivers Conserv (2011) 20:873–894 893
123

Tellerıa JL, Santos T (1993) Distributional pattern of insectivorous passerines in the Iberian forests: doesabundance decrease near the border? J Biogeogr 20:235–240
Ulrich W, Almeida-Neto M, Gotelli NJ (2009) A consumer’s guide to nestedness analysis. Oikos 118:3–17White D (2009) maptree: mapping, pruning, and graphing tree models. R package version 1.4-6.
http://cran.r-project.org. Accessed 1 July 2010Whittaker RJ, Araujo MA, Jepson P, Ladle RJ, Watson JEM, Willis KJ (2005) Conservation biogeography:
assessment and prospect. Divers Distrib 11:3–23Willig MR, Kauffman DM, Stevens RD (2003) Latitudinal gradients of biodiversity, pattern, process, scale
and synthesis. Ann Rev Ecol Syst 34:273–309Wise DH (1993) Spiders in ecological webs. Cambridge University Press, New York
894 Biodivers Conserv (2011) 20:873–894
123
Copyright © 2022 FDOKUMEN