Suitability for drinking, agriculture and fluoride exposure risk
PNNL-16885
Development of a Habitat Suitability Index Model for the Sage Sparrow on the Hanford Site C. A. Duberstein M. A. Simmons M. R. Sackschewsky J. M. Becker January 2008 Prepared for the U.S. Department of Energy under Contract DE-AC05-76RL01830
PNNL-16885
Development of a Habitat Suitability Index Model for the Sage Sparrow on the Hanford Site C. A. Duberstein M. A. Simmons M. R. Sackschewsky J. M. Becker January 2008 Prepared for the U.S. Department of Energy under Contract DE-AC05-76RL01830 Pacific Northwest National Laboratory Richland, Washington 99352
Executive Summary
The current mitigation thresholds for the Hanford Site are based on habitat requirements of the sage sparrow (Amphispiza belli) and only apply to areas with a mature big sagebrush (Artemisia tridentata) overstory and a native understory. These sage sparrow habitat requirements are based on literature values not specific to the Hanford Site. To refine these guidelines for the Site, a multi-year study to quantify habitat characteristics of sage sparrow territories on the Hanford Site was undertaken by Pacific North-west National Laboratory for the U.S. Department of Energy. These characteristics were then used to develop a habitat suitability index (HSI) model that can be used to estimate the value of specific locations on the Site.
Thirty-seven sage sparrow territories were mapped and habitat features including the percent cover of all shrub species, perennial grasses and forbs, and annual grasses and forbs were measured. Big sagebrush height was also measured, as was the amount of bare ground and litter. Additional habitat features measured included stand age based on the burn history and the patchiness of shrub cover surrounding the territory. These later two features were measured on a landscape scale rather than a territory scale. A principal component analysis was conducted to identify the subset of variables that best described the habitat features of the territories. These variables—big sagebrush canopy cover, annual grass and forb canopy cover, stand age and shrub patchiness—were used to develop the HSI model. The model was tested by collecting additional data on sage sparrow density and associated habitat features. The model was fine-tuned by replacing sagebrush cover with the combined cover of sagebrush and bitterbrush (Purshia tridentata).
The data and model revealed sage sparrow occupancy is associated with a broad range of big sagebrush cover and understory characteristics. Smaller territories were associated with higher, more continuous sagebrush/bitterbrush cover and fewer weedy, annual species in the understory. Larger territories were found in areas with patchy or sparse shrub cover and higher cover of weedy species in the understory. Only one-third of the sage sparrow territories were in areas that would currently require mitigation, that is, mature big sagebrush habitat with a native understory. The results indicate the current mitigation standards may not be protective of sage sparrows on the Hanford Site. The sage sparrow HSI model can be used to estimate habitat quality in areas that are proposed to be disturbed by site develop-ment or remediation activities. The model will be applied to determine if compensatory mitigation would be required of a proposed project, and if mitigation is needed, how much habitat replacement or other mitigative actions would be appropriate.
iii

Contents
Executive Summary ........................................................................................................................... iii 1.0 Introduction................................................................................................................................ 1 2.0 Methods...................................................................................................................................... 2 2.1 Sage Sparrow Territory Mapping and Measurement .......................................................... 2 2.2 Statistical Analyses and Model Development..................................................................... 5 2.3 Sage Sparrow Density Surveys ........................................................................................... 5 3.0 Results ........................................................................................................................................ 6 3.1 HSI Model Development .................................................................................................... 9 3.2 Density Estimates and Model Application.......................................................................... 12 4.0 Discussion .................................................................................................................................. 13 5.0 Conclusions................................................................................................................................ 15 6.0 References .................................................................................................................................. 15
Figures
2.1 Map of the Hanford Site Showing Location of Central Hanford and the Hanford Reach National Monument ........................................................................................................ 3 2.2 Example of Sage Sparrow Territory Mapping and Vegetation Sampling Methodology ........... 3 2.3 Landscape-Level Shrub Patchiness as Defined by the Onscreen Digitization of Both Color and Texture from Low-Level Aerial Photography.................................................. 4 3.1 Location of 37 Sage Sparrow Territories on Central Hanford in 2003 and 2004 ...................... 7 3.2 Sage Sparrow Territory Size Distribution for 2003 and 2004 on Central Hanford.................... 7 3.3 Shrub Canopy Cover Distribution in 37 Sage Sparrow Territories on Central Hanford............ 8 3.4 Shrub Patchiness Associated with 37 Sage Sparrow Territories on Central Hanford in 2003 and 2004........................................................................................................................ 9 3.5 Habitat Suitability Index and Sage Sparrow Territory Size for the Hanford Site in 2003 and 2004........................................................................................................................ 11 3.6 Relationship Between Sage Sparrow Densities and Habitat Suitability Index Values Using Equation (3.1) .................................................................................................................. 12 3.7 Relationship Between Sage Sparrow Densities and Habitat Suitability Index Values Using Equation (3.2) .................................................................................................................. 13
Tables
3.1 Statistics for Habitat Variables Measured on 37 Sage Sparrow Territories on Central Hanford in 2003 and 2004............................................................................................. 8 3.2 Factor Coordinates of Variables Based on Correlations from the Principal Component Analysis...................................................................................................................................... 10 3.3 Index Values Assigned to Four Variables Determined to be Related to Sage Sparrow Occurrence in Central Hanford .................................................................................................. 11
v
1.0 Introduction
The Hanford Site in southeastern Washington State, managed by the U.S. Department of Energy (DOE), occupies one of the last large remnants of late-successional shrub-steppe habitat in the Columbia Basin ecoregion. Sagebrush-steppe is classified as a priority habitat by the Washington Department of Fish and Wildlife (WDFW) and as a high-value resource by the Hanford Site Biological Resources Management Plan (BRMaP) (DOE 2001). As a high-value resource, damage to sagebrush-steppe habitat requires mitigation under the current DOE Hanford Site guidelines as described in BRMaP and in the Biological Resources Mitigation Strategy (BRMiS) (DOE 2003). However, like all habitat types, sagebrush-steppe exists as a mosaic of shrub types, sizes, and canopy cover overlaying an array of understory herbaceous plants. Therefore, although it may be easy to distinguish high-quality stands as deserving mitigation and degraded stands as not requiring mitigation, the threshold between high- and low-quality stands is not always apparent.
At present, the interim mitigation threshold guidelines as set forth in BRMiS (DOE 2003) state that “guidelines were developed based on the estimated minimum home range size of one potential evaluation species (sage sparrow) and current Hanford Site disturbance and land-use patterns…”. This interim threshold applies only to areas with mature sagebrush-steppe habitat that has at least 10% cover of a climax shrub species such as big sagebrush (Artemisia tridentata) or bitterbrush (Purshia tridentata), an average shrub height of 0.5 m, and a native species understory.
The BRMiS (DOE 2003) describes a process to improve upon these interim guidelines by estimating the value of a particular site based on characteristics of the site and their relative value to a representative wildlife species. BRMiS proposed to measure habitat value using the concepts of habitat suitability index (HSI) models, which are commonly used to associate habitat characteristics with species usage. These models derive a relationship between species presence or abundance and habitat measures for such elements as canopy cover for trees, shrubs, grasses, forbs, and canopy height. Recently, HSI models have incorporated large-scale habitat features employing spatial data and modeling using Geographical Information Systems (GIS) software (Rotenberry et al. 2006). These models are based on a combination of statistical analysis and observational knowledge. The development of these models, whether based on local or landscape features, involves an iterative component, with models being tested and adjusted as new data are added.
However, HSI models had not been developed for species that occur on the Hanford Site that would be good indicators of quality sagebrush-steppe habitat applicable to the Hanford Site. Therefore, we developed a Hanford Site-specific HSI model for the sage sparrow (Amphispiza belli) based on the vegetation characteristics of territories found on the central portion of the Hanford Site.
The sage sparrow is a Washington State candidate species (WDFW 2005). Its distribution coincides with the distribution of sagebrush (Vander Haegen 2004), and they are often referred to as a sagebrush-obligate species. Although there is no dietary link to sagebrush, sage sparrows prefer to nest within or occasionally on the ground beneath sagebrush (Petersen and Best 1985; Fitzner 2000; Misenhelter and Rotenberry 2000). At Hanford, sage sparrows begin to arrive on the site in late February/early March and appear to leave the site in late summer. Nesting occurs from late March through June, with pairs producing from one to two broods per year (Fitzner 2000).
1

The objective of the study was to develop a HSI model for the sage sparrow that can be used to help estimate habitat value at specific locations where Hanford Site activities are proposed. The model could be used to identify whether a particular site contains habitat that requires mitigation and could also help to identify the type of mitigation and how much would be required. Additionally, the model could be useful at sites where habitat improvement or restoration is proposed, both to determine if a site is a good candidate for improvement and for measuring progress over time.
2.0 Methods
The sage sparrow HSI was developed in three phases. During the initial phase, sage sparrow territories were located, mapped, and the vegetation cover was characterized. In the second phase, the data were analyzed, and the results were used to construct a HSI model. The final phase involved collecting additional data on sage sparrow densities and corresponding vegetation cover to test and fine-tune the model.
2.1 Sage Sparrow Territory Mapping and Measurement
Surveys to locate and map sage sparrow nesting territories were conducted on Central Hanford in 2003 and 2004 (Figure 2.1). The search for sage sparrow territories was based on known habitat preferences and directed using vegetation cover type maps of the site. Sage sparrows on the Hanford Site are known to occupy habitats with an overstory dominated by one of three shrub species: big sagebrush, bitterbrush or spiny hopsage (Grayia spinosa) (Fitzner and Gray 1991). Using this information, areas containing vegetation cover types with an overstory dominated by one or more of these shrub species were identified on GIS maps from previous Hanford Site vegetation mapping (DOE 2001). The size of the areas containing each vegetation cover type was determined, and based on the size, three or more 500-m line transects were randomly assigned to each vegetation cover type. The direction of each transect was based on a random azimuth (Bibby et al. 1992). Where the random azimuth extended the transect outside the vegetation cover type being surveyed, a new direction was established at 90º, 180º, or 270º until a 500-m transect was contained within the community of interest.
To locate sage sparrow territories, an observer walked along the transect line and listened for singing male sage sparrows. If a sage sparrow was detected, the observer immediately discontinued the transect survey and began mapping the territory. Each transect was surveyed up to three times with at least 10 days between surveys, and areas were considered unoccupied if sage sparrows were not detected during any of the three walking surveys.
Territory mapping was accomplished by following the singing bird continually for one hour (Misenhelter and Rotenberry 2000). The initial and subsequent singing locations were recorded with a global positioning system. Sage sparrow behavior was closely monitored, and observers moved away when individuals vocalized warning calls. Using the coordinate data, a sage sparrow breeding territory was calculated as the maximum convex polygon (a polygon where all interior angles are <180°) determined by the singing perches (minimum of 10) that an individual male used during one hour of monitoring (Figure 2.2).
2

Figure 2.1. Map of the Hanford Site Showing Location of Central Hanford (light shading) and the Hanford Reach National Monument (dark shading)
Figure 2.2. Example of Sage Sparrow Territory Mapping and Vegetation Sampling Methodology. Overstory vegetation attributes were measured within the 10-m X 10-m plots while understory habitat attributes were measured along the transects within each 10-m X 10-m plot.
3

Vegetation characteristics were measured in randomly placed 10-m X 10-m plots within each territory. The number of plots per territory varied depending on territory size, with a minimum of three plots per territory (Figure 2.2). All shrubs >0.2 m high with any portion of the canopy within the plot were measured. Measured shrub characteristics included: species, whether the shrub was rooted inside or outside the plot, maximum height, maximum diameter, perpendicular diameter to the maximum, and a visual estimate of the percentage of the canopy that was dead. All characteristics were recorded only for the portion of the shrub canopy within the plot. The two shrub canopy diameters were used to calculate individual shrub canopy cover using an oval to approximate the shape.
The percent canopy cover for understory plants in each plot was visually estimated using 15 quadrats (20 X 50 cm). These were placed systematically along three transects oriented east-west across the plot at distances of 3 m, 6 m, and 9 m north of the southern boundary (Figure 2.2). The average percent canopy cover was determined for annual grasses, small perennial bunchgrasses, large perennial bunchgrasses, annual forbs, perennial forbs, litter, and bare ground.
Two landscape-scale attributes were used in the analysis: a measure of shrub patchiness and a classification of stand age based on the fire history. Shrub patchiness was based on the number and size of shrub patches in and near each territory (Figure 2.3). To develop a GIS data layer representing patchiness, a 1-km buffer was created around the geometric center of each territory. Shrub patches within the buffer area identified in low-level aerial photography viewed at a 1:3000 scale were digitized. A
Figure 2.3. Landscape-Level Shrub Patchiness as Defined by the Onscreen Digitization of Both Color and Texture from Low-Level Aerial Photography
4
patch was separated from another patch by a distance of at least 20 m without visible shrubs. Patchiness was then calculated as the ratio of the sum of patch perimeters to the sum of the patch areas within each 1-km circle. The second landscape-scale attribute of stand age was determined using maps showing the fire history of the site from 1974 to 2000. Territories were then assigned a stand age based on when the area last burned.
2.2 Statistical Analyses and Model Development
For each territory, the mean and standard deviation were calculated for every measured habitat component including shrub cover by species, shrub height, annual grass cover, annual forb cover, large perennial bunchgrass cover, small perennial grass cover, perennial forb cover, litter, and bare ground. Also included were the two landscape variables: stand age and shrub patchiness at the 1-km scale. All variables were standardized before analysis by subtracting the overall mean from each territory value and dividing by the overall standard deviation (Gotelli and Ellison 2004).
A principal component analysis (PCA) was used to examine the habitat data for relationships among the suite of variables. PCA is used with multivariate data sets to reduce the number of variables by creating new, uncorrelated variables, or factors, which are combinations of the original variables. Within each factor, correlations are used to indicate the contribution from each variable to that factor. The factors are ordered by the amount of variation they account for in a multivariate data set, with the first two to three factors generally accounting for most of the variation in the data. The analyses were conducted using Statistica 6.0.
From the original, large suite of variables, a subset of variables associated with the first two factors in the PCA analysis was chosen to develop the multiplicative habitat suitability model. Criteria for eliminating variables included redundancy (i.e., variables that occupied similar quadrants of the factor plane) and those that added little to the overall factor (i.e., coefficients of less than 0.6). The remaining variables were used to construct the HSI model. Coefficients for the model were based on the data collected for this study and expert opinion.
2.3 Sage Sparrow Density Surveys
To evaluate the HSI model, sage sparrow densities and associated habitat characteristics were quantified at 26 additional sites on Central Hanford in 2005. These sites were stratified to represent different levels of the variables used in the HSI model (i.e., sagebrush canopy cover, stand age, understory composition, and patchiness) and were more than 500 m away from any of the previously mapped sage sparrow territories. Sage sparrow densities were estimated using point counts at randomly selected locations within each of the previously identified vegetation cover types. Two 10-minute counts were conducted at least 30 days apart at each location during the spring breeding season (March 15–June 15).
Density estimates depend on estimating the detectability of individual birds. It is well established that the detectability of an individual bird decreases as distance from an observer increases (Bibby et al. 1992; Buckland 1987; Burnham et al. 1980; Emlen 1971). This relationship is influenced by the conspicuous-ness of the target species in a given habitat as well as its aversion to human presence. Although detectability can be estimated as a function of distance by plotting a detection curve based on field survey data, due to the limited number of observations, we chose to model density at each point using Ramsey
5
and Scott’s (1979) continuous half-normal model. Although values derived from this model may not represent an absolute density, they provide a measure of relative density adequate for comparison purposes. Distance and azimuth were recorded with a laser rangefinder and compass for all sage sparrows observed singing. Territorial (singing) male sage sparrow density was modeled at each point using the continuous half-normal model (Ramsey and Scott 1979):
∑ ==
n
i i mnnD r1
2 /)/( π (2.1)
where n = total number of singing males at a point ri = distance from the observer to the ith detected animal, i=1…, n. m = number of counts at a point.
Overstory and understory vegetation characteristics were measured using methods similar to those used previously except four plots were located around each point count location in each of the four cardinal directions at incremental distances. Sampling plots were moved if necessary to ensure that all plots were located in vegetated areas of the territory (e.g., plots were moved to avoid sampling dirt roads or other human-made disturbances). Stand age and shrub patchiness attributes also were calculated for the 26 locations using the methods described in Section 2.1.
3.0 Results
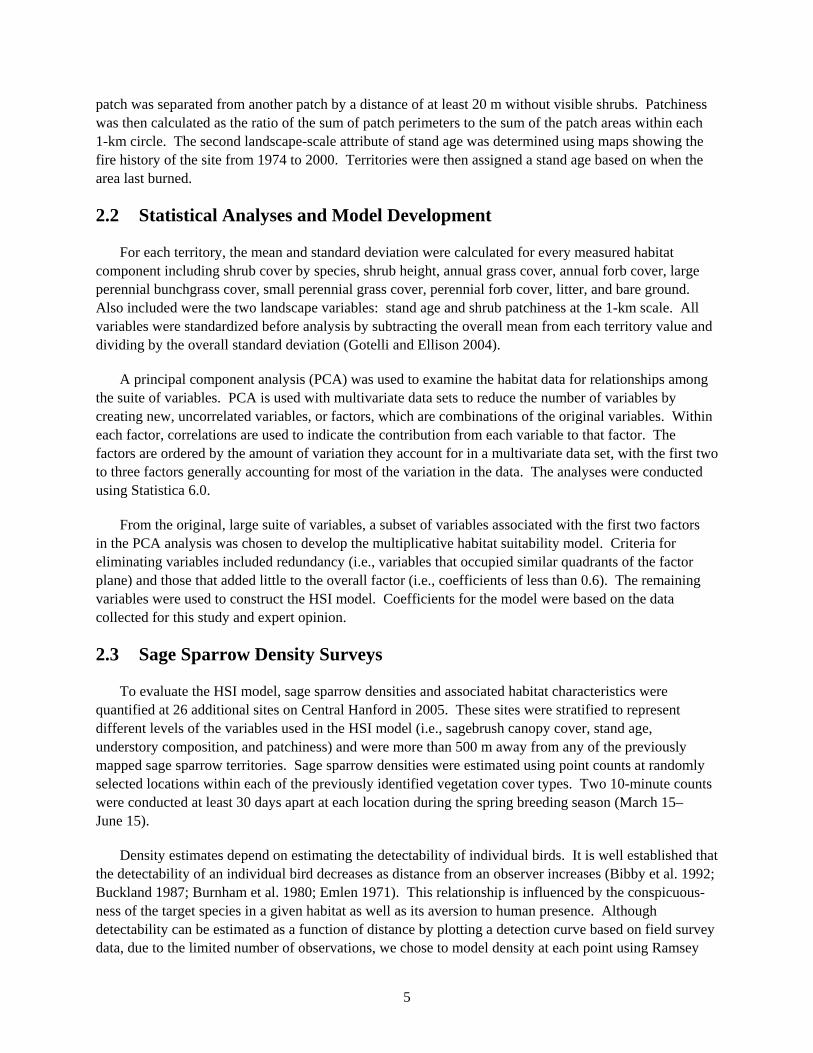
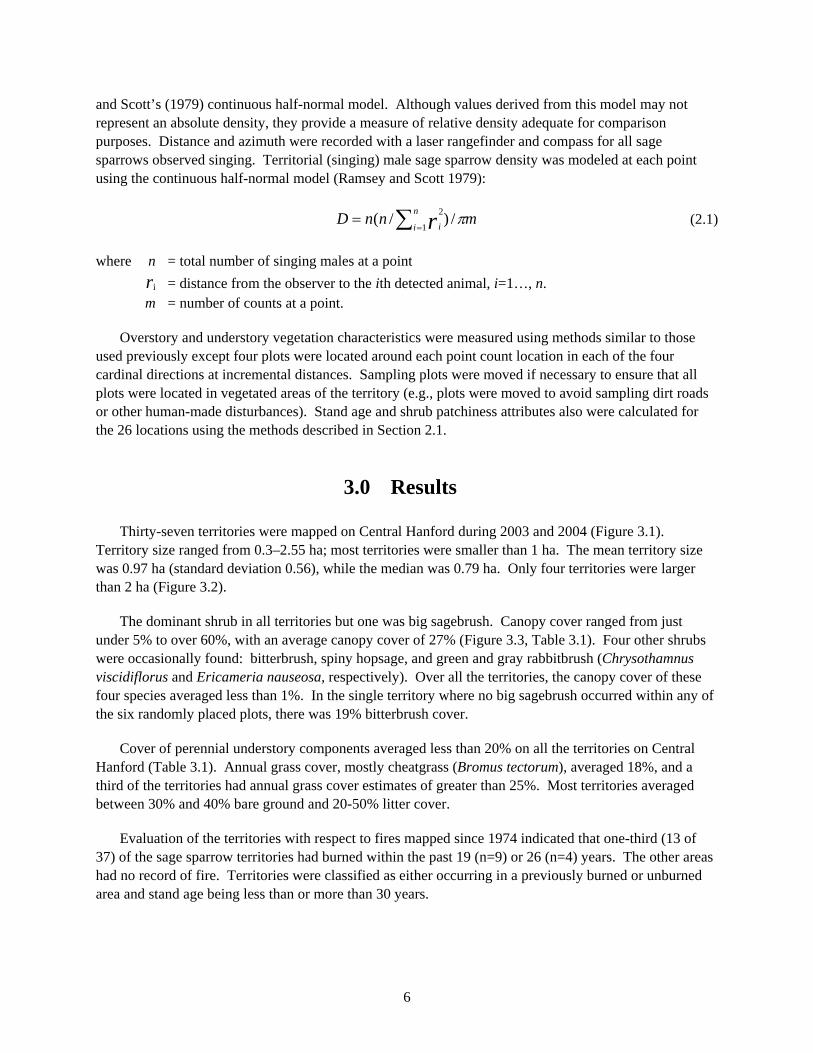
Thirty-seven territories were mapped on Central Hanford during 2003 and 2004 (Figure 3.1). Territory size ranged from 0.3–2.55 ha; most territories were smaller than 1 ha. The mean territory size was 0.97 ha (standard deviation 0.56), while the median was 0.79 ha. Only four territories were larger than 2 ha (Figure 3.2).
The dominant shrub in all territories but one was big sagebrush. Canopy cover ranged from just under 5% to over 60%, with an average canopy cover of 27% (Figure 3.3, Table 3.1). Four other shrubs were occasionally found: bitterbrush, spiny hopsage, and green and gray rabbitbrush (Chrysothamnus viscidiflorus and Ericameria nauseosa, respectively). Over all the territories, the canopy cover of these four species averaged less than 1%. In the single territory where no big sagebrush occurred within any of the six randomly placed plots, there was 19% bitterbrush cover.
Cover of perennial understory components averaged less than 20% on all the territories on Central Hanford (Table 3.1). Annual grass cover, mostly cheatgrass (Bromus tectorum), averaged 18%, and a third of the territories had annual grass cover estimates of greater than 25%. Most territories averaged between 30% and 40% bare ground and 20-50% litter cover.
Evaluation of the territories with respect to fires mapped since 1974 indicated that one-third (13 of 37) of the sage sparrow territories had burned within the past 19 (n=9) or 26 (n=4) years. The other areas had no record of fire. Territories were classified as either occurring in a previously burned or unburned area and stand age being less than or more than 30 years.
6
Figure 3.1. Location of 37 Sage Sparrow Territories on Central Hanford in 2003 and 2004
0.0 0.2 0.4 0.6 0.8 1.0 1.2 1.4 1.6 1.8 2.0 2.2 2.4 2.8Territory Size (ha)
0
2
4
6
8
10
12
Num
ber o
f Ter
ritor
ies
Figure 3.2. Sage Sparrow Territory Size Distribution for 2003 and 2004 on Central Hanford
7

0 5 10 15 20 25 30 35 40 45 50 55 60Percent Cover Big Sagebrush and Bitterbrush
0
1
2
3
4
5
6
7
Num
ber o
f Ter
ritor
ies
Figure 3.3. Shrub Canopy Cover Distribution in 37 Sage Sparrow Territories on Central Hanford
Table 3.1. Statistics for Habitat Variables Measured on 37 Sage Sparrow Territories on Central Hanford in 2003 and 2004
Units Habitat Variable Mean Standard Deviation Median Minimum Maximum
Big sagebrush 27.3 17.4 26.1 0.0 62.1 Bitterbrush 0.7 2.0 0.0 0.0 8.9 Spiny hopsage 0.9 2.6 0.0 0.0 11.3 Green rabbitbrush 0.4 0.9 0.0 0.0 4.4 Gray rabbitbrush 0.9 2.3 0.0 0.0 11.1 Perennial forb 4.5 5.2 1.9 0.0 19.6 Large perennial bunchgrass 1.8 3.1 0.3 0.0 11.1 Small perennial bunchgrass 7.0 5.2 5.6 0.1 20.3 Annual forb 6.1 4.1 5.4 0.1 17.0 Annual grass 17.9 12.1 14.1 3.2 47.3 Bare ground 32.8 9.6 34.3 13.2 57.3
% Canopy Cover
Litter 37.0 13.1 36.1 17.1 69.6 Sagebrush 9.8 1.6 9.8 6.6 13.0 Bitterbrush 8.9 2.8 9.3 3.5 13.0 Spiny hopsage 8.0 1.7 7.2 6.5 11.5 Green rabbitbrush 5.7 1.3 5.5 3.9 8.6
Height (dm)
Gray rabbitbrush 5.9 1.6 5.6 3.5 8.5
8
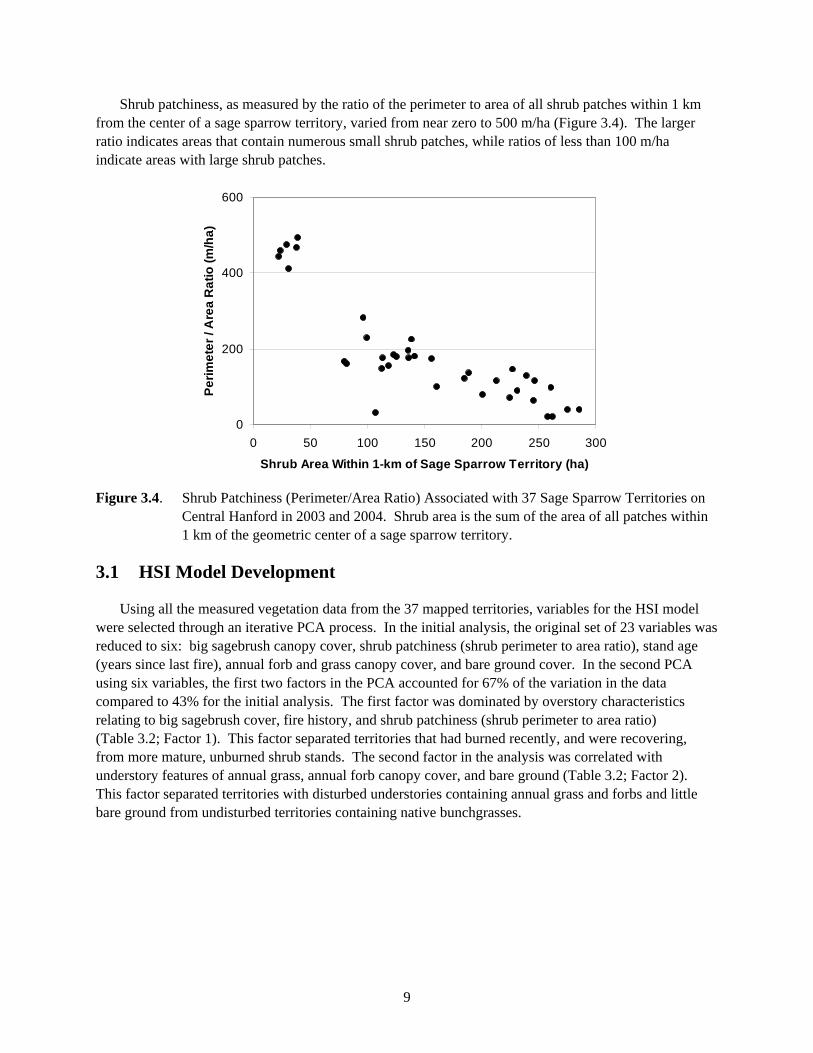
Shrub patchiness, as measured by the ratio of the perimeter to area of all shrub patches within 1 km from the center of a sage sparrow territory, varied from near zero to 500 m/ha (Figure 3.4). The larger ratio indicates areas that contain numerous small shrub patches, while ratios of less than 100 m/ha indicate areas with large shrub patches.
0
200
400
600
0 50 100 150 200 250 300
Shrub Area Within 1-km of Sage Sparrow Territory (ha)
Perim
eter
/ A
rea
Rat
io (m
/ha)
Figure 3.4. Shrub Patchiness (Perimeter/Area Ratio) Associated with 37 Sage Sparrow Territories on Central Hanford in 2003 and 2004. Shrub area is the sum of the area of all patches within 1 km of the geometric center of a sage sparrow territory.
3.1 HSI Model Development
Using all the measured vegetation data from the 37 mapped territories, variables for the HSI model were selected through an iterative PCA process. In the initial analysis, the original set of 23 variables was reduced to six: big sagebrush canopy cover, shrub patchiness (shrub perimeter to area ratio), stand age (years since last fire), annual forb and grass canopy cover, and bare ground cover. In the second PCA using six variables, the first two factors in the PCA accounted for 67% of the variation in the data compared to 43% for the initial analysis. The first factor was dominated by overstory characteristics relating to big sagebrush cover, fire history, and shrub patchiness (shrub perimeter to area ratio) (Table 3.2; Factor 1). This factor separated territories that had burned recently, and were recovering, from more mature, unburned shrub stands. The second factor in the analysis was correlated with understory features of annual grass, annual forb canopy cover, and bare ground (Table 3.2; Factor 2). This factor separated territories with disturbed understories containing annual grass and forbs and little bare ground from undisturbed territories containing native bunchgrasses.
9
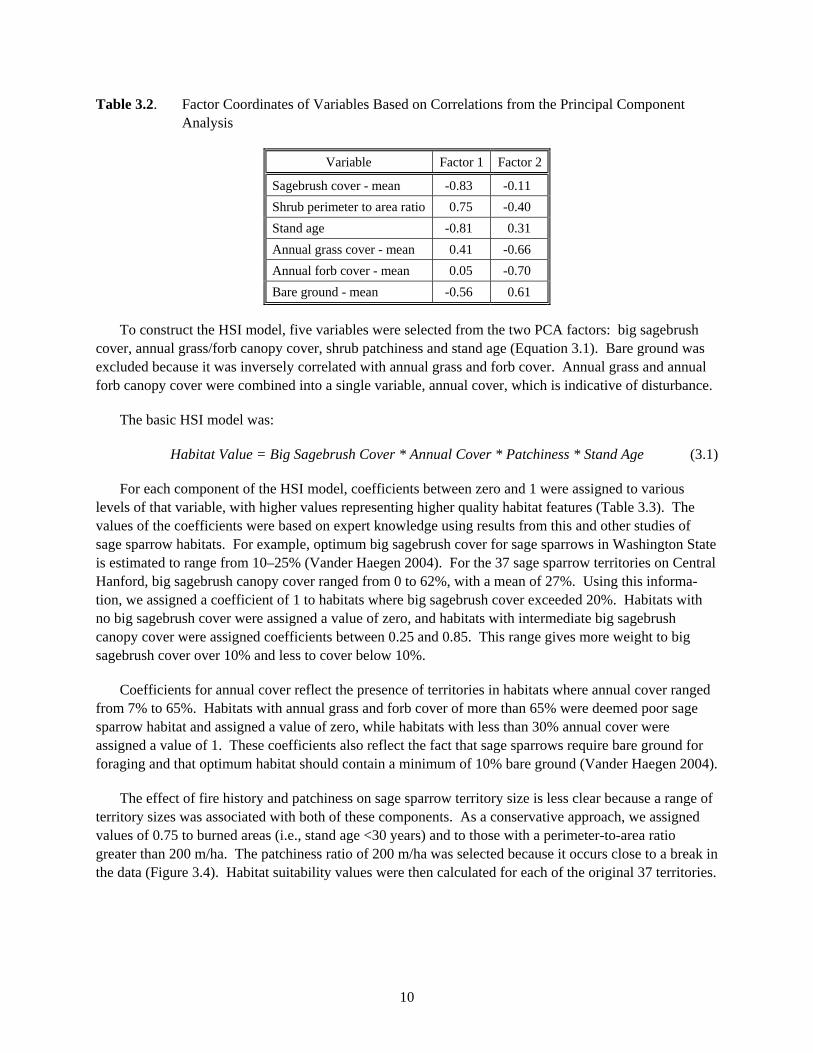
Table 3.2. Factor Coordinates of Variables Based on Correlations from the Principal Component Analysis
Variable Factor 1 Factor 2
Sagebrush cover - mean -0.83 -0.11 Shrub perimeter to area ratio 0.75 -0.40 Stand age -0.81 0.31 Annual grass cover - mean 0.41 -0.66 Annual forb cover - mean 0.05 -0.70 Bare ground - mean -0.56 0.61
To construct the HSI model, five variables were selected from the two PCA factors: big sagebrush cover, annual grass/forb canopy cover, shrub patchiness and stand age (Equation 3.1). Bare ground was excluded because it was inversely correlated with annual grass and forb cover. Annual grass and annual forb canopy cover were combined into a single variable, annual cover, which is indicative of disturbance.
The basic HSI model was:
Habitat Value = Big Sagebrush Cover * Annual Cover * Patchiness * Stand Age (3.1)
For each component of the HSI model, coefficients between zero and 1 were assigned to various levels of that variable, with higher values representing higher quality habitat features (Table 3.3). The values of the coefficients were based on expert knowledge using results from this and other studies of sage sparrow habitats. For example, optimum big sagebrush cover for sage sparrows in Washington State is estimated to range from 10–25% (Vander Haegen 2004). For the 37 sage sparrow territories on Central Hanford, big sagebrush canopy cover ranged from 0 to 62%, with a mean of 27%. Using this informa-tion, we assigned a coefficient of 1 to habitats where big sagebrush cover exceeded 20%. Habitats with no big sagebrush cover were assigned a value of zero, and habitats with intermediate big sagebrush canopy cover were assigned coefficients between 0.25 and 0.85. This range gives more weight to big sagebrush cover over 10% and less to cover below 10%.
Coefficients for annual cover reflect the presence of territories in habitats where annual cover ranged from 7% to 65%. Habitats with annual grass and forb cover of more than 65% were deemed poor sage sparrow habitat and assigned a value of zero, while habitats with less than 30% annual cover were assigned a value of 1. These coefficients also reflect the fact that sage sparrows require bare ground for foraging and that optimum habitat should contain a minimum of 10% bare ground (Vander Haegen 2004).
The effect of fire history and patchiness on sage sparrow territory size is less clear because a range of territory sizes was associated with both of these components. As a conservative approach, we assigned values of 0.75 to burned areas (i.e., stand age <30 years) and to those with a perimeter-to-area ratio greater than 200 m/ha. The patchiness ratio of 200 m/ha was selected because it occurs close to a break in the data (Figure 3.4). Habitat suitability values were then calculated for each of the original 37 territories.
10
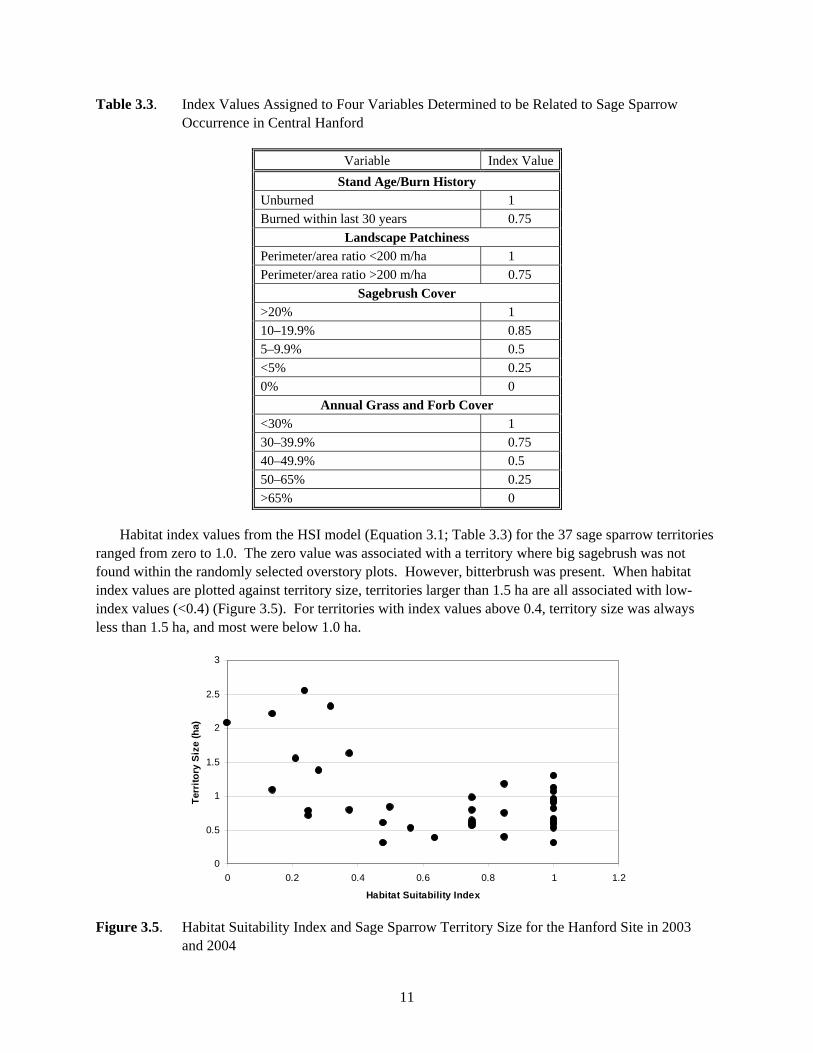
Table 3.3. Index Values Assigned to Four Variables Determined to be Related to Sage Sparrow Occurrence in Central Hanford
Variable Index ValueStand Age/Burn History
Unburned 1 Burned within last 30 years 0.75
Landscape Patchiness Perimeter/area ratio <200 m/ha 1 Perimeter/area ratio >200 m/ha 0.75
Sagebrush Cover >20% 1 10–19.9% 0.85 5–9.9% 0.5 <5% 0.25 0% 0
Annual Grass and Forb Cover <30% 1 30–39.9% 0.75 40–49.9% 0.5 50–65% 0.25 >65% 0
Habitat index values from the HSI model (Equation 3.1; Table 3.3) for the 37 sage sparrow territories ranged from zero to 1.0. The zero value was associated with a territory where big sagebrush was not found within the randomly selected overstory plots. However, bitterbrush was present. When habitat index values are plotted against territory size, territories larger than 1.5 ha are all associated with low-index values (<0.4) (Figure 3.5). For territories with index values above 0.4, territory size was always less than 1.5 ha, and most were below 1.0 ha.
0
0.5
1
1.5
2
2.5
3
0 0.2 0.4 0.6 0.8 1 1.2
Habitat Suitability Index
Terr
itory
Siz
e (h
a)
Figure 3.5. Habitat Suitability Index and Sage Sparrow Territory Size for the Hanford Site in 2003 and 2004
11
3.2 Density Estimates and Model Application
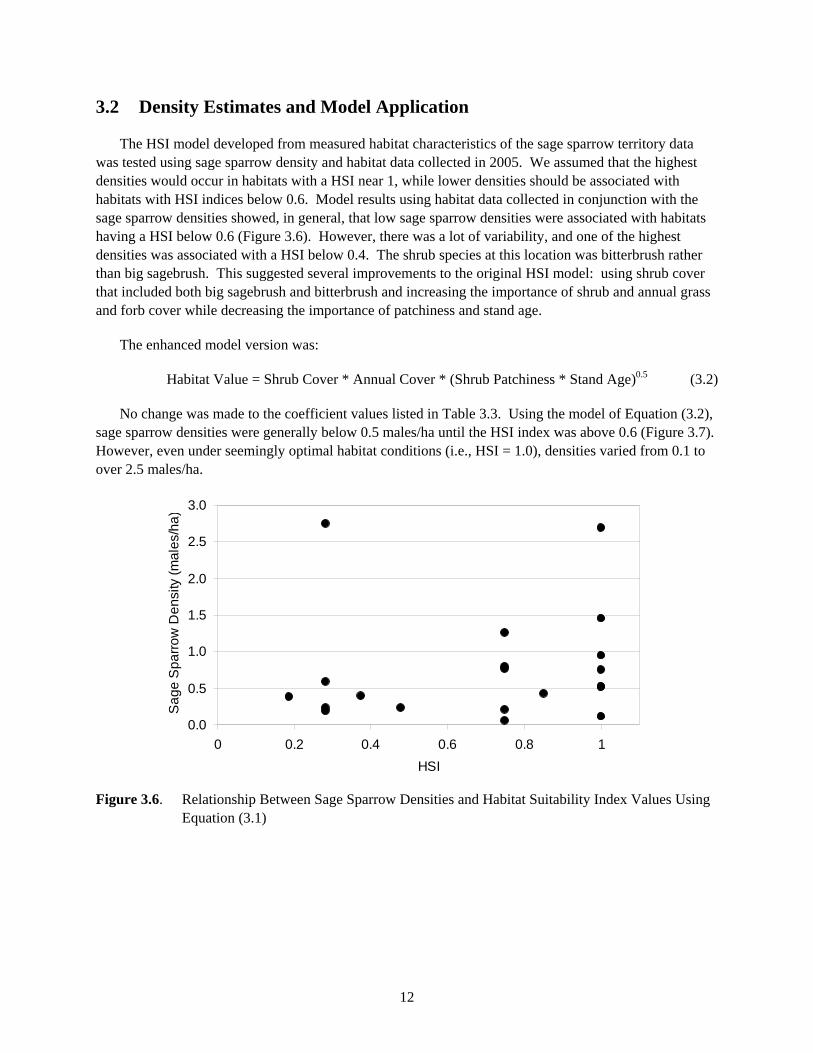
The HSI model developed from measured habitat characteristics of the sage sparrow territory data was tested using sage sparrow density and habitat data collected in 2005. We assumed that the highest densities would occur in habitats with a HSI near 1, while lower densities should be associated with habitats with HSI indices below 0.6. Model results using habitat data collected in conjunction with the sage sparrow densities showed, in general, that low sage sparrow densities were associated with habitats having a HSI below 0.6 (Figure 3.6). However, there was a lot of variability, and one of the highest densities was associated with a HSI below 0.4. The shrub species at this location was bitterbrush rather than big sagebrush. This suggested several improvements to the original HSI model: using shrub cover that included both big sagebrush and bitterbrush and increasing the importance of shrub and annual grass and forb cover while decreasing the importance of patchiness and stand age.
The enhanced model version was:
Habitat Value = Shrub Cover * Annual Cover * (Shrub Patchiness * Stand Age)0.5 (3.2)
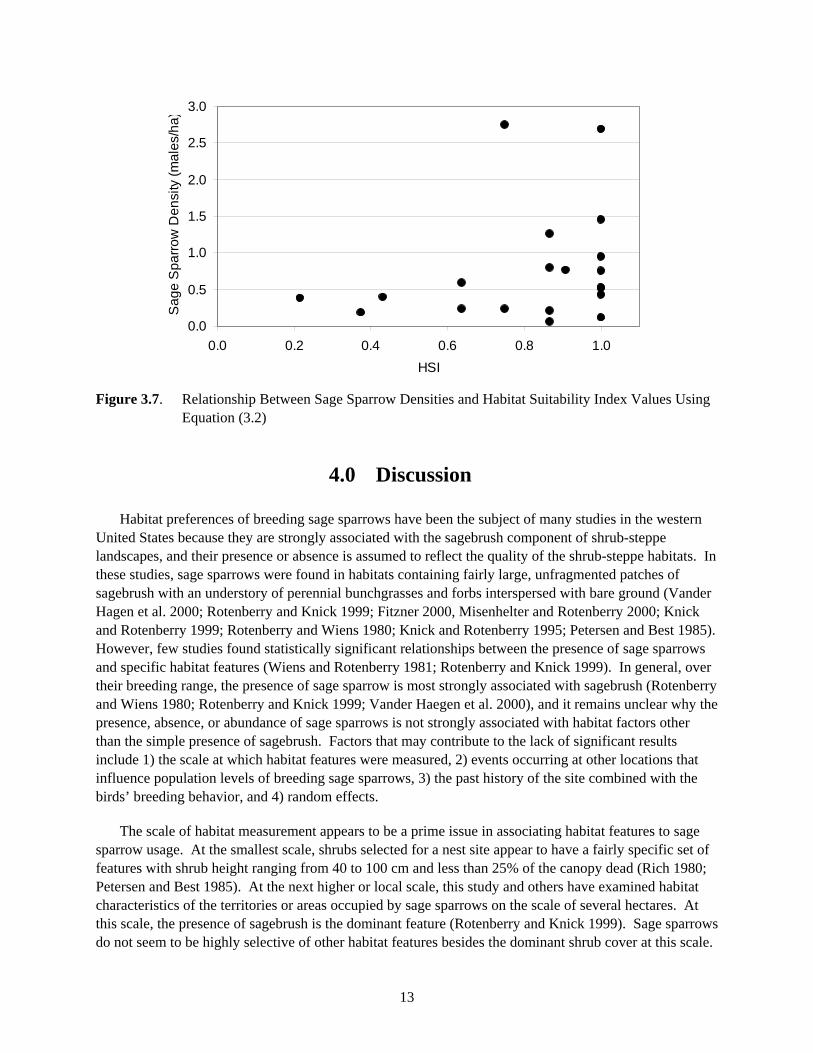
No change was made to the coefficient values listed in Table 3.3. Using the model of Equation (3.2), sage sparrow densities were generally below 0.5 males/ha until the HSI index was above 0.6 (Figure 3.7). However, even under seemingly optimal habitat conditions (i.e., HSI = 1.0), densities varied from 0.1 to over 2.5 males/ha.
0.0
0.5
1.0
1.5
2.0
2.5
3.0
0 0.2 0.4 0.6 0.8 1HSI
Sag
e S
parro
w D
ensi
ty (m
ales
/ha)
Figure 3.6. Relationship Between Sage Sparrow Densities and Habitat Suitability Index Values Using Equation (3.1)
12
0.0
0.5
1.0
1.5
2.0
2.5
3.0
0.0 0.2 0.4 0.6 0.8 1.0HSI
Sag
e S
parro
w D
ensi
ty (m
ales
/ha)
Figure 3.7. Relationship Between Sage Sparrow Densities and Habitat Suitability Index Values Using Equation (3.2)
4.0 Discussion
Habitat preferences of breeding sage sparrows have been the subject of many studies in the western United States because they are strongly associated with the sagebrush component of shrub-steppe landscapes, and their presence or absence is assumed to reflect the quality of the shrub-steppe habitats. In these studies, sage sparrows were found in habitats containing fairly large, unfragmented patches of sagebrush with an understory of perennial bunchgrasses and forbs interspersed with bare ground (Vander Hagen et al. 2000; Rotenberry and Knick 1999; Fitzner 2000, Misenhelter and Rotenberry 2000; Knick and Rotenberry 1999; Rotenberry and Wiens 1980; Knick and Rotenberry 1995; Petersen and Best 1985). However, few studies found statistically significant relationships between the presence of sage sparrows and specific habitat features (Wiens and Rotenberry 1981; Rotenberry and Knick 1999). In general, over their breeding range, the presence of sage sparrow is most strongly associated with sagebrush (Rotenberry and Wiens 1980; Rotenberry and Knick 1999; Vander Haegen et al. 2000), and it remains unclear why the presence, absence, or abundance of sage sparrows is not strongly associated with habitat factors other than the simple presence of sagebrush. Factors that may contribute to the lack of significant results include 1) the scale at which habitat features were measured, 2) events occurring at other locations that influence population levels of breeding sage sparrows, 3) the past history of the site combined with the birds’ breeding behavior, and 4) random effects.
The scale of habitat measurement appears to be a prime issue in associating habitat features to sage sparrow usage. At the smallest scale, shrubs selected for a nest site appear to have a fairly specific set of features with shrub height ranging from 40 to 100 cm and less than 25% of the canopy dead (Rich 1980; Petersen and Best 1985). At the next higher or local scale, this study and others have examined habitat characteristics of the territories or areas occupied by sage sparrows on the scale of several hectares. At this scale, the presence of sagebrush is the dominant feature (Rotenberry and Knick 1999). Sage sparrows do not seem to be highly selective of other habitat features besides the dominant shrub cover at this scale.
13
Finally, at the landscape scale, which exceeds 1 km, habitat features such as fragmentation or patchiness and configuration are important (Rotenberry and Knick 1999). Cunningham and Johnson (2006) found that the habitat association for many birds is a combination of local and landscape informa-tion. While the Hanford Site is classified as shrub-steppe, the central portion includes at least 15 common plant communities, four of which have big sagebrush as the dominant shrub species and three in which bitterbrush is dominant (Sackschewsky and Downs 2001). Within these communities, variability in soils, slope, and aspect create considerable heterogeneity within shrub-steppe habitats. Consequently, plant cover on the site is naturally variable and has been fragmented at multiple scales from historical human activity and rangeland fires.
Breeding philopatry may also contribute to the variability in habitat features found in sage sparrow territories. Birds have been known to return to the same site to nest even after habitat conditions deteriorate (Wiens and Rotenberry 1985). If no nesting sites are available the birds will move on, but as long as some minimum conditions exit, they will continue to use the location.
Another factor that may impact the association between sage sparrow presence and habitat char-acteristics is bird population levels. One of the assumptions of habitat suitability modeling is that optimally suitable habitats will be selected over less suitable habitats. However, philopatric behavior and the loss of individual sage sparrows during the non-nesting season may result in apparently prime nesting habitats remaining unoccupied. An additional effect would be an increase in the variability of habitat features of nesting territories as less optimal habitat continues to be occupied even though optimal habitats are available.
Our findings suggest that restricting mitigation standards to mature big sagebrush habitat with a purely native understory may not protect sage sparrow habitats on Central Hanford. The model and data show that sage sparrows inhabit areas considered to be marginal habitat by present standards, including areas with little shrub cover and areas with up to 65% cover of alien, annual understory species. Using our model, habitats of this nature that may be impacted by human activities can be assigned a value based on measured attributes of the site. The calculated habitat value can then be compared to other potential sites to determine project siting, or the value could be used to determine the type and amount of restoration necessary to mitigate impacts.
Applying the model on Central Hanford would likely allow some sites that were once considered below mitigation standards to now qualify for mitigation, as would areas that were once passed over as compensation or habitat improvement sites. However, to improve the area for sage sparrows, the habitat quality of sites with a HSI below 0.6 would need to be raised to 0.8 or above to provide opportunities for higher densities of sage sparrows. This could be accomplished by planting more big sagebrush near existing patches to increase shrub cover and decrease fragmentation. Habitat factors could be measured again after mitigation to quantify the progress attained by specific mitigation actions, and this information could be used to further refine future mitigation guidelines.
14

5.0 Conclusions
The sage sparrow HSI model will be used to estimate habitat quality in areas that are proposed to be disturbed by site development or remediation activities. The model will be applied to determine if compensatory mitigation would be required of a proposed project, and if mitigation is needed, how much habitat replacement or other mitigative actions would be appropriate. PNNL and DOE intend to begin application of the sage sparrow HSI model to current field situations on the Hanford Site. The mitigation recommendations resulting from the model application will be compared against the current BRMaP/ BRMiS guidance to help DOE understand how the change in habitat value measurement technique would affect DOE actions on the Hanford Site. The comparisons will be documented and used in determining appropriate modifications/additions to BRMaP/BRMiS during the next revision cycle.
The sage sparrow model appears to be useful for evaluating sites that can potentially support sage sparrows. However, this model, based only on the sagebrush-obligate sage sparrow, is not likely to adequately represent overall habitat value in areas without shrubs, even if the other components of the plant community indicate that the habitat is of high quality. Additional models may be needed to complement the sage sparrow model to fully quantify habitat value on the Hanford Site. Other wildlife species with complementary habitat requirements will be considered by DOE and PNNL, with input from resource trustees, to identify additional species for which HSI models might be developed and applied.
6.0 References
Bibby CJ, ND Burgess, and DA Hill. 1992. Bird Census Techniques. Academic Press Inc., San Diego, California.
Buckland ST. 1987. “On the Variable Circular Plot Method of Estimating Animal Density.” Biometrics 43:363–384.
Burnham KP, DR Anderson, and JL Laake. 1980. “Estimation of Density from Line Transect Sampling of Biological Populations.” Wildlife Mongraphs, no. 72.
Cunningham MA and DH Johnson. 2006. “Proximate and Landscape Factors Influence Grassland Bird Distributions.” Ecological Applications 16:1062–1075.
Daubenmire R. 1959. “A Canopy-Coverage Method of Vegetational Analysis.” Northwest Science 33:43–64.
Emlen JT. 1971. “Population Densities of Birds Derived from Transect Counts.” The Auk 88:323–342.
Fitzner LE. 2000. “Reproductive Ecology of the Sage Sparrow (Amphispiza belli) and its Relationship to the Characteristics of Native and Cheatgrass (Bromus tectorum) Dominated Habitats.” M.S. Thesis. Washington State University, Pullman, Washington. 69 pp.
15
Fitzner RE and RH Gray. 1991. “The Status, Distribution and Ecology of Wildlife on the U.S. DOE Hanford Site: A Historical Overview of Research Activities.” Environmental Monitoring and Assessment 18:173–202.
Gotelli NJ and AM Ellison. 2004. A Primer of Ecological Statistics. Sinauer Associates, Inc. Sunderland, Massachusetts.
Knick ST and JT Rotenberry. 1995. “Landscape Characteristics of Fragmented Shrubsteppe Habitats and Breeding Passerine Birds.” Conservation Biology 9:1059–1071.
Knick ST and JT Rotenberry. 1999. “Spatial Distribution of Breeding Passerine Bird Habitats in a Shrubsteppe Region of Southwestern Idaho.” Studies in Avian Biology 19:104–111.
Misenhelter MD and JT Rotenberry. 2000. “Choices and Consequences of Habitat Occupancy and Nest Site Selection in Sage Sparrows.” Ecology 81(10):2892–2901.
Petersen KL and LB Best. 1985. “Nest-Site Selection by Sage Sparrows.” The Condor 83:217–221.
Ramsey FL and JM Scott. 1979. “Estimating Population Densities from Variable Circular Plot Surveys” in Sampling Biological Populations, RM Cormack, GP Patil, and DS Robson (eds.), pp. 155–181. International Cooperative Publishing House, Fairland, Maryland.
Rich T. 1980. “Territorial Behavior of the Sage Sparrow: Spatial and Random Aspects.” The Wilson Bulletin 92(4):425–438.
Rotenberry JT and ST Knick. 1999. “Multiscale Habitat Associations of the Sage Sparrow: Implications for Conservation Biology.” Studies in Avian Biology 19:95–103.
Rotenberry JT and JA Wiens. 1980. “Habitat Structure, Patchiness, and Avian Communities in North American Steppe Vegetation: A Multivariate Analysis.” Ecology 61(5):1228–1250.
Rotenberry JT and JA Wiens. 1980. “Temporal Variation in Habitat Structure and Shrubsteppe Bird Dynamics.” Oecologia 47:1–9.
Rotenberry JT, KL Preston, and ST Knick. 2006. “GIS-Based Niche Modeling for Mapping Species’ Habitat.” Ecology 87(6):1458–1464.
Sackschewsky MR and JL Downs. 2001. Vascular Plants of the Hanford Site. PNNL-13688, Pacific Northwest National Laboratory, Richland, Washington.
U.S. Department of Energy. 2001. Hanford Site Biological Resources Management Plan. DOE-RL 96-32, U.S. DOE Richland Operations Office, Richland, Washington.
U.S. Department of Energy. 2003. Hanford Site Biological Resources Mitigation Strategy. DOE-RL 96-88, U.S. DOE Richland Operations Office, Richland, Washington.
16
17
Vander Haegen WM. 2004. “Sage Sparrow” in Management Recommendations for Washington’s Priority Species, Volume IV: Birds, E Larsen, JM Azerrad, N Nordstrom, (eds.) Washington Department of Fish and Wildlife. Olympia, Washington.
Vander Haegen WM, FC Dobler, and DJ Pierce. 2000. “Shrub-Steppe Bird Response to Habitat and Landscape Variables in Eastern Washington, U.S.A.” Conservation Biology 14(4):1145–1160.
Washington Department of Fish and Wildlife. 2005. Species of Concern List. Olympia, Washington.
Wiens JA and JT Rotenberry. 1981. “Habitat Associations and Community Structure of Birds in Shrubsteppe Environments.” Ecological Monographs 51:21–42.
Wiens JA and JT Rotenberry. 1985. “Response of Breeding Passerine Birds to Rangeland Alteration in a North American Shrubsteppe Locality.” Journal of Applied Ecology 22:655–668.
Wiens JA, JT Rotenberry, and B Van Horne. 1985. “Territory Site Variations in Shrubsteppe Birds.” The Auk 102:500–505.
PNNL-16885
Distribution No. of Copies OFFSITE C. Andrade Washington Department of Fish and Wildlife 600 Capitol Way 1111 Washington Street NE Olympia, WA 98501-1091 M. Baker U.S. Department of Commerce – NOAA 7600 Sand Point Way NE Seattle, WA 98115 G. Bohnee Nez Perce Tribe P.O. Box 365 Lapwai, ID 83540 H. Bowers Hanford Reach National Monument 3250 Port of Benton Boulevard Richland, WA 99354 R. Brunoe, GW Natural Resources Confederated Tribes of the Warm Springs Reservation P.O. Box 1299 Warm Springs, OR 97761 R. Buck, Jr. Wanapum P.O. Box 878 Ephrata, WA 98823 L. Gadbois U.S. Environmental Protection Agency 309 Bradley, Suite 115, MS B1-46 Richland, WA 99352
No. of Copies L. Goldstein Washington Department of Ecology P.O. Box 47600 Olympia, WA 98504 M. Vander Haegen Washington Department of Fish and Wildlife 600 Capitol Way 1111 Washington Street NE Olympia, WA 98501-1091 J. Hanson U.S. Fish and Wildlife Service 11103 East Montgomery Drive Spokane, WA 99206 B. Harper Confederated Tribes of the Umatilla Indian Reservation 750 Swift, Suite 14 Richland, WA 99352 S. Harris Confederated Tribes of the Umatilla Indian Reservation P.O. Box 638 Pendleton, OR 97801 G. Hughes Hanford Reach National Monument 3250 Port of Benton Boulevard Richland, WA 99354 S. Hughs Oregon Department of Energy 625 Marion Street NE Salem, OR 97301-3737
Distr.1
PNNL-16885
No. of Copies R. Jim, Manager Yakama Nation 2808 Main Street Union Gap, WA 98903 D. Landeen Nez Perce Tribe P.O. Box 365 Lapwai, ID 83540 M. Livingston Washington Department of Fish and Wildlife 1701 South 24th Avenue Yakima, WA 98902-5720 J. McConnaughey Yakama Nation P.O. Box 6066 Kennewick, WA 99336-0066 H. Newsome Hanford Reach National Monument 3250 Port of Benton Boulevard Richland, WA 99354 A. Nomee, Dept. of Natural Resource Coeur d’Alene Tribe P.O. Box 408 Plummer, ID 83851-9704 C. Pleasants Confederated Tribes of the Colville Indian Reservation P.O. Box 150 Nespelem, WA 99155 P. Rigdon Yakama Nation P.O. Box 151 Toppenish, WA 98948
No. of Copies P. Shaffer Oregon Department of Energy 625 Marion Street NE Salem, OR 97301-3737 D. Steffeck U.S. Fish and Wildlife Service 911 NE 11th Avenue Portland, OR 97232-4181 ONSITE 4 DOE – Richland Operations Office J. R. Franco A3-04 A. L. Hawkins A7-50 D. C. Ward A3-04 S. H. Wisness A3-04 5 DOE – Office of River Protection W. Russell H6-60 DOE Public Reading Room (2) H2-53 Hanford Site Administrative Record (2) H6-08 2 Washington Closure Hanford, LLC K. A. Gano H4-21 D. D. Teel H4-21 3 Fluor Hanford R. Bauer E6-44 A. R. Johnson H8-26 R. C. Roos L4-19
Distr.2
PNNL-16885
Distr.3
No. of Copies 12 Pacific Northwest National Laboratory J. M. Becker K6-85 R. L. Dirkes K6-75 J. L. Downs K6-85 C. A. Duberstein K6-85 T. M. Poston K6-75
No. of Copies E. L. Prendergast K6-75 W. H. Rickard K6-85 M. R. Sackschewsky K6-85 M. A. Simmons K6-85 J. A. Stegen K3-66 Hanford Technical Library (2) P8-55
Copyright © 2022 FDOKUMEN