Internal structure of the aeolian sand dunes of El Fangar spit, Ebro Delta (Tarragona, Spain)
15
Internal structure of the aeolian sand dunes of El Fangar spit, Ebro Delta (Tarragona, Spain) Inmaculada Rodríguez Santalla a, ⁎, María José Sánchez García a , Isabel Montoya Montes a , David Gómez Ortiz a , Tomas Martín Crespo a , Jordi Serra Raventos b a Área de Geología, Dpto. de Biología y Geología, ESCET, Universidad Rey Juan Carlos, C/Tulipán s/n, 28933 Móstoles, Madrid, Spain b University of Barcelona, Faculty of Geology, C/Martí i Franquès s/n, E-08028 Barcelona, Spain abstract article info Article history: Received 27 January 2008 Received in revised form 27 August 2008 Accepted 31 August 2008 Available online 16 September 2008 Keywords: Ground-penetrating radar Coastal dune Ebro River Delta This paper presents an analysis of the dune field dynamics of El Fangar Spit in the Ebro Delta (Spain), associating it with the internal structure of dunes carried out with ground-penetrating radar and supported by data from topographic DGPS. These analyses are of great importance to ascertain the state of the internal structure of dunes as an important element in their stability and, therefore in their evolution. The internal structure shows accretion and progradation sequences of dunes over beach deposits, which depend on dune morphology (height, crest orientation) and location, as well as the processes acting on them. © 2008 Elsevier B.V. All rights reserved. 1. Introduction Dunes are characteristic elements of sandy beaches in which there is great sediment availability. The dunes have importance from an ecological point of view, creating their own ecosystems, as well as a sediment reservoir available in times of adverse weather (Houston et al., 2001). The dune field constitutes a natural coastal defence, representing the main sand reserve for stormy weather. During winter the dunes are eroded by local storms, carrying sand offshore where it is temporarily stored in submerged sand bars forming the winter profile, thus diminishing the energy of the surge. In summer, the swell transports sand bars onto the shoreline building up the beach and the dunes are reconstituted again (Eisma, 1995; Charlier and de Meyer, 1998). Recognizing the importance of dune performance during storms, coastal engineers have developed a variety of numerical models for cross-shore sediment transport and dune erosion, a review of which is given by Judge et al. (2003). The dunes represent one of the elements that have suffered considerable destruction, mainly due to the massive human occupa- tion of the coast, causing the erosion of many coastal zones (Nordstrom, 2000). At present, because of the concern about the effects of the climate change, and in particular the effect that the increase of sea level can cause in coastal zones, there is a tendency to regenerate dunes in the places where they have disappeared; this being the best mechanism of defence and conservation of beaches (Hesp, 2007; Tsoar and Blumberg, 2007). Therefore, studies of the structure, behaviour and evolution of dunes in different regional geographic settings are necessary. Characteristics of dune ecosystems are conditioned by sedi- mentary dynamics and these are mostly determined by wind field and sediment properties. For this reason it is necessary to understand the internal structure of dunes in order to establish an evolutionary model, which will forecast the future of the dune system. It will then be possible to determine the control measures necessary to decrease dune erosion and contribute to the establish- ment of a sustainable management plan in the Ebro Delta (Sánchez et al., 2004). An understanding of dune history can assist manage- ment decisions of coastal dune lands by national and state park organisations, municipalities, and private landowners (Havholm et al., 2004). Different methodologies have been used to determine aeolian dynamics such as aeolian sediment traps, anemometer towers, Digital Elevation Models from different years or months; but ground- penetrating radar offers the possibility to analyse dune evolution over the long term through revealing internal dune structure. Ground-penetrating radar (GPR) is a geophysical technique used to analyse the internal and geometric structures of sedimentary deposits (Bristow et al., 2000; Guha, 2004; Neal, 2004; Pedersen and Clemmensen, 2005; Bristow et al., 2005; Costas et al., 2006; Aagaard et al., 2007). The high resistivity of aeolian sands facilitates the penetration of the electromagnetic waves emitted by GPR, favouring observation of the sedimentary structures and the geometry of dunes (Moura et al., 2006). Geomorphology 104 (2009) 238–252 ⁎ Corresponding author. Tel.: +34 91 488 70 17; fax: +34 91 664 74 90. E-mail addresses: [email protected] (I. Rodríguez Santalla), [email protected] (J. Serra Raventos). 0169-555X/$ – see front matter © 2008 Elsevier B.V. All rights reserved. doi:10.1016/j.geomorph.2008.08.017 Contents lists available at ScienceDirect Geomorphology journal homepage: www.elsevier.com/locate/geomorph
-
Upload
independent -
Category
Documents
-
view
4 -
download
0
Transcript of Internal structure of the aeolian sand dunes of El Fangar spit, Ebro Delta (Tarragona, Spain)

Geomorphology 104 (2009) 238–252
Contents lists available at ScienceDirect
Geomorphology
j ourna l homepage: www.e lsev ie r.com/ locate /geomorph
Internal structure of the aeolian sand dunes of El Fangar spit, Ebro Delta(Tarragona, Spain)
Inmaculada Rodríguez Santalla a,⁎, María José Sánchez García a, Isabel Montoya Montes a,David Gómez Ortiz a, Tomas Martín Crespo a, Jordi Serra Raventos b
a Área de Geología, Dpto. de Biología y Geología, ESCET, Universidad Rey Juan Carlos, C/Tulipán s/n, 28933 Móstoles, Madrid, Spainb University of Barcelona, Faculty of Geology, C/Martí i Franquès s/n, E-08028 Barcelona, Spain
⁎ Corresponding author. Tel.: +34 91 488 70 17; fax: +E-mail addresses: [email protected] (I. R
[email protected] (J. Serra Raventos).
0169-555X/$ – see front matter © 2008 Elsevier B.V. Aldoi:10.1016/j.geomorph.2008.08.017
a b s t r a c t
a r t i c l e i n f oArticle history:
This paper presents an ana Received 27 January 2008Received in revised form 27 August 2008Accepted 31 August 2008Available online 16 September 2008Keywords:Ground-penetrating radarCoastal duneEbro River Delta
lysis of the dune field dynamics of El Fangar Spit in the Ebro Delta (Spain),associating it with the internal structure of dunes carried out with ground-penetrating radar and supportedby data from topographic DGPS. These analyses are of great importance to ascertain the state of the internalstructure of dunes as an important element in their stability and, therefore in their evolution. The internalstructure shows accretion and progradation sequences of dunes over beach deposits, which depend on dunemorphology (height, crest orientation) and location, as well as the processes acting on them.
© 2008 Elsevier B.V. All rights reserved.
1. Introduction
Dunes are characteristic elements of sandy beaches in which thereis great sediment availability. The dunes have importance from anecological point of view, creating their own ecosystems, as well as asediment reservoir available in times of adverse weather (Houstonet al., 2001). The dune field constitutes a natural coastal defence,representing themain sand reserve for stormyweather. Duringwinterthe dunes are eroded by local storms, carrying sand offshore where itis temporarily stored in submerged sand bars forming the winterprofile, thus diminishing the energy of the surge. In summer, the swelltransports sand bars onto the shoreline building up the beach and thedunes are reconstituted again (Eisma, 1995; Charlier and de Meyer,1998). Recognizing the importance of dune performance duringstorms, coastal engineers have developed a variety of numericalmodels for cross-shore sediment transport and dune erosion, a reviewof which is given by Judge et al. (2003).
The dunes represent one of the elements that have sufferedconsiderable destruction, mainly due to the massive human occupa-tion of the coast, causing the erosion of many coastal zones(Nordstrom, 2000). At present, because of the concern about theeffects of the climate change, and in particular the effect that theincrease of sea level can cause in coastal zones, there is a tendency toregenerate dunes in the places where they have disappeared; this
34 91 664 74 90.odríguez Santalla),
l rights reserved.
being the best mechanism of defence and conservation of beaches(Hesp, 2007; Tsoar and Blumberg, 2007). Therefore, studies of thestructure, behaviour and evolution of dunes in different regionalgeographic settings are necessary.
Characteristics of dune ecosystems are conditioned by sedi-mentary dynamics and these are mostly determined by wind fieldand sediment properties. For this reason it is necessary tounderstand the internal structure of dunes in order to establishan evolutionary model, which will forecast the future of the dunesystem. It will then be possible to determine the control measuresnecessary to decrease dune erosion and contribute to the establish-ment of a sustainable management plan in the Ebro Delta (Sánchezet al., 2004). An understanding of dune history can assist manage-ment decisions of coastal dune lands by national and state parkorganisations, municipalities, and private landowners (Havholmet al., 2004).
Different methodologies have been used to determine aeoliandynamics such as aeolian sediment traps, anemometer towers, DigitalElevation Models from different years or months; but ground-penetrating radar offers the possibility to analyse dune evolutionover the long term through revealing internal dune structure.
Ground-penetrating radar (GPR) is a geophysical technique used toanalyse the internal and geometric structures of sedimentary deposits(Bristow et al., 2000; Guha, 2004; Neal, 2004; Pedersen andClemmensen, 2005; Bristow et al., 2005; Costas et al., 2006; Aagaardet al., 2007). The high resistivity of aeolian sands facilitates thepenetration of the electromagnetic waves emitted by GPR, favouringobservation of the sedimentary structures and the geometry of dunes(Moura et al., 2006).

239I. Rodríguez Santalla et al. / Geomorphology 104 (2009) 238–252
While the dynamics of El Fangar spit have been widely studied(Maldonado, 1972; Jiménez and Sánchez-Arcilla, 1993; Jiménez et al.,1997; Rodríguez, 1999, 2000; Rodríguez et al., 2003), research hashardly gone into depth with respect to the aeolian mechanisms,although some work has been completed on aeolian transport fromtheoretical equations (Guillén, 1992; CEDEX, 1996; Serra et al., 1998)that reveals its importance and its role in the processes which controlthe deltaic evolution.
2. Regional setting
El Fangar spit is located in the north hemidelta of the Ebro River, inTarragona on the Mediterranean coast, 170 km from Barcelona (Fig. 1).It is 2-km long sand spit with amaximumwidth of 1.4 km at its centre,which spreads to the northwest forming a bay. The inner coast of thebay presents a smooth slope easily overrun by seawater duringepisodic storm surges.
The formation of the Peninsula of El Fangar is principally due totransport and sedimentation of erodedmaterial fromold deltaic lobules,forming bars and beach ridges parallel to the coastline (Maldonado,1972).The spit evolution shows significant accretion at its end, and itturns towards the continental coast progressively closing thebay (Fig. 2).The environment is micro-tidal, with a spring tidal range of 25 cm. Theaverage offshore significant wave height (Hs) is 0.7 m, and the meanwave period (Tm) is 3.9 s (Jiménez et al., 1997). The eastern wavecomponent, the higher and more energetic waves, is the predominantcause of morphological changes (Jiménez and Sánchez-Arcilla, 1993).
El Fangar spit morphology reveals evidence of continuousreshaping. It shows two different tendencies: the middle-south,joined to the deltaic body, exhibiting continued erosion, while themiddle-north exhibits considerable accretion (Fig. 2). The evolution ofEl Fangar spit has beenwidely studied by Rodríguez (1999, 2000), andthe principal conclusions are: (i) the shoreline regressions areproduced due to the direct coastal incidence of easterly waves, andtheir limits are in themiddle of the outer coast of El Fangar spit. At thispoint of null movement, the coastal orientation changes, alsochanging the evolutionary trend towards the area where the amountof sediment increases, building El Fangar Spit; (ii) the width at the
Fig. 1. Location of the study are
beginning of El Fangar Spit is maintained; (iii) the bar tip has increasedby 1280 m from 1957 to 2000, which represents an increase of 31 m/year; (iv) the increase of the area exceeds 180 ha, representing anincrease rate of 4.3 ha/year. Taking into account the advance of the bartip, if the hydrodynamic conditions permit, and considering a lineartendency, it has been estimated that the bay could be closed byapproximately 2030.
The outer coast of the Peninsula of Fangar has a 6-km long dunesystemwhich represents the longest and the only active dune systemof the Ebro Delta (Serra et al., 1998; Rodríguez et al., 2003). Thisprovides a perfect nesting place for the bird life which colonizes thedune field in the spring and summer seasons (Rodríguez, 2000;Sánchez et al., 2004). The dune morphology is barchan type. Duneformation in the north hemidelta is related to the orientation of thecoast, and to the predominant wind direction of greater intensity andfrequency, coming from 315° (Fig. 3). The sand of the dunes extendsfrom accretion areas to the end of the spit. Its exhibits a seasonality,where El Fangar spit is practically flooded by wave storms, seriouslyaffecting the dunes, to be regenerated again by returning to its initialstate in calm conditions.
The aeolian dynamic in the study area is determined by northerlywinds. Various works in which the aeolian transport have beencalculated from theoretical equations have been carried out (Guillén,1992; CEDEX, 1996). All of them agree that the predominant directionof the aeolian transport is towards the SE, although the magnitude ofthe transport varies substantially between authors. Serra et al. (1998)used sediment traps concluding that aeolian transport is assessed at40 m3/m/year and in exceptional conditions even more. The averagewidth of current dune field is 250 m; the aeolian transport adds10000 m3/year to the sediment flux of the north hemidelta towardsthe SE. This value is almost a third of the drift transport towards theNW (Serra et al., 1998).
Considering the shape and average height of the dunes, which havebeen monitored by topographic surveys since 2005, it is possible todivide the dune field into four different areas (Sánchez et al., 2007)(Fig. 4): Zone 1, is located to the north, just where the bar dynamicschange from an erosive to accretion tendency. It has the greatestactivity, and has small isolated barchans with an average height of 1 to
a in the Iberian Peninsula.

Fig. 2. Coastline variation in 40 years. Different values of erosion and accretion are shown, according to Rodríguez et al. (2003).
240 I. Rodríguez Santalla et al. / Geomorphology 104 (2009) 238–252
2 m; Zones 2 and 3, in the intermediate area, have lesser activity thanzone 1 but the dunes of Zone 2 form barchanoid ridges, reaching of anaverage height of 2–3 m, and in Zone 3 the shape oscillates betweenbarchanoid and seif dunes increasing in height up to 5 m; Zone 4, issimilar to Zone 1, but has less aeolian activity where the dunemorphology is barchan and the average height is 2.5 m. Pye and Tsoar(1990) related these morphological changes to an increase in thesediment supply.
3. Materials and methods
As has been explained previously, the dune field of Fangar is beingmonitored by topographic surveys with Differential Global PositioningSystem (DGPS), seven having been completed between 2005 April andSeptember of 2006. DGPS technology allows precision in position andelevation data to less than 10 cm. To obtain the topographywith DGPS,two receptors are necessary, collecting data simultaneously. One ofthem remained at a point of known coordinates, and the other wascarried in a backpack through the dune field. In this study, atopographic survey was carried out synchronizing with the acquisi-tion GPR data.
To increase the knowledge of dune dynamics at El Fangar, a studyof the internal structure has been performed by GPR survey. Themethod has been extensively used to analyse the internal andgeometric structures of coastal dunes (Harari, 1996; Bristow et al.,2000; Van Dam et al., 2003; Pedersen and Clemmensen, 2005;Bristow et al., 2005; Costas et al., 2006, Moura et al., 2006).
Considering that the Ebro Delta is a protected area, this technique isespecially useful due to its non-invasive character, avoiding environ-mental damage in very sensitive areas (Bristow et al., 2000; Havholmet al., 2004; Girardi, 2005) in comparison with other techniques thatuse trenches to study internal structures (Girardi, 2005; Horwitz andWang, 2005).
The GPR technique is based on the measurements of the subsur-face response to high frequency (typically 100–1000 MHz) electro-magnetic (EM) waves. A transmitting antenna on the ground surfaceemits EM waves in distinct pulses into the ground that propagate,reflect and/or diffract at interfaces where the dielectric permittivity ofthe subsurface changes. EM wave velocity data thus allow conversionof a time record of reflections into an estimated depth.
Reflections of EM waves are usually generated by changes in theelectrical properties of sediments, variations in water content, andchanges in bulk density at stratigraphic interfaces. Reflections canalso be related to changes in EM wave velocity due, for instance, tothe occurrence of voids in the ground. The penetration depth andresolution of the reflection data are both functions of wavelengthand dielectric constant values, which in turn are mainly controlledby the water content of the materials (Davis and Annan, 1989;Daniels, 1996).
Data from this study were collected with the SubsurfaceInterface Radar (SIR) 3000 system developed by GeophysicalSurvey Systems, Inc. (GSSI). GPR measurements were made usinga 200 MHz centre frequency shielded antenna in the monostaticmode, which is considered the best compromise between

Fig. 3. Wind rose of the delta of the Ebro, 1992–2007. Hourly data coming from theFangar weather station belonging to the Red de Instrumentos Oceanográficos yMeteorológicos managed by Generalidad de Cataluña.
Fig. 4. Position of profiles and dune field division (Sánchez et al., 2007).
241I. Rodríguez Santalla et al. / Geomorphology 104 (2009) 238–252
penetration depth and event resolution in sedimentary materials.All the profiles have been collected in a continuous mode with adistance interval between traces of 0.1 m and a total number of1024 samples per scan. In this continuous acquisition mode, eachtrace of the radargram is the result of a 64-times stacking in orderto improve the signal-to-noise ratio. A survey wheel attachmentwas used in order to obtain a measurement at exact distanceintervals, in this case every 0.1 m. Thus, using the survey wheel wecan be confident that the accuracy in the horizontal resolution ofthe survey is enhanced. Automatic gain control was employedduring data acquisition and depending on the dune height, a timewindow of 50 or 100 ns two way travel time (TWT) was applied.The topography along the profile was obtained by means of adifferential GPS and the data were used to correct the topographyin the data processing.
Following the scheme proposed by Neal (2004), data processingcomprised zero-time corrections, signal-saturation corrections,automatic gain control (AGC), band-pass filtering, static correctionsand Kirchoff migration. Although published data for EM wavevelocities in sedimentary materials are available, each specificstudy area displays particular dielectric features due to the inherentheterogeneities of any individual lithology, mostly in sedimentaryrocks. For this reason, calibration surveys were necessary to obtaina mean EM velocity value applicable to all profiles so that arepresentative dielectric constant could be calculated. A calibrationsurvey was carried out over a representative zone of the area, wherea metallic bar had been horizontally introduced. Once the velocitydata were obtained, a migration process was applied in order tocollapse the diffraction hyperbolae and obtain true geometries anddepths of the subsurface structures along the profiles. All data wereprocessed, modelled and interpreted using REFLEXW 3.5 software. Inall the profiles, the position of the antennae is represented on thehorizontal axis, whereas depth is depicted with no scale exaggera-tion on the vertical.
As a general statement, GPR profiles exhibit a good signal-to-noise ratio over the whole time window. In addition to this, all
GPR profiles show a much higher intensity at the central part,corresponding to the coastal dunes, than at the edges, wherewater-saturated sands are predominant. Moreover, a reflectorlocated at a constant depth of about 0.7 m below the plain can beseen in all the profiles, although under the dune formations it isobscured by other reflectors. From direct field observations made atsmall trenches, the 0.7 m depth reflector closely matches thelocation of the water table. Conductive saline groundwaterincreases attenuation below the water table, as well as introducinginterferences in the GPR diagrams, especially if the pores are filledwith salt water. This would be the cause of some persistentrepetitions of parallel reflectors present in the lower part of therecords, in addition to deeper reflections that could be multiples ofthe air and ground waves at the top of the profile. For these reasons,the profiles have not been interpreted below the water table exceptwhere attenuation is low.
During the field survey, 14 GPR profiles with a total length of1120 m were carried out. The location of the profiles was plannedaccording to the different zones of dune activity. This paper showsonly 5 profiles (Fig. 4) chosen from 14 GPR profiles, to explain theinternal structure of the dune field at El Fangar Spit.
In addition, to understand the present aeolian dynamics themonthly wind roses from April to September of 2006 (Fig. 5), aswell as the wave roses (Fig. 6) and the sea-level variations (Fig. 7)for the same period have been analysed. All these data havebeen made available by the Red de Instrumentos Oceanográficos yMeteorológicos (XIOM) of Generalidad de Cataluña. The meteor-ological station is located in the Port of L'Ampolla about 6 km fromthe El Fangar dune field. The data are provided for every 10 min.Fig. 5 shows monthly wind roses from April to September of 2006,which reflect wind direction changes in the months of summer. The

Fig. 5. Wind roses from April to September 2006. Data acquired every 10 min coming from L'Ampolla weather station belonging to the Red de Instrumentos Oceanográficos yMeteorológicos of Generalidad de Cataluña.
242 I. Rodríguez Santalla et al. / Geomorphology 104 (2009) 238–252
wave roses in Fig. 6 present the hourly significant heights of thewaves. The buoy is directional, anchored in the Cabo de Tortosaapproximately 1 km from the El Fangar coast. The tide-gauge dataare correlated with the same time period of the meteorologicalstation.
4. Results
4.1. Topographic surveys
From topographic surveys with DGPS, different Digital ElevationModels (DEM) have been obtained, which have been used toestimate field dune movement (Fig. 8). Migration rates werecalculated between each survey by superposition of MDT with a
Geographic Information System (GIS). The method used can be seenin Sánchez et al. (2007).
4.2. Ground-penetrating radar survey
To explain the internal structure of the dunes a profile from theGPR survey in each zone is shown (Fig. 4).
4.2.1. Zone 1Profile 1 (Fig. 9) was acquired in zone 1, parallel to the prevailing
wind direction and parallel to the shoreline, cutting two barchan typedunes lengthwise. In this profile, the reflectors are parallel and sub-horizontal by foreset accretion. At a horizontal distance of between 10and 20 m, truncations in the radargram sequence can be observed. In

Fig. 6. Wave roses from April 2006 to September 2006. Data acquired every hour coming from Cap Tortosa directional buoy belonging to the Red de Instrumentos Oceanográficos yMeteorológicos of Generalidad de Cataluña.
243I. Rodríguez Santalla et al. / Geomorphology 104 (2009) 238–252
the interdune zone (20–30 m distance), the reflectors are sub-horizontal, showing vertical accretion. From 38 m there are onlaprelations associated with dune migration towards the SE.
Profile 2 (Fig. 10), is perpendicular to profile 1, perpendicular to theshoreline, and parallel to the dune crest. The reflectors stay sub-horizontal, showing foreshore accretion, but at 28m and 32m distancethere are convex-up reflectors which maintain onlap relations in thelateral ones, adapting to a morphology of the underlying beach,represented by a continuous reflector. Over this formation dune radarfacies are developed showing parallel lamination.
4.2.2. Zone 2Profile 3 (Fig. 11) was carried out parallel to the shoreline and
predominant wind direction of greater intensity. It is possible todistinguish two radar facies, separated by thewater table. The lower is
defined by continuous low-angle reflectors that correspond to beachfacies (Bristow et al., 2000; Bristow and Pucillo, 2006), and over-lapping this is another dune facies, showing discontinuous reflectors,dipping in the wind direction at a low angle forming cross-stratification typical of the movements of the migration of the dune.At a horizontal distance of 68 m, it is possible to distinguish a wedgegeometry from avalanching due to brink reactivation by the prevailingwind.
4.2.3. Zone 3Zone 3 is represented by profile 4 (Fig. 12). The internal structure is
similar to the previous one. Below thewater table, there are low-anglereflectors and parallel lamination due to foreset accretion. Above thewater table, themodification of wind flowaround themain dune bodyis shown by short SE-dipping reflectors forming cross-stratification,
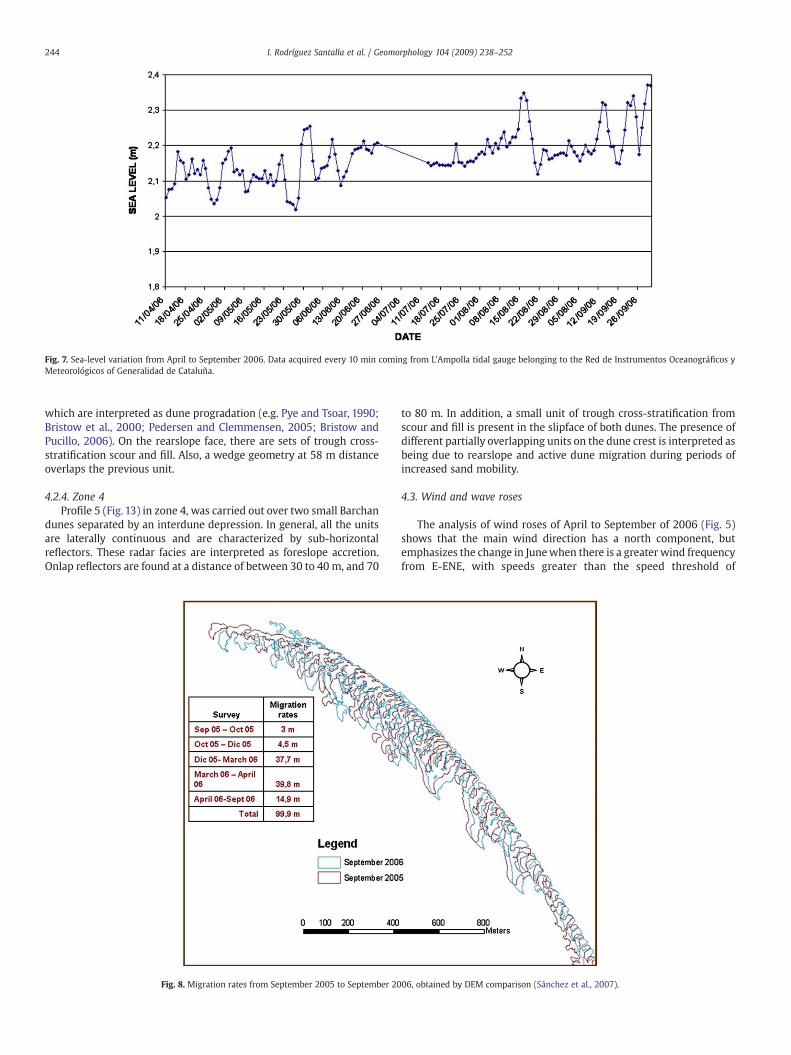
Fig. 7. Sea-level variation from April to September 2006. Data acquired every 10 min coming from L'Ampolla tidal gauge belonging to the Red de Instrumentos Oceanográficos yMeteorológicos of Generalidad de Cataluña.
244 I. Rodríguez Santalla et al. / Geomorphology 104 (2009) 238–252
which are interpreted as dune progradation (e.g. Pye and Tsoar, 1990;Bristow et al., 2000; Pedersen and Clemmensen, 2005; Bristow andPucillo, 2006). On the rearslope face, there are sets of trough cross-stratification scour and fill. Also, a wedge geometry at 58 m distanceoverlaps the previous unit.
4.2.4. Zone 4Profile 5 (Fig. 13) in zone 4, was carried out over two small Barchan
dunes separated by an interdune depression. In general, all the unitsare laterally continuous and are characterized by sub-horizontalreflectors. These radar facies are interpreted as foreslope accretion.Onlap reflectors are found at a distance of between 30 to 40 m, and 70
Fig. 8. Migration rates from September 2005 to September 20
to 80 m. In addition, a small unit of trough cross-stratification fromscour and fill is present in the slipface of both dunes. The presence ofdifferent partially overlapping units on the dune crest is interpreted asbeing due to rearslope and active dune migration during periods ofincreased sand mobility.
4.3. Wind and wave roses
The analysis of wind roses of April to September of 2006 (Fig. 5)shows that the main wind direction has a north component, butemphasizes the change in Junewhen there is a greater wind frequencyfrom E-ENE, with speeds greater than the speed threshold of
06, obtained by DEM comparison (Sánchez et al., 2007).

Fig. 9. Profile 1, parallel to wind direction. In this profile it is possible to distinguish reflectors (A) parallel and sub-horizontal by foreset accretion; truncate reflectors (B) associated with storm events, and in onlap relations due to dunemigration towards the SE.
245I.Rodríguez
Santallaet
al./Geom
orphology104
(2009)238
–252

Fig. 10. Profile 2, perpendicular to profile 1. This profile presents parallel lamination (A) adapting to underlying shapes which are interpreted as beach ridges (B) that form El Fangar Spit.
246I.Rodríguez
Santallaet
al./Geom
orphology104
(2009)238
–252

Fig.11. Profile 3, parallel towind direction. It is possible to distinguish the beach facies (A) defined by continuous low-angle reflectors, and dune facies (B) forming cross-stratification dipping in thewind direction. The rearslope face presents anactivation wedge (C) due to an increase in the activity of the wind.
247I.Rodríguez
Santallaet
al./Geom
orphology104
(2009)238
–252

Fig. 12. Profile 4, parallel to wind direction. This profile present parallel lamination (A) by foreset accretion, where the dune facies are developed (B) with cross-stratification parallel to the wind direction. Sets of trough cross-stratification(C) are present in the rearslope face, and a wedge geometry (D) caused by deposit from a small avalanche.
248I.Rodríguez
Santallaet
al./Geom
orphology104
(2009)238
–252

Fig. 13. Profile 5, parallel to wind direction. Shows two dunes separated by an interdune depression (A) with parallel lamination. It is possible to distinguish truncations (B) associated with dune overwashing, and overlapping units (C) in therearslope face associated with dune migration.
249I.Rodríguez
Santallaet
al./Geom
orphology104
(2009)238
–252

Fig. 14. Location of Profiles 1 and 2 in April 2006.
250 I. Rodríguez Santalla et al. / Geomorphology 104 (2009) 238–252
movement (4 m/s according to Serra et al., 1998). In July and Augustwind storms from the SW direction and with speeds greater than10m/s are also observed. Thewave roses of thesemonths are analysed(Fig. 6) in the same way, distinguishing two storms from the E, withsignificant wave heights greater than 1.5 m, which agrees with thesurge elevations caused by meteorological tide (Fig. 7), and favouringwaves of high energy which affect the field dune.
5. Discussion
According to Sánchez et al. (2007), and considering the migrationrates shown in Fig. 8, the dune field of El Fangar spit is highly active,distinguished by different zones defined by dune activity linked tocoastal and aeolian processes. The internal structure reveals thedynamic history of dunes. If the DEM obtained from the topographicalsurvey with DGPS in April of 2006 (Sánchez et al., 2007), and thoseobtained with the GPR data from September of 2006 are compared, itis possible to determine that associated aspects of the existingstructures in each profile are derived from events that happenedbetween the dates compared (April to September 2006) using wind
Fig. 15. Barchan dunes with three brinks
and wave roses (Figs. 5 and 6). The evolution obtained by means oftopographic data shows that zones with low heights have migrationrates higher than zones with higher dune height. Then, to explain theinternal structure it is necessary to establish a relationship with thedune height, suggesting that low height (zones 1 and 4) involvessignificant migratory activity, while a height increase (zones 2 and 3)leads to a decrease in dune migration, showing a more developedinternal structure.
Profiles 1 and 2 are located to the north, just where the bardynamics change from erosive to accretionary tendency. It has thegreatest dune activity since they are directly facing north winds. Inrelation to profile 1 it is possible to point out that the first 14 m isdeveloped on top of that which, in the DEM of April of 2006, wasoccupied by sand flats (Fig. 14). This can explain the different relationsassociated with wind reactivation and the advance of dune towardsthe SE that are observed in zone 1 (Fig. 8).
During months of May, July and August of 2006 episodes ofsoutherly wind of great intensity took place (Fig. 5), affecting the dunemorphologies and changing the direction of the crests (Fig. 15). Thesechanges are registered in the internal structure of the dunes in form of
oriented in three different directions.

251I. Rodríguez Santalla et al. / Geomorphology 104 (2009) 238–252
truncations like those observed between the 10 and 20 m distance inprofile 1.
Given the low height of the dune in zone 1, it is possible todistinguish in the base of the radargram of profile 2 (Fig. 9) differentshapes that can be explained as positive relief of the beach ridges(Neal and Roberts, 2000) forming El Fangar Spit, which are covered bydunes.
In comparisonwith zone 1, the height and complexity of the dunesincreases in zone 2 and zone 3, which contain dunes of greater size,implying a decrease in dune migration (Sánchez et al., 2007). Theradar facies of both zones show structures in line with the previousfindings, presenting radar facies which are more continuous laterally,with low-angle foresets associated with dune accretion, following anormal sequence with a low grade of mobility, and being moredeveloped. The cross-stratification in the radar facies of dune isinterpreted as dune progradation showing different phases of dunereactivation (e.g. Pye and Tsoar, 1990; Bristow et al., 2000; Pedersenand Clemmensen, 2005; Bristow and Pucillo, 2006). Beside this,wedge geometry overlaps the previous unit with trough cross-stratification from scour and fill. This could correspond to the resultingdeposit from a small avalanche of the windward face of the dune dueto reworking by the prevailing wind (Bristow et al., 2000).
Zone 4 is located to the south of the dune field, and it exhibitssmaller dunes than the others. This is because the wind and thesediment, coming from the north, previously feed the dune bodies ofzones 1, 2 and 3. In this way, a lesser amount of sand arrives to formthe dunes of this zone. The radar facies on GPR profiles across the dunein zone 4 contain trough cross-stratification cut and fill, and roll-overstructures; all of them associated with active dunes, with reworkingby winds. The shoreline trend is different in the four areas, the erosionrate of the coastline diminishing from the south towards the north(Jiménez et al., 1997; Rodríguez et al., 2003). This is also reflected inthe coastal orientation, so that the northern formation receives moreoblique waves coming from the east, zone 4 being the nearest to thecoastline and more affected by waves (Fig. 16).
As a result the dune formation located to the south of the dunefield presents greater problems because of the effect of the waves,being clearly reflected in their internal structure where it ispossible to distinguish truncations due to erosion by wave stormsevents (Fig. 12) (Bristow and Pucillo, 2006; Costas et al., 2006;Moura et al., 2006).
Fig. 16. Inundation of the dune fi
6. Conclusion
The internal structure of dunes can be explained by the duneactivity and aeolian and wave dynamics. Zone 1 shows small and lowdunes, but high aeolian activity because they are the first to faceeffective winds from the NW. The internal structure of these dunesshows intense migratory activity in response to wind direction,towards the SE. In addition, a bar from accretion of sand that forms ElFangar Spit has been observed at the base of the dune.
The intermediate area of the dune field, showing less activity thanthe zone 1, exhibits two zones (zones 2 and 3) in line with the dunetype. In both cases, the dunes are higher than in other zones, and havea low migration rate. An important foreshore accretion is observed inthe GPR profiles, as well as superficial activity marked by cross-stratification, due to wind action.
Zone 4, located to the south of the dune field, presents very smalldunes. Due to its position in relation to coastal orientation, they areinfluenced by northerly winds and they are also affected by easterlywaves of greater energy. These are the cause of significant erosion ofcoastline in this zone. This activity is reflected in the dune internalstructure, showing different truncations by storm waves.
From the GPR data analysis it is possible to confirm that themorphology and the geometry of the dune bodies adapt themselves tometeorological conditions. This allows us to make an extensive studyof dune activity and to obtain models of coastal dune development, inorder to advise on themost effectivemechanisms for themanagementand maintenance of the dune fields.
The structure of dunes is the result of the processes that occur in thezone during a short period of time. HavingDEMs of dunes fromprevioussurveys, as well as data of wind and waves of months previous to theacquisition of radargrams, facilitates interpretation of the internalstructure in relation to recent dynamics. In zones such as the FangarSpit, where during the months of April to August there is no access inorder to allow the nesting of birds, the GPR technique turns out to behelpful in understanding the significance of dynamic processes duringthis period when it is not possible to study dune topography directly.
Acknowledgments
We would like to thank of the Parque Natural of Ebro Delta forpermitting fieldwork in the area. This work is funded by the Project
eld during periods of storm.

252 I. Rodríguez Santalla et al. / Geomorphology 104 (2009) 238–252
“Cuantificación y contribución del transporte eólico en los procesosdinámicos y ambientales en el delta del Ebro. Aplicación a su gestiónintegrada y a la conservación de los ambientes marginales”, from theMinisterio de Ciencia y Tecnología of Spain. Moreover, we would liketo give thanks to the Red de Instrumentos Oceanográficos yMeteorológicos (Generalidad de Cataluña) for the data provided.
References
Aagaard, T., Oxford, J., Murray, A.S., 2007. Environmental controls on coastal duneformation; Skallingen Spit, Denmark. Geomophology 83, 29–47.
Bristow, C.S., Pucillo, K., 2006. Quantifying rates of coastal progradation from sedimentvolume using GPR and OSL: the Holocene fill of Guichen Bay, south-east SouthAustralia. Sedimentology 53, 769–788.
Bristow, C.S., Chroston, P.N., Bailey, S.D., 2000. The structure and development offoredunes on a locally prograding coast: insights from ground-penetrating radarsurveys, Norfolk, UK. Sedimentology 47, 923–944.
Bristow, C.S., Lancaster, N., Duller, G.A.T., 2005. Combining ground penetrating radarsurveys and optical dating to determine dune migration in Namibia. Journal of theGeological Society, London 162, 315–321.
CEDEX, 1996. Estudio de la dinámica litoral del Delta del Ebro y prognosis de suevolución. Dinámica litoral del Delta del Ebro. Centro de Estudios de Puertos yCostas, CEDEX. Tecnical Report, Direccion General de Costas, MOPTMA, Madrid,Spain. 155 pp.
Charlier, R.H., de Meyer, C.P., 1998. Coastal erosion: response and management. Ed.Springer. 343 p.
Costas, S., Alejo, I., Rial, F., Lorenzo, H., Nombela, M.A., 2006. Cyclical evolution of amodern transgressive sand barrier in Northwestern Spain elucidated by GPR andaerial photos. Journal of Sedimentary Research 76, 1077–1092.
Daniels, D.J., 1996. Surface-penetrating Radar-IEE Radar, Sonar, Navigation and AvionicsSeries 6. The Institue of Electrical Engineers, London. 320 p.
Davis, J.L., Annan, A.P., 1989. Ground-penetrating radar for high-resolution mapping ofsoil and rock stratigraphy. Geophysical Prospecting 37, 531–551.
Eisma, D., 1995. Climate Change: Impact on Coastal Habitation. CRC Press. 272 pp.Girardi, J.D., 2005. A GPR and Mapping Study of the Evolution of an Active Parabolic
Dune System, Napeague, New York. PhD Thesis, Dept. of Geosciences, Stony BrookUniversity, Manhattan.
Guha, S., 2004. Ground penetrating radar response to thin Layers: Examples fromWaites Island, South Carolina. PhD Thesis, University of South Florida.
Guillén, J., 1992. Dinámica y balance sedimentario en los ambientes fluvial y litoral delDelta del Ebro. PhD Thesis, Universidad Politécnica de Cataluña, Barcelona, Spain,580 pp.
Harari, Z., 1996. Ground-penetrating radar (GPR) for imaging stratigraphic features andgroundwater in sand dunes. Journal of Applied Geophysics 36, 43–52.
Havholm, K.G., Ames, D.V.,Whittecar, G.R.,Wenel, B.A., Riggs, S.R., Jol, H.M., Berger, G.W.,Holmes, M.A., 2004. Stratigraphy of back-barrier coastal dunes, Northern NorthCarolina and Southern Virginia. Journal of Coastal Research 20-4, 980–999.
Hesp, P., 2007. Initiation, evolution, dynamics and geomorphology of transgressivedunefields. International Conference on Management and Restoration of CoastalDunes. Santander, Spain.
Horwitz, M., Wang, P., 2005. Sedimentological characteristics and internal architectureof two overwash fans from hurricanes Ivan and Jeanne. Gulf Coast Association ofGeological Societies Transactions, Volume 55, 342–352.
Houston, J., Edmondson, S.E., Rooney, P.J., 2001. Coastal Dune Management: SharedExperience of European Conservation Practice. Liverpool University Press. 458 pp.
Jiménez, J.A., Sánchez-Arcilla, A., 1993. Medium-term coastal response at the Ebro Delta,Spain. Marine Geology 114, 105–118.
Jiménez, J.A., Sánchez-Arcilla, A., Valdemoro, H.I., Gracia, V., Nieto, F., 1997. Processesreshaping the Ebro delta. Marine Geology 144, 59–79.
Judge, E.K., Overton, M.F., Fisher, J.S., 2003. Vulnerability indicators for coastal dunes.Journal of Waterway Port Coastal and Ocean Engineering 129 (6), 270–278.
Maldonado, A., 1972. El Delta del Ebro. Estudio sedimentológico y estratigráfico. PhDThesis. Universidad de Barcelona, Spain. Boletín de Estratigrafía, Vol. 1 486 p.
Moura, M.V.M., Reyes-Perez, Y.A., Siqueira, D., Santos, D.A., Medeiros, A., Reis, A.P.M.,Pinheiro, F., 2006. Levantamento geofísico com GPR em um campo de dunas eólicasem Tibau do Sul/RN. Revista de Geología 19 (1), 99–108.
Neal, A., 2004. Ground-penetrating radar and its use in sedimentology: principles,problems and progress. Earth-Science Reviews 66, 261–330.
Neal, A., Roberts, C.L., 2000. Applications of ground-penetrating radar (GPR) tosedimentological, geomorphological and geoarchaeological studies in coastalenvironments. In: Pye, K., Allen, J.R.L. (Eds.), Coastal and estuarine environments:sedimentology, geomorphology and geoarchaeology. Geological Society, London,Special Publications, vol. 175, pp. 139–171.
Nordstrom, K.F., 2000. Beaches and Dunes of Developed Coasts. Cambridge UniversityPress. 338 pp.
Pedersen, K., Clemmensen, L.B., 2005. Unveiling past aeolian landscapes: a ground-penetrating radar survey of a Holocene coastal dunefield system, Thy, Denmark.Sedimentary Geology 177, 57–86.
Pye, K., Tsoar, H., 1990. Aeolian Sand and Sand Dunes. Unwin Hyman, London.Rodríguez, I., 1999. Evolución Geomorfológica del Delta del Ebro y Prognosis de su
Evolución. PhD Thesis, Universidad de Alcalá de Henares, Alcalá de Henares, Spain.Rodríguez, I., 2000. Proyecto de actuaciónmedioambiental en el entorno de la Península
del Fangar, Playa de la Marquesa y Playa de Pal en el Delta del Ebro. Estudio deImpacto Ambiental. Tecnical Report, Direccion General de Costas, Ministerio deMedio Ambiente, Madrid, Spain.
Rodríguez, I., Galofré, J., Montoya, F., 2003. El Fangar Spit Evolution. Coastal EngineeringVI: Computer Modelling and Experimental Measurements of Seas and CoastalRegions. WIT PRESS, UK, pp. 419–425.
Sánchez, M.J., Rodríguez, I., Serra, J., 2004. Evolution of shoredune field on the Ebro Delta(Spanish Mediterranean Coast). Littoral 2004, Aberdeen, Escocia, UK, pp. 719–720.
Sánchez, M.J., Rodríguez, I., Montoya, I., 2007. Short term coastal dune evolution ofFangar Spit (Ebro Delta, Spain). International Conference on Management andRestoration of coastal dunes. Santander, Spain.
Serra, J., Maia, L.P., Bautista, R., 1998. Aeolian contribution to the sediment budget alongthe coast of the Ebro delta. 15 th International Congress of Sedimentology. Alicante,Spain.
Tsoar, H., Blumberg, D.G., 2007. Management of stable and active coastal sand dunes.International Conference on Management and Restoration of coastal dunes.Santander, Spain.
Van Dam, R.L., Van Den Berg, E.H., Schaap, M.G., Broekema, L.H., Schlager, W., 2003.Radar reflections from sedimentary structures in the vadose zone. GeologicalSociety of London, Special Publications 211, 257–273.