Spatial Model for Ground Water Conservation Based on Landform Approach in the Southern Flank of...
20
Journal of Geography and Earth Sciences December 2014, Vol. 2, No. 2, pp. 01-20 ISSN 2334-2447 (Print) 2334-2455 (Online) Copyright © The Author(s). 2014. All Rights Reserved. Published by American Research Institute for Policy Development DOI: 10.15640/jges.v2n2a1 URL: http://dx.doi.org/10.15640/jges.v2n2a1 Spatial Model for Ground Water Conservation Based on Landform Approach in the Southern Flank of Merapi Vulcano Hargono, B. 1 , Sartohadi, J. 2 , Pramonohadi, M. 3 & Setiawan, B 4 Abstract The research is focused on the urban City of Yogyakarta. This location is the most densely populated with the highest number of population in the southern flank of Merapi Volcano, with the consequence of the highest water requirement. The southern flank of Merapi Volcano is an area with very high intensity of precipitation, however declining of groundwater table has occurred for quite of years with an intensive rate. It is therefore, groundwater conservation effort is required in the urban city of Yogyakarta. This research is aimed at; 1) making a hydrology spatial model to understand the water balance based on landform approach on the research area; 2) to find the area suffering from water scarcity and when the scarcity occurs; and 3) recommendation on groundwater conservation effort to overcome the water scarcity. The methods applied are to make a spatial model of the research area based on landforms, river interfluves, water availabilty analysis, water balance analysis to find where and when the scarcity occurs, and the analysis for water conservation. The research area is naturally divided into 12 unit areas based on landforms and interfluves. The analysis has shown the unit areas when and where the water scarcity occur using water requirements of 120 liter/capita/day and 50 liter/capita/day. The proposed conservation effort is applying rainstorm management that rain water shall be considered as water resources not flood or standing water to be drained away, and keep the hydrologic function of the area remains unchanged after a development. A spatial model is constructed on the most seriously suffered unit area which is divided into microcatchments. A microcatchment is a single hydrology unit having independent drainage system, where efforts on the unchanged hydrology functions are implemented and analyzed.. Keywords: spatial model, landforms, water scarcity, ground water conservation, rainstorm management, microcatchment 1 Center for Water Resources Research Institute, Ministry of Public Works, Indonesia. E-mail: [email protected] 2 Department of Environmental Geography, University of Gadjahmada, Yogyakarta, Indonesia. Email: [email protected] 3 Department of Environmental Geography, University of Gadjahmada, Yogyakarta, Indonesia. Email: [email protected] 4 Department of Architecture and Planning Engineering, University of Gadjahmada, Yogyakarta, Indonesia. Email: [email protected]
Transcript of Spatial Model for Ground Water Conservation Based on Landform Approach in the Southern Flank of...
Journal of Geography and Earth Sciences December 2014, Vol. 2, No. 2, pp. 01-20
ISSN 2334-2447 (Print) 2334-2455 (Online) Copyright © The Author(s). 2014. All Rights Reserved.
Published by American Research Institute for Policy Development DOI: 10.15640/jges.v2n2a1
URL: http://dx.doi.org/10.15640/jges.v2n2a1
Spatial Model for Ground Water Conservation Based on Landform Approach
in the Southern Flank of Merapi Vulcano
Hargono, B.1, Sartohadi, J.2, Pramonohadi, M.3 & Setiawan, B4
Abstract
The research is focused on the urban City of Yogyakarta. This location is the most densely populated with the highest number of population in the southern flank of Merapi Volcano, with the consequence of the highest water requirement. The southern flank of Merapi Volcano is an area with very high intensity of precipitation, however declining of groundwater table has occurred for quite of years with an intensive rate. It is therefore, groundwater conservation effort is required in the urban city of Yogyakarta. This research is aimed at; 1) making a hydrology spatial model to understand the water balance based on landform approach on the research area; 2) to find the area suffering from water scarcity and when the scarcity occurs; and 3) recommendation on groundwater conservation effort to overcome the water scarcity. The methods applied are to make a spatial model of the research area based on landforms, river interfluves, water availabilty analysis, water balance analysis to find where and when the scarcity occurs, and the analysis for water conservation. The research area is naturally divided into 12 unit areas based on landforms and interfluves. The analysis has shown the unit areas when and where the water scarcity occur using water requirements of 120 liter/capita/day and 50 liter/capita/day. The proposed conservation effort is applying rainstorm management that rain water shall be considered as water resources not flood or standing water to be drained away, and keep the hydrologic function of the area remains unchanged after a development. A spatial model is constructed on the most seriously suffered unit area which is divided into microcatchments. A microcatchment is a single hydrology unit having independent drainage system, where efforts on the unchanged hydrology functions are implemented and analyzed..
Keywords: spatial model, landforms, water scarcity, ground water conservation, rainstorm management, microcatchment
1 Center for Water Resources Research Institute, Ministry of Public Works, Indonesia. E-mail: [email protected] 2 Department of Environmental Geography, University of Gadjahmada, Yogyakarta, Indonesia. Email: [email protected] 3 Department of Environmental Geography, University of Gadjahmada, Yogyakarta, Indonesia. Email: [email protected] 4 Department of Architecture and Planning Engineering, University of Gadjahmada, Yogyakarta, Indonesia. Email: [email protected]

2 Journal of Geography and Earth Sciences, Vol. 2(2), December 2014 Background
Yogyakarta is an urban city in the island of Java, Indonesia (Figure 1). The most densely populated place in the southern flank of Merapi Volcano. The Merapi Volcano (+2965 m) is the most active one among 129 volcanoes of Indonesia (Soetikno et al., 2007). The urban city lies on the foot slope, foot plain, and fluvial plain landforms of the southern slope of the Volcano. The research is focused on this urban city that founded on high permeability pyroclastic materials and its derivatives (MacDonald and Partners, 1984). High intensity of annual rain supplies the aquifer of the city with abundance of groundwater, where 80% of the population use dug wells as water resources to fulfill their domestic needs (Putra et al., 2007)
Figure 1: The location of the study area, Merapi Volcano and Special Province
of Yogyakarta in the Island of Java
The population density in the city of Yogyakarta is 12,114 people/km2 (BPS DIY, 2010), about 8 times the density of the districts in the surrounding. The location of the study covers an urbanized area of 163.6 km2, about 5 times the area of the City of Yogyakarta which is about 32.5 km2. The population of the study area is 816,787 people make the average density of 4,993 people/km2. Interpretation of satellite image from Google Map of 2010, showing distribution of infrastructures that interpreted as population distribution shows Yogyakarta as the most populated area, and therefore, the study is focused in the City of Yogyakarta and the surrounding (Figure2).
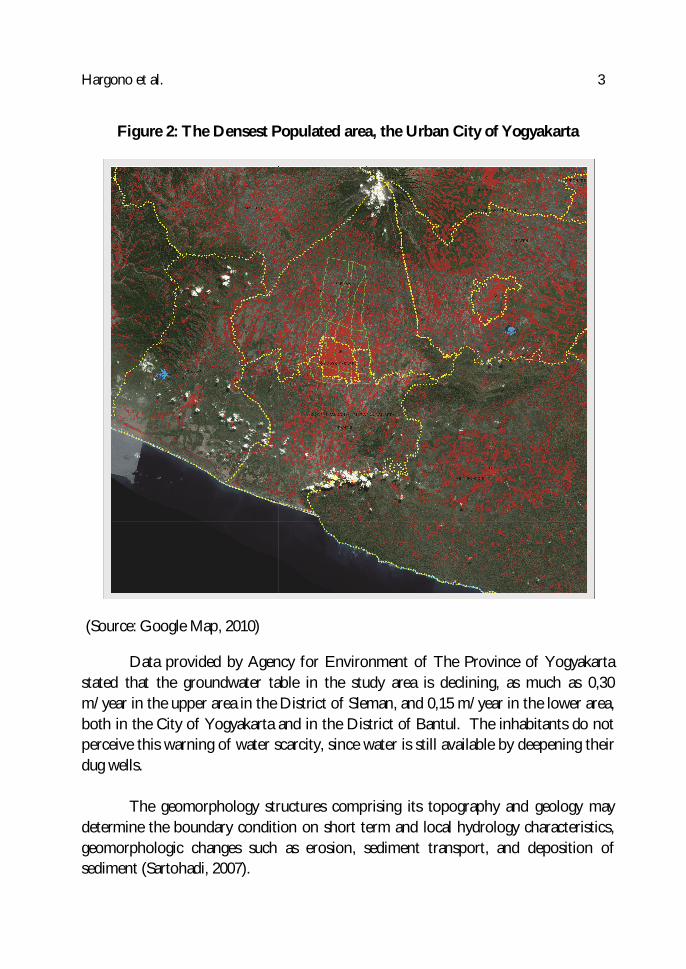
Hargono et al. 3
Figure 2: The Densest Populated area, the Urban City of Yogyakarta
(Source: Google Map, 2010)
Data provided by Agency for Environment of The Province of Yogyakarta stated that the groundwater table in the study area is declining, as much as 0,30 m/year in the upper area in the District of Sleman, and 0,15 m/year in the lower area, both in the City of Yogyakarta and in the District of Bantul. The inhabitants do not perceive this warning of water scarcity, since water is still available by deepening their dug wells.
The geomorphology structures comprising its topography and geology may
determine the boundary condition on short term and local hydrology characteristics, geomorphologic changes such as erosion, sediment transport, and deposition of sediment (Sartohadi, 2007).

4 Journal of Geography and Earth Sciences, Vol. 2(2), December 2014
The relatively flat topography of the study area, 0.3o-1.5o sloping down to the south, and the annual rain intensity as high as 2300 mm, on a high permeability of pyroclastic material, all should support the stability of shallow groundwater table of the Urban City of Yogyakarta. The fact, however, the decline of the groundwater that still tends to continue, indicates the unbalance between the supply from rain water against the consumption of water by the inhabitants.
The urbanization process which is high rate of population growth and
development of infrastructures has caused the instability of water availability in the aquifer.
With reference to the background of the study, the problems on the southern
flank of the Merapi Volcano lead to the statement of research questions as the followings, 1) how the spatial model for the hydrology assessment is based on landforms to understand the water balance; 2) which parts of the study area suffer from water shortage and when the water shortage occurs; 3) how and what are conservation efforts shall be applied to overcome the water shortage. Previous Studies
The drop of groundwater table is a common phenomenon in big cities of the
world, mainly in the cities depending on groundwater for their domestic water resources (Nonner, 2010). Declining of groundwater table may entail adverse impacts such as land subsidence and sea (salt) water intrusion in the coastal area (Sharma et al., 2006). Jakarta and Bandung, large cities of Indonesia, have suffered from the land subsidence due to excessive extraction of groundwater (Taufiq et al., 2014). Intrusion of sea water far in to the land had occurred in Jakarta. The drainage patterns have changed, slopes of drainage channels adversely oriented, small basins created in the cities that lead to standing water requiring pumps or sometimes complicated efforts to drain the water away. These studies had shown that the decline of water table is a serious matter, and not only a case of water shortage. Serious efforts are required to overcome the problems before it is getting worse.
MacDonald and Partners (1984) had made a study on groundwater of the
southern flank of Merapi Volcano. The safe yield of the groundwater is 3,5 to 4 m3/sec in the upper part, from Mataram Canal upward, the lower part, from the Mataram Canal to the coast in the fluvial plain, the safe yield is 7 to 8 m3/sec.

Hargono et al. 5
MacDonald and Partners (1984) also reported that the aquifer of Yogyakarta groundwater basin works excellently, that all rivers in the basin are perennial; the water continues flowing throughout the year.
A specific landform may have characteristics that enable a hydrologic cycle
occurs and can be analyzed within a spatial model based on the landform (Sartohadi, 2007).
A landform is a specific form on the earth surface as the result of changes on the earth surface due to morphological processes. Landform is determined by its topography and relief, rock structures and its lithology, and the formation processes due to geomorphologic forces apply on the land.
Spatial model is a model representing earth surface with special characteristic
which is required. Spatial model shall represent elements of geography comprising geology, hydrology, and meteorology which consist of layers of rocks, water, and air, the existence of those elements, the distribution, the physical and chemical processes of their formations, their mechanical properties, their structures and its reversal relation of those elements. The discussion of the environmental interaction of those elements shall include land use, land cover, and social aspects of the activities of the people living on the land (Sen, 2009). Methodology
Satellite imageries supported with some maps are analyzed. Google map of
2010 covering the overall southern flank of Merapi Volcano is interpreted to find the density of infrastructures that is related to the density of the population as previously described. The SRTM (Shuttle Radar Topography Mission) image is analyzed to find the boundary of landforms by finding the break of slopes, and delineating rivers to find the zones of interfluves. The Quickbird of 2010 is interpreted to find the portion of land use in the area of concerns, in order to know the extent of infrastructures in blocking the infiltration of water into the ground.
The study area is established by delineating the infrastructures distribution in
the urban City of Yogyakarta on Google Map 2010. By studying the maps, the exact path of rivers can also be delineated on Google Map. The digital way in finding the river paths, is especially done using SRTM image.
6 Journal of Geography and Earth Sciences, Vol. 2(2), December 2014
The study area appears to be located on 3 landforms, foot slope, foot plain, and fluvial plain. Five rivers across the study area Bedog, Winongo, Code, Gajahwong, and Tambakboyo, form 4 interfluves. The superposition between the landforms and the interfluves shows that the area of the study is naturally divided into 12 units of study area. Geotechnical samples are taken from each study area unit, by considering its landuse.
In geomorphology it is believed that anisotropy is lesser when the objects are
closer (Sen, 2009), therefore, smaller units of study area are expected to provide more accurate data and analysis. Data analysis is conducted manually using some quantitative calculation. While qualitative analysis is conducted by analyzing each unit of the study area on their characteristics; among others are geotechnical properties.
Several important steps on the method of the research are 1) Construction of
spatial hydrology model, covering identification of landform units, identification of zone of interfluves, formation of units of research areas taking an assumption that the most populated unit area needs the most urgent conservation efforts; 2) to determine the unit area suffers from water scarcity by comparing the available water supply and the water requirement. There are 2 water requirement figures applied in the analysis; 120 liter/capita/day (BBWS SO, 2010) and 50 liter/capita/day (Gleick, 1996); 3) conservation efforts based on the characteristics of the unit of research area, types of conservation infrastructures and its distribution, and the spatial planning.
Four kinds of analysis are conducted in calculating the availability of water; 1)
simple analysis, in which the volume of monthly average precipitation after subtracted by the evapotranspiration (P-Ea) which falls onto developed areas, buildings and roads, or the impermeable areas, is assumed to flow directly into a river. The one falls on to permeable ground is assumed to directly infiltrate into the ground and usable by the inhabitants through dug wells; 2) base flow from NRECA, by applying rainfall-runoff NRECA model after Crawford et al. (1981) the volume of base flow, flowing in the aquifer, deduced from P-Ea is usable for the inhabitants through dug wells; 3) total flow from NRECA, the volume of the total flow, the base flow and direct flow all together, deduced from P-Ea by applying NRECA model can be used by the inhabitants for their domestic needs; and 4) potential analysis, all P-Ea is usable by the inhabitants for their domestic needs.

Hargono et al. 7
The water balance analysis determines the ratio between monthly water requirement and water availability in every unit of study area. The unit of study area is considered suitable as a hydrology unit, where rain water falls onto every unit area is not flowing to the adjacent ones. The ratio is expressed as water criticality and scarcity, less than 25%, not critical, between 25% and 50% light critical, between 50% and 75% medium critical, between 75% and 100% very critical, and more than 100%, water scarcity (Hatmoko et al., 2012).
Result and Discussion
There are 3 breaks of slope, and 5 rivers running across the study area. No break of slope can be identified in the fluvial plain however the appearance of urban city fades out at the south of the Southern Outer Ring Road of the City. The three break of slope and the ring road distinguish the study area into three landforms. Five rivers in the study area, namely Bedog, Winongo, Code, Gajahwong, and Tambakboyo, divide the study area into four interfluves. The superposition of those characteristics results into 12 unit area of research as shown on Figure 3. This division reduces the anisotropy of the study area. Further analysis, concerning hydrology of the study area is conducted in more detail on every unit area of research. The hydrology analysis to understand water balance of the study area is conducted based on the spatial model as shown in Figure 3.
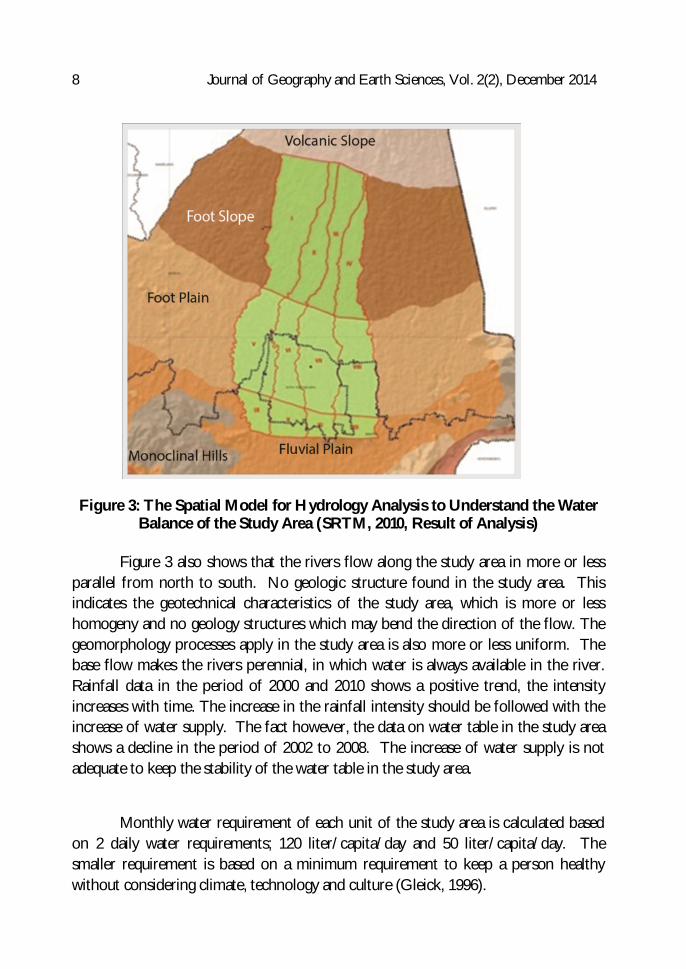
8 Journal of Geography and Earth Sciences, Vol. 2(2), December 2014
Figure 3: The Spatial Model for Hydrology Analysis to Understand the Water
Balance of the Study Area (SRTM, 2010, Result of Analysis) Figure 3 also shows that the rivers flow along the study area in more or less
parallel from north to south. No geologic structure found in the study area. This indicates the geotechnical characteristics of the study area, which is more or less homogeny and no geology structures which may bend the direction of the flow. The geomorphology processes apply in the study area is also more or less uniform. The base flow makes the rivers perennial, in which water is always available in the river. Rainfall data in the period of 2000 and 2010 shows a positive trend, the intensity increases with time. The increase in the rainfall intensity should be followed with the increase of water supply. The fact however, the data on water table in the study area shows a decline in the period of 2002 to 2008. The increase of water supply is not adequate to keep the stability of the water table in the study area.
Monthly water requirement of each unit of the study area is calculated based on 2 daily water requirements; 120 liter/capita/day and 50 liter/capita/day. The smaller requirement is based on a minimum requirement to keep a person healthy without considering climate, technology and culture (Gleick, 1996).

Hargono et al. 9
It becomes a target for minimum fulfillment of water supply. The maximum population is at unit area VI and followed by unit area VII. The water requirement consequently is also maximum at the unit area VI and followed by unit area VII.
The data on water requirement is used for water balance analysis of every unit
area of research to find the one suffers from water scarcity. The simple analysis, in which the rain falling on the undeveloped area will directly infiltrate into the ground and can be used by the inhabitants through dug wells, also simple in terms of no change in water storage in the aquifer. The water supply is based on monthly average precipitation. The result of the analysis is as shown in Table 2, showing the criticality of each unit area based on simple hydrology analysis. Table 1 shows that unit area VI, VII, and XII suffer from water scarcity throughout the year. Unit area X suffers from water scarcity from March to November, very critical in December and January, and medium critical in February.
Table 1: Water Criticality, Simple Hydrology Analysis Using Water Requirement of 120 Liter/Capita/Day
Legends: Not critical Light critical Medium critical Very critical Water scarcity
There is no rainfall from June to October, or the rain intensity is smaller than
actual evapotranspiration, that P-Ea is negative. Water supply is 0 in overall unit area, except at unit area I in October. Ratio between water supply and water requirement shows division by 0. Although P-Ea is positive in October at unit I, the supply is very small that the requirement is about 18 times of the water availability.
I II III IV V VI VII VIII IX X XI XIIJan 8% 5% 5% 8% 56% 256% 192% 53% 59% 81% 31% 131%
Feb 8% 5% 5% 7% 39% 195% 158% 46% 34% 64% 26% 107%
Mar 10% 6% 6% 10% 47% 237% 233% 79% 44% 106% 45% 218%
Apr 16% 10% 10% 15% 104% 581% 628% 107% 87% 175% 72% 396%
Mei 53% 27% 25% 44% 953% 5363% #DIV/0! 438% #DIV/0! 715% 264% 1706%
Jun #DIV/0! #DIV/0! #DIV/0! #DIV/0! #DIV/0! #DIV/0! #DIV/0! #DIV/0! #DIV/0! #DIV/0! #DIV/0! #DIV/0!
Jul #DIV/0! #DIV/0! #DIV/0! #DIV/0! #DIV/0! #DIV/0! #DIV/0! #DIV/0! #DIV/0! #DIV/0! #DIV/0! #DIV/0!
Agust #DIV/0! #DIV/0! #DIV/0! #DIV/0! #DIV/0! #DIV/0! #DIV/0! #DIV/0! #DIV/0! #DIV/0! #DIV/0! #DIV/0!
Sep #DIV/0! #DIV/0! #DIV/0! #DIV/0! #DIV/0! #DIV/0! #DIV/0! #DIV/0! #DIV/0! #DIV/0! #DIV/0! #DIV/0!
Okt 1792% #DIV/0! #DIV/0! #DIV/0! #DIV/0! #DIV/0! #DIV/0! #DIV/0! #DIV/0! #DIV/0! #DIV/0! #DIV/0!
Nop 10% 6% 8% 14% 50% 252% 266% 92% 51% 196% 93% 277%
Des 6% 4% 4% 6% 37% 176% 151% 56% 38% 79% 32% 134%
10 Journal of Geography and Earth Sciences, Vol. 2(2), December 2014
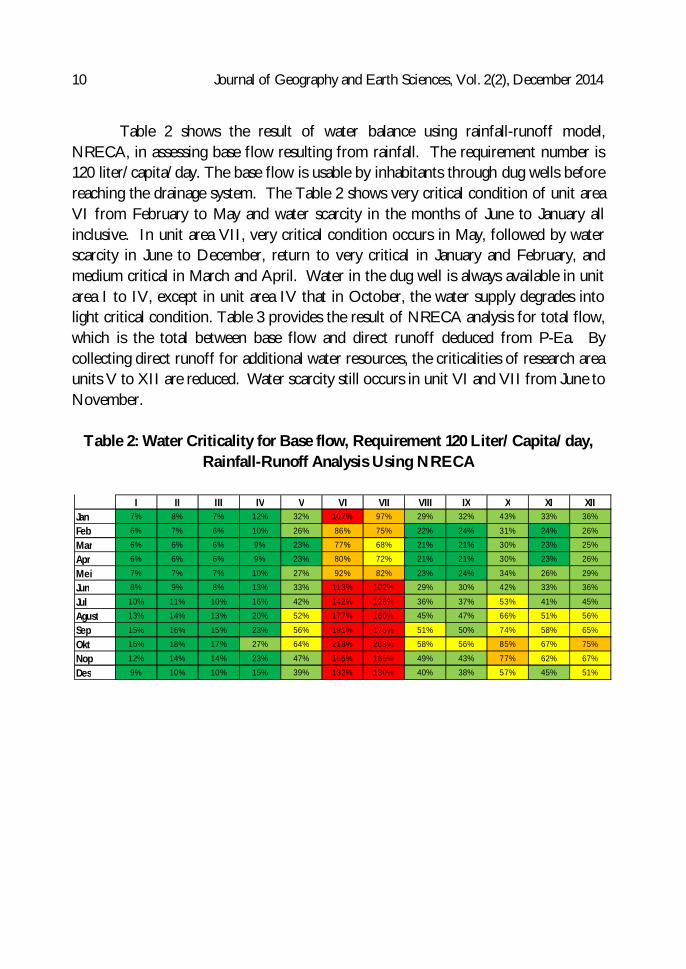
Table 2 shows the result of water balance using rainfall-runoff model, NRECA, in assessing base flow resulting from rainfall. The requirement number is 120 liter/capita/day. The base flow is usable by inhabitants through dug wells before reaching the drainage system. The Table 2 shows very critical condition of unit area VI from February to May and water scarcity in the months of June to January all inclusive. In unit area VII, very critical condition occurs in May, followed by water scarcity in June to December, return to very critical in January and February, and medium critical in March and April. Water in the dug well is always available in unit area I to IV, except in unit area IV that in October, the water supply degrades into light critical condition. Table 3 provides the result of NRECA analysis for total flow, which is the total between base flow and direct runoff deduced from P-Ea. By collecting direct runoff for additional water resources, the criticalities of research area units V to XII are reduced. Water scarcity still occurs in unit VI and VII from June to November.
Table 2: Water Criticality for Base flow, Requirement 120 Liter/Capita/day,
Rainfall-Runoff Analysis Using NRECA
I II III IV V VI VII VIII IX X XI XIIJan 7% 8% 7% 12% 32% 107% 97% 29% 32% 43% 33% 36%
Feb 6% 7% 6% 10% 26% 86% 75% 22% 24% 31% 24% 26%
Mar 6% 6% 6% 9% 23% 77% 68% 21% 21% 30% 23% 25%
Apr 6% 6% 6% 9% 23% 80% 72% 21% 21% 30% 23% 26%
Mei 7% 7% 7% 10% 27% 92% 82% 23% 24% 34% 26% 29%
Jun 8% 9% 8% 13% 33% 113% 102% 29% 30% 42% 33% 36%
Jul 10% 11% 10% 16% 42% 142% 128% 36% 37% 53% 41% 45%
Agust 13% 14% 13% 20% 52% 177% 160% 45% 47% 66% 51% 56%
Sep 15% 16% 15% 23% 56% 191% 175% 51% 50% 74% 58% 65%
Okt 16% 18% 17% 27% 64% 218% 203% 58% 56% 85% 67% 75%
Nop 12% 14% 14% 23% 47% 165% 165% 49% 43% 77% 62% 67%
Des 9% 10% 10% 15% 39% 132% 130% 40% 38% 57% 45% 51%
Hargono et al. 11
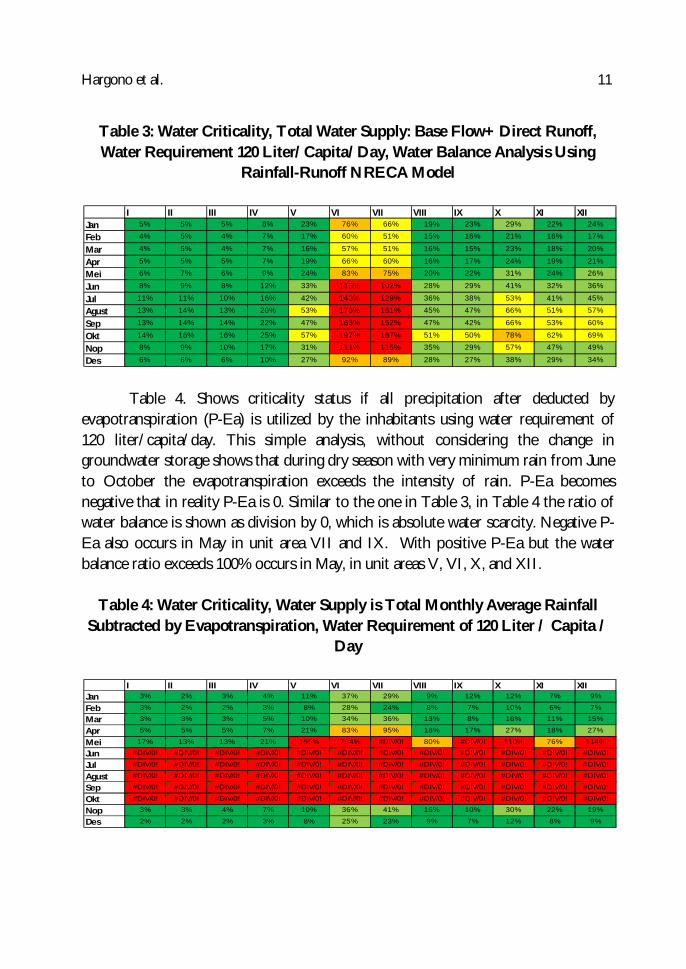
Table 3: Water Criticality, Total Water Supply: Base Flow+ Direct Runoff, Water Requirement 120 Liter/Capita/Day, Water Balance Analysis Using
Rainfall-Runoff NRECA Model
Table 4. Shows criticality status if all precipitation after deducted by evapotranspiration (P-Ea) is utilized by the inhabitants using water requirement of 120 liter/capita/day. This simple analysis, without considering the change in groundwater storage shows that during dry season with very minimum rain from June to October the evapotranspiration exceeds the intensity of rain. P-Ea becomes negative that in reality P-Ea is 0. Similar to the one in Table 3, in Table 4 the ratio of water balance is shown as division by 0, which is absolute water scarcity. Negative P-Ea also occurs in May in unit area VII and IX. With positive P-Ea but the water balance ratio exceeds 100% occurs in May, in unit areas V, VI, X, and XII.
Table 4: Water Criticality, Water Supply is Total Monthly Average Rainfall Subtracted by Evapotranspiration, Water Requirement of 120 Liter / Capita /
Day
I II III IV V VI VII VIII IX X XI XIIJan 5% 5% 5% 8% 23% 76% 66% 19% 23% 29% 22% 24%
Feb 4% 5% 4% 7% 17% 60% 51% 15% 16% 21% 16% 17%
Mar 4% 5% 4% 7% 16% 57% 51% 16% 15% 23% 18% 20%
Apr 5% 5% 5% 7% 19% 66% 60% 16% 17% 24% 19% 21%
Mei 6% 7% 6% 9% 24% 83% 75% 20% 22% 31% 24% 26%
Jun 8% 9% 8% 12% 33% 113% 102% 28% 29% 41% 32% 36%
Jul 11% 11% 10% 16% 42% 143% 129% 36% 38% 53% 41% 45%
Agust 13% 14% 13% 20% 53% 178% 161% 45% 47% 66% 51% 57%
Sep 13% 14% 14% 22% 47% 163% 152% 47% 42% 66% 53% 60%
Okt 14% 16% 16% 25% 57% 197% 187% 51% 50% 78% 62% 69%
Nop 8% 9% 10% 17% 31% 111% 115% 35% 29% 57% 47% 49%
Des 6% 6% 6% 10% 27% 92% 89% 28% 27% 38% 29% 34%
I II III IV V VI VII VIII IX X XI XIIJan 3% 2% 3% 4% 11% 37% 29% 9% 12% 12% 7% 9%
Feb 3% 2% 2% 3% 8% 28% 24% 8% 7% 10% 6% 7%
Mar 3% 3% 3% 5% 10% 34% 36% 13% 8% 16% 11% 15%
Apr 5% 5% 5% 7% 21% 83% 95% 18% 17% 27% 18% 27%
Mei 17% 13% 13% 21% 195% 764% #DIV/0! 80% #DIV/0! 110% 76% 114%
Jun #DIV/0! #DIV/0! #DIV/0! #DIV/0! #DIV/0! #DIV/0! #DIV/0! #DIV/0! #DIV/0! #DIV/0! #DIV/0! #DIV/0!
Jul #DIV/0! #DIV/0! #DIV/0! #DIV/0! #DIV/0! #DIV/0! #DIV/0! #DIV/0! #DIV/0! #DIV/0! #DIV/0! #DIV/0!
Agust #DIV/0! #DIV/0! #DIV/0! #DIV/0! #DIV/0! #DIV/0! #DIV/0! #DIV/0! #DIV/0! #DIV/0! #DIV/0! #DIV/0!
Sep #DIV/0! #DIV/0! #DIV/0! #DIV/0! #DIV/0! #DIV/0! #DIV/0! #DIV/0! #DIV/0! #DIV/0! #DIV/0! #DIV/0!
Okt #DIV/0! #DIV/0! #DIV/0! #DIV/0! #DIV/0! #DIV/0! #DIV/0! #DIV/0! #DIV/0! #DIV/0! #DIV/0! #DIV/0!
Nop 3% 3% 4% 7% 10% 36% 41% 16% 10% 30% 22% 19%
Des 2% 2% 2% 3% 8% 25% 23% 9% 7% 12% 8% 9%

12 Journal of Geography and Earth Sciences, Vol. 2(2), December 2014
The change in water requirement from 120 liter/capita/day to 50 liter/capita/day in the simple hydrology analysis do not change the amount of water availability, therefore the P-Ea in June to October remains negative. It is shown in Table 5. Water scarcity still occurs in wet season, when P-Ea is positive, which are in unit area I in October, in area V in May, in area VI in January, April, and November, in area VII in April and November, in unit areas VIII, X, and XII in April, May and November. Unit area VI suffers from very critical condition in February and March, and medium critical in December. Unit area VII is in medium critical condition in February and December, and very critical condition in January and March. In unit area V the condition improves, with 120 liter/capita/day the status is water scarcity in April (104%), with water requirement of 50 liter/capita/day, the status becomes light critical (43%) in the same month. The changes in status also occur in unit areas VIII and XI.
Table 5. Water Criticality Using Simple Analysis, Water Requirement of 50
Liter/Capita/Day
Table 6 shows criticality of the unit areas analyzed using NRECA rainfall-
runoff model to assess the base flow and water requirement of 50 liter/capita/day. Significant improvement seems to appear, although the water availability remains unchanged. The very critical condition only occurs in unit area VI in September and October; and in unit area VII in the month of October. These two unit areas are still in critical condition in various levels the whole year. From January until June, their status are light critical, from July to December medium critical, except in unit area VI in September and October they suffer from very critical condition, while in unit area VII, this very critical condition occurs in the month of October only. Some unit areas are still in the light critical status; and the most of the unit areas, water is available in adequate amount and can be taken out from dug wells.
I II III IV V VI VII VIII IX X XI XIIJan 3% 2% 2% 3% 23% 107% 80% 22% 25% 34% 13% 54%
Feb 3% 2% 2% 3% 16% 81% 66% 19% 14% 27% 11% 45%
Mar 4% 2% 3% 4% 20% 99% 97% 33% 18% 44% 19% 91%
Apr 7% 4% 4% 6% 43% 242% 262% 45% 36% 73% 30% 165%
Mei 22% 11% 10% 18% 397% 2235% #DIV/0! 182% #DIV/0! 298% 110% 711%
Jun #DIV/0! #DIV/0! #DIV/0! #DIV/0! #DIV/0! #DIV/0! #DIV/0! #DIV/0! #DIV/0! #DIV/0! #DIV/0! #DIV/0!
Jul #DIV/0! #DIV/0! #DIV/0! #DIV/0! #DIV/0! #DIV/0! #DIV/0! #DIV/0! #DIV/0! #DIV/0! #DIV/0! #DIV/0!
Agust #DIV/0! #DIV/0! #DIV/0! #DIV/0! #DIV/0! #DIV/0! #DIV/0! #DIV/0! #DIV/0! #DIV/0! #DIV/0! #DIV/0!
Sep #DIV/0! #DIV/0! #DIV/0! #DIV/0! #DIV/0! #DIV/0! #DIV/0! #DIV/0! #DIV/0! #DIV/0! #DIV/0! #DIV/0!
Okt 746% #DIV/0! #DIV/0! #DIV/0! #DIV/0! #DIV/0! #DIV/0! #DIV/0! #DIV/0! #DIV/0! #DIV/0! #DIV/0!
Nop 4% 3% 3% 6% 21% 105% 111% 38% 21% 81% 39% 115%
Des 3% 1% 1% 2% 15% 73% 63% 23% 16% 33% 13% 56%
Hargono et al. 13
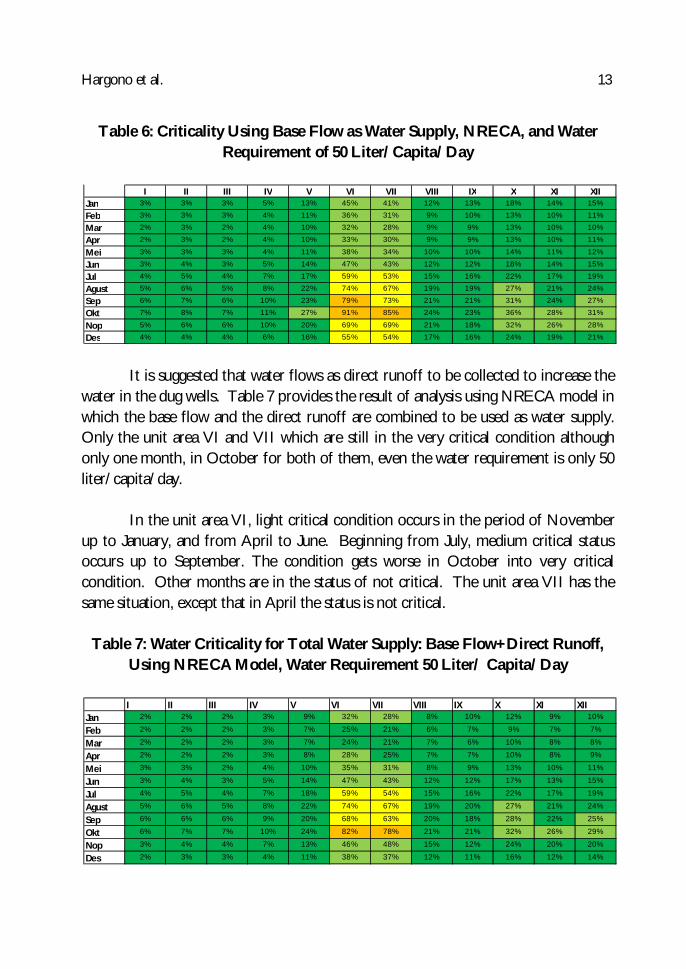
Table 6: Criticality Using Base Flow as Water Supply, NRECA, and Water Requirement of 50 Liter/Capita/Day
It is suggested that water flows as direct runoff to be collected to increase the
water in the dug wells. Table 7 provides the result of analysis using NRECA model in which the base flow and the direct runoff are combined to be used as water supply. Only the unit area VI and VII which are still in the very critical condition although only one month, in October for both of them, even the water requirement is only 50 liter/capita/day.
In the unit area VI, light critical condition occurs in the period of November
up to January, and from April to June. Beginning from July, medium critical status occurs up to September. The condition gets worse in October into very critical condition. Other months are in the status of not critical. The unit area VII has the same situation, except that in April the status is not critical.
Table 7: Water Criticality for Total Water Supply: Base Flow+Direct Runoff, Using NRECA Model, Water Requirement 50 Liter/ Capita/Day
I II III IV V VI VII VIII IX X XI XIIJan 3% 3% 3% 5% 13% 45% 41% 12% 13% 18% 14% 15%
Feb 3% 3% 3% 4% 11% 36% 31% 9% 10% 13% 10% 11%
Mar 2% 3% 2% 4% 10% 32% 28% 9% 9% 13% 10% 10%
Apr 2% 3% 2% 4% 10% 33% 30% 9% 9% 13% 10% 11%
Mei 3% 3% 3% 4% 11% 38% 34% 10% 10% 14% 11% 12%
Jun 3% 4% 3% 5% 14% 47% 43% 12% 12% 18% 14% 15%
Jul 4% 5% 4% 7% 17% 59% 53% 15% 16% 22% 17% 19%
Agust 5% 6% 5% 8% 22% 74% 67% 19% 19% 27% 21% 24%
Sep 6% 7% 6% 10% 23% 79% 73% 21% 21% 31% 24% 27%
Okt 7% 8% 7% 11% 27% 91% 85% 24% 23% 36% 28% 31%
Nop 5% 6% 6% 10% 20% 69% 69% 21% 18% 32% 26% 28%
Des 4% 4% 4% 6% 16% 55% 54% 17% 16% 24% 19% 21%
I II III IV V VI VII VIII IX X XI XIIJan 2% 2% 2% 3% 9% 32% 28% 8% 10% 12% 9% 10%
Feb 2% 2% 2% 3% 7% 25% 21% 6% 7% 9% 7% 7%
Mar 2% 2% 2% 3% 7% 24% 21% 7% 6% 10% 8% 8%
Apr 2% 2% 2% 3% 8% 28% 25% 7% 7% 10% 8% 9%
Mei 3% 3% 2% 4% 10% 35% 31% 8% 9% 13% 10% 11%
Jun 3% 4% 3% 5% 14% 47% 43% 12% 12% 17% 13% 15%
Jul 4% 5% 4% 7% 18% 59% 54% 15% 16% 22% 17% 19%
Agust 5% 6% 5% 8% 22% 74% 67% 19% 20% 27% 21% 24%
Sep 6% 6% 6% 9% 20% 68% 63% 20% 18% 28% 22% 25%
Okt 6% 7% 7% 10% 24% 82% 78% 21% 21% 32% 26% 29%
Nop 3% 4% 4% 7% 13% 46% 48% 15% 12% 24% 20% 20%
Des 2% 3% 3% 4% 11% 38% 37% 12% 11% 16% 12% 14%

14 Journal of Geography and Earth Sciences, Vol. 2(2), December 2014
Table 8. Water Criticality for Water Supply: Monthly Average Rainfall (Subtracted by Evapotranspiration), Water Requirement 50 Liter/Capita/Day
Criticality table based on simple hydrology analysis using monthly average
precipitation subtracted by evapotranspiration (P-Ea) as water supply, and water requirement of 50 liter/capita/day is presented as Table 8. Comparison between Table 8 and Table 4 with water requirement of 120 liter/capita/day, shows a significant difference. Unit areas VI and VII still have light critical condition in April. Precipitation is limited in June to October as in Table 4. P-Ea is negative in all unit areas and also in May in unit areas VII and IX. Very critical condition occurs in May in unit area V. Water scarcity occurs in May in unit area VI, the P-Ea is positive. Light critical condition occurs in unit area VI and VII in April and in unit areas VIII, X, XI, and XII in May.
The rest seem to have adequate water for their domestic requirement if the
water requirement is kept 50 liter/capita/day. Still the worst condition are in unit areas VI and VII.
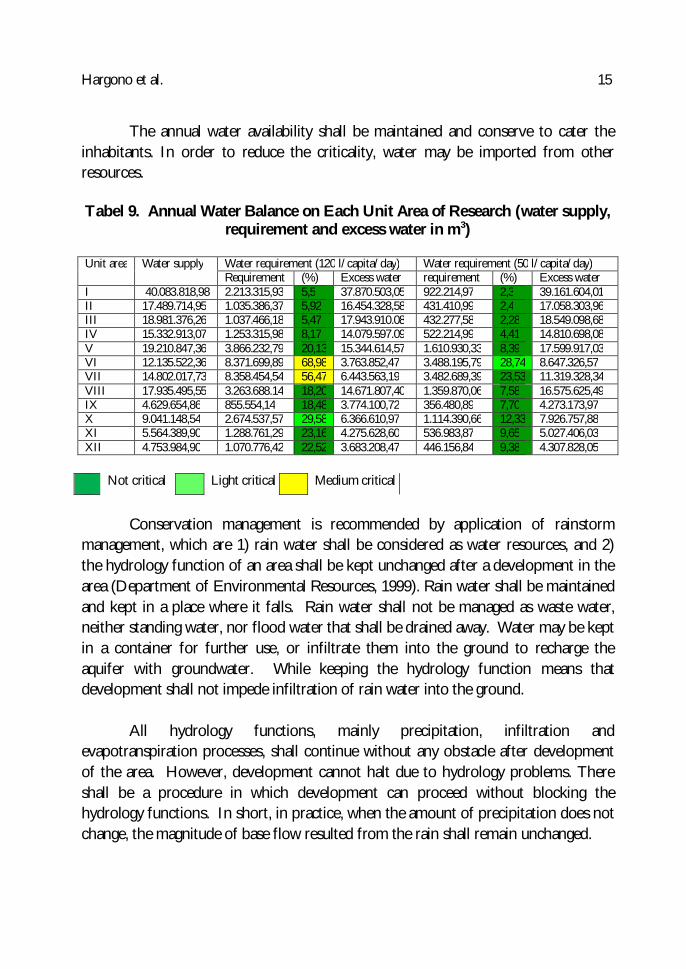
Table 9 shows annual water balance, the water availability is P-Ea of the whole
year and water requirement for the whole year are calculated for both water requirement, 120 and 50 liter/capita/day. The result shows that excess water is still available for other than domestic purposes. The domestic water requirement makes the water balance in unit area VI and VII in the very critical condition, which are 68,98% and 54,67% consecutively. If the water requirement can be reduced to 50 liter/capita/day, the water will be adequate throughout the year without any criticality, except unit area VI that still in light critical status. Overall annual water availability is adequate in general.
I II III IV V VI VII VIII IX X XI XIIJan 1% 1% 1% 2% 5% 15% 12% 4% 5% 5% 3% 4%
Feb 1% 1% 1% 1% 3% 12% 10% 3% 3% 4% 3% 3%
Mar 1% 1% 1% 2% 4% 14% 15% 6% 4% 7% 5% 6%
Apr 2% 2% 2% 3% 9% 35% 39% 8% 7% 11% 8% 11%
Mei 7% 5% 5% 9% 81% 318% #DIV/0! 34% #DIV/0! 46% 32% 48%
Jun #DIV/0! #DIV/0! #DIV/0! #DIV/0! #DIV/0! #DIV/0! #DIV/0! #DIV/0! #DIV/0! #DIV/0! #DIV/0! #DIV/0!
Jul #DIV/0! #DIV/0! #DIV/0! #DIV/0! #DIV/0! #DIV/0! #DIV/0! #DIV/0! #DIV/0! #DIV/0! #DIV/0! #DIV/0!
Agust #DIV/0! #DIV/0! #DIV/0! #DIV/0! #DIV/0! #DIV/0! #DIV/0! #DIV/0! #DIV/0! #DIV/0! #DIV/0! #DIV/0!
Sep #DIV/0! #DIV/0! #DIV/0! #DIV/0! #DIV/0! #DIV/0! #DIV/0! #DIV/0! #DIV/0! #DIV/0! #DIV/0! #DIV/0!
Okt #DIV/0! #DIV/0! #DIV/0! #DIV/0! #DIV/0! #DIV/0! #DIV/0! #DIV/0! #DIV/0! #DIV/0! #DIV/0! #DIV/0!
Nop 1% 1% 2% 3% 4% 15% 17% 7% 4% 13% 9% 8%
Des 1% 1% 1% 1% 3% 10% 10% 4% 3% 5% 3% 4%
Hargono et al. 15
The annual water availability shall be maintained and conserve to cater the inhabitants. In order to reduce the criticality, water may be imported from other resources. Tabel 9. Annual Water Balance on Each Unit Area of Research (water supply,
requirement and excess water in m3) Unit area Water supply Water requirement (120 l/capita/day) Water requirement (50 l/capita/day)
Requirement (%) Excess water requirement (%) Excess water I 40.083.818,98 2.213.315,93 5,5 37.870.503,05 922.214,97 2,3 39.161.604,01 II 17.489.714,95 1.035.386,37 5,92 16.454.328,58 431.410,99 2,4 17.058.303,96 III 18.981.376,26 1.037.466,18 5,47 17.943.910.08 432.277,58 2,28 18.549.098,68 IV 15.332.913,07 1.253.315,98 8,17 14.079.597.09 522.214,99 4,41 14.810.698,08 V 19.210.847,36 3.866.232,79 20,13 15.344.614,57 1.610.930,33 8,39 17.599.917,03 VI 12.135.522,36 8.371.699,89 68,98 3.763.852,47 3.488.195,79 28,74 8.647.326,57 VII 14.802.017,73 8.358.454,54 56,47 6.443.563,19 3.482.689,39 23,53 11.319.328,34 VIII 17.935.495,55 3.263.688.14 18,20 14.671.807,40 1.359.870,06 7,58 16.575.625,49 IX 4.629.654,86 855.554,14 18,48 3.774.100,72 356.480,89 7,70 4.273.173,97 X 9.041.148,54 2.674.537,57 29,58 6.366.610,97 1.114.390,66 12,33 7.926.757,88 XI 5.564.389,90 1.288.761,29 23,16 4.275.628,60 536.983,87 9,65 5.027.406,03 XII 4.753.984,90 1.070.776,42 22,52 3.683.208,47 446.156,84 9,38 4.307.828,05
Conservation management is recommended by application of rainstorm management, which are 1) rain water shall be considered as water resources, and 2) the hydrology function of an area shall be kept unchanged after a development in the area (Department of Environmental Resources, 1999). Rain water shall be maintained and kept in a place where it falls. Rain water shall not be managed as waste water, neither standing water, nor flood water that shall be drained away. Water may be kept in a container for further use, or infiltrate them into the ground to recharge the aquifer with groundwater. While keeping the hydrology function means that development shall not impede infiltration of rain water into the ground.
All hydrology functions, mainly precipitation, infiltration and
evapotranspiration processes, shall continue without any obstacle after development of the area. However, development cannot halt due to hydrology problems. There shall be a procedure in which development can proceed without blocking the hydrology functions. In short, in practice, when the amount of precipitation does not change, the magnitude of base flow resulted from the rain shall remain unchanged.
Not critical Light critical Medium critical
16 Journal of Geography and Earth Sciences, Vol. 2(2), December 2014
The process on increasing the capacity of the aquifer is by improving the PSUB, parameter of NRECA expressing the rate of percolation of water into the aquifer, from 0.85 to 0.90, the maximum possible PSUB in Indonesia. The increase of PSUB is implemented by constructing infiltration wells to increase the amount of water to percolate into the aquifer. The result is that the required number of infiltration well is very small. The minimum requirement is one infiltration well for 3937 m2. This means that the Yogyakarta aquifer is functioning very well. It has been reported by previous study that the permeability of the Yogyakarta aquifer is very high (Sudarmadji, 1999). Nature will percolate the rain water into the aquifer without any additional infiltration well. However, the decline of the groundwater still continues and need a solution.
NRECA model states that there are two steps that rain water would become
groundwater; 1) the infiltration into the subsurface layer of the ground, which is unsaturated layer, and 2) the percolation process from the unsaturated layer into the aquifer, which is saturated layer (Crawford, 1981). The second one has been proven that there is no blockage in the percolation process therefore the first one shall be solved. The impediment of the infiltration are 1) the impermeability of the ground as the result of human activities and 2) the natural moisture content of the surface ground during wet season rejects the rain water to infiltrate, and creates runoff.
The unit areas of study can be devided into microcatchment for analizing the
hydrology. A microcatchment is a small drainage basin with its own independent drainage system. An assessment to a single microcatchment on its hydrologic function can be made. How much water from the precipitation will fall into a single microcatchment. All water from the precipitation shall infiltrate into the ground with some release for maintaining the environment. This needs conservation facilities to be built. How many and how is the distribution of the conservation facilities shall be planned based on the spatial planning in the microcatchment.
An infiltration well shall accommodate rain that falls onto the roof of a
building, onto paved roads, and on other infrastructures that make the land become absolutely watertight. The plan, shall keep the principal, in which precipitation that falls onto a microcatchment shall be kept or infiltrate in the microcatchment itself.
Hargono et al. 17
Conclusion
The simple analysis using water requirement of 120 liter/capita/day results in water scarcity in unit area VI, VII, and XII throughout the year. Unit area VI and VII appear in any simple hydrology analysis in water scarcity status, or in a lighter criticality while other unit areas are in better conditions. These unit areas also appear in medium critical status as the worst status in the annual simple water balance analysis. The analysis applying rainfall-runoff model NRECA, using water requirement of 120 liter/capita/day also shows water scarcities of unit area VI and VII, while other unit areas are in better status. The same analysis using 50 liter/capita/day shows some water criticalities with no water scarcities, with unit areas VI and VII are in the worst status, which are very critical in September and October for unit area VI and October only for unit area VII.
The adequacy of annual precipitation provides the opportunity for conserving
the water by infiltrating the water as much as possible into the aquifer. If water requirement can be reduced to 50 liter/capita/day, no water scarcity will occur. Yogyakarta aquifer is in its extreme condition, with the maximum possible capacity in impounding water, and maximum capacity in releasing base flow to all rivers in the study area a whole year. The decline of groundwater table is due to excessive extraction of water by the inhabitants with very limited effort for recharging water into the aquifer. Another cause of the water decline is high moisture content in the ground surface layer that impedes water to infiltrate into the ground especially during wet season. This cause’s bigger part of rain water directly flows as surface runoff into the drainage system.
Groundwater conservation efforts should be implemented to overcome water
scarcity and the decline of the water table. The conservation efforts are based on 1) rainstorm management, in which rain water shall be considered as water resources, not water nuisance that shall be drained away; 2) the hydrology functions shall remain unchanged after development of the area of concern. The spatial model for the conservation of groundwater is therefore a map of unit areas divided into microcatchments to have a closer monitor and control of development and other human activities for not altering the hydrology function in the area of concern.
18 Journal of Geography and Earth Sciences, Vol. 2(2), December 2014
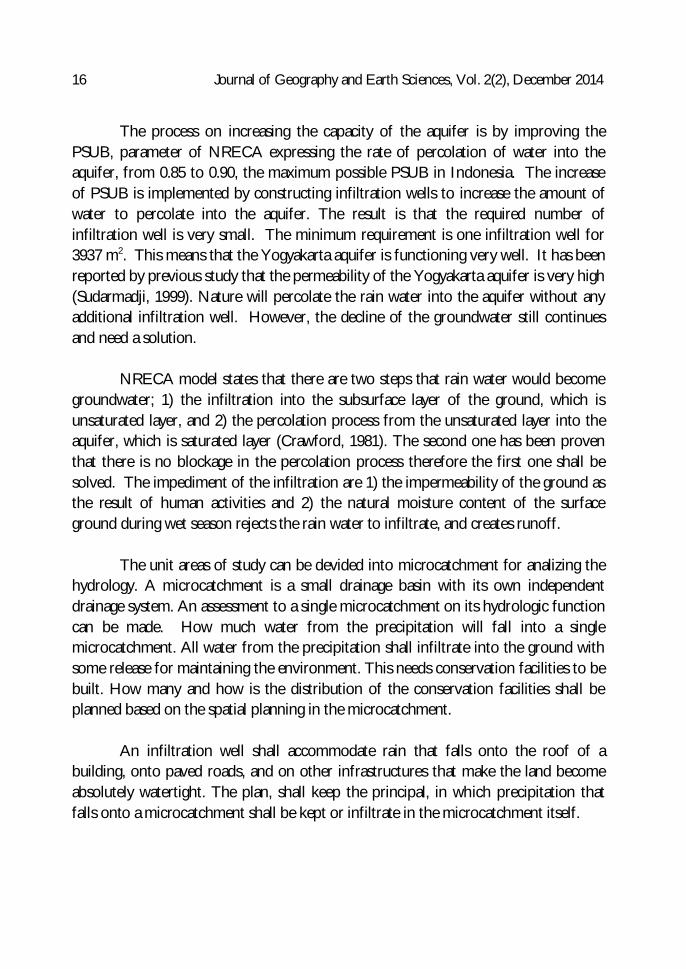
The unit area VII with its serious water criticality is chosen to have the conservation of ground water modeled (Figure 4). The unit area VII, as large as about 20 km2 is divided into small basins, named microcatchments. A microcatchment is a small drainage basin with its own independent drainage system. The boundary of this small basin is determined using the digital elevation mode (DEM). This digital process creates 35 microcatchments of various natural sizes out of unit area VII. A hydrology assessment is conducted on every microcatchment by applying rainfall-runoff model NRECA. The NRECA analysis results that the basin parameter of the research area is in its extreme condition. The percolation rate, PSUB is 0.85, more than maximum can be achieved in America, which is 0,80 but still smaller than the value in Indonesia, which is 0.90 (Adidarma et al., 1999). The GWF, the parameter indicating the rate for releasing base flow is also at its extreme value, which is 0.20, the minimum value. This value indicates that the aquifer is able to release the base flow year round.
Figure 4: Spatial Model for Ground Water Conservation, the unit area VII is devided into microcatchments, as units of conservation works.
Hargono et al. 19
Acknowledgement
This paper is part of the dissertation of Doctorate Program. The writer acknowledged University of Gadjahmada, Yogyakarta, Indonesia, the Professors and staff for the supervisions and supports.
The writer would like also to thank BBWS-SO, Balai Besar Wilayah Sungai
Serayu Opak, The Serayu-Opak River Basin Territory, Yogyakarta, Indonesia, the Head and all the staff for the data and all supports that have been provided.
The same acknowledgement is also expressed to the Head and staff of
Research Center for Water Resources, in Bandung, Indonesia, for the data and supports that have been provided. References BBWS-Serayu Opak, 2010, Pola Pengelolaan Sumberdaya Air Wilayah Sungai Progo Opak Serang,
Yogyakarta: Balai Besar Wilayah Sungai Serayu-Opak, Direktorat Jenderal Sumberdaya Air, Kementerian Pekerjaan Umum.
BPS DIY, 2010, Potensi Desa, Jakarta: Badan Pusat Statistik. Crawford, N. and Thurin, S.M., 1981, Hydrologic Estimates for Small Hydroelectric Projects,
NRECA Small Decentralized Hydropower (SDH) Program, Washington D.C. Department of Environmental Resources, 1999, Low Impact Development Design Strategies, An
Integrated Design Approach, Maryland, USA: Prince George’s County, Programs and Planning Division.
Gleick, P., 1996, Basic Water Requirements for Human Activities: Meeting Basic Needs, Water International (IWRA) 21.
Hatmoko W., Radhika, Amirwandi S., Fauzi, M., Firmansyah, R., Solihah, R., dan Fathoni, A., 2012a, Neraca Ketersediaan dan Kebutuhan Air pada Wilayah Sungai di Indonesia, Jakarta : Badan Penelitian dan Pengembangan Pekerjaan Umum, Kementerian Pekerjaan Umum.
MacDonald & Partners, Sir M, Binnie & Partners, Hunting Technical Services Ltd., 1984, Greater Yogyakarta Groundwater Resources Study, Groundwater Development Project (P2AT), Jakarta: DGWRD, Ministry of Public Works.
Nonner, J.C., 2010, Introduction to Hydrogeology 2nd Edition, London : CRC Press/Balkema. Putra, D.P.E., dan Baier, K, 2007, Impact of Urbanization on Groundwater Recharge – the Example
of the Indonesian Million City Yogyakarta, Yogyakarta : Gadjah Mada University, Geological Engineering.
Sartohadi, 2007, Terapan Geomorfologi dalam Pengelolaan Sumberdaya Air, Alami, Jurnal Air, Lahan, Lingkungan dan Mitigasi Bencana, volume 12 Nomor 1 Tahun 2007, Jakarta: Badan Pengkajian dan Penerapan Teknologi.

20 Journal of Geography and Earth Sciences, Vol. 2(2), December 2014 Sen, Z., 2009. Spatial Modelling Principles in Earth Sciences, Springer Science+Business Media
B.V. Sharma, R.H, dan Shakya, N.M., 2006, Hydrological Changes and Its Impacts on Water Resources of
Bagmati Watershed, Nepal, Journal on Hydrology (2006) 327, 315 – 322. Soetikno, Langgeng, WS., Widiyanto, Kurniawan, Andri, Purwanto,TH., 2007, Kerajaan
Merapi, Sumberdaya Alam & Daya Dukungnya, Yogyakarta: Badan Penerbit Fakultas Geografi (SPFG) Universitas Gadjah Mada.
Sudarmadji, 1991, Agihan Geografi Sifat Kimia Airtanah Bebas di Kotamadya Yogyakarta, Yogyakarta: Fakultas Geografi Universitas Gadjah Mada.
Taufiq, A., Edwin Rustandi, Pulung, DiahAffandi, 2014, Model SistemImbuhan Air Tanah untuk Pengendalian Banjir dan Land Susidence, Naskah Kebijakan Imbuhan Air Tanah, Bandung: Tim PenelitiBalai BHGK, Puslitbang Sumber Daya Air, Balitbang PU.