Tornillos at Vulcano: Clues to the dynamics of the hydrothermal system
18
This article appeared in a journal published by Elsevier. The attached copy is furnished to the author for internal non-commercial research and education use, including for instruction at the authors institution and sharing with colleagues. Other uses, including reproduction and distribution, or selling or licensing copies, or posting to personal, institutional or third party websites are prohibited. In most cases authors are permitted to post their version of the article (e.g. in Word or Tex form) to their personal website or institutional repository. Authors requiring further information regarding Elsevier’s archiving and manuscript policies are encouraged to visit: http://www.elsevier.com/copyright
Transcript of Tornillos at Vulcano: Clues to the dynamics of the hydrothermal system
This article appeared in a journal published by Elsevier. The attachedcopy is furnished to the author for internal non-commercial researchand education use, including for instruction at the authors institution
and sharing with colleagues.
Other uses, including reproduction and distribution, or selling orlicensing copies, or posting to personal, institutional or third party
websites are prohibited.
In most cases authors are permitted to post their version of thearticle (e.g. in Word or Tex form) to their personal website orinstitutional repository. Authors requiring further information
regarding Elsevier’s archiving and manuscript policies areencouraged to visit:
http://www.elsevier.com/copyright

Author's personal copy
Tornillos at Vulcano: Clues to the dynamics of the hydrothermal system
Vincenzo Milluzzo a,b, Andrea Cannata c,⁎, Salvatore Alparone c, Salvatore Gambino c,Margaret Hellweg d, Placido Montalto c,e, Laura Cammarata c, Iole Serena Diliberto f,Stefano Gresta a, Marcello Liotta f, Antonio Paonita f
a Dipartimento di Scienze Geologiche, Università di Catania, Corso Italia 57, 95129 Catania, Italyb Eni S.p.A. Divisione Exploration & Production, via Emilia 1, 20097 San Donato Milanese, Italyc Istituto Nazionale di Geofisica e Vulcanologia, Sezione di Catania, Piazza Roma 2, 95123 Catania, Italyd Berkeley Seismological Laboratory, University of California at Berkeley, Berkeley, CA, USAe Dipartimento di Ingegneria Elettrica, Elettronica e dei Sistemi, Università di Catania, Viale Andrea Doria 6, 95125 Catania, Italyf Istituto Nazionale di Geofisica e Vulcanologia, Sezione di Palermo, Via Ugo La Malfa 153, 90146 Palermo, Italy
a b s t r a c ta r t i c l e i n f o
Article history:Received 26 October 2009Accepted 29 September 2010Available online 13 October 2010
Keywords:tornillosvolcano seismologyVulcano Islandhydrothermal system
The number of tornillo events has recently increased at the Vulcano Island, Italy. While only 15 tornillos wererecorded during 2004–2006, 584 events occurred in 2007–2008. They were located just below La Fossa Craterat depths ranging between 0.1 and 1 km b.s.l. During two intervals in 2007–2008 increases in the number oftornillos took place at the same time as temperature and geochemical anomalies were observed. The spectralcontent of the tornillos, generally characterized by one–two dominant spectral peaks near 6 and 10 Hz, variedover time, with changes also noted in the quality factors. The simplest source mechanism proposed fortornillos is the free eigenvibration of a fluid volume within a crack or a conduit. Based on this model, wepropose a causal relationship between the temperature and geochemical anomalies and the increases innumbers of tornillos. As the amount of hydrothermal fluids increases during the anomalies, the upward flux offluids grows. The consequent changes in the pressure, temperature and dynamics of the system of cracks andconduits result in the generation of tornillos. Based on the fluid-filled crack/conduit model, the shallow depthsof the sources and the values of the quality factors, the fluid within the resonant crack/conduit was inferred tobe an ash–gas or water droplet–gasmixture. Moreover, the observed variations in the wavefield can be causedby small changes in the location of the source, in the source mechanism, or in the medium in between thesource and the seismic station. Finally, another peculiar feature of tornillos is the amplitude modulation thatcan be explained as a result of a beating phenomenon.
© 2010 Elsevier B.V. All rights reserved.
1. Introduction
Tornillo, the Spanish word for screw, refers to a class of seismicevents recorded in volcanic areas, which can last up to several minutes.They are characterized by decaying sinusoidal waveforms, screw-likeenvelope profiles and one, or at most a few, narrow spectral peak. InJapan several names have been used to refer to these particular signals:LC (long-coda) events; BS (banded-spectrum) events; SF (single-frequency) events; and T-type (similarity with a T-square) events(Gomez and Torres, 1997). Some authors include them in theclassification long period (LP) events, based both on the spectralcontent and proposed source process (e.g., Kumagai et al., 2002;Molinaet al., 2008). Tornillos (hereafter referred to as TRs) have been observedat many volcanoes such as Galeras (Gomez and Torres, 1997; Seidl andHellweg, 2003), Puracé (Arcila, 1996; Gomez and Torres, 1997),
Tongariro (Hagerty and Benites, 2003), Tatun Volcano Group (Linet al., 2005), Asama (Shimozuru andKagiyama, 1989), Cotopaxi (Molinaet al., 2008), Papandayan (Triastuty et al., 2006), Kuchinoerabujima(Triastuty et al., 2009) and Katmai National Park (DeAngelis, 2006). TRsare recorded during various stages of volcanic activity. They can precedeash eruptions, as at Galeras in 1992–1993 and Asama in 1983 (Gomezet al., 1999). In other cases they occur after eruptions (Tokachi Volcano,Japan, 1989), during seismic swarms (Meakan Volcano, Japan, 1982) orsimply during quiescence (Puracè Volcano, Colombia, 1994–1995;Tarumai Volcano, Japan, 1970–1971, 1975) (Gomez et al., 1999).Many different models have been proposed for the physical source ofTRs: fluid-filled cracks (Gil-Cruz and Chouet, 1997; Kumagai andChouet, 1999; Hagerty and Benites, 2003), lumped-parameter models(Julian, 1994), self-excited eddy shedding and turbulent slug flowoscillations (Hellweg, 2000). Moreover, according to Seidl and Hellweg(2003), TRs can be interpreted as the free vibration response of a fluid-filled cavity to a pressure pulse (linear model) or as the initial transientleading into a tremor sequence generated by a nonlinear, self-excitedoscillator (nonlinear model).
Journal of Volcanology and Geothermal Research 198 (2010) 377–393
⁎ Corresponding author.E-mail address: [email protected] (A. Cannata).
0377-0273/$ – see front matter © 2010 Elsevier B.V. All rights reserved.doi:10.1016/j.jvolgeores.2010.09.022
Contents lists available at ScienceDirect
Journal of Volcanology and Geothermal Research
j ourna l homepage: www.e lsev ie r.com/ locate / jvo lgeores

Author's personal copy
Vulcano is the southernmost member of the Aeolian Islands, avolcanic arc in the south-eastern Tyrrhenian Sea in the south of Italy(Fig. 1). It has been active in the last few centuries, erupting calc-alkaline and shoshonitic products (Barberi et al., 1974) and showingan explosive nature with frequent transitions from phreato-magmaticto magmatic activity (Mercalli and Silvestri, 1890; Barberi et al.,1988). A magmatic body was identified at a depth of 2–3 km below LaFossa Crater by geophysical and geochemical studies (Ferrucci et al.,1991; Clocchiatti et al., 1994; Nuccio and Paonita, 2001). Researchersalso agree on the presence of a hydrothermal system below La Fossacone (Chiodini et al., 1993, 1995; Nuccio et al., 1999; Paonita et al.,2002), whose thermodynamic conditions (temperature, pressure andcomposition) can show large temporal variations (Di Liberto et al.,2002). Since the last eruption in 1888–1890, volcanic activityproduces fumarolic emissions varying in intensity and temperatureover time. The fumaroles are mainly concentrated at La Fossa Crater(Fig. 1), where the fumarole fields, as well as the steam heated areas,have significantly expanded in the last 20 years (Bukumirovic et al.,1997; Boyce et al., 2007). Based on geochemical studies (Chiodiniet al., 1993; Nuccio et al., 1999), the fumarolic emissions of La FossaCrater are fed by fluids coming from both the magmatic and thehydrothermal system.
As in most active volcanoes around the world, Vulcano is alsocharacterized by an ample variety of seismic signals. Since all thesesignals at Vulcano are “transients,” that is, are limited in time, we call
them earthquakes or seismic events. Here the different types of theseearthquakes are briefly classified, mainly on the basis of waveformsand spectral contents, and their similarities or differences with themost recent classifications of seismic signals in volcanic areas (e.g.,Chouet, 1996; McNutt, 2005;Wassermann, 2009) are shown. The firstgroup of events comprises the volcano-tectonic (VT) earthquakes,characterized by high-frequency content (N5 Hz), low magnitude(generally M≤2.5) and clear P and S phases (Aubert and Alparone,2000). Similar to the VT earthquakes defined in other classifications(e.g., Wassermann, 2009), they are originated by shear failure causedby stress buildup and resulting in a slip on a fault plane. The otherearthquakes were associated with the shallow dynamics of thehydrothermal system (focal depth, generally b1 km b.s.l.) andgrouped into three classes (Alparone et al., 2010): long period,high-frequency and monochromatic events. The first ones arecharacterized by a spectral content mainly ranging between ~0.5and 5 Hz and are similar to the long period events (also called low-frequency events) observed at most volcanoes (Chouet, 1996;McNutt, 2005). They are associated with the resonance of cracks (orconduits) filled with hydrothermal fluid (Alparone et al., 2010). Thehigh-frequency events show a wide frequency range and seismicenergy between 5 and 25 Hz. They differ from the aforementioned VTearthquakes because of the emergent onsets and the poorly defined Pand S phases and thus are very similar to VT-B or shallow VT eventsintroduced by Wassermann (2009). Moreover, similar to the VT
Fig. 1. Sketch map of the Vulcano Island showing the location of the seismic stations belonging to the permanent andmobile networks and tiltmeter used in this work (see the key inthe lower left corner). In the upper right corner an inset with the location of the monitoring sites of CO2, fumarole temperature and soil temperature is reported.
378 V. Milluzzo et al. / Journal of Volcanology and Geothermal Research 198 (2010) 377–393

Author's personal copy
earthquakes, the high-frequency events are likely generated by thefracturing processes of rocks driven by hydrothermal fluid dynamics(Alparone et al., 2010). The monochromatic events are characterizedby sharp frequency peaks above 5 Hz and, similar to the long periodevents, result from the resonance of cracks (or conduits) filled withhydrothermal fluid (Alparone et al., 2010). Because of both frequencycontent (in the same range as high-frequency events and VTearthquakes) and source mechanism (shared with long periodevents) these events could not be classified into one of theaforementioned classes or into the classes individuated in thetraditional classifications. For this reason they were grouped into aseparated class. Finally, other events with very long duration (30–50seconds) and sharp spectral peaks above 5 Hz are recorded at Vulcanoand can be considered tornillos, similar to the aforementionedearthquakes, with the same peculiar long duration recorded in othervolcanoes. Hereafter, with the term volcano-seismic events we referindistinctly to all the above described earthquakes, with the exceptionof VT earthquakes.
Increases in the temperatures of the fumaroles and changes in thechemical composition of their emissions (mainly an increase in theCO2 flux and concentration), called temperature and geochemicalanomalies, respectively, occur at the same time as the number ofvolcano-seismic events increases (Granieri et al., 2006; Aubert et al.,2008; Inguaggiato et al., 2008; Alparone et al., 2010). The most recentanomalies were observed in 2004, 2005 and 2006 when TRs wereclearly identified for the first time at Vulcano (Alparone et al., 2010).There is broad agreement among researchers about the fact that bothseismic and geochemical anomalies are related to the increased inputsof magmatic fluids into the fumarolic system, whereas theirrelationship to unrest processes leading up to eruptions is still beingdebated (Barberi et al., 1991; Italiano and Nuccio, 1992; Bukumirovicet al., 1997; Nuccio et al., 1999; Nuccio and Paonita, 2001; Granieriet al., 2006).
The aim of this work is to study the TRs that occurred at Vulcano in2007–2008 in order to identify their main features and investigate thepossible physical processes that produce them. Moreover, we willanalyze the changes in the TRs' characteristics over time, which mayprovide information about the evolution of the hydrothermal system.In doing so, we will advantageously exploit the comparison of theseismic signals with the concurrent geochemical anomalies.
2. Data analysis
During 2007–2008, seismicity at Vulcano was monitored by apermanent network and mobile seismic stations (Fig. 1). Before 2007,the permanent network [operated by the Catania Section of IstitutoNazionale di Geofisica e Vulcanologia (INGV)], consisted of fouranalog, 3-component stations (IVCR, IVUG, IVPL and IVLT). Eachstation was equipped with short period geophones (Geotech S13, 1-scorner period) and acquired at a sampling rate of 100 Hz. Successive-ly, the sensors were replaced with digital 3-component broadbandNanometrics Trillium, with flat responses in the 40–0.01-s periodrange. The mobile network was operated jointly by the University ofCatania and INGV Catania and included five digital, 24-bit seismicstations (STZ1, STZ2, STZ3, STZ4, and STZ5), equipped with 3-component Lennartz LE-3D (20-s corner period). These stationswere deployed on the northern and southern rims of La Fossa (Fig. 1).Data from the mobile network were acquired at a sampling rate of125 Hz.
During 2007–2008, about 4000 volcano-seismic events wererecorded at Vulcano. According to the classification proposed byAlparone et al. (2010), most events belonged to the high-frequencyand monochromatic classes. Moreover, a large number of TRsoccurred. In this paper we focus on 584 TR events (four examplesare shown in Fig. 2). The TRs observed at Vulcano exhibit quasi-sinusoidal waveforms characterized by a long duration (30–50 s) due
to a very slowly decaying coda (Fig. 2). These events are characterizedby one, or at most a few, narrow spectral peak, at not necessarilyinteger harmonic frequencies. Moreover, we noted that some of theseevents exhibit amplitude modulation effects. The TRs occurrence ratewas not steady but varied significantly over time. The twomain increases occurred during July–November 2007 and August–December 2008 when the number of TRs increased from a few eventsper 10-day windows to over 30 (Fig. 3a). In the first increase somefluctuations in the number of events took place with two main peaksat the beginning of July and October. Conversely, the second increasewas more “regular” and was characterized by a gradual increaseculminating with a peak between the end of September and mid-October, followed by a fairly gradual decrease. Moreover, it is worthnoting that while many TR events were observed in 2007–2008, only15 TRs were recorded during the previous three years, 2004–2006(Alparone et al., 2010).
The variation of the TR number over time was compared with thedaily number of VT earthquakes, tiltmeter recordings, CO2 concen-tration of crater fumarolic emissions, fumarole and soil temperatures(Fig. 3). Very few VT earthquakes with epicenters within an 10-km-radius area centered at the Vulcano Island occurred during 2007–2008(Fig. 3b). Moreover, the seismic energy released by these VTearthquakes was very small and the maximum magnitude wasequal to 2.7. Finally, no clear relation between TR activity and VTearthquakes can be seen. Tilt recordings at SLT station (Fig. 1) showedonly slow long-term variations with no rapid (from hours to days)changes (Fig. 3c) that could suggest important and fast deformationphenomena of the volcanic system (see Gambino et al., 2007 for moredetails). The molar percentage of CO2 in some fumaroles of La FossaCrater (inset in Fig. 1) increased twice at the same time as the TRnumber increased. The first increase, taking place during the secondhalf of 2007, was more evident than the second one, occurring duringthe second half of 2008 (Fig. 3d). Fumarole and soil temperaturesduring 2007–2008 were measured by monitoring stations locatednear La Fossa Crater (Fig. 1). Fumarole temperature mainly changedfrom 300 up to 450 °C (Fig. 3e). The seasonal influence cannot accountfor the main temperature variations, daily variations are small andnegligible (b2 °C, not shown), while rainfall only caused intense butvery short-term disturbs in the time series (see sudden and briefdecreases in Fig. 3e and rainfall time series in Fig. 3g). Zonescharacterized by diffuse heat flux of hydrothermal origin (SteamHeated Soil; monitoring station MN in Fig. 1) showed surfacetemperatures ranging from background external values to boiling(Fig. 3f). In the steam heated soil, steam condenses below the soilsurface and this exothermic process warms up the soil more than theconductive and convective heat transfer. Similar to the concentrationof CO2, both fumarole and soil temperatures increased roughly at thesame time as TR activity increased (Fig. 3e and f). However, in 2008soil temperature increased inMarch, somemonths before the 2008 TRincrease.
To study the features of TRs, we performed: i) spectral analysis usingthe fast Fourier transform (FFT) and the Sompi method (Kumazawaet al., 1990); ii) cross-correlation analysis among the spectra;iii) polarization analysis; and iv) hypocentral location.
2.1. Spectral analysis
The spectral characteristics of the LP, VLP events and tornillosrecorded in volcanic areas are generally assumed to be related to thegeometry of the plumbing system and the features of the fluids itcontains (e.g., Chouet, 1996; Almendros et al., 2002; Kumagai et al.,2005). Thus, information about the frequency content of these eventsand its evolution over time is important for studying and monitoringthe dynamics of a volcanic system.
To study the variation of the TRs spectral features over time at theVulcano Island,weperformed twodifferent frequencydomain analyses:
379V. Milluzzo et al. / Journal of Volcanology and Geothermal Research 198 (2010) 377–393

Author's personal copy
FFT and Sompi analysis (Kumazawa et al., 1990, and references therein).Using the former we calculated one spectrum for each event from a20-second-long window recorded by the vertical component of stationIVCR. The window started at the onset of the event. We normalized thespectra of all the events occurring during one day and averaged them toobtain a daily average spectrum. These daily spectra were visualized aspseudo-spectrograms (Fig. 4b). The spectra averaging process isjustified by the fact that the TR spectral features generally remainsteady for a several days at a time, as suggested in Fig. 4c, showing thefrequency of the spectral peak with the highest amplitude extractedfrom the spectra of all the TRs. The FFT analysis shows that most of theTRs are characterized by two sharp spectral peaks at frequencies ofabout 6 and 10 Hz (Figs. 2 and 4b and c). A few events also exhibiteddominant spectral peaks at other frequencies such as 4, 8, 13 and 16 Hz(Figs. 2 and4c). The frequencies of the twomain peaks variedduring thetwo-year interval. For example, in August–September 2007 the peak at10 Hz gradually drifted toward lower frequencies (see “I” in Fig. 4b) andthen increased again (see “II” in Fig. 4b). Later, in March and August2008 the frequency of this peak decreased suddenly (see “III” and “IV” inFig. 4b). Moreover, this final change in the spectral content involvedbothdominant frequencypeaks and occurred at the end of August 2008,at the same time as the onset of an increasing trend in the number of theTRs (Fig. 4a). It is worth noting that the decreases in the TR frequencypeak observed in August–September 2007 and August 2008 took placeroughly at the same time as increases in the molar fraction of CO2 andfumarole and soil temperatures (Fig. 3d–f).
To obtain information about the decay of the TRs, we applied theSompi analysis (e.g., Kumazawa et al., 1990). In this method ofspectral analysis, a signal is deconvolved into a linear combination ofcoherent oscillations with decaying amplitudes (called wave ele-ments) and additional noise. In this approach we define a complexfrequency fc=f− ig that describes each wave element, where f is thefrequency, g is the growth rate and i is
ffiffiffiffiffiffiffiffi−1
p. The quality factor Q is
then given as −f/2 g. An amplitude value is also calculated for eachwave element. Generally, in order to represent a set of complexfrequencies, they are plotted on a 2D-plane with the f and g axes,called the f–g diagram. Wave elements scattering widely in the plotare considered to be noise, whilewave elements densely populated onthe theoretical frequency lines are considered to be the dominantspectral components of the signal (Hori et al., 1989). The amplitudeinformation (for details about the computation see Hori et al., 1989;Kumazawa et al., 1990) can be added by using a color scale for the dots(Fig. 2d). Such amplitude information can be useful to furtherdiscriminate noise and dominant spectral components of the signal.Indeed the former and the latter are generally characterized by smalland large amplitudes, respectively (Hori et al., 1989). A 10-second-long window from the recording of the vertical component of stationIVCR was analyzed for each TR event. The signal was filtered in twofrequency bands, 5–8 and 8–12 Hz, and the Sompi method wasapplied to each band. The frequency values obtained confirm theresults of the FFT analysis. Moreover, we noted that most of thequality factor values ranged between 20 and 400 in both frequency
Fig. 2. (a) Waveforms, (b) short time Fourier transform (STFT), (c) spectra and (d) f–g plots of four examples of TRs recorded by the vertical component of the IVCR station. TheSTFT was obtained by splitting the seismic signal in 2.56-second-long windows with a 50% overlap. The spectra and the f–g plots were calculated by using 20-second-long windows.The f–g plots were obtained for all the trial autoregressive (AR) orders 4–60. The color of the dots in (d) indicate the amplitude values of the wave elements (see color scale). Clustersof dots in (d) (encircled with solid ellipses) indicate dominant spectral components of the signal, scattered dots represent noise.
380 V. Milluzzo et al. / Journal of Volcanology and Geothermal Research 198 (2010) 377–393

Author's personal copy
bands (Fig. 4d and e). The time distribution of Q values, calculated forthe two frequency bands 5–8 and 8–12 Hz, showed no significantpattern (Fig. 4d and e). A decrease of the dispersion of the Q values forthe band 5–8 Hz can be noted in August 2008 (Fig. 4d), at the same
time as the frequency decreases from 6.4 to 5.9 Hz and the occurrencerate of events increases (Fig. 4a–c).
As aforementioned, 15 TRs were recorded during the previousthree years, 2004–2006. These events were mostly monochromatic,with a single frequency peak in the band 5.5–8.5 Hz and quality factorvalues ranging from 50 to 300. It is worth noting that all the TRs
Fig. 4. Characteristics of TRs observed at Vulcano. (a) Number of events calculatedduring 10-day-long windows. (b) Normalized pseudo-spectrogram obtained by thedaily average spectra of the TRs at the vertical component of IVCR (see text for details).(c) Frequency of the spectral peak with the highest amplitude at the verticalcomponent of IVCR by using 20-second-long windows, containing the first part of TRsignals. (d) and (e) Quality factor of the vertical component of the seismic signal of IVCRstation, filtered in the range 5–8 and 8–12 Hz, respectively, obtained by the Sompimethod for AR order equal to 2. The black areas in (b) indicate periods with no tornillorecordings. The white arrows and the roman numbers in (b) indicate the main changesin the frequency content. The two dashed horizontal lines in (c) indicate frequencyvalues of 6 and 10 Hz.
Fig. 3. (a) Number of TRs calculated during 10-day-long windows. (b) Daily number ofVT earthquakes, with epicenters within an 10-km-radius area centered at the VulcanoIsland (histogram) and corresponding strain release cumulative curve (dashed blackline). (c) Tilt measurements in the radial and tangential components at SLT station.(d) CO2 molar percentage in the fumaroles indicated in the upper right corner.(e) Temperature of fluids emitted from F5AT fumarole. (f) Soil temperature at MNstation recorded at depth of 0.3 m. (g) Daily amount of rainfall. The locations of thetiltmeter and the monitoring sites of CO2 and fumarole and soil temperatures arereported in Fig. 1. The monitoring sites of CO2 and fumarole and soil temperatures arerun by the Istituto Nazionale di Geofisica e Vulcanologia, Sezione di Palermo. Thefumarole and soil temperatures weremeasured by thermocouples (resolution±0.1 °C)equipped with stainless-steel probes resistant to corrosive acidic gases and dataloggercommunicating via radio to the data acquisition center.
381V. Milluzzo et al. / Journal of Volcanology and Geothermal Research 198 (2010) 377–393

Author's personal copy
occurred during the period November 2004–June 2005, with theexception of one event taking place on 31 December 2006. This TR,characterized by two spectral peaks with frequencies of 6.5 and10.1 Hz, was very similar to the events analyzed in this work.
2.2. Classification
The evolution of the spectral content of the TRs over time was alsoinvestigated to group the TRs into families with similar spectralcontent and better identify time spans characterized by differentfrequency content of TRs. This method entails the following steps:i) for each event a 20-second-long window starting at the onset of theevent was selected from the recording of the vertical component ofstation IVCR; ii) the spectra of these windows were obtained byaveraging spectra calculated on 10-second-long windows with 50%overlap; iii) a cross-correlationmatrix was obtained by comparing thespectra using cross correlation; iv) a master spectrumwas selected asthe spectrum that had the largest number of cross-correlationcoefficients above a fixed threshold; v) an average spectrum for thefamilywas found by stacking all spectra thatwerewell correlatedwiththe master spectrum (cross-correlation coefficientNfixed threshold);vi) this stacked spectrum was then cross correlated with the originaldataset, and all the spectra with a cross-correlation coefficient greaterthan the threshold were grouped into a family; vii) steps iv)–vi) wererepeated until the entire matrix was classified into distinct groups. Inthis procedure, overlap between clusterswas not allowed. In fact, oncea spectrum was assigned to a given group, it was removed from thecorrelation matrix. The threshold of the cross-correlation value was
fixed equal to 0.7. Thismethod is similar to that proposed byGreen andNeuberg (2006) and used to compare volcano-seismic or infrasonicevents (e.g., Patanè et al., 2008; Cannata et al., 2009a,b), but it isapplied in the frequency domain. Indeed, we are mostly interested ininvestigating the time evolution of the spectral content of the TRs, that,as aforementioned, may be related to variations of the plumbingsystemgeometry and the features of the fluids it contains (e.g., Chouet,1996; Almendros et al., 2002; Kumagai et al., 2005).
In all, for the fixed cross-correlation threshold of 0.7 eight familieswithmore than 20members were found, containingmore than 50% ofall the events (Fig. 5). This implies the repetitive excitation ofstationary sources in a nondestructive process. The families showspectra with different features: a monochromatic spectrum with afrequency peak at about 6 or 10 Hz and events with both these peaks.Moreover, as already noted by the spectral analysis (see Section 2.1),the stacked spectra show a time evolution of the spectral features.Indeed, during 2007 and in particular during the first TR numberincrease (July–November 2007), most events were characterized bythe dominant peak at about 10 Hz, as suggested by the timedistribution and stacked spectra of the families 4, 6, 7 and 8.Conversely, the stacked spectra of families 1 and 2, whose eventsmainly occurred during the second half of 2008, showed the dominantpeak at about 6 Hz.
2.3. Polarization analysis
In earthquake seismology polarization analysis is able to provideimportant information about thewave types composing thewavefield
Fig. 5. (a) Time distribution of the TRs belonging to the families obtained classifying their spectra by cross-correlation function. (b) Average spectra of the families of TRs.
382 V. Milluzzo et al. / Journal of Volcanology and Geothermal Research 198 (2010) 377–393

Author's personal copy
and the seismic source location and mechanism (e.g., Alessandriniet al., 1994). However, in volcano seismology polarization analysiscannot necessarily be used for these objectives because of the
heterogeneities and rough topography of volcanoes (e.g., Neubergand Pointer, 2000). On the other hand, as demonstrated by Hellweg(2003) analyzing TRs at Galeras, this kind of analysis can be useful to
Fig. 6. (a) Normalized pseudo-spectrogram, composed of all the spectra of the 584 TRs recorded at the vertical component of IVCR, calculated by 20-second-long windows. (b)–(g)Time variation of the polarization parameters of the TRs recorded by IVCR station and filtered in two frequency bands 5–8 and 8–12 Hz. The event number in temporal order isreported in the x-axis, the time elapsed from the onset to the tail of the event in the y-axis and the polarization parameters are depicted with the color scale. The polarizationvariations during a single event and from one event to another are reported along the vertical and horizontal directions, respectively. The black triangles and the Roman numbers attop of (b) indicate the events whose polarization parameters and particle motion are plotted in Figs. 7 and 8. The dashed black lines and the dates reported at top of (a) indicate thetime of the main spectral and polarization changes.
383V. Milluzzo et al. / Journal of Volcanology and Geothermal Research 198 (2010) 377–393

Author's personal copy
detect even very small variations in location and/or source mechanism.This is especially true for TRs at Vulcano because of their very highnumber during the studied 2-year-long period.
For each event, a 15-second-long window starting at the onset wasselected and filtered in two frequency bands 5–8 and 8–12 Hz.Polarization was determined from nonoverlapping 0.5-second-longwindows using eigenvalue decomposition of the covariance matrix ofthe three components of groundmotion (Jurkevics, 1988). Then,we notonly investigated the variation of the polarization parameters (azimuth,inclination and rectilinearity) from the onset to the tail of eachevent butalso noted polarization changes from one event to another. In Fig. 6b–gsuchvariations are graphed for the frequencybands 5–8 and 8–12 Hzbyusing plots with the event number in temporal order in the x-axis, thetime elapsed during the aforementioned 15-second-long windows inthe y-axis, and finally the polarization parameters reported with thecolor scale. The variations of the polarization parameters from the onsetto the tail of each event and the ones from one event to another areshown as vertical and horizontal color changes, respectively. In Fig. 6athe pseudo-spectrogram, composed of the spectra of the 584 TRsrecorded at the vertical component of IVCR, calculated by 20-second-longwindows, is also reported to compare thewavefield timevariationswith the spectral changes.
The polarization in the band 8–12 Hz was much more complicatedthan in the band 5–8 Hz and no clear patterns are present. By contrast,the band 5–8 Hz does exhibit some patterns.
Inclination and the rectilinearity coefficients were generallygreater than 60° and 0.6, respectively, and remained quite stableduring each event. In contrast, azimuth showed greater variationduring each individual event. On the basis of the azimuthal variationfrom the onset to the tail of each event, we subdivided the TRs intothree segments. The initial segment, comprising the onsets of the TRs,roughly 1 second long, was characterized by azimuths between 120°and 150° for the whole 2-year period. The second segment, againlasting about 1 second, showed values of about 350°, from thebeginning of 2007 through August 2008, with the exception of themonth of September 2007. In the remaining periods the azimuth inthis segment ranged between 30° and 60°. Finally, the third segment,comprising almost the entire tail of the events, exhibited azimuthvalues depending strictly on the period. Therefore, periods of steadypolarization values, reflecting the repetitive source mechanisms andlocation, alternated with important variations, highlighting changesover time of TRs mechanisms and/or locations. These changes tookplace at the same time as the spectral changes (Fig. 6a–d). Moreover,as previously mentioned, changes can also be noted within theindividual events.
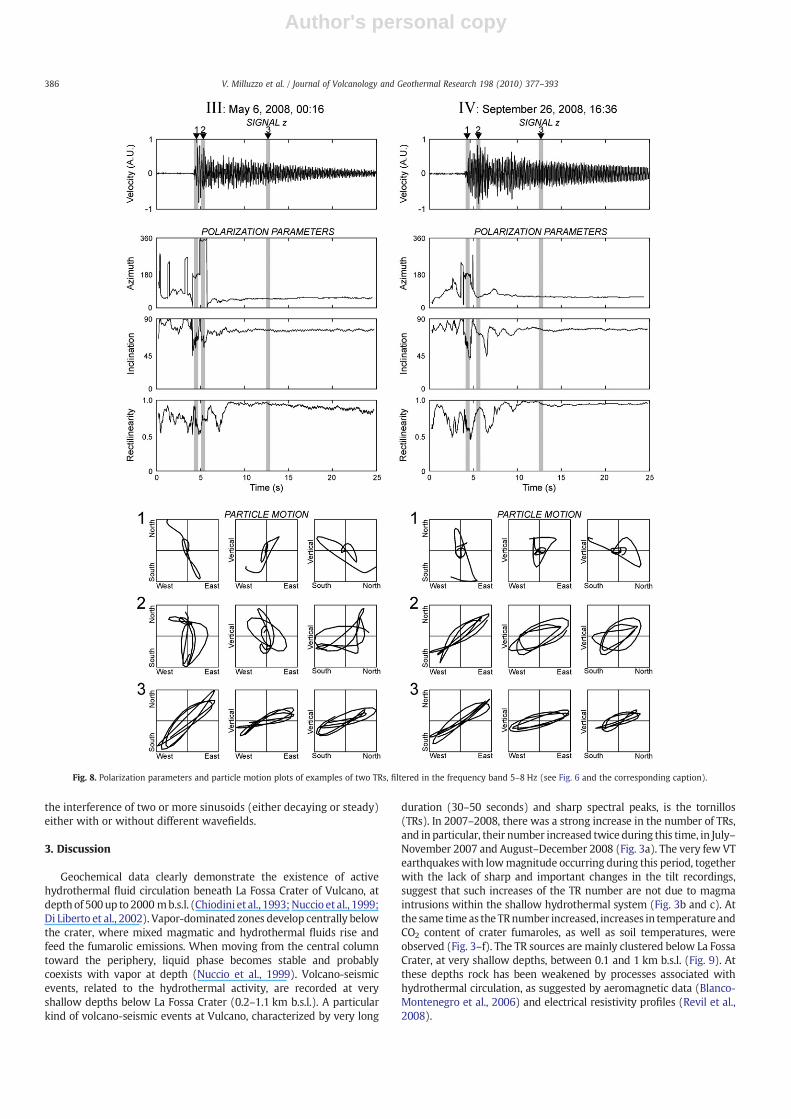
Based on the polarization analysis, the wavefield in the frequencyband 5–8 Hz of four representative TRs was investigated in detail(Figs. 7 and 8). Polarization parameters and particle motion wereobtained from 0.5-second-long windows. For each of these fourevents the particle motion was plotted for three windows coincidingwith the three segments of TRs described above.
This detailed analysis confirms that wavefield changes areobserved not only within individual TRs but also among differentones during the two years described here.
2.4. Source location
Using the program HYPOELLIPSE (Lahr, 1989) and the velocitymodel from Falsaperla et al. (1985), we located about 30 TRs, whichwere selected for their high signal to noise ratio and clear first arrivaland for having an azimuthal gap of less than 190°.
The spatial distribution of these events is shown in Fig. 9. We notethat the seismic sources were mainly clustered beneath La FossaCrater at very shallow depths, which ranged from 0.1 to 1 km b.s.l. Thefact that TRs are recorded clearly only at the stations nearest to LaFossa Crater also indicates that their source is shallow. These source
locations are consistent with the locations of the volcano-seismicevents recorded during 2004–2006 and reported in Alparone et al.(2010).
The mean horizontal and vertical uncertainties of 0.4 km do notallow us to reliably recognize significant time changes (if any) of theTR source locations.
2.5. Amplitude modulation
Several TRs at Vulcano exhibited amplitude modulation, aspreviously observed at other volcanoes (e.g., Galeras, Gomez andTorres, 1997). We focused on this phenomenon by analyzing two TRs,recorded on October 5, 2007 and February 29, 2008 (Fig. 10a–d). Thedominant spectral peaks for these two events were at 6.4 and 7.8 Hz,respectively (Fig. 10e–h). The former TR was mainly monochromatic(Fig. 10e and g), while the latter was also characterized bymany otherminor spectral peaks at 2.3, 6.2, 12.4, 13, and 13.7 Hz (Fig. 10f and h).Both RMS envelopes calculated at the three components andpolarization parameters clearly exhibited periodic oscillations(Fig. 11b and c, respectively). In order to quantitatively investigatethese periodicities, the spectra of the RMS and rectilinearitycoefficient time series were calculated using FFT (Fig. 11d). Theyexhibited spectral peaks at various frequencies. It is worth noting thatthe same modulation frequencies are present in both the polarizationand RMS time series. In particular, the spectrum of the former TR has asingle peak at 0.5 Hz, while the latter has several peaks, the dominantone at 1.6 Hz.
The observed amplitude modulation has at least two possibleexplanations: i) slow waves along the interface of the crack andii) beating. According to the former hypothesis, a slow wave, travellingalong a fluid-filled conduit (or crack), reaches the ends and is partiallyreflected back and partially transmitted into surrounding rocks (Joussetet al., 2003; Sturton, 2003). This process gives rise to subevents causingamplitude modulations (Sturton and Neuberg, 2006). Another expla-nation for amplitude modulation is beating, namely, the alternatingconstructive and destructive interference as two (or more) waveshaving slightly different frequencies interact with each other. In thiscase the frequency of amplitude modulation equals the differencebetween the initial two frequencies. In our case, the second explanationseems to be the most likely. In fact, the modulation frequency of theevent occurring on February 29, 2008 (1.6 Hz; Fig. 10b, d, f, and h) isequal to the difference between the spectral components at 6.2 and7.8 Hz. Although the event of October 5, 2007 ismainlymonochromatic,the same process can also be invoked for it. Indeed, the backgroundnoise, recorded before the onset of the TR showed a sharp spectral peakat 5.9 Hz (Fig. 10a, c, e, and g). The noise waves, interacting with the TRones peaking at 6.4 Hz, gave rise to the amplitude modulation at 0.5 Hz(Fig. 11). It is also worth noting that themodulation is especially visibleduring the tail of TR, when the event amplitude is lower. Assuming thatthe amplitude of noise remains steady during the whole TR duration,such a feature could be related to the lower amplitude differencebetweennoise and TR. Indeed, the amplitudemodulation due to beatingis more effective when the two frequency components have similaramplitude. Thus, this observation is a further indication of beatingbetween noise and TR waves as the cause of the observed amplitudemodulation in the TR.
In order to further investigate the amplitudemodulation caused bybeating and its effects on the polarization parameters, we calculatedsynthetic TRs by using the following equation (Seidl and Hellweg,2003):
x tð Þ = 1ω′
0e −q0 tð Þ sin ω′
0 t� � ð1Þ
where ω0′ is the angular frequency, and q0 is the ratio between theangular frequency and the quality factor multiplied by 2. We
384 V. Milluzzo et al. / Journal of Volcanology and Geothermal Research 198 (2010) 377–393

Author's personal copy
performed two different tests generating synthetic signals mimickingthe two previously analyzed TRs recorded on October 5, 2007 andFebruary 29, 2008. In the first test we calculated a synthetic TR eventwith a frequency of 6.4 Hz and summed it with a monochromaticnoise with a frequency of 5.9 Hz (Fig. 12a–c). As shown by the spectrain Fig. 12f, the amplitude ratio between synthetic TR and noise is equalto the one calculated for the recorded TR and noise (Fig. 10g). Thethree components of TR and noise were generated so as to becharacterized by different wavefield features. As observed in the eventrecorded on October 5, 2007 (Fig. 11a and b), the amplitudemodulation is evident, especially in the tail of the event, that is,when noise and TR show similar amplitudes (Fig. 12c and d). Likewise,the polarization parameters exhibit evident cyclic variations in the TRtail with the same modulation frequency as the RMS envelope(Fig. 12e). This behavior is very clear in the rectilinearity time series. Asimilar modulation pattern of polarization parameters was observed
in the recorded TR event (Fig. 11c). In the second test, we created a TRby summing two synthetic TRs with the same polarization featuresand frequency peak of 6.2 and 7.8 Hz (Fig. 13a–c). Also in this case, theamplitude ratio of these two synthetic TRs is equal to the one obtainedfor the two highest peaks of the recorded TR (Fig. 10h). Unlike the firsttest, the modulation of amplitude is also well evident at the onset ofthe event (Fig. 13c and d), as observed in the TR recorded on February29, 2008 (Fig. 11a and b). Moreover, also in this case, the polarizationparameters show periodic changes with the same modulationfrequency as the RMS envelope (Fig. 13e).
In summary, the synthetic tests showed that the beatingphenomena can be responsible for the modulated amplitudes ofboth the analyzed TRs recorded on October 5, 2007 and on February29, 2008. Furthermore, it was also clearly shown that the periodicvariations of the polarization parameters, sharing the same modula-tion frequency as the amplitude of the waveforms, were simply due to
Fig. 7. Polarization parameters and particle motion plots of examples of two TRs, filtered in the frequency band 5–8 Hz (see Fig. 6 and the corresponding caption).
385V. Milluzzo et al. / Journal of Volcanology and Geothermal Research 198 (2010) 377–393
Author's personal copy
the interference of two or more sinusoids (either decaying or steady)either with or without different wavefields.
3. Discussion
Geochemical data clearly demonstrate the existence of activehydrothermal fluid circulation beneath La Fossa Crater of Vulcano, atdepth of 500up to 2000 mb.s.l. (Chiodini et al., 1993;Nuccio et al., 1999;Di Liberto et al., 2002). Vapor-dominated zones develop centrally belowthe crater, where mixed magmatic and hydrothermal fluids rise andfeed the fumarolic emissions. When moving from the central columntoward the periphery, liquid phase becomes stable and probablycoexists with vapor at depth (Nuccio et al., 1999). Volcano-seismicevents, related to the hydrothermal activity, are recorded at veryshallow depths below La Fossa Crater (0.2–1.1 km b.s.l.). A particularkind of volcano-seismic events at Vulcano, characterized by very long
duration (30–50 seconds) and sharp spectral peaks, is the tornillos(TRs). In 2007–2008, there was a strong increase in the number of TRs,and in particular, their number increased twice during this time, in July–November 2007 and August–December 2008 (Fig. 3a). The very few VTearthquakes with lowmagnitude occurring during this period, togetherwith the lack of sharp and important changes in the tilt recordings,suggest that such increases of the TR number are not due to magmaintrusions within the shallow hydrothermal system (Fig. 3b and c). Atthe same time as the TRnumber increased, increases in temperature andCO2 content of crater fumaroles, as well as soil temperatures, wereobserved (Fig. 3–f). The TR sources are mainly clustered below La FossaCrater, at very shallow depths, between 0.1 and 1 km b.s.l. (Fig. 9). Atthese depths rock has been weakened by processes associated withhydrothermal circulation, as suggested by aeromagnetic data (Blanco-Montenegro et al., 2006) and electrical resistivity profiles (Revil et al.,2008).
Fig. 8. Polarization parameters and particle motion plots of examples of two TRs, filtered in the frequency band 5–8 Hz (see Fig. 6 and the corresponding caption).
386 V. Milluzzo et al. / Journal of Volcanology and Geothermal Research 198 (2010) 377–393

Author's personal copy
Different source models have been proposed for TRs by variousauthors. The simplest physical explanation is the free eigenvibrationsof a fluid volume within a crack or a conduit (e.g., Molina et al., 2008).The resonating fluid-filled crack model is able to explain the presenceof more than one spectral components at not equally spacedfrequencies as the ones observed in the TR taking place on February29, 2008 (Fig. 10b, d, f, and h). There are also nonlinear models inwhich TRs are initial transients leading into a tremor sequencegenerated by a nonlinear, self-excited oscillator (Seidl and Hellweg,2003). In any case, it is clear that fluids play an important role ingenerating TRs. In view of this, a relationship can be inferred betweenthe increases in the number of TR and the contemporaneous increasesin the molar fraction of CO2 and fumarole and soil temperatures(Fig. 3d–f). Indeed, geochemical anomalies are interpreted as due to anincreased involvementofmagma-derivedfluids in the feeding systemoffumaroles (Nuccio et al., 1999), which commonly accompanies notableincreases of the fumarolic fluid output (Bukumirovic et al., 1997;Granieri et al., 2006). Ultimately, it means that the hydrothermal fluidcirculation below the crater increases during the anomalies, especiallyin the vapor-dominated zone. The circulating fluids, in turn, penetratecracks and conduits producing more TRs. Similar interpretations weregiven by Triastuty et al. (2009) to explain the simultaneous increase ofboth the number of monochromatic events and fumarolic temperaturein 2006 at Kuchinoerabujima volcano: the intrusion of hydrothermalfluids into cracks may trigger monochromatic seismicity and fumarolictemperature increase.
If the TR source is assumed to be represented by free eigenvibra-tions of a fluid volume within a crack or a conduit (e.g., Molina et al.,2008), the characteristic properties of the resonator system can bedetermined from the complex frequencies (frequency f and qualityfactor Q) of the decaying harmonic oscillations. It has been recognizedthat the complex frequencies of long period events and TRs recordedat many volcanoes vary in time (e.g., Gomez and Torres, 1997;Kumagai and Chouet, 1999; Nakano and Kumagai, 2005; Patanè et al.,2008; Alparone et al., 2010). Their variations are of particularimportance for diagnosing the state of fluids within the resonator.Following Kumagai and Chouet (2000), the high Q values observed atVulcano (up to 400; Fig. 4d and e) may only be observed if thematerial in the crack is a mixture of ash and gas or a misty gascomposed of a water droplet–steam mixture with a gas–volumefraction larger than 90%. In order to obtain such long-lastingoscillations, a large velocity contrast between fluids and thesurrounding rock is required. The shallow depth of the TR sources(b1 km) does not allow us to exclude either two fluid kinds and alsosuggests that the fluids in the resonator should be related to thehydrothermal system. Two changes in the spectral features of the TRs,occurring in August–September 2007 and August 2008 consisted ofthe decreases of the frequency peaks (Fig. 4b and c). Similar frequencypeak changes were also observed at Galeras before eruptions andwere interpreted as the result of an increase in the gas fraction in thesource region (Torres et al., 1996; Gomez and Torres, 1997). This isbecause, when the gas content within a crack increases, the speed of
Fig. 9. Space distribution in map and sections of the locations of about 30 TRs (red dots). Blue triangles in map indicate the seismic stations.
387V. Milluzzo et al. / Journal of Volcanology and Geothermal Research 198 (2010) 377–393

Author's personal copy
sound and, therefore, the resonant frequencies decrease. At the sametime the impedance contrast between the region of fluids and thesurrounding rock increases, increasing the apparent Q value (Hagertyand Benites, 2003). However, the Q values calculated for TRs atVulcano do not allow recognizing any significant patterns, probablybecause of uncertainty and instability that derive from fittingexponentially decaying oscillations in the Sompi analysis. Such aproblem was also encountered in other works (e.g., Molina et al.,2004). Taking into account the two proposed kinds of fluid containedin the resonating crack and justifying the very high Q values, in thecase of misty gas the observed changes might be interpreted as anincrease of the liquid phase fraction (e.g., Kumagai and Chouet, 2000;Kumagai et al., 2002; Nakano and Kumagai, 2005). On the other hand,
in the case of a mixture of ash and gas, a relative increase of ashparticles may be responsible for decreases of the frequency peakvalues (e.g., Kumagai and Chouet, 2000; Molina et al., 2004). Thepresence of ash can be caused by either the fragmentation of magmain the conduit or the interactions magma–water or rock–water, whichare generally accompanied by explosive activity. Since there is noevidence of such phenomena at Vulcano during the studied period,the first proposed fluid mixture (water droplet–steam mixture)seems to be the most reasonable. It is also worth noting that the twoaforementioned decreases of frequency peaks, occurring in August–September 2007 and August 2008, took place at the same time as theincreases of temperature and CO2 content in fumaroles, as well soiltemperatures (Fig. 3d–f). Therefore, beyond changes in the relative
Fig. 10. TRs recorded on October 5, 2007 (a) and (c), and February 29, 2008 (b) and (d) at the vertical component of IVCR station. (e) and (f) Short time Fourier transform (STFT) of70-second-long seismic windows containing TR waveforms calculated by using 10-second-long sliding windows with 50% overlap. (g) and (h) Spectra of the signal windowscomprised in the gray areas in (c) and (d); see legend in the right upper corner.
388 V. Milluzzo et al. / Journal of Volcanology and Geothermal Research 198 (2010) 377–393

Author's personal copy
Fig.
11.(a)
TRsreco
rded
atthethreeco
mpo
nentsof
IVCR
stationon
Octob
er5,
2007
andFe
brua
ry29
,200
8.(b
)RM
Sen
velope
san
d(c)po
larization
parametersof
theTR
ssh
ownin
(a).(d
)Sp
ectraof
theRM
Sen
velope
san
drectiline
arityseries
show
nin
(b)an
d(c),resp
ective
ly.T
heRM
Sen
velope
swerecalculated
byus
ing0.25
-secon
d-long
mov
ingwindo
w,slid
ingby
onesample(0
.01s).T
hepo
larization
parameterswereco
mpu
tedby
theJurkev
icsmetho
d(Jurke
vics,1
988)
on0.25
-secon
d-long
mov
ingwindo
wsslidingby
0.01
s.
389V. Milluzzo et al. / Journal of Volcanology and Geothermal Research 198 (2010) 377–393

Author's personal copy
contribution of the components of the aforementioned mixtures, thesegeochemical and temperature variations can also modify the acousticproperties of the resonating crack. For instance, increasing the temper-ature and pressure of themisty gas can cause a decrease of the resonancefrequency and an increase of the quality factor (Kumagai and Chouet,2000). The changes in the spectra, alsohighlightedby thevariability of thestacked spectra obtained by the cross-correlation analysis (Fig. 5b),indicate important variations in the characteristics of the hydrothermalfluids and hence suggest an unsteady and dynamic hydrothermal system.This is also supportedby the increase in thenumber of events takingplaceat the same time as the spectral variations (Fig. 4). Changes in thefrequencies of the dominant peaks of TRs or LP events, accompanied bychanges in their occurrence rate, similar to those taking place at Vulcano,have also been observed at other volcanoes, such as Tongariro in 2001(Hagerty and Benites, 2003), Tungurahua in 2001 (Molina et al., 2004)and Galeras in 1993 (Gomez and Torres, 1997). At Tongariro no changesin the volcanic activity occurred after such variations in number andspectral features of TRs or LP events,whereas ash emission eruptions tookplace in the two other cases.
The spectral variations are accompanied by wavefield changes(Figs. 6–8). As also shown for other volcanoes (e.g., Galeras, Hellweg,2003; Tongariro, Hagerty and Benites, 2003), the wavefield associatedwith the TRs is complex, and its constituent wave types are difficult todetermine. In fact, several phenomena affect the polarization of seismic
waves, particularly at high frequencies, such as the reflection at the freesurface, topography, anisotropy along the path and scattering in themedium (Hellweg, 2003). In addition to the wavefield variations notedamong the different TRs, the particle motion also changes during thecourse of an individual event. As suggested by Hellweg (2003), if thesource of the seismic waves moves, the polarization observed at thereceiver will change as a function of time. In fact, small changes inthe location of the source may produce large variations in thepolarization parameters if high frequencies and their concomitantlyshort wavelength are taken into account. Therefore, both the observedwavefield variations (within a single event and among all the events)may be related to small changes in the source location. In view of thepossible migration of the vapor-dominated hydrothermal zones asresulting from the geochemical studies (see above), such changes in thesource location among all the events would seem reasonable. Forinstance, Giudicepietro et al. (2009) attributed the changes in thepolarization parameters of VLP events observed during the 2007eruption at Stromboli as an effect of slight changes in the depth of theVLP sources. On the other hand, another possible cause of the wavefieldvariations among the events could be the change in the sourcemechanism, that would impact the relative amount of radial andtransverse waves; e.g., given a crack as the source, transition fromlongitudinal to transversal modes of resonance could modify thewavefield, as would a change in the orientation of the crack. A similar
Fig. 12. (a) Synthetic tornillo, (b) synthetic monochromatic noise, (c) stacked tornillo and noise, (d) RMS envelopes, (e) polarization parameters and (f) spectra of the windows ofsignal comprised in the orange (tornillo) and green (noise) areas in (a) and (b), respectively (see Section 2.5 for details).
390 V. Milluzzo et al. / Journal of Volcanology and Geothermal Research 198 (2010) 377–393

Author's personal copy
interpretationwas also given by Lokmer et al. (2008) to explain changesin timeof thepolarizationparameters of LPevents atMt. Etnabefore andafter the 2004–2005 eruption. Finally, a variation of the medium inbetween the source and the seismic station could give rise to wavefieldmodifications. Also this explanation is reasonable since two of themainvariations, taking place in July 2007 and August 2008, occurred at thesame time as temperature and geochemical anomalies were observed.Such anomalies likely produced slight medium variations such asopening of fractures and changes of permeability, that can affect theseismic waves propagation.
Finally, some TRs exhibited amplitudemodulation (Fig. 11), similarto that observed at other volcanoes (Gomez and Torres, 1997). Basedon the spectral analysis performed on the seismic signals, as well as onRMS and polarization time series, this feature can be due to beats: twoor more slightly different frequencies interact with each other to giverise to alternating destructive and constructive interference. The twoneighboring frequency components can be present either both in theTR signals or in the TR signal and in the background noise.
4. Concluding remarks
Tornillos were recorded in large numbers at Vulcano during 2007–2008, while there were very few in the previous years (Alparone et al.,2010).
The following points summarize their main features and changesover time:
– The number of tornillos increased and their spectral featureschanged at the same time as temperature and geochemicalanomalies, suggesting that their occurrence is closely related tothe increased fluid circulation in a dynamic hydrothermal system.
– Spectral analyses reveal that tornillos were characterized by one ormore frequency peaks and by very high values of quality factor (upto 400). On the basis of such features and assuming a crack-likeresonating source, the fluid filling the resonator could be a mixtureof water droplets and gas. Moreover, the variations in the spectrasuggest changes in the characteristics of the fluids filling theresonating cracks, and hence are suggestive of an unsteady anddynamic hydrothermal system.
– Wavefield changes were observed at the same time as spectralvariations, not only within individual tornillos but also amongdifferent ones. Both such changes can be related to small variationsin the location of the source. Other possible causes of the wavefieldvariations among the tornillos can be variations in their sourcemechanism and/or in the medium in between the source and theseismic station.
– The amplitude modulations, observed in some tornillos, are due tobeating phenomena.
Fig. 13. (a) and (b) Synthetic tornillos, (c) stacked tornillos, (d) RMS envelopes, (e) polarization parameters and (f) spectra of thewindows of signal comprised in the orange (tornillo 1)and green (tornillo 2) areas in (a) and (b), respectively (see Section 2.5 for details).
391V. Milluzzo et al. / Journal of Volcanology and Geothermal Research 198 (2010) 377–393
Author's personal copy
Acknowledgements
Wethank Philippe Jousset and ananonymous reviewer for their veryhelpful suggestions. We also acknowledge the technical staff of INGV,Section of Catania, for their help in the installation and maintenance ofthe seismic networks, and the U.O. Fumarole Vulcano of the INGV,Section of Palermo, for making available geochemical data. Thisresearch has been supported by grants INGV-DPC 2005-2007 (ProjectV3_5_Vulcano) and INGV–DPC 2008–2010 (V1 UNREST) and a grantfrom the Università di Catania (Fondi di Ateneo 2008).
References
Alessandrini, B., Cattaneo, M., Demartin, M., Gasperini, M., Lanza, V., 1994. A simpleP-wave polarization analysis: Its application to earthquake location. Ann. Geophys. 5,883–897.
Almendros, J., Chouet, B., Dawson, P., Huber, C., 2002. Mapping the sources of theseismic wave field at Kilauea volcano, Hawai'i: Using data recorded on multipleseismic antennas. Bull. Seismol. Soc. Am. 92, 2333–2351.
Alparone, S., Cannata, A., Gambino, S., Gresta, S., Milluzzo, V., Montalto, P., 2010. Time-space variation of the volcano-seismic events at La Fossa (Vulcano, Aeolian Islands,Italy): New insights into seismic sources in a hydrothermal system. Bull. Volcanol.72, 803–816.
Arcila, M., 1996. Geophysical monitoring of the Puracé Volcano, Colombia. Ann. Geofis.39, 265–272.
Aubert, M., Alparone, S., 2000. Variation d'origine sismique du flux de chaleur convectifdans La Fossa de Vulcano (Italie). Earth Planet. Sci. 330, 603–610.
Aubert, M., Diliberto, S., Finizola, A., Chebli, Y., 2008. Double origin of hydrothermalconvective flux variations in the Fossa of Vulcano (Italy). Bull. Volcanol. 70, 743–751.
Barberi, F., Ferrara, G., Keller, J., Innocenti, F., Villari, L., 1974. Evolution of the Aeolian arcvolcanism. Earth Planet. Sci. Lett. 21, 269–276.
Barberi, F., Navarro, J.M., Rosi, M., Santacroce, R., Sbrana, A., 1988. Explosive interactionof magma with ground water: Insights from xenoliths and geothermal drillings.Rend. Soc. Ital. Mineralog. Petrol. 43, 901–926.
Barberi, F., Neri, G., Valenza, M., Villari, L., 1991. 1987–1990 unrest at Vulcano. ActaVulcanol. 1, 95–106.
Blanco-Montenegro, I., De Ritis, R., Chiappini, M., 2006. Imaging and modelling thesubsurface structure of volcanic calderas with high-resolution aeromagnetic data atVulcano (Aeolian Islands, Italy). Bull. Volcanol. 69, 643–659.
Boyce, A.J., Fulignati, P., Sbrana, A., Fallick, A.E., 2007. Fluids in early stage hydrothermalalteration of high-sulfidation epithermal systems: A view from the Vulcano activehydrothermal system (Aeolian Islands, Italy). J. Volcanol. Geoth. Res. 166, 76–90.
Bukumirovic, T., Italiano, F., Nuccio, P.M., 1997. The evolution of a dynamic geologicalsystem: The support of a GIS for geochemical measurements at the fumarole field ofVulcano, Italy. J. Volcanol. Geoth. Res. 79, 253–263.
Cannata, A., Montalto, P., Privitera, E., Russo, G., 2009a. Characterization and location ofinfrasonic sources in active volcanoes: Mt. Etna, September–November 2007.J. Geophys. Res. 114, B08308. doi:10.1029/2008JB006007.
Cannata, A., Hellweg, M., Di Grazia, G., Ford, S., Alparone, S., Gresta, S., Montalto, P.,Patanè, D., 2009b. Long period and very long period events at Mt. Etna volcano:Characteristics, variability and causality, and implications for their sources.J. Volcanol. Geoth. Res. 187, 227–249.
Chiodini, G., Cioni, R., Marini, L., 1993. Reactions governing the chemistry of craterfumaroles from Vulcano Island, Italy, and implications for volcanic surveillance.Appl. Geochem. 8, 357–371.
Chiodini, G., Cioni, R., Marini, L., Panichi, C., 1995. Origin of fumarolic fluids of VulcanoIsland, Italy and implications for volcanic surveillance. Bull. Volcanol. 57, 99–110.
Chouet, B., 1996. Long-period volcano seismicity: Its source and use in eruptionforecasting. Nature 380, 309–316.
Clocchiatti, R., Del Moro, A., Gioncada, A., Joron, J.L., Mosbah, M., Pinarelli, L., Sbrana, A.,1994. Assessment of a shallow magmatic system: The 1888–90 eruption, VulcanoIsland, Italy. Bull. Volcanol. 56, 466–486.
De Angelis, S., 2006. Analyses of unusual long-period earthquakes with extended codarecorded at Katmai National Park, Alaska, USA. Geophys. Res. Lett. 33, L07306.doi:10.1029/2005GL025581.
Di Liberto, V., Nuccio, P.M., Paonita, A., 2002. Genesis of chlorine and sulphur infumarolic emissions at Vulcano Island (Italy): Assessment of pH and redoxconditions in the hydrothermal system. J. Volcanol. Geoth. Res. 116, 137–150.
Falsaperla, S., Neri, G., Velardita, S., 1985. Struttura della crosta superiore dell'area delleisole Eolie. Rend. Osserv. Geofis. Reggino 29, 103–111 (in Italian).
Ferrucci, F., Gaudiosi, G., Milano, G., Nercessian, A., Vilardo, G., Luongo, G., 1991.Seismological exploration of Vulcano (Aeolian Islands, southern Tyrrhenian Sea):Case history. Acta Vulcanol. 1, 143–152.
Gambino, S., Campisi, O., Falzone, G., Ferro, A., Guglielmino, F., Laudani, G., Saraceno, B.,2007. Tilt measurements at Vulcano Island. Ann. Geophys. 50, 233–247.
Gil-Cruz, F., Chouet, B., 1997. Long-period events: The most characteristic seismicityaccompanying the emplacement and extrusion of a lava dome in Galeras Volcano,Colombia, in 1991. J. Volcanol. Geoth. Res. 77, 121–158.
Giudicepietro, F., D'Auria, L., Martini, M., Caputo, T., Peluso, R., De Cesare, W., Orazi, M.,Scarpato, G., 2009. Changes in the VLP seismic source during the 2007 Strombolieruption. J. Volcanol. Geoth. Res. 182, 162–171.
Gomez, D.M., Torres, R.A., 1997. Unusual low-frequency volcanic seismic events withslowly decaying coda waves observed at Galeras and other volcanoes. J. Volcanol.Geoth. Res. 77, 173–193.
Gomez, D.M., Torres, R.A., Seidl, D., Hellweg, M., Rademacher, H., 1999. Tornillo seismicevents at Galeras volcano, Colombia: A summary and new information frombroadband three-component measurements. Ann. Geofis. 42, 365–378.
Granieri, D., Carapezza, M.L., Chiodini, G., Avino, R., Caliro, S., Ranaldi, M., Ricci, T.,Tarchini, L., 2006. Correlated increase in CO2 fumarolic content and diffuseemission from La Fossa Crater (Vulcano, Italy): Evidence of volcanic unrest orincreasing gas release from a stationary deep magma body? Geophys. Res. Lett. 33,L13316. doi:10.1029/2006GL026460.
Green, D., Neuberg, J., 2006. Waveform classification of volcanic low-frequencyearthquake swarms and its implication at Soufrière Hills Volcano, Monserrat.J. Volcanol. Geoth. Res. 153, 51–63.
Hagerty, M., Benites, R., 2003. Tornillos beneath Tongariro Volcano, New Zealand.J. Volcanol. Geoth. Res. 125, 151–169.
Hellweg, M., 2000. Physical models for the source of Lascar's harmonic tremor.J. Volcanol. Geoth. Res. 101, 183–198.
Hellweg, M., 2003. The polarization of volcanic seismic signals: Medium or source?J. Volcanol. Geoth. Res. 128, 159–176.
Hori, S., Fukao, Y., Kumazawa, M., Furumoto, M., Yamamoto, A., 1989. A new method ofspectral analysis and its application to the Earth's free oscillations: The ‘Sompi’method. J. Geophys. Res. 94, 7535–7553.
Inguaggiato, S., Mazot, A., Diliberto, I.S., Rowet, D., Vita, F., Capasso, G., Bobrowshj, N.,Inguaggiato, C., Grassa, F., 2008. Preliminary estimate of CO2 budget dischargedfrom Vulcano Island. IAVCEI General Assembly, August 18-25 08 2008 Reykjavik.
Italiano, F., Nuccio, P.M., 1992. Volcanic steam output directly measured in fumaroles:The observed variations at Vulcano Island, Italy, between 1983 and 1987. Bull.Volcanol. 54, 623–630.
Jousset, P., Neuberg, J., Sturton, S., 2003. Modelling the time-dependent frequency contentof low-frequency volcanic earthquakes. J. Volcanol. Geoth. Res. 128, 201–223.
Julian, B.R., 1994. Volcanic tremor: Nonlinear excitation by fluid flow. J. Geophys. Res.99 (B6), 11859–11877.
Jurkevics, A., 1988. Polarization analysis of three-component array data. Bull. Seismol.Soc. Am. 78, 1725–1743.
Kumagai, H., Chouet, B., 1999. The complex frequencies of long-period seismicevents as probes of fluid composition beneath volcanoes. Geophys. J. Int. 138,F7–F12.
Kumagai, H., Chouet, B.A., 2000. Acoustic properties of a crack containing magmatic orhydrothermal fluids. J. Geophys. Res. 105, 25493–25512.
Kumagai, H., Chouet, B.A., Nakano, M., 2002. Temporal evolution of a hydrothermalsystem in Kusatsu-Shirane Volcano, Japan, inferred from the complex frequenciesof long-period events. J. Geophys. Res. 107. doi:10.1029/2001JB000653.
Kumagai, H., Chouet, B., Dawson, P., 2005. Source process of a long-period event atKilauea volcano, Hawai'i. Geophys. J. Int. 161, 243–254.
Kumazawa, M., Imanishi, Y., Fukao, Y., Furumoto, M., Yamamoto, A., 1990. A theory ofspectral analysis based on the characteristic property of a linear dynamic system.Geophys. J. Int. 101, 613–630.
Lahr, J.C., 1989. HYPOELLIPSE/VERSION 2.0: A computer program for determining localearthquake hypocentral parameters, magnitude and first motion pattern. U.S. Geol.Surv. Open-File Rep 89/116, 81 pp.
Lin, C.H., Konstantinou, K.I., Liang, W.T., Pu, H.C., Lin, Y.M., You, S.H., Huang, Y.P., 2005.Preliminary analysis of volcanoseismic signals recorded at the Tatun Volcano Group,northern Taiwan. Geophys. Res. Lett. 32, L10313. doi:10.1029/2005GL022861.
Lokmer, I., Saccorotti, G., Di Lieto, B., Bean, C.J., 2008. Temporal evolution of long-periodseismicity at Etna Volcano, Italy, and its relationships with the 2004–2005 eruption.Earth Planet. Sci. Lett. 266, 205–220.
McNutt, S.R., 2005. Volcanic seismology. Annu. Rev. Earth Planet. Sci. 32, 461–491.Mercalli, G., Silvestri, O., 1890. Le eruzioni dell'Isola di Vulcano incominciate il 3 agosto
1888 e terminate il 22 marzo 1890, relazione scientifica. Ann. Ufficio CentraleMetereol. Geodin. Ital., 10. 213 pp. (in Italian).
Molina, I., Kumagai, H., Yepes, H., 2004. Resonances of a volcanic conduit triggered byrepetitive injections of an ash-laden gas. Geophys. Res. Lett. 31, L03603.doi:10.1029/2003GL018934.
Molina, I., Kumagai, H., Garcia-Aristibal, A., Nakano, M., Mothes, P., 2008. Source processof very-long-period events accompanying long-period signals at Cotopaxi Volcano,Ecuador. J. Volcanol. Geoth. Res. 176, 119–133.
Nakano, M., Kumagai, H., 2005. Response of a hydrothermal system to magmatic heatinferred from temporal variations in the complex frequencies of long-period eventsat Kusatsu–Shirane Volcano, Japan. J. Volcanol. Geoth. Res. 147, 233–244.
Neuberg, J., Pointer, T., 2000. Effects of volcano topography on seismic broad-bandwaveforms. Geophys. J. Int. 143, 239–248.
Nuccio, P.M., Paonita, A., 2001. Magmatic degassing of multicomponent vapors andassessment of magma depth: Application to Vulcano Island (Italy). Earth Planet. Sci.Lett. 193, 467–481.
Nuccio, P.M., Paonita, A., Sortino, F., 1999. Geochemical model of mixing betweenmagmatic and hydrothermal gases: The case of Vulcano Island (Italy). Earth Planet.Sci. Lett. 167, 321–333.
Paonita, A., Favara, R., Nuccio, P.M., Sortino, F., 2002. Genesis of fumarolic emissions asinferred by isotope mass balances: CO2 and water at Vulcano Island, Italy. Geochim.Cosmochim. Acta 66, 759–772.
Patanè, D., Di Grazia, G., Cannata, A., Montalto, P., Boschi, E., 2008. The shallowmagma pathway geometry at Mt. Etna volcano. Geochem. Geophys. Geosyst. 9.doi:10.1029/2008GC002131.
Revil, A., et al., 2008. Inner structure of La Fossa di Vulcano (Vulcano Island, southernTyrrhenian Sea, Italy) revealed by high-resolution electric resistivity tomography
392 V. Milluzzo et al. / Journal of Volcanology and Geothermal Research 198 (2010) 377–393

Author's personal copy
coupled with self-potential, temperature, and CO2 diffuse degassing measure-ments. J. Geophys. Res. 113, B07207. doi:10.1029/2007JB005394.
Seidl, D., Hellweg, M., 2003. Parameterization of multichromatic tornillo signalsobserved at Galeras Volcano (Colombia). J. Volcanol. Geoth. Res. 125, 171–189.
Shimozuru, D., Kagiyama, T., 1989. Some significant features of pre-eruption volcanicearthquakes. In: Latter, J. (Ed.), Volcanic Hazards. Springer, Berlin, pp. 504–512.
Sturton, S., 2003. Modelling volcanic earthquakes and tremor. Unpublished PhD thesis,University of Leeds, 229 pp.
Sturton, S., Neuberg, J., 2006. The effects of conduit length and acoustic velocity on conduitresonance: Implications for low-frequency events. J. Volcanol. Geoth. Res. 151,319–339.
Torres, R., Gomez, D., Narvaez, L., 1996. Unusual seismic signals associated with theactivity at Galeras volcano, Colombia, from July 1992 to September 1994. Ann.Geofis. 39, 299–310.
Triastuty, H., Iguchi, M., Tameguri, T., 2006. Source mechanism of monochromatic andlow-frequency events at Papandayan Volcano, West Java, Indonesia. Indonesian J.Phys. 17, 63–72.
Triastuty, H., Iguchi, M., Tameguri, T., 2009. Temporal change of characteristics ofshallow volcano-tectonic earthquakes associated with increase in volcanic activityat Kuchinoerabujima Volcano, Japan. J. Volcanol. Geoth. Res. 187, 1–12.
Wassermann, J., 2009. Volcano Seismology. In: Bormann, P. (Ed.), New manual ofseismological observatory practice. IASPEI 42 pp. doi:10.2312/GFZ.NMSOP_r1_ch13.
393V. Milluzzo et al. / Journal of Volcanology and Geothermal Research 198 (2010) 377–393