Production of reduced graphene oxide via hydrothermal ...
20
ORIGINAL PAPER Production of reduced graphene oxide via hydrothermal reduction in an aqueous sulphuric acid suspension and its electrochemical behaviour William Ignatius Hayes & Paul Joseph & Muhammad Zeeshan Mughal & Pagona Papakonstantinou Received: 14 May 2014 /Revised: 21 June 2014 /Accepted: 24 June 2014 # Springer-Verlag Berlin Heidelberg 2014 Abstract Widespread availability of fuel cells is being de- layed due to the scarcity and high expense of precious metal catalysts, which presently provide the most efficient oxygen reduction reaction (ORR). Research has shown efficient electrocatalysis towards ORR from carbon materials offers a possible alternative to precious metal catalysts. Increasing focus is being given to the provision of graphene by the reduction of graphene oxide (GO) as a facile method for possible up-scaled production. Presented is a novel method for the production of electrocatalytic graphene-like material, involving the hydrothermal reduction of GO suspended in 0.1 M sulphuric acid (denoted as rGO H 2 SO 4 ). The rGO H 2 SO 4 sample provides a more efficient electron transfer during ORR than GO reduction in hydrazine (denoted as rGO N 2 H 4 ), a commonly employed, but toxic reducing agent. The overall current observed from the rGO H 2 SO 4 preparation is similar to that provided by rGO N 2 H 4 during diffusion- controlled linear sweep voltammetry analysis. Oxygen reduc- tion catalysis of the rGO H 2 SO 4 sample is seen to be promoted by the incorporation of sulphur, along with the high level of surface defects created after GO reduction. The diffusion- dependent conditions of cyclic voltammetry analysis confirms a pseudocapacitive response from the rGO preparations. The stability of this pseudocapacitance is significant for all reduced graphene oxide (rGO) samples discussed, opening the possible dual application of both electrical power genera- tion and power storage capabilities. Keywords Reduced graphene oxide . Hydrothermal reduction . Oxygen reduction reaction . Pseudocapacitance . Alkaline fuel cell . Supercapacitor Introduction The production of graphite oxide from graphite has been possible for the last 150 years [1]. Hummer’ s method pro- duces graphite oxide that is susceptible to the intercalation of aqueous solutions [2] causing the carbon lattice layers to expand. The carbon atoms bound to an epoxy or a hydroxyl group mostly are the sites of defective sp 3 carbon formation after oxidation [3], inferring an interruption of the carbon lattice sp 2 structure [4, 5]. The fraction of sp 2 carbon in fully oxidised graphene oxide is ~0.80 [6], with ~38 % of carbon atoms in a GO preparation consisting of C–O bonds of epoxy and hydroxyl groups at the basal plane [6]. After GO reduc- tion, the oxygen content dramatically decreases [3, 6, 7], together with an increase in conductivity [8–10]. Some of the most common chemicals used for reduction of graphene oxide have been sodium borohydride and hydrazine [9, 11–13]. Graphene oxide reduced by hydrazine has a higher resistance than graphene produced via other chemically based methods, such as sodium borohydride [9, 14]. Hydrazine is a potent antioxidant which effectively scavenges the abundant oxygen functional groups present at the surface of carbon lattices [15]. The main types of reduction process employed in reducing graphene oxide involve thermal or chemical treatment. Chem- ical processing does not presently allow the level of GO reduction to be easily controlled. Synergistic application of Electronic supplementary material The online version of this article (doi:10.1007/s10008-014-2560-6) contains supplementary material, which is available to authorized users. W. I. Hayes (*) : M. Z. Mughal : P. Papakonstantinou School of Engineering, University of Ulster at Jordanstown, Shore Road, Newtownabbey, BT37 0QB Northern Ireland, UK e-mail: [email protected] P. Joseph School of the Built Environment, University of Ulster at Jordanstown, Shore Road, Newtownabbey, BT37 0QB Northern Ireland, UK J Solid State Electrochem DOI 10.1007/s10008-014-2560-6
-
Upload
khangminh22 -
Category
Documents
-
view
3 -
download
0
Transcript of Production of reduced graphene oxide via hydrothermal ...

ORIGINAL PAPER
Production of reduced graphene oxide viahydrothermal reduction in an aqueous sulphuric acid suspensionand its electrochemical behaviour
William Ignatius Hayes & Paul Joseph &
Muhammad Zeeshan Mughal &Pagona Papakonstantinou
Received: 14 May 2014 /Revised: 21 June 2014 /Accepted: 24 June 2014# Springer-Verlag Berlin Heidelberg 2014
Abstract Widespread availability of fuel cells is being de-layed due to the scarcity and high expense of precious metalcatalysts, which presently provide the most efficient oxygenreduction reaction (ORR). Research has shown efficientelectrocatalysis towards ORR from carbon materials offers apossible alternative to precious metal catalysts. Increasingfocus is being given to the provision of graphene by thereduction of graphene oxide (GO) as a facile method forpossible up-scaled production. Presented is a novel methodfor the production of electrocatalytic graphene-like material,involving the hydrothermal reduction of GO suspended in0.1 M sulphuric acid (denoted as rGO H2SO4). The rGOH2SO4 sample provides a more efficient electron transferduring ORR than GO reduction in hydrazine (denoted asrGO N2H4), a commonly employed, but toxic reducing agent.The overall current observed from the rGOH2SO4 preparationis similar to that provided by rGO N2H4 during diffusion-controlled linear sweep voltammetry analysis. Oxygen reduc-tion catalysis of the rGOH2SO4 sample is seen to be promotedby the incorporation of sulphur, along with the high level ofsurface defects created after GO reduction. The diffusion-dependent conditions of cyclic voltammetry analysis confirmsa pseudocapacitive response from the rGO preparations. Thestability of this pseudocapacitance is significant for all
reduced graphene oxide (rGO) samples discussed, openingthe possible dual application of both electrical power genera-tion and power storage capabilities.
Keywords Reduced graphene oxide . Hydrothermalreduction . Oxygen reduction reaction . Pseudocapacitance .
Alkaline fuel cell . Supercapacitor
Introduction
The production of graphite oxide from graphite has beenpossible for the last 150 years [1]. Hummer’s method pro-duces graphite oxide that is susceptible to the intercalation ofaqueous solutions [2] causing the carbon lattice layers toexpand. The carbon atoms bound to an epoxy or a hydroxylgroup mostly are the sites of defective sp3 carbon formationafter oxidation [3], inferring an interruption of the carbonlattice sp2 structure [4, 5]. The fraction of sp2 carbon in fullyoxidised graphene oxide is ~0.80 [6], with ~38 % of carbonatoms in a GO preparation consisting of C–O bonds of epoxyand hydroxyl groups at the basal plane [6]. After GO reduc-tion, the oxygen content dramatically decreases [3, 6, 7],together with an increase in conductivity [8–10]. Some ofthe most common chemicals used for reduction of grapheneoxide have been sodium borohydride and hydrazine [9, 11–13].Graphene oxide reduced by hydrazine has a higher resistancethan graphene produced via other chemically based methods,such as sodium borohydride [9, 14]. Hydrazine is a potentantioxidant which effectively scavenges the abundant oxygenfunctional groups present at the surface of carbon lattices [15].
The main types of reduction process employed in reducinggraphene oxide involve thermal or chemical treatment. Chem-ical processing does not presently allow the level of GOreduction to be easily controlled. Synergistic application of
Electronic supplementary material The online version of this article(doi:10.1007/s10008-014-2560-6) contains supplementary material,which is available to authorized users.
W. I. Hayes (*) :M. Z. Mughal : P. PapakonstantinouSchool of Engineering, University of Ulster at Jordanstown, ShoreRoad, Newtownabbey, BT37 0QB Northern Ireland, UKe-mail: [email protected]
P. JosephSchool of the Built Environment, University of Ulster atJordanstown, Shore Road, Newtownabbey, BT37 0QB NorthernIreland, UK
J Solid State ElectrochemDOI 10.1007/s10008-014-2560-6
multiple chemical reductants, such as sodium borohydride(NaBH4) and hydroquinone [16], can aid in the enhanceddelivery of functionalised graphitic material from reducingGO. The mechanism of hydroquinone reduction of grapheneoxide is suggested to be because of the loss of one H+ ionproviding monophenolate or two H+ ions resulting in adiphenolate ion [15, 17]. However, the toxic nature of hydra-zine and sodium borohydride could render a high disposal costduring industrial delivery of reduced graphene oxide.Methods of thermal GO reduction are continually being eval-uated to expedite the route to an effective mass productionmethod for graphene [18–22]. Thermal reduction of GO hasbeen obtained by varying the ambient gas (argon, hydrogen,nitrogen, ammonia, ultra-high vacuum) or through a variationin the heating source [3, 18, 22–29]. The degree of GOreduction can be adjusted by varying the heating temperatureand treatment duration. Exfoliation by thermal expansion ofGO to deliver functionalised graphene sheets is dependent onthe decomposition rate of the oxygen groups [30]. When thedecomposition rate of the epoxy and hydroxyl groups exceedsthe diffusion rate of the gases released from the thermalreduction treatment, a positive pressure is exerted betweenthe carbon lattice layers. When this pressure exerts a strongerforce than the van derWaals forces binding the stacked carbonlattice layers, exfoliation occurs, providing few to single layerfunctionalised graphene [30]. The main drawback of thermal-ly reduced GO is the high energy requirements, which inhibitup-scaling of a GO reduction process to an industrial level.
Hydrothermal reduction is a process whereby the thermaltreatment of GO is completed at high pressure within a sealedvessel. The pH and temperature of a GO suspension influ-ences structure and behaviour of the final rGO product[31–33]. Other work has included the application of sulphuricacid to assist the reduction of GO by NaBH4 [34]. Theaddition of sulphuric acid into GO solvent suspensions (N,N′-dimethylformamide (DMF), dimethyl sulfoxide (DMSO))has inferred significant electrochemical enhancement of theresultant rGO product produced at room pressure [35]. Thereduction of GO by pure sulphur is due to a reaction withhydrogen sulphide (H2S) and sulphurous acid (H2SO3), whichare reducing agents found from a sulphur solution [36]. Com-plete GO reduction by pure sulphur is difficult to achieve [36].GO reduction has resulted in graphene that is particularlyeffective towards energy storage, facilitated by a highsupercapacitive behaviour [37]. Developments have alsohighlighted the effectiveness of rGO as an electrocatalyst forORR [36, 38]. The reduction of GO by hydrazine is observedto cause the incorporation of nitrogen into the graphene latticestructure, along with a decrease in the oxygen functionalgroups, which assist in promotion of electrocatalysis [11,39]. The presence of nitrogen results from the formation ofhydrazides and hydrazones, which in turn are derived duringthe interaction of hydrazine with lactones, anhydrides and
quinone derivatives present at the graphene oxide surface[15].
The thermal reduction of GO can successfully deliversingle graphene sheets [3], but a minimum temperature re-quirement is estimated to be above 550 °C at room pressure[30]. GO reduction in the present study is completed inaqueous solution, as the hydrophilicity of GO allows a highdegree of solution intercalation between the carbon latticelayers. This facilitates a high contact surface area duringrGO production [36, 40]. Also, the temperature is kept rela-tively low during hydrothermal treatment, assisting in theenergy efficient provision of graphene. The novelty of thisstudy lies in the application of an aqueous sulphuric acidsolution during hydrothermal treatment, providing rGOwhichexhibits significant ORR catalysis.
Experimental
Graphene oxide production
Graphene oxide was prepared via a modified Hummer’smethod [41–43]. Briefly, mixing of graphite (2.5 g) was donewith sodium nitrate (NaNO3) (2 g), concentrated sulphuricacid (70 ml) and potassium permanganate (KMnO4) (10 g).The resultant mixture was heated to 50 °C for 6 hours, follow-ed by overnight cooling and further subsequent heating to35 °C. After cooling, a further portion of KMnO4 (10 g) wasadded and the reaction mixture was heated to 35 °C overnight.This solution was then cooled to room temperature allowingthe safe addition of hydrogen peroxide (H2O2) (3 ml of30 wt.%). Settling for 5 days assured cessation of the reduc-tion reaction. The reaction sludge was isolated via centrifuga-tion (3,000 rpm for 30 minutes) and re-suspended a furtherfour times in 3 wt.% sulphuric acid and 0.5 wt.% hydrogenperoxide. The isolated GO sludge was suspended in distilledwater repeatedly until pH ~3 was obtained. The resultantproduct was then suspended in distilled water (1 mg ml−1)and sonicated for 5 hours to ensure sufficient exfoliation tographene oxide. Afterwards, the GO solution was centrifugedat 3,000 rpm for 30 minutes to isolate the graphene oxideparticulates. The supernatant was decanted after centrifugation,allowing the graphene oxide to remain as a moist particulatesludge. This graphene oxide sludge was then freeze-dried tofacilitate drying, while preventing coagulation of the particles.The freeze-dried graphene oxide powder was then used forassessment of the proposed hydrothermal reduction processes.
Reduction of graphene oxide
Reduction of freeze-dried GO was carried out at 190 °C for12 h at high pressure in an air-tight general purposepressure vessel (Parr Instruments, USA; Part No.
J Solid State Electrochem
236HC10TCT316121402; Serial No. 26905). The hot plateassembly controls the temperature of the internal hydrother-mal chamber via an in -situ thermostat. All GO suspensionswere sonicated for 30 minutes and then placed in a Tefloncontainer and covered with a Teflon lid. The Teflon containerwas then placed in the pressure vessel to reduce the GO at highpressure. The reduction suspensions were prepared with2 mg ml−1 of GO in distilled water with a pH 3.8 (denotedas rGO DI H2O) and 0.1 M sulphuric acid with a pH 1.16(denoted as rGO H2SO4), respectively, at high pressure(180 psi). An additional reduction was carried out in thepresence of hydrazine and was used as a positive control tofacilitate comparison to a known effective reduction treat-ment. For this control sample, GO (1 mgml−1) was suspendedin 0.33 M hydrazine aqueous solution and heated in thepressure vessel (190 psi) at 190 °C for 12 hours (denoted asrGO N2H4). After hydrothermal reduction in the requiredmedium, cleaning of the rGO powder was carried out. Atypical cleaning procedure involved the sonication of therGO suspension after hydrothermal treatment for 5 minutes.This was then centrifuged for 30 minutes at 3,000 rpm. Thesupernatant was decanted, and the rGO pellet was suspendedin ethanol. The sample was sonicated and suspended as pre-viously mentioned. This re-suspension in ethanol was follow-ed by three repetitive sonication cycles. The rGO was thendried over night at 40 °C.
Catalyst coating preparation
Catalyst inks were prepared by adding catalyst powder (5 mg)to a 1:20 dilution of Nafion 117 in DMF (1 ml). Homogeneitywas assured via sonication for 15 minutes. Pipetting was usedto prepare a 0.424 mg cm−2 coating of rGO on a glassy carbon(GC) rotating disc electrode (RDE) tip (BASi Analytical; 3-mm diameter disc). Measurements of platinum nominally20 % on carbon black (Pt/C) were carried out on a0.283 mg cm−2 coating, also drop-dried onto a glassy carbonelectrode (GCE) disc to allow comparison to a known andsuccessful ORR catalyst. The deposited catalyst ink was grad-ually dried under an infrared (IR) lamp, forming a sufficientlyadhered catalyst coating to the GCE disc.
Electrochemical characterisation
All electrochemical analysis was recorded on a software-controlled Autolab PGSTAT20 potentiostat/galvanostat sys-tem (Eco-Chemie, The Netherlands). The measurement cellcomprised of a GCE RDE tip as a working electrode with asilver/silver chloride (Ag/AgCl) reference electrode and plat-inum (Pt) wire as a counter electrode. Voltammograms werecaptured within +0.2 to −1.0 V in 0.1 M potassium hydroxide(KOH) with flow of an individual dissolved gas (O2 or N2)into the 0.1 M KOH electrolyte providing saturation as
necessary. Linear sweep voltammetry (LSV) was carried outat 1,600 rpm with a 10 mV s−1 scan rate. The Koutecky–Levich (K-L) equation was used to calculate ORR kineticefficiency from LSV scans taken from 225 to 3,600 rpm.Throughout the voltammetric results discussed in this paper,the current response is displayed with respect to the current(mA) provided per gram (g) of catalyst coating, which allowsa closer comparison to previously published studies.Chronoamperometric measurements were recorded in O2-sat-urated 0.1 MKOHwith a GCE rotation of 1,600 rpm using anapplied potential taken from the LSV scan of the catalystpowder in question. Electrochemical impedance spectroscopy(EIS) was captured at a fixed potential of −0.1 V for allmeasurements. A superimposed alternating potential with a10 mV amplitude was also applied at a frequency of 106 to10−2 Hz in a single sine mode using O2-saturated 0.1 M KOHelectrolyte under convection-controlled conditions.
Material characterisation
X-ray diffractometry (XRD) was carried out on a Bruker D8-Discover diffractometer. Measurement parameters consistedof an increment of 0.04° of the 2θ angle with a 10-s hold time.The 2θ angle range of operation was 3°—70°. Tapping modeatomic force microscopy (AFM) analysis was completed witha scanning probe Veeco Dimension 3100 microscope usingTESP levers (nominal stiffness ~40 N m−1) operated slightlybelow resonance (300 kHz). A Labram system using a He–Nelaser (λ 632.81 nm) was used to generate Raman spectra data.X-ray photoelectron spectroscopy (XPS) analysis was carriedout on a Kratos Axis Ultra DLD spectrometer. Scanningelectron microscopy (SEM) imaging was carried out using aFEI Quanta 300D system. A multi-point Brunauer–Emmett–Teller (BET) method was employed for this study. The linearplot required for BET surface area calculations is taken fromthe P0=P range of 0.05–0.35 in the N2 adsorption scan.Nitrogen gas adsorption and desorption behaviour wasanalysed with a Autosorb-1 system manufactured byQuantachrome Instruments, Boynton Beach, FL, USA.
Results and discussion
Surface topography of graphene oxide reduced in varioushydrothermal media
SEM images of the graphene oxide and rGO samples showthe largest particles present within the whole powder prepara-tion (Fig. 1). A highly roughened surface for the GO and rGOsamples [30] is due to the freeze-drying treatment and is incontrast to the smoother surface of the graphite raw materialand the oven-dried GO (Fig. 1).
J Solid State Electrochem
A highly distorted surface and topography can preventface-to-face stacking of the graphene layers, while also en-hancing the formation of mesopores and macropores, whichbestow significant capacitive behaviour [44, 45]. The pres-ence of a porous surface after GO reduction would alsoattribute a considerable electrostatic capacitance to the surfaceof the rGO particles.
Examination of the surface structure of graphene oxideafter hydrothermal reduction in varied media
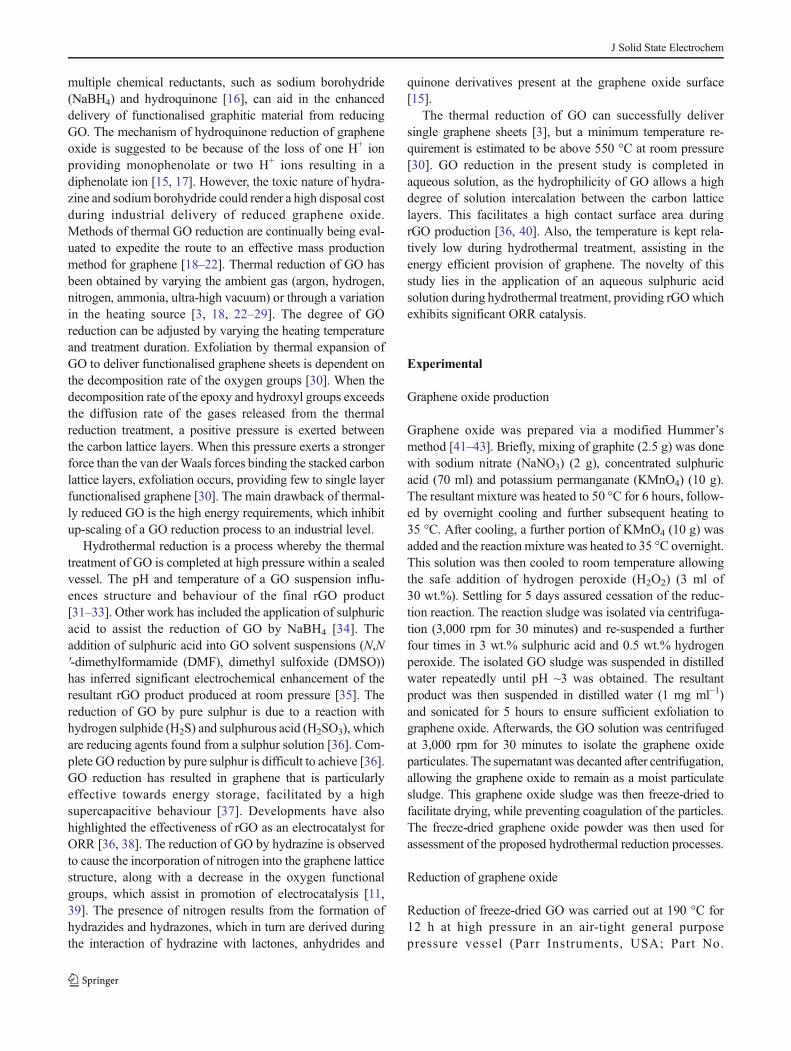
Raman analysis of GO, graphite and rGO samples displayedin Fig. 2 shows positioning of the diamondoid (D), graphitic(G) and 2-D peaks that are typical for graphitic-based mate-rials [6, 46, 47]. It is appropriate to consider the Raman dataseparately to obtain more complete information on the struc-ture of the rGO samples investigated (Figs. 2 and S1). The 2-Dpeak present at ~2,700 cm−1 is activated by the A1′ phonon butis depressed in a highly disordered structure (Figs. 2 and S1)[48, 49]. A well-defined 2-D peak exists in a highly orderedcrystalline structure, such as what is found in the carbon lattice
layers of graphene [50, 51]. The rGO samples and GOdisplayed in Figs. 2 of this manuscript and S1 of thesupporting information have a highly disrupted graphiticstructure, indicated by a prominent D-peak, most likely causedby the incorporation of a high amount of oxygen. The D-peakis stimulated at ~1,360 cm−1 by the A1g phonon and can becaused by the presence of structural defects within the material[52]. These defects become notably heightened in intensityafter the oxidation of graphite to GO and can persist to asignificant degree in the subsequent rGO samples after GOreduction. The G-peak is present at ~1,580 cm−1, being stim-ulated by the E2g phonon vibrations of the sp2 carbonhybridisation [53]. The D+D′ peak present at 2,940 cm−1
shows the combined effect of phonons which vibrate at dif-ferent frequencies; these vibrations are influenced by thepresence of structural defects [54].
An overall decrease in the in-plane sp2 domain size is seento occur after oxidation and exfoliation of graphite. This issuggested by Raman analysis data, as an increase in the ID/IGratio from 0.32 for graphite to 1.01 for graphite oxide and 1.12for graphene oxide (Table 1) [35, 55]. A further decrease in thesp2 domain size after hydrothermal reduction of grapheneoxide is indicated with an increase in the ID/IG ratio, whichalso indicates an increase in the surface defects as a result ofthe abrasive removal of oxygen functional groups (Table 1) [7,55–57]. Sulphur incorporated into the rGO H2SO4 sample(Figs. 6 and 7; Table 4) may contribute to the increased levelof defects [58], which is indicated by the high ID/IG ratio(1.43) for this sample (Table 1).
Table 1 shows that defects are lowest in the rGO derivedfrom hydrazine reduction (pH of hydrothermal suspension forrGO N2H4=~10; ID/IG=1.00), while a higher level is
Fig. 1 SEM images of freeze-dried graphene oxide versus oven-driedgraphene oxide, graphite and graphene oxide reduced at 190 °C underhigh pressure (180–190 psi) for 12 hours in distilled water (rGODI H2O),0.1 M sulphuric acid (rGO H2SO4) and 0.33 M hydrazine (rGO N2H4).Freeze-dried graphene oxide was employed in the provision of all rGOsamples
1200 1600 2000 2400 2800 3200
2160
2190
2220
2250
2280
2310
2340
1200 1600 2000 2400 2800 32001830
1860
1890
1920
1950
1980
2010
2040
2070
2100
1200 1600 2000 2400 2800 3200
2010
2040
2070
2100
2130
2160
2190
1200 1600 2000 2400 2800 32002408
2412
2416
2420
2424
2428
2432
Raman Shift / cm-1Raman Shift / cm-1
Raman Shift / cm-1Raman Shift / cm-1
rGO H2SO4D
2D
G
D+D'
Graphite Oxide
D G
D+D'2D
G
D
2D
G
D+D'
rGO DI H2O
DG
Inte
nsity
/ A
.U.
Inte
nsity
/ A
.U.
Inte
nsity
/ A
.U.
Inte
nsity
/ A
.U.
rGO N2H4
2D D+D'
D
G
Fig. 2 Raman spectra of graphite oxide before exfoliation and grapheneoxide reduced hydrothermally (190 °C for 12 hours at high pressure(180–190 psi)) in distilled water (rGO DI H2O), 0.1 M sulphuric acid(rGO H2SO4) and 0.33 M hydrazine (rGO N2H4), respectively
J Solid State Electrochem
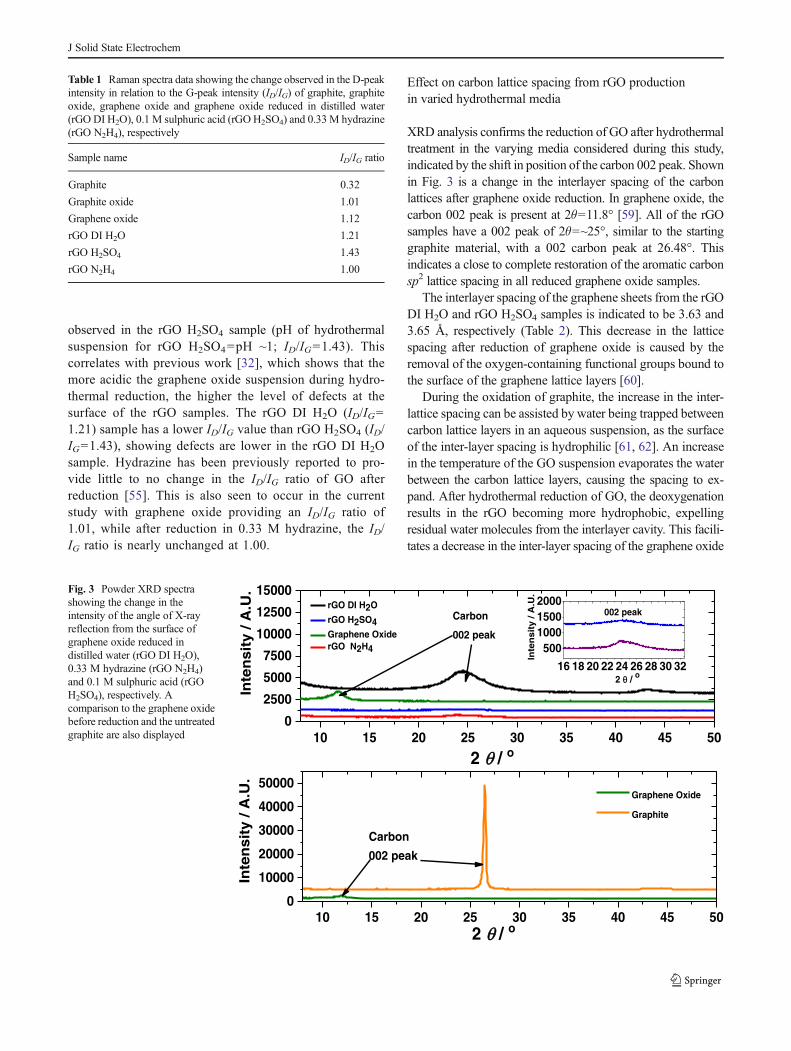
observed in the rGO H2SO4 sample (pH of hydrothermalsuspension for rGO H2SO4=pH ~1; ID/IG=1.43). Thiscorrelates with previous work [32], which shows that themore acidic the graphene oxide suspension during hydro-thermal reduction, the higher the level of defects at thesurface of the rGO samples. The rGO DI H2O (ID/IG=1.21) sample has a lower ID/IG value than rGO H2SO4 (ID/IG=1.43), showing defects are lower in the rGO DI H2Osample. Hydrazine has been previously reported to pro-vide little to no change in the ID/IG ratio of GO afterreduction [55]. This is also seen to occur in the currentstudy with graphene oxide providing an ID/IG ratio of1.01, while after reduction in 0.33 M hydrazine, the ID/IG ratio is nearly unchanged at 1.00.
Effect on carbon lattice spacing from rGO productionin varied hydrothermal media
XRD analysis confirms the reduction of GO after hydrothermaltreatment in the varying media considered during this study,indicated by the shift in position of the carbon 002 peak. Shownin Fig. 3 is a change in the interlayer spacing of the carbonlattices after graphene oxide reduction. In graphene oxide, thecarbon 002 peak is present at 2θ=11.8° [59]. All of the rGOsamples have a 002 peak of 2θ=~25°, similar to the startinggraphite material, with a 002 carbon peak at 26.48°. Thisindicates a close to complete restoration of the aromatic carbonsp2 lattice spacing in all reduced graphene oxide samples.
The interlayer spacing of the graphene sheets from the rGODI H2O and rGO H2SO4 samples is indicated to be 3.63 and3.65 Å, respectively (Table 2). This decrease in the latticespacing after reduction of graphene oxide is caused by theremoval of the oxygen-containing functional groups bound tothe surface of the graphene lattice layers [60].
During the oxidation of graphite, the increase in the inter-lattice spacing can be assisted by water being trapped betweencarbon lattice layers in an aqueous suspension, as the surfaceof the inter-layer spacing is hydrophilic [61, 62]. An increasein the temperature of the GO suspension evaporates the waterbetween the carbon lattice layers, causing the spacing to ex-pand. After hydrothermal reduction of GO, the deoxygenationresults in the rGO becoming more hydrophobic, expellingresidual water molecules from the interlayer cavity. This facili-tates a decrease in the inter-layer spacing of the graphene oxide
Table 1 Raman spectra data showing the change observed in the D-peakintensity in relation to the G-peak intensity (ID/IG) of graphite, graphiteoxide, graphene oxide and graphene oxide reduced in distilled water(rGO DI H2O), 0.1 M sulphuric acid (rGOH2SO4) and 0.33M hydrazine(rGO N2H4), respectively
Sample name ID/IG ratio
Graphite 0.32
Graphite oxide 1.01
Graphene oxide 1.12
rGO DI H2O 1.21
rGO H2SO4 1.43
rGO N2H4 1.00
10 15 20 25 30 35 40 45 500
2500
5000
7500
10000
12500
15000
10 15 20 25 30 35 40 45 500
10000
20000
30000
40000
50000
002 peak
Graphene Oxide
Graphite
rGO DI H2O
rGO H2SO4Graphene OxiderGO N2H4
Carbon
002 peak
16 18 20 22 24 26 28 30 32
500100015002000
2 / o
2 / o
Inte
nsi
ty /
A.U
.
Carbon
002 peak
Inte
nsi
ty /
A.U
.
Inte
nsi
ty /
A.U
.
2 / o
Fig. 3 Powder XRD spectrashowing the change in theintensity of the angle of X-rayreflection from the surface ofgraphene oxide reduced indistilled water (rGO DI H2O),0.33 M hydrazine (rGO N2H4)and 0.1 M sulphuric acid (rGOH2SO4), respectively. Acomparison to the graphene oxidebefore reduction and the untreatedgraphite are also displayed
J Solid State Electrochem
after reduction together with the removal of oxygen-containingfunctional groups [61]. There is a slightly larger inter-latticespacing observed between the carbon layers of the rGO sam-ples (3.63 Å–3.72Å) of this study in comparison to the graphiteraw material (3.36 Å). Persistence of a significant portion ofoxygen-based functional groups after GO reduction (O 1s rGON2H4=5.12 at.%, rGO DI H2O=14.47 at.%, rGO H2SO4=16.09 at.%) would promote a higher carbon lattice spacing thanthe untreated graphite (O 1s 3.03 at.%). The incorporation ofnitrogen and sulphur-containing functional groups is speculatedto assist in the creation of a larger carbon lattice spacing withinthe rGO H2SO4 and rGO N2H4 samples, in comparison to thegraphite starting material (Fig. 3; Table 2) [35].
Analysis of the dimensions of the rGO particles producedin varied hydrothermal media
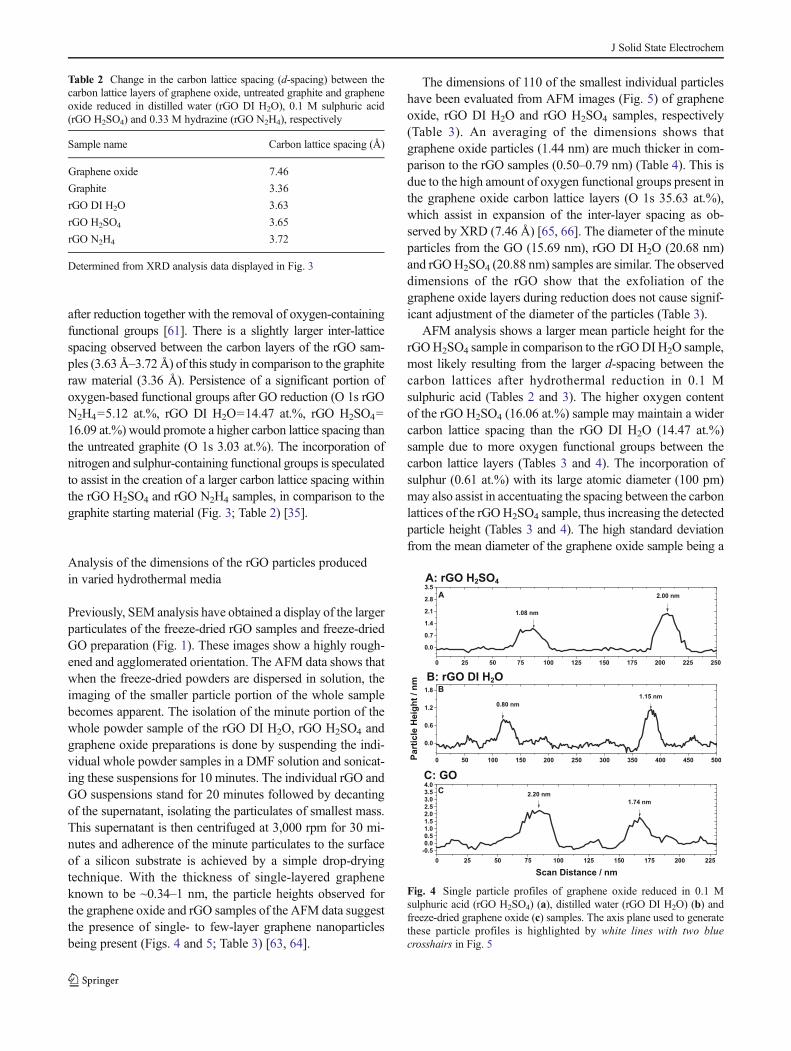
Previously, SEM analysis have obtained a display of the largerparticulates of the freeze-dried rGO samples and freeze-driedGO preparation (Fig. 1). These images show a highly rough-ened and agglomerated orientation. The AFM data shows thatwhen the freeze-dried powders are dispersed in solution, theimaging of the smaller particle portion of the whole samplebecomes apparent. The isolation of the minute portion of thewhole powder sample of the rGO DI H2O, rGO H2SO4 andgraphene oxide preparations is done by suspending the indi-vidual whole powder samples in a DMF solution and sonicat-ing these suspensions for 10 minutes. The individual rGO andGO suspensions stand for 20 minutes followed by decantingof the supernatant, isolating the particulates of smallest mass.This supernatant is then centrifuged at 3,000 rpm for 30 mi-nutes and adherence of the minute particulates to the surfaceof a silicon substrate is achieved by a simple drop-dryingtechnique. With the thickness of single-layered grapheneknown to be ~0.34–1 nm, the particle heights observed forthe graphene oxide and rGO samples of the AFM data suggestthe presence of single- to few-layer graphene nanoparticlesbeing present (Figs. 4 and 5; Table 3) [63, 64].
The dimensions of 110 of the smallest individual particleshave been evaluated from AFM images (Fig. 5) of grapheneoxide, rGO DI H2O and rGO H2SO4 samples, respectively(Table 3). An averaging of the dimensions shows thatgraphene oxide particles (1.44 nm) are much thicker in com-parison to the rGO samples (0.50–0.79 nm) (Table 4). This isdue to the high amount of oxygen functional groups present inthe graphene oxide carbon lattice layers (O 1s 35.63 at.%),which assist in expansion of the inter-layer spacing as ob-served by XRD (7.46 Å) [65, 66]. The diameter of the minuteparticles from the GO (15.69 nm), rGO DI H2O (20.68 nm)and rGOH2SO4 (20.88 nm) samples are similar. The observeddimensions of the rGO show that the exfoliation of thegraphene oxide layers during reduction does not cause signif-icant adjustment of the diameter of the particles (Table 3).
AFM analysis shows a larger mean particle height for therGOH2SO4 sample in comparison to the rGODI H2O sample,most likely resulting from the larger d-spacing between thecarbon lattices after hydrothermal reduction in 0.1 Msulphuric acid (Tables 2 and 3). The higher oxygen contentof the rGO H2SO4 (16.06 at.%) sample may maintain a widercarbon lattice spacing than the rGO DI H2O (14.47 at.%)sample due to more oxygen functional groups between thecarbon lattice layers (Tables 3 and 4). The incorporation ofsulphur (0.61 at.%) with its large atomic diameter (100 pm)may also assist in accentuating the spacing between the carbonlattices of the rGOH2SO4 sample, thus increasing the detectedparticle height (Tables 3 and 4). The high standard deviationfrom the mean diameter of the graphene oxide sample being a
0 25 50 75 100 125 150 175 200 225 250
0.0
0.7
1.4
2.1
2.8
3.5
0 50 100 150 200 250 300 350 400 450 500
0.0
0.6
1.2
1.8
0 25 50 75 100 125 150 175 200 225-0.50.00.51.01.52.02.53.03.54.0
2.00 nm
1.08 nm
A: rGO H2SO4
B: rGO DI H2O
C: GO
1.74 nm 2.20 nm
Scan Distance / nm
A
C
Part
icle
Hei
ght /
nm
0.80 nm1.15 nm
B
Fig. 4 Single particle profiles of graphene oxide reduced in 0.1 Msulphuric acid (rGO H2SO4) (a), distilled water (rGO DI H2O) (b) andfreeze-dried graphene oxide (c) samples. The axis plane used to generatethese particle profiles is highlighted by white lines with two bluecrosshairs in Fig. 5
Table 2 Change in the carbon lattice spacing (d-spacing) between thecarbon lattice layers of graphene oxide, untreated graphite and grapheneoxide reduced in distilled water (rGO DI H2O), 0.1 M sulphuric acid(rGO H2SO4) and 0.33 M hydrazine (rGO N2H4), respectively
Sample name Carbon lattice spacing (Å)
Graphene oxide 7.46
Graphite 3.36
rGO DI H2O 3.63
rGO H2SO4 3.65
rGO N2H4 3.72
Determined from XRD analysis data displayed in Fig. 3
J Solid State Electrochem
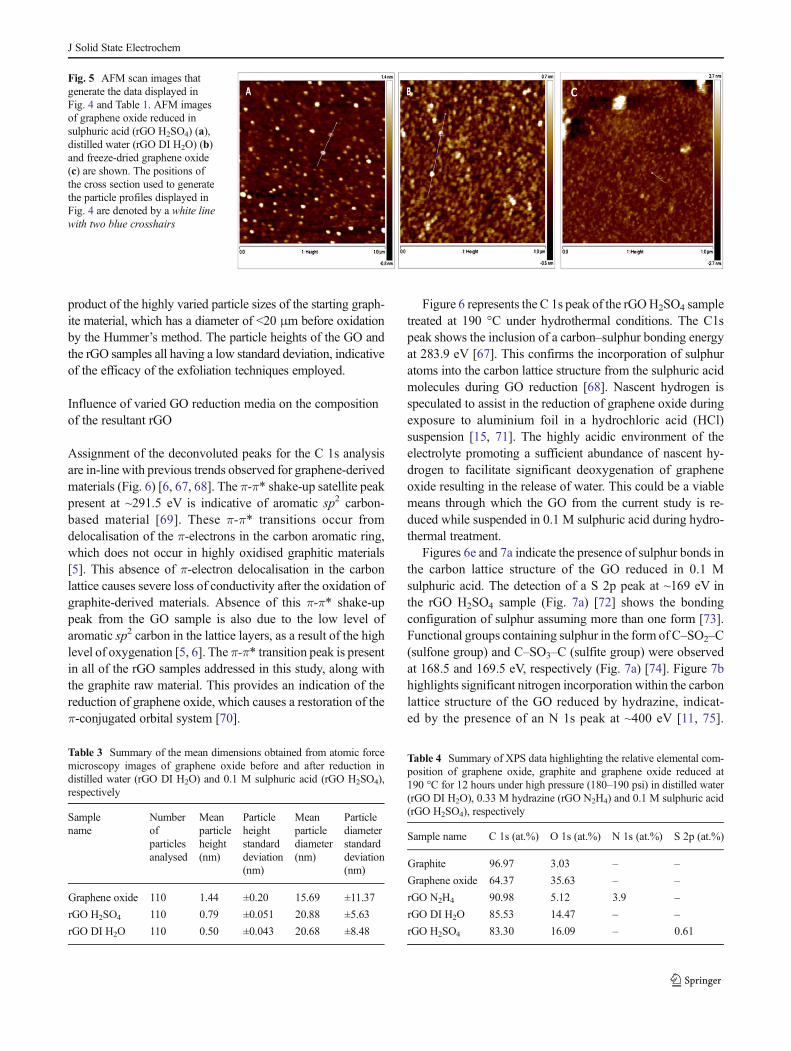
product of the highly varied particle sizes of the starting graph-ite material, which has a diameter of <20 μm before oxidationby the Hummer’s method. The particle heights of the GO andthe rGO samples all having a low standard deviation, indicativeof the efficacy of the exfoliation techniques employed.
Influence of varied GO reduction media on the compositionof the resultant rGO
Assignment of the deconvoluted peaks for the C 1s analysisare in-line with previous trends observed for graphene-derivedmaterials (Fig. 6) [6, 67, 68]. The π-π* shake-up satellite peakpresent at ~291.5 eV is indicative of aromatic sp2 carbon-based material [69]. These π-π* transitions occur fromdelocalisation of the π-electrons in the carbon aromatic ring,which does not occur in highly oxidised graphitic materials[5]. This absence of π-electron delocalisation in the carbonlattice causes severe loss of conductivity after the oxidation ofgraphite-derived materials. Absence of this π-π* shake-uppeak from the GO sample is also due to the low level ofaromatic sp2 carbon in the lattice layers, as a result of the highlevel of oxygenation [5, 6]. The π-π* transition peak is presentin all of the rGO samples addressed in this study, along withthe graphite raw material. This provides an indication of thereduction of graphene oxide, which causes a restoration of theπ-conjugated orbital system [70].
Figure 6 represents the C 1s peak of the rGOH2SO4 sampletreated at 190 °C under hydrothermal conditions. The C1speak shows the inclusion of a carbon–sulphur bonding energyat 283.9 eV [67]. This confirms the incorporation of sulphuratoms into the carbon lattice structure from the sulphuric acidmolecules during GO reduction [68]. Nascent hydrogen isspeculated to assist in the reduction of graphene oxide duringexposure to aluminium foil in a hydrochloric acid (HCl)suspension [15, 71]. The highly acidic environment of theelectrolyte promoting a sufficient abundance of nascent hy-drogen to facilitate significant deoxygenation of grapheneoxide resulting in the release of water. This could be a viablemeans through which the GO from the current study is re-duced while suspended in 0.1 M sulphuric acid during hydro-thermal treatment.
Figures 6e and 7a indicate the presence of sulphur bonds inthe carbon lattice structure of the GO reduced in 0.1 Msulphuric acid. The detection of a S 2p peak at ~169 eV inthe rGO H2SO4 sample (Fig. 7a) [72] shows the bondingconfiguration of sulphur assuming more than one form [73].Functional groups containing sulphur in the form of C–SO2–C(sulfone group) and C–SO3–C (sulfite group) were observedat 168.5 and 169.5 eV, respectively (Fig. 7a) [74]. Figure 7bhighlights significant nitrogen incorporation within the carbonlattice structure of the GO reduced by hydrazine, indicat-ed by the presence of an N 1s peak at ~400 eV [11, 75].
Fig. 5 AFM scan images thatgenerate the data displayed inFig. 4 and Table 1. AFM imagesof graphene oxide reduced insulphuric acid (rGO H2SO4) (a),distilled water (rGO DI H2O) (b)and freeze-dried graphene oxide(c) are shown. The positions ofthe cross section used to generatethe particle profiles displayed inFig. 4 are denoted by a white linewith two blue crosshairs
Table 4 Summary of XPS data highlighting the relative elemental com-position of graphene oxide, graphite and graphene oxide reduced at190 °C for 12 hours under high pressure (180–190 psi) in distilled water(rGO DI H2O), 0.33 M hydrazine (rGO N2H4) and 0.1 M sulphuric acid(rGO H2SO4), respectively
Sample name C 1s (at.%) O 1s (at.%) N 1s (at.%) S 2p (at.%)
Graphite 96.97 3.03 – –
Graphene oxide 64.37 35.63 – –
rGO N2H4 90.98 5.12 3.9 –
rGO DI H2O 85.53 14.47 – –
rGO H2SO4 83.30 16.09 – 0.61
Table 3 Summary of the mean dimensions obtained from atomic forcemicroscopy images of graphene oxide before and after reduction indistilled water (rGO DI H2O) and 0.1 M sulphuric acid (rGO H2SO4),respectively
Samplename
Numberofparticlesanalysed
Meanparticleheight(nm)
Particleheightstandarddeviation(nm)
Meanparticlediameter(nm)
Particlediameterstandarddeviation(nm)
Graphene oxide 110 1.44 ±0.20 15.69 ±11.37
rGO H2SO4 110 0.79 ±0.051 20.88 ±5.63
rGO DI H2O 110 0.50 ±0.043 20.68 ±8.48
J Solid State Electrochem
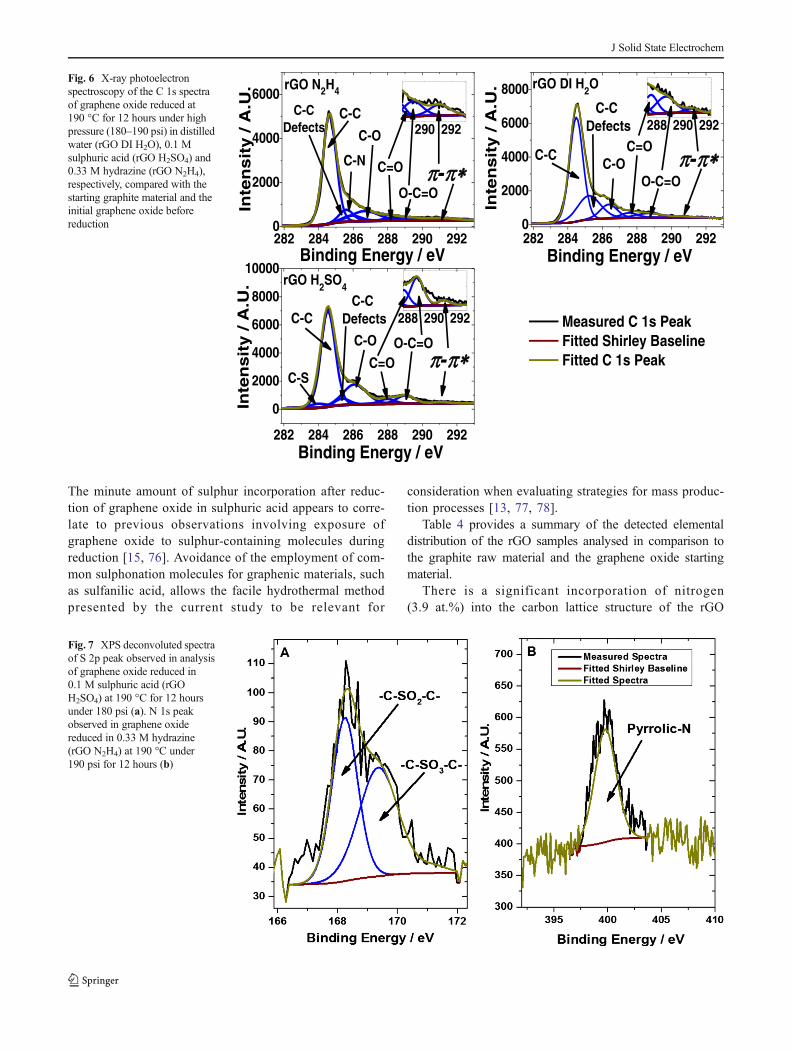
The minute amount of sulphur incorporation after reduc-tion of graphene oxide in sulphuric acid appears to corre-late to previous observations involving exposure ofgraphene oxide to sulphur-containing molecules duringreduction [15, 76]. Avoidance of the employment of com-mon sulphonation molecules for graphenic materials, suchas sulfanilic acid, allows the facile hydrothermal methodpresented by the current study to be relevant for
consideration when evaluating strategies for mass produc-tion processes [13, 77, 78].
Table 4 provides a summary of the detected elementaldistribution of the rGO samples analysed in comparison tothe graphite raw material and the graphene oxide startingmaterial.
There is a significant incorporation of nitrogen(3.9 at.%) into the carbon lattice structure of the rGO
Fig. 6 X-ray photoelectronspectroscopy of the C 1s spectraof graphene oxide reduced at190 °C for 12 hours under highpressure (180–190 psi) in distilledwater (rGO DI H2O), 0.1 Msulphuric acid (rGO H2SO4) and0.33 M hydrazine (rGO N2H4),respectively, compared with thestarting graphite material and theinitial graphene oxide beforereduction
Fig. 7 XPS deconvoluted spectraof S 2p peak observed in analysisof graphene oxide reduced in0.1 M sulphuric acid (rGOH2SO4) at 190 °C for 12 hoursunder 180 psi (a). N 1s peakobserved in graphene oxidereduced in 0.33 M hydrazine(rGO N2H4) at 190 °C under190 psi for 12 hours (b)
J Solid State Electrochem
N2H4 sample produced in the current investigation (Ta-ble 4; Fig. 7b). The oxidation of graphite (O 1s 3.03 at.%)is clearly confirmed by the marked increase of the oxygencontent (O 1s 35.63 at.%) after oxidation. Reduction ofthe graphene oxide to rGO (O 1s rGO N2H4=5.12 at.%,rGO H2SO4=16.09 at.%, rGO DI H2O=14.47 at.%) isindicated by a decrease in the oxygen content after hy-drothermal treatment in the varied media employed(Table 4). The persistence of a certain level of oxygenfunctionalities is to be expected in the rGO product.Higher oxygen content is observed in the rGO samplesthan in the raw graphite material (Table 4). However, thissignificant reduction of graphene oxide being carried outby the proposed single-step treatments of this study aremore favourable for a cost-effective delivery of rGO thana multistep solution-based process [13].
Chemical-based GO reduction processes providefunctionalised graphene, which in reality differs fromthat of pristine graphene [79]. GO reduction deliversfunctionalised graphene sheets and are more cost-effective than that of pristine graphene, which is diffi-cult to produce in large quantities and is not easilyprocessible [80]. The mechanisms responsible for thereduction of GO are not entirely understood at present[11, 15]. Current literature has shed some light onpossible reduction mechanisms during the hydrazine-assisted production of rGO [81]. One proposed mecha-nism explains the reduction process being initiated bythe opening of the epoxy ring of hydrazine, whichrequires the removal of hydrogen. This forms ahydrazino (N2H3) compound, which reacts with ahydrazino alcohol (N2H3−OH) by a transfer of hydro-gen, forming water as a by-product [82]. The remainingderivative (−NNH2) desorbs once heating begins,allowing the formation of diazene (N2H2), while alsoincorporating nitrogen into the carbon lattice [81, 82].However, mechanisms of GO deoxygenation is stillmired with a significant degree of uncertainty, whichneeds clarification before significant advancement ofthis process [11].
Effect of the reduction media on the ORR catalysis of the rGOpreparations
The novel provision of an ORR catalyst by an aqueous sus-pension of GO in 0.1 M H2SO4 during hydrothermal reduc-tion is analysed in comparison to an aqueous suspensionwithout H2SO4 (rGO DI H2O). This comparison provides afurther novelty in the production of an ORR catalyst by thehydrothermal reduction of GO in only distilled water. Hydro-thermal GO reduction in hydrazine acts as a positive controlproviding a typical electrocatalytic behaviour from the suc-cessful reduction of GO resulting from application of the
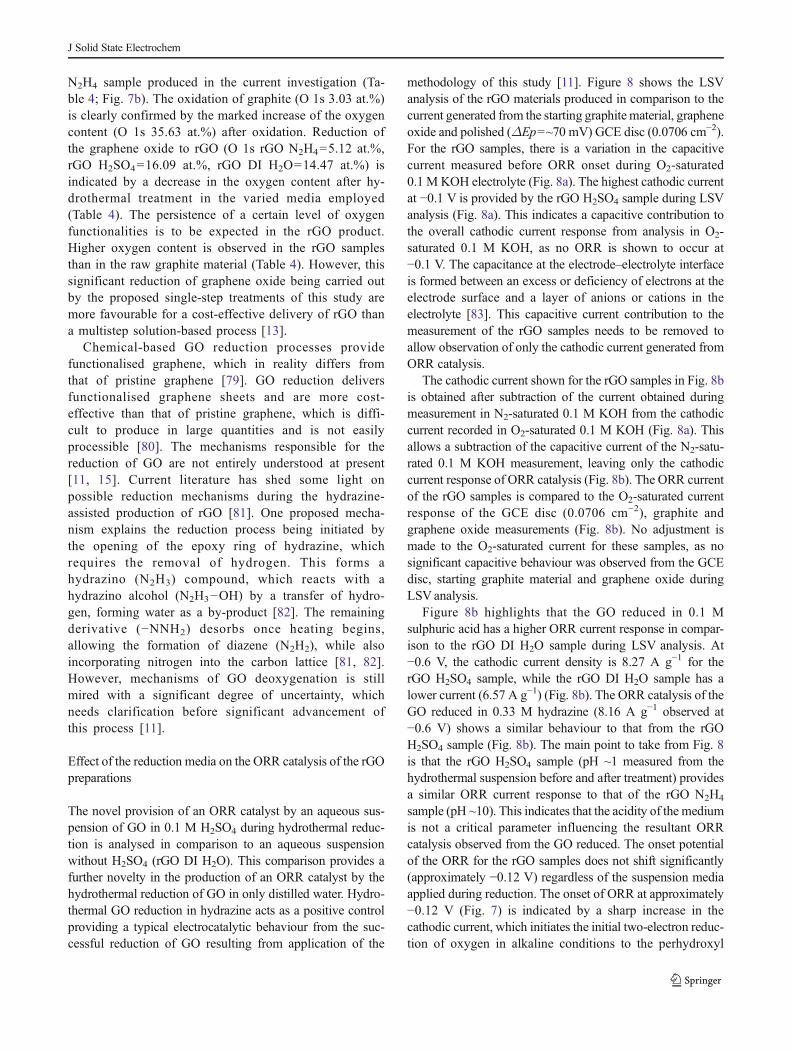
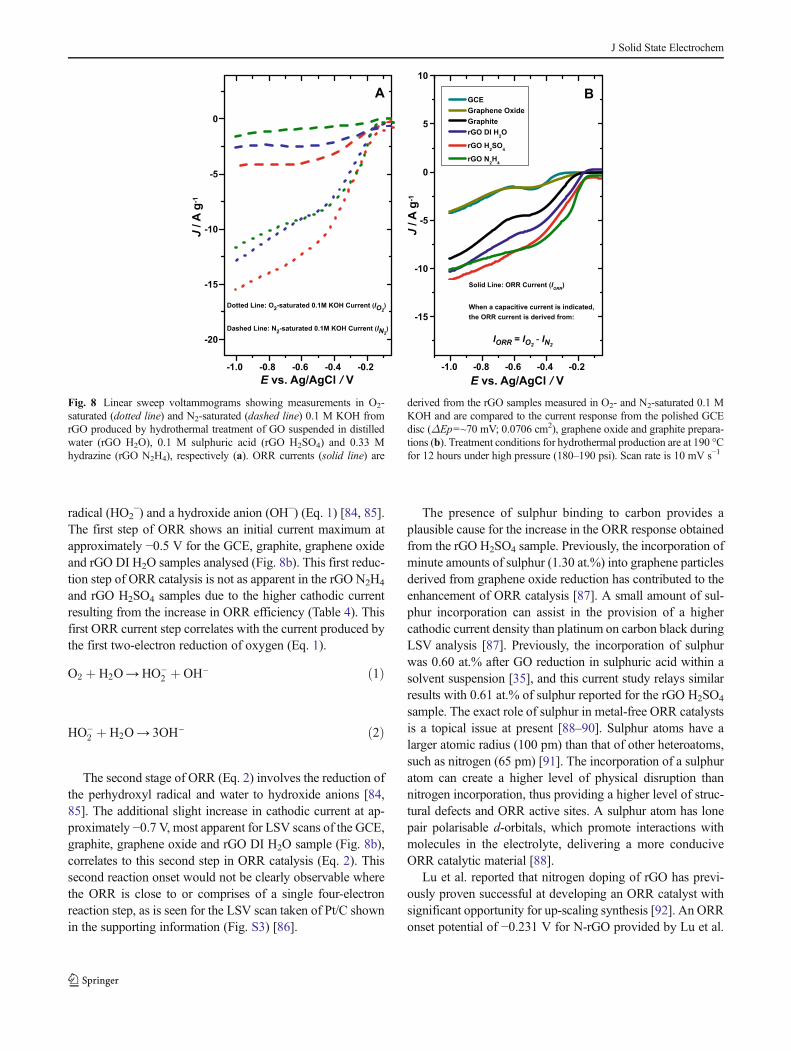
methodology of this study [11]. Figure 8 shows the LSVanalysis of the rGO materials produced in comparison to thecurrent generated from the starting graphite material, grapheneoxide and polished (ΔEp=~70 mV) GCE disc (0.0706 cm−2).For the rGO samples, there is a variation in the capacitivecurrent measured before ORR onset during O2-saturated0.1 M KOH electrolyte (Fig. 8a). The highest cathodic currentat −0.1 V is provided by the rGO H2SO4 sample during LSVanalysis (Fig. 8a). This indicates a capacitive contribution tothe overall cathodic current response from analysis in O2-saturated 0.1 M KOH, as no ORR is shown to occur at−0.1 V. The capacitance at the electrode–electrolyte interfaceis formed between an excess or deficiency of electrons at theelectrode surface and a layer of anions or cations in theelectrolyte [83]. This capacitive current contribution to themeasurement of the rGO samples needs to be removed toallow observation of only the cathodic current generated fromORR catalysis.
The cathodic current shown for the rGO samples in Fig. 8bis obtained after subtraction of the current obtained duringmeasurement in N2-saturated 0.1 M KOH from the cathodiccurrent recorded in O2-saturated 0.1 M KOH (Fig. 8a). Thisallows a subtraction of the capacitive current of the N2-satu-rated 0.1 M KOH measurement, leaving only the cathodiccurrent response of ORR catalysis (Fig. 8b). The ORR currentof the rGO samples is compared to the O2-saturated currentresponse of the GCE disc (0.0706 cm−2), graphite andgraphene oxide measurements (Fig. 8b). No adjustment ismade to the O2-saturated current for these samples, as nosignificant capacitive behaviour was observed from the GCEdisc, starting graphite material and graphene oxide duringLSVanalysis.
Figure 8b highlights that the GO reduced in 0.1 Msulphuric acid has a higher ORR current response in compar-ison to the rGO DI H2O sample during LSV analysis. At−0.6 V, the cathodic current density is 8.27 A g−1 for therGO H2SO4 sample, while the rGO DI H2O sample has alower current (6.57 A g−1) (Fig. 8b). The ORR catalysis of theGO reduced in 0.33 M hydrazine (8.16 A g−1 observed at−0.6 V) shows a similar behaviour to that from the rGOH2SO4 sample (Fig. 8b). The main point to take from Fig. 8is that the rGO H2SO4 sample (pH ~1 measured from thehydrothermal suspension before and after treatment) providesa similar ORR current response to that of the rGO N2H4
sample (pH ~10). This indicates that the acidity of the mediumis not a critical parameter influencing the resultant ORRcatalysis observed from the GO reduced. The onset potentialof the ORR for the rGO samples does not shift significantly(approximately −0.12 V) regardless of the suspension mediaapplied during reduction. The onset of ORR at approximately−0.12 V (Fig. 7) is indicated by a sharp increase in thecathodic current, which initiates the initial two-electron reduc-tion of oxygen in alkaline conditions to the perhydroxyl
J Solid State Electrochem
radical (HO2−) and a hydroxide anion (OH−) (Eq. 1) [84, 85].
The first step of ORR shows an initial current maximum atapproximately −0.5 V for the GCE, graphite, graphene oxideand rGO DI H2O samples analysed (Fig. 8b). This first reduc-tion step of ORR catalysis is not as apparent in the rGO N2H4
and rGO H2SO4 samples due to the higher cathodic currentresulting from the increase in ORR efficiency (Table 4). Thisfirst ORR current step correlates with the current produced bythe first two-electron reduction of oxygen (Eq. 1).
O2 þ H2O→HO−2 þ OH− ð1Þ
HO−2 þ H2O→ 3OH− ð2Þ
The second stage of ORR (Eq. 2) involves the reduction ofthe perhydroxyl radical and water to hydroxide anions [84,85]. The additional slight increase in cathodic current at ap-proximately −0.7 V, most apparent for LSV scans of the GCE,graphite, graphene oxide and rGO DI H2O sample (Fig. 8b),correlates to this second step in ORR catalysis (Eq. 2). Thissecond reaction onset would not be clearly observable wherethe ORR is close to or comprises of a single four-electronreaction step, as is seen for the LSV scan taken of Pt/C shownin the supporting information (Fig. S3) [86].
The presence of sulphur binding to carbon provides aplausible cause for the increase in the ORR response obtainedfrom the rGO H2SO4 sample. Previously, the incorporation ofminute amounts of sulphur (1.30 at.%) into graphene particlesderived from graphene oxide reduction has contributed to theenhancement of ORR catalysis [87]. A small amount of sul-phur incorporation can assist in the provision of a highercathodic current density than platinum on carbon black duringLSV analysis [87]. Previously, the incorporation of sulphurwas 0.60 at.% after GO reduction in sulphuric acid within asolvent suspension [35], and this current study relays similarresults with 0.61 at.% of sulphur reported for the rGO H2SO4
sample. The exact role of sulphur in metal-free ORR catalystsis a topical issue at present [88–90]. Sulphur atoms have alarger atomic radius (100 pm) than that of other heteroatoms,such as nitrogen (65 pm) [91]. The incorporation of a sulphuratom can create a higher level of physical disruption thannitrogen incorporation, thus providing a higher level of struc-tural defects and ORR active sites. A sulphur atom has lonepair polarisable d-orbitals, which promote interactions withmolecules in the electrolyte, delivering a more conduciveORR catalytic material [88].
Lu et al. reported that nitrogen doping of rGO has previ-ously proven successful at developing an ORR catalyst withsignificant opportunity for up-scaling synthesis [92]. An ORRonset potential of −0.231 V for N-rGO provided by Lu et al.
-1.0 -0.8 -0.6 -0.4 -0.2
-15
-10
-5
0
5
10
-1.0 -0.8 -0.6 -0.4 -0.2
-20
-15
-10
-5
0
J / A
g-1
B
J / A
g-1
E vs. Ag/AgCl / V
GCEGraphene OxideGraphiterGO DI H2O
rGO H2SO4
rGO N2H4
A
Solid Line: ORR Current (IORR)
When a capacitive current is indicated, the ORR current is derived from:
IORR = IO2 - IN2
E vs. Ag/AgCl / V
Dotted Line: O2-saturated 0.1M KOH Current (IO2)
Dashed Line: N2-saturated 0.1M KOH Current (IN2)
Fig. 8 Linear sweep voltammograms showing measurements in O2-saturated (dotted line) and N2-saturated (dashed line) 0.1 M KOH fromrGO produced by hydrothermal treatment of GO suspended in distilledwater (rGO H2O), 0.1 M sulphuric acid (rGO H2SO4) and 0.33 Mhydrazine (rGO N2H4), respectively (a). ORR currents (solid line) are
derived from the rGO samples measured in O2- and N2-saturated 0.1 MKOH and are compared to the current response from the polished GCEdisc (ΔEp=~70 mV; 0.0706 cm2), graphene oxide and graphite prepara-tions (b). Treatment conditions for hydrothermal production are at 190 °Cfor 12 hours under high pressure (180–190 psi). Scan rate is 10 mV s−1
J Solid State Electrochem
shows that the rGO samples produced in the current studyrequire less overpotential to initiate ORR (approximately−0.12 V). This indicates a more favourable ORR catalysisfor the rGO DI H2O, rGO H2SO4 and rGO N2H4 samples. Wuet al. disclosed rGO produced from GO reduction by hydra-zine which provided ~3 mA cm−2 at −0.6 V during LSVmeasurements taken at 1,200 rpm [93]. While the currentdensity of the 1,200 rpm measurement of the rGO N2H4
sample in the current study is 3.05 mA cm−2 (0.215 mA) at−0.6 V. The ORR current provided by the hydrothermal GOreduction process with 0.33 M hydrazine suspension in thisstudy is similar to the room pressure hydrazine-based reduc-tion processes commonly applied to other studies [11, 93].
Another ORR catalysis study focuses on an electrode coat-ing consisting of bi-layer poly(diallyldimethylammoniumchloride) (PDDA) and reduced graphene oxide material. Nu-merous bi-layers yield an ORR onset potential movement toas much as −0.11 V [94]. This is similar to the rGO samples ofthe current study (−0.12 V), while the highest ORR cathodiccurrent from LSVanalysis is observed to be 1.22 mA cm−2 at−0.6 V for the rGO/PDDA composite catalyst layer [94]. TherGODI H2O (2.79 mA cm−2), rGON2H4 (3.46 mA cm−2) andrGO H2SO4 (3.51 mA cm−2) samples (current densities are inmilliampere per square centimetre (mA cm−2), which werecalculated from Fig. 8b using the area of the substrate GCEdisc) from the current study all provide a higher currentdensity at −0.6 V than the rGO/PDDA composite reported.This further highlights the advantage of the hydrothermalreduction process proposed in this study. An ORR catalystusing rGO in a composite with Au nanoparticles have provid-ed an ORR onset of approximately −0.3 V (vs. Ag/AgCl)during LSV analysis [95]. Incorporation of iron, cobalt andnitrogen into rGO non-precious metal catalysts (NPMCs) hasenhanced ORR catalysis [96]. This is indicated by Fu et al.with a reported onset potential during LSVanalysis of approx-imately +0.05 V (vs. Ag/AgCl (saturated KCl) referenceelectrode), which was seen to require less overpotential thana Pt/C coating prepared on a GCE disc [96]. Other applica-tions for nitrogen-doped rGO preparations have shown suc-cess as a support substrate for electrocatalytic platinum nano-particles. The employment of N-rGO as a catalyst supportenhances the ORR onset potential during LSV analysis ofthe platinum nanoparticles by minimising the amount ofoverpotential required to initiate electrocatalysis [97]. Forfuture development of the rGO samples of the current study,there is much opportunity for broadening the scope of exper-imental investigations to identify additional applications.
Comparison of the rGO samples developed with that of theoptimum ORR response obtained from Pt/C is shown inFig. S3 of the supporting information. Figure S3 highlightsthe level of improvement required from the rGO samplesbefore replication of the ORR catalysis from Pt/C can be
realised. The catalytic enhancement of the developed rGOmaterials is another vital consideration to include during fur-ther development so that the Pt/C may be replaced by asuitable non-metal electrocatalyst during the construction offuel cell technologies. A recent study also highlights thesuitability of sulfonated reduced graphene oxide as a supportmaterial for electrocatalytic platinum nanoparticles, whichefficiently provide a stable ORR current [58]. This may beanother consideration for the rGOH2SO4 sample of this study,bringing merit to future work.
Effect of varied GO reduction suspension on ORR efficiency
The rGO H2SO4 sample (n=2.8 at −0.6 V) indicates a slightlyhigher electron transfer number to that obtained for GO re-duced with hydrazine (n=2.2 at −0.6 V). This result coupledwith the LSV comparison indicates that the ORR response issimilar for rGO H2SO4 sample and rGO N2H4 sample. Thekinetics calculated for the rGO DI H2O sample (n=2.3 at−0.6 V), along with the accompanying LSV analysis, wouldsuggest that the rGO DI H2O sample provides a lower ORRcatalysis than the rGO H2SO4 sample (Table 5; Fig. 8).
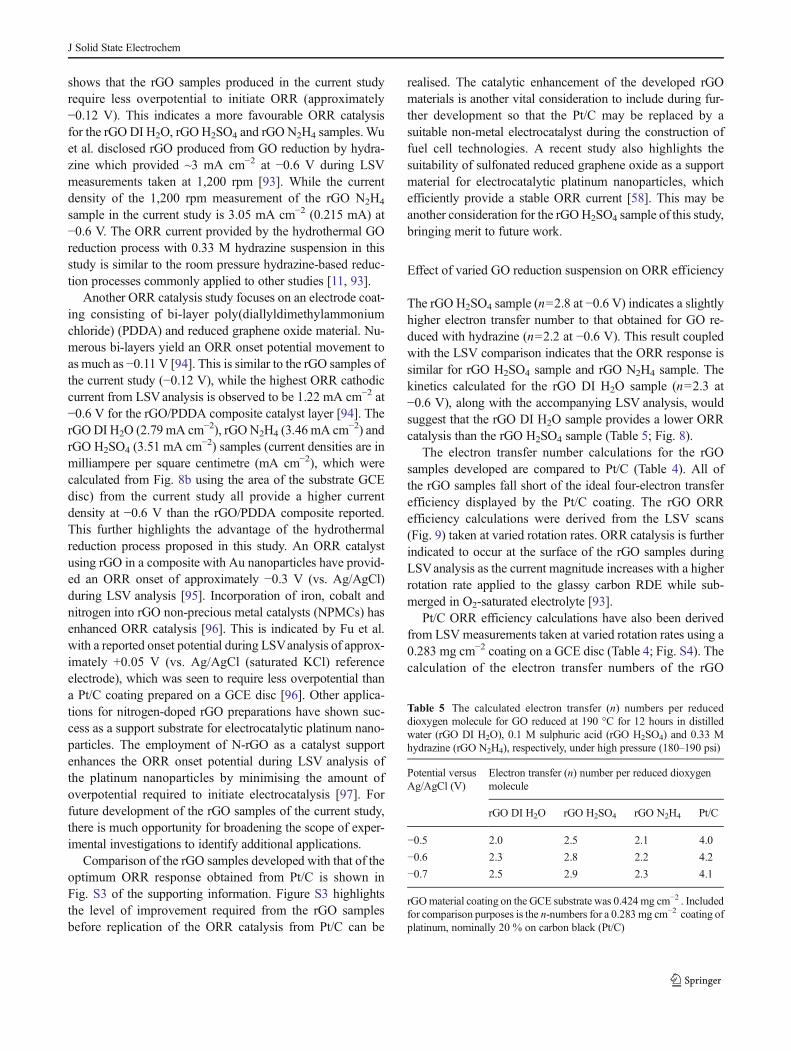
The electron transfer number calculations for the rGOsamples developed are compared to Pt/C (Table 4). All ofthe rGO samples fall short of the ideal four-electron transferefficiency displayed by the Pt/C coating. The rGO ORRefficiency calculations were derived from the LSV scans(Fig. 9) taken at varied rotation rates. ORR catalysis is furtherindicated to occur at the surface of the rGO samples duringLSVanalysis as the current magnitude increases with a higherrotation rate applied to the glassy carbon RDE while sub-merged in O2-saturated electrolyte [93].
Pt/C ORR efficiency calculations have also been derivedfrom LSV measurements taken at varied rotation rates using a0.283 mg cm−2 coating on a GCE disc (Table 4; Fig. S4). Thecalculation of the electron transfer numbers of the rGO
Table 5 The calculated electron transfer (n) numbers per reduceddioxygen molecule for GO reduced at 190 °C for 12 hours in distilledwater (rGO DI H2O), 0.1 M sulphuric acid (rGO H2SO4) and 0.33 Mhydrazine (rGO N2H4), respectively, under high pressure (180–190 psi)
Potential versusAg/AgCl (V)
Electron transfer (n) number per reduced dioxygenmolecule
rGO DI H2O rGO H2SO4 rGO N2H4 Pt/C
−0.5 2.0 2.5 2.1 4.0
−0.6 2.3 2.8 2.2 4.2
−0.7 2.5 2.9 2.3 4.1
rGOmaterial coating on the GCE substrate was 0.424 mg cm−2 . Includedfor comparison purposes is the n-numbers for a 0.283mg cm−2 coating ofplatinum, nominally 20 % on carbon black (Pt/C)
J Solid State Electrochem
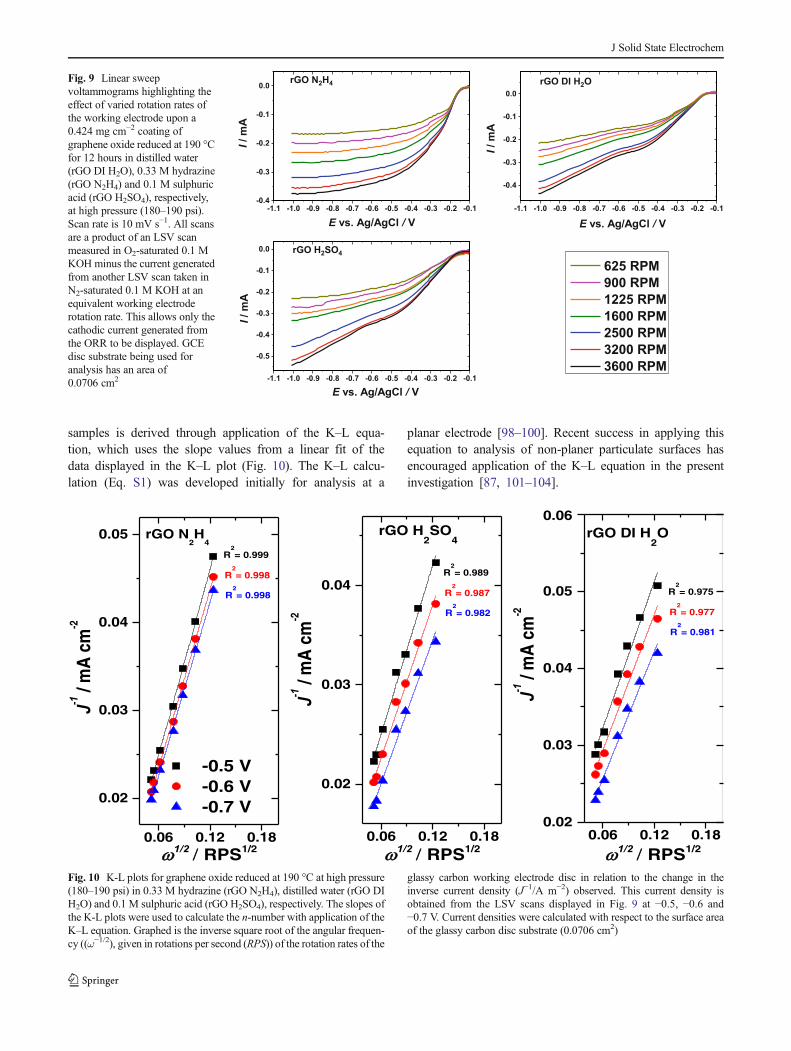
samples is derived through application of the K–L equa-tion, which uses the slope values from a linear fit of thedata displayed in the K–L plot (Fig. 10). The K–L calcu-lation (Eq. S1) was developed initially for analysis at a
planar electrode [98–100]. Recent success in applying thisequation to analysis of non-planer particulate surfaces hasencouraged application of the K–L equation in the presentinvestigation [87, 101–104].
-1.1 -1.0 -0.9 -0.8 -0.7 -0.6 -0.5 -0.4 -0.3 -0.2 -0.1-0.4
-0.3
-0.2
-0.1
0.0
-1.1 -1.0 -0.9 -0.8 -0.7 -0.6 -0.5 -0.4 -0.3 -0.2 -0.1
-0.4
-0.3
-0.2
-0.1
0.0
-1.1 -1.0 -0.9 -0.8 -0.7 -0.6 -0.5 -0.4 -0.3 -0.2 -0.1
-0.5
-0.4
-0.3
-0.2
-0.1
0.0
I / m
A
I / m
A
E vs. Ag/AgCl / V
E vs. Ag/AgCl / VI /
mA
E vs. Ag/AgCl / V
rGO N2H4 rGO DI H2O
625 RPM 900 RPM 1225 RPM 1600 RPM 2500 RPM 3200 RPM 3600 RPM
rGO H2SO4
Fig. 9 Linear sweepvoltammograms highlighting theeffect of varied rotation rates ofthe working electrode upon a0.424 mg cm−2 coating ofgraphene oxide reduced at 190 °Cfor 12 hours in distilled water(rGO DI H2O), 0.33 M hydrazine(rGO N2H4) and 0.1 M sulphuricacid (rGO H2SO4), respectively,at high pressure (180–190 psi).Scan rate is 10 mV s−1. All scansare a product of an LSV scanmeasured in O2-saturated 0.1 MKOH minus the current generatedfrom another LSV scan taken inN2-saturated 0.1 M KOH at anequivalent working electroderotation rate. This allows only thecathodic current generated fromthe ORR to be displayed. GCEdisc substrate being used foranalysis has an area of0.0706 cm2
0.06 0.12 0.18
0.02
0.03
0.04
0.05
0.06 0.12 0.18
0.02
0.03
0.04
0.06 0.12 0.180.02
0.03
0.04
0.05
0.06
R2= 0.987
R2= 0.982
1/2 RPS1/2 1/2 RPS1/2
J-1/ m
A c
m-2
J-1/ m
A c
m-2
rGO H2SO
4rGO N2H
4
J-1/ m
A c
m-2
1/2 RPS1/2
rGO DI H2O
R2= 0.989R
2= 0.998
R2= 0.998
R2= 0.999
-0.5 V -0.6 V -0.7 V
R2= 0.977
R2= 0.981
R2= 0.975
Fig. 10 K-L plots for graphene oxide reduced at 190 °C at high pressure(180–190 psi) in 0.33 M hydrazine (rGO N2H4), distilled water (rGO DIH2O) and 0.1 M sulphuric acid (rGO H2SO4), respectively. The slopes ofthe K-L plots were used to calculate the n-number with application of theK–L equation. Graphed is the inverse square root of the angular frequen-cy ((ω−1/2), given in rotations per second (RPS)) of the rotation rates of the
glassy carbon working electrode disc in relation to the change in theinverse current density (J−1/A m−2) observed. This current density isobtained from the LSV scans displayed in Fig. 9 at −0.5, −0.6 and−0.7 V. Current densities were calculated with respect to the surface areaof the glassy carbon disc substrate (0.0706 cm2)
J Solid State Electrochem

In another study, an rGO/PDDA bi-layered catalyst (n=~2.85 at −0.6 V) shows comparable ORR efficiency to that ofthe rGO H2SO4 sample (n=~2.8 at −0.6 V) of this currentinvestigation [94], while a nitrogen-doped rGO (n=3.7) prep-aration highlights an ORR efficiency close to that of the idealfour-electron ORR catalysis facilitated by Pt/C [92]. Thisnitrogen-doped rGO was produced by pyrolysis of Hummer’sgraphene oxide with 5-aminotetrazole monohydrate (AM)under a N2-rich ambient environment [92]. The enhancementof ORR on the N-rGO produced after pyrolysis of GO withAM is due to the increased defects caused by the high level ofnitrogen incorporation (10.6 at.%), along with the significantedge plane exposure of the N-rGO particles [92]. Anotherstudy involving graphene sheets delivered by hydrazine re-duction at room pressure have indicated an electron transfer of~3.2 at −0.6 V [93]. These previously reported rGO prepara-tions highlight the rGO samples of this study to be comparableto some of the findings of other investigations, while alsobringing to light the opportunity for further enhancement.
The specific surface area values of the rGO H2SO4
sample is of most interest as the most enhanced ORRcatalysis of the developed rGO samples is provided afterreduction in sulphuric acid. The graphite powder used todeliver graphene oxide in this study was observed to have aBET [105] specific surface area value of 14.36 m2 g−1
(Fig. S7). Graphene oxide has been shown to provide aspecific surface area of 68–161 m2 g−1 [37, 74, 106], whichcorrelates with the freeze-dried graphene oxide sample ofthis study (102.29 m2 g−1).
In the present study, graphene oxide reduced in 0.1 Msulphuric acid resulted in a specific surface area(114.77 m2 g−1) that increased after hydrothermal treatment.The abrasive action of the reduction process appears to in-crease the specific surface area of rGO H2SO4 (Fig. S7) with-out noticeably affecting the appearance after reduction, asshown from SEM analysis (Fig. 1). The increase in the widthof the hysteresis in the GO after hydrothermal reduction in0.1 M H2SO4 indicates an enhancement of porosity with anincrease of the pore size distribution [107, 108]. A high levelof porosity within a graphenic material has been noted toenhance electrochemical behaviour [44, 109–111]. The morepores available on the surface, the higher the contact surfacearea with the electrolyte, providing opportunity for an en-hanced abundance of ORR active sites. This being the mostlikely avenue through which the increased surface area of therGO H2SO4 contributes to the enhanced ORR catalysis ob-served (Fig. 8).
Investigation of the capacitive behaviour of graphene oxidereduced in varied media during hydrothermal treatment
During analysis of the ORR current, the capacitive response isshown to be significant for the reduced graphene oxide
samples (Fig. 8), indicated by the varied current magnitudesbefore ORR onset during LSV analysis. A RDE provides aconstant flow of electrolyte to the working electrode surfaceduring analysis. The force exerted on the electrode surface bythe electrolyte flow during LSVanalysis needs to be removedto facilitate an undistorted observation of the capacitive cur-rent generated at the surface of the rGO coating. Cyclicvoltammetry is employed to measure the rGO samples at astagnant GCE working electrode, permitting observation ofany capacitive effect without adjustments from the flow ofelectrolyte to the electrode surface. Figure 11 displays a com-parison of the anodic and cathodic current response duringcyclic voltammetry analysis of the graphene oxide reduced indistilled water, 0.1 M sulphuric acid and 0.33 M hydrazine,respectively. The graphene oxide, untreated graphite and thebare GCE disc are also included for comparison purposes. Thecurrent detected during cyclic voltammetry analysis in O2-,air-, N2-saturated 0.1 M KOH electrolyte are compared foreach sample preparation (Fig. 11).
The CVevaluations of the rGO DI H2O sample show thatthe current response does not adjust significantly to changes indissolved oxygen concentrations. The rGO DI H2O sample at−0.312 V provides a cathodic current of 13.67 A g−1 in O2-saturated KOH, 14.67 A g−1 in air-saturated KOH and13.47 A g−1 being observed in N2-saturated KOH electrolyte.The current density at −0.312 V being most relevant due to theoxygen reduction peak indicated at approximately −0.312 Vfor the rGO preparations, as was confirmed for the rGO N2H4
sample during CV analysis in O2-saturated 0.1 M KOH(Fig. 11). Any change in the cathodic current as a result ofthe oxygen reduction should be detectable at approximate-ly −0.312 V. The rGO H2SO4 sample also shows an evenhigher degree of similarity in the cathodic current responsebetween the N2-saturated (18.67 A g−1), air-saturated(19.67 A g−1) and O2-saturated (20.21 A g−1) 0.1 MKOH assessments at −0.312 V. Although the current maychange slightly from catalysis at the developed rGO sur-face in response to variation in the dissolved O2 of theelectrolyte, there is a reliable pseudocapacitance that is notmodified significantly (Fig. 11).
The distinct ORR peak for the rGO N2H4 sample measuredin O2-saturated 0.1 M KOH provides a cathodic current of8.33 A g−1 at −0.312 V, while a decreased cathodic current isobserved from air-saturated (6.19 A g−1) and N2-saturated(5.20 A g−1) scans (Fig. 11). This sequential decrease of thecathodic current with a decrease in dissolved O2, seems to bedue to the decrease in the magnitude of the ORR catalysis. Thegraphene oxide reduced in 0.1 M sulphuric acid provides thehighest magnitude of the cathodic and anodic current responseat −0.312 V in comparison to the other rGO samples analysed(Fig. 11).
At −0.312 V, the graphite sample provides a low-levelcathodic current in O2-saturated (1.11 A g−1), air-saturated
J Solid State Electrochem
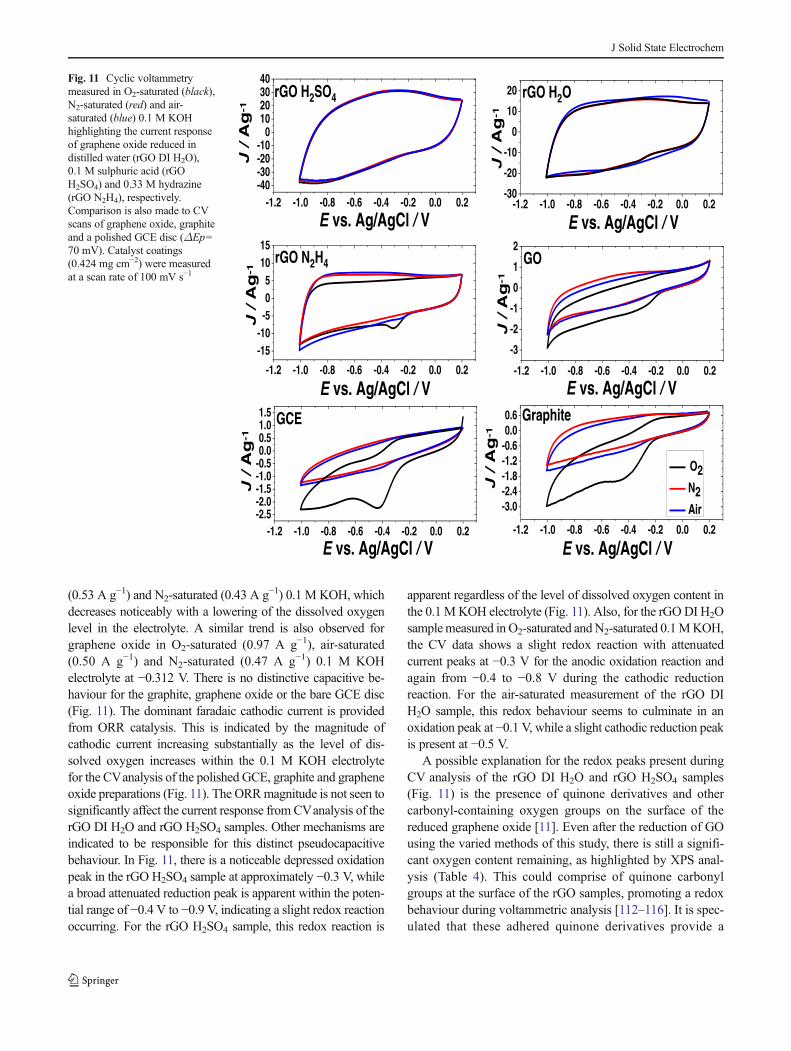
(0.53 A g−1) and N2-saturated (0.43 A g−1) 0.1 M KOH, whichdecreases noticeably with a lowering of the dissolved oxygenlevel in the electrolyte. A similar trend is also observed forgraphene oxide in O2-saturated (0.97 A g−1), air-saturated(0.50 A g−1) and N2-saturated (0.47 A g−1) 0.1 M KOHelectrolyte at −0.312 V. There is no distinctive capacitive be-haviour for the graphite, graphene oxide or the bare GCE disc(Fig. 11). The dominant faradaic cathodic current is providedfrom ORR catalysis. This is indicated by the magnitude ofcathodic current increasing substantially as the level of dis-solved oxygen increases within the 0.1 M KOH electrolytefor the CVanalysis of the polished GCE, graphite and grapheneoxide preparations (Fig. 11). The ORRmagnitude is not seen tosignificantly affect the current response from CVanalysis of therGO DI H2O and rGO H2SO4 samples. Other mechanisms areindicated to be responsible for this distinct pseudocapacitivebehaviour. In Fig. 11, there is a noticeable depressed oxidationpeak in the rGO H2SO4 sample at approximately −0.3 V, whilea broad attenuated reduction peak is apparent within the poten-tial range of −0.4 V to −0.9 V, indicating a slight redox reactionoccurring. For the rGO H2SO4 sample, this redox reaction is
apparent regardless of the level of dissolved oxygen content inthe 0.1 MKOH electrolyte (Fig. 11). Also, for the rGODI H2Osamplemeasured in O2-saturated andN2-saturated 0.1MKOH,the CV data shows a slight redox reaction with attenuatedcurrent peaks at −0.3 V for the anodic oxidation reaction andagain from −0.4 to −0.8 V during the cathodic reductionreaction. For the air-saturated measurement of the rGO DIH2O sample, this redox behaviour seems to culminate in anoxidation peak at −0.1 V, while a slight cathodic reduction peakis present at −0.5 V.
A possible explanation for the redox peaks present duringCV analysis of the rGO DI H2O and rGO H2SO4 samples(Fig. 11) is the presence of quinone derivatives and othercarbonyl-containing oxygen groups on the surface of thereduced graphene oxide [11]. Even after the reduction of GOusing the varied methods of this study, there is still a signifi-cant oxygen content remaining, as highlighted by XPS anal-ysis (Table 4). This could comprise of quinone carbonylgroups at the surface of the rGO samples, promoting a redoxbehaviour during voltammetric analysis [112–116]. It is spec-ulated that these adhered quinone derivatives provide a
-1.2 -1.0 -0.8 -0.6 -0.4 -0.2 0.0 0.2-2.5-2.0-1.5-1.0-0.50.00.51.01.5
-1.2 -1.0 -0.8 -0.6 -0.4 -0.2 0.0 0.2-30
-20
-10
0
10
20
-1.2 -1.0 -0.8 -0.6 -0.4 -0.2 0.0 0.2
-15-10
-505
1015
-1.2 -1.0 -0.8 -0.6 -0.4 -0.2 0.0 0.2
-3.0-2.4-1.8-1.2-0.60.00.6
-1.2 -1.0 -0.8 -0.6 -0.4 -0.2 0.0 0.2
-3
-2
-1
0
1
2
-1.2 -1.0 -0.8 -0.6 -0.4 -0.2 0.0 0.2-40-30-20-10
010203040
E vs. Ag/AgCl / VE vs. Ag/AgCl / V
E vs. Ag/AgCl / VE vs. Ag/AgCl / V
E vs. Ag/AgCl / V
J /
Ag
-1
J /
Ag
-1
J /
Ag
-1J
/ A
g-1
GraphiteGCE
GOrGO N2H4J
/ A
g-1
rGO H2O
J /
Ag
-1
E vs. Ag/AgCl / V
O2 N2 Air
rGO H2SO4
Fig. 11 Cyclic voltammetrymeasured in O2-saturated (black),N2-saturated (red) and air-saturated (blue) 0.1 M KOHhighlighting the current responseof graphene oxide reduced indistilled water (rGO DI H2O),0.1 M sulphuric acid (rGOH2SO4) and 0.33 M hydrazine(rGO N2H4), respectively.Comparison is also made to CVscans of graphene oxide, graphiteand a polished GCE disc (ΔEp=70 mV). Catalyst coatings(0.424 mg cm−2) were measuredat a scan rate of 100 mV s−1
J Solid State Electrochem
faradaic current contribution to the pseudocapacitive responseobserved from the rGO H2SO4 and rGO DI H2O samples[117]. The redox potential of surface-bound quinonederivatives varies in relation to the different types ofquinone moieties present at an electroactive surface [117].This is a possible explanation for the slight variation in theattenuated redox peak positions of the rGO DI H2O samplemeasured in O2-saturated and N2-saturated 0.1 M KOH mea-surements in comparison to the air-saturated CV analysis[118].
The current response during voltammetric analysis mayalso be partially due to oxygen reduction catalysed at thesequinone groupings on the rGO surface, although the exactmechanism involved is not definitively agreed upon amongcurrent literature [119]. ORR is seen to be predominantly atwo-step, two-electron process at quinone-based electrodecoatings, placing quinone catalysts as an ideal material forthe production of hydrogen peroxide in acidic electrolyte[117–119]. The variation in the current density of the rGON2H4, rGO DI H2O and rGO H2SO4 samples, as shown at−0.312 V in N2-saturated, O2-saturated and air-saturatedKOH, proves that there is a low-level faradaic current
contribution from the oxygen reduction reaction (Fig. 11).The reduction of oxygen to the perhydroxyl radical (HO2
−)involves a two-electron transfer, providing a well-definedcathodic current peak at the polished GCE, rGO N2H4, graph-ite and graphene oxide material coatings (Fig. 11).
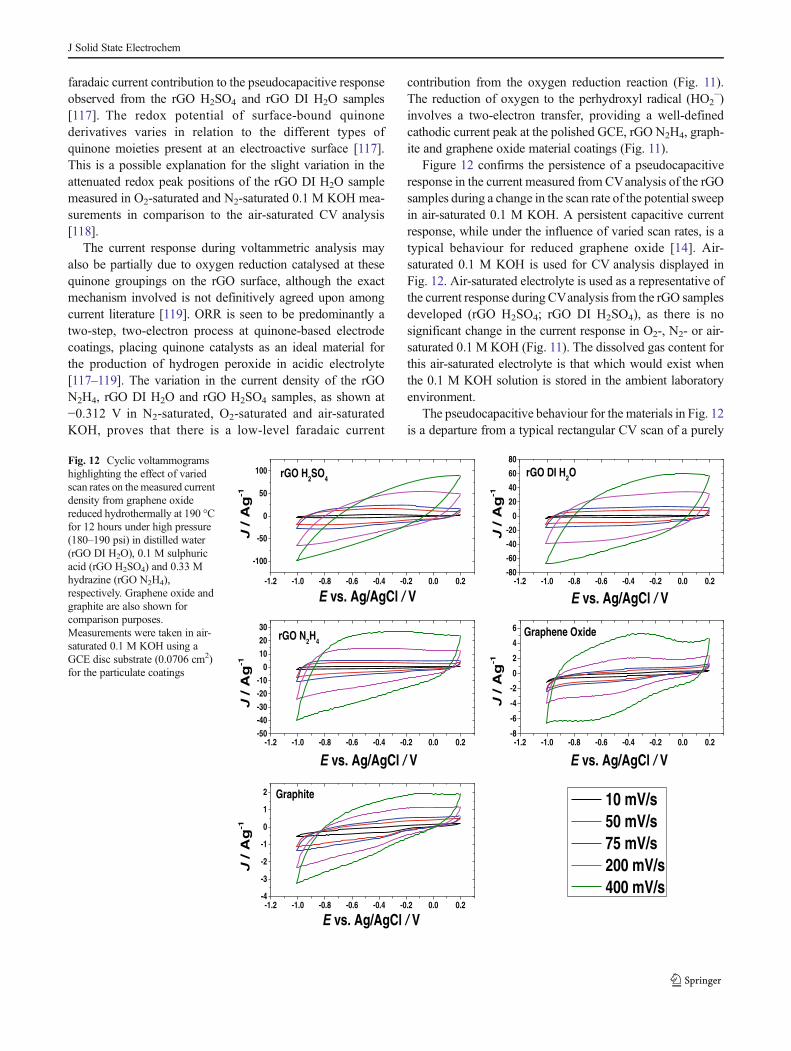
Figure 12 confirms the persistence of a pseudocapacitiveresponse in the current measured from CVanalysis of the rGOsamples during a change in the scan rate of the potential sweepin air-saturated 0.1 M KOH. A persistent capacitive currentresponse, while under the influence of varied scan rates, is atypical behaviour for reduced graphene oxide [14]. Air-saturated 0.1 M KOH is used for CV analysis displayed inFig. 12. Air-saturated electrolyte is used as a representative ofthe current response during CVanalysis from the rGO samplesdeveloped (rGO H2SO4; rGO DI H2SO4), as there is nosignificant change in the current response in O2-, N2- or air-saturated 0.1 M KOH (Fig. 11). The dissolved gas content forthis air-saturated electrolyte is that which would exist whenthe 0.1 M KOH solution is stored in the ambient laboratoryenvironment.
The pseudocapacitive behaviour for the materials in Fig. 12is a departure from a typical rectangular CV scan of a purely
-1.2 -1.0 -0.8 -0.6 -0.4 -0.2 0.0 0.2
-100
-50
0
50
100
-1.2 -1.0 -0.8 -0.6 -0.4 -0.2 0.0 0.2-80
-60
-40
-20
0
20
40
60
80
-1.2 -1.0 -0.8 -0.6 -0.4 -0.2 0.0 0.2-8
-6
-4
-2
0
2
4
6
-1.2 -1.0 -0.8 -0.6 -0.4 -0.2 0.0 0.2-4
-3
-2
-1
0
1
2
-1.2 -1.0 -0.8 -0.6 -0.4 -0.2 0.0 0.2-50-40-30-20-10
0102030
E vs. Ag/AgCl / V
E vs. Ag/AgCl / V
E vs. Ag/AgCl / V
J / A
g-1
J / A
g-1
J / A
g-1
J / A
g-1
E vs. Ag/AgCl / V
rGO DI H2O
J / A
g-1
E vs. Ag/AgCl / V
rGO H2SO4
Graphene Oxide
Graphite 10 mV/s 50 mV/s 75 mV/s 200 mV/s 400 mV/s
rGO N2H4
Fig. 12 Cyclic voltammogramshighlighting the effect of variedscan rates on themeasured currentdensity from graphene oxidereduced hydrothermally at 190 °Cfor 12 hours under high pressure(180–190 psi) in distilled water(rGO DI H2O), 0.1 M sulphuricacid (rGO H2SO4) and 0.33 Mhydrazine (rGO N2H4),respectively. Graphene oxide andgraphite are also shown forcomparison purposes.Measurements were taken in air-saturated 0.1 M KOH using aGCE disc substrate (0.0706 cm2)for the particulate coatings
J Solid State Electrochem

non-faradaic capacitive response. CV measurements inFig. 12 indicate a varied current magnitude, which is influ-enced by faradaic processes along with the underlying non-faradaic behaviour [14]. Nitrogen incorporation (3.9 at.%)after GO reduction in 0.33 M hydrazine (Table 4; Fig. 7) is acontributing factor to the increased capacitance present at thesurface of the rGO N2H4 sample. Pyridinic-N and pyrrolic-Nincorporation are the most beneficial types of nitrogenbonding for promotion of pseudocapacitive current,which is due to the higher electronic charge densityinferred [120–124]. The incorporated nitrogen modifiesthe electronic configuration, rendering the surface of therGO N2H4 sample more susceptible to ion adsorption,increasing the specific capacitance [125]. Also, the ox-ygen content of the rGO N2H4 sample (O 1s 5.12 at.%)of the current study (Table 4) is lower in comparison tothe rGO DI H2O and rGO H2SO4 samples promoting ahigher conductivity, thus enhancing the capacitive re-sponse [126, 127].
The capacitance response of the rGO H2SO4 sample can beattributed to the high level of C-C sp2 lattice restoration afterreduction of the graphene oxide [35, 128], indicated by thehighest increase in the ID/IG ratio (1.43) during Raman anal-ysis (Figs. 2 and S1; Table 1). The C-C sp2 bonding restora-tion along with a decrease in oxygen content contribute to thepromotion of a pseudocapacitive behaviour [35, 127, 128].Sulphur also assists in increasing the capacitive response ofgraphene preparations [129, 130]. The rGO H2SO4 sampleindicates a high level of defects at the surface of the GO after
reduction in 0.1 M sulphuric acid, as highlighted by thehighest ID/IG ratio from Raman data (1.43) (Table 1) [33].The carbon lattice defects can contribute to the incorporationof sulphur present in the rGO H2SO4 sample [87]. Theseaspects of the rGO H2SO4 sample promote thepseudocapacitive current response observed (Figs. 11 and12). The rGO DI H2O sample has an enhancedpseudocapacitive response as a result of the decrease in theoxygen content (O 1s 14.47 at.%) (Table 4), while a dramaticdecrease in oxygen content (O 1s 5.12 at.%) appears tocontribute to the promotion of the prominent pseudocapacitivebehaviour of the rGO N2H4 sample (Figs. 11 and 12; Table 4).
The pH of the graphene oxide suspension during reduc-tion has been noted to influence the topology of the resul-tant graphene sheets [32]. The more acidic the hydrother-mal suspension during graphene oxide reduction, the morevariation in the structure [32], while an alkaline solutionallows the formation of graphene sheets with a loweramount of surface defects indicated [32]. This correlateswith the low defects suggested by the low ID/IG ratio valuefrom the rGO N2H4 sample (ID/IG=1.00), derived fromtreatment in an alkaline solution of 0.33 M hydrazine (pH~10). While the more acidic hydrothermal treatment of theGO suspension (0.1 M sulphuric acid (pH ~1)), providesindications of a high level of surface defects, as shown byRaman analysis (Figs. 2 and S1; Table 1).
Figure 13 highlights the change of the current re-sponse between the beginning (scan 1) and conclusion(scan 10,000) of a continuous repetitive CV analysis. A
-1.2 -1.0 -0.8 -0.6 -0.4 -0.2 0.0 0.2
-40
-30
-20
-10
0
10
20
30
-1.2 -1.0 -0.8 -0.6 -0.4 -0.2 0.0 0.2
-100
-50
0
50
100
-1.2 -1.0 -0.8 -0.6 -0.4 -0.2 0.0 0.2-80
-60
-40
-20
0
20
40
60
80
rGO N2H4 rGO H2SO4
rGO DI H2O
E vs. Ag/AgCl / VE vs. Ag/AgCl / V
J / A
g-1
J / A
g-1J
/ Ag-1
E vs. Ag/AgCl / V
Scan 1Scan 10,000
Fig. 13 Cyclic voltammograms of 0.424 mg cm−2 material coatings ofgraphene oxide reduced in distilled water (rGODI H2O), 0.1 M sulphuricacid (rGO H2SO4) and 0.33 M hydrazine (rGO N2H4), respectively. Thefirst (black) and the last (red) CV scans are displayed from a 10,000
continuous repetitive CVanalysis. Scan rate employed is 400 mV s−1. CVmeasured in air-saturated 0.1 M KOH. The GCE disc used for analysishas a working area of 0.0706 cm2
J Solid State Electrochem
highly stable current is indicated for all the rGO samplesanalysed in the present study, confirming the validity andstability of the pseudocapacitive behaviour observed(Fig. 13).
Elaboration on the dynamics at the surface of the rGOcoatings during electrochemical analysis
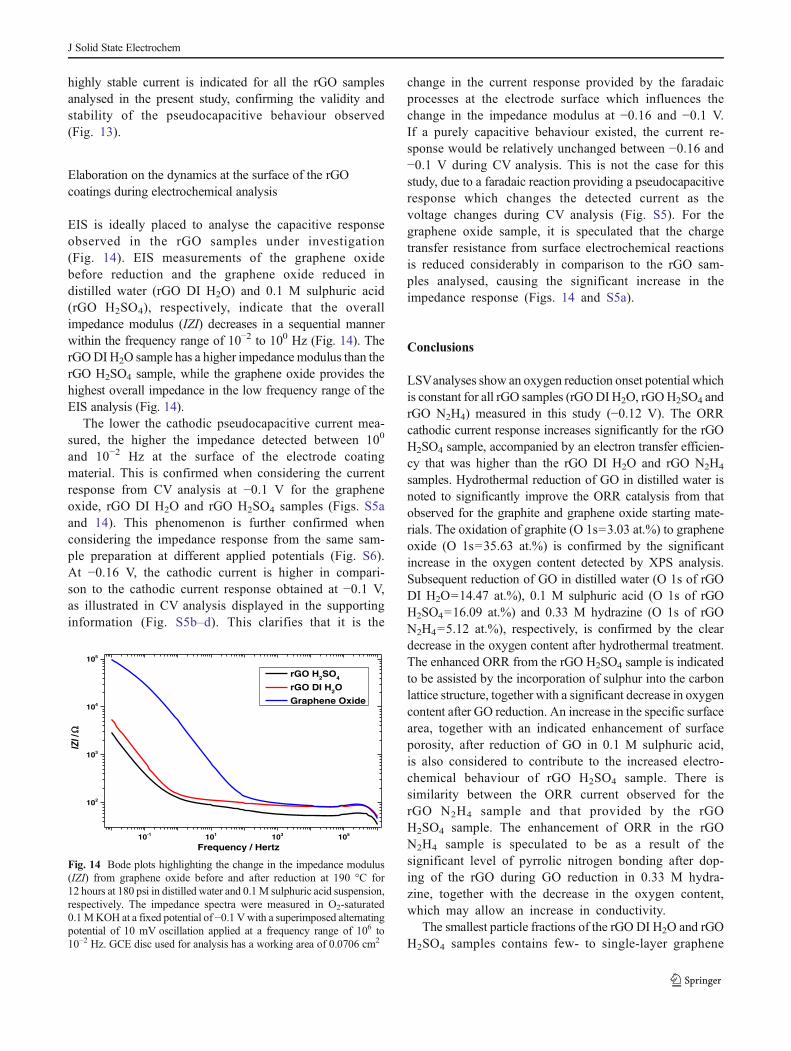
EIS is ideally placed to analyse the capacitive responseobserved in the rGO samples under investigation(Fig. 14). EIS measurements of the graphene oxidebefore reduction and the graphene oxide reduced indistilled water (rGO DI H2O) and 0.1 M sulphuric acid(rGO H2SO4), respectively, indicate that the overallimpedance modulus (IZI) decreases in a sequential mannerwithin the frequency range of 10−2 to 100 Hz (Fig. 14). TherGODI H2O sample has a higher impedance modulus than therGO H2SO4 sample, while the graphene oxide provides thehighest overall impedance in the low frequency range of theEIS analysis (Fig. 14).
The lower the cathodic pseudocapacitive current mea-sured, the higher the impedance detected between 100
and 10−2 Hz at the surface of the electrode coatingmaterial. This is confirmed when considering the currentresponse from CV analysis at −0.1 V for the grapheneoxide, rGO DI H2O and rGO H2SO4 samples (Figs. S5aand 14). This phenomenon is further confirmed whenconsidering the impedance response from the same sam-ple preparation at different applied potentials (Fig. S6).At −0.16 V, the cathodic current is higher in compari-son to the cathodic current response obtained at −0.1 V,as illustrated in CV analysis displayed in the supportinginformation (Fig. S5b–d). This clarifies that it is the
change in the current response provided by the faradaicprocesses at the electrode surface which influences thechange in the impedance modulus at −0.16 and −0.1 V.If a purely capacitive behaviour existed, the current re-sponse would be relatively unchanged between −0.16 and−0.1 V during CV analysis. This is not the case for thisstudy, due to a faradaic reaction providing a pseudocapacitiveresponse which changes the detected current as thevoltage changes during CV analysis (Fig. S5). For thegraphene oxide sample, it is speculated that the chargetransfer resistance from surface electrochemical reactionsis reduced considerably in comparison to the rGO sam-ples analysed, causing the significant increase in theimpedance response (Figs. 14 and S5a).
Conclusions
LSVanalyses show an oxygen reduction onset potential whichis constant for all rGO samples (rGODI H2O, rGOH2SO4 andrGO N2H4) measured in this study (−0.12 V). The ORRcathodic current response increases significantly for the rGOH2SO4 sample, accompanied by an electron transfer efficien-cy that was higher than the rGO DI H2O and rGO N2H4
samples. Hydrothermal reduction of GO in distilled water isnoted to significantly improve the ORR catalysis from thatobserved for the graphite and graphene oxide starting mate-rials. The oxidation of graphite (O 1s=3.03 at.%) to grapheneoxide (O 1s=35.63 at.%) is confirmed by the significantincrease in the oxygen content detected by XPS analysis.Subsequent reduction of GO in distilled water (O 1s of rGODI H2O=14.47 at.%), 0.1 M sulphuric acid (O 1s of rGOH2SO4=16.09 at.%) and 0.33 M hydrazine (O 1s of rGON2H4=5.12 at.%), respectively, is confirmed by the cleardecrease in the oxygen content after hydrothermal treatment.The enhanced ORR from the rGO H2SO4 sample is indicatedto be assisted by the incorporation of sulphur into the carbonlattice structure, together with a significant decrease in oxygencontent after GO reduction. An increase in the specific surfacearea, together with an indicated enhancement of surfaceporosity, after reduction of GO in 0.1 M sulphuric acid,is also considered to contribute to the increased electro-chemical behaviour of rGO H2SO4 sample. There issimilarity between the ORR current observed for therGO N2H4 sample and that provided by the rGOH2SO4 sample. The enhancement of ORR in the rGON2H4 sample is speculated to be as a result of thesignificant level of pyrrolic nitrogen bonding after dop-ing of the rGO during GO reduction in 0.33 M hydra-zine, together with the decrease in the oxygen content,which may allow an increase in conductivity.
The smallest particle fractions of the rGO DI H2O and rGOH2SO4 samples contains few- to single-layer graphene
10-1 101 103 105
102
103
104
105
IZI /
Frequency / Hertz
rGO H2SO4
rGO DI H2O
Graphene Oxide
Fig. 14 Bode plots highlighting the change in the impedance modulus(IZI) from graphene oxide before and after reduction at 190 °C for12 hours at 180 psi in distilled water and 0.1M sulphuric acid suspension,respectively. The impedance spectra were measured in O2-saturated0.1MKOH at a fixed potential of −0.1 Vwith a superimposed alternatingpotential of 10 mV oscillation applied at a frequency range of 106 to10−2 Hz. GCE disc used for analysis has a working area of 0.0706 cm2
J Solid State Electrochem
particles as indicated by AFM analysis. The high in-crease of the ID/IG ratio for the rGO H2SO4 sampleindicates an increase in the point defects that may actas ORR active sites resulting in an enhancement ofcatalysis. These defects are indicated to increase as aresult of the decrease of the domain size in the carbonlattices. The minute amount of sulphur incorporationmay also contribute to the abundance of carbon latticedefects.
A significant difference in charging current is indicatedbefore ORR onset in LSV analysis of the rGO samplesproduced. This shows a varied capacitive effect at therGO surface, resulting from a change in the medium usedduring hydrothermal GO reduction. The developed rGOsamples provide a prominent pseudocapacitive behaviourunder the diffusion-dependent conditions of CV analysis.The pseudocapacitive current response of the rGO DI H2Oand rGO H2SO4 samples is only slightly affected by thechange of the dissolved oxygen concentration in the elec-trolyte. This shows a slight contribution to the current fromoxygen reduction during CV analysis, but the dominantreaction appears to be a redox system. This indicates theinvolvement of carbonyl groups, such as quinones, in aredox reaction at the surface of the rGO particulates. Theredox cycling of the quinone derivatives could cause theattenuated and broad reduction and oxidation peaks ob-served during cyclic voltammetry analysis. The reliabilityof the pseudocapacitive behaviour of all the rGO samplesis observed with a stable pseudocapacitive current over acontinuous 10,000 CV scan assessment. The impedance ishighest for the graphene oxide electrode preparation. Asthe overall pseudocapacitive current increases, the imped-ance decreases. GO reduction in hydrazine incorporatesnitrogen into the carbon lattice (3.9 at.%), which is indi-cated to assist in increasing the specific capacitancecalculated.
The proposed facile method of rGO production al-lows a potentially cost effective and scalable avenuetowards fuel cell catalyst material which could contrib-ute to making this technology more widely available.With similarity between the GO reduced in sulphuricacid with that of rGO produced in hydrazine, the possibleredundancy of toxic chemical-based GO reduction methods isalso suggested. The pseudocapacitive behaviour for the de-veloped rGO samples of this study indicates potential forfuture applications in the area of electrical power storagedevices.
Acknowledgments The authors wish to acknowledge the financialsupport of the Department of Employment and Learning, Northern Ire-land, during the completion of this study. Assistance with access tofreeze-drying facilities from Dr. Mukhtar Ahmed is graciously acknowl-edged. Sincere gratitude is extended to Mrs. Grace Hayes for her soundsupport and to Mr. William Bartolome Hayes for important motivation.
References
1. Kim J, Cote LJ, Huang J (2012) Acc Chem Res 45:1356–13642. Buchsteiner A, Lerf A, Pieper J (2006) J Phys Chem B 110:22328–
223383. Schniepp H, Li J, McAllister M, Sai H, Herrera-Alonso M,
Adamson D, Prudhomme RK, Car R, Saville DA, Aksay IA(2006) J Phys Chem B 110:8535–8539
4. Szabó T, Berkesi O, Forgó P, Josepovits K, Sanakis Y, Petridis D,Dékány I (2006) Chem Mater 18:2740–2749
5. Hontoria-Lucas C, Lopez-Peinado AJ, Lopez-Gonzalez JD, Rojas-Cervantes ML, Martin-Aranda RM (1995) Carbon 33:1585–1592
6. Mattevi C, Eda G, Agnoli S, Miller S, Mkhoyan K, Celik O,Mastrogiovanni D, Granozzi G, Garfunkel E, Chhowalla M(2009) Adv Funct Mater 19:2577–2583
7. Sutar DS, Narayanam PK, Singh G, Botcha VD, Talwar SS,Srinivasa RS, Major SS (2012) Thin Solid Films 520:5991–5996
8. Park S, An SJ, Potts J, Velamakanni A, Murali S, Ruoff R (2011)Carbon 49:3019–3023
9. Shin H, Kim K, Benayad A, Yoon S, Park H, Jung I, Jin M, JeongH, Kim J, Choi J, Lee Y (2009) Adv Funct Mater 19:1987–1992
10. Su CY, Xu YP, Zhang WJ, Zhao JW, Liu AP, Tang XH, Tsai CH,Huang YZ, Li LJ (2010) ACS Nano 4:5285–5292
11. Stankovich S, Dikin DA, Piner RD, Kohlhaas KA, KleinhammesA,Jia Y, Wu Y, Nguyen ST, Ruoff RS (2007) Carbon 45:1558–1565
12. Chen H, Müller MB, Gilmore KJ, Wallace GG, Li D (2008) AdvMater 20:3557–3561
13. Si Y, Samulski ET (2008) Nano Lett 8:1679–168214. Perera SD, Mariano RG, Nijem N, Chabal Y, Ferraris JP, Balkus KJ
Jr (2012) J Power Sources 215:1–1015. Chua CK, Pumera M (2014) Chem Soc Rev 43:291–31216. Bourlinos AB, Gournis D, Petridis D, Szabó T, Szeri A, Dékány I
(2003) Langmuir 19:6050–605517. Wang G, Yang J, Park J, Gou X, Wang B, Liu H, Yao J (2008) J
Phys Chem C 112:8192–819518. Cote LJ, Cruz-Silva R, Huang JX (2009) J Am Chem Soc 131:
11027–1103219. Zhang Y, Guo L, Wei S, He Y, Xia H, Chen Q, Sun H-B, Xiao F-S
(2010) NanoToday 5:15–2020. Mao S, Pu H, Chen J (2012) RSC Adv 2:2643–266221. Hassan H, Abdelsayed V, Khder A, AbouZeid K, Terner J, El-Shall
M, Al-Resayes SI, El-Azhary AA (2009) J Mater Chem 19:3832–3837
22. Wei ZQ, Wang DB, Kim S, Kim SY, Hu YK, Yakes MK,Laracuente AR, Dai ZT, Marder SR, Berger C, King WP, de HeerWA, Sheehan PE, Riedo E (2010) Science 328:1373–1376
23. Zhu YW, Stoller MD, CaiWW, Velamakanni A, Piner RD, Chen D,Ruoff RS (2010) ACS Nano 4:1227–1233
24. Baraket M, Walton SG, Wei Z, Lock EH, Robinson JT, Sheehan P(2010) Carbon 48:3382–3390
25. Chen WF, Yan LF, Bangal PR (2010) Carbon 48:1146–115226. Sokolov DA, Shepperd KR, Orlando TM (2010) J Phys Chem Lett
1:2633–263627. Yang D, Velamakanni A, Bozoklu G, Park S, Stoller M, Piner RD,
Stankovich S, Jung I, Field DA, Ventrice CA, Ruoff RS (2009)Carbon 47:145–152
28. Yao PP, Chen PL, Jiang L, Zhao HP, Zhu HF, Zhou D, HuWP, HanBH, Liu MH (2010) Adv Mater 22:5008–5012
29. ZhuW, Murali S, Stoller MD, Velamakanni A, Piner RD, Ruoff RS(2010) Carbon 48:2118–2122
30. McAllister M, Li J, Adamson D, Schniepp H, Abdala A, Liu J,Herrera-Alonso M, Milius DL, Car R, Prudhomme RK, Aksay IA(2007) Chem Mater 19:4396–4404
31. Min K, Han TH, Kim J, Jung J, Jung C, Hong SM, Koo CM (2012)J Colloid Interface Sci 383:36–42
J Solid State Electrochem
32. Bosch-Navarro C, Coronado E, Martí-Gastaldo C, Sánchez-RoyoJF, Gómez MG (2012) Nanoscale 4:3977–3982
33. Zhou Y, Bao Q, Tang LAL, Zhong Y, Loh KP (2009) Chem Mater21:2950–2956
34. Gao W, Alemany L, Ci L, Ajayan P (2009) Nat Chem 1:403–40835. Tien HN, Luan VH, Lee TK, Kong B-S, Chung JS, Kim EJ, Hur SH
(2012) Chem Eng J 211–212:97–10336. Lin L, Zhang S (2012) J Mater Chem 22:14385–1439337. Fan L-Z, Liu J-L, Ud-Din R, Yan X, Qu X (2012) Carbon 50:3724–
373038. Jiaoxing X (2013) Chemsuschem 6:493–49939. Lee KR, Lee KU, Lee JW, Ahn BT, Woo SI (2010) Electrochem
Commun 12:1052–105540. Huang C, Li C, Shi G (2012) Energy Environ Sci 5:8848–886841. Hummers W, Offeman R (1958) J Am Chem Soc 80:1339–
133942. Kong HX (2013) Curr Opin Solid State Mater Sci 17:31–3743. Eigler S, Grimm S, Hirsch A (2014) Chem Eur J 20:984–98944. Liu C, Yu Z, Neff D, ZhamuA, JangBZ (2010) NanoLett 10:4863–
486845. Yan J, Liu JP, Fan ZJ, Wei T, Zhang LJ (2012) Carbon 50:2179–
218846. Gomez-Navarro C, Weitz RT, Bittner AM, Scolari M, Mews A,
Burghard M, Kern K (2007) Nano Lett 7:3499–350347. Lomeda JR, Doyle CD, Kosynkin DV, HwangW-F, Tour JM (2008)
J Am Chem Soc 130:16201–1620648. Gokus T, Nair RR, Bonetti A, BohmlerM, LombardoA, Novoselov
KS, GeimAK, Ferrari AC, Hartschuh A (2009) ACS Nano 3:3963–3968
49. Trusovas R, Ratautas K, Raciukaitis G, Barkauskas J, StankevicieneI, Niaura G, Mazeikiene R (2013) Carbon 52:574–582
50. Graf D, Molitor F, Ensslin K, Stampfer C, Jungen A, Hierold C,Wirtz L (2007) Eur Phys J Spec Top 148:171–176
51. Rohrl J, Hundhausen M, Emtsev K, Seyller T, Graupner R, Ley L(2008) Appl Phys Lett 92:201918–201921
52. Ferrari AC (2007) Solid State Commun 143:47–5753. Ferrari AC,Meyer JC, Scardaci V, Casiraghi C, Lazzeri M, Mauri F,
Pisanec S, Jiang D, Novoselov KS, Roth S, Geim AK (2006) PhysRev Lett 97:187401
54. Boutchich M, Jaffré A, Alamarguy D, Alvarez J, Barras A,Tanizawa Y, Tero R, Okada H, Thu TV, Kleider JP, Sandhu A(2013) J Phys Conf Ser 433:012001
55. Ganguly A, Sharma S, Papakonstantinou P, Hamilton J (2011) JPhys Chem C 115:17009–17019
56. Fan ZJ, Wang K,Wei T, Yan J, Song LP, Shao B (2010) Carbon 48:1686–1689
57. Li Y, Lv X, Lu J, Li J (2010) J Phys Chem C 114:21770–2177458. He D, Kou Z, Xiong Y, Cheng K, Chen X, Pan M, Mu S (2014)
Carbon 66:312–31959. Wang W, Wang Z, Liu Y, Li N, Wang W, Gao J (2012) Mater Res
Bull 47:2245–225160. Pham VH, Cuong TV, Hur SH, Oh E, Kim EJ, Shin EW, Chung JS
(2011) J Mater Chem 21:3371–337761. Park S, An J, Jung I, Piner RD, An SJ, Li X, Velamakanni A, Ruoff
RS (2009) Nano Lett 9:1593–159762. Lerf A, Buchsteiner A, Pieper J, Schottl S, Dekany I, Szabo T,
Boehm HP (2006) J Phys Chem Solids 67:1106–111063. Liu C, Hu G, Gao H (2012) J Supercrit Fluids 63:99–10464. Antolini E (2012) Appl Catal B Environ 123–124:52–6865. Ban FY, Majid SR, Huang NM, Lim HN (2012) Int J Electrochem
Sci 7:4345–435166. Hsieh C-T, Hsu S-M, Lin J-Y, Teng H (2011) J Phys Chem C 115:
12367–1237467. Liang J, Jiao Y, Jaroniec M, Qiao SZ (2012) Angew Chem Int Ed
51:11496–1150068. Wan S, Wang L, Xue Q (2010) Electrochem Commun 12:61–65
69. Fan X, Peng W, Li Y, Li X, Wang S, Zhang G, Zhang F (2008) AdvMater 20:4490–4493
70. Guo H-L, Peng S, Kang X, Ning S-K (2013) JMater Chem 1:2248–2255
71. Pham VH, PhamHD, Dang TT, Hur SH, Kim EJ, Kong BS, Kim S,Chung JS (2012) J Mater Chem 22:10530–10536
72. Vesel A, Mozetic M (2009) J Phys Conf Ser 162:01201573. Choi CH, Park SH, Woo SI (2011) Green Chem 13:406–41274. Seredych M, Tamashausky AV, Bandosz TJ (2010) Adv Funct
Mater 20:1670–167975. Ellis AV, Al-deen A, Dalal H, AnderssonGG (2013) J Phys ChemC
117:21312–2131976. Chen W, Yan L, Bangal PR (2010) J Phys Chem C 114:19885–
1989077. Zhao G, Jiang L, He Y, Li J, Dong H, Wang X, Hu W (2011) Adv
Mater 23:3959–396378. Liu F, Sun J, Zhu L, Meng X, Qi C, Xiao F-S (2012) J Mater Chem
22:5495–550279. Novoselov K, Geim A, Morozov S, Jiang D, Zhang Y, Dubonos S,
Grigorieva IV, Firsov AA (2004) Science 306:666–66980. Wu D, Zhang F, Liang H, Feng X (2012) Chem Soc Rev 41:6160–
617781. Gao X, Jang J, Nagase S (2010) J Phys Chem C 114:832–84282. Zalan Z, Lazar L, Fulop F (2005) Curr Org Chem 9:357–37683. Bard AJ, Faulkner LR (2001) Electrochemical methods fundamen-
tals and applications, 2nd edn. Wiley, Hoboken84. Yang H-H, McCreery RL (2000) J Electrochem Soc 147:3420–
342885. Song C, Zhang J (2008) In: Zhang J (ed) PEM fuel cell
electrocatalysts and catalyst layers, vol 12. Springer, Vancouver86. Wu J, Yang H (2013) Acc Chem Res 46:1848–185787. Yang Z, Yao Z, Li G, Fang G, Nie H, Liu Z, Zhou X, Chen X,
Huang S (2012) ACS Nano 6:205–21188. Wohlgemuth S-A, White RJ, Willinger M-G, Titirici M-M,
Antonietti M (2012) Green Chem 14:1515–152389. Park J-E, Jang YJ, Kim YJ, Song MS, Yoon S, Kim DH, Kim SJ
(2014) Phys Chem Chem Phys 16:103–10990. Seredych M, Bandosz TJ (2014) Carbon 66:227–23391. Slater JC (1964) J Chem Phys 41:319992. Lu Z-J, Bao S-J, Gou Y-T, Cai C-J, Ji C-C, Xu M-W, Song J, Wang
R (2013) RSC Adv 3:3990–399593. Wu J, Wang Y, Zhang D (2011) Adv Mater Res 197–198:667–67194. Huang D, Zhang B, Zhang Y, Zhaan F, Xu X, Shen Y, Wang M
(2013) J Mater Chem A 1:1415–142095. Xu S, Yong L, Wu P (2013) ACS Appl Mater Interfaces 5:654–66296. Fu X, Liu Y, Cao X, Jin J, Liu Q, Zhang J (2013) Appl Catal B
Environ 130–131:143–15197. He D, Jiang Y, Lv H, Pan M, Mu S (2013) Appl Catal B Environ
132–133:379–38898. Koutecky J, Levich VG (1958) Zh Fiz Khim 32:1565–157599. Koutecky J, Levich VG (1957) Dokl Akad Nauk SSSR 117:441–
444100. Masa J, Batchelor-McAuley C, Schuhmann W, Compton RG
(2014) Nano Res 7:71–78101. Yang Z, Nie H, Chen X, Chen X, Huang S (2013) J Power Sources
236:238–249102. Yang S, Feng X, Wang X, Müllen K (2011) Angew Chem
Int Ed 50:5339–5343103. Zhou X, Yang Z, Nie H, Yao Z, Zhang L, Huang S (2011) J Power
Sources 196:9970–9974104. Yang Z, Zhou X, Nie H, Yao Z, Huang S (2011) ACS Appl Mater
Interfaces 3:2601–2606105. Brunauer S, Emmett PH, Teller E (1938) JAmChemSoc 60:309–319106. You S, Luzan SM, Szabó T, Talyzin AV (2013) Carbon 52:171–180107. Farghali AA, Bahgat M, El Rouby WMA, Khedr MH (2013) J
Alloys Compd 555:193–200
J Solid State Electrochem
108. Mishra AK, Ramaprabhu S (2011) Desalination 282:39–45109. Jiang Y, Chen D, Song J, Jiao Z, Ma Q, Zhang H, Cheng L, Zhao B,
Chu Y (2013) Electrochim Acta 91:173–178110. Radich JG, Kamat PV (2012) ACS Catal 2:807–816111. Li Y, van Zijll M, Chiang S, Pan N (2011) J Power Sources 196:
6003–6006112. Guin PS, Das S, Mandal PC (2008) Int J Electrochem Sci 3:1016–
1028113. Guin PS, Das S, Mandal PC (2010) J Phys Org Chem 23:477–482114. Gill R, Stonehill HI (1952) J Chem Soc:1845–1857115. Furman NH, Stone KG (1948) J Am Chem Soc 70:3055–3061116. Nurmi JT, Tratnyek PG (2002) Environ Sci Technol 36:617–624117. Sarapuu A, Helstein K, Vaik K, Schiffrin DJ, Tammeveski K (2010)
Electrochim Acta 55:6376–6382118. Sarapuu A, Vaik K, Schiffrin DJ, Tammeveski K (2003) J
Electroanal Chem 541:23–29119. Li Q, Batchelor-McAuley C, Lawrence NS, Hartshorne RS,
Compton RG (2011) Chem Phys Chem 12:1255–1257
120. Lee Y-H, Chang K-H, Hu C-C (2013) J Power Sources 227:300–308
121. Frackowiak E (2007) Phys Chem Chem Phys 9:1774–1785122. Hulicova-Jurcakova D, Kodama M, Shiraishi S, Hatori H, Zhu ZH,
Lu GQ (2009) Adv Funct Mater 19:1800–1809123. Lota G, Lota K, Frackowiak E (2007) Electrochem Commun 9:
1828–1832124. Jeong HM, Lee JW, Shin WH, Choi YJ, Shin HJ, Kang JK, Choi
JW (2011) Nano Lett 11:2472–2477125. Zhu ZH, Hatori H, Wang SB, Lu GQ (2005) J Phys Chem B 109:
16744–16749126. Bai Y, Rakhi RB, Chen W, Alshareef HN (2013) J Power Sources
233:313–319127. Luo Z, Zhu L, Huang Y, Tang H (2013) Synth Met 175:88–96128. DeakinMR,Wightman RM (1986) J Electroanal Chem 206:167–177129. Deyi Z (2013) J Mater Chem A 1:7584–7591130. Huang J-Q, Liu X-F, Zhang Q, Chen C-M, Zhao M-Q, Zhang S-M,
Zhu W, Qian W-Z, Wei F (2013) Nano Energy 2:314–321
J Solid State Electrochem