The electrochemical performance of reduced graphene oxide ...
Upload
ucberkeleyCategory
view
3download
0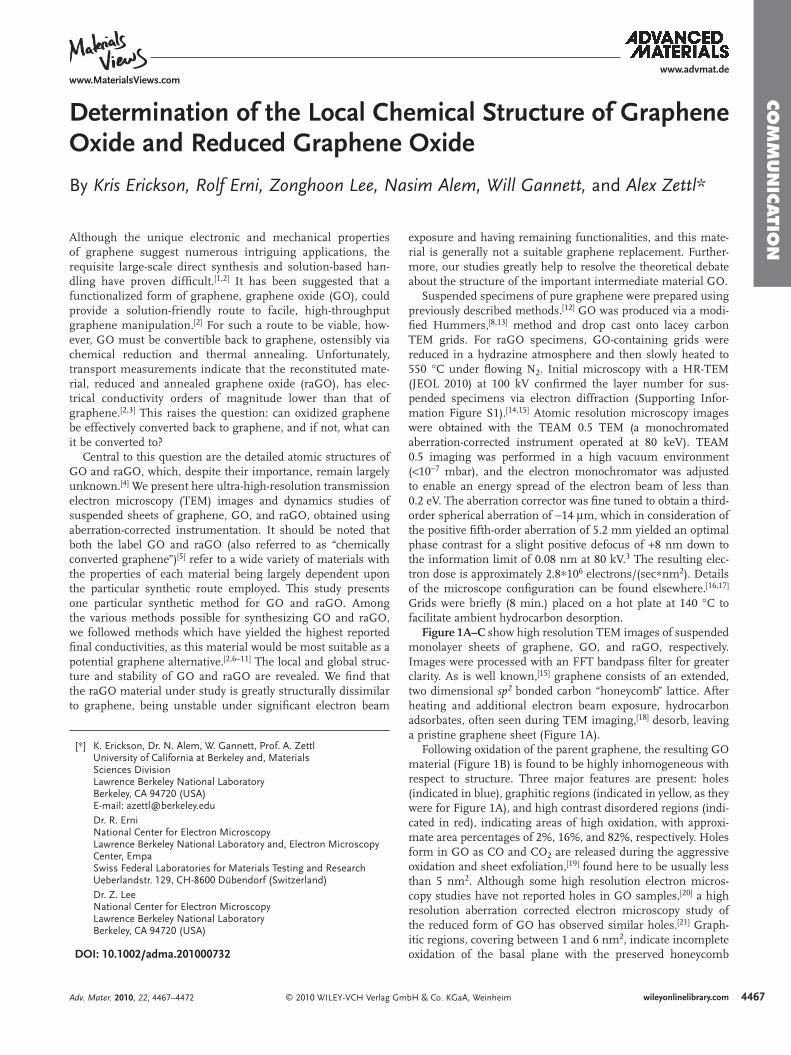
www.advmat.dewww.MaterialsViews.com
CO
MM
Determination of the Local Chemical Structure of Graphene Oxide and Reduced Graphene Oxide
UNIC
A
By Kris Erickson , Rolf Erni , Zonghoon Lee , Nasim Alem , Will Gannett , and Alex Zettl *
TION
Although the unique electronic and mechanical propertiesof graphene suggest numerous intriguing applications, the requisite large-scale direct synthesis and solution-based han-dling have proven diffi cult. [ 1 , 2 ] It has been suggested that a functionalized form of graphene, graphene oxide (GO), could provide a solution-friendly route to facile, high-throughput graphene manipulation. [ 2 ] For such a route to be viable, how-ever, GO must be convertible back to graphene, ostensibly via chemical reduction and thermal annealing. Unfortunately, transport measurements indicate that the reconstituted mate-rial, reduced and annealed graphene oxide (raGO), has elec-trical conductivity orders of magnitude lower than that of graphene. [ 2 , 3 ] This raises the question: can oxidized graphene be effectively converted back to graphene, and if not, what can it be converted to?
Central to this question are the detailed atomic structures of GO and raGO, which, despite their importance, remain largely unknown. [ 4 ] We present here ultra-high-resolution transmission electron microscopy (TEM) images and dynamics studies of suspended sheets of graphene, GO, and raGO, obtained using aberration-corrected instrumentation. It should be noted that both the label GO and raGO (also referred to as “chemically converted graphene”) [ 5 ] refer to a wide variety of materials with the properties of each material being largely dependent upon the particular synthetic route employed. This study presents one particular synthetic method for GO and raGO. Among the various methods possible for synthesizing GO and raGO, we followed methods which have yielded the highest reported fi nal conductivities, as this material would be most suitable as a potential graphene alternative. [ 2 , 6–11 ] The local and global struc-ture and stability of GO and raGO are revealed. We fi nd that the raGO material under study is greatly structurally dissimilar to graphene, being unstable under signifi cant electron beam
© 2010 WILEY-VCH Verlag GmAdv. Mater. 2010, 22, 4467–4472
[∗] K. Erickson , Dr. N. Alem , W. Gannett , Prof. A. Zettl University of California at Berkeley and, Materials Sciences Division Lawrence Berkeley National Laboratory Berkeley, CA 94720 (USA) E-mail: [email protected] Dr. R. Erni National Center for Electron Microscopy Lawrence Berkeley National Laboratory and, Electron Microscopy Center, Empa Swiss Federal Laboratories for Materials Testing and Research Ueberlandstr. 129, CH-8600 Dübendorf (Switzerland) Dr. Z. Lee National Center for Electron Microscopy Lawrence Berkeley National Laboratory Berkeley, CA 94720 (USA)
DOI: 10.1002/adma.201000732
exposure and having remaining functionalities, and this mate-rial is generally not a suitable graphene replacement. Further-more, our studies greatly help to resolve the theoretical debate about the structure of the important intermediate material GO.
Suspended specimens of pure graphene were prepared using previously described methods. [ 12 ] GO was produced via a modi-fi ed Hummers, [ 8 , 13 ] method and drop cast onto lacey carbon TEM grids. For raGO specimens, GO-containing grids were reduced in a hydrazine atmosphere and then slowly heated to 550 ° C under fl owing N 2 . Initial microscopy with a HR-TEM (JEOL 2010) at 100 kV confi rmed the layer number for sus-pended specimens via electron diffraction (Supporting Infor-mation Figure S1). [ 14 , 15 ] Atomic resolution microscopy images were obtained with the TEAM 0.5 TEM (a monochromated aberration-corrected instrument operated at 80 keV). TEAM 0.5 imaging was performed in a high vacuum environment ( < 10 − 7 mbar), and the electron monochromator was adjusted to enable an energy spread of the electron beam of less than 0.2 eV. The aberration corrector was fi ne tuned to obtain a third-order spherical aberration of − 14 μ m, which in consideration of the positive fi fth-order aberration of 5.2 mm yielded an optimal phase contrast for a slight positive defocus of + 8 nm down to the information limit of 0.08 nm at 80 kV. 3 The resulting elec-tron dose is approximately 2.8 ∗ 10 6 electrons/(sec ∗ nm 2 ). Details of the microscope confi guration can be found elsewhere. [ 16 , 17 ] Grids were briefl y (8 min.) placed on a hot plate at 140 ° C to facilitate ambient hydrocarbon desorption.
Figure 1 A–C show high resolution TEM images of suspended monolayer sheets of graphene, GO, and raGO, respectively. Images were processed with an FFT bandpass fi lter for greater clarity. As is well known, [ 15 ] graphene consists of an extended, two dimensional sp 2 bonded carbon “honeycomb” lattice. After heating and additional electron beam exposure, hydrocarbon adsorbates, often seen during TEM imaging, [ 18 ] desorb, leaving a pristine graphene sheet (Figure 1 A).
Following oxidation of the parent graphene, the resulting GO material (Figure 1 B) is found to be highly inhomogeneous with respect to structure. Three major features are present: holes (indicated in blue), graphitic regions (indicated in yellow, as they were for Figure 1 A), and high contrast disordered regions (indi-cated in red), indicating areas of high oxidation, with approxi-mate area percentages of 2%, 16%, and 82%, respectively. Holes form in GO as CO and CO 2 are released during the aggressive oxidation and sheet exfoliation, [ 19 ] found here to be usually less than 5 nm 2 . Although some high resolution electron micros-copy studies have not reported holes in GO samples, [ 20 ] a high resolution aberration corrected electron microscopy study of the reduced form of GO has observed similar holes. [ 21 ] Graph-itic regions, covering between 1 and 6 nm 2 , indicate incomplete oxidation of the basal plane with the preserved honeycomb
bH & Co. KGaA, Weinheim 4467wileyonlinelibrary.com

4468
www.advmat.dewww.MaterialsViews.com
CO
MM
UN
ICATI
ON
Figure 1 . Aberration corrected TEM images of the following materials. Scale bar, denoting 2 nanometers, is valid for all images. (A) Single sus-pended sheet of graphene. On the right, graphitic area indicated in yellow. (B) Single suspended sheet of GO. On the right, holes are indicated in blue, graphitic areas in yellow, and high contrast, disordered regions, indi-cating oxygen functionalities, in red. (C) Suspended monolayer of raGO. On the right, holes indicated in blue, graphitic regions in yellow, and areas with remaining functionalities in red.
Figure 2 . Aberration-corrected TEM image of a single sheet of suspended GO. The scale bar is 2 nm. Expansion (A) shows, from left to right, a 1 nm 2 enlarged oxidized region of the material, then a proposed possible atomic structure of this region with carbon atoms in gray and oxygen atoms in red, and fi nally the average of a simulated TEM image (see Supporting Information) of the proposed structure and a simulated TEM image of another structure where the position of oxidative functionali-ties has been changed. Expansion (B) focuses on the white spot on the graphitic region. This spot moved along the graphitic region, but stayed stationary for 3 frames (6 seconds) at a hydroxyl position (left portion of expansion (B)) and for 7 frames (14 seconds) at a (1,2) epoxy posi-tion (right portion of expansion (B)). The ball-and-stick fi gures below the microscopy images represent the proposed atomic structure for such functionalities. The simulated TEM image for the suggested structure (see Supporting Information) agrees well with the TEM data. Expansion (C) shows a 1 nm 2 graphitic portion from the exit plane wave reconstruc-tion of a focal series of GO and the atomic structure of this region.
structure and 1.4 Å atomic spacing of graphene. The disor-dered, high contrast oxidized regions of the basal plane form a continuous network throughout the GO sheet.
Monolayer raGO (Figure 1 C) is similarly structurally inho-mogeneous with holes (blue), graphitic regions (yellow), and disordered areas with high contrast (red). The observed holes comprise approximately 5% of the area. An increase in the area of holes compared to GO is expected as CO and CO 2 form during annealing. [ 10 ] The anticipated signifi cant increase in graphitic area observed, up to approximately 70% of the area, indicates a substantial restoration of the original sp 2 bonding character lost during the oxidation, by the reduction of oxygen functionalities. However, extensive disordered high contrast regions still exist, likely from nitrogen and oxygen function-alities which persist even after reduction and annealing. [ 8 ]
© 2010 WILEY-VCH Verlag Gwileyonlinelibrary.com
Uninterrupted translational order, as observed with pristine graphene, is not seen, being disrupted by the holes and the remaining functionalities.
This raGO material under study is substantially different from graphene as indicated by Figure 1 . Although signifi -cantly restored graphitic nature is imparted upon reduction, the remaining functionalities and holes in raGO drastically differentiate it from graphene. Attempts at synthesizing limit-edly oxidized graphene oxide or at introducing a carbon feed-stock for the “healing” of raGO show promise for potentially addressing these observed differences between raGO and graphene, possibly resulting in minimal defects and reincorpo-ration of carbon into the basal plane when missing from the synthesized raGO material. [ 6 , 11 , 22 , 23 ]
We turn now to a closer examination of the structure of GO. The main body of Figure 2 shows another representative TEM image of GO, suitable for detailed examination. A high-contrast
mbH & Co. KGaA, Weinheim Adv. Mater. 2010, 22, 4467–4472

www.advmat.dewww.MaterialsViews.com
CO
MM
UN
ICATIO
N
region is selected in Figure 2 A. With this sample, adsorbates are understood to be limitedly present, and if present, to only be adsorbed onto the oxidized regions of GO. Grids heating prior to TEM imaging largely desorbs such weakly, physically bonded species. Furthermore, electron beam exposure induces desorption and motion of adsorbates, [ 18 ] resulting in minimally observed adsorbates in the similarly prepared and imaged graphene and raGO samples (Figure 1 A and 1 C). Finally, time-dependent changes in the overall area of the high con-trast regions would be expected during TEM imaging if they were caused by large numbers of adsorbates as some of these adsorbates would desorb under electron beam exposure. How-ever, the increased Van der Waals interaction between adsorb-ates and oxidative functionalities compared to their interaction with graphitic regions means that any remaining adsorbates would be adsorbed to the oxidized regions of GO. High contrast regions are thus primarily from oxidized carbons and limitedly from adsorbates, which indicate an underlying oxidized region. The high amount of contrast variation indicates a high density of oxygen functionalities, with each carbon likely being oxidized with no order between functionalities.
In the high contrast regions, oxygen atoms are present in a much higher density and greater numbers will be mobilized by the electron beam. After studying the times series (see Sup-porting Information Video S1), although cases of function-alities being stable for multiple seconds can be found, most functionalities seem to be mobile of the timescale of a second. Given this, signifi cant changes in the bonding can occur over the course of each captured frame, and each micrograph could represent multiple bonding confi gurations between the carbon basal plane and oxidative functionalities. Figure 2 A shows such a region with a high degree of oxidative functionalities. A pos-sible representative local atomic structure for this oxidized region is proposed, but of course the complicated contrast within this region makes any specifi c defi nition of a structure for this region impractical. Simulations of TEM images were made from this proposed structure and another structure where the location of the oxidative functionalities was changed, the average of which is compared to the obtained micrograph.
Figure 2 B highlights a mostly graphitic region with isolated anomalous bright spots. The anomalies are dynamic (on the timescale of a second, see Supporting Information Video S1), likely indicating isolated mobile oxygen functionalities. The anomalies of Figure 2 B are consistent with simulations of TEM images (see Supporting Information) for an oxygen resting at a hydroxyl position (left), or an oxygen resting at an (1,2) epoxy position (right). Multiple instances of such isolated functionalities are observed in GO. Although it is possible that the observed adatoms were carbon adatoms, the likelihood of mobilizing a carbon bound to the graphitic sheet or even from a nearby hole is unlikely given the multiple bonds required to be broken (with a graphene C-C bond energy of 4.9 eV) [ 24 ] compared to those required to be broken to mobilize an oxygen from common functionalities expected in GO: 2.1 eV for (1,2) epoxies and 0.7 eV for hydroxyls. [ 25 ]
The mobility of these functionalities is a consequence of the incident 80 keV electron bombardment, which transfers a maximum of 11.8 eV to an oxygen atom, [ 26 ] well over epoxy and hydroxyl bond energies and well over the hopping barrier,
© 2010 WILEY-VCH Verlag GmAdv. Mater. 2010, 22, 4467–4472
being much lower. [ 27 ] Electron beam induced bond breakage occurs, mobilizing atoms which rest at stable positions nearby on the basal plane. The energy for the ejection of an atom from the sheet is much greater. [ 28 ] For GO we observe minimal loss of high contrast and stable hole size indicating relatively little overall beam-induced oxygen- or carbon-ejection, respectively.
Figure 2 C highlights a graphitic region of GO. The sharpened blowup was obtained from the exit plane wave reconstructed from a 12-member focal series (for details see Supporting Infor-mation and Figure S3). The highly graphitic nature of this region is striking. Some bond strain does occur at the interface of oxi-dized and unoxidized regions, but the interior of the graphitic regions, when lacking oxygen functionalities, are found to be largely unaffected by this strain. The different graphitic regions can be thought of as fl akes of nearly pure graphene separated by highly oxidized and thus structurally modifi ed regions. The graphitic domains are mis-tilted in the azimuthal direction with respect to each other. This combined with bond strain at the interface of the graphitic and oxidized regions results in the observed blurring of diffraction spots compared to graphene [ 29 ] (see Supporting Information Figure S1).
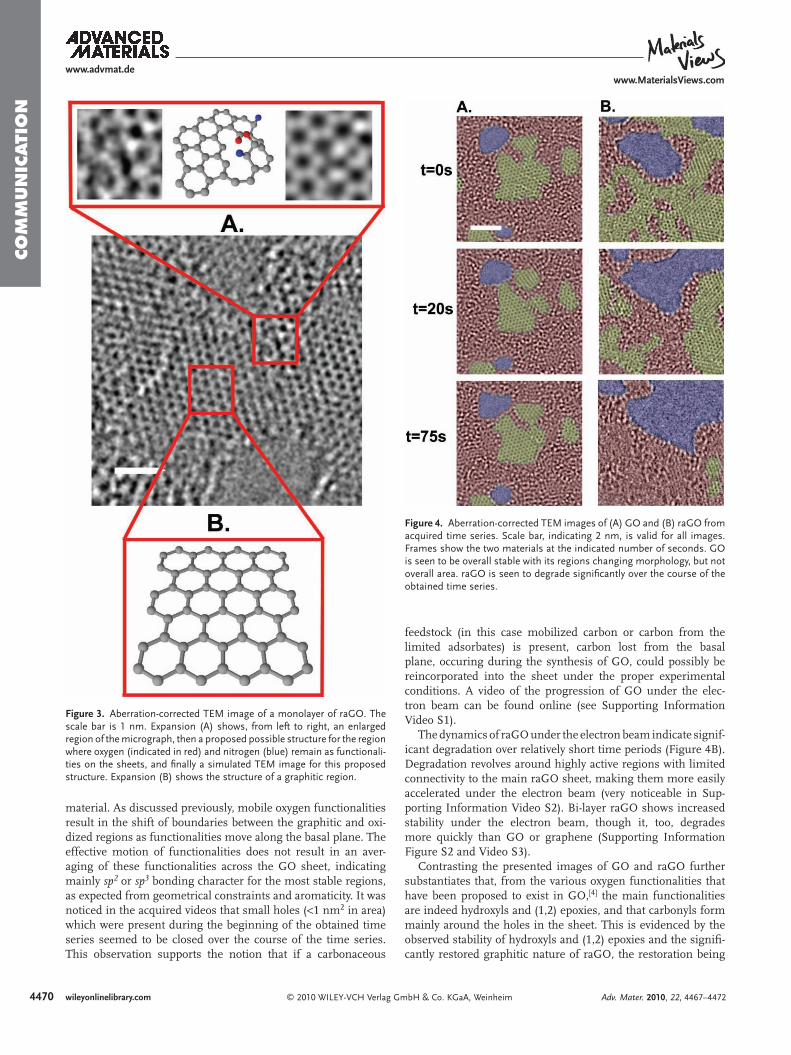
We now examine the raGO material under study in detail. Figure 3 shows a representative image, similar to that presented in Figure 1 C. A signifi cant portion of raGO is indeed graphitic, but certainly raGO cannot be properly characterized as consti-tuting “graphene”. The examined raGO material was found to be overall highly sensitive to electron beam induced degrada-tion to the point that meaningful exit plane wave reconstruction was not possible. This indicates a higher instability of raGO, as compared to graphene, or even to GO (we found, however, a signifi cantly higher stability for bilayer raGO, as compared to monolayer raGO, as discussed below).
Nevertheless, the high amount of restored graphitic area in raGO supports the supposition that the parent GO contains mostly hydroxyl and epoxy functionalities. Only these oxidative functionalities (other than high energy peroxide functionalities) would result in fully restored graphitic character once reduced, as other functionalities would induce C-C bond breakage. [ 29 ]
Figure 3 A highlights regions of raGO with high contrast spots, likely representing remaining functional groups. These are understood to be either oxygen functionalities from the initial oxidation or nitrogen functionalities from the hydrazine reduction. [ 8 ] Although specifi c determination of a structure can not be made, a likely structure for this region is proposed in Figure 3 A. A simulated TEM image for the proposed struc-ture is included for comparison. Figure 3 B highlights a fully restored graphitic region of raGO.
It is instructive to examine in some detail the relative tem-poral stability of graphene, GO, and raGO when exposed to the agitation of the imaging TEM electron beam. Under our imaging conditions, graphene is exceptionally stable, suffering only occasional knock-on damage. [ 28 ] Figure 4 contrasts time series images of GO and raGO. GO was seen to be stable under the beam with each of the discussed regions not changing in area percentage during the obtained time series (75 seconds) (Figure 4 A). This indicates that although atoms may become mobile within the GO plane under electron beam irradiation, signifi cant atom ejection does not occur, which would result in changes to these percentages, indicating degradation of the
4469bH & Co. KGaA, Weinheim wileyonlinelibrary.com
4470
www.advmat.dewww.MaterialsViews.com
CO
MM
UN
ICATI
ON
Figure 3 . Aberration-corrected TEM image of a monolayer of raGO. The scale bar is 1 nm. Expansion (A) shows, from left to right, an enlarged region of the micrograph, then a proposed possible structure for the region where oxygen (indicated in red) and nitrogen (blue) remain as functionali-ties on the sheets, and fi nally a simulated TEM image for this proposed structure. Expansion (B) shows the structure of a graphitic region.
Figure 4 . Aberration-corrected TEM images of (A) GO and (B) raGO from acquired time series. Scale bar, indicating 2 nm, is valid for all images. Frames show the two materials at the indicated number of seconds. GO is seen to be overall stable with its regions changing morphology, but not overall area. raGO is seen to degrade signifi cantly over the course of the obtained time series.
material. As discussed previously, mobile oxygen functionalities result in the shift of boundaries between the graphitic and oxi-dized regions as functionalities move along the basal plane. The effective motion of functionalities does not result in an aver-aging of these functionalities across the GO sheet, indicating mainly sp 2 or sp 3 bonding character for the most stable regions, as expected from geometrical constraints and aromaticity. It was noticed in the acquired videos that small holes ( < 1 nm 2 in area) which were present during the beginning of the obtained time series seemed to be closed over the course of the time series. This observation supports the notion that if a carbonaceous
© 2010 WILEY-VCH Verlag Gmwileyonlinelibrary.com
feedstock (in this case mobilized carbon or carbon from the limited adsorbates) is present, carbon lost from the basal plane, occuring during the synthesis of GO, could possibly be reincorporated into the sheet under the proper experimental conditions. A video of the progression of GO under the elec-tron beam can be found online (see Supporting Information Video S1).
The dynamics of raGO under the electron beam indicate signif-icant degradation over relatively short time periods (Figure 4 B). Degradation revolves around highly active regions with limited connectivity to the main raGO sheet, making them more easily accelerated under the electron beam (very noticeable in Sup-porting Information Video S2). Bi-layer raGO shows increased stability under the electron beam, though it, too, degrades more quickly than GO or graphene (Supporting Information Figure S2 and Video S3).
Contrasting the presented images of GO and raGO further substantiates that, from the various oxygen functionalities that have been proposed to exist in GO, [ 4 ] the main functionalities are indeed hydroxyls and (1,2) epoxies, and that carbonyls form mainly around the holes in the sheet. This is evidenced by the observed stability of hydroxyls and (1,2) epoxies and the signifi -cantly restored graphitic nature of raGO, the restoration being
bH & Co. KGaA, Weinheim Adv. Mater. 2010, 22, 4467–4472

www.advmat.dewww.MaterialsViews.com
CO
MM
UN
ICATIO
N
possible only when these functionalities are dominant. Also, since bond breakage associated with carbonyl formation likely accommodates hole formation and expansion, [ 30 ] and substan-tial XPS data indicates the presence of these groups, [ 8 ] carbo-nyls likely form at the edges of the observed holes within the GO sheet.
Our experiments greatly elucidate the important and previously unknown structure of GO. Previous attempts at experimentally determining this structure involved ana-lyzing chemical reactivity, XPS, Raman, NMR, IR, conduc-tivity, TGA, diffraction and absorption, [ 4 ] were relevant only to macro to microscopic regions of GO. Theoretical calculations have conversely been limited to considering regions less than 100 atoms, [ 19 ] sometimes less than 10 atoms, [ 25 ] in extent, and then generalizing a larger structure. Since regions larger than 100 atoms exist with only sp 2 or sp 3 bonding nature, these theo-retical considerations are seen to poorly describe GO. Likewise, when bulk properties are generalized down to determine the most likely atomically defi ned structure, many nuances are overlooked. For instance, XPS results indicating carbonyls within GO have been attributed to these groups being along the microscopic edges of GO. The observation of holes, likely with edge carbonyls, every few nanometers redefi nes how these results should be interpreted.
Our observations and deductions about the structure of GO can be summarized as follows. 1. Graphitic regions up to 8 nm 2 remain. 2. Oxidized regions exhibit no order with regards to oxidation, have minimal sp 2 bonding character, and form a continuous network across the GO sheet. 3. Holes are present, usually under 5 nm 2 . 4. Hydroxyls and (1,2) epoxies are the dominant functionalities. Carbonyls likely exist along the edges of the holes. 5. Largely unstrained sp 2 bonds exist between car-bons within the core of graphitic regions. 6. Lines of graphitic or oxidized regions do not form and no superstructures are formed.
Given these deductions, theories of the structure of GO can be evaluated. Proposals for ordered functional groups or long range order, for instance lines of aromatic regions [ 4 ] or lines of oxidized regions [ 4 , 27 ] are unsubstantiated. Pre-dictions of densely oxidized regions with hydroxyls and (1,2) epoxies as the primary functionalities and carbonyls along the edges are supported, [ 19 , 29 , 31–33 ] whereas prediction of (1,3) epoxies, [ 34 ] carbonyls as dominant functionalities, [ 4 ] other functionalities, [ 35 ] numerous isolated functionalities, [ 35 ] or just epoxies [ 36 ] are not supported. Theories disregarding signifi cant aromaticity [ 19 ] are likewise not supported. Theoret-ical considerations of less than 10 carbons [ 25 ] in GO are dis-carded owing to the high degree of structural inhomogeneity. Also, the proposed mechanism of “unzipping” GO sheets caused by sequential epoxies [ 27 ] is not observed. Adjacent functionalities with positions indicative of epoxies are observed, but continuation of this defect line is not; thus the proposed microscopic cleavage of GO sheets via this mecha-nism is doubtful.
Given all these considerations, the structure proposed by Lerf [ 33 ] is supported, albeit with modifi cations. The sizes of graphitic and oxidized regions are much larger than those proposed by Lerf and with this studied GO material, holes are found throughout the sheet.
© 2010 WILEY-VCH Verlag GmAdv. Mater. 2010, 22, 4467–4472
Supporting Information Supporting Information is available from the Wiley Online Library or from the author.
Acknowledgements KE and AZ were supported for GO and raGO synthesis by the Director, Offi ce of Science, Offi ce of Basic Energy Sciences, Division of Materials Sciences and Engineering, of the U.S. Department of Energy under contract No. DE-AC02–05CH11231. NA was supported for suspended graphene precursor development by the National Science Foundation via the Center of Integrated Nanomechanical Systems. WG received support for diffraction characterization via an IGERT grant. Part of this work was performed at the National Center for Electron Microscopy under the TEAM project, which is supported by the Department of Energy, Offi ce of Science, Offi ce of Basic Energy Sciences under Contract No. DE-AC02—05CH11231 .
Received: January 27, 2010 Revised: April 23, 2010
Published online: August 17, 2010
[ 1 ] X. Li , Y. Zhu , W. Cai , M. Borysiak , B. Han , D. Chen , R. D. Piner , L. Colombo , R. S. Ruoff , Nano Lett. 2009 , 9 , 4359 .
[ 2 ] S. Park , R. S. Ruoff , Nat. Nanotechnol. 2009 , 4 , 217 . [ 3 ] C. Berger , Z. Song , X. Li , X. Wu , N. Brown , C. Naud , D. Mayou , T. Li ,
J. Hass , A. N. Marchenkov , E. H. Conrad , P. N. First , W. A. de Heer , Science 2006 , 312 , 1191 .
[ 4 ] T. Szabo , O. Berkesi , P. Forgo , K. Josepovits , Y. Sanakis , D. Petridis , I. Dekany , Chem. Mater. 2006 , 18 , 2740 .
[ 5 ] A. Sinitskii , D. V. Kosynkin , A. Dimiev , J. M. Tour , ACS Nano 2010 , 4 , 3095.
[ 6 ] Q. Su , S. Pang , V. Alijani , C. Li , X. Feng , K. Müllen , Adv. Mater. 2009 , 21 , 3191 .
[ 7 ] G. Eda , G. Fanchini , M. Chhowalla , Nat. Nanotechnol. 2008 , 3 , 270 . [ 8 ] H. A. Becerril , J. Mao , Z. Liu , R. M. Stoltenberg , Z. Bao , Y. Chen ,
ACS Nano 2008 , 2 , 463 . [ 9 ] H. Chen , M. B. Müller , K. J. Gilmore , G. G. Wallace , D. Li ,
Adv. Mater. 2008 , 20 , 3557 . [ 10 ] I. Jung , D. Dikin , S. Park , W. Cai , S. L. Mielke , R. S. Ruoff , J. Phys.
Chem. C 2008 , 112 , 20264 . [ 11 ] Y. Liang , J. Frisch , L. Zhi , H. Norouzi-Arasi , X. Feng , J. P. Rabe ,
N. Koch , K. Mullen , Nanotechnology 2009 , 434007 . [ 12 ] J. C. Meyer , C. O. Girit , M. F. Crommie , A. Zettl , Appli. Phys. Lett.
2008 , 92 , 123110 . [ 13 ] W. S. Hummers , R. E. Offeman , J. Am. Chem. Soc. 1958 , 80 , 1339 . [ 14 ] N. R. Wilson , P. A. Pandey , R. Beanland , R. J. Young , I. A. Kinloch ,
L. Gong , Z. Liu , K. Suenaga , J. P. Rourke , S. J. York , J. Sloan , ACS Nano 2009 , 3 , 2547 .
[ 15 ] J. C. Meyer , A. K. Geim , M. I. Katsnelson , K. S. Novoselov , D. Obergfell , S. Roth , C. Girit , A. Zettl , Solid State Commun. 2007 , 143 , 101 .
[ 16 ] J. C. Meyer , C. Kisielowski , R. Erni , M. D. Rossell , M. F. Crommie , A. Zettl , Nano Lett. 2008 , 8 , 3582 .
[ 17 ] M. D. Rossell , R. Erni , M. Asta , V. Radmilovic , U. Dahmen , Phys. Rev. B 2009 , 80 , 024110 .
[ 18 ] J. C. Meyer , C. O. Girit , M. F. Crommie , A. Zettl , Nature 2008 , 454 , 319 .
[ 19 ] J. T. Paci , T. Belytschko , G. C. Schatz , J. Phys. Chem. C 2007 , 111 , 18099 .
[ 20 ] R. S. Pantelic , J. C. Meyer , U. Kaiser , W. Baumeister , J. M. Plitzko , J. Struct. Biol. 2010 , 170 , 152 .
4471bH & Co. KGaA, Weinheim wileyonlinelibrary.com

4472
www.advmat.dewww.MaterialsViews.com
CO
MM
UN
ICATI
ON
[ 21 ] C. Gomez-Navarro , J. C. Meyer , R. S. Sundaram , A. Chuvilin ,S. Kurasch , M. Burghard , K. Kern , U. Kaiser , Nano Lett. 2010 , 10 , 1144 . [ 22 ] X. Li , G. Zhang , X. Bai , X. Sun , X. Wang , E. Wang , H. Dai , Nat. Nan-
otechnol. 2008 , 3 , 538 . [ 23 ] V. López , R. S. Sundaram , C. Gómez-Navarro , D. Olea , M. Burghard ,
J. Gómez-Herrero , F. Zamora , K. Kern , Adv. Mater. 2009 , 21 , 4683 . [ 24 ] D. W. Brenner , O. A. Shenderova , J. A. Harrison , S. J. Stuart , B. Ni ,
S. B. Sinnott , J. Phys.: Cond. Matter 2002 , 4 , 783 . [ 25 ] R. J. W. E. Lahaye , H. K. Jeong , C. Y. Park , Y. H. Lee , Phys. Rev. B
2009 , 79 , 125435 . [ 26 ] R. F. Egerton , F. Wang , P. A. Crozier , Microscopy Microanal. 2006 ,
12 , 65 . [ 27 ] J.-L. Li , K. N. Kudin , M. J. McAllister , R. K. Prud’homme , I. A. Aksay ,
R. Car , Phys. Rev. Lett. 2006 , 96 , 176101 . [ 28 ] C. O. Girit , J. C. Meyer , R. Erni , M. D. Rossell , C. Kisielowski ,
L. Yang , C. H. Park , M. F. Crommie , M. L. Cohen , S. G. Louie , A. Zettl , Science 2009 , 323 , 1705 .
© 2010 WILEY-VCH Verlag Gwileyonlinelibrary.com
[ 29 ] H.-K. Jeong , Y. P. Lee , R. J. W. E. Lahaye , M.-H. Park , K. H. An , I. J. Kim , C.-W. Yang , C. Y. Park , R. S. Ruoff , Y. H. Lee , J. Am. Chem. Soc. 2008 , 130 , 1362 .
[ 30 ] R. Backreedy , J. M. Jones , M. Pourkashanian , A. Williams , Faraday Discussions 2002 , 119 , 385 .
[ 31 ] M. C. Kim , G. S. Hwang , R. S. Ruoff , J. Chem. Phys. 2009 , 131 , 064704 .
[ 32 ] W. Cai , R. D. Piner , F. J. Stadermann , S. Park , M. A. Shaibat , Y. Ishii , D. Yang , A. Velamakanni , S. J. An , M. Stoller , J. An , D. Chen , R. S. Ruoff , Science 2008 , 321 , 1815 .
[ 33 ] A. Lerf , H. He , M. Forster , J. Klinowski , J. Phys. Chem. B 1998 , 102 , 4477 .
[ 34 ] M. Mermoux , Y. Chabre , A. Rousseau , Carbon 1991 , 29 , 469 . [ 35 ] W. Scholz , H. P. Boehm , Z. Anorg. Allgem. Chemie 1969 , 369 ,
327 . [ 36 ] U. Hofmann , R. Holst , Berichte der Deutschen Chemischen Gesellschaft
1939 , 72 , 754 .
mbH & Co. KGaA, Weinheim Adv. Mater. 2010, 22, 4467–4472
Copyright © 2022 FDOKUMEN