
Cytotoxicity of protein corona-graphene oxide nanoribbons on human epithelial cells

lable at ScienceDirect
Journal of Power Sources 272 (2014) 239e247
Contents lists avai
Journal of Power Sources
journal homepage: www.elsevier .com/locate/ jpowsour
Characterization of a graphene oxide membrane fuel cell
T. Bayer a, b, S.R. Bishop a, M. Nishihara a, K. Sasaki a, b, c, d, S.M. Lyth a, *
a International Institute for Carbon-Neutral Energy Research (WPI-I2CNER), Kyushu University, 744 Motooka, Nishi-ku, Fukuoka 819-0395, Japanb Faculty of Engineering, Kyushu University, 744 Motooka, Nishi-ku, Fukuoka 819-0395, Japanc Next-Generation Fuel Cell Research Center (NEXT-FC), Kyushu University, 744 Motooka, Nishi-ku, Fukuoka 819-0395, Japand International Research Center for Hydrogen Energy, Kyushu University, 744 Motooka, Nishi-ku, Fukuoka 819-0395, Japan
h i g h l i g h t s
* Corresponding author. Tel.: þ81 92 802 6742.E-mail addresses: [email protected], lyth
http://dx.doi.org/10.1016/j.jpowsour.2014.08.0710378-7753/© 2014 Elsevier B.V. All rights reserved.
g r a p h i c a l a b s t r a c t
� Graphene oxide is explored as a newionomer material for proton ex-change membrane fuel cells(PEMFCs).
� The performance of a graphene oxidemembrane fuel cell (GOMFC) isinvestigated and compared with aNafion-based PEMFC.
� We present the highest reported po-wer density for pure GO membraneto date (35 mW cm�2).
� The performance is investigated overa wide temperature range, up to80 �C for the first time.
� Durability measurements are per-formed, giving an insight into thedegradation mechanism.
a r t i c l e i n f o
Article history:Received 10 June 2014Received in revised form14 August 2014Accepted 19 August 2014Available online 28 August 2014
Keywords:Fuel cellGrapheneGraphene oxideProton conductivityMembranePEMFC
a b s t r a c t
The electrical, mechanical, and compositional characterization of a graphene oxide membrane is pre-sented, and its application as an electrolyte material in a polymer electrolyte membrane fuel cell isexplored. Self-supporting graphene oxide membranes were prepared by a simple vacuum filtrationprocess and, for the first time, characterized as the electrolyte in a fuel cell operating in an elevatedtemperature range (30e80 �C), with a maximum power density of ~34 mW cm�2, approaching that of aNafion electrolyte based cell prepared and tested under similar conditions. Evidence for partial mem-brane reduction was found at higher temperatures and is believed to originate frommore easily released,higher energy oxide groups, such as epoxides. We also discuss the morphology, the mechanical prop-erties, chemical composition, and electrical conductivity of the graphene oxide membranes, with com-parisons made to conventional Nafion membranes.
© 2014 Elsevier B.V. All rights reserved.
@physics.org (S.M. Lyth).
1. Introduction
Increasing energy demand and finite fossil fuel energy reserveshave led to greater interest in renewable energy sources and highlyefficient energy conversion devices. Fuel cells provide clean andefficient energy, and many are already commercially available as

T. Bayer et al. / Journal of Power Sources 272 (2014) 239e247240
stationary systems (e.g. the Japanese micro-combined heat andpower system; Ene-Farm), or as portable systems (e.g. auxiliarypower units or consumer electronics) [1]. Several collaborations inthe automotive sector have been formed to accelerate and reducethe price of automotive fuel cells, with, for example, Toyota plan-ning to start sales by 2015 in Japan [1].
Currently, polymer electrolyte membrane fuel cells (PEMFCs)are one of the most commercially viable fuel cell options, due totheir low operation temperature, fast start-up, and simplicity. Oneof the key components of a PEMFC is the ionomer membrane,typically Nafion. Nafion is a perfluorinated ionomer membrane,consisting of fluorinated carbon backbone chains with perfluoro-side chains terminating in sulfonic acid groups, and is a regis-tered trademark of E.I. DuPont de Nemours. It exhibits high protonconductivity (>0.1 S cm�1) in typical operating conditions, has goodmechanical properties, and it is an effective gas separator. Due tothese reasons, Nafion is the most used membrane for PEMFCs.
However, Nafion is also expensive and limits PEMFC operationto relatively low temperature (~80 �C), due to the reliance on hy-dration for high proton conductivity. Dehydration decreases theconductivity, whilst the changing water content also leads tomembrane shrinkage and swelling, which in turn leads to deteri-oration of the electrolyteeelectrocatalyst interface [2]. Additionally,at higher operation temperatures, the mechanical stability ofNafion is reduced due to its low glass transition temperature(~110 �C) [3e6]. Fuel crossover in Nafion strongly increases withdecreasing membrane thickness and increasing operation tem-perature, leading to lower efficiency and decreased fuel cell per-formance [7,8]. Finally, membrane degradation is caused byhydrogen peroxide radicals, inhibiting the use of non-preciouscatalysts in Nafion-based PEMFCs [9]. To reduce the cost andimprove the performance of PEMFCs, new membrane materials areneeded.
Graphene, a single layer of graphitic carbon, has become a hottopic in materials research due to its extraordinary properties, e.g.high intrinsic mobility, surface area, and large Young's modulus[10,11]. Due to these properties, graphene is an ideal material foruse in PEMFCs as e.g. a catalyst support, or as a non-preciouscatalyst [12e14]. An interesting variation on graphene is gra-phene oxide (GO) [11,15,16]; an electronically insulating counter-part of the highly electrically conductive graphene [17]. The carbonlattice of GO consists of aromatic areas containing unoxidizedbenzene rings, as well as regions with aliphatic six-membered ringsdepending on the extent of oxidation. Its basal plane is reported tocontain mainly hydroxyl and epoxy oxygen groups, whilst theedges contain mainly hydroxyl and carboxyl groups [18,19]. GOmembranes have been observed to be completely impermeable tomany liquids, vapors and gases, whilst allowing unimpededpermeation of water, thus indicating an affinity for hydration [20],whilst minimizing fuel crossover in PEMFCs.
GO has been investigated in composite PEMFC membranes withknown proton conductors such as Nafion, sulfonated poly etherether ketone (SPEEK), polybenzimidazol (PBI), and poly vinylalcohol (PVA). Kumar et al. reported improved PEMFC performanceat 100 �C for a 4 wt% GO/Nafion composite, compared to pureNafion. [21] Jiang et al. reported that the incorporation of sodiumdodecylbenzene sulfonate-adsorbed GO in SPEEK greatly increasedthe ion-exchange capacity, water uptake and proton conductivity,whilst reducing methanol permeability [22]. Xu et al. reported amaximum cell power density of 600 mW cm�2 at 175 �C for a PBI/sulfonated GO composite membrane [23]. Bao et al. reported thecharacteristics of PVA/GO nanocomposites [24].
The use of membranes in PEMFCs consisting primarily of GO hasalso been investigated, but to a much lesser extent. Tateishi et al.reported the performance of a fuel cell using a pure GO paper
membrane, achieving a maximum power density of ~13 mW cm�2
at room temperature [25]. Functionalized GO membranes havedemonstrated greater promise, for example Scott and Ravikumarreported a freestanding sulfonated GO paper membrane achievingan MEA power density of 113 mW cm�2 at 40 �C, though duringoperation the added acid may leach out, thus reducing long-termperformance [26]. Such studies in the literature show the poten-tial for GO to be used in fuel cells, however so far no studies haveinvestigated non-composite GOmembranes at higher temperature,under PEMFC operating conditions, where electrode kinetics andionic transport are faster [12].
Here we present a detailed investigation of the properties of GOmembranes via scanning electron microscopy (SEM), laser micro-scopy, X-ray photoelectron spectroscopy (XPS), Raman spectros-copy, and X-ray diffraction (XRD). We report water-uptake, tensilestrength, and electrical impedance in a wide range of humidity andtemperature conditions. Lastly, for the first time the performance ofa pure graphene oxide membrane fuel cell (GOMFC) up to 80 �C,utilizing GO in place of Nafion, is reported.
2. Experimental
2.1. Membrane preparation
Membranes were prepared from a GO solution (Graphene Su-permarket, 5 mg ml�1, flake size 0.5e5 mm) by vacuum-filtrationonto Millipore membrane filters (35 mm diameter, 0.025 mm poresize). After filtration the membranes were vacuum-dried at 80 �Cfor 12 h and then peeled-off the filter resulting in free-standing andflexible pure GO membranes. Herein the face of the membranepreviously attached to the filter is referred to as the underside, andthe air-exposed face is referred to as the upper side. Membranethickness was measured with a micrometer, and 10 ml GO sus-pension (i.e. 50 mg) led to a membrane thickness of around 36 mm,corresponding to a density of 1444 kg m�3.
2.2. Morphological and chemical analysis
Morphology was investigated by SEM (Hitachi S-5200, 30 kV)and laser microscopy (Olympus LEXT 3d OLS 4000). For determina-tion of the roughness profile, a short wave Gaussian profile filterwith a cut-off length of l ¼ 80 mm and an evaluation length of700 mm was used. The chemical composition of the graphenesamples was determined by XPS (KRATOS Analytical ESCA-3400withMg Ka radiation, 12 kW,10 mA). Raman spectra were analyzedusing a RENISHAW inVia Raman Microscope with 532 nm laserexcitation wavelength. X-ray diffraction was measured using aSmartlab X-ray Diffractometer with Cu Ka radiation (g ¼ 1.5418 Å,0.01� step�1).
2.3. Water uptake and swelling test
Water up-take and swelling (i.e. the increase in thickness)were measured on GO and Nafion (Nafion® 212, 50.1 mm thick)samples with a size of 10 � 10 mm2. Five different samples weremeasured for reproducibility. Samples were first vacuum dried at80 �C for two hours. The mass was then determined using ananalytical balance (Mettler Toledo, ±0.1 mg) and the thickness wasdetermined using a micrometer (Mitutoyo, ±1 mm). Samples werethen placed into an 80 �Cwater bath for one hour. After saturation,excess surface water was removed, and the mass and thicknesswere measured. Water uptake (WU) was calculated using Equa-tion (1.1), where mwet and mdry are the wet and dry masses,respectively;

T. Bayer et al. / Journal of Power Sources 272 (2014) 239e247 241
WUð%Þ ¼ mwet �mdry
mdry$100% (1.1)
Swelling (Sw) was calculated by using Equation (1.2), where Twetand Tdry are the wet and dry thicknesses of the samples,respectively;
Swð%Þ ¼ Twet � TdryTdry
$100% (1.2)
2.4. Tensile strength test
The tensile strengths of GO and Nafion were measured at roomtemperature and around 70% relative humidity (ambient lab con-ditions). The sample length was 15 mm and its width 1 mm. Tensileload was applied using a hydraulic testing machine force gauge(SHIMPO FGO-C-TV), until rupture. Applied force and elongationwere recorded. The tensile stress (S) was calculated using S ¼ F/A,where F is the applied force and A is the initial cross-sectional areaof the sample. Strain (ε) was calculated using ε¼ L/L0$100%, where Lis the length of the sample during elongation and L0 is the initialsample length. Elastic modulus E is defined as the slope of thestressestrain curve in the elastic region and was calculated usingE ¼ S/ε.
2.5. Through-plane conductivity
Through-plane proton conductivity was determined using amembrane test system (Scribner Associates Inc. MTS 740) coupledwith an impedance analyzer (Solatron SI1260). [27] A 10 � 30 mm2
membrane with a thickness of 42 mm was measured in the fre-quency range of 30 MHz to 10 Hz with an AC amplitude of 100 mVin a 2-electrode/4-terminal setup (the latter for minimizing leadresistance). Gas diffusion electrodes (E-TEK, High TemperatureELAT, 140E-W, 18 � 5 mm2) were attached on the platinum elec-trodes using conductive carbon paint (SPI Supplies, colloidalgraphite, Part #05006-AB). Compression of the cell to obtain goodelectrode contact was performed using a pressure of 1.074MPa. Theimpedance was measured in the order from 30 to 80 �C, withisothermal changes in relative humidity (RH) from 100 to 20%.Before impedance measurements, the sample was pretreated at100% RH for 3 h, and then for 1 h between each different RHmeasurement. From the determined membrane resistance R (U),thickness L (cm) and cross-sectional area A (cm2) 0.5 cm2, con-ductivity s was calculated using ¼ L/(R$A).
2.6. Membrane electrode assembly
Membrane electrode assemblies (MEAs) were prepared using aGO membrane with an active electrode area of 0.5 cm2 and thick-ness of 16 mm. Catalyst ink was prepared by mixing Pt/C electro-catalyst (Tanaka Kikinzoku Kogyo K.K., 46.2 wt % Pt) with 5 wt%Nafion solution (Aldrich), ethanol (Chameleon), and deionized wa-ter. The catalyst ink was stirred overnight, then sonicated beforeuse for 30 min (SMT Ultra Sonic Homogenizer UH-600). The catalystink was sprayed onto the free-standing GO membrane (NordsonK.K. Spraying Device, C-3J) using amask to create an electrode size of0.5 cm2 with a catalyst loading of 0.3 mgPt cm�2 for both electrodes.The anode was sprayed onto the upper side of the membrane, andthe cathode onto the underside. Hydrophobic carbon paper (EC-TP1-060T) gas diffusion layers (GDLs), were precisely positionedover the electrocatalyst layers and the prepared GO-MEA wasplaced into a single cell test holder (1 cm2) and installed in a home-made PEMFC test system. It is important to note that the GDLs were
not hot-pressed onto the electrocatalyst layer in this case. Hot-pressing is usually performed for Nafion-based PEMFCs (e.g. at132 �C and 0.6 kN) in order create a good interfacial contact be-tween the GDL and the electrocatalyst layer. However the GOmembrane is damaged under these conditions. The resultingGOMFC was installed in an oven and heated up in 10 �C-steps from30 �C to 80 �C. Hydrogen and air were flowed at 100 ml min�1 and100% RH. The cell performance was investigated using a potentio-stat (Solartron SI 1287). For comparison a Nafion-based MEA(Nafion® 212) was prepared using the same electrode size, catalystloading, and without hot-pressing in the same procedure as theGOMFC described above.
3. Results and discussion
SEM was used to probe the morphology and structure of the GOmembrane surface and cross-section. Fig. 1a shows the upper sideof the membrane. A wrinkled surface with structural features ofapproximately 20 mm in length and several mm inwidth is observed.The underside of the membrane is smoother and nearly featureless(not shown). In Fig. 1b, the GO membrane cross section consists ofmany layers of graphene oxide closely stacked together.
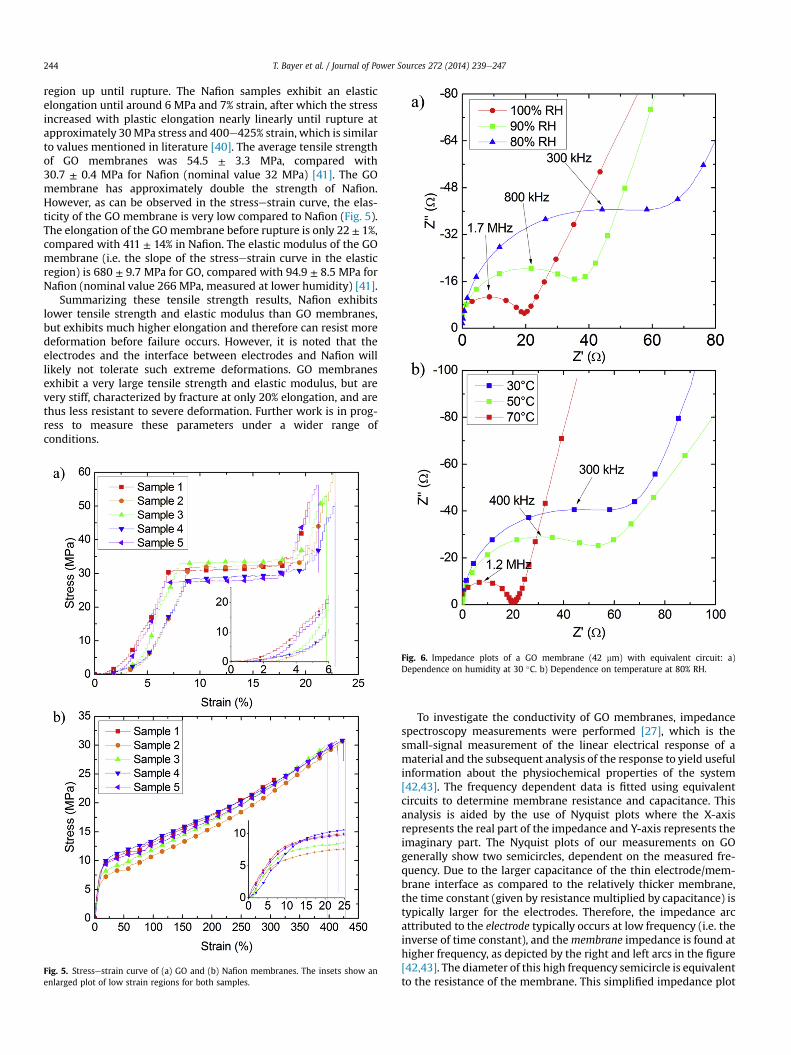
Linear and areal roughness measurements were conducted us-ing laser microscopy. Fig. 2a shows the GO surface at 5� magnifi-cation. Wrinkles are observed uniformly across the surface, likelyinduced by stresses imposed during drying. At 100� magnification(Fig. 2b), the wrinkles can be seen in greater detail, and are verysimilar to the SEM image. The 3D projection in Fig. 2c illustrates thewrinkled texture more clearly. The image is magnified by 3� in thez-axis to display the structure more clearly. The peak to troughdistance is approximately 4 mm.
For a quantitative evaluation of the membrane surfaces,roughness measurements were conducted. The arithmetic averageheight Ra, defined as the average absolute deviation of the rough-ness irregularities from the mean line, is 0.5062 (±0.0261) mm forthe upper side of the membrane, and 0.1832 (±0.0150) mm for theunderside. This surface roughness is larger than that measured forNafion (0.052 mm). This increased roughness may lead to increasedmechanical interaction between the membrane and the electro-catalyst layer, resulting in improved adhesion.
XPS was measured for elemental and chemical analysis. In thewide scan, two major peaks at binding energies of approximately284.5 and 532.0 eV are observed (Fig. 3a), attributed to C1s (74.8 at%) and O1s (25.2 at%) components. The peak at ~480 eV is noise. Forgood proton conductivity, and low electronic conductivity, it isassumed that a high degree of oxidation is preferable. Fig. 3b showsthe C1s spectrum of GO, deconvoluted into six peaks, attributed todifferent C bonds. The C1s related peaks assigned in the followingparagraph are in accordance with Tien et al. [28] The largest peak isattributed to sp3 hybridized CeC/CeH bonds at 284.2 eV (41.0%)and thus to the carbon backbone of GO. The next largest peak isattributed to epoxy groups CeOeC at 286.1 eV (24.5%), followed byhydroxyl groups CeOH at 285.1 eV (15.7%). Epoxy and hydroxylgroups are the dominant species on the basal plane of GO, resultingin strong binding to water via hydrogen bonds. [16] Carbonyl C]Oat 287.1 eV (8.3%) and carboxyl groups OeC]O at 288.2 eV (5.5%)are also present with lower intensities. The lowest peak in the C 1sspectrum is attributed to sp2 hybridized C]C bond at 283.5 eV(5.0%), and due to its small magnitude, this indicates that theproportion of free electrons in this GO is very low, in contrast withthe significantly larger peaks typically observed in graphene. The O1s (Fig. 3c) signal is deconvoluted into five peaks. The strongestpeak at 531.9 eV is attributed to CeO bonds (38.0%), followed byOeH at 532.8 eV (22.4%), and CeOH at 531.1 eV (21.0%). C]O bondsat 530.2 eV (9.3%) and adsorbed water at 533.7 eV (9.3%) [29]. The
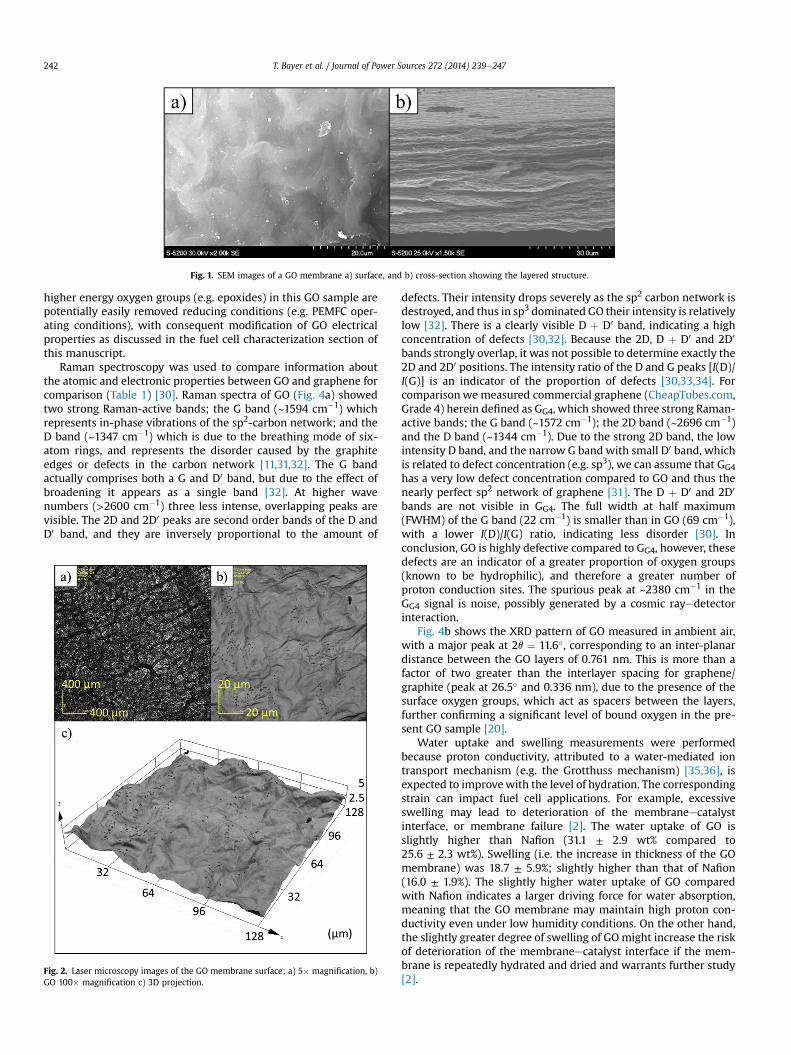
Fig. 1. SEM images of a GO membrane a) surface, and b) cross-section showing the layered structure.
T. Bayer et al. / Journal of Power Sources 272 (2014) 239e247242
higher energy oxygen groups (e.g. epoxides) in this GO sample arepotentially easily removed reducing conditions (e.g. PEMFC oper-ating conditions), with consequent modification of GO electricalproperties as discussed in the fuel cell characterization section ofthis manuscript.
Raman spectroscopy was used to compare information aboutthe atomic and electronic properties between GO and graphene forcomparison (Table 1) [30]. Raman spectra of GO (Fig. 4a) showedtwo strong Raman-active bands; the G band (~1594 cm�1) whichrepresents in-phase vibrations of the sp2-carbon network; and theD band (~1347 cm�1) which is due to the breathing mode of six-atom rings, and represents the disorder caused by the graphiteedges or defects in the carbon network [11,31,32]. The G bandactually comprises both a G and D0 band, but due to the effect ofbroadening it appears as a single band [32]. At higher wavenumbers (>2600 cm�1) three less intense, overlapping peaks arevisible. The 2D and 2D0 peaks are second order bands of the D andD0 band, and they are inversely proportional to the amount of
Fig. 2. Laser microscopy images of the GO membrane surface; a) 5� magnification, b)GO 100� magnification c) 3D projection.
defects. Their intensity drops severely as the sp2 carbon network isdestroyed, and thus in sp3 dominated GO their intensity is relativelylow [32]. There is a clearly visible D þ D0 band, indicating a highconcentration of defects [30,32]. Because the 2D, D þ D0 and 2D0
bands strongly overlap, it was not possible to determine exactly the2D and 2D0 positions. The intensity ratio of the D and G peaks [I(D)/I(G)] is an indicator of the proportion of defects [30,33,34]. Forcomparison we measured commercial graphene (CheapTubes.com,Grade 4) herein defined as GG4, which showed three strong Raman-active bands; the G band (~1572 cm�1); the 2D band (~2696 cm�1)and the D band (~1344 cm�1). Due to the strong 2D band, the lowintensity D band, and the narrow G band with small D0 band, whichis related to defect concentration (e.g. sp3), we can assume that GG4has a very low defect concentration compared to GO and thus thenearly perfect sp2 network of graphene [31]. The D þ D0 and 2D0
bands are not visible in GG4. The full width at half maximum(FWHM) of the G band (22 cm�1) is smaller than in GO (69 cm�1),with a lower I(D)/I(G) ratio, indicating less disorder [30]. Inconclusion, GO is highly defective compared to GG4, however, thesedefects are an indicator of a greater proportion of oxygen groups(known to be hydrophilic), and therefore a greater number ofproton conduction sites. The spurious peak at ~2380 cm�1 in theGG4 signal is noise, possibly generated by a cosmic rayedetectorinteraction.
Fig. 4b shows the XRD pattern of GO measured in ambient air,with a major peak at 2q ¼ 11.6�, corresponding to an inter-planardistance between the GO layers of 0.761 nm. This is more than afactor of two greater than the interlayer spacing for graphene/graphite (peak at 26.5� and 0.336 nm), due to the presence of thesurface oxygen groups, which act as spacers between the layers,further confirming a significant level of bound oxygen in the pre-sent GO sample [20].
Water uptake and swelling measurements were performedbecause proton conductivity, attributed to a water-mediated iontransport mechanism (e.g. the Grotthuss mechanism) [35,36], isexpected to improvewith the level of hydration. The correspondingstrain can impact fuel cell applications. For example, excessiveswelling may lead to deterioration of the membraneecatalystinterface, or membrane failure [2]. The water uptake of GO isslightly higher than Nafion (31.1 ± 2.9 wt% compared to25.6 ± 2.3 wt%). Swelling (i.e. the increase in thickness of the GOmembrane) was 18.7 ± 5.9%; slightly higher than that of Nafion(16.0 ± 1.9%). The slightly higher water uptake of GO comparedwith Nafion indicates a larger driving force for water absorption,meaning that the GO membrane may maintain high proton con-ductivity even under low humidity conditions. On the other hand,the slightly greater degree of swelling of GOmight increase the riskof deterioration of the membraneecatalyst interface if the mem-brane is repeatedly hydrated and dried and warrants further study[2].

Table 1Position of Raman active bands, intensity ratio I(D)/I(G) and the full width at halfmaximum of the G peak FWHM (G).
GO GG4
D band 1347 cm�1 1344 cm�1
G band 1594 cm�1 1572 cm�1
D þ D00 band e 2449 cm�1
2D band 2700 2696 cm�1
D þ D0 band 2914 cm�1 e
I(D)/I(G) 0.932 0.365FWHM(G) 69 cm�1 22 cm�1
T. Bayer et al. / Journal of Power Sources 272 (2014) 239e247 243
Tensile strength and elongation are both important mechanicalproperties regarding membrane handling, MEA preparation andcell longevity because they give information about the “work per-formance” (i.e. the amount of deformation the membrane will bearwithout failure). Fig. 5a shows the stressestrain curves for five GOmembrane samples. All the curves have similar shape, confirmingthe reproducibility of the measurement. The curve progression canbe divided into four different regions: a straightening region; anelastic region; an extended elastic limit (where plastic deformationbegins); and a plastic region up until fracture. At low stress, GOdisplays a non-linear elastic elongation up to a stress of approxi-mately 10MPa. This straightening region is suggested to be inducedby a high concentration of watermolecules in the interlayer spacing[37]. At higher stress, an approximately linear elastic elongation
Fig. 3. a) XPS wide scan spectra of GO. b) Component analysis of the C 1s peak of GO. c)Component analysis of the O 1s peak of GO.
occurs, up until around 28e32 MPa stress, and 6.5e8.5% strain.After this elastic elongation region, there is an extended tensileelastic limit (from approximately 7 to 18% strain) where the strainincreases rapidly with only a very small increase in force. It isproposed that this phenomenon is a result of individual GO sheetssliding over each other in the presence of water molecules, whichmay act as a lubricant [38,39]. Finally there is a regionwhere the GOsheets appear to grip again (above 30 MPa), before plastic elonga-tion continues with a fast increase in stress until rupture at around50 MPa and 20% strain. The stressestrain curves of Nafion (Fig. 5b)can be separated into two regions: an elastic region, and a plastic
Fig. 4. a) Wide scan Raman spectra of GO and GG4. b) XRD patterns of GO and GG4.
T. Bayer et al. / Journal of Power Sources 272 (2014) 239e247244
region up until rupture. The Nafion samples exhibit an elasticelongation until around 6 MPa and 7% strain, after which the stressincreased with plastic elongation nearly linearly until rupture atapproximately 30MPa stress and 400e425% strain, which is similarto values mentioned in literature [40]. The average tensile strengthof GO membranes was 54.5 ± 3.3 MPa, compared with30.7 ± 0.4 MPa for Nafion (nominal value 32 MPa) [41]. The GOmembrane has approximately double the strength of Nafion.However, as can be observed in the stressestrain curve, the elas-ticity of the GO membrane is very low compared to Nafion (Fig. 5).The elongation of the GOmembrane before rupture is only 22 ± 1%,compared with 411 ± 14% in Nafion. The elastic modulus of the GOmembrane (i.e. the slope of the stressestrain curve in the elasticregion) is 680 ± 9.7 MPa for GO, compared with 94.9 ± 8.5 MPa forNafion (nominal value 266 MPa, measured at lower humidity) [41].
Summarizing these tensile strength results, Nafion exhibitslower tensile strength and elastic modulus than GO membranes,but exhibits much higher elongation and therefore can resist moredeformation before failure occurs. However, it is noted that theelectrodes and the interface between electrodes and Nafion willlikely not tolerate such extreme deformations. GO membranesexhibit a very large tensile strength and elastic modulus, but arevery stiff, characterized by fracture at only 20% elongation, and arethus less resistant to severe deformation. Further work is in prog-ress to measure these parameters under a wider range ofconditions.
Fig. 6. Impedance plots of a GO membrane (42 mm) with equivalent circuit: a)Dependence on humidity at 30 �C. b) Dependence on temperature at 80% RH.
Fig. 5. Stressestrain curve of (a) GO and (b) Nafion membranes. The insets show anenlarged plot of low strain regions for both samples.
To investigate the conductivity of GO membranes, impedancespectroscopy measurements were performed [27], which is thesmall-signal measurement of the linear electrical response of amaterial and the subsequent analysis of the response to yield usefulinformation about the physiochemical properties of the system[42,43]. The frequency dependent data is fitted using equivalentcircuits to determine membrane resistance and capacitance. Thisanalysis is aided by the use of Nyquist plots where the X-axisrepresents the real part of the impedance and Y-axis represents theimaginary part. The Nyquist plots of our measurements on GOgenerally show two semicircles, dependent on the measured fre-quency. Due to the larger capacitance of the thin electrode/mem-brane interface as compared to the relatively thicker membrane,the time constant (given by resistance multiplied by capacitance) istypically larger for the electrodes. Therefore, the impedance arcattributed to the electrode typically occurs at low frequency (i.e. theinverse of time constant), and themembrane impedance is found athigher frequency, as depicted by the right and left arcs in the figure[42,43]. The diameter of this high frequency semicircle is equivalentto the resistance of the membrane. This simplified impedance plot
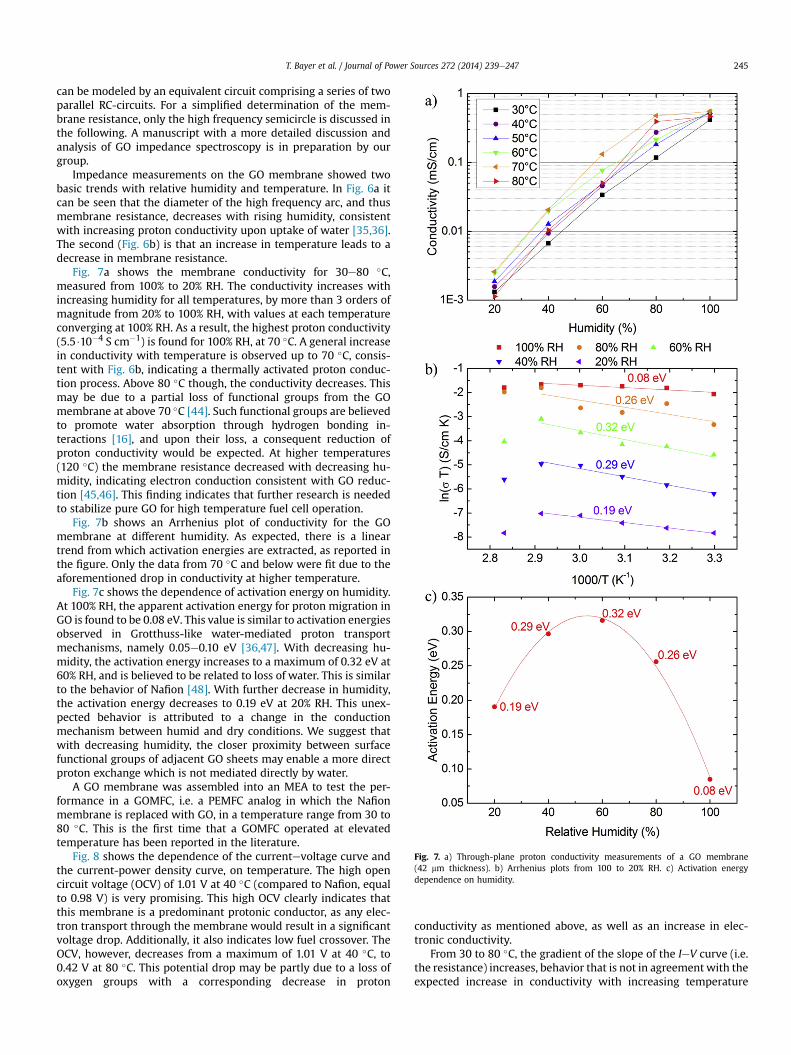
Fig. 7. a) Through-plane proton conductivity measurements of a GO membrane(42 mm thickness). b) Arrhenius plots from 100 to 20% RH. c) Activation energydependence on humidity.
T. Bayer et al. / Journal of Power Sources 272 (2014) 239e247 245
can be modeled by an equivalent circuit comprising a series of twoparallel RC-circuits. For a simplified determination of the mem-brane resistance, only the high frequency semicircle is discussed inthe following. A manuscript with a more detailed discussion andanalysis of GO impedance spectroscopy is in preparation by ourgroup.
Impedance measurements on the GO membrane showed twobasic trends with relative humidity and temperature. In Fig. 6a itcan be seen that the diameter of the high frequency arc, and thusmembrane resistance, decreases with rising humidity, consistentwith increasing proton conductivity upon uptake of water [35,36].The second (Fig. 6b) is that an increase in temperature leads to adecrease in membrane resistance.
Fig. 7a shows the membrane conductivity for 30e80 �C,measured from 100% to 20% RH. The conductivity increases withincreasing humidity for all temperatures, by more than 3 orders ofmagnitude from 20% to 100% RH, with values at each temperatureconverging at 100% RH. As a result, the highest proton conductivity(5.5$10�4 S cm�1) is found for 100% RH, at 70 �C. A general increasein conductivity with temperature is observed up to 70 �C, consis-tent with Fig. 6b, indicating a thermally activated proton conduc-tion process. Above 80 �C though, the conductivity decreases. Thismay be due to a partial loss of functional groups from the GOmembrane at above 70 �C [44]. Such functional groups are believedto promote water absorption through hydrogen bonding in-teractions [16], and upon their loss, a consequent reduction ofproton conductivity would be expected. At higher temperatures(120 �C) the membrane resistance decreased with decreasing hu-midity, indicating electron conduction consistent with GO reduc-tion [45,46]. This finding indicates that further research is neededto stabilize pure GO for high temperature fuel cell operation.
Fig. 7b shows an Arrhenius plot of conductivity for the GOmembrane at different humidity. As expected, there is a lineartrend from which activation energies are extracted, as reported inthe figure. Only the data from 70 �C and below were fit due to theaforementioned drop in conductivity at higher temperature.
Fig. 7c shows the dependence of activation energy on humidity.At 100% RH, the apparent activation energy for proton migration inGO is found to be 0.08 eV. This value is similar to activation energiesobserved in Grotthuss-like water-mediated proton transportmechanisms, namely 0.05e0.10 eV [36,47]. With decreasing hu-midity, the activation energy increases to a maximum of 0.32 eV at60% RH, and is believed to be related to loss of water. This is similarto the behavior of Nafion [48]. With further decrease in humidity,the activation energy decreases to 0.19 eV at 20% RH. This unex-pected behavior is attributed to a change in the conductionmechanism between humid and dry conditions. We suggest thatwith decreasing humidity, the closer proximity between surfacefunctional groups of adjacent GO sheets may enable a more directproton exchange which is not mediated directly by water.
A GO membrane was assembled into an MEA to test the per-formance in a GOMFC, i.e. a PEMFC analog in which the Nafionmembrane is replaced with GO, in a temperature range from 30 to80 �C. This is the first time that a GOMFC operated at elevatedtemperature has been reported in the literature.
Fig. 8 shows the dependence of the currentevoltage curve andthe current-power density curve, on temperature. The high opencircuit voltage (OCV) of 1.01 V at 40 �C (compared to Nafion, equalto 0.98 V) is very promising. This high OCV clearly indicates thatthis membrane is a predominant protonic conductor, as any elec-tron transport through the membrane would result in a significantvoltage drop. Additionally, it also indicates low fuel crossover. TheOCV, however, decreases from a maximum of 1.01 V at 40 �C, to0.42 V at 80 �C. This potential drop may be partly due to a loss ofoxygen groups with a corresponding decrease in proton
conductivity as mentioned above, as well as an increase in elec-tronic conductivity.
From 30 to 80 �C, the gradient of the slope of the IeV curve (i.e.the resistance) increases, behavior that is not in agreement with theexpected increase in conductivity with increasing temperature
T. Bayer et al. / Journal of Power Sources 272 (2014) 239e247246
observed in Fig. 7. We propose that the GOMFC may suffer a loss ofoxygen-containing functional groups due to the strongly reducinghydrogen conditions at the anode. A partial reduction of the GOmembrane could also result in an increase in electronic conduc-tivity, leading to a direct flow of electrons from the anode to thecathode, correspondingly reducing the OCV [49]. Additionally,rupture of the membrane may occur under reducing conditions,resulting in gas leakage across the membrane, with a correspond-ing drop in OCV.
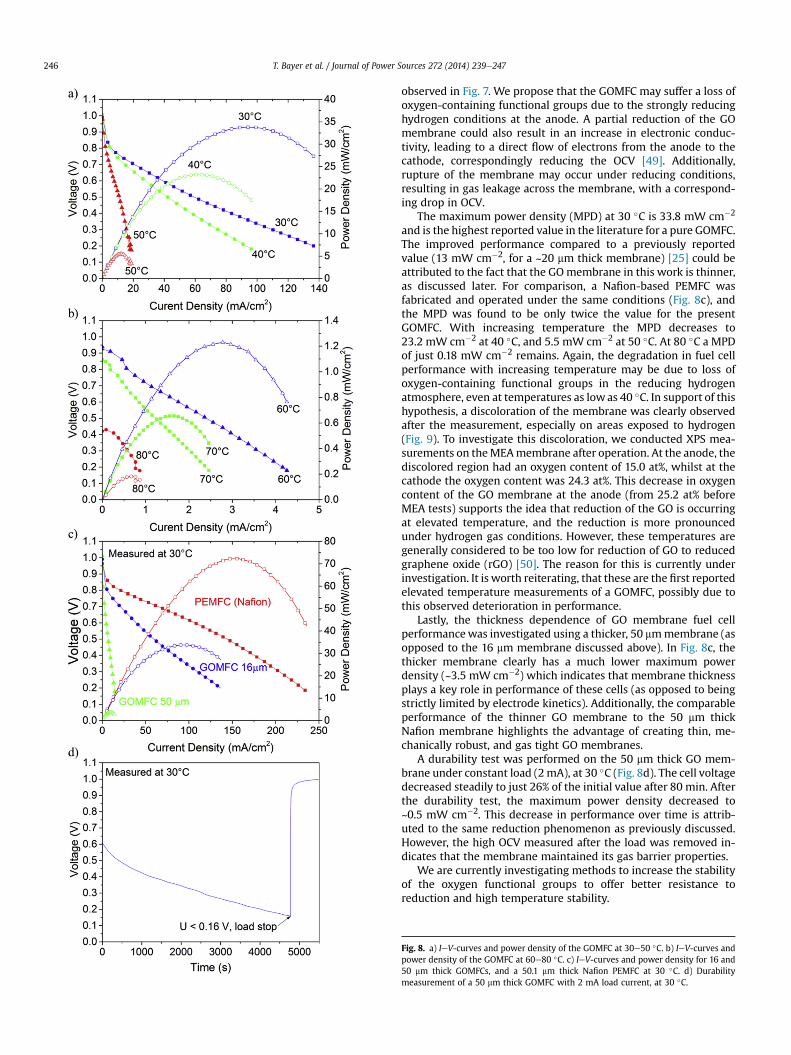
The maximum power density (MPD) at 30 �C is 33.8 mW cm�2
and is the highest reported value in the literature for a pure GOMFC.The improved performance compared to a previously reportedvalue (13 mW cm�2, for a ~20 mm thick membrane) [25] could beattributed to the fact that the GOmembrane in this work is thinner,as discussed later. For comparison, a Nafion-based PEMFC wasfabricated and operated under the same conditions (Fig. 8c), andthe MPD was found to be only twice the value for the presentGOMFC. With increasing temperature the MPD decreases to23.2 mW cm�2 at 40 �C, and 5.5 mW cm�2 at 50 �C. At 80 �C a MPDof just 0.18 mW cm�2 remains. Again, the degradation in fuel cellperformance with increasing temperature may be due to loss ofoxygen-containing functional groups in the reducing hydrogenatmosphere, even at temperatures as lowas 40 �C. In support of thishypothesis, a discoloration of the membrane was clearly observedafter the measurement, especially on areas exposed to hydrogen(Fig. 9). To investigate this discoloration, we conducted XPS mea-surements on theMEAmembrane after operation. At the anode, thediscolored region had an oxygen content of 15.0 at%, whilst at thecathode the oxygen content was 24.3 at%. This decrease in oxygencontent of the GO membrane at the anode (from 25.2 at% beforeMEA tests) supports the idea that reduction of the GO is occurringat elevated temperature, and the reduction is more pronouncedunder hydrogen gas conditions. However, these temperatures aregenerally considered to be too low for reduction of GO to reducedgraphene oxide (rGO) [50]. The reason for this is currently underinvestigation. It is worth reiterating, that these are the first reportedelevated temperature measurements of a GOMFC, possibly due tothis observed deterioration in performance.
Lastly, the thickness dependence of GO membrane fuel cellperformancewas investigated using a thicker, 50 mmmembrane (asopposed to the 16 mm membrane discussed above). In Fig. 8c, thethicker membrane clearly has a much lower maximum powerdensity (~3.5 mW cm�2) which indicates that membrane thicknessplays a key role in performance of these cells (as opposed to beingstrictly limited by electrode kinetics). Additionally, the comparableperformance of the thinner GO membrane to the 50 mm thickNafion membrane highlights the advantage of creating thin, me-chanically robust, and gas tight GO membranes.
A durability test was performed on the 50 mm thick GO mem-brane under constant load (2mA), at 30 �C (Fig. 8d). The cell voltagedecreased steadily to just 26% of the initial value after 80 min. Afterthe durability test, the maximum power density decreased to~0.5 mW cm�2. This decrease in performance over time is attrib-uted to the same reduction phenomenon as previously discussed.However, the high OCV measured after the load was removed in-dicates that the membrane maintained its gas barrier properties.
We are currently investigating methods to increase the stabilityof the oxygen functional groups to offer better resistance toreduction and high temperature stability.
Fig. 8. a) IeV-curves and power density of the GOMFC at 30e50 �C. b) IeV-curves andpower density of the GOMFC at 60e80 �C. c) IeV-curves and power density for 16 and50 mm thick GOMFCs, and a 50.1 mm thick Nafion PEMFC at 30 �C. d) Durabilitymeasurement of a 50 mm thick GOMFC with 2 mA load current, at 30 �C.
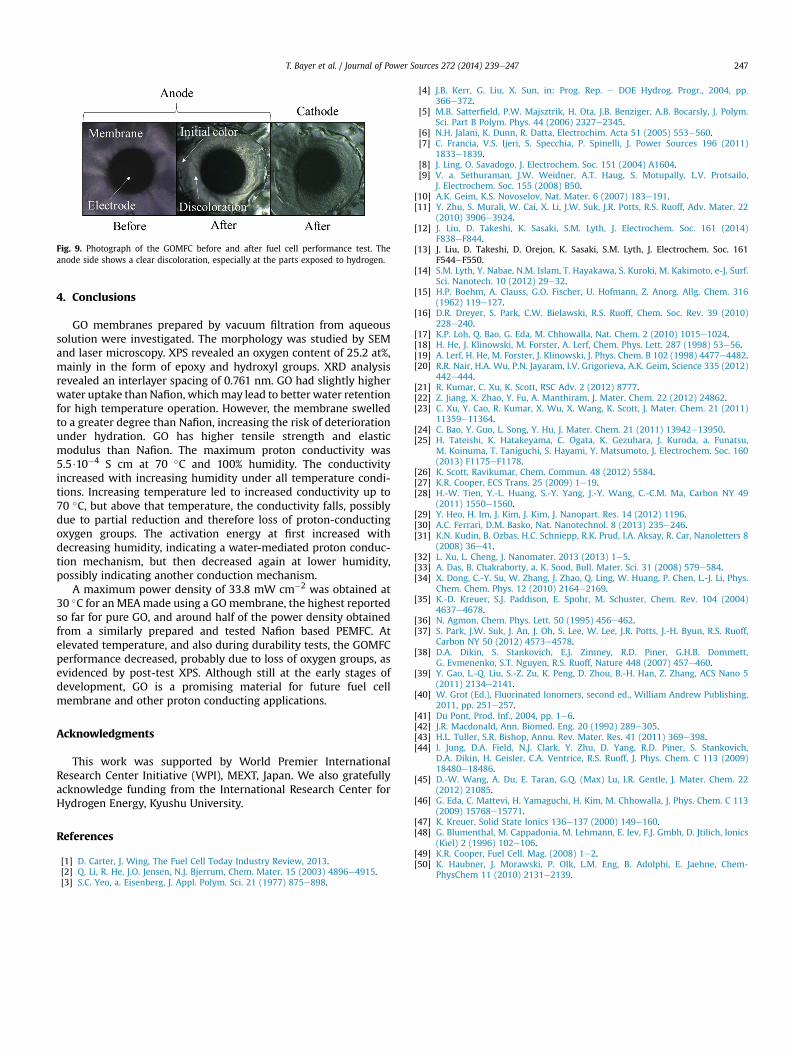
Fig. 9. Photograph of the GOMFC before and after fuel cell performance test. Theanode side shows a clear discoloration, especially at the parts exposed to hydrogen.
T. Bayer et al. / Journal of Power Sources 272 (2014) 239e247 247
4. Conclusions
GO membranes prepared by vacuum filtration from aqueoussolution were investigated. The morphology was studied by SEMand laser microscopy. XPS revealed an oxygen content of 25.2 at%,mainly in the form of epoxy and hydroxyl groups. XRD analysisrevealed an interlayer spacing of 0.761 nm. GO had slightly higherwater uptake than Nafion, whichmay lead to better water retentionfor high temperature operation. However, the membrane swelledto a greater degree than Nafion, increasing the risk of deteriorationunder hydration. GO has higher tensile strength and elasticmodulus than Nafion. The maximum proton conductivity was5.5$10�4 S cm at 70 �C and 100% humidity. The conductivityincreased with increasing humidity under all temperature condi-tions. Increasing temperature led to increased conductivity up to70 �C, but above that temperature, the conductivity falls, possiblydue to partial reduction and therefore loss of proton-conductingoxygen groups. The activation energy at first increased withdecreasing humidity, indicating a water-mediated proton conduc-tion mechanism, but then decreased again at lower humidity,possibly indicating another conduction mechanism.
A maximum power density of 33.8 mW cm�2 was obtained at30 �C for an MEAmade using a GOmembrane, the highest reportedso far for pure GO, and around half of the power density obtainedfrom a similarly prepared and tested Nafion based PEMFC. Atelevated temperature, and also during durability tests, the GOMFCperformance decreased, probably due to loss of oxygen groups, asevidenced by post-test XPS. Although still at the early stages ofdevelopment, GO is a promising material for future fuel cellmembrane and other proton conducting applications.
Acknowledgments
This work was supported by World Premier InternationalResearch Center Initiative (WPI), MEXT, Japan. We also gratefullyacknowledge funding from the International Research Center forHydrogen Energy, Kyushu University.
References
[1] D. Carter, J. Wing, The Fuel Cell Today Industry Review, 2013.[2] Q. Li, R. He, J.O. Jensen, N.J. Bjerrum, Chem. Mater. 15 (2003) 4896e4915.[3] S.C. Yeo, a. Eisenberg, J. Appl. Polym. Sci. 21 (1977) 875e898.
[4] J.B. Kerr, G. Liu, X. Sun, in: Prog. Rep. e DOE Hydrog. Progr., 2004, pp.366e372.
[5] M.B. Satterfield, P.W. Majsztrik, H. Ota, J.B. Benziger, A.B. Bocarsly, J. Polym.Sci. Part B Polym. Phys. 44 (2006) 2327e2345.
[6] N.H. Jalani, K. Dunn, R. Datta, Electrochim. Acta 51 (2005) 553e560.[7] C. Francia, V.S. Ijeri, S. Specchia, P. Spinelli, J. Power Sources 196 (2011)
1833e1839.[8] J. Ling, O. Savadogo, J. Electrochem. Soc. 151 (2004) A1604.[9] V. a. Sethuraman, J.W. Weidner, A.T. Haug, S. Motupally, L.V. Protsailo,
J. Electrochem. Soc. 155 (2008) B50.[10] A.K. Geim, K.S. Novoselov, Nat. Mater. 6 (2007) 183e191.[11] Y. Zhu, S. Murali, W. Cai, X. Li, J.W. Suk, J.R. Potts, R.S. Ruoff, Adv. Mater. 22
(2010) 3906e3924.[12] J. Liu, D. Takeshi, K. Sasaki, S.M. Lyth, J. Electrochem. Soc. 161 (2014)
F838eF844.[13] J. Liu, D. Takeshi, D. Orejon, K. Sasaki, S.M. Lyth, J. Electrochem. Soc. 161
F544eF550.[14] S.M. Lyth, Y. Nabae, N.M. Islam, T. Hayakawa, S. Kuroki, M. Kakimoto, e-J. Surf.
Sci. Nanotech. 10 (2012) 29e32.[15] H.P. Boehm, A. Clauss, G.O. Fischer, U. Hofmann, Z. Anorg. Allg. Chem. 316
(1962) 119e127.[16] D.R. Dreyer, S. Park, C.W. Bielawski, R.S. Ruoff, Chem. Soc. Rev. 39 (2010)
228e240.[17] K.P. Loh, Q. Bao, G. Eda, M. Chhowalla, Nat. Chem. 2 (2010) 1015e1024.[18] H. He, J. Klinowski, M. Forster, A. Lerf, Chem. Phys. Lett. 287 (1998) 53e56.[19] A. Lerf, H. He, M. Forster, J. Klinowski, J. Phys. Chem. B 102 (1998) 4477e4482.[20] R.R. Nair, H.A. Wu, P.N. Jayaram, I.V. Grigorieva, A.K. Geim, Science 335 (2012)
442e444.[21] R. Kumar, C. Xu, K. Scott, RSC Adv. 2 (2012) 8777.[22] Z. Jiang, X. Zhao, Y. Fu, A. Manthiram, J. Mater. Chem. 22 (2012) 24862.[23] C. Xu, Y. Cao, R. Kumar, X. Wu, X. Wang, K. Scott, J. Mater. Chem. 21 (2011)
11359e11364.[24] C. Bao, Y. Guo, L. Song, Y. Hu, J. Mater. Chem. 21 (2011) 13942e13950.[25] H. Tateishi, K. Hatakeyama, C. Ogata, K. Gezuhara, J. Kuroda, a. Funatsu,
M. Koinuma, T. Taniguchi, S. Hayami, Y. Matsumoto, J. Electrochem. Soc. 160(2013) F1175eF1178.
[26] K. Scott, Ravikumar, Chem. Commun. 48 (2012) 5584.[27] K.R. Cooper, ECS Trans. 25 (2009) 1e19.[28] H.-W. Tien, Y.-L. Huang, S.-Y. Yang, J.-Y. Wang, C.-C.M. Ma, Carbon NY 49
(2011) 1550e1560.[29] Y. Heo, H. Im, J. Kim, J. Kim, J. Nanopart. Res. 14 (2012) 1196.[30] A.C. Ferrari, D.M. Basko, Nat. Nanotechnol. 8 (2013) 235e246.[31] K.N. Kudin, B. Ozbas, H.C. Schniepp, R.K. Prud, I.A. Aksay, R. Car, Nanoletters 8
(2008) 36e41.[32] L. Xu, L. Cheng, J. Nanomater. 2013 (2013) 1e5.[33] A. Das, B. Chakraborty, a. K. Sood, Bull. Mater. Sci. 31 (2008) 579e584.[34] X. Dong, C.-Y. Su, W. Zhang, J. Zhao, Q. Ling, W. Huang, P. Chen, L.-J. Li, Phys.
Chem. Chem. Phys. 12 (2010) 2164e2169.[35] K.-D. Kreuer, S.J. Paddison, E. Spohr, M. Schuster, Chem. Rev. 104 (2004)
4637e4678.[36] N. Agmon, Chem. Phys. Lett. 50 (1995) 456e462.[37] S. Park, J.W. Suk, J. An, J. Oh, S. Lee, W. Lee, J.R. Potts, J.-H. Byun, R.S. Ruoff,
Carbon NY 50 (2012) 4573e4578.[38] D.A. Dikin, S. Stankovich, E.J. Zimney, R.D. Piner, G.H.B. Dommett,
G. Evmenenko, S.T. Nguyen, R.S. Ruoff, Nature 448 (2007) 457e460.[39] Y. Gao, L.-Q. Liu, S.-Z. Zu, K. Peng, D. Zhou, B.-H. Han, Z. Zhang, ACS Nano 5
(2011) 2134e2141.[40] W. Grot (Ed.), Fluorinated Ionomers, second ed., William Andrew Publishing,
2011, pp. 251e257.[41] Du Pont, Prod. Inf., 2004, pp. 1e6.[42] J.R. Macdonald, Ann. Biomed. Eng. 20 (1992) 289e305.[43] H.L. Tuller, S.R. Bishop, Annu. Rev. Mater. Res. 41 (2011) 369e398.[44] I. Jung, D.A. Field, N.J. Clark, Y. Zhu, D. Yang, R.D. Piner, S. Stankovich,
D.A. Dikin, H. Geisler, C.A. Ventrice, R.S. Ruoff, J. Phys. Chem. C 113 (2009)18480e18486.
[45] D.-W. Wang, A. Du, E. Taran, G.Q. (Max) Lu, I.R. Gentle, J. Mater. Chem. 22(2012) 21085.
[46] G. Eda, C. Mattevi, H. Yamaguchi, H. Kim, M. Chhowalla, J. Phys. Chem. C 113(2009) 15768e15771.
[47] K. Kreuer, Solid State Ionics 136e137 (2000) 149e160.[48] G. Blumenthal, M. Cappadonia, M. Lehmann, E. Iev, F.J. Gmbh, D. Jtilich, Ionics
(Kiel) 2 (1996) 102e106.[49] K.R. Cooper, Fuel Cell. Mag. (2008) 1e2.[50] K. Haubner, J. Morawski, P. Olk, L.M. Eng, B. Adolphi, E. Jaehne, Chem-
PhysChem 11 (2010) 2131e2139.
Copyright © 2022 FDOKUMEN