Final GEIS on use of recycle Pu in mixed oxide fuel in LWR
187
, N U R EG-0002, VO L. 2 j | : i Final Generic Environmental Statement on the Use of Recycle Plutonium in Mixed Oxide Fuel in Light Water Cooled Reactors ! | HEALTH, SAFETY & ENVIRONMENT | Chapter I - Introduction 11 - Background and Experience with Plutonium lil - Projected Plutonium Recycle industry | | August 1976 Office of Nuclear Material Safety and Safeguards U.S. Nuclear Regulatory Commission 77j LLk1, L
-
Upload
khangminh22 -
Category
Documents
-
view
2 -
download
0
Transcript of Final GEIS on use of recycle Pu in mixed oxide fuel in LWR
,
N U R EG-0002, VO L. 2 j
|:i
Final Generic Environmental Statement on
the Use of Recycle Plutonium in
Mixed Oxide Fuel in Light Water Cooled Reactors!
|
HEALTH, SAFETY & ENVIRONMENT|
Chapter
I - Introduction
11 - Background and Experience with Plutonium
lil - Projected Plutonium Recycle industry
|
|
August 1976
Office of Nuclear Material Safety and SafeguardsU.S. Nuclear Regulatory Commission
77j LLk1, L

VOLUME 2
TABLE OF CONTENTS,
|'
Paragraph Title Page
CHAPTER I - INTRODUCTION
1.0 BACKGROUND AND PURPOSE OF GESM0.................. ..... 1-1. .......... ..
2.0 LIGHT WATER REACTOR PROJECTIONS AND URANIUM AND PLUT0NIUM RECYCLE OPTIONS..... 1-3
2.1 No Recycle Option. . . . 1-6. ......... . ........... .. ....... ..... .. .
|2.2 Ura n i um Re cyc l e Op ti o n . . . . . . . . . . . . . . . . . . . . . . . . . . . . . .. . I-92.3 Plutonium Recycle Option....... I-9...... . ........ .. .. . . .
3,0 ENVIRONMENTAL EFFECTS OF RECYCLE IN LIGHT WATER REACTORS.. 1-19.. .. .
4.0 APPROACH TO ASSESSMENT OF ENVIRONMENTAL IMPACTS OF RECYCLE IN LIGHT WATERREACTORS.. ..... . .. .. .. . . .... ...... . .... .. .. . . I-21
5." '/0PE OF GESMO. I-22. .. . . .. ........ ..... . . .... ..... . . .. . ..
.1 Volume 1 - Summary and Conclusions. . .... I-22... ... ... ... . . . .
5.2 Vol ume 2 - CHAPTERS !-III . . . . . . . . ... . ..... .. . . . .... . . I-22
5.3 Volume 3 - CHAPTER IV. . I-22.. .. .. . ....... . .. . .
5.4 Volume 4 - CHAPTER V-XI.. .. . . . 1-24... . . .. ....... . .. . . ..
5.5 Volume 5 - Comments. . . 1-25... ..... ... .. . .. . .... . . .......
APPENDIX A. . ....... . . ... .. ..... . I(A)-1.. . .. ...... . . .... .. . ..
Part I The Genesis of Plutonium in Light Water Peactors. !(A)-1.. ..
Part II The Generation of Transplutonium Actinides . .. !(A)-3.. .. .... .
CHAPTER II - BACKGROUND AND EXPERIENCE WITH PLUT0NIUM
1.0 INTRODUCTION... .. . .. 11-1.... ... .... . . .. . .. . .. .....
2.0 PLUT0NIUM: GENERAL 9%CKGROUND AND EXPERIENCE. . . 11-1 i. .. . . .. .. .
2.1 The formation of Plutonium in the Reactor. 11-2.. ... . ...... .
2.2 Nuclear Characteristics of Plutonium. .. .. . ... .... .. . II-3
2.3 The Chemistry of Pu0 * **** * II-92** * * ** * -'**
2.4 Radiobiological Hazards of Plutonium.. . . . II-9...... .. .... ...
3.0 PLUTONIUM RECYCLE IN LWR'S..... 11-11... ... .. .. . ... .. .
3.1 Development and Testing of Mixed Oxide Fuels........ II-ll. . . .
| 3.1.1 Plutonium Utilization Program. II-12.. .. . .. ... . .. .. . ..
3.1.2 Saxton Program..... . . . II-17.. .. . . .. ...... . .
3.1.3 Edison Electric Institute / Westinghouse. II-20...... .... .. .
3.1.4 Edison Electric Institute / General Electric. II-24. . . ...
| 3.1.4.1 Rod Irradiations... ...... .. .. . 11-25.. .. .. . .
3.1.4.2 Bundle Irradiation Demonstrations. . !!-28. . . ....i
3.1.4.3 M0X fuel Irradiation - Guad Cities Unit No.1. II-29. ..
i
t_ ,

VOLUME 2
TABLE OF CONTENTS
Paragraph Title Page
CHAPTER II - BACKGRDUND AND EXPERIENCE WITH PLUT0NIUM (Con t'd)
3.1.5 Gulf United Nuclear Corporation / Commonwealth Fdison. .. 11-30.. ......
3.1.6 Bi g Roc k Po i n t/ E x xon/ NF S . . . . . . . . . . . . . . . . . . . . . . . . . . . . . . . . . . . . . . II-32
3.1. 7 The Belgian Plutonium Recycle Program. . . . . . . . . . . . . . . . . . . . . 11-33...
3.1.8 CNEN/ENEL Plutonium Utilization Programs in Italy......... II-34. ....
3.1.9 Obrigheim Reactor Demonstration of Mixed 0xide Fuel. . . . . .. . . . . . 11-35
3.1.10 Worldwide Plutonium Utilization Plans and Programs.. . .. . . . .. .. .. II-363.2 Mixed 0xide Fuel Fabrication. 11-41.. .......... ............... ....... .. .
3.3 Reprocessing of Mixed Oxide Fuels...... .... ...... ........... 11-42..... ..
3.4 Effects of Plutonium Recycle on Transportation....... . ...... ... . II-433.5 Ef fects of Plutonium Recycle as Fuel on Waste Management. . . . . . . . . . . . 11-44
3.6 Summary of Accident Experience.. II-45. ... . ....... .. .. ..... .......
REFERENCES.... 11-49. ...... ...... .. ..... ................ . . .. .. .... ....
CHAPTER !!! - PROJECTED PLUTONIUM RECYCLE INDUSTRY
.. . ...... . . ....... .. ......... .. .... ....... . . 'II-lSUMMARY. ..... ..1.0 INTRODUCTION. I!!-6.... ... . ...... . . . . . ........ .... .. ...... .....
2.0 CONSUMPTION OF ENERGY IN THE U.S.... III-7. ..... .. . .. ... . ...... ...
2.1 Relationship of Energy Consumption to Gross National Product..... III-7.. ..
2.2 Forecasts of Future Rates of Energy Consumption...... III-7... . . ... . .
3.0 POTENTIAL ENERGY RESOURCES..... .... III-13.. . .... ... ... ........ .. ..
3.1 Fossil Fuels.. III-13. .. . ....... . .... .... .. ...... ... .. .. ..
III-143.2 Hydro, Tidal, and Geothermal Resources. . . .. . .. . . . ... .. .
3.3 Solar Energy..... III-14.. . . ........ . ... . . ... . .. . . .
111-153.4 Uranium. ... .... .... ...... . ... . .. . . .. ... . . .. .
3.5 Thermonuclear Fuels. . . I!!-15...... ....... ...... . . . ... .. .... .. ..
3.6 Consumption of Resources. ... ... . . ...... .. 111-16... . .. . . .. . ...
.... ..... ...... ............ .. . .. . .. . . III-174.0 ELECTRICAL ENERGY.,
III-174.1 Growth in the Generation of Electricity... ......... . . .. . .....
4.2 Technologies Capable of Supplying Electricity. . .. .. III-19.... . .. . .
.. ........ ... .... . .. . .. . III-194.2.1 Fossil fuel Power. . ..4.2.2 Hydroelec tri c Power. . . . . . . . . . . . III-22... ... . ....... . ..
4.2.3 Geothermal Power.... ...... ...... III-22...... . .. . . . ........ .
4.2.4 Solar Power.......... ........... .... .. ... ... . . . III-23...... .
4.2.5 Thermonuclear Power......... . III-25....................... . ..... .
4.2.6 Nucl ea r Power . . . . . . . . . . . . . . . . . . . . . . . . . III-25... ....... ... ...
... .. .. . ..... . III-274.2.7 Co n s erva ti on . . . . . . . . . . . . . . . . . . . . . . . .
4.2.8 NRC Conclusions............. . . .. ...... ........... .. ... . III-29
11
VOLUME 2
TABLE OF CONTENTS
, Paragraph Title Pagel
CHAPTER III - PROJECTED PLUTONIUM RECYCLE INDUSTRY (Cont'd)
4.3 Growth in Nuclear Electric Generating Capacity. . .. . .. . . . III-29...... .... . .
5.0 ROLE OF PLUT0NIUM RECYCLE.............. ............ .. .......... ....... ... III-31
5.1 Domestic Uranium Resources and Relation to Use of LWR's. . . . .. .. . . .. . . III-315.2 Availability and Dependence on Foreign Supplies........ .... .... III-33. ...
5.3 Relationship Between Pu Recycle and the Long Tenn Nuclear Option.... III-33...
5.4 Ava il abil i ty o f Pl u to n1 u. . . . . . . . . . . . . . . . . . . . . . . . . III-34............ .... .
6.0 THE LWR INDUSTRY IN THE Y EAR 2000. . . . . . . . . . . . . . . . . . . . . . III-34... ....... ...
.. ...... ... ..... ..... . . . III-386.1 The Components of the LWR Industry...III-386.1.1 Reactors.............. .................... ......... .... .. .
6.1.2 Mi xed Oxide Fuel Fabri cation. . . . . . . . . . . . . . . . . I!!-39. . ....... . .. .
!!I-406.1.3 Fuel Reprocessing... .... ... ..... .... ...... ..... .. .. . ..
6.1.4 The Supporting Uranium Cycle.. . . .. III-40.......... ......... .. ..
6.1.4.1 Mine-Mill Complexes... ........ .... .... . ....... . ... III-41
III-426.1.4.2 UF Con e sion..... .. m. ..m..m.m.m. .. m . . .. .6
6.1.4.3 Uranium Enrichment....... ... ...... III-43.. ..... .. .
III-436.1.4.4 U0 Fuel Fabrication..... . .. . .. ... ... .. ... .
26.2 Transportation......... ................ ....................... ... .. III-446.3 Waste Management... ...... .. III-45. ..... .. .... ..... .... ... .........
6.3.1 No Recycle of Uranium or Plutonium. . . .. . . . III-46.. .............
6.3.2 Recycle of Uranium Only or Recycle of Both Uranium andP l u to n i um . . . . . . . . . . . . . . . . . III-47... .............. ..... ... ......
APPENDIX A COMPUTER PRINTOUTS FOR CENTERLINE CASE (LOW GROWTH WITH NO BREEDER). . III(A)-1
.. . . . . III(B)-1APPENDIX B GROWTH PROJECTIONS FOR NUCLEAR GENERATING CAPACITY... .
REFERENCES. ........ ................. .............. ........ III(R)-1.. . .. ...
,
iii
If
.
VOLUME 2
LIST OF TABLES
Table Title Page
CHAPTER I - INTRODUCTION
!-l Maximum Permissible Airborne Concentrations (Mass / Volume)of Urani um and Plutonium Nuclides , Occupa tional Exposure. . . . . . . . . . . . . . . . I-17
I-2 Summary of Effects of Plutonium Recycle in the Overall U.S. LWRFuel Cycl e i n a bout the Yea r 2000. . . . . . . . . . . . . . . . . . . . . . . . . . . . . . . . . . . I-20
CHAPTER II - BACKGROUND AND EXPERIENCE WITH PLUT0NIUM
II-l Selected Nuclear Characteristics of Uranium Isotopes. . ... .. .. .. . . .. .. . . . II-4
II-2 Selected Nuclear Characteristics of Plutunium Isotopes.... . ... 11-5. ....
II-3 Operating Conditions for the Plutonium Recycle Test Reactor..... ....... 11-13
II-4 Fuel Elements Irradiated in Plutonium Recycle Test Peactor. 11-15.. ......
II-5 Saxton Core II Design Operating Conditions. . . II-18. . ......... ..........
11-6 EEI/GE - Big Rock Point Reactor 32 Rod Program ExperimentDesign............. II-26................ .... .. .. ........ ..... ..... ..
II-7 EEI/GE - Big Rock Point M0X Fuel Data . . . . . . . . . . . . . . . . . II-26.. ...........
II-8 EEI/GE - Big Rock Point Mixed Oxide Fuel ThermalPerfo rma nce Cha rac teri s tics . . . . . . . . . . . . . . . . . . . . . . . 11-27.... ............
II-9 EEI/GE - Big Rock Peint Fuel Pellet Specifications.Three Bundles........... .................................. .. II-27..... .
11-10 Isotopic Composition of Plutonium for Dresden PlutoniumRecycle Assemblies... ........... .... . .. . ... .. .. 11-30. .... ... ...
II-11 Summary of the Irradiation of Mixed 0xide Fuel AssembliesOperated in Kra f twerk Union (KWU) Supplied Plants. . . . .. . .. . . . ... II-36..
11-12 Long-Lived Alpha Activity Released from Rocky Flats...... .. 11-47..........
CHAPTER III - PROJECTED PLUTONIUM RECYCLE INDUSTRY
111-1 The ?rojected LWR Industry for the Period 1975-2000With No Recycle...... . III-3............ .................. . . .. .......
III-2 The Projected LWR Industry for the Period 1975-2000With Pecycle of Uranium Only.... .............. .. ........ .... . .... III-4
III-3 The Projected LWR Industry for the Period 1975-2000With Recycle of Both Uranium and Plutonium. . . . . . . . . . III-5... .. . .. ..
i
! iv
____

VOLUME 2
LIST OF TABLES
Pa ragra ph Title Page
CHAPTER III - PROJECTED PLUTONIUM RECYCLE INDUSTRY (Cont'd)
III-4 Energy usage for Various Applications (1968) . . . . . . . . . . . . . . . . . . . . . . . . . . III-ll
III-5 Department of the Interior Forecast of U.S. Energy111-11Consumption.......... .......... . . ............. . ........ ...
III-6 Projected Distribution of Consumption Among Consuming Sectors.. .. . .... 111-12
III-7 Federal Energy Administration Forecast of U.S. Energy Demands., .. ... . III-12
III-8 Federal Energy Administration Distribution of Energy DemandAmona Consuming Sectors. ......... III-13... . ... . . ........ ... .. ..
III-9 Total Estimated Recoverable Resources of Fossile Fuels...... ..... III-14.....
III-10 Hydroelectric, Tidal and Geothermal Resources.. III-14. .. ....... .. ......
. . ... . .. .... .. .. .. . III-15III-11 U.S. Uranium Resources. . . . . . . . . . . . .
III-15III-12 Fusion Fuel Resources....... ...... .... ..... .. . . . . .
111-13 U.S. Consumption of Energy Resources by Major Sources and..... ...... .............. . .. . III-16Consuming Sectors in 1974... .
III-14 Department of the Interior Forecast of Consumption ofEnergy by Major Source........... ............... .. .. . .. III-17. ........
III-15 Federal Energy Administration Forecast of Consumption ofIII-17Energy by Major Source.. .. .... .. ... . ... ... ... . .
III-16 U.S. Electric Power Statistics 1947-1974.. .... ... III-18... ... . ....
III-17 Consumption and Growth of Purchased Electricity by Sectorand End Use 1960-1963.... III-28.... . .. ....... .. .... ..... . .. .. .....
111-18 Cumulative Fissile Plutonium Recovered from LWR's.. ... ... 111-38.. . ... .
III-19 Projected Cumulative Waste Inventory in the Year 2000...... .. . .. 111-46
III-(B)-1 Comparison of Forecasts, Projections and Scenarios of TotalNuclear Generating Capacity for 1985 and the Year 2000.. ..... III(B)-2.. . ..
y

. _ . .._ ... - . - , - _ _ . . .. - . _ _ .___ _ ._. -_ =_ , _ _ _ _ . - _ _ _. __
.i -
4
iVOLUME 2
:
LIST OF FIGURES4
Figure Title Page.
,
4
CHAPTER I - INTRODUCTION
I-l ' Centra 1' Station Electrical Generating Capacity in the United Statesas Projected by ERDA, OPA, 1975 Low Growth............................... I-4,
)d 1-2 Annual United States Industrywide Fuel Cycle Requirements for LightWater Reactors for About 2000 Without Urar' lum or Plutonium Recycle,'ERDA OPA, 1975 Projection, Low Growth, Wi thout Breeder. .. . . . . . . . . . . . . . . . . I-7
I-3 Annual Yellowcake and Enrichment Requirements for United Statesd
Light Water Power Reactors as Projected by ERDA OPA,1975. Low Growth,Wi thou t Breeder (Wi thout U or Pu Recyc le ) . . . . . . . . . . . . . . . . . . . . . . . . . . . . . . . . I-8
I-4 Annual United States Industrywide Fuel Cycle Requirements forLight Water Reactors for About 2000 With Uranium Recycle Only,'
ERDA OPA, 1975 Projection Low Growth, Without Breeder................... 1-10.
I-5 Central Station Generating Capacity in the United States by Reactor! Type a s Projected by ERDA OPA , 1975 Low Growth. . . . . . . . . . . . . . . . . . . . . . . . . 1-12
I-6 Annual Production and Utilization of Plutonium in Power Reactorsin the United States as Projected by ERDA OPA, 1975 Low Growth(Without Pu Recycle in LWR's)........................... ............ ... 1-13
I-7 Annual United States Industrywide Fuel Cycle Requirements for Light,
Water Reactors for About 2000 With Urant a and Plutonium Recycle,r
j ERDA OPA, 1975 Projection, Low Growth, Without Breeder................... 1-15
CHAPTER II - BACKGROUND AND EXPERIENCE WITH PLUT0NIUM |+
f 11-1 The' Total and Fission Cross Sections of 239Pu at Low Neutron '
j Energies....... ................... ........ ............................ II-6 '
241II-2 The Total and Fission Cross Sections of Pu at low Neutron,
Energies................................................................. Il-7 j'
235 239!!-3 Nu;1 ear Characteristics of 0 and Pu................................ II-8
1
CHAPTER III - PROJECTED PLUTONIUM RECYCLE INDUSTRY
.III-1 1968 Per Capi ta Income And Energy Contumption. . . . . . . . . . . . . . . . . . . . . . . . . . . . III-8 I
III-2 Energy Cogsumption and Gross National Product.| 1920 to 1970, Wi th Projections to 1990. . . . . . . . . . . . . . . . . . . . . . . . . . . . . . . . . . . III-9
III-3 . Changes in Energy and GNP, 1947-1974.............. ...................... III-10
'III-4 Forecasts of ' Growth in Total Electric Generating
. Capacity............................................................. ... III-20,
vi'
_- _ . _ . - _ - -- , _ - . , __ _ _

VOLUME 2
LIST OF FIGURES
Figure Title Page
CHAPTER !!! - PROJECTED PLUTONIUM RECYCLE INDUSTRY (Cont'd)
!!!-5 Forecas ts of Growth in Nuclea r Power Generation Capacity. . . . . . . . . . .. . . . . . III-30
!!!-6 Projected U 0 Comi tmen ts for Model LWR 's . . . . . . . . . . . . . . . . . . . . . . . . . . . . . . III-3238!!!-7 The Model Light Water Reactor Industry in the Year 2000 -
Without Uranium or Plutonium Recycle (ERDA-OPA 1975Projection - Low Growth Without Breeder)................................ III-35
!!!-8 The Model Light Water Reactor Indu*,try in the Year 2000 -With Uranium Recycle Only (ERDA-0PA 1975 Projection -Low Growth, Without Breeder).... .............................. ......... Ill-36
!!!-9 The Model Light Water Reactor Industry in the 2000 - WithUranium and Plutonium Recycle (ERDA-OPA 1975 Projection -Low Growth, Without Breeder)............................................. III-37
vil
_
,

--
GESMO
CHAPTER I
INTRODUCTION
t
-
_ _ _ _ _ _ _ _
_ _ - - _ _ _ _ _ _ _ - - _ _ _
CHAPTER I
INTRODUCTION
Paragraph Page
1.0 BACKGROUND AND PURPOSE OF GESM0............................................... 1-1
2.0 LIGHT WAYER REACTOR PROJECTIONS AND URANIUM AND PLUTONIUM RECYCLE OPTIONS..... 1-3
2.1 No Recycla 0ption........................................................ 1-6
2.2 Uranium Recycle 0ption................................................... I-92.3 Plutonium Recycle Option........ .......... ............................. I-9
3.0 ENVIRONMENTAL EFFECTS OF RECYCLE IN LIGHT WATER REACTORS...................... 1-19
4.0 APPROACH TO ASSESSMENT OF ENV!n0NMENTAL IMPACTS OF RECYCLE IN LIGHT WATERREACT 0RS.................................................................... 1-21 |
5.0 SCOPE CF GESP0................................................................ 1-22
5.1 Vol ume 1 - S umma ry a nd Co ncl u s i o n s . . . . . . . . . . . . . . . . . . . . . . . . . . . . . . . . . . . . . . . 1-22
5.2 Volume 2 - CHAPTERS I-I!!.... ................................... ....... I-225.3 V o l ume 3 - C HA PT E R I V . . . . . . . . . . . . . . . . . . . . . . . . . . . . . . . . . . . . . . . . . . . . . . . . . . . . 1-22
5.4 Volume 4 - CHAPTER V-XI.................................................. 1-24
5.5 Volume 5 - Comments...................... ... .. ........................ I-25
APPENDIX A......................................................................... I(A)-1 ,
!
Part I The Genesis of Plutonium in Light Water Reactors................. !(A)-1Part II The Generation of Transplutonium Actinides ..................... !(A)-3
i

CHAPTER I
INTRODUCTION
1.0 BACKGROUND AND PURPOSE OF GESMO
The current generation of light water nuclear power reactors (LWR's) normallyuses fuel in which natural uranium is enriched from 0.7 percent readily fissionableuranium-235(235) to between 3 and 4 percent 235 The balance of the uranium fuel0 U
consists of relatively nonfissionable uranium-238 (238 ).U
238All nuclear reactors containing U in their fuel produce plutonium as a byprod-9uct of the chain reaction. Two of the more plentiful isotopes of plutonium, Pu and
2#I Pu, are readily fissionable and, once formed, contribute to the fission process
(chainreaction).
Generally more than half of the plutonium produced in the reactor subsequentlyfissions in place, thus contributing significantly to the energy produced in the powerplant. Just before expended fuel is discharged from the reactor, more than half thefissions occurring in that fuel are fissions of plutonium rather than uranium. Thus,in effect, uranium fueled light water power reactors generate plutonium, some of whichis consumed in the reactor without external recycle.
About one-third to one-fourth of a light water reactor's fuel is removed eachyear and replaced by fresh fuel. Although the used fuel is referred to as " spent
235 , as well as plutonium. The plutonium canfuel," it still contains some reusable 0235be recovered from reprocessed fuel and subsequently used to replace 0 by combining
it with recovered or fresh uranium to produce mixed oxide fuel. This recycling ofplutonium is a means of augmenting the supply of U and of conserving a natural
resource.
Currently, three LWR's in the United States are operating with some mixed oxide
!fuels: Big Rock Point, in Michigan, and Quad Cities Unit No. I and Dresden Unit No.~l
I in Illinois. Of these the 70 MWe Big Rock Point reactor contains the largest signifi-' cant loading of mixed oxide fuel, about 1,000 rods or about 11% of the fuel rods in
the core containing about 50 kg of plutonium. For comparison, a large modern boilingwater reactor (BWR) would be loaded with about 13,000 rods of mixed oxide fuel contain-ing about 2,400 kg plutonium.
Plutonium recycle in light water reactors is defined as the use of plutonium-uranium mixed oxide fuels in which plutonium produced as a byproduct of operating
235light water reactors (LWk's) replaces some portion of the 0 normally used forfueling LWR's. The U.S. Nuclear Regulatory Commission (NRC) and its predecessor, theU.S. Atomic Energy Commission (AEC), determined that widescale recovery and recycle of
.,
I-1
|
!- |-- - - . - . __ . .- .- ._ - -, J

I'
plutonium fuel in light water cooled nuclear power reactors warranted analysis apart
,from that given for the licensing of any single recycle facility, and that adoption ofrules governing such widescale use would constitute a major Federal action which would
! have the potential to significantly affect the quality of the human environment.Accordingly, pursuant to the National Environmental Policy Act of 1969 (NEPA), Section102(2)(C),' NRC has prepared this final Generic Environmental Statement on the use of
Mixed 04tdes (GESMO).*
The Council on Environmental Quality (CEQ) Guidelines of. August 1,1973,51500.1(a), implementing NEPA, require agencies to butid into their decision-makingprocess, beginning at the earliest point, an appropriate and careful consideration of
[environmental aspects of the proposed action so that adverse environmental effects maybe avoided or minimized and environmental quality previously lost may be restored. Toimplement HEPA and the CEQ Guidelines, NRC promulgated Regulation 10 CFR Part 51. i
Should widescale use of mixed oxide fuels be approved, both Part St,and Part 51 of theCommission's regulations would require implementing amendments. In accordance withthe AEC notice regarding participation in public hearings on this issue (39 FR 43101),copies of proposed amendments to 10 CFR, Parts 50 and 51, were distributed to allparties who received the draf t statement or commented on it.
In a Federal Register Hotice issued November 14, 1975 (40 FR 53056) the Commission
described the scope, procedures and schedule for completing this generic environmental*
impact statement. That notice set forth the Comission finding that before it canI reach a decision on the widescale use of mixed oxide fuel, there must be a full
assessment of safeguards issues. Toward that end, the Commission directed the staff to'
prepare a safeguards supplement to the draft GESMO, which was issued in August 1974.This supplement will include an analysis of the costs and benefits of alternativesafeguards programs and a recommendation as to safeguards associated with the wide-scale use of MOX fuel.
This environmental statement assesses the impacts of the implementation of plu-tonium recycle in the LWR industry. It is based on assumptions that are intended toreflect conservatively an acceptable level of the application of current technology.It is not intended to be a representation of the "as low as reasonably achievable"(ALARA) philosophy.
! - |The three following fuel cycle options are compared with respect to health, l'
; safety, environmental, and economic impact:
I-[ T5e no recycle option--all LWR fuel comes from virgin natural uranium that has
been enriched in uranium-235 content by an isotope separation plant.
The uranium only recycle option--only uranium is reused (after reenriching theuranium-235 content in an isotope separation plant) to manufacture replacement fuelaf ter recovery from LWR spent fuel.
,UTC originally prepared a draft statement. ,
| 121
f
- .- ,,.-- .- . .- , - . . - . - . - . . . - . . . . - . . - - - ,
_ _ _ _ _ _ _ _ _ _ _ _
The uranium and plutonium recycle option--both uranium and plutonium are recoveredfrom LWR spent fuels and subsequently incorporated into replacement fuel as mixedoxides.
The time frame of reference is the period from the year 1975 through the year2000; impacts are integrated over the entire period in the comparative assessmentsthat are performed.
2.0 LIGHT WATER REACTOR PROJECTIONS AND URANIUM AND PLUT0NIUM RECYCLE OPTIONS
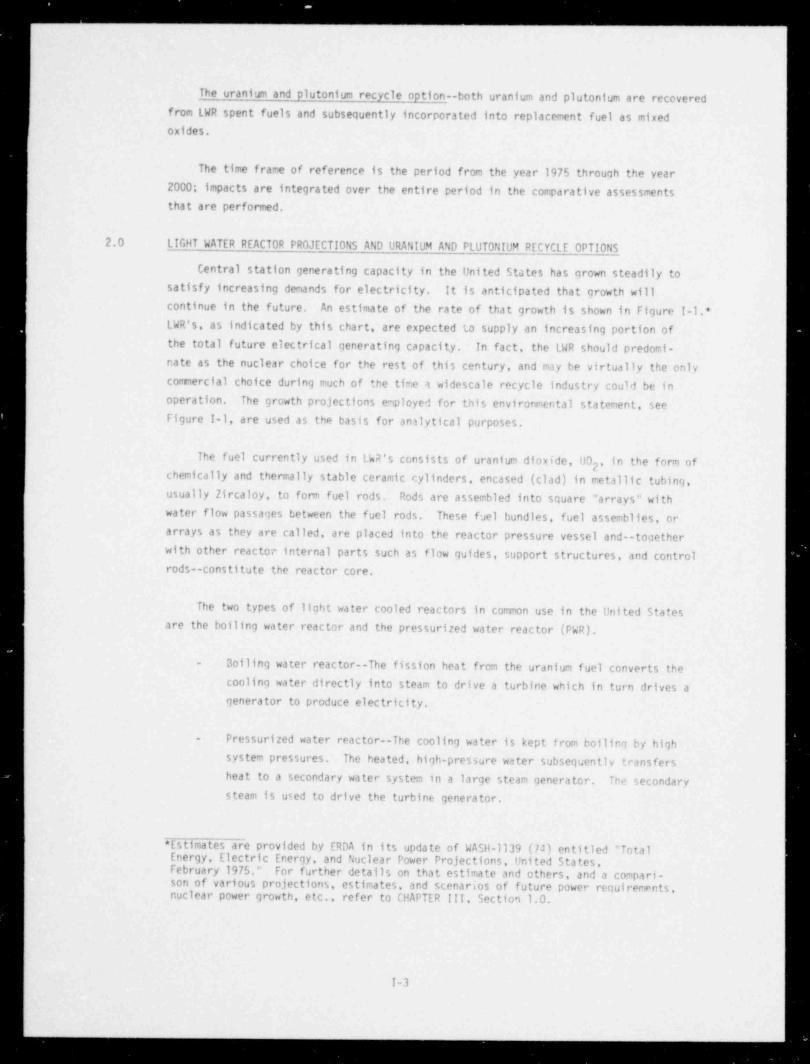
Central station generating capacity in the United States has grown steadily tosatisfy increasing demands for electricity. It is anticipated that growth willcontinue in the future. An estimate of the rate of that growth is shown in Figure I-l.*LWR's, as indicated by this chart, are expected to supply an increasing portion ofthe total future electrical generating capacity. In fact, the LWR should predomi-nate as the nuclear choice for the rest of this century, and may be virtually the onlycommercial choice during much of the time a widescale recycle industry could be inoperation. The growth projections employed for this environmental statement, seeFigure I-1, are used as the basis for antlytical purposes.
The fuel currently used in LkR's consists of uranium dioxide UO , in the form of2
chemically and thermally stable ceramic cylinders, encased (clad) in metallic tubing,usually Zircaloy, to form fuel rods. Rods are assembled into square " arrays" withwater flow passages between the fuel rods. These fuel bundles, fuel assemblies, orarrays as they are called, are placed into the reactor pressure vessel and--tocetherwith other reactor internal parts such as flow guides, support structures, and controlrods--constitute the reactor core.
The two types of light water cooled reactors in common use in the United Statesare the boiling water reactor and the pressurized water reactor (PWR).
- Boiling water reactor--The fission heat from the uranium fuel converts thecooling water directly into steam to drive a turbine which in turn drives agenerator to produce electricity.
- Pressurized water reactor--The cooling water is kept from boiling by highsystem pressures. The heated, high-pressure water subsequently transfers
heat to a secondary water system in a large steam generator. The secondarysteam is used to drive the turbine generator.
* Estimates are provided by ERDA in its update of WASH-ll39 (74) entitled " TotalEnergy, Electric Energy, and Nuclear Power Projections, United States,February 1975." For further details on that estimate and others, and a compari-son of various projections, estimates, and scenarios of future power requirements,nuclear power growth, etc., refer to CHAPTER III, Section 1.0.
I-3
- _ _ _ _ _ _ _ _ _ _

!
1,600
1,500 -
1,400 -
1,300 -
g 1,200 -
Y5q 1,100 -
0
2> 1,000 -
h TOTAL CENTRAL STATIONy
'_
ELECTRICAL GENERATINGq CAPACITYuo3 800 -
Ecry 700 -
woo2 600 -
Uw
d 500 -
400 -
300 - LIGHT WATERPOWER REACTORS
200 -
100 -
' ' ' ' ' ' ' I I I I0
74 76 78 80 82 84 86 88 90 92 94 96 98 2000
YEARFIGURE l-1 Central Station Electrical Generating Capacity
in the United States as Projected tiy ERDAOPA,1975 Low Growth
I-4
_ . .

Tha thsrmal entrgy produced by operation of ntw fuel in LWR's is produced .by the235fissioning of 0 atoms in the fuel. As the reactor operates and the fuel is progres-
9 241sively used, atoms of fissile plutonium (Pu , which is Pu and Pu) are producedg r
238by transmutation of U atoms.* Some of these in turn contribute to the nuclearfission reaction and the energy produced by the reactor.
235For each megawatt-day, thermal (MWdth) produced by the fission of 0 in LWRfuel, about 1 gram of fissile plutonium (Pu ) is formed within the fuel. Somewhatg
more than one-half of that plutonium subsequently fissions prior to removal of thefuel from the reactor, thus contributing significantly (about 35%) to the total energyproduced in the nuclear power plant. Just before spent fuel is normally dischargedfrom the reactor, more than half the fissions occurring in that fuel are from pluton-ium rather than uranium. Thus, in effect, uranium-fueled LWR's are significantly
' fueled with self-geaerated plutonium. |
Fuel is considered to be " spent" when it can no longer sustain the neutron chainreaction at economic power levels because of the depletion of its contained fissilematerials and the accumulation of neutron-absorbing byproducts in the fuel and fuelhardware. At that point, however, the fuel still contains appreciable quantities of
235fissile isotopes (about 6 grams of Pu , about 8 grams of 0 per kilogram of uranium,f
238and about 981 of the U originally loaded), which can be recovered from the spentLWR fuel after it is removed from the core by treatment in a reprocessing plant.Recovered uranium can be reenriched in the same manner as natural uranium. Theenriched recovered uranium can then be used to replace some of the enriched uraniummade from virgin natural uranium in the preparation of new fuel assemblies. Thisoption is called uranium recycle. It is also possible to utilize some of the recovereduranium to prepare recycle fuel withou;, reenrichment by combining the uranium withplutonium. However, this alternative will not utilize all of the recovered uranium I
because sufficient recovered plutonium does not exist.
Plutonium that is recovered from spent fuel can be combined with uranium having235a lower U content than that of fresh uranium fuel, which normally contains about 3%
i
235 , to make an equivalent reactor fuel. Thus, a substitution of recovered plutonium )U
2can be made for some of the U fissile content of the fuel. Such fuel is calledplutonium-uranium mixed oxide or simply mixed oxide fuel; and its use for this purposeis known as plutonium recycle. Further, it is possible to m'ke useful mixed oxide
Ofuels with plutonium in combination with any predominantly U uranium, including alow-enriched uranium product from an enrichment plant, recovered uranium from spentfuel, virgin natural uranium, or depleted uranium enrichment plant tails. For thepurposes of this environmental statement, it is assumed that natural uranium will beused in the preparation of mixed oxide fuel. This is considered to be an adequaterepresentation because there are no significant differences in safety, environmentalor economic impacts related to the type of uranium used for preparation of mixed oxidefuels.***
For details of the genesis of plutonium in LWR's, see Appendix A, Part I.**
$pecial cases, that of blending plutonium with low enriched uranium, called dilute'Pu recycle, are discussed in Section L of CHAPTER IV.
1-5

--
2.1 No Recycle Option
LWR's require many supporting operations. Most of these relate to the supply of (fresh fuel and treatment of spent fuel. These operations are usually referred to as
'
the fuel cycle. Fuel cycle operations where neither uranium nor plutonium is recycledinclude
- Both underground and open pit mining of uranium ores
- Milling to concentrate uranium values from the ores and to produce a semi-refined uranium oxide product called "yellowcake" (assayed as equivalent
U0)38
- Refining and converting yellowcake to volatile uranium hexafluoride UF6
which is the feed for isotopic enrichment facilities
- Enrichment of UF6 (currently by the gaseous diffusion process) to yield aproduct enriched in the fissile isotope U and a depleted stream (enrich-mentplanttails)
- Conversion of enriched UF to oxide, fabrication of ceramic fuel cylinders,6
encapsulation in fuel rods and assembly into fuel elements
- Spent fuel storage
- Permanent disposal of spent fuel
The overall LWR uranium fuel cycle without recycle of either uranium or plutoniumis shown in Figure I-2. It should be noted that this option would result in spentfuel being designated as high level waste. The waste management program would have tobe modified to accocinodate this material. Refer to CHAPTER IV, Section H. The
magnitude of each of these operations is expressed in tenns of the total quantitiesof materials processed or handled through the year 2000.
The enrichment process is characterized by the work necessary to accomplish therequired separation of isotopes. Such separative work is measured in " separative workunits" (SWU) and is expressed in units of kilograms or metric tons. Separative workis a considerable component of the cost of enriched uranium fuel. For cyample, forthe no recycle case for about the year 2000, with projected costs of $37.60 per poundof U 0 f r yell wcake and $75.00 per kg SWU (1975 dollars), assuming a tails assay of380.3%, the value of all the yellowcake projected for fuel for all U.S. reactors is $8.6billion, and the cost for separative work for enriching that uranium is projected tobe $3.4 billion. Separative work requirements and yellowcake requirements to supplyinitial fuel loadings and reload fuels for the pojected needs of U.S. LWR's are shownin Figure 1-3.
1-6i
1
. .. . ..
- .. _

1
- SPENT FUEL
F 4JE L~ L 11,100 MTHM -
13.500 MTU 1000 MWe
_LW POWER RE ACTORS
507,000 MWe'
REACTORSTORAGE2,645 MTHM
U02 FUEL 1
FABRICATION j
Ai
LOW ENRICHEDUF6
13,500 MTUSPENT FUEL 8,400 MTHM
ENRICHMENT45,000 MT SWU
VA
_
NATURAL UF6FEDERAL WASTE REPOSITORY
CONVE RSIONTO UF6
Ai
)U338
114,000 ST_
URANIUM MINES & MILLS
Note: The numbers in this figure represent a " snapshot" ofORE, M4 x 106gr about the year 2000. The flows of materials indica-
ted are not intended to constitute a material balance.The numbers reflect the production quantities projec-ted for the year 2000 and varying lead times in agrowing industry.
Figure 12 Annual United States industrywide Fuel Cycle Requirements forLight Water Reactors for About 2000 Without Uranium or PlutoniumRecycle, ERDA OPA,1975 Projection, Low Growth, Without Breeder
I-7

'1 M,000 60,000
100,000 - - 50,000
3
0 -
e s80,000 - - 40,000 gy,
< n'
$ "O YELLOWCAKE (U 0 ) o38
*.-
$ 60,000 - N - 30,000 $A SEPARATIVE Eg WORK $_
'S8 v
zlI$ 40,000 -
j- 20,000 {
D mC OI o* d
u
20,000 - - 10,000
' ' ' ' ' ' ' ' ' ' ' '074 76 78 80 82 84 86 88 90 92 94 96 98 2000
YEAR
FIGURE l-3 Annual Yellowcake and Enrichment Requirements forUnited States Light Water Power Reactors as Projectedby ERDA OPA,1975, Low Growth, Without Breeder
| (Without U of Pu Recycle)
- - - . - _ _ - --

2.2 Uranium Recycle Option
If spent fuels are reprocessed for recovery and recycle of uranium, additionaloperations are added to the out-of-reactor fuel cycle. The overall cycle then includes
Both underground and open pit mining of uranium ores-
- Milling to concentrate uranium values from the ores and to produce thesemirefined uranium oxide product yellowcake (assayed as equivalent U 0 )38
- Refining and conversion of yellowcake to volatile uranium hexafluoride UF6which is the feed for isotopic enrichment facilities
'- Enrichment of uranium hexafluoride (currently by the gaseous diffusion
35process) to yield a product enriched in the fissile isotope 0 and a
depletedstream(enrichmentplanttails)
- Reprocessing of spent fuels to separate and recover residual uranium fromplutonium and radioactive wastes *
- Conversion of the recovered uranium to UF *6
- Reenrichment of that recovered uranium in the enrichment plant simulta-
neously with enrichment of virgin natural UF to make a combined enriched6
product *
Conversion of enriched UF to oxide, fabrication of ceramic fuel cylinders,-
6encapsulation in fuel rods, and assembly into fuel elements
- Spent fuel storage
- High level waste storage and disposal *
- Transuranic waste storage and disposal *
The overall industrywide fuel cycle for light water reactors where uranium, butnot plutonium, is recycled is shown in Figure I-4. Impure plutonium is disposed
of in a manner similar to the high level wastes. An alternative scheme would storethe separated plutonium in a special repository. Comparison with the "no recycle" |
fuel cycle shown in Figure I-2 indicates that implementation of uranium recyclereduces virgin U 0 requirements by about 13% in the year 2000.38
2.3 Plutonium Recycle Option
A considerable amount of plutonium is produced in LWR's. In fact, the quantity
is sufficiently large that even if ERDA projections prove to be accurate regarding
*0peration added to the out-of-reactor fuel cycle when spent fuels are reprocessed forrecovery and recycle of uranium.
I-9

-
lSPENT FUELFUEL r
* OWW13500 M THM p' ,
_ LWR POWER REACTORS507,000 MWe
|
|
UO2 FUEL REPROCESS;NGF ABRICATioN
A-
|
ENRICHED IJFg,
13500 MTU,
RECoVFREDENRICHMENT45500 MT SWU g gg
HIGH LEVEL WASTES = 3,300 CanestersA TR ANSUR ANIC WASTES = 12,800 Cu. MetersNATURAL UF PLUTONIUM (Totall = 93,000 kg
6- 75,500 MTU
A vCoNVERSloNTO UF6
AUo38 FEDERAL WASTE REPOSITORY
98,800 ST-
UR ANIUM MINES & MILLS
6ORE, n9 x t0 MT Note: The numbers in this figure represent a " snapshot" ofabout the year 2000. The flows of materials indica-ted are not intended to constitute a material balance.
4
The numbers reflect the production quantities projec-ted for the year 2000 and varying lead times in agrowing industry.
Figure I 4 Annual United States industrywide Fuel Cycle Requirements forLight Water Peactors for About 2000 With Uranium Recycle Only,ERDA OPA,1975 Projection, Low Growth, Without Breeder
I-10

penetration of the electric power industry by the breeder reactor in the early 1990's,there will be a substantial quantity of plutonium in excess of breeder program require-ments. The fundamental safety, environmental, and safeguards issues concerningplutonium recycle in LWR's are not contingent upon the breeder. Figure I-5 chartsprojected electric generating capacity for the LWR and the breeder reactors to theyear 2000; Figure I-G shows the generation and utilization of plutonium.
With plutonium recycle, two new operations--plutonium conversion and mixed oxidefuel manufacture--are added to the fuel cycle, and the reprocessing step modifiedsomewhat from that of the uranium only recycle; the out-of-reactor portions of thefuel cycle then become
,- Underground and open pit mining of uranium ores
- Milling to concentrate uranium va'ues from the ores and to produce a semi-refined uranium oxide product, yellowcake (assayed as equivalent U 0 )3g
- Refining and converting yellowake to volatile uranium hexafluoride Uc6
which is the feed for isotopic enrichment facilities
- Enricnment of UF6 (currently by gaseous d'ffusion process) to yield a3product enriched in the fissile isotope U and a depleted stream (enrich-
ment plant tails)
- Reprocessing of spent fuels to separate and recover uranium and plutoniumfrom radioactive wastes and from one another
- Conversion of recovered uranium to UF6
- Reenrichment of that recovered uranium in the enrichment plant simulta-neously with enrichment of virgin natural UF to make a combined enriched
6product
- Conversion of enriched UF to oxide, fabrication of ceramic fuel cylinders,6encapsulation in fuel rods and assembly into fuel elements
I- Conversion of recovered plutonium into a solid form * I
- Combination of recovered plutonium with uranium to make mixed oxide, fabri-
cation of ceramic fuel cylinders, encapsulation in fuel rods and assemblyinto fuel elements *
- Spent fuel storage
- High level waste storage and disposal
Operation added to the fuel cycle with plutonium recycle.1-11

600
1
500 -
>k-
'Og 400 -
4OO
N< >-1 4m it 300 -
z <E LIGHT WATERc
y POWER REACTORS- 9( E! 'o 200 -
! "
| W
|
I( 100 -
FAST BREEDERPOWER REACTORS
,
!
' ' ' ' ' ' ' ' ' ' 'O
74 76 78 80 82 84 86 ' 88 90 92 94 96 98 2000YEAR
FIGURE l-5 Central Station Generating Capacity in the United States,
j hy Reactor Type as Projected by ERDA OPA,1975, ,
Low Growthi
!
i- I-12
,
.. . _ _ _ , _ . - - ,, , , - - ,-r .- . - .

70,000
l
60,000 -
TOTALPLUTONIUM RECOVERABLE
FROM LWR FUELS
50,000 -
UE2g 40,000 -
5$"i12C 30,000 -
u.OmE<toco3 20,000 -
2 POTENTIAL FASTBREEOER POWER
REACTOR PROGRAMREQUIREMENTS FOR
10'000 -
PLUTONIUM j
' ' ' ' ' ' ' ' ' ' '0
74 76 78 80 82 84 86 88 90 92 94 96 98 2000
YEAR
FIGURE l-6 Annual Production and Utilisation of Plutonium in Power Reactors in theUnited States as Projected by ERDA OPA,1975. Low Growth (WithoutPu Recycle in LWR's)
i
{
1-13
!-
-
,- . .. ,. . - , , , .. - - _ . - _ .. - - - _.__- .. _ = , . _ - . _ , - . . _ . . - - - -
Transuranic waste storage and disposal-
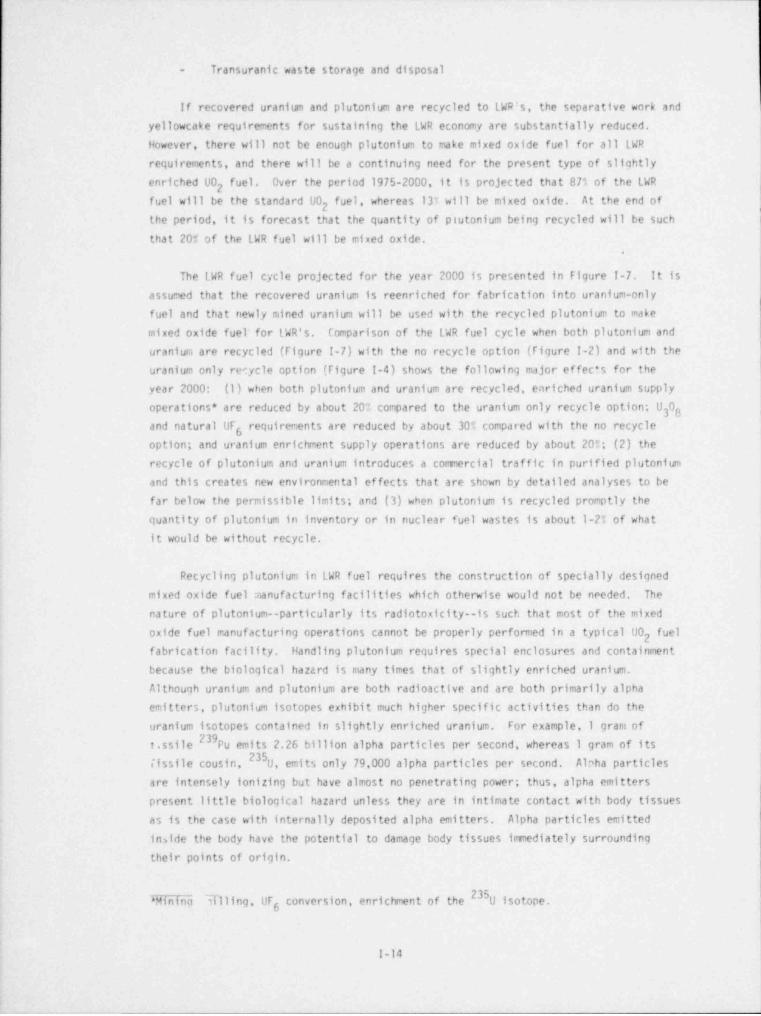
If recovered uranium and plutonium are recycled to LWR's, the separative work andyellowcake requirements for sustaining the LWR economy are substantially reduced.However, there will not be enough plutonium to make mixed oxide fuel for all LWRrequirements, and there will be a continuing need for the present type of slightlyenriched UO fuel. Over the period 1975-2000, it is projected that 87% of the LWR
2fuel will be the standard UO fuel, whereas 137 will be mixed oxide. At the end of
2the period, it is forecast that the quantity of plutonium being recycled will be suchthat 201 of the LWR fuel will be mixed oxide.
.
The LWR fuel cycle projected for the year 2000 is presented in Figure I-7. It is
assumed that the recovered uranium is reenriched for fabrication into uranium-onlyfuel and that newly mined uranium will be used with the recycled plutonium to makemixed oxide fuel' for LWR's. Comparison of the LWR fuel cycle when both plutonium anduranium are recycled (Figure I-7) with the no recycle option (Figure I-2) and with theuranium only recycle option (Figure I-4) shows the following major effects for theyear 2000: (1) when both plutonium and uranium are recycled, enriched uranium supplyoperations * are reduced by about 20% compared to the uranium only recycle option; U 038and natural UF requirements are reduced by about 30% compared with the no recycle
6option; and uranium enrichment supply operations are reduced by about 20?; (2) therecycle of plutonium and uranium introduces a commercial traffic in purif' ed plutoniumi
and this creates new environmental ef fects that are shown by detailed analyses to befar below the permissible limits; and (3) when plutonium is recycled promptly thequantity of plutonium in inventory or in nuclear fuel wastes is about 1-2% of whatit would be without recycle.
Recycling plutonium in LWR fuel requires the construction of specially designedmixed oxide fuel manufacturing facilities which otherwise would not be needed. Thenature of plutonium--particularly its radiotoxicity--is such that most of the mixed
oxide fuel manufacturing operations cannot be properly performed in a typical UO I"'I2
fabrication facility. Handling plutonium requires special enclosures and containmentbecause the biological hazard is many times that of slightly enriched uranium.Although uranium and plutonium are both radioactive and are both primarily alphaemitters, plutonium isotopes exhibit much higher specific activities than do theuranium isotopes contained in slightly enriched uranium. For example,1 gram of
239t.ssile Pu emits 2.26 billion alpha particles per second, whereas I gram of itsfissile cousin, 235 , emits only 79,000 alpha particles per second. Alrha particles0
are intensely ionizing but have almost no penetrating power; thus, alpha emitterspresent little biological hazard unless they are in intimate contact with body tissuesas is the case with internally deposited alpha emitters. Alpha particles emitted
I
inside the body have the potential to damage body tissues irrrnediately surroundingtheir points of origin.
Mining iflling, UF con e sion, en chment of W b hotope.T6
1-14

m
'FUEL SPENT FUEL
10,250 MTHM13,500 MTHM pLW POWER REACTORS
"
(Mk_
UO2 FUEL REPROCESSINGF ABRICATION
PLUTONIUMb 122,400 kg Pu,
|
ENRICHED UF610 M M W RECOVER ED UR ANIUM
10.200 MTUPuOg {
119,400 kg Pu, |
- MIXED OX1DEFUEL F ABRICAT'oe'
<%
ENRICHMENT36,100 MT SWU
ANATURALUF6
'
HIGH LEVEL WASTES = 3,300 CanestersNATURAL UO2 TRANSUR ANIC WASTES = 13,700 Cu. Meters2,500 MTU PLUTONIUM tTotall = 1,600 kg
CON VE HSION
TOUF6 V V ;AU083
80,500 ST-
UR ANIUM MINES FEDERAL WASTE REPOSITORYAND MILLS
ORE,808 m 106 MTNote: The numbers in this figure represent a " snapshot" of
about the year 2000. The flows of materials indica-ted are not mtended to constitute a material balance.The numbers reflect the production quantities projec-ted for the year 2000 and varying lead times in agrowing industry.
(U Pul 02 RODS2.650 MTM
Figure I 7 Annual United States Industrywide Fuel Cycle Requirements forLight Water Reactors for About 2000 With Uranium and PlutoniumRecycle, ERDA OPA - 1975 Projection, low Growth. WithOut Breeder
I-15
. _ _ . - - . _ _ _ _ . _ _ . _-

Although the body assimilates roughly the same fraction of' inhaled airborne' plutonium as it does inhaled uranium--inhalation is the major exposure pathway toemployees in plants manufacturing nuclear fuel--the biochemistry is such that assimi-
- lated plutonium is distributed differently within the body and is eliminated much moreslowly than uranium. These factors, combined with the very much higher specificactivity of plutonium, make the biological hazard of plutonium markedly greater thanthat of uranium. A useful measure of the relative biological hazard of plutonium anduranium isotopes is the maximum permissible concentration in air for occupational
exposure (MPC,) set by Federal regulation (10 CFR Part 20, Appendix B. Table 1Column 1), as expressed in activity concentration units, microcuries per milliliter(uC1/ml), and transformed for this purpose to mass concentration units, grams per
3cubic meter (g/m ). See Table I-l.
The lowest MPC, for uranium is that of the relatively high specific activity234isotope U. Because slightly enriched uranium contains only very small quantities
of high specific activity U, about 0.04%, it can be handled safely where confine-ment (and thus protection from inhalation) is provided only by process equipment andby manufacturing area ventilation and housekeeping practices consistent with safe andestablished practices for handling of nonradioactive, but toxic, compounds of heavymetals such as lead or cadmium. In contrast, plutonium manufacturing facilities arecharacterized by elaborate confinement structures (process enclosures), which usuallycompletely surround al! process equipment and all materials transfer operations.Largely because of the gamma radiation and neutron emissions associated with such
activities, routine manufacturing operations are mechanized to the maximum extentpracticable. Hand operations are minimized but when necessary, are performed throughlong gauntleted gloves that are sealed to ports in the process enclosure. Elaboratesupplemental confinement systems and structures are integral parts of the processconfinement concept. These include such items as high integrity ventilation systemsequipped with multiple stages of high efficiency particulate air (HEPA) or equivalentfilters (capable of >99.9% removal of Pu aerosols per stage) and high integritynatural phenomena-resistant building structures to provide essentially completeisolation of plutonium from the mixed oxide fuel fabrication plant workers and the
Plant environs.*
Plutonium-handling plants are considerably more expensive to build, maintain, andoperate than those used for the manufacture of low enriched uranium fuels. Thus, it
has been generally considered to be uneconomic to distribute recycle plutonium uniformly,
throughout all the fuel pellets.* To do so would require that all reload fuels forall LulR's be manufactured only in plants with the special features required for pluto-nium handling. Inherent in the materials flow quantities of Figure I-7 are assumptionsabout the disposition of recycled plutonium within LWR fuels. The basic assumption,,
prop] sed by industry and accepted by NRC for this statement, is that any one fuel rod
%Mr%w concerning the matter of the relative toxicity of uranium and plutoniumi and the necessary degrees of containment for manufacturing processes and disposition
of Pu in LWR fuel has also been proposed, cf., "The Case for Low ConcentrationPlutonium Recycle," by K. H. Puechl, in International Nuclear Engineering, p. 687,September 1975.
1-16
,
l.
. ~ . , -. _ . _ . . . . . . - . , _. .-, , _ _ ~ _ . . . . . _. . - . _ _

Table I-1
MAXIMUM PERMISSIBLE AIRBORNE CONCENTRATIONS (MASS / VOLUME) 0F
URANIUM AND PLUTONIUM NUCLIDES, OCCUPATIONAL EXPOSURE *
MPCa
grams perIsotope _ Form cubic meter
234 5 9.58 x 100
1 1.60 x 10⁻⁸
235 S 2.31 x 10U
I 4.63 x 10⁻⁵
238 S 2.08 x 10'3U
I 2.98 x 10~4
238 S 1.16 x 10Pu
1 1.75 x 10'I2
239 5 3.26 x 10*"Pu
I 6.52 x 10⁻¹⁰
240 5 8.78 x 10'I2Pu
1 1.76 x 10⁻¹⁰
241 S 9.10 x 10Pu
I 4.04 x 10⁻¹⁰
242 S 5.24 x 10⁻¹⁰Pu
I 1.05 x 10⁻⁸
|
5 = SolubleI * Insoluble
*Because of its relatively short effective half-life in the body, the uraniumMPC's reported in Table I-l are correct for both long and short exposureperiods whereas the corresponding MPC's for long biological half-lifeplutonium presume exposure for 50 years. Thus, whereas Table I-1 presents auseful illustration of levels of confir.ement necessary for'long periodsof exposure such as occur in occupational exposures, it greatly overstates -the hazard of plutonium relative to uranium for short exposure periods.
I-17

will contain either enriched uranium only, or mixed oxide fuel only. Additionallyassumed, as discussed earlier, is that mixed oxide fuels contain only natural uranium.Average fissile Pu contents of mixed oxide fuel assemblies are expected to be lessthan 5% of the total uranium and plutonium.
When plutonium produced in a light water reactor is recovered, recombined withuranium, fabricated into fuel rods, and reinserted into the same LWR core displacing
235an equivalent number of U-enriched fuel rods, the resulting reactor can be describedas a self-generation reactor (SGR). The SGR recycles all of the plutonium that itproduces (fissile and nonfissile). The mixed oxide content increases with time untilan equilibrium level is reached wherein about one-third of the fuel rods contain mixed
oxide. In that state, a reactor is described as an equilibrium self-generationreactor. See CHAPTER IV, Section C for detailed discussion of the SGR.
The SGR concept of plutonium recycle is an example of many possibilities thatutilize less or more plutonium than is produced within the core. For example, byutilizing plutonium from other reactors in addition to its own, a standard LWR can beoperated with all of its enriched uranium fuel rods replaced by Pu0 -UO mixed oxidep 2rods, eliminating dependence on enrichment facilities for that reactor. However, theSGR mode of operation, or its near equivalent, is assumed to represent the industry-wide norm. In the near equivalent mode, the plutonium from any one reactor may bepooled with that from other reactors and then recycled to individual LWR's in quantitiessuch that the mixed oxide contents of their cores do not greatly exceed the mixedoxide contents of equilibrium self-generation reactors. An excess of 15Y above self-generation levels is believed to be a justifiable extension of present reactor techno-logy. Accordingly, an LWR operating with recycle plutonium in the amount of 115% ofthe equilibrium self-generating quantity has been selected as the model reactor inthis study. It is referred to as a 1.15 SGR. Typically it would contain mixed oxidein about 40% of the fuel rods with the remainder of the rods containing only enricheduranium fuel. See CHAPTER IV, Section C, paragraph 4.1.1.
Introduction of mixed oxide fuel produces only minor effects on reactor opera-tion. Nuclear properties of mixed oxide fueled reactors differ somewhat from UO
2fueled reactors, but differences can be accommodated by suitable core management.Characteristics of the reactor design, however, such as fuel assembly geometry,coolant flow patterns, and mechanical properties of cladding and structural members,are unchanged by the use of mixed oxide fuels. Analytical results and reactor experi-ence indicate that the performance of mixed oxide cores will be similar to UO cores
p
under steady state and load following conditions; core behavior during transients andaccidents will be only slightly altered.
There are some differences in the production of fission product radioquclides inmixed oxide fueld LWR's as compared with uranium only fueled LWR's. However, no
~
safety or environmental problems have been identified as result of these differences.
1-18
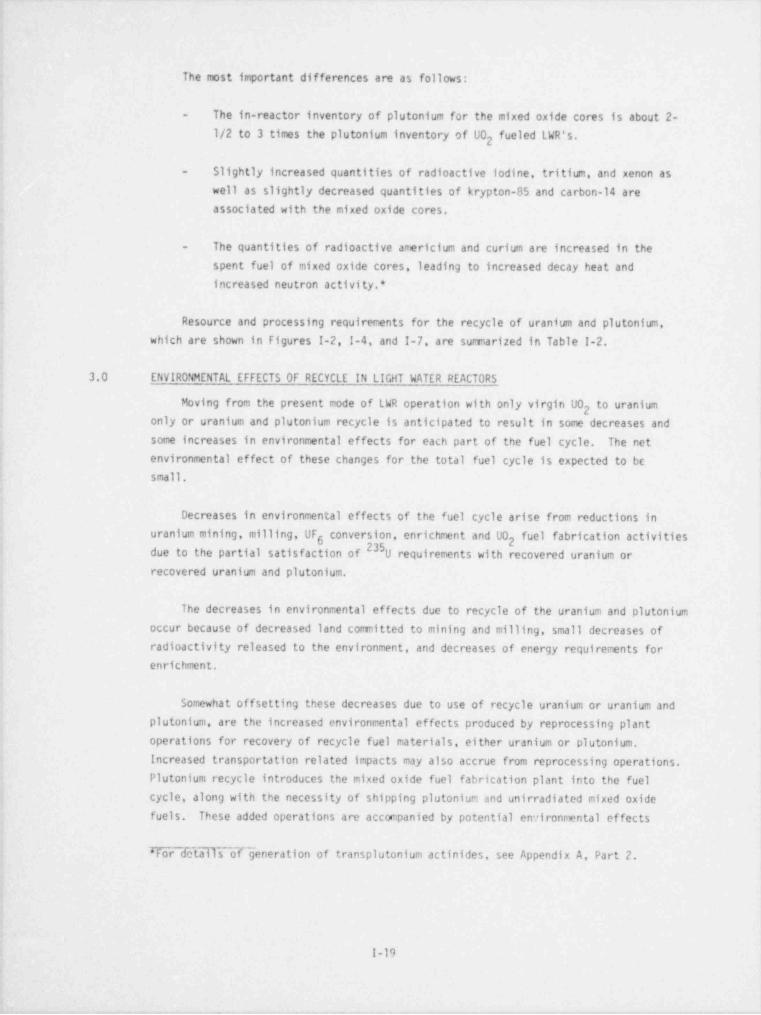
The most important differences are as follows:
- The in-reactor inventory of plutonium for the mixed oxide cores is about 2-1/2 to 3 times the plutonium inventory of UO fueled LWR's.
2
- Slightly increased quantities of radioactive iodine, tritium, and xenon aswell as slightly decreased quantities of krypton-85 and carbon-14 areassociated with the mixed oxide cores.
- The quantities of radioactive americium and curium are increased in thespent fuel of mixed oxide cores, leading to increased decay heat andincreased neutron activity.*
Resource and processing requirements for the recycle of uranium and plutonium,which are shown in Figures I-2, I-4, and I-7, are sunnarized in Table I-2,
3.0 ENVIRONMENTAL EFFECTS OF RECYCLE IN LIGHT WATER REACTORS
Moving from the present mode of LWR operation with only virgin 00 to uranium2
only or uranium and plutonium recycle is anticipated to result in some decreases andsome increases in environmental effects for each part of the fuel cycle. The netenvironmental effect of these changes for the total fuel cycle is expected to besmall.
Decreases in environmental effects of the fuel cycle arise from reductions inuranium mining, milling, UF conversion, enrichment and 00 fuel fabrication activities
6 2Sdue to the partial satisfaction of U requirements with recovered uranium or
recovered uranium and plutonium.
The decreases in environmental effects due to recycle of the uranium and plutoniumoccur because of decreased land committed to mining and milling, small decreases ofradioactivity released to the environment, and decreases of energy requirements forenrichment.
Somewhat offsetting these decreases due to use of recycle uranium or uranium andplutonium, are the increased environmental effects produced by reprocessing plantoperations for recovery of recycle fuel materials, either uranium or plutonium.Increased transportation related impacts may also accrue from reprocessing operations.Plutonium recycle introduces the mixed oxide fuel fabrication plant into the fuelcycle, along with the necessity of shipping plutonium and unirradiated mixed oxidefuels. These added operations are accompanied by potential environmental effects
*For details of generation of transplutonium actinides, see Appendix A. Part 2.
1-19

. - _ _ _ - - - - - _ __
f
Table I-2
SUMMARY OF EFFECTS OF PLUT0NIUM RECYCLE IN THE OVERALL U.S. LWR FUEL CYCLE IN ABOUT THE YEAR 2000
NoFuel Cycle Parameter Recycle U Recycle U & Pu Recycle
6 6 61. Uranium Ore Mined and Milled (MT) 118 x 10 99.1 x 10 80.7 x 10
2. U0 Recovered (ST) 113,900 98,800 80,500383. Natural Uranium Converted to
UF6 (MTU) 87,3M 75,5@ 59,3%
4. Enrichment of Uranium (MT SWU) 45,000 45,500 36,100
5. Conversion of UF to UO2( ) 13,500 13,500 10,8506
6. Plutonium through ReprocessingPlants (kg Pu ) None 68,000 82,200
f-
k 7. Plutonium in Storage / Inventoryor Waste or Spent Fuel (kg Pu ) 690,000 690,000 7,000
f
8. Mixed Oxide Fuel Fabrication(MTHM) None None 2,650
MT - Metric TonsMTU - Metric Tons of UraniumMTHM - Metric Tons of Heavy Mctal (U + Pu)MT SW'J - Metric Ton Separative Work Units
kg Puf - Kilograms of fissile plutoniumST - Short Tons

associated with the toxicity of plutonium or its possible use as a nuclear explosiveand from the potential for its releases to the environment from nonnal operations,from an accident, or as a' result of theft or sabotage. Generation of additionalquantitites of low level transuranic wastes results from reprocessing operations forthe uranium recycle option, and is increased with the plutonium recycle option throughincreased plutonium handling and waste generation in M0X fabrication operations.
In addition to the direct impacts of increased plutonium handling throughout muchof the fuel cycle, plutonium recycle in LWR's leads to added potential environmentaleffects on the fuel cycle. Those include
- Potential effects (not necessarily adverse) on the cperational safety of thereactor from increased quantities and different distributions of plutoniumin the reactor core due to changes in the core physics, and fission productand transuranium nuclide inventories in the operating reactor
- Slightly different fission product contents and increased quantities oftransplutonium nuclides in spent fuels and their im,oacts upon shipping,reprocessing, and storage or disposal of high level wastes
4.0 APPROACH TO ASSESSMENT OF ENVIRONMENTAL IMPACTS OF RECYCLE IN LIGHT WATER REACTORS_
The approach to assessing the environmental impact of implementation of recyclein the light water reactor industry involves the following steps:
- Environmental impacts are evaluated and compared for each element of the LWRfuel cycle, with no recycle, with uranium recycle, and with plutoniumrecycle, considering the effects associated with construction, the normaloperation, and postulated accidents for model plants of each type, with theattendant radioactive waste management and transportation activities.
- The industrywide environmental impacts for each option are then assessed forthe period 1975 through 2000. The integrated economic impacts for theperiod 1975 through 2000 are similarly developed for use in tht: cost-benefitanalyses.
- Based upon analyses of the first two steps, the unavoidable adverse environ-mental impacts of implementation of plutonium recycle in LWR's are determined.
- Alternatives are studied for mitigating adverse environmental impacts of theLWR-Pu recycle, based either upon currently feasible methods or potentialfuture developments.
- Potential relationships between short term environmental benefits and longtenn environmental costs brought on by implementation of plutonium recycleare investigated.
|
|
l-21
-- -
y

. . - _ . - . _ . - __ - - _ - - . - - . . __ - .._
.
Vhe irreversible and irretrievable comitments of resources resulting from-
implementation of plutonium recycle are determined.|.
.
t
A cost-benefit analysis is made of alternative fuel recycle schemes con--
| sidering also the timing of implementation of plutonium recycle. ft
5.0 SCOPE OF GESMO
The body of this generic environmental impact statement on the use of mixed
i oxides in LWR's is organized, insofar as is appropriate, in accordance with theguidelines of the Council on Environmental Quality.
|
5.1 Volume 1 - SUMMARY AND CONCLUSIONS i
This section presents a summary of the evaluations and analyses described in the *
various chapters of GESMO and it includes the conclusions concerning the relativeadverse and beneficial impacts of implementation of Pu recycle in LWR's.
5.2 Volume 2
l CHAPTER I - INTRODUCTION--sets forth the purpose of GESM0, introduces the reader
to the no recycle, the uranium only recycle, and the uranium plus plutonium recyclefuel management options; describes the origin of environmental impacts that occurbecause of the widespread application of plutonium recycle; the methodology of assess-ment of such impacts; and introduces the reader to the body of this environmental
i impact statement.!
I CHAPTER II - BACKGROUND AND EXPERIENCE WITH PLUTONIUM--outlines past and current
research and Jevelopment activities that have brought plutonium recycle to the thresholdof possible widespread commercial application. It also describes the industrial
j context in which plutonium recycle would occur--the structure and status of the U.S.I nuclear power industry.
CHAPTER Ill - PROJECTED PLUTON!UM RECYCLE INDUSTRY--describes and considers the
effects on the light water reactor industry of widespread implementation of recycle.It describes the industry which is the subject of this environmental impact statement:the overall LWR induttry as it is projected to exist between the present time andabout the year 2000, with and without recycle in LWR's. Specifically addressed are
j differences effected in the LWR industry by the introduction of plutonium recycle.|1
5.3 Volume 3
CHAPTER IV - ENVIRONMENTAL IMPACT DUE TO THE IMPLEMENTATION OF PLUT0NIUM RECYCLE--
this chapter constitutes the major portion of this environmental impact statement.The environmental impacts resulting from widescale implementation of recycle in LWR'sare estimated and presented. Environmental impacts from accident conditions as wellas from routine operations are addressed. Also presented, as appropriate for back-
,ground information and perspective, are estimates of the environmental effects of the
| LWR industry without recycle, with uranium recycle, and with plutonium recycle.
I-22
. - . . . - - - . - . ._ .. .. - - - - . -- - - . . - - - -.

CHAPTER IV describes in detati the individual model plants and other elements ofthe LWR fuel cycles. These, in the aggregate, constitute the projected light waterreactor industry for the period 1975-2000 with'no recycle, uranium recycle, andplutonium recycle.
Because of the comprehensive discussions, CHAPTER IV is divided into the followingr.jor sections:
Section IV A - Summary--summarizes the industrywide environmental impacts of theimplementation of plutonium recycle in light water reactors and describes the overalllight water reactor industry for the period 1975-2000.
Section IV B - Introduction-introduces various elements of the light waterreactor industry, discussed in greater detail in the remaining sections of CHAPTER IV.
Section IV C - The Light Water Reactor (LWR) With Plutonium Recycle--describes
typical light water reactors and assesses the operational and safety effects of imple-- mentation of plutonium recycle in such reactors. Analyzes at some length those aspectsof fuel and reactor core perfonnances that differ or that could differ from those of
uranium-fueled reactors. Incremental impacts of implementation of plutonium recycleupon reactor safety are addressed. Radiological impacts are assessed by developingsource terms for potential releases related both to accident and nonnal conditions,with and without plutonium recycle (there are essentially no differences in reactor 6
operation with no recycle and with uranium only recycle) and translating these toequivalent exposures to the environment.
i
Section IV D - Mixed Oxide Fuel Fabrication--describes a model mixed oxide fuelfabrication plant, its processes, and projected effluents. Resultant environmentaiimpacts due to both normal operations and accident conditions are estimated anddescribed.
Section IV E - Reprocessing Plant Operations--describes a model reprocessingplant, both with recycle of uranium and with recycle of uranium and plutonium;establishes the incremental changes in effluents and radiological source terms. Thecorresponding incremental environmental impacts are estimated for both nonnal operat-
i ing and accident conditions.li
,Sectior iV F - Supporting Uranium Fuel Cycle--this section describes those
j portions of the light water reactor industry that constitute the uranium fuel supplyi segment and assesses their environmental impacts. Those operations are mining,'
milling UF conversion, enrichment, and UO fuel manufacture. The most significant6 2
cumulative industrywide decreases in the environmental impact for the supportinguranium fuel cycle resulting from recycling uranium cr both uranium and plutonium in
{ LWR's are suninarized.
I-23i
r
--w, ,on- . . w- , - , - - -,.-r,- - , , , , - , -,,,vr- - - - ,,rr,- , --, - - -,,,r.- - - , - , % , -- ,

. _ _ _ _ _ - . . - . _ . . . _ - _ _ . __-
l
Section IV G - Transportation of Radioactive Material--discusses transportation
of radioactive materials within the light water reactor industry and the changes *
effected in the transportation requirements by uranium recycle and by uranium andplutonium recycle. The corresponding environmental impacts are assessed. Also
,
discussed are means of minimizing the probabilities and limiting the consequences of,
transportation accidents.i-
iSection IV H - Radioactiva Waste Management--describes primarily the means for
assuring the long term isolation of radioisotopes from the environment. Storagei
concepts are described for high level and other-than-high level wastes containing,* transuranium elements, and for disposal of other wastes by burial. The environmental
impacts associated with long term waste management, with no recycle, uranium recycle,and uranium and plutonium recycle, and under normal and accident conditions, areestimated and described. Environmental impacts of management of fuel cycle wastes arereviewed and analyzed.
Section IV I - Storage of Plutonium--addresses the need for plutonium storage and
j potential environmental impacts with and without plutonium recycle. The increasedrequirement for storage of plutonium if plutonium is not recycled and the concomitant+
20facility requirements are discussed. The loss by beta decay of fissfie Pu, if LWR!
Pu is not promptly recycled, is also discussed. |'
!
Section IV J - Radiological Health Assessment--includes a discussion of radio-
logical impacts for the overall industry of implementation of plutonium recycle ini light water reactors. General discussions of dose estimation methodology, health
risks from radiation, and plutonium in the environment are appended.
Section IV K - Extended Spent Fuel Storage--describes temporary storage of spentfuel as a necessary component of the fuel cycle under each fuel management option.Environmental impact assessments are made.
!
j Section IV L - Blending of Plutonium and Uranium at Peprocessing Plants--discusses
blending and analyzes some concentrations of blends that have been considered for usein the fuel cycle plants. Describes environmental impacts related to blending and theuse of blends in the fuel cycle..
f
5.4 Volume 4h
i . CHAPTER V - SAFEGUARDS CONSIDERATIONS--refers to the supplement that assesses
! safeguards issues related to Pu recycle. *
,
CHAPTER VI - PROBABLE ADVERSE ENVIRONMENTAL EFFECTS THAT CANNOT BE AVOIDED--InIaccordance with the guidelines of the Council on Environmental Quality, this chapter'
gathers and summarizes all the adverse environmental effects of implementation of
( uranium only or uranium and plutonium recycle in light water reactors.!I
I-24
I
_ _ _ _ _ - - _ _ _ _ _ . . __ - - - _ _ __

... __ , _
CHAPTER VII - MEANS FOR MITIGATING ADVERSE ENVIRONMENTAL EFFECTS _--the NRC has
established siting, design, and operating criteria, and established review processesdesigned to assure that releases from fuel cycle factitties are very small, as low as i
reasonably achievable and that environmental impacts are minimized. Chronic releasesare mitigated by engineered confinement systems. Acute releases that may result fromaccident or natur-al phenomena are mitigated by engineered safety systems. Alsodiscussed are potential future measures for mitigating adverse environrental effects.
CHAPTER VI!! - ALTERNATIVE DISPOSITIONS OF PLUT0NIUM--Identifies and describes in
detail the various alternative dispositions of plutonium produced in light waterreactors. Environmental and economic considerations are discussed for alternativescont,isting of the no recycle option, uranium only recycle option, and the plutoniumrecycle option with various implementation dates. This chapter provides the basis forthe comparative evaluations of the incremental benefits, costs, and risks associatedwith each alternative disposition of plutonium Which are developed in the cost-benefit analysis in CHAPTER XI.
CHAPTER !X - RELATIONSHIP BETWEEN LOCAL SHORT TERM USES OF MAN'S ENVIRONMENT AND
THE MAINTENANCE AND ENHANCEMENT OF LONG TERM PRODUCTIVITY--discusses the extent to
which the recycle of plutonium involves tradeoffs between short term and long termenvironmental gains and losses, and narrows future options. Short term effects arethose associated with the fuel cycle operations through the year 2000. Long termeffects are those associated with conservation of uranium ore reserves and long term
confinement of radioactive materials.
CHAPTER X - IRREVERSIBLE AND IRRETRIEVABLE COMMITMENTS OF RESOURCES--identifies
those resource commitments, resulting from the proposed recycling of plutonium, whichwould curtail the range of potential uses of the environment or of other resources.Resources discussed are fissile materials, manpower, and permanent land commitments.
CHAPTER XI - ECONOMIC ANALYSIS AND COST-BENEFIT BALANCING--makes comparb ons of
the incremental benefits, costs, and risks associated with alternative dispositions ofLWR-produced plutonium. The impact of each alternative upon individual components ofthe fuel cycle is evaluated, and the results are combined into assessments of theoverall cost-benefits of each alternative.
5.5 Volume 5
All public comments received are included in this volume, as are NRC responses.
I-25t
|i-|
- . . . -- _ . -_ -. _ _ _ _ _
APPENDIX A
Part ITHE GENESIS OF PLUTONIUM
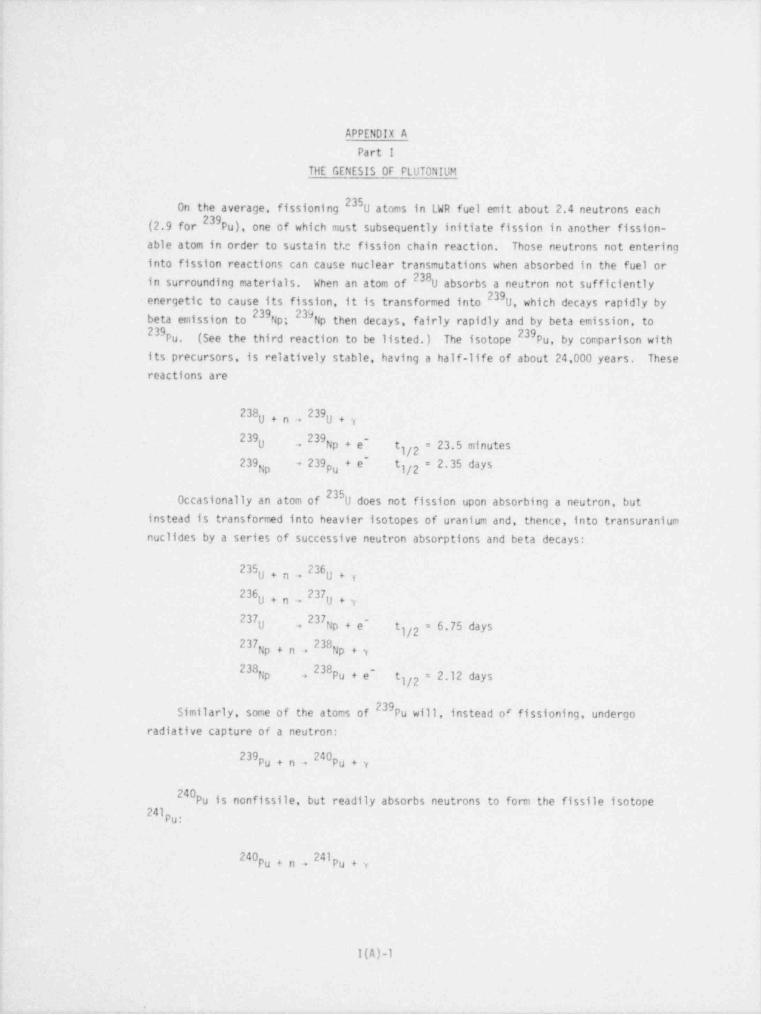
235On the average, fissioning U atoms in LWR fuel emit about 2.4 neutrons each239(2.9 for Pu), one of which must subsequently initiate fission in another fission-
able atom in order to sustain tt.c fission chain reaction. Those neutrons not enteringinto fission reactions can cause nuclear transmutations when absorbed in the fuel orin surrounding materials. When an atom of U absorbs a neutron not sufficiently
239 , which decays rapidly byenergetic to cause its fission, it is transformed into 0239beta emission to Np; Np then decays, fairly rapidly and by beta emission, to
39 239Pu. (See the third reaction to be listed.) The isotope Pu, by comparison withits precursors, is relatively stable, having a half-life of about 24,000 years. Thesereactions are
238U + n - 239U+y
239 -,239gp , ,- t01/2 = 23.5 minutes
239 + 239py + e' tl/2 = 2.35 daysgp
235Occasionally an atom of 0 does not fission upon absorbing a neutron, butinstead is transformed into heavier isotopes of uranium and, thence, into transuraniumnuclides by a series of successive neutron absorptions and beta decays:
235U + n -+ 236U+y
236U + n - 237g,v237 237gp , ,- tl/2 = 6.75 daysg
237Np + n - 238Np + y
238 ,238Pu + e' tNp 1/2 = 2.12 days
9Similarly, some of the atoms of Pu will, instead of fissioning, undergo- radiative capture of a neutron:
239Pu + n + Pu + y !
|240Pu is nonfissile, but readily absorbs neutrons to form the fissile isotope
24IPu:
240Pu + n -, 241Pu + y
|
1(A)-1
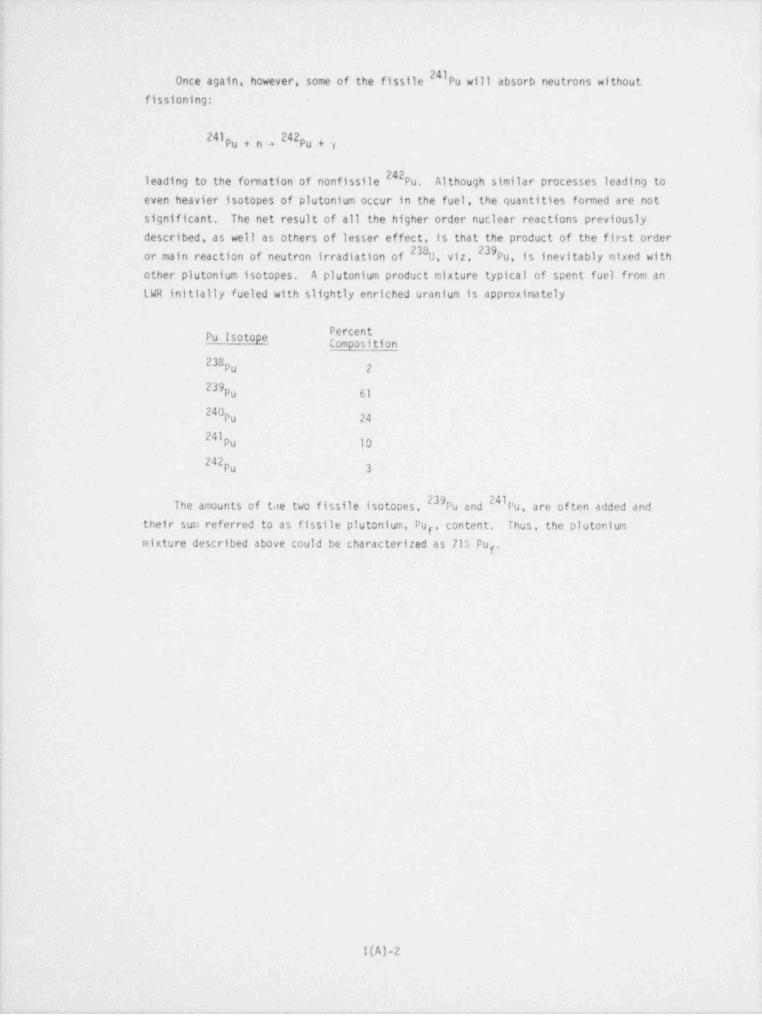
24IOnce again, however, some of the fissile Pu will absorb neutrons withoutfissioning:
241Pu + n + 242 , , vp
242leading to the formation of nonfissile Pu. Although similar processes leading toeven heavier isotopes of plutonium occur in the fuel, the quantities formed are notsignificant. The net result of all the higher order nuclear reactions previouslydescribed, as well as others of lesser effect, is that the product of the first order
238 , yg,, 239Pu, is inevitably mixed withor main reaction of neutron irradiation of g
other plutonium isotopes. A plutonium product mixture typical of spent fuel from anLWR initially fueled with slightly enriched uranium is approximately
Pu IsotopeCo po tion
238Pu 2
239Pu 61
240Pu 24
241Pu 10
242Pu 3
241The amounts of tite two fissile isotopes, Pu and Pu, are of ten added and
their sum referred to as fissile plutonium, Pu , content. Thus, the plutoniumf
mixture described above could be characterized as 71% Pu .f
I
|
!(A)-2
-_.

APPENDIX _A
Part !!THE GENERATION OF TRANSPLUTONIUM ACTINIDES
In addition to fission products, various transplutonium (actinide) radionuclidesare created in the cores of LWR's. The more important of these and their predominant
source reactions are described as follows:
241 241Am + e~ t1/2 = 13.2 yearsPu +
241Am + n + 242Am + y
242 242Cm + e~ t1/2 = 16.0 hoursg
242Pu + n + 243Pu + y
243 243 ~
t1/2 = 5.0 hours+ Am + ePu
243Am + n + 244h+y
244 244 ~
1/2 = 10.1 hoursCm + eh +
2442IAm, 243h ,242Cm, and Cm are present in significant quantities in spentreactor fuel. Even heavier transplutonium isotopes are produced, but not in substan-
I 242tial quantities. Because Pu and Pu are the precursors of the transplutonium
2 A.i 243Am, 242Cm. and Cm, the increased average in-reactor2Hradionuclides24I 242inventories of Pu and Pu typically present in mixed cxide fuels lead to much
higher inventories of transplutonium isotopes in spent mixed oxide fuels.
I(A)-3

t
|
GESM0
CHAPTER II
BACKGROUND AND EXPERIENCE WITH PLUT0NIUM

_
CHAPTER II
BACKGROUND AND EXPERIENCE WITH PLUTONIUM
Pa ra graph Page
1.0 INTRODUCTION.............. II- 1............................................... ..
2.0 PLUTONIUM: GENERAL BAC KGROUND AND EXPERIENCE. . . . . . . . . . . . . . . . . . . . . . . . . . . . . II- 1
2.1 The Fo rmation o f Plutoni um i n the Reac to r. . . . . . . . . . . . . . . . . . . . . . . . . . . . . . . . II- 2
2.2 Nuclear Characteristics o f Plutonium... . . . . .. . II- 3........................
T he Chemi s t ry o f Pu0 . . . . . . . . . . . . . . . . . . . . . . . . . . . . . . . . . . . . . . - Il- 92.3 2
2.4 Radiobiological Hazards of Plutonium........... .. ...................... II- 9
3.0 PLUT0NIUM RECYCLE IN LWR'S................................................ ... 11-113.1 Development and Testing of Mixed 0xide fuel s . . . . . . . . . . . . . . . . . . . . . . . . . . . . 11-11
3.1.1 Plutonium Utilization Program..... .................. ............ 11-12
3.1.2 Saxton Program.................. ............... .... ......... .. 11-17
3.1.3 Edison Electric Institute / Westinghouse.......... 11-20.... .... ... ..
3.1.4 Edison Electric Institute / General Electric..... II-24.... ......... ..
3.1.4.1 Rod Irradiations..................... ......... ......... 11-25
3.1.4.2 Bundl e Irradi a tion Demonstrations. . . . . . . . . . . . . . . . . . . . . 11-28
3.1.4.3 M0X Fuel Irradiation - Quad Cities Unit No.1. . . .. . . . . .. II-293.1.5 Gul f United Nuclear Corporation / Commonweal th Edison. . . . . . . . . . . . . 11-30
3.1.6 Big Rock Point / Exxon /NFS. ............ ....... !!-32.. . ......
3.1.7 The Belgian Plutonium Recycle Program............................. II-333.1.8 CNEN/ENEL Plutonium Utilization Programs in Italy. . . . .. . . .. . . . 11-34
3.1.9 Obrigheim Reactor Demonstration of Mixed 0xide Fuel. 11-35.. ...... .
3.1.10 Worldwide Plutonium Utilization Plans and Programs. ....... 11-36.. ..
3.2 Mixed Oxide fuel Fabrication................. ..... ..................... !!-41
3.3 Reproces si ng o f Mixed 0xide fuel s . . . . . . . . . . . . . . . . . . . . . . . . . . . . . . . . . . . . . II-42
3.4 E f fects of Pl utonium Recycle on Transporta tion. . . . . . . . . . . . . . . . . . . . . . . . 11-43
3.5 Effects of Plutonium Recycle as Fuel on Waste Management. . ............. 11-443.6 Summa ry o f Acci dent Experi ence . . . . . . . . . . . . . . . . . . . . . . . . . . . 11-45.. .........
REFERENCES................ .. ..... .... . . ......... . ...... ........ ... . .. . II-49
i

CHAPTER II
BACKGROUND AND EXPERIENCE WITH PLUTONIUM
1.0 INTRODUCTION
This generic environmental statement discusses the anticipated effects ofrecycling plutonium in light water nuclear power reactors. It is based on about 30years of experience with the element in the context of a projected light waternuclear power industry that is already substantial. This chapter provides a back-ground pers ective on plutonium, its safety, and its recycling as a reactor fuel.
Sectirn 2.0 deals with general information about plutonium, developed since itsdiscovery more than three decades ago: how it is formed in the reactor, its nuclearcharacteristics, the forination and properties of its dioxide (the chemical form inwhich it would be used in fuel), reprocessing of plutonium bearing spent fuel, andbasic information on its radiobiological hazards.
Section 3.0 includes a review of work in research, development, and testing indirect connection with plutonium fuel recycling, in the form of mixed oxides ofuranium and plutonium, for light water reactors. The history and status Jf domesticand foreign plutonium utilization programs, including reactor tests, are reviewed,as are mixed oxide fuel fabrication, reprocessing. transportation, and wastemanagement developments.
2.0 PLUT0NIUM: GENERAL BACKGROUND AND EXPERIENCE
244With the exception of very minute quantities of 6u recently discovered in239nature and minute quantities of Pu beln) formed in uranium bodies by the action
of naturally occurring neutrons, plutonium is artificially produced. It was thefirst man made element to be produced in quantities sufficient to be seen. Plutoniumwas discovered by Glenn T. Seaborg, Arthur C. Wahl, and Joseph W. Kennedy at theUniversity of California at Berkeley through a series of investigations which cul-
238minated in the identification of Pu on February 24, 1941. A few months later,239Pu was identified. Plutonium is now known to have 15 isotopes ranging in atomicmass frot 232 to 246. Microgram quantities were available for research in 1942,milligram quantities in 1943, and gram quantities in 1944. In 1945, a plutonium |atomic bomb was exploded. In 1946 the first reactor to use plutonium fuel, the LosAlamos Fast Reactor, called "Clementine," began operation.
Beginning with wartime research and production activities, the United Stateshas made an intensive study of plutonium. As a result, its properties and charac-teristics are better known today than those of most other elements and many corrnercialcompounds. Piutonium has been produced in reactors, recovered from reactor fuel,
f II-1i

purified, and mada into many chemical and physical fonns. Fabrication, transporta-tion and storage have involved safely handling many tons of the material.
If plutonium recycle is authorized for use in the fuel of LWR's, new facilitieswould have to be constructed and operated for the mixed oxide fuel cycle. Thesenew plants would take into account past experiences in plutonium pro ~ ving and wouldemploy more advanced technology, new equipment, and improved methods for safely
handling the material. The result should be greater production efficiency, improvedsafety and protection of employees and the public, and a reduced likelihood thatdetrimental environmental impacts could occur. The operations carried out by Federalcontractors, both for commercial demonstration purposes and the classified plutoniumnuclear weapons programs, have resulted in development of extensive informationconcerning normal and abnormal operating conditions, and have led to identificationof safety considerations and safe operating techniques. The resulting informationbase has been used to design commercial reprocessing, mixed oxide fuel fabrication,and waste management facilities.
After World War II, when security restrictions on information about plutoniumwere eased, numerous scientific and technical articles were published in the openliterature. During the early 1950's, there were one to two dozen publications onalutonium each year in the open literature; in the year 1958, about 200 such articleswere published. The rate of such publication continued to grow during the following-decade. Between 1968 and 1973, there were over 7,000 publications--more than 1,000a year--on plutonium, its alloys and compounds, processing technology, utilization,analysis, and health and safety aspects.
A recent computer search of information systems operated by the Oak RidgeNational Laboratory and covering specialized areas of science and engineeringdisclosed approximately 5,800 references to publications about plutonium in theliterature of the United States and other countries. Of these there were over 2,000
references dealing with plutonium in relation to nuclear safety; 2,100 pertaining toenvironmental effects of plutonium; 135 covering plutonium metabolism and internalexposure in humanst and 360 dealing with medical aspects. Although this coverage ofpublications is not complete, the number of references dealing with plutonium indi-cates the extent of the body of knowledge that has been produced in 30 years oftheoretical and applied work.
Virtually all of the U.S. research and development effort relating to plutoniumhas been supported by the Federal government under the U.S. Atomic Energy Comission.
The et. af AEC supported research and development on comercial applications ofplutonium and on its biomedical eff ects has amounted to several hundred million
dollars.
2.1 The Formation of Plutonium in the Reactor
The standard LWR fuel contains uranium that is about 3% U and 97% 2382EU
238Plutonium is formed in this fuel by the capture of neutrons in 0. The formation
11-2

. . . . , . - -
238 , the most plentiful (99.29%) isotope inof plutonium occurs principally when U
natural uranium, absorbs a r.eutron to form 239 This isotope decays rapidly (half-0239life 23.5 minutes) to form Np which soon decays (half-life 2.3 days) to form,
: ' 239Pu, with a half life of about 24,000 years. The chain of events leading toformation of other plutonium isotopes is complex and is always in progress in the'
reactor. CHAPTER I, Appendix A, part I shows the genesis of plutonium in LWR's bya series of nuclear reactions;2-
i
Any of the uranium, plutonium, or neptunium isotopes present at a given instant
f in.the reactor may decay radioactivity to form a new isotope; or absorb a neutron andform a heavier isotope; or absorb one neutron and eject two neutrons (n 2n reaction)to form a lighter isotope; or absorb a neutron and undergo fission, forming two muchlighterisotopes(fissionproducts). A typical 1,000 MWe LWR, using uranium fuelwithout plutonium recycle, produces about 280 kilograms of plutonium per year, of'
which approximately 200 kilograms are the fissle isotopes, 'Pu and 241 Pu.,
In a typical PWR fuel management scheme, the fuel remains in the reactor forabout 3 years. At the end of that time, part of the U will have fissioned and
235; the 0 concentration will be about 0.81; and the fissile plutonium will have built
up to a concentration of about 0.6%. In a BWR the fuel lifetime is about 4 years,
and the final fissile plutonium concentration is about 0.5%. While the fuel is in235the reactor its plutonium content increases and U content decreases, so that
i shortly before.the fuel is discharged, plutonium is contributing about as much to theproduction of energy as the uranium.
The use of mixed oxide fuel for LWR's will not result in fomation of elements*
or isotopes which are not present in the uranium fuel at the end of fuel lifetimes.I
However, when plutonium is included in fresh fuel, the end of lifetime fuels willcontain larger quantities of plutonium, particularly the heavier isotopes of plutonium,and transplutonium elements. The average plutonium content in an LWR mixed oxide
fuel loading is about 3 times the final plutonium content of spent urarium fuel elements.'
See CHAPTER IV, Section C-4.0.4
2.2 Nuclear Characteristics of Plutonium
Tables II-1 and II-2 show some of the nuclear characteristics of uranium a'idplutonium isotopes. The likelihood that neutrons will interact with any isotope toi
cause a particular nuclear reaction is proportional to the cross section (a measureof the probability) for that reaction; the larger the cross section, the more likelyis the reaction. Both tables give cross section values for some of_ the more importantneutron reactions involving uranium and plutonium. The data apply at specific4
, temperature and energy levels and are useful to demonstrate some specific points.Figures 11-1 and 112 show the cross sections for the two important fissile isotopesof plutonium, 239Pu and p241 1
Figure II-3 compares the nuclear characteristics of plutonium and uranium.2These effects of neutron absorptions by the plutonium isotopes are made more
|1
*.
,
, . -
. - - , m. , - - , <. . ~ - .-~,.-.m ..e , ,_ -_ .
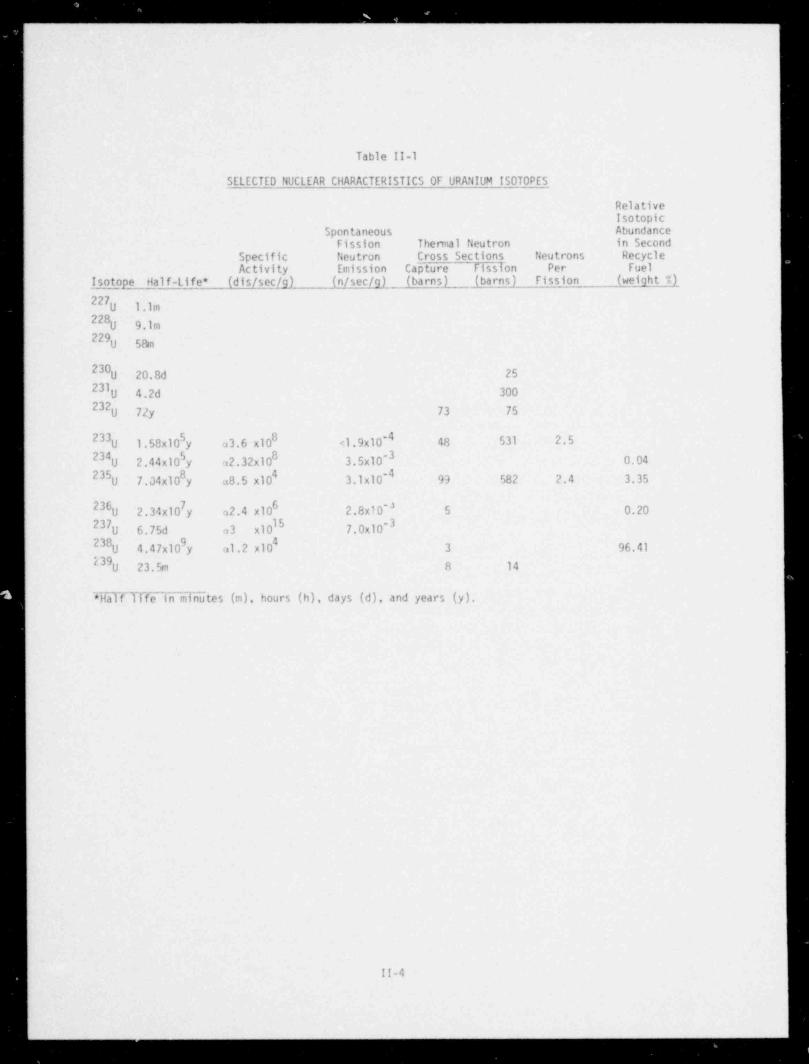
- _ . .. _ . . . .
Table 11-1
SELECTE0 NUCLEAR CHARACTERISTICS OF URANIUM ISOTOPES
RelativeIsotopic
Spontaneous AbundanceFission Thermal Neutron in Second
Specific Neutron Cross Sections Neutrons RecycleActivity Emission Capture Fission Per Fuel
Isotope Half-Life * (dis /sec/g) (n/sec/g) (barns) (barns) Fission (weight %)
227U l.lm
228U 9.lm
229U 58m
230 25U 20.8d231 300U 4.2d232
U 72y 73 75
233 5 0 <l.9x10'4 48 531 2.5U l.58x10 y a3.6 x10234 S 8 3.5x10⁻³ 0.04U 2.44x10 y a2.32x10235 0 4 3.1x10⁻⁴ 99 582 2.4 3.35U 7.04x10 y a8.5 x10
236 7 6 2.8x10'' 5 0.20U 2.34x10 y a2.4 x10237 15 7.0x10⁻³U 6.75d a3 x10238 9 4
U 4.47x10 y al.2 x10 3 96.4139
U 23.5m 8 14
- Half life in minutes (m), hours (h), days (d), and years (y).*
II-4
_ _ _ _ _ _ _ _ _ - _ _ _ _ - _ - _ _ _ _ _ _ - _ _ _ _

Table II-2
SELECTE0 NUCLEAR CHARACTERISTICS OF PLUTONIUM ISOTOPES
RelativeIsotopic
Spo.itaneous AbundanceFission and Thermal Neutron in Second
Specific (a-n) Neutron Cross Sections Neutrons RecycleActivity Emission (0xide) Capture Fission Per Fuel
Isotope Half-Life * (dis /sec/g) (n/sec/q) (barns) (barns) Fission (weight T)
232 I7Pu 36m a8.5 x10
233 18Pu 20m al.3 x10
234 16Pu 9h a5.5 x10
235 13Pu 24.3m a3.4 x10
6 13 4Pu 2.85y a2.0 x10 f3.7 x10 165
10Pu 45.6d al.5 x10 2400
238 II
(a-n)l.4x10|Pu 87.8y a6.3 x10 f3.4 x10 548 16.5 3.21
239 4 9
(a-n)4.5x10{2Pu 2.439x10 y a2.3 x10 f3.0 x10 268 754 2.9 40.25
240 3 9 3Pu 6.54 x10 y a8.4 x10 fl.0 x10 289 .03 30.42
( -n)l.7x10241 12Pu 13.2y 64.2 x10 368 1009 3.1 15.91
242 5 b 3Pu 3.87 x10 y al.43x10 fl.7 x10 18 .2 1 0.21(a-n)2.7
243 16Pu 4.96h 89.6 x10 60 196
244 7 5 3Pu 8.3 x10 y a7.0 x10 f5.1 x10 1.8
245 6Pu 10.5h 84.7 x10 150
26 15Pu 10.9d 61.8 x10
* Half life in minutes (m), hours (h), days (d), and years (y).
i
l
1
11-5

10,0003
__.__. _ _ _ _ . -
t
p. .--+. _ _ _ , _ _ _ . ____m_._ _ .._ _ _ . . - . - . _ . . . _ - _ . - -
f .. _ __ f _.__. d .___ _ . _ -. _---_--- _ ---._ m _
I--+i i-- +-F--~t-5000
! | |
__ _ __f,__ . .d 1.. _.. _ _ _ . . . _ _ _ - -- - - --
.__ _ _ _ . . _ , .- - d--
Ii !
i 1i ! . !' l-,! . -_ --.+.+- -.'-.- i -- - -+ -- ..-r - - _ m-
; ! ; i|-
I' ! i ! i j i !i ' ! !w. ', j,
22 i* ; - ! 3| '
ir. r t ' ; j |< i
. I t im | j | | [ jz' TOTAL i j> j i i !
i | Io- o ,
: ! !-p; -L-e - -~ +-,
. p 1000 : i-
g _ _ h___. - _ p-+L 4 .~ . 4--_ _ ___. ..
.__ - + j- y-__L ..- ,.;_. n
3
-; -. .-_7-- - r - . + _.m. -
n_.__' '
- __ v - .i- .-
M ;__ _ [____. _ _ _ _ .i _ .____. ._ U_ _ _ l--_ _ _M1._bo i iy __ j .
.M_..dy__Q,!'
;I
',
_f. [_. q_4 k-| I I !! i |
t ! |*
500 e- FISSION 1- l
.' r - - - + - - - - + -
v - ~| -i ', ; i -- ii
5 | | .f i f |4 4_ _ .4 _ .4 .. .__14 +I L- _..-b_-. +. 7 .-,ti
-rI
-
1 1 !|! ||'
i : i:
.___._-____.1 +- _ _ i d , - - 4__ _ _ . . _ _ .__ .1 i_. ---
i ! i - '
! :.
6 i ' l '
i l' ;
.
: i li i i
i i! !'' I| |! i i ii i
t--t -tt, ; .
;:
;t - !! , } I-
!-
i >,
. . j
i i !'
i ! i
| '!.
'-
!100 ' l
O.01- 0.50 0.1 0.5
NEUTRON ENERGY, eV
Figure ll.1 The Total and Fission Cross Sections of 239Pu at Low Neutron Energies
II-6
- _ _ _ _ _ ._

.. _.
_ . . . . . - - _ -
jj i * 3 i
I a .MTR| t
6 :HANFORD It gi j i
241 i I ( !
! Ii !I i
#1eg[ f i'
! A1\>J i
I i i im
E i | ['
b J b |tp -
i l-
,
9b 500 - 1
a$ ,
-+-O !ac ! > .
! ! IO
II'
!I -
1 i |!+
100
0.01 0.05 0.10 0.50|
NEUTRON ENERGY,eV |
241Figure 112 The Total and Fission Cross Sections of Pu at Low Neutron Energies
!
I
l
11-7
|. ,,, , , _ . _ _ _ - _ _ _. _, __ . - - - - - - - -

._ . .. _
- 5000 , , , ,
.$ 239 ,s p
{. 1000 - N-
E 500 - 235U N ~
mO Nm c g
O) N Nu- _100 _. \ .
$ 50 -''** '''9" ""' #f236U = 3Co }@-
c 239Pu=610 8s10 _ e > >
0.001 0.01 0.1 1.0 3.0
NEUTRON ENERGY (eV)
Relative comparison of fission cross sections below235 2393 eV for U and po,
i : i .
'2 5000 - 1i
-
i 240ip s 239 s Pupuo N ,t .
1000 -\ [t -<DU I i
oO 500 - 235 \ # I -
E E U | \ 'g
25 | y, \'
O \ 4 %p 100 -
| /g $4 -5
A
2220 m/sec Nm i#
1e I a
0.001 0.01 0.1 1.0 3.0
NEUTRON ENERGY (eV)
Relative comparison of absorption cross sections235 ,235Pu,and po,240below 3 eV for U
a i a
22 - 239Pua2 /,
o 2.1 _ _ _ _ _ _ _ , , , / - -
E cc 2.0 - 235Uto h f-Omcc m 1.9 - -
w4O Ey g 1.8 - -
1.7 - -
1 I I
10 10 3 10-2 10'I 1.04
NEUTRON ENERGY (eV)235 239Neutron yield per absorption for U and Pu.
, Figure 113 Nuclear Characteristics of 235Uand 239Pu|
; II-a,
_. . . . ,, .
pronounced by the fact that plutonium, on the average, releases more neutrons perfission than uranium, and thus increases the number of neutrons available to beabsorbed. The cross section behavior of plutonium isotopes causes the variouscoefficients of reactivity (moderator temperature, fuel temperature, and void) tobe more negative for plutonium systems. This is a favorable feature from a safetystandpoint, but adds to the complexity of computing these coefficients. The presenceof several fissile and fertile isotopes of plutonium also increases the complexityof computing the buildup, decay, and burnup of the higher isotopes. A great deal ofthe special research and development effort on plutonium recycle has gone intodeveloping core behavior data to make calculations more precise. The success ofthese efforts is confirmed by the fact that the more complex plutonium uraniumreactor core performance data can now be calculated with an accuracy approximatelyequal to that for the cores fueled with uranium only. The reactor core character-istics are discussed more thoroughly in CHAPTER IV, Section C-3.0.
2.3 The Chemistry of Pu02
lPlutonium dioxide ' is the material that will be used in the mixed oxide fuelof LWR's if plutonium is recycled. It has a melting point of about 2,390*C and isvery stable. For production purposes, purified plutonium nitrate is usually con-
verted to Pu0 by dec mposition of precipitated Pu (IV) oxalate by heating at2
temperatures of 450*C-800*C in air. Pu0 may be prepared by thermal decomposition2
of other compounds of plutonium:
- Decomposition of plutonium (IV) peroxide by heating to above 200*C
- Thermal decomposition of Pu (IV) nitrate at above 225*C
- Calcination of Pu (IV) todate at 600 C in air
- Calcination of Pu (IV) sulfate at 800*C
- Calcination of plutonium (IV) hydroxide
02.4 Radiobiological Hazards of Plutonium
Before the world's supply of plutonium was as much as one gram, research on theradiobiological hazards of plutonium had been started. The radiological hazards ofplutonium have been the subject of continuing research by many scientists during thepast 30 years.
The recycling of plutonium would have little effect on the exposures to the
public from external radiation. However, in working with the material precautionsmust be exercised to avoid inhalation or ingestion of plutonium bearing materialsbecause plutonium is extremely radiotoxic if taken into the body.
II-9
i
L
.

. _ _ . .. _.
Since external radiation associated with plutonium can be readily controlled byrelatively thin shielding in work areas or around handling equipment, the mostimportant measures to protect workers and the public are precautions to preventrelease and subsequent intake into the body. The most likely route of intake is byinhalation. , Less likely routes of intake are
Through the skin or through wounds-
Ingestion and subsequent absorption from the gastrointestinal tract '-
The route of entry into the body has a significant effect on deposition anddistribution in the-tissues and bone. CHAPTER IV. Section J. includes a detaileddiscussion of the radiobiological hazards associated with plutonium, includingeffects from skin absorption and internal deposition in the blood stream, in thelungs, and in body organs and bone. It is important to note that plutonium is noteasily retained in the body fluids--solubility in water at room temperature is onlyabout 20 micrograms per liter. In slightly alkaline conditions, such as would befound in the small bowel, for example, plutonium forms extremely insoluble hydrox-ides and hydrous oxides.
Since the advent of the Atomic Energy Commission programs in the United States,a number of people working with plutonium have accumulated quantities of plutoniummeasurable by urinary excretion. Case histories and data developed in thoroughphysical examinations of 37 individuals who had systemic burdens estimated to be in
excess of the National Council of Radiation Protection (NCRP) established maximumpermissible level (MPL) of 0.04 pCi of' plutonium are available. Under observationfor periods ranging from 5 to 25 years since exposure,7 the cases concern persons
who were exposed during the Manhattan Project or subsequently in government facilitiesoperated by contractors. Twelve individuals in whom the original plutonium intakesoccurred 23 and 24 years ago have been kept under surveillance and subjected toperiodic careful and thorough examinations. These individuale have experienced nochanges in their physical conditions not attributable to the natural aging process.Similarly, in the several cases where systemic burdens approached or were greaterthan 0.04 uCi that have occurred more recently in England, there have been no reportsof lung, lymph node, liver or bone morbidity attributable to plutonium deposition.Although the number of cases is too few to support reliable extrapolations to thebiological consequences of plutonium, this evidence suggests that the MPL forplutonium is conservative.
A study of indigenous and experimental animals kept for long periods in areasheavily contaminated with plutonium. indicates that direct uptake of plutonium was
-small. Plutonium uptake by plants from soil and growth media has been investigated
.
in the field and in the laboratory under a variety of conditions'. The concentrationof plutonium in plants on a dry weight basis was never more than one thousandth of
that in the growth medium, and only about one ten thousandth of that in the soil.The fraction of available plutonium absorbed from the gastrointestinal tract of
' animals grazing on contaminated vegetation is less than one ten thousandth the total
II-10,
|;
- - . - . . . . - . - - .
intake of the element and messurements of plutonium transfer from the blood streat.to milk suggest a further reduction in plutonium concentration by another factor ofat least 10. Consumption of animal products by man will introduce another reductionfactor of at least 10-4 in the plutonium concentration entering the systemic circula-tion, except in the very young infant where the factor may approach 0.01.8 Itappears, therefore, that the possibility of transfer of plutonium from soil to manby way of the food chain is negligible.
Studies at the Nevada Test Site for a period of 10 years following the 1955-1957 series of high explosive detonations involving plutonium, show that the uptakeof plutonium by plants increases over the years. Although conclusive evidence wasnot obtained, it appears that the increase in plutonium uptake might be due tocontinued development of larger and deeper root systems, and to the action of naturalchemical complexing agents present in soils that make plutonium more soluble.Although the increase in plutonium uptake is measurable, the levels are so low that,even with the increase, ingestion of plutonium through the consumption of plantswould not represent a significant pathway to human exposure.9 For example, during a
5-year period of growing test crops in the contaminated soil, the accumulation ofplutonium in plant tissues increased from 3 d/m.g* (dry weight) to about 23 d/m.g.Even so, consumption of food grown in such contaminated soils has caused onlyextremely low plutonium uptake in the body. This conclusion is based on measure-ments of the tissues or persons exposed to fallout from past nuclear weapons tests,which in themselves have resulted in the production and dispersal of about 320,000curies of plutonium.6 These measurements also indicate a maximum plutonium concen-
tration of 3x10 Ci/g in pulmonary lymph nodes. The highest concentration found inthe lung was 5x15-15 Ci/g. These values also attest to the very low body uptake viainhalation in a slightly contaminated environment.
1
At Palomares, Spain, the nonnuclear explosion of a nuclear weapon dispersed a
large quantity of Pu0 . Followup studies af ter an extensive cleanup campaign have2
not revealed any consistently measurable plutonium concentration levels in people orproduce from the area, even though plutonium surface contamination levels approaching
2500 pg/m were plowed into the soil and in some areas, the plutonium could not beplowed under because of the rocky terrain.6
3.0 PLUT0NIUM RECYCLE IN LWR's
3.1 Development and Testing of Mixed 0xide fuels
The initial development of technology for plutonium recycle in LWR fuel wassponsored by the USAEC, with follow-on programs financed by utility companies andnuclear reactor manufacturers; in some cases, programs had joint sponsorship.
Development of the technology of plutonium recycle in reactor fuels began with theAEC sponsored Plutonium Utilization Program (PUP) at Hanford in 1956, and is con-tinuing, mainly with mixed oxide fuel performance demonstrations in LWR's. After
supporting the PUP program at Hanford and the Saxton MOX fuel developnent and testingprogram, the U.S. Government concluded that further development of plutonium recycletechnology could be carried out by industry.
*d/m.g. = disintegrations / minute / gram
11-11
|J

- _ - _ - - - - _ .
The Federal government-supported research and development program on plutonium
recycle was essentially completed by the year 1970, with only a small program wrapupphase extending to 1972. Major industry programs were initiated in the year 1967 withthe Edison Electric Institute supporting mixed oxide fuel development and testingperformed by Westinghouse and General Electric, followed by the mixed oxide fuelperformance demonstration programs in commercial reactors. As early as the year 1959,demonstrations of plutonium recycle were also initiated in foreign reactors. Each ofthe major programs carried out to establish the viability of plutonium recycle inLWR's is discussed below.
As a result of the experience acquired and the technology developed in variousplutonium recycle programs, both in the United States and abroad, it has been demon-strated that plutonium recycle is technically feasible. This conclusion is based onsuccessful irradiations of fuel in the Plutonium Recycle Test Reactor at Hanford, andin the Saxton, San Onofre, Big Rock Point, and Dresden Unit No.1 U.S. reactors.Foreign experiments have involved tests of mixed oxide fuel in a number of reactors,but especially at Garigliano in Italy. The mixed oxide fuels were irradiated tospecific pot er levels and to burnups typical of those expected in LWR's. The irradia-tions showed no abnormalities with respect to fuel behavior or predicted reactorcontrol and core perforcance characteristics.
3.1.1 Plutonium Utilization Program
The Plutonium Utilization Program (PUP) sponsored by the AEC at its BattellePacific Northwest Laboratories (PNL) in Richland, Washington, to develop the tech-nology for plutonium recycle in thermal reactors, began in the year 1956, about oneyear before the first demonstration nuclear plant began operation at Shippingport,Pennsylvania, in 1957.
It was not known in the 1950's what type of nuclear power reactors would dominatethe commercial market or what type of fuel would be used; therefore, a great deal ofthe effort of the Plutonium Utilization Progra'n was devoted to development andtesting of fuels other than the mixed oxide pellet type which, if plutonium recycleproceeds, would be used in LWR's.
As a part of PUP, the 70 MWth Plutonium Recycle Test Reactor (PRTR) was built
at PNL (formerly the Hanford Laboratory) for fuel performance tests; operatingcharacteristics are shown in Table 11-3. The PRTR was a heavy water moderated and
cooled reactor with 85 vertical pressure tubes which contained individual fuelassemblies. It also included a Fuel Element Rupture Test Facility (FERTF) which wasa test loop with a separate light water cooling system to be used for conductinghigh risk experiments with elements having intentional defects.
The major efforts in PUP were concentrated on development of mixed oxide fuels,their irradiation in the PRTR, and experimental and calculational neutronics studies.Other efforts included studies of chemical reprocessing, economic optimization, andreactor decontamination.
11-12

1
Table 11-3
OPERATING CONDITIONS FOR THE
PLUTONIUM RECYCLE TEST REACTOR
Reactor Operating Pressure 1050 psi
Coolant Surface Velocity * 15 ft/sec,
Inlet Coolant Temperature 235'c (455'F)Outlet Coolant Temperature 275'C (527'F)Coolant pH 6.0 to 7.5
"Peak Linear Heat Rating * 20.1 kW/ft (464,000 )fg
Axial Peak-to-Average Power Ratio 1.27
Average Linaer Heat Generation Rate of Maximum Rod * 16.1 kW/ftMaximum Allowable Fuel Temperature Incipient meltingDesign Peak Burnup 35,000 mwd /MTHM
2Film Coefficient (Calculate 'r t)* 6520 Btu /hr/ft .FPeak Cladding Surface Heat F iux* 475,000 Btu /hr/ft
Maximum Allowable Cladding Surface Heat Flux 650,000 Btu /hr/ft
Boiling Burnout Ratio * 1.85
Pressure Tube (Inside Diameter) 3.25+.01 in.Equivalent Diameter * 0.3 in.
2Flow Area * 12.11 inMaximum Allowable Tube Power 1800 kW
*HPD PRTR fuel element. Nineteen-rod cluster of .565 in Zircaloy clad rods containingvibrationally compacted UO with 2 wt% Pu0 f"*1*
2 2
II-13
i
In tho area of fuelf derelopment and irradiation, the PUP program t'as directed
almost exclusively toward vibratory packed particles rathw than the pellet type U02fuels which later came to be exclusively utilized in comercial LWR's. Also, in theearlier part of the program, metallic Pu-Al alloy elements were fabricated andirradiated, but these were of very little economic interest. The large effort onthe vibratory packed (Vipac) particle fuel was spurred by what appeared to be poten-tial economic advantages of this method and its adaptability to remote operation.But, as the program progressed, the economic advantage of Vipac fuel appearedmarginal. For this reason and because of the good performance and general accept-ance of pellet type fuel in commercial power reactors, the fuel fabricators designedtheir LWR fuel facilities to produce pellet-type fuel; and the Vipac fuel became apossible alternative. Table II-4 sumarizes the fuel irradiation experiments per-formed in the PRTR during the Plutonium Utilization Program. These irradiationsincluded 2 assemblies (38 rods) of mixed oxide hot pressed pellets and 13 individualrods of cold pressed and sintered pellets. The mixed oxide fuel designs tested inPRTR (Zircaloy clad fuel which was heterogeneous 1y and homogeneously enriched)
included three chronological phases as noted below. Some types were vibratorycompacted and some were swage compacted types of fuel.
The irradiations carried out in the PRTR were classified into three chrono-logical phases:
Phase I - Startup - experimental elements
Phase II - Continuation of tests - modified phase I elements
Phase III - Batch core experiments
in Phase I, which extended from the startup of the Plutonium Recycle TestReactor ir. July 1961 tc January 1965, a large variety of experimental elements wasirradiated. The element types included Al Pu alloy elements; UO elements fabri-
2cated by vibratory compaction and by swaging; and heterogeneously enriched (incre-mentally loaded) and homogeneously enriched mixed oxide fuels fabricated by swagingand by vibratory compaction. Peak burnups of 13,000 mwd /MTHM at peak linear heatrating of 12 kW/f t were attained during Phase I operation. The first plutonium
produced in PRTR was recycled back into the reactor as a swage compacted UO2 -0.5wtt Pu0 element in May 1963.
2
During the Phase I irradiation, 38 mixed oxide rods developed in service defects.With one exception, these defects were attributed to internal gas phase hydriding ofthe Zircaloy-2 cladding, caused by impurities in the fuel material. Three types ofimpurities were identified:
- Residual fluoride contamination in the plutonium oxide
- Absorbed moisture in the fuel
II-14
..
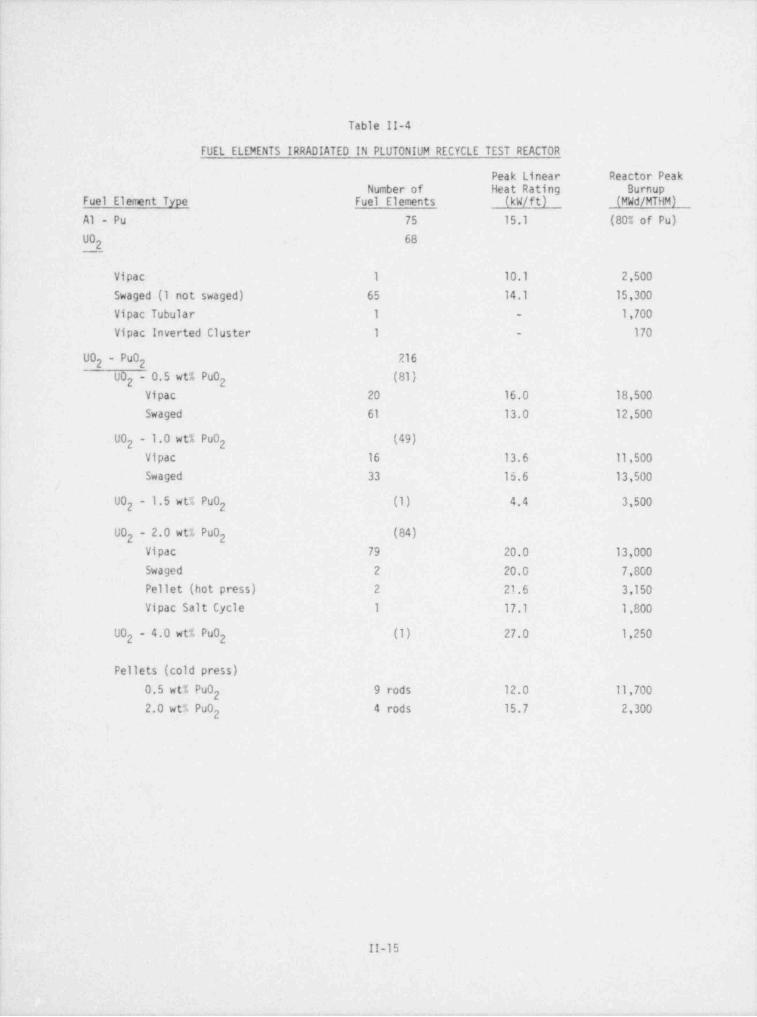
Table II-4
FUEL ELEMENTS IRRADIATED IN PLUTONIUM RECYCLE TEST REACTOR
Peak Linear Reactor PeakNumber of Heat Rating Burnup
Fuel Element Type Fuel Elements (kW/ft) (mwd /MTHM)
Al - Pu 75 15.1 (80% of Pu)UO 68
_.2_
| Vipac 1 10.1 2,500
Swaged (1 not swaged) 65 14.1 15,300'
Vipac Tubular 1 - 1,700
Vipac Inverted Cluster 1 - 170
UO2 - Pu02 216
(81)UO2 - 0.5 wt% Pu02Vipac 20 16.0 18,500
Swaged 61 13.0 12,500
(49)U02 - 1.0 wt% Pu02Vipac 16 13.6 11,500
Swaged 33 15.6 13,500
(1) 4.4 3,500UO2 - 1.5 wt% Pu02
(84)UO2 - 2.0 wt% Pu02Vipac 79 20.0 13,000
Swaged 2 20.0 7,800
Pellet (hotpress) 2 21.6 3,150
Vipac Salt Cycle 1 17.1 1,800
(1) 27.0 1,250U02 - 4.0 wt% Pu02
Pellets (cold press)0.5 wt% Pu0 9 rods 12.0 11,700
22.0 wt% Pu0 4 rods 15.7 2,300
2
II-15
. - . . .__ . . - - -. _.
i,
: Traces of hydrocarbons (011) introduced in the fuel by leakage from mechan--
ical processing equipment
Although hydriding of the cladding led to severe localized embrittlement andloss of cladding fragments in some instances, little or no fuel loss into the coolantresulted, and no severe reactor operating difficulties were experienced. .By con-certed efforts to identify and correct this problem, the impurity induced failureswere confined to a short period of time,'after which fuel materials of improvedquality eliminated the problem.
Irradiation of Phase I first generation elements in PRTR was continued in r
Phase II. In Phase II (January 1965 through September 1965) irradiation tests wereperformed on modified design mixed oxide fuel elements which were develo,ed toprovide for operation at high power density, high burnups (~20,000 mwd /MTHM), andhigh linear heat ratings (-20 kW/ft). It was expected that these fuel elements
-would be used for a full fuel loading in the Batch Core Experiment under Phase III.
During Phase II of PRTR operation, peak burnups of 15,000 mwd /MTHM were attainedon Phase I.first generation mixed oxide fuel. Also during Phase II operation, peakburnups of about -6,500 mwd were achieved on prototype high power density (HPD) fuelat peak linear heat ratings of about 21 kW/ft and maximum fuel temperatures abovemelting. Phase II operation was terminated as a result of the rupture of an inten-tionally defected mixed oxide element under irradiation in the Fuel Element RuptureTest' Facility loop in the PRTR at a peak linear heat rating of about 27 kW/ft withsignificant fuel melting at the plane of the defect.
TheBatchCoreExperiment(BCE)wasconductedinPhaseIII,whichextendedfrom.January 1967 through July 1968. At the start, the PRTR was loaded with 66 fresh HPD
elements designed to operate at high specific powers to high burnups.U02 -2 wt% Pu02The irradiation of selected first generation Phase I and Phase II elements was con-tinued in the fringe positions of the BCE during this experiment.
At the end of Phase III operation, peak burnups of 13,000 mwd /MTHM were achieved
on high-power density mixed oxide fuels that operated at nominal maximum peak heat -ratings of 19 kW/ft with maximum fuel temperatures near melting. Peak heat ratingsas high as 21.4 kW/ft with fuel temperatures above melt *, were achieved for short
-periods of. time. Peak burnups of about 18,500 mwd /MT were attained on first generationmixed oxide fuels at maximum peak heat ratings of 17.1 kW/ft.
A large number and variety of experimental fuel elements were successfullyirradiated in the PRTE to evaluate the irradiation performance of mixed oxide fuelssuitable for plutonium utilization in water cooled reactors. Mixed oxide fuels wereirradiated to peak'burnup levels above 18,000 mwd /MTHM and to linear heat' rates
about 20 kW/f t.
.The behavior'of the various experimental' mixed oxide fuel types operating underhigh performance conditions was generally excellent. Fabrication problems associated.
i' 11-16
i
-
. - - - , . -, ,--- - -, . - , . . .c-

,
with PRTR mixtd oxida fuel elements of the first-gtneration dtsign resulted in fuel '
rod defects which provided some of the first experience with gas phase hydridingdefects in Zircaloy clad oxide fuel rods, and.resulted in an improved understanding
,
of the phenomenon. Consequently, improved fuel fabrication techniques were developedand no fuel rod defects occurred in the more advanced vibratory compacted HPD designmixed oxide elements irradiated in PRTR during the BCE.
The PUP placed major emphasis on packed particle fuels, and most of the fuel
irradiations in PRTR were not demonstrations representative of the pellet type mixedoxide fuels planned to be utilized in current LWR's. However, it should be notedthat the test results all indicated that the M0X pellet fuel currently in use wouldperform adequately under commercial LWR operating conditions.
Further details, sumaries and references on PUP are available in NuclearTechnology (August 1972andMay 1973) .10,H
.3.1.2' Saxton Program
The Saxton Program was carried out by Westinghouse under an AEC contract tosupplement the work at PNL and develop information on utilization of mixed oxidefuel;in pressurized water reactors. Primary objectives were to
- Perform pilot-scale tests of plutonium enriched fuel in a pressurizedwater reactor environment
- Compare the performance of mixed oxide fuel fabricated by two economicallypromising techniques: pelletized versus vibratory compacted (Vipac)
Obtain nuclear data of interest to plutonium recycling, especially in-
depletion and generation of transuranic isotopes
Provide a preliminary basis for selection and design of plutonium fuel for-
,
a commercial PWR
The project included design and fabrication of mixed oxide fuel elements,reactor irradiation of the fuel, and post irradiation evaluation. The guidelinesfor mechanical, thermal, and hydraulic design of the mixed oxide fuel elements were .
- -20,000 mwd /MT peak rod average burnup
16 kW/ft maximum design heat rating in the rods-
Internal gas pressure at end of design life to be less than external-
reactor operating pressure
!; Fuel rod outside diameter, length, and lattice spacing to be the same as !-
for the standard UO fuel r ds2 ;
.t. II-17
v.
l
[:

~ _ - - - .-- -. . - ___- . ..
;.
i
f.
The project was initiated early in the year 1964, and full power operation ofthe Saxton PWR with standard UO fuel elements began in January 1966. The character-
2;
istics of the Saxton Reactor during the period of Core II operation are suninarized'
in Table 11-5.
Table 11-5
SAXTON CORE II DESIGN OPEPaTING CONDITIONS
| Reactor Type PWR
I Maximum Power Level 23.5 MWt
Maximum Linear Power Density 16 kW/ft
Maximum Heat Flux 531,400 Btu /hr-ft
' Average Coolant Temperature 277'C (530*F)
System Pressure 2,000 psia
Maximum Clad Surface Temperature 339'C (642*F)
Average Clad Temperature ati
Hot Spot (stainless steel) 356'C (674*F)
Average Clad Temperature atHotSpot(Zircaloy4) 367'C (692*F)
Maximum fuel Central Temperature 2,200'C (3992'F)
Peak Rod Average Barnup 25,000 mwd /MTPM
Chemical Shim, Beginning of Life 2,000 ppm boron
Initial Loading - M0X 345 kg in 9 assemblies525 kg in 12 assemblies
| Initial Loading - U02
Saxton Core I used standard UO fuel elements to establish a core perfonnance2
base Ifne. Saxton Core !! fuel loading consisted of nine central mixed oxide fuel
assemblies (638 rods) and twelve outer fuel assemblies of standard U0 . The mixed2
oxide contained 6.6 wt% Pu0 in natural U0 . The UO assemblies were enriched to2 2 2,
| 5.7 wt% 235 Of the nine plutonium assemblies, two cor .ned vibratory compactedU
(Vipac) fuel; the remaining seven assemblies, pelletized ruel. With the exceptionof some thirty fuel rods which were clad with 304 stainless steel, the mixed oxide
L fuel rods were clad with Zircaloy 4. Important elements requisite to nuclear
operations analysis and fuel performance evaluation were:
- Analyses of at power boron (soluble neutron absorber) and control rod
i worths (ability'to absorb neutrons to control reactor power level and shutdown reactor during emergencies), temperature and power coefficients, coredepletion rate (rate that fissile atoms fission; i.e., the rate of fuelburnup), and core flux wire * and detector maps **
* Flux wire - a special wire that can be inserted into the core for a short irradiation .period. The wire, when withdrawn and passed by a radiation scanner, providesprovides data that is indicative of the core neutron flux at the wire
r
|locition. Neutron flux is a measure of the number of neutrons per squarecentimeter /second,
It
[, ** Detector maps - in core radiation mapping, sensors positioned within the core produce three
[~dimensional measurements of neutron density (radial axial flux maps).
,
11-18L.
I'
I-
_. _, -. _ _ , . _ _ _ . . .

Evaluation of nuclear parameters in zero power tests, based on measurement-
of boron and control rod worths, temperature and pressure coefficients,minimum shutdown reactivity and xenon decay
- Nondestructive and destructive post-irradiation examinations of the fuel
Core II achieved 9.360 effective full power hours, corresponding to a coreaverage burnup of 10,940 mwd /MTHM with an average burnup of 17,400 mwd /MTHM in the
central region which contained the mixed oxide fuel. Subsequent measurements anddata reduction showed that the burnups of the peak plutonium rod were 21,000 mwd /MTHM(rod average) and 28,000 mwd /MTHM (peak pellet).
Extensive examination of Pu0 and UO mixed xide fuel rods after the Core II2 2irradiation led to the following conclusions:
- Mixed oxide fuel perfomed satisfactorily, with no evidence of fuel rodfailures, thus confirming the adequacy of design and fabrication procedures.
- The fuel rods exhibited good dimensional stability, with a maximum of 0.23percent length increase and, with the exception of one rod, changes inmean diameter no greater than 0.003 inch.
- Pellet and vibratory compacted fuel performed equally well, althoughlength increases with Vipac fuel were slightly less, and center fueltemperatures in peak power Vipac rods were somewhat higher than in highestpower pellet fuel rods.
- The cold-reduced and stress-relieved Zircaloy 4 cladding employed in theplutonium region of Saxton Core Il perfomed well. Oxidation of the outersurface was highly variable and, in some areas, greater than had beenpredicted from out of pile testing. Hydrogen uptake by the Zircaloyduring operation was less than 50 ppm, which indicated few chemicallyreactive impurities in the fuel. The resulting hydrides were randomly orcircumferentially oriented. Mechanical tests of clad samples indicatedmoderate irradiation strengthening but retention of significant ductility(at least 2.5 percent uniform elongation as measured in tensile tests).
,
- One fuel rod, which had anomalous dimensions, exhibited local massive
hydriding but did not fail. The source of the excess hydrogen was probablystray contamination introduced during fabrication.
- None of the changes in diirensions, microstructure, or properties was ofsufficient consequence to impose basic operation limits for M0X fuel in
irradiation environments similar to those of Saxton Core II. As a result,
it was determined that the mixed oxide irradiations could be carried topeak pellet burr.ups approaching 50,000 mwd /MTHM by reconstituting the
11-19

, . . . . . .. _. -. _ --
mixed oxide fuel rods into a looser lattice configuration employing 250rods. -This lattice change was made before starting Core III operations.
Core III remained in operation until May 1,1972, at which time the peak pellet. ournup ranged from 40,000 to 51,000 mwd /MTHM and a peak linear power of 21.2 kW/ft
had been achieved.
Analysis and evaluation of the mixed oxide rods from Core !!I indicated goodoverall performance, even at the peak pellet burnups experienced. Progressivechanges were observed in rod length, fuel microstructure, fuel clad interaction,corrosion of the cladding material, and mechanical properties of cladding. However,these changes were consistent with increased irradiation time and had no apparenteffect on fuel perfomance. Profilometer scans, fission gas collection, and hydrogenanalysis showed results similar to those observed at the end of Core II irradiation.
In the Core III irradiation 33 rods developed defects when the burnup reached40,000 to 42,000 mwd /MTHM. The defects were limited to rods near the upper end ofthe power spectrum and were associated with an anomalous crud condition not seenpreviously on any Saxton fuel rods. The defective rods were not considered indica-tive of an inherent power, burnup, or other perfemance limitation in Zircaloy cladmixed fuel, but appeared to be related to the presence of significant quantities ofadherent crud, which suggested a change in core environment, such as water chemistry,
after the midlife shutdown.
With respect to core reactivity, effectiveness of the control rods, and theprediction of neutron flux patterns and power densities, the methods of calculationwhich had been used for reactor cores with uranium fuels proved readily adaptable
-and accurate when used in computing the characteristics and performance of reactorcores with mixed oxide fuels. The predicted values were always withis 5% of measuredvalues and, for most parameters, within 2%.
It was shown that a reactor core designed for uranium fuels can accept mixed~
oxide fuel without change in the mechanical design, and that it can achieve longerlife (withmixedoxidefuels)ifthelatticespacingisincreased.
AEC support of the Saxton Plutonium program was teminated in 1972. Reports of
the work are available in the documents listed in References 12-20 at the end ofthis chapter.
'3.1.3 Edison Electric Institute / Westinghouse
Industry participation in mixed oxide fuel development was provided by the EdisonElectric Institute (EEI), an investor owned electric utility company trade associationorganization through which support is provided far research and development projects ofinterest'to the industry. A contract was entered between EEI and WestinghouseElectric Corporation (W) fer a plutonium utilization development program directed
. toward the use of mixed oxide fuel in pressurized water reactors. The AEC contributed
11-20
_ _ - _ _ _ _ _ _ _ - _ .

-
to th) work undir this program by providing plutcatum at a reduced charga. Th2EEI/W program was initiated in the year 1967, with the first phase of the workdevoted to study factors that influence the economics of Pu recycle t.ad the distinc-tive characteristics of plutonium fueled pressurized water reactors.
Using analytic and semiempirical adjustments to reactor core calculational tech-niques, Westinghouse improved the computer codes to make it possible to calculate theinitial criticality of plutonium fueled systems with an accuracy consistent withthat for uranium-fueled systems. In cores containing both plutonium fuel and enricheduranium fuel, calculations indicated that the use of separate and distinct core regionsfor each fuel type would be the most promising method for fuel loading. This could beaccomplished either by arranging two distinct fuel regions in each assembly, or by useof individual assemblies of each fuel iype.
Calculations and critical experiments showed no inherent limits which wouldrestrict the use of a full plutonium core in a pressurized water reactor. However, inthe core lattice configuration of existing reactors, a core consisting entirely ofmixed oxide rods would experience a reduction in control rod worth. This results fromthe already noted fact that the fission cross sections for the fissile plutonium
235 ; consequently the same power density may beisotopes are about twice that of U
maintained with about half the neutron flux. Thus, with mixed oxide fuel, control rodshave only about half as many neutrons to act on. This phenomenon is somewhac compli-cated by the fact that nonfissile plutonium isotopes have very high neutron absorptionresonances in the thermalization neutron energy range, further reducing the number ofneutrons available for the control rods to act on. The EEI/W experiments snowed that,with a core design incorporating a larger number of control rods and a more openlattice spacing, a core with all mixed oxide rods could be operated safely. In a
"I 'standard PWR core employing both mixed oxide fuel rods and rods containing UO2 Y4
adequate control rod worth can be assured by positioning the U0 rods adjacent to all*2
control rods and positioning the mixed oxide rods so as to obtain the desired powerdistribution. See CHAPTER IV, Section C-3.0, for a more complete treatment
of this subject.
During the early studies and experiments under the EE1/W program, certain areaswere identified as requiring a continuing effort:
In the fabrication studies, the nature and extent of the shielding (primarily--
for neutrons) required for the high burnup plutonium fabrication, and theeffects of this shielding on the cost of performing fabrication operationsneeded further resolution.
- Although initial criticality could be calculated satisfactorily, the |
depletion characteristics of large mixed oxide fueled cores containeduncertainties which could be resolved only through actual irradiation andsubsequent destructive examination of the mixed oxide fuel. In addition,nuclear design uncertainties remained in the calculation of the power
11-21
- ~

_. . .. .
..
. distribution characteristics and control rod requirements for cores con-taining both 00 fuel rods and mixed oxide fuel rods. A donor.stration
2fuel loading for a large PWR wouN assist in resolving this area ofuncertainty.
Based on the work at PNWL, the inp11e materials perfece of mixed oxide-
- fuel was expected to be similar to and as satisfactory as that of uraniumfuel; however, before this performance could be established with a high levelof confidence, large quantities of plutonium fuel would have to be irradiatedin the typical PWR environment.
In the preliminary core region design study conducted under Phase 2 of the EEI/W
[- program, a 1,000 MWe four loop plant with a core containing both mixed oxide and UO2
fuels was selected as the reference case. Calculations were made for the referencecore uf an identical core fueled with UO only. The self-generated recycle mode of
2! refueling with plutonium was assumed; this required each region reload to include both
mixed oxide and uranium oxide fuel. To simulate equilibrium recycle conditions,operation with a 1/3 loading of mixed oxide fuel introduced in sequential loadings * was
'
analyzed and compared with a UO c re that had operatou for four fuel cycles. These2
analyses yielded several conclusions:
An average enricivnent of 4.2 wt% Pu is required to achieve the 33,000 mwd /-
ffTHM ournup reached in the reference UOp core.
- Usits the discrete assembly concept (all rods in single assembly containeither mixed oxide or U0 ), self-generated Pu recycle can be accomplished
2
with all mixed oxide rods located in assemblies that do not contain controlrods. This can be done without increasing the peak power density andwithout reducing the core power capability or lifetime.
- At equilibrium, with one-third of the core containing mixed oxide fueli elements, it is not necessary to install additional control rods or to
position mixed oxide rods in assemblies containing the control rods.
- ' The moderator temperature coefficient for the core contain .9 mixed oxide is6.5% more negative, with the result that, as th' reactor cure temperatureincreases, the control rod worth decreases slightly.
- Natural uranium shows an economic advantage over depleted uranium as themixed oxide diluent.
'*The calculations were based on introducing all of the mixed oxide fuel (1/3loading) over a 3 year period.
II-22

As a part of phas) 2 of the EE!/W Plutonium Recycla Demonstratian Program, a totalof 720 Pu0 and 00 , Zircaloy 4 clad fuel rods in four assemblies were irradiated in
2 2San Onofre Nuclear Generating Station Unit No.1. f.11 rods in each fuel assemblycontained mixed oxide pellets. The fuel rods were of three different plutoniumen-ichments and positioned so as to control local power. The number of fuel assem-blies selected for the demonstration program was representative of the initialloading for self-generated plutonium recycle. These four assemblies, containing 45kg of plutonium (fissile) in the mixed oxide rods, were inserted into the San Onofrereactor during the first refueling in November 1970. The demonstration mixed oxideassemblies were operated through two nonnal reactor cycles (San Onofre Cycles 2 and3). The original plan was to irradiate these assemblies for three cycles. However,because of the possibility of problems identified subsequent to their insertion,caused by fuel densification in U0 fuels and the consequent limitation on powerp
operation, irradiation was restricted to two cycles. One of the ways in which theUO fuel densification problems was manifested was by the collapse of the clad
2material onto the pellets. This was compensated for by pressurizing the fuel rods.The mixed oxide rods were not pressurized and rather than risk fuel densificationproblems, it was decided to remove the mixed oxide assemblies even though they hadshown no signs of trouble.
The San Onofre core consists of 157 fuel assemblies. During the first refuelingat the end of cycle 1,105 fuel assemblies from the initial core were reloadedaccording to the standard plan, and 52 fresh fuel assemblies were added, consisting
of 48 UO assemblies and the four Pu0 and UO demonstration assemblies. Two of the2 2 2
11xed oxide assemblies each had 52 removable and 128 nonremovable fuel rods. At theend of cycle 2, removable mixed oxide rods were examined and returned to the core.Four of these were replaced with natural U0 rods. Two of the four discharged rods
2were subjected to postirradiation examinations.
Af ter one cycle, the peak pellet burnup on these assemblies was 12,600 mwd /MTHM,
and the highest rod average burnup was 10,500 MWdjMTHM. Visual examination of the fourassemblies and eight of the removable rods showed them to be in excellent condition.
Af ter two cycles of irradiation were completed in June 1973, the peak pelletburnup on these assemblies was 25,050 mwd /MTHM and the highest rod average burnup
was 21,050 mwd /MTHM. The assambly average burnup was 18,950 mwd /MTHM. Visual
examination of the four assemblies and of six removable rods showed them to be inexcellent condition. Although there was one indication of possible local cladhydriding on a peripheral rod in one of the assemblies, the rod was still intact,with no evidence of mechanical degradation. Rod length, diameter, and ovalitymeasurements were made on six rods, four of which had previously been measured after
one cycle of irradiation. The measurements showed no unusual conditions.
Two rods irradiated for one cycle and two rods irradiated for two cycles were
selected for a program of nr 7destructivt and destructive postirradiation examination.The examinations showed no ,iomalous conditions.
11-23
. - -. . _.
Details on the EEI/W Plutonium Program are available in the documents listed inReferences 21-25 at the end of this chapter.
3.1.4 Edison Electr k Institute / General Electric
The Edison Electric Institute also sponsored work by the General Electric Company(GE) on plutonium utilization in boiling water reactors. AEC contributed by providingplutonium at a reduced charge. The EEI/GE mixed oxide fuel investigation was initiatedin the year 1957 and pursued in parallel with the PWR mixed oxide prcgram. The firstphase was a study of the technical and economic aspects of plutonium recycle in BWRfuel. The following conclusions were reached on the work to be performed in subsequentparts of the program:
- It is technically and economically feasible to utilize recycle plutonium inEWR's.
The fabrication method (hot pressed vs cold pressed pellets) needs to be-
! evaluated with respect to effects on cost and performance.!
| In reactor operating experience on fuel is needed.-
.
- Further work is required concerning the trend toward reduced control marginsi when plutonium is utilized.
Nuclear calculational methods require improvement.-
- Fast transient tests are required to evaluate safety, because plutoniumsegregation within the fu-1 :*d is possible as a result of diffusion or someother mechanism.
1
Under the development and t sting phate of the EEI/GE plutonium recycle demon-strati? >rogram, mixed oxide fuils of several types were tested in operating reactorsto evaluate their performance. %ior tests were planned for the 31g Rock Point1
nuclear power reactor. In addif irm, four assemblies which were fabricated originallyfor use in the first core of Ve laont Yankee were instead now being irradiated in treQuad Cities Unit No. I reactor. Optimization of mixed oxide fuel element design wascontinued, taking into account Improvements in methods, technology, and economic
: studies.
The irradiations of mixed oxide fuel carried out in Big Rock Point under thisprogram began in March 1969, a"d included 32 rods; irradiation of three bundles,each containing 68 mixed oxide rods, was initiated in March 1970. These tests aredescribed subsequently.
Ii,
11-24
|
.-- _- -. - __ .

3.1.4.1 Rod Irradiations
The. fuel rod tests were designed to compare the performance of
- Rods containing mixed oxide pellets with flat ends so that the pelletswould stack within the cladding to make a solid rod
Rods containing pellets with dished ends which would create about 3% voids-
within the fuel rods
Rods containing annular pellets-
These fuel form! would be compared with each other and with standard U0 fuel.2
The major differences in the fuel rod designs are shown in Table II-6. In thistest, emphasis was placed on annular fuels in which the annular pellets are stackedwithin the rod cladding so that there is a vertical hole sealed inside the rod.This has the effect of reducing the plutonium in the core without changing the fuelrod size or spacing. The four rods containing cylindrical solid pellets and thefour containing dished pellets supplied the performance link between UO fuel of
2current design and mixed oxide fuel. These eight rods were also designed to showincre ental perfonnance differences between the three pellet geometries. SeeTable II-8. Tables II-7 and 11-9 present fuel rod design information.
The plutonium content in each rod was originally designed to be constant, andthe plutenium concentration was varied to make up for changes in fuel density andgeometry. Thus, the linear power characteristics of each rod were similar. Therods were positioned initially in the Big Rock Point reactor core to maintain thesesimilar power characteristics.
The 32-rod irradiation began with Cycle 7 of the Big Rock Point reactor inMarch 1969 and continued through Cycle 11, which ended in March 1974. It should benoted that during the early operation of Big Rock Point, the copper-nickel tubes inthe feedwater heater led to high crudding rates on the surface of all fuel rods inBig Rock Point. This in turn led to a restriction of 70% of rated power on thereactor power level and consequent derating of the specific power of the mixed oxidefuel rods during part of the operatir.g period. Nevertheless, the mixed oxide rodsoperated between 5 and 15 kW/ft. The 32 rods were examined visually after Cycles 7,8, 9,10, and 11.
Four rods were given destructive examinations after Cycle 7. Additional rodswere removed after each cycle for possible destructive examination. Botn the visualexaminations and the destructive tests in the hot cells showed no flaws or inade-quacies in sny of the fuel rods. Peak rod exposures of 23,100 mwd /MTHM were achieved. |
Il-25
_
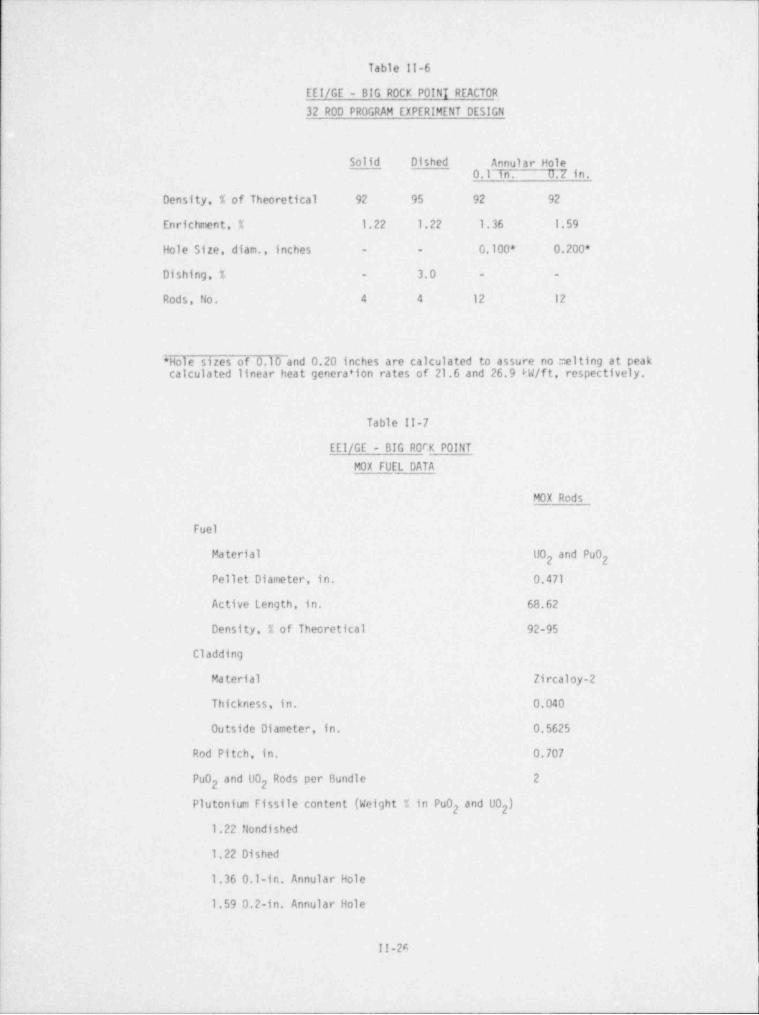
Vable II-6
EEI/GE - BIG ROCK POINI REACTOR,
32 ROD PROGRAM EXPERIMENT DESIGN
Solid Dished Annular Hole0.1 in. 0.2 in.
Density, % of Theoretical 92 95 92 92
Enrichment, % 1.22 1.22 1.36 1.59
0.100* 0.200*Hole Size, diam., inches - -
Dishing, % - 3.0 - -
Rods, No. 4 4 12 12
* Hole sizes of 0.10 and 0.20 inches are calculated to assure no melting at peakcalculated linear heat generation rates of 21.6 and 26.9 kW/f t, respectively.
Table 11-7
EEI/CE - BIG ROCK POINT
M0X FUEL DATA
M0X Rods
Fuel
Ma terial U0 and Pu02 2
Pellet Diameter, in. 0,471
Active Length, in. 68.62
Density,1 of Theoretical 92-95
Cladding
Material Zircaloy-2
Thickness, in. 0.040
Outside Diameter, in. 0.5625
Rod Pitch, in. 0.707
Pu0 and U0 Rods per Bundle 22 2
; Plutonium Fissile content (Weight % in Pu0 and 00 )2 2
1.22 Nondished
1.22 Dishedi
! 1.36 0.1-in. Annular Hole
I 1.59 0.2-in. Annular Hole|i
II-24
,I
{

Table II-8EE!/GE - BIG ROCK POINT MIXED OXIDE FUEL
THERMAL PERFORMANCE CIIAPACTERISTICS
'M0X fuel
Annular Hole
Solid Dished 0.1 in. 0.2 in.Fuel Pellets
Outside Diameter, in. 0.471 0.471 0.471 0.471
Inside Diameter, in. 0.0 0.0 0.1 0.2Cladding
Thickness, in. 0.040 0.040 0.040 0.040Outside Diameter, in. 0.5625 0.5625 0.5625 0.5625
Incipient Melting Temperatureof UO , F 5080 5080 5080 50802Fuel Density, % of Theoretical 94 94 94 94
Centerline Temperatureat 500,000 Btu /h-ft *F 5080 5080 4850 3950
2at 410,000 Btu /h-ft *F 4600 4350 4100 3250
Heat Flux for Incipient Melting.2Stu/h-ft 465,000 490,000 530,000 670,000
Area Fraction Molten at PeakHeat Flux 0.09 0.03 0 0
Table !!-9
EEI/GE - BIG ROCK POINT
FUEL PELLET SPECIFICATIONS THREE BUNDLES
No. of M0X Rods 204
Diameter (in.) 0.471 + 0.002
Annulus (in.) 0.150 1 0.005Density (' TD) 92.0 1 1.5Enrichment (%)
Pu Fissile /Pu + U l.462.30
4.95
8.16
2.04
235U 0.7
0xygen to Heavy Metal Ratio 1.98 - 2.02 I
Gas Content
Moisture (ut/g) <l2
Gas (ut/g) 28
Homogeneity 100% <500 um, at 95%confidence level
95% <100 um, at 95%confidence level
11-27

The fuel rod examination phase responsibility was assumed by the Electric PowerResearch Institute (EPRI). It was expected that fuel rod characterization, metal-lographic examination of fuel rod sections and microprobe analysis for fission producttransport would be included in the laboratory examination.
3.1.4.2 Bundle Irradiation Demonstrations
Three bundles containing 204 mixed oxide rods were designed to demonstrate theperformance of complete mixed oxide fuel bundles in the Big Rock Point reactor. Thenormal UO bundle mechanical design was used. M0X fuel loading was designed to be
2interchangeable with the UO fuel, with respect to performance and exposure capability.
2Bundles contained M0X rods of four different plutonium concentrations designed toprovide the desired power distribution for operation in the reactor through fourcycles. The peak fuel bundle exposure achieved was 17,500 mwd /MTHM. Special rodswere included for irradiation of some 80% fissile plutonium from the Dresden reactor.
The MOX rods all contained cold pressed and sintered fuel pellets of annular
and UO2 p wders. Thedesign prepared from mechanically blended ceramic grade Pu02annular hole was 0.150 inch diameter and the fuel matrix was nominally 92% of the-oretical density. The only rod to rod variation was the plutonium enrichment and theremovability of four of the rods.
Each bundle contained four of the removable fuel rods which could be examined tomonitor the performance of the fuel. The four cobalt corner rods were also removable.Twice the usual number of burnable poison (Gd 0 ) rods were used because of reduced23worth in a mixed oxide fuel bundle. Table II-9 shows the fuel pellet specifications
for the MOX rods.
The bundle irradiations were initiated with Cycle 8 in the year 1970 and continuedthrough Cycle 10 with all three bundles. Only one bundle was reinstalled for Cycle 11,as decribed later. Irradiation of this bundle continued through Cycle 11.
It has been reported informally that the fission product leakage tests showedevidence of rod failures in two of the bundles. Two rods in the third bundle failedin a decrudding operation during the Cycle 10 shutdown. With replacement of these tworods * the bundle was returned to the reactor for continued irradiation during Cycle 11.
On the basis of performance evaluation to date, the investigators felt that themixed oxide fuel in these three bundles, as well as in the 32 individual rods pre-viously irradiated, behaved similarly to UO fuel--with no abnormal behavior resulting
2
from the use of mixed oxide fuel.
*These rods also were to be examined by EPRI. See paragraph 3.1.4.1.
t
11-28
i

3.1.4.3 MOX Fuel Irradiation - Quad Cities Unit No. 1
The reload plutonium recycle fuel bundle was designed with the same envelope
dimensions as the initial core fuel. See CHAPTER IV. Section C-2.0. It could, there-
fore, be inserted, without restriction, into all locations within the reactor core atQuad Cities or other similar BWR cores. The basic lattice arrangement of 49 rods in aseven by seven array is the same 65 the inittel core fuel, with a centrally locatedspacer capture rod, and eight tie rods located symmetrically around the periphery ofthe fuel bundle.
Prototype M0X fuel bundles were of the same general mechanical configuration thatGE had been designing and manufacturing for the past 12 years, with gadolinium forreactivity control aurinentation. Gadolinium containing reload fuel had been thesubject of past AEC safet/ analyses for Dresden 'Jntt No.1. Big Rock Point, HumboldtBay Unit No. 3, Dresden Units No. 2 and No. 3 Quad Cities Units No. I and No. 2. NineMlle Point and others, and had been approved for use in each case. The mixed oxidefuel bundles also incorporated design improvements which had also demonstrated theirvalue in initial core fuel for Browns Ferry Unit No.1 Peach Bottom Unit No. 2 andCooper Station.
Two types of mixed oxide fuel astamblies were designed. Four assemblies of TypeA31 contained 40 of the 48 rods and were designed to be loaded in the central reactorpositions around the center control blade. The uranium enrichments in the UO fuel2
rods were the same as the standard U0 reload fuel, with the exception that 10 Type 52
high enrichment UO r ds were introduced to improve power distribution. The fcur2
identical Type A31 assemblies were designed to be irradiated under well controlledconditions in the center of the reactor. This would maximize the benefits of possiblefollowing program gama scans and isotopic measurements.
Two types of plutonium were utilized in the mixed oxide fuel assemblies: DresdenUnit No. I recycle Pu (80', fissile) and AEC Pu (90% fissile). The Dresden Unit No. Irecycle plutonium was used in reduced concentration in mixed oxide rods at the outsideof the mixed oxide rod island and provided some flattening of local power peaking aswell as improving the steam void dependence of the local power peaking. The remainingeight M0X rods were incorporated in a special peripheral fuel assembly design, TypeA32--two rods of each of the four mixed oxide rod fuel types. Irradiation of theType A32 assembly provides a directly comparable low power environment for fuel rodsidentical to those located in the central fuel assemblies, for future evaluations ofthe observed fuel performance. The environment at the periphery also results in thecoolest possible BWR neutron spectrum and will provide reactor physics data of signifi-cance. These BWR prototype fuel assemblies were inserted in Quad Cities Unit No. 1
c e in July 1974. The average burnup for the four center fuel assemblies was nearly
8. .) mwd /MTHM as of January,1976 when the assemblies were visually examined during
a reactor refueling outage. The peripheral fuel assembly reached a burnup of about3,000 mwd /MTHM.
Reports covering the eel /GE program are listed as References 26-38 at the end of
|this chapter. )
l
! 11-29
- -

_ _ _ _ _ _ _ _ _ - ..
.
3.1.5 Gulf United Nuclear Corporation /Comonwealth Edison
In the year 1957, Gulf United Nuclear Corp, oration and Comonwealth Edison joinedin sponsoring a plutonium recycle demonstration program in the Dresden Unit No. Inuclear power reactor for the overall purpose of gaining experience in all aspects ofthe recycle operation. Objectives of the Dresden Plutonium Recycle DemonstrationProgram w'ere to
- Establish the adequacy of a full-size plutonium recycle assently underactual operating conditions
Fabricate mixed oxide fuel assemblies on a sem1 production scale-
- Establish fuel cycle costs for M0X assemblies under cornerical conditions
- Evaluate reactor performance for a core containing a significant quantityof mixed oxide fuel
- Verify the adequacy of analytical models for calculating reactivity andpower distributions in mixed oxide assemblies
Obtain measured reactivity and local power distributions for mixed oxide-
assemblies by critical experiments prior to irradiation
- Obtain postirradiation isotopic and burnup data from hot cell examinationsof removed rods
The available plutonium for fabricating the demonstration assemblies had the isotopiccumposition shown in Table 11-10. This isotopic distribution is characteristic ofDresden fuel at 12.000 mwd /MTHM--rather than at discharge (23.000 mwd /MTHM), which
would have been preferable for demonstration assemblies. The total assembly plutoniumfissile content, 0.45 wt%, was maintained even though the isotopic composition differedfrom equilibrium discharge plutonium.
Table 11-10
~ ISOTOPIC COMPOSITION OF PLUT0NIUM FORDRESDEN PLUTONIUM RECYCLE ASSEMBLIES
Composition of Plutoniumwt%
238Pu 0.4
239Pu 71.3
240Pu- 20.6
241Pu 6.1
242Pu 1.6
Percent fissile = 77.4 wt%At 77.4 wt% fissile, the total plutonium contained in the 11demonstration assemblies was 6.6 kg.
|11-30 i

It was desirable from a fabrication and economic standpoint to use the standardDresden 00 fuel rods in non-plutonium bearing rod locations. The number of mixed
2oxide fuel rods and their location were established on the basis of utilizing self
. generation plutonium (0.45 wt% fissile plutonium per assembly) in the minimum numberof rods while still meeting the local power peaking limitations. Nine mixed oxiderods were chosen as a compromise between pnwer peaking and fabrication penalty. Withnine mixed oxide rods at a fissile plutonium content of 1.78 wt%, a beginning of life-peak-to-local power ratio of 1.28 was calculated for the assembly--the same as thereference UO beginning of life peak.
2
The specific locations of the mixed oxide assemblies in the Dresden reactor coreat the beginning of Cycle 7 were selected primarily to distribute these elementsthroughout the core. This permitted core unifomity and eliminated distortion of thecore by any unexpected performance of the mixed oxide elements. The two instrumentedassemblies were placed incore at locations along the north south axis. Four othermixed oxide elements were loaded adjacent to instrumented UO assemblies. Thus, any
2!effects of the mixed oxide assemblies on their uranium neighbors could be observed in
the instrument responses. The themal hydraulic characteristics of the plutoniemfuel assemblies which consti-bearing assemblies were identical to those of the U02
tuted the major portion of the reload batch.
After two cycles in the reactor core, the mixed oxide assemblies had attained anaverage exposure of 15,900 mwd /MTHM, a highest assembly exposure of 17.470 mwd /MTHM
and a peak pellet exposure of 22,830 mwd /MTHM. At that time all eleven mixed oxideassemblies were tested for fission product gas leakage: six appeared to contain
leaking rods and were given detailed visual inspection by closed circuit television.and the M0XThe inspections revealed end plug weld fractures in both the standard UO2
fuel rods. Clad blisters and a major rod fracture were also observed in UO r ds.2
Similar failures have been observed in the same rod locations in fuel assemblies con-taining only UO rods.
2
End plug weld fa Dures were the most common visual evidence of failure in alltypes of fuel rods and the only observed fault in the mixed oxide rods.
The five assemblies that did not show indication of leaks were reinserted forCycle 9, which started in March 19R. They were examined in September 1975 at the endof the cycle. Two fuel assemblies with fuel : lad leaks were removed. The averageburnup exposure of the 23 mixed oxide rods in the three fuel assemblies was 15,000 -17,000 mwd /MTHM.
Present plans are to perform post irradiation examination, including isotopiccomp'sition measurements of two rods from Cycle 8 and two rods from Cycle 10. Anotherfuel inspection is planned at the end of Cycle 10, expected in November 1976.
Details of the GUNC/Comenwealth Edison Program are available in the documents
listed in References 39 '';.ough 41 at the end of this chapter.
11-31
__ ._ _ ._ _ - ._ ___ _ _, ., .

3.1.6 Big Rock Point / Exxon /NFS
Exxon Multiple Cycle Plutonium utilization
One of the ongoing programs at Big Rock Point includes two uranium assemblies and
four mixed oxide assemblies. The four mixed oxide assemblies contain a total of96 plutonium-oearing rods. Two of these M0X assemblies with the 9 x 9 rod matrixdesign which characterized comnercial uranium fuel designs prevalent at that time,were inserted into the Big Rock Point core in May 1972. The maximum assembly exposureachieved so far is 17,8(0 mwd /MTHM. The remaining two assemblies, incorporating the11 x 11 fuel rod matrix design with smaller fuel pins and more heat transfer area,were inserted in April '973. The 11 x 11 design served as a forerunner to the conter-cial mixed oxide fuel design discussed later, and was first inserted in the Big RockPoint core in July 1974. The maximum assembly exposure reached on this design is15,400 mwd /MTHM. The two uranium assemblies provide a standard for reference inevaluating the four Exxon mixed oxide fuel assemblies. All six fuel assemblies haveremained in the core since first inserted. It is expected that assembly exposuresexceeding 20,000 mwd /MTHM will be achieved by the end of the year 1976 (Cycle 14).
Examination of the rods in the program is primarily nondestructive in nature.Typical poolside examinations include visual inspection and measurements:
- Visual inspection by periscope (individual fuel rods and overall assembly)
- Rod diameter measurements by profilometer
- Cladding integrity testing by eddy current
Pellet column length by gamma scan, eddy current, and plenum gauge methods-
- Pellet column continuity verification by garea scan
- Relative rod power measurements by gamma scan
Cladding growth measurements by mechanical fixture-
Destructive examinations are planned, however, for isotopic analysis and forfeatures revealed by the nondestructive examination, four rods with only 672 hours ofirradiation will be destructively examined for densification data.
As the rods from this program are discharged, the plutonium fuel will be recov-ered, refabricated, and reinserted into the reactor. This will allow gatheringisotopic data on multiple recycle plutonium.
NFS Demonstration Assemblies
Four demonstration assemblies manufactured by Nuclear fuel Services were inserted
in the Big Rock Point core in february 1973. Each assembly contains 73 mixed oxiderods; the first assembly has' accumulated an exposure of 13,700 mwd /MTHM. All of these
!!-32
.

mixed oxide assemblies have remained in the core since first inserted. Burnup to20,000 mwd /MTHM is planned unless fuel integrity is compromised. No plans have beenmade for destructive examination of these assemblies.
Exxon Commercial Irradiation
Irradiation of mixed oxide assemblies on a commercial scale began in July 1974with the insertion of eighteen assemblies, each of the 11 x 11 design with 24 mixedoxide rods. Eight additional mixed oxide assemblies were inserted during the springrefueling of 1976. Comercial irradiation of plutonium at Big Rock Point is currentlyrestricted to 50 kg.*
Experience
Experience with both developmental and comercial mixed oxide fuel at Bbj RockPoint has been extremely good. Off-gas activity--an indicator of fuel integrity--hasshown a downward trend over the last several years. The recently completed cycle 13had the lowest off-gas activity of any full length cycle. Examirctions of the fuel atthe end of this cycle revealed no leaking mixed oxide assemblies.
433.1.7 The Belgian Plutonium Recycle Program
The Celgian plutonium recycle program was initiated in the year 1959 underEURATOM spor:orship. It was described in 1971 as a "1000 man-year effort.'' Theprogram has emphasized plutonium recycle for LWR's and has included extensive testingas well as research and development. The Belgian 11.5 MWe BR-2 reactor was the firstLWR to be loaded with plutonium fuel; it t is since been supplemented with additionalcore loadings which carried burnup tests as high as 50,000 mwd /T. Mot; recent testsinvolve fuel elements in the BWR's at Dodewaard and Garigliano, Italy. PWR fuel testsare being conducted in the SENA reactor.
Some of the conclusions reached by the Belgians are sumarized as follows:
- In equilibrium recycle cores, the water to fuel ratio should be increased toachieve better plutonium utilization and to compensate for control rod worthdecreases; this water to fuel ratio increase is limited by the associateddecrease in temperature coefficients.
- There is an economic incentive to increase the burnup of mixed oxide fuelbeyond that which would be optimum for enriched uranium to compensate forhigher mixed oxide fuel fabrication costs.
- The first generation PWR plants can advantageously make use of plutoniumrecycle.
* Memo and Order from the USNRC, August 1,1975.
11-33

- The so called " plutonium island" fuel assembly type (plutonium zone surroundedby enriched uranium only fuel) is recommended for some core configurationswhere the shutdown r.argins remain practically unaffected; in the SENA casethe relative control rod worth is decreased by less than 2%.
- plutonium utilization in BWR's appears economically less attractive than inPWR's, but several BWR characteristics favor progressive conversion into
plutonium burners.
Relatively independent behavior of the fuel assemblies inside individual-
shrouds is observed when assemblies are separated by large water gaps
(flexibility to adapt the water moderator / metal ratio).
- The practice of power distribution flattening by control rod movements isreconnended.
- Routine utilization of multiple enrichments within the fuel assemblies givesa lower relative penalty for plutonium fuels.
3.1.8 CNEN/ENEL Plutonium Utilization Programs in Italy
in the year 1966, the Italians launched a major program of study and developmentrelated to plutonium utilization. The ENEL (Ente Nazionale per l'Energia Elettrica)program investigated the feasibility of plutonium recycling by loading mixed oxidefuel rods into operating reactors. CNEN (Comitato Nazionale per l'Energia Nucleare)worked on mixed oxide fuel technology, including physics, fuel element design, and
fabrication methods.
Under the CNEN program, a pilot plant at Saluggia undertook reprocessing ofirradiated mixed oxide fuels to separate both uranium and plutonium. The Reactor
Physics Laboratory at Casaccia Nuclear Research Center investigated the neutronicbehavior of M0X fuels in cooperation with Battelle Pacific Northwest Laboratory. Themixed oxide fuel rods for the initia* work in Italy were provided by the USAEC. A newplutonium laboratory was completed at Casaccia in the year 1968 and used thereafterfor fuel element fabrication research and development.
Mixed oxide fuel pins were irradiated in reactors in Sweden, Nomay, Germany,
England and France as well as in Italy. Many irradiations involved single rods forresearch investigations; the Swedish and German reactors accepted complete fuel assemb-lies for tests to burnups of 15,000 and 25,000 mwd /MTHM, respectively. The activitiesof the CNEN program provided a basis for planning experiments with mixed oxide fuelsin the ENEL nuclear power reactors. 2
The Garigliano BWR power station was used by ENEL for a plutonium recycle demon-
straF.on program which began in the year 1968. A total of 600 mixed oxide fuel rodswas incorpcrated into fuel assemblies for the Garigliano reactor. Critical experi-ments were performed with mixed oxide fuel assemblies, and irradiated fuel assemblies
II-34i
!

were examined in detail to determine how closely the calculated values agreed withmeasured values. Agreement was considered to be good, proving the validity of computer
codes for use with mixed oxide cores. Examination of 12 assemblies after the firstshutdown showed no abnormal conditions. This examination included both a fissionproduct gas leakage analysis and a visual examination. Postirradiatim metallurgicalexamination of a mixed oxide fuel rod after 10,000 mwd /MTHM peak pellet Nrnup showedthe plutonium distribution to be similar to the pre-irradiation distr ibution.
Four reload assemblies containing 96 mixed oxide fuel rods were provided byGeneral Electric in the year 1968 as part of a group of 24 plutonium bearing fuelelements for irradiation in the Garigliano reactor. Four of these were d schargedfrom the reactor in the year 1975, and 46 new mixed oxide fuel assemblies added. Thenew elements were fabricated by Fabbricazioni Nucleari at Bascomarengo, Italy, usingfuel rods fabricated by Belgonucleaire. All of the new assemblies are of the plutoniumisland type. To date, irradiated fuel from the Italian reactors has been processed atWindscale. England, and Mol, Belgium, for separation and purification of plutonium.Fabrication of fuel rods containing plutonium initially was performed for the Italiansby contractors in the United States, Germany, and other European countries, but theCNEN mixed oxide fabrication plant at Casaccia, Italy, is now in operation. Italy'scurrent plans are to recycle no more plutonium in the LWR's, but to recover theplutonium and save it for use in fast breeder reactors. The Italian experimentalfast breeder is scheduled for startup in the year 1978.
3.1.9 Obrigheim Reactor Demonstration of Mixed Oxide Fuel
In a cooperative program with the West Germany Kraftwerk Union (KWU), CombustionEngineering (CE), through ALKEM, fabricated mixed oxide fuel assemblies in Europe forthe Obrigheim reactor. The demonstration began in the year 1972 with insertion of asingle demonstration assembly. Eight additional mixed oxide assemblies were addedduring the September 1973 refueling. Since that time, more mixed oxide fuel assemblies
have been added and some have been removed. The announced intention is to continueadding mixed oxide rods until the equivalent of self generation levels is achieved.As of early 1976, one mixed oxide fuel assembly is in its third cycle,11 are in thesecond cycle, and 8 are in the first cycle. Because of a cooperative agreement withKWU, CE has complete access to data from this program. In addition to the Obrigheimdemonstration, there have been other CE/KWU programs to determine the irradiationperformanc'e and densification properties of mixed oxides and a program to dynamicallymeasure fuel properties, including densification, in the Halden, Norway, reactor.
The 111 assemblies, representing a collective exposure of 230 operating cycles,~
have only developed one leaking assembly--the prototype assembly in KWO. This assemblywas shown by postirradiation examination to have failed by internal hydriding and froma failure that was characteristic of similar failures in UO fuel assemblies. The
2* visual inspection of the mixed oxide assemblies together with destructive postirradia-
tion examination of 12 mixed oxide fuel rods did not show any significant differencesfrom rods from UO assemblies. The accumulated burnup of mixed oxide assemblies to i2date is shown in Table II-11.
I1-35

Table 11-11
SumARY OF THE IRRADIATION OF MIXED OXIDE FUEL ASSEMBLIESOPERATED IN KRAFTWERK UNION (KWU) SUPPLIED 7LANTS
Nuclear Year Number of Inserted Amount of NumberPower of Fuel Fuel Fissile Burnup, ofPlant * Insertion Assemblies Rods Pu, kg mwd /MTU Cycles Matrix Material.
VAK 1966 41 557 18.4 15,000 4 Natural uraniumKRB 1974 40 1400 94.0 22,000 2 Natural uraniumKWL 1970 1 15 1.0 18,000 5 Natural uranium
plus 232Th
MZFR 1972 8 296 11.8 12,000 4 Natural uraniumKWO 1977 21 3780 158.9 28,500 3 Natural uranium
*VAK: Versuchsatomkraf twerk KahlKRB: Kernkraf twerk RWE Bayernwerk (Gundremingen)KWL: Kernkraftwerk Lingen
MZFR: Mehrzweckforschungsreaktor (Karlsruhe)KWO: Kernkraftwerk Obrigheim
The KWU mixed oxide fuel rods were fabricated by ALKEM, while the assembly was
carried out by Reaktor-Brennelement Union (RBU); both organizations being affiliatesof KWU. The current capacity of ALKEM is 20 netric tons of heavy metal per year andwill increase to 40 metric tons in about 1980.
The KWU experience with mixed oxide fuel assemblies was sumarized by CE as
follows:
- 6,048 fuel rods in ill fuel assemblies
- 1 defected fuel assembly
- No significant restrictions in fuel cycle manag nent
- No licensing restrictions
Thus, from a technical point of view, KWU's experience is that the performance ofmixed oxide fuel assemblies is essentially equivalent to that of uranium oxide fuels.
3.1.10 Worldwide Plutc,nium Utilization Plans and Programs
Many countries have been developing and testing the technology required forrecycle of plutonium in thermal reactors. A large amount of plutonium is expected tohave been produced in commercial reactors around the world by the year 1980. Becausemost countries do not yet have an established reprocessing industry, it is uncertainhow much of this plutonium will be separated from spent fuel and purified in a formsuitable for recycling in nuclear fuel. To date, ruost national programs have con-centrated on mixed oxide fuel irradiations, demonstration and large reload programs,
design studies, critical experiments and economic and environnental assessments. Thefuel reprocessing aspects of the plutonium recycle studies are generally not so far
11-36

advanced. Although fuel reprocessing plants have optrated in the past, there are nocomercial plants now in operation anywhere in the world. A reprocessing plant inFrance may start up late in the year 1976. Others in England and the United Statesmy be started up a few years later but operations today are limited to pilot plantsor special noncommercial fuel reprucessing facilities.
In the United States, assuming favorable regulatory decisions, Allied-GeneralNuclear Services' Plant at Barnwell, South Carolina, is expected to start operationsin the early 1980's; similarly Nuclear fuel Services' Plant at West Valley, New York,is expected to start up again in the early 1980's after completing plannedmodifications.
In November 1974, the International Atomic Energy Agency's Panel on Plutoniumutilization in Thermal Reactors met in Karlsruhe, Germany, to review the currentstatus of plans and programs for plutonium utilization in the participating countries.The 1974 status reports for the various countries are sumarized in the followingparagraphs, adapted from a report prepared for the Electric Power Research Institutein Palo Alto, California, with updates from other sources.
Belgium: Belgium has a well established plutonium recycle development program.An industrial facility capable of producing 900 to 1,000 kg/ week of mixed oxide fuelhas been in operation since the year 1973. The Eurochemic fuel reprocessing plantprocessed 120 tons of fuel in the years 1973 and 1974, but has been shut down sincethat time. Demonstrations of the behavior of plutonium fuels have been in progressfor several years in PWR and BWR plants. In parallel, a few samples were and arebeing irradiated in material testing reactors to assess particular details of thespecifications or to investigate the fuel behavior at extreme conditions. Belgium haspurposely followed a policy of scaling up its mixed oxide fuel manufacturing capacityin order to fulfill not only its needs but to allow it to act as a subcontractor for
foreign reload suppliers.
Canada: The plutonium utilization program in Canada is directed towards solvingthe technical problems of plutonium recycle in CANDU (natural uranium, heavy water)reactors and establishing conditions for economic viability. To provide a focus forthese investigations, the Canadians have ptrformed a design study which used a con-ceptual design for a 1,200 MWe CANDU BLW reactor as the basis for an examination ofall aspects of the reactor system and fuel cycle. Similar studies are in progress, toexamine plutonium recycle in the CANDU PHW and the use of plutonium as the initial
233fissile feed for a thorium U fuel cycle in CANDU reactors.
A 3-ton per year pilot facility for the fabrication of mixed oxide fuel wascompleted in the year 1974. The plant is being operated to fabricate 200 to 300 CANDU
fuel bundles or 3.2 to 4.8 tons of fuel (Th and Pu). The intent is to obtain suffi-cient experience to permit reliabic 'uel fabrication cost estimates and to demonstratethe successful operation of mixed oxide fuel bundles in Canadian Power Reactors.Canada has no fuel reprocessing plant at present.
11-37
Federal Republic of Germany: Up to the year 1975, work in the Federal Republicof Germany concentrated on successful demonstration of recycle fuel behavior in thermalpower reactors. This included fuel fabrication at prototype scale, elements testingunder irradiation and the necessary applied software development. Phase I ended inthe year 1974 with design and initiation of testing of full Pu-reload cores followingthe self generation concept in both a PWR and BWR.
Phase II of plutonium recycle in the FRG for the years 1975 to 1980 will be con-ducted by a joint venture of utilities, the nuclear fuel recycling industry, and thegovernment. The primary goal of this program is to advance the technology of com-mercial plutonium recycling. Additional aims are to demonstrate technology by whichthe environmental impact of plutonium can be held as low as possible and to developtechnology needed for fast breeder fuel element production. Present plans call foroperation of a fuel reprocessing pLnt about the year 1985.
Plutonium utilization in thermal power reactors is considered to be a necessityat least in the next decade. The first core loads for fast breeder reactors are notanticipated prior to the year 1990. An immediate recycling of plutonium in thermalpower reactors will improve the economy of the nuclear fuel cycle because stored Puhas a high financial value. The Federal Republic of Germany does not plan to considerthe alternative of plutonium storage, either in purified form af ter chemical separationor in the form of spent fuel elements after discharge from the reactor. The keyobjectives in Pe recycling, the demonstrations of Pu technology, and the technical andeconomical aspects of Pu handling are also directed toward the development and in-troduction of fuel fabrication technology for fast breeder reactors.
France: France has decided to concentrate on the development of fast breederreactors; thus interest in the recycle of plutonium as fuel in thermal reactors is
secondary and at a low level. A few years ago it appeared that for about 10 years(1980 to 1990), France would have a great quantity of available plutonium and only afew fast breeder reactors. Today, it appears that spent fuel reprocessing has fallenbehind schedule and plutonium accumulation during this period will not be large. Afuel reprocessing plant at Le Havre with a capacity of about 800 tons of fuel per yearhas been constructed and may start up near the end of the year 1976.
India: India plans to utilize the plutonium produced in CANDU type reactors asfuel for fast breeders when they become available. A 40 MWth fast breeder test reactoris presently under construction at the Reactor Research Center near Madras to gainexperience with sodium cooled fast reactor _.
The annual spent fuel discharge from the Tarapur Atomic Power Station (two BRW'sat 200 MWe each) contains about 120 kg of Plutonium. The CANDU type power stations atRajasthan, Madras and Navora will produce spent fuel containing about 150 kg plutoniumper station per year. The fuel discharged up to this time from the Tarapur stationcontains about 200 kg of plutonium.
II-38
!

I
To operata tha Tarapur Atomic Power Station, enrichtd fual is imported from theUnitId States, but India is taking serious note of the developments being made in thetechnology of plutonium recycle. The capability to reprocess spent fuel is beingdeveloped at Tarapur, though no firm decision has been made to utilize M0X technology.A plant is being set up to fabricate the fuel elements for the fast breeder testreactor.
Japan: The Power Reactor and Nuclear fuel Development Corporation (PNC) is now
planning to initiate plutonium recycling at an early stage. It plans to irradiateplutonium fuel assemblies in JPDR (PWR, 90 MWth). Another program is under way toload four plutonium fuel assemblies in MIHAMA-1 (PWR, 340 MWe) by the year 1977 orlater. In the Advanced Thermal Reactor (ATR,165 MWe), reactor physics experinentshave been carried out since the year 1972; ATR is scheduled to be critical in 1976. Areprocessing facility (PNC, 200 tons / year) has been operated on a test basis since theyear 1975. The reprocessing facility is not currently scheduled for productionoperation. In addition, a conversion facility at PNC is scheduled to be operative inthe year 1977 for conversion of plutonium nitrate produced from PNC's reprocessingfacility to Pu0 which is used for fabrication of FBR, ATR, and Pu-thermal reactor
2fuel. The present fabrication capacity is insufficient for Pu fuel assembly loadingprograms, and therefore expansion is under consideration. The total amount of Puproduced from thermal reactors in Japan will increase to about 14 tons by the year1980.
The Netherlands: At present there are two operational thermal power reactors inthe Netherlands. One is at Dodewaard (BWR, 50 MWe), the second at Borssele (PWR,
450 MWe).
At the start of the second cycle of the BWR plant at Dodewaard, two prototype Pu-island elements were loaded. They remained in the core during Cycles 2, 3, 4, and 5.Average burnup cn removal was about 20,000 mwd /MTHM. At the start of Cycle 5. fourPu-island elements were loaded (two with gadolinium as burnable poison). At the startof Cycle 6, one fresh Pu-island element was added with gadolinium burnable poison.
In the near future, Dodewaard will most probably sell its plutonium. The produc-tion rate at equilibrium is about 12 kg fissile Pu per year. The Borssele plant willprobably recycle its own plutonium--with the exception of the plutonium of the firstdischarge. The production rate is about 78 kg fissile Pu per year at equilibrium(assuming no Pu recycling).
The sol-gel processes are being evaluated for application in producing spherical |fuel particles as feed material for vibratory compaction--the Vibrasol process. It
fuel rods for irradiation jhas been successfully applied to production of about 100 002purposes and has now been further developed for mixed oxide rods. Mixed oxide Vibrasolrods are at present under irradiation in the High Flux Reactor (HFR) at Petten. It is i
felt that the Vibrasol process has distinct advantages as a fabrication method, espe-cially for mixed oxide. Furthermore, as indicated by the irradiation of instrumentedfuel assemblies in the Halden Reactor, Vibrasol fuel rods may have better operatingbehavior, due to less interaction between the fuel and the cladding.
i
I 1
!11-39
|

_ _ . - . . . - ...... _._._
United Kingdom: The major research and development effort of the United KingdomAtomic Energy Authority (UKAEA) is directed towards the exploitation of the sodiumcooled fast reactor (SCFR). However, adequate expertise and manufacturing capacityfor producing plutonium bearing fuels for experimental purposes for either gas orwater cooled thermal reactors are being maintained by both the UKAEA and British Nuclearfuels Limited (BNFL). This could form the basis of development programs for plutoniumrecycling should the UK Electricity Generating Board require that option. If the UKdecides to develop the plutonium recycle option, the earliest date at which largescale recycling could commente is the year 1986. This timescale is set primarily bythe steam generating heavy water reactor (SGHWR) connissioning program and the desir-ability of a few years of successful operation experience with uranium fuel beforeintroducing plutonium recycle as fuel on a large scale. A demonstration plutoniumrecycle program would involve the irradiation of a series of trial assemblies beginningabout the year 1975, initially to check validity of possible manufacturing routesarising within the fabrication plant developnent program, and later to include studiesof the operational and fuel management aspects of recycle. Fuel for the initialstages of a demonstration prooram would be manufactured in laboratory and developmentfacilities which have already provided mixed oxide fuel that has been irradiated in anumber of different types of reactors. The fuel reprocessing plant in England hasbeen shut down since a chemical explosion that occurred in 1973. 6 When that explosion
occurred, the plant was starting up for a new processing campaign using the tritex(dibutyl carbitol) solvent extraction process. Fission product residues (mainlyruthenium-106) from previous processing operations were released inside the buildingand 35 employees received fission product contamination of skin and lungs. No healtheffects have been observed, and no offsite contamination occ; ed. Current plans callfor a 1,000 metric ton per year plant to be started up in the early 1980's.
| Sweden: The accumulated plutonium from Swedish nuclear power plants is estimatedto be 1.4 tons by 1980 and 15 to 18 tons by the year 1990. Because it appears improb-able that breeder reactors will be introduced concercially before the 1990's, it islikely that the plutonium will be recycled as fuel. This is not expected to startbefore the year 1919.
!
| Development work is in progress along several different lines. The criticalfacility KRITZ at Studsvik is large enough to accommodate full length assemblies, andmeasurements can be performed at different temperatures up to 250'C. At the plutoniumlaboratory at Studsvik, mixed oxide pellets have been produced for 10 years for
( internal experiments and, more recently, for AECL. Experimental fuel pins have beenirradiated with the aim of studying fabrication parameters.
Demonstration irradiations of plutonium fuel started in the Agesta PHWR in theyear 1966, in cooperation with the UKAEA. The first plutonium fuel to be used in anLWR is represented by three assemblies which have been loaded into Oskarshamn I.
ASEA-ATOM is responsible for the design and manufacture of the island-type assemblies,but since there is currently no fabrication of such elements on a comnercial scale inSweden, the mixed oxide rods were obtained from Belgonucleaire.
11-40
__ .-
3.2 Mixed Oxide Fuel Fabricatinn,
The mixed oxide fuel fabrication operation may begin with conversion of uraniumhexafluoride to uranium dioxide; it then involves special techniques for blendinguranium and plutonium oxide powders together, pressing the mixed oxides into pellets,sintering the pellets at temperatures up to 1.750*C, grinding pellets to final dimen-sional requirements, encapsulating pellets in Zircaloy or stainless steel tubing, andassembling the resulting fuel rods into fuel bundles or assemblies. More details onthese operations can be found in CHAPTER IV, Section D.
Because plutonium is much more radiotoxic than uranium, the incorporation ofplutonium into LWR fuels requires different fabrication techniques and equipment thanfor low enriched uranium fuel fabrication. Such techniques and equipment have beendeveloped for use in AEC programs over the past 30 years.
Fabrication and processing of M0X fuel are carried out in equipment and facilitiesdesigned for handling plutonium. In these facilities the plutonium is contained tothe maximum extent practicable in the process equipment itself, which in turn, islocated in glovebox enclosures, Where transfers are required from one glovebox
i opration to another, plutonium bearing materials may be handled in trays or othercontainers--scaled inside a plastic bag, a duct, or other enclosure to assure that noplutonium escapes during the transfer. The M0X fuel is similarly protected until itis sealed inside the cladding of the fuel rod. Af ter decontamination of the fuel rodsto remove all traces of plutonium from the outside surfaces, they are brought into thef uel assembly area where they may be handled directly and manually. This is done with
j appropriate measures to assure that employees are adequately protected from penetrating
radiation, which is substantially higher than from UO2 ' dS-
There are multiple levels of plutonium confinement in a plutonium fabricationfacility. Confinement, in this context, means a complete enclosure around the plu-
.{tonium, with the atmospheric pressure inside the contained volume maintained lower
'
than pressure in the surrounding area so that any leakage in the enclosure will drawmaterial inward rather than allow plutonium to escape outward. Confinement systems
! require complete enclosures and associated ventilation equipment. In a room thatserves as a confinement barrier, doors and other openings are normally closed, and theroom atmosphere is kept at a lower pressure than its surroundings.
The first level of confinement is the process vessel or equipment inside theglovebox; the second level is the glovebox or other equipment enclosure or a totallyenclosed transfer device. (In some plants another level of confinement is effected bydividing the processes into individual process areas which are totally separated fromone another, including separate ventilation systems.) Final confinement is providedby the building structure itself, designed as the ultimate barrier against releaseinto the environment, under all conservatively selected design basis conditions.
|Structures housing new plutonium fabrication facilities are required to be capable ofwithstanding the effects of natural phenomena such as tornadoes, hurricanes, earthquakes,and floods.
11-41
- -
_ _ _ _ _ _ - - -
. ..
Emergency power is provided to operate the ventilation systems in the event of apower failure. Air from each of the confinement areas is exhausted through at least
.
two high efficiency particulate air (HEPA) filters to remove particulate plutonium.
The design of plutonium fuel fabrication facilities is based upon the need toprotect plant workers from the toxicity of the element and to prevent release to theenvironment in quantities that could present a hazard to the general public. The costof a mised oxide fuel fabrication plant may be several times that of a plant of equalsize that processes only low-enriched uranium. CHAPTER IV. Section D, discusses
design of plutonium fuel fabrication facilities in more detail.
3.3 Reprocessing of Mixed Oxide fuels
During World War II, one major objective of the Manhattan Project was to produceand purify plutonium. Reactors were built at the Hanford Engineer Works for thespecific purpose of producing plutonium by the irradiation of natural uranium.Radiochemical processing plants were built to separate the plutonium from naturaluranium and f rom fission products contained in the irradiated uranium. Since thattime, the United States has produced plutonium and purified it by a variety of pro-cessing methods. Of these, the solvent extraction process is now employed almostuniversally.
The large scale separation of plutonium by solvent extraction (the Purex process),has been developed into a well tested industrial technology. In the United States,the processing has been done in Government owned plants and in one commercial facility.four privately owned fuel reprocessing plants have been built or are planned to handlethe fuel from LWR nuclear power reactors, separating uranium and plutonium from eachother and from fission products: Nuclear fuel Services (West Valley, New York) was inoperation from 1966 to 1972, and is now shut down for modification. Midwest fuelRecovery Plant (Morris, Illinois) has been constructed, but is not being operated be-cause of technical difficulties encountered in the preoperational tests. The difficul-ties are related to implementation of a new design concept for preparing and handlingthe solid uranium product and wastes, which have no connection with the solvent extrac-tion separation part of the process. The Barnwell Nuclear fuel Plant (Barnwell,South Carolina) is under construction, with the separations facility and the UF C0"~6version facility nearing completion. See CHAPTER IV, Section E, for details. Thefourth plant, Exxon's Nuclear Fuel Pecovery and Recycle Center (Oak Ridge, Tennessee),is under design.
In the processing of enriched uranium or plutonium, a potential hazard unique tothe nuclear industry must be dealt with; a nuclear chain reaction (criticality) canoccur in the processing equipment if too large a quantity of fissile material accumu-lates.under certain conditions. Ti.ere have been a total of six criticality accidentsassociated with the processing of highly en< hhed uranium or plutonium in the UnitedStates during the past 30 years. One, involving highly enriched uranium, occurred ina commercial facility; none has occurred with the low enriched uranium used in
11-42

connercial LWR fuels. Two occurred in the chemical processing of plutonium. In bothinstances the nuclear reactions caused only minor physical damage to the equipment andfacilities, but did result in radiation overexposures to some workers in the vicinity,and the death of one process technician. Brief summaries of two nuclear chain reaction
(criticality) incidents involving plutonium and four with highly enriched uranium, areincluded in paragraph 3.6 to give a clearer picture of the nature of this specialhazard. There have been no criticality accidents in commercial fuel cycle plants inthe past 12 years.
235Plutonium has a smaller critical mass than highly enriched U and a much smallercritical mass than the low enriched uranium used in LWR fuels. Therefore, increasingthe quantity of plutonium to be handled in fuel reprocessing also increases the needfor attention to be given to preventing accidental criticality. However, the recycleof plutonium compared to the uranium recycle does not necessarily indicate a corre-sponding increase in risk of criticality accidents. Built-in safety features such assafe geometry vessels, safe volumes, and other design features, and administrativecontrols are employed to prevent plutonium fror.. collecting in sufficient quantities toform a critical mass.
In the reprocessing of spent fuel, the high radiation levels associated withfission products and other radioactive naterials formed in the reactor far overshadowthe comparatively low radiation levels from plutonium and uranium. In the reproct:ssingoperations, the presence or absence of plutonium would have no effect on personnelexposures only after the plutonium is separated from the spent fuel. Also, after theunconsumed fuel is recovered, the presence or absence of plutonium in recycle fuel (infuel fabrication plants) makes a considerable diffe.ence in the radiological safetyprecautions to be employed--plutonium is highly radiotoxic due to the combination ofits specific radioactivity and biochemistry (see paragraph 2.4). The specific activity
of the predominant plutonium isotopes is about 100,000 times that of the uraniumisotopes. The potential physical effects of plutonium are also more serious, becauseit is retained in the body much longer than uranium and is absorbed and held incertain organs of the body.
The difference in the handling of plutonium and uranium in the fuel fabricationplant is the need to conduct plutonium operations in sealed gloveboxes--some withshielding and operated remotely--whereas many uranium processing operations can besafely perfonned without such isolation measures. Plutonium presents mnre severeproblems than uranium, if involved in an abnormal event that would allow escape fromprocessing equipment or storage facilities.
3.4 Effects of Plutonium Recycle on Transportation
For shipping from the nuclear power reactor to the spent fuel reprocessing plant,spent fuel elements are placed in large shielded shipping casks for transport eitherby rail or truck. Principal design criteria for the casks include important require-ments to assure that a cask will maintain its safety functions even in the highlyunlikely event that there is a severe accident. Adoption of criteria for spent fuel
11-43 j
l
l
i_ _ .

-. _ . - _ _ _ . - _ .
. shipping casks to handle mixed oxide fuels for LWR's would require provisions that take'
account of the higher heat content of these fuels, but it is not judged that thiswould require any significant change in the procedures or the shipping casks now used4'
for uranium spent fuels.<
The AEC (now ERDA) has extensive experience in the shipment of radioactive48,O ,50
5 materials, including plutonium. Analysis of accidents incurred in this ship-
ping experience indicates that probabilities of release and dispersion of radioactive,
material are very small. Shipment of these materials in the nuclear fuel cycle is4
usc *1y accomplished by means of truck or rail transportation modes, but some shipmentsnay be made on aircraft. Historically, plutonium shipments in some military programshave been made by air and other modes. Regulations of shipments of radioactivematerials have historically not differentiated among transport modes. Recently publicconcern has been raised about air shipments of plutonium and other special nuclearma terial s.51 A Federal law r(cently enacted in the United States requires the U.S.S2
Nuclear Regulatory Commission to prohibit its ifcensees from transporting plutonium by
j,air until it has certified to the Joint Comittee on Atomic Energy of the Congress
"that a safe container has been developed and tested which will not rupture undercrash and blast testing equivalent to the crash and explosion of a high-flying aircraf t."Except for plutonium contained in a medical device designed for individual humanapplication, the restriction applies to air transport of plutonium in any fonn orquantity, whether for exports, imports, or domestic shipments. As a result of thislaw, the Nuclear Regulatory Comission has initiated a program to (1) evaluate theconditions which could be produced in severe accidents; (2) develop qualificationcriteria prescribing appropriate perfonnance requirements and acceptance standards forpackages used to transport plutonium by air; and, (3) perform a series of physicaltests and engineering studies to demonstrate that a plutonium package design meets thequalification criteria. Af ter a package design has been demonstrated to meet the
i criteria, it will be certified as required by law.a
NRC regulations governing transportation of radioactive materials (1 71.42,10 CFR Part 71) require that plutonium in excess of 20 curies per package be shippedas a doubly contained solid af ter June 17, 1978. See CHAPTER IV. Section G, for amore detailed discussion.
4
Shipment of plutonium compounds or of new mixed oxide fuel assemblies to LWR'swould require some changes in container design because of the toxicity, heat generationproperties and shielding requirements. Safeguards required to prevent theft or misuseof the plutonium is an added consideration in shipments of plutonium. This subject isreviewed in detail in the GEEM0 draft supplenent for safeguards considerations.
(. 35 Effects of Plutonium Recycle as Fuel on Waste Panagement
in the bulk of the fuel reprocessing activities conducted to date, both the highlevel radioactive wastes, which contain all of the fission products separated in thefirst cycle solvrat extraction system, and the concentrated wastes from subsequentprocessing operations have been stored as liquids in underground tanks. In planning
11-44
_ - .. . - . _ . _ . _ _ _ _ _ _ _ _ . _ _ _ _ _ - -

|1
,
for long term storage of high level wastes from cortnercial reprocessing plants, theNRC requires conversion of high level wastes to a solid fom for permanent storage(Ab % F,10 CFR Part 50). Meanwhile, evaluation of geological famations andsites n being continued by ERDA, with the eventual goal of using these fomations forpermanent disposal of the waste in a Federal repository. Extensive effort is beingdevoted to the details of packaging requirements, and the physical and chemical fomof the high level waste that might be required for such storage.
The quantity of radioactivity involved in the nuclear fuel cycle will not beaffected greatly by the implementation of uranium and plutonium recycle in comparisonto no recycle. If spent fuel is not recycled, it will be stored with essentially allthe radioactivity still contained the fuel. If spent fuel is reprocessed to recyclethe uranium or to recycle both uranium and plutonium, the bulk of the radioactivewaste from reprocessing will be solidified and stored as high level waste. Thesolidified high level waste will contain most of the radioactivity which otherwisewould have been stored in the spent fuel; but, with the uranium removed, it willoccupy about half the volume even af ter the addition of chemicals to convert it tosolid form.
The volume of other-than high level radioactive wastes from reprocessing and other
recycle operations will increase, but the wastes from mining, milling UF6 C0"*" 5 U"'and enrichment will decrease by about 22%. The major environmental impacts are thereductions in mill tallings and in the releases of radon from mining and millingactivities. This is partially offset by the releases of tritium, krypton-85 andcarbon-14 from reprocessing operations and by the increase in plutonium contaminatedwastes from reprocessing and M0X fuel fabrication operations. Some differences inwaste composition as a result of plutonium recycle should be no'ed. The transuraniumelements such as americium and curium will be formed in substantially greater quanti-ties in mixed oxide fuel than in UO fuel, and these are expected to be completely
2,
passed to the reprocessing wastes. If plutonium is not recycled, it will be disposedof as an impure solid in a manner similar to the high level wastes. With plutoniumrecycle about 0.5% of the plutonium in fuel reprocessing operations is expected toremain in the radioactive wastes. Because of the increased quantities of transuraniumelements in mixed oxide fuels, the decay heat released 10 years after discharge fromthe reactor will be about 25% higher than from U0 fuel. Waste container designs now
2being developed will be able to accommodate this higher heat generation. For adetailed discussion on radioactive waste management, refer to CHAPTER IV. Section H.
3.6 Surinary of Accident Experience
A summary of operational accidents in U.S. Government facilities, from 1943 to1970, is given in WASH-1192.5 For those facilities and operations having a generalresemblance to the various mixed oxide fuel cycle steps (in the areas of fuel reproces-sing, fuel fabrication, and scrap recovery) there have been a number of accidents.1 hose which involved the possibility of environmental release include the following:
i'
11-45
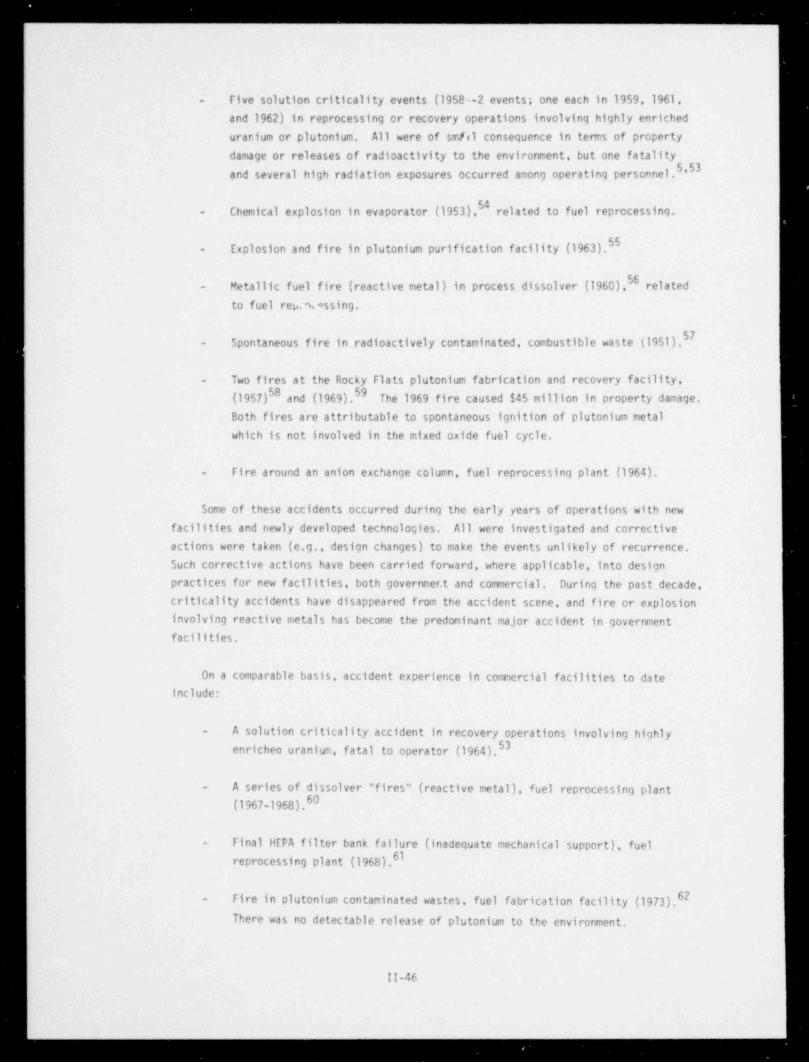
_ _ _ _ _ _ _ _ _ _ _ _ _ _ _ - - - -_
- Five solution criticality events (1958-.-2 events; one each in 1959, 1961,and 1962) in reprocessing or recovery operations involving highly enricheduranium or plutonium. All were of sr/sl consequence in tems of propertydamage or releases of radioactivity to the environment, but one fatalityand several high radiation exposures occurred among operating personnel.5,53
Chemical explosion in evaporator (1953),54 related to fuel reprocessing.-
Explosion and fire in plutonium purification facility (1963).55-
- Metallic fuel fire (reactive metal) in process dissolver (1960),56 relatedto fuel rep m ssing.
- Spontaneous fire in radioactively contaminated, combustible waste (1951).57
- Two fires at the Rocky Flats plutonium fabrication and recovery facility,(1957)58 and (1969).59 The 1969 fire caused $45 million in property damage.
Both fires are attributable to spontaneous ignition of plutonium metalwhich is not involved in the mixed oxide fuel cycle.
Fire around an anion exchange column, fuel reprocessing plant (1964).-
Some of these accidents occurred during the early years of operations with newfacilities and newly developed technologies. All were investigated and correctiveactions were taken (e.g., design changes) to make the events unlikely of recurrence.Such corrective actions have been carried forward, where applicable, into designpractices for new facilities, both governmer.t and comercial. During the past decade,criticality accidents have disappeared from the accident scene, and fire or explosioninvolving reactive metals has become the predominant major accident in governmentfacilities.
On a comparable basis, accident experience in comercial facilities to dateinclude:
- A solution criticality accident in recovery operations involving highlyenricheo uranium, fatal to operator (1964).53
i
, A series of dissolver " fires" (reactive metal), fuel reprocessing plant-
! (1967-1968).60
{ - Final HEPA filter bank failure (inadequate mechanical support), fuelreprocessing plant (1968).61
- Fire in plutonium contaminated wastes, fuel fabrication facility (1973).62There was no detectable release of plutonium to the environment.
!!-46
_ _ ___ _

__ - - _ _ _ _ _ _ - _ _ _ _ _ _ _ _
Explosion in plutonium glovebox, fuel fabrication facility (1972).63 About-
5.6 9C1 of alpha activity was released via the stack.
The above adverse experiences in the nuclear field to date are a matter ofrecord, and, in the context of this discussion, the experiences at the Rocky Flatsplant are most prominent among them.64.65 There is no question that adverse experi-ence must be taken into account when projecting future expectation, but the mostconstructive use of past adverse experience is as guidance for present and futureactions. The assessment of future expectations properly includes an assessment ofall pertinent experience, good and bad, along with an assessment of procedures,practices, regulatory guides, regulations, improved technology, etc., that have comeinto being and have an important bearing on future actions.
The measured and estimated quantities of long-lived alpha activity released fromthe Rocky Flats plant during its first 20 years of operation are sumarized inTable !!-12.66 The removal of contaminated oil from the protected confines of the
plant for long tenn outside storage effectively compromised the plant's ability toconfine alpha activity. It did so to a much greater extent than did the 1957 fire,which extensively damaged the containment filter system of the building in which thefire occurred.
Table II-12
LONG-LIVED ALPHA ACTIVITY RELEASED FROM ROCK ( FLATS
Date Circumstances Guantity_
1958-1968 Leakage of Pu contaminated machine oil stored 5.3 Ci to soil at drumat the Rocky Flats site storage area
1957 Fire in Bldg. 771 resulting in major damage 60 pC1, airborne, mostlyto filter system during fire
1969 Fire in Bldg. 776 0.2 pC1, airborne, over6-day period during andafter fire
1953-1970 Nonnal effluent releases (cumulative) < 41 pCi, airborne *91 pC1, liquid effluents
*18 pCi could be subtracted from this amount as a contribution of the 1957 fire or, morespecifically, as an indication of high samples observed in October 1957 from contaminationin the ductwork and plenum following restoration of the filter system. Additionally, itshould be noted that daily stack samples for airborne alpha particulates were normallybelow detectable limits so that the cumulative numerical value is der;ved by taking theminimum detectable quantity as the maximum possible release. It can be inferred thatnormal alpha particulate releases averaged something less than 1.3 pCi per year:
<41 - 18 pCi l= <l.3 uCi/yr18 years
|
|\
II-47|
|

- - .-.
Practices adopted for the design, construction, and operation of government-facilities, and regulations governing comparable practices in licensed commercialfacilities have been influenced as a result of past experience. Among other things,1
they are intended to make past adverse experience, such as that at Rocky flats, highlyunlikely of recurrence. Moreover, recognizing that human error and equipment failuresare unavoidable in an absolute sense, considerable effort has gone inte the continuingdevelopment of regulations and regulatory guides to provide criteria for the increasedprotection of the public, operating personnel and facilities in the event that sucherrors or failures do occur.
!
The specific and extensive modifications made to all plutonium handling facilitiesat Rocky Flats subsequent to the 1957 fire (especially the substitution of flame
1 resistant filters for those fonnerly used, and the addition of fire protection in thefilter banks and plenums) were clearly responsible for the vastly improved containmentof alpha activity during the 1969 fire. The new plutontune recovery facility now
'
under construction at Rocky Flats (as a replacdynt for older facilities) is being;
built under criteria that should provide even greater assurance that the facility will.
be able to confine plutonium releases to exceedingly small values, even under severe4
abnormal circumstances--including natural events, such as tornados.07'
i
The criteria governing the design and construction of the new Rocky Flats facilityapply to all comparable government facilities under construction or to be built in thefuture. Strictly comparable criteria exist as regulatory guides for commercialfacilities that process or fabricate plutonium.68,6 .70,71 In addition, commercialfacilities are required to meet the effects of natural phenomena such as floods,tornados, and earthquakes. The assumed characteristics of the various model mixed
; oxide fuel cycle facilities, and the assessment of future expectations with respect'
to their performance under routine and accident circumstances, are based on thecurrently applied regulations, guides, criteria, and practices. *
<
!
!
i
ld
!!-48||
. _. . - l
REFERENCES
1. O. J. Wick, Ed., " Plutonium Handbook," USAEC. New York: Gordon and Breach, SciencePublishers, 1967.
2. V. O. Votinen, B. R. Leonard, Jr., and R. C. Liikala, "The Neutronics of PlutoniumRecycling," Nuclear Technology, Vol. 18, No. 2. May 1973, po. 115-140.
3. J. M. Cleveland "The Chemistry of Plutonium." New York: Gordon and Breach, SciencePublishers,1970.
4. USAEC, Division of Operational Safety, " Operational Accidents and Radiation ExposureExperier.ce," Report No. WASH-1192, 1971.
5. W. R. Stratton, "A Review of Criticality Accidents," Los Alamos Scientific Laboratory,Report No. LA-3611,1967.
6. . W. H. Langham, "The Biological Considerations of Nonnuclear Incidents Involving NuclearWarheads," University of California, Report No. UCRL-50639 Lawrence Radiation Laboratory,Berkeley, California, 1969.
7. L. H. Hempelmann, W. H. Langham, C. R.- Richmond, and G. L. Voelz, " Manhattan ProjectPlutonium Workers: A Twenty-Seven Year Follow-up Study of Selected Cases," HealthPhysics, 25: 461-479, 1973.
8. J. W. Healy, "A Proposed Interim Standard for Plutonium in Soils," Los Alamos ScientificLaboratory Report No. LA-5483-MS, Los Alamos New Mexico, January 1974.
9. E. M. Romney, H. M. Mark, and K. H. Larson, " Persistence of Plutonium in Soil. Plantsand Small Mansnals," Health Physics,19: 487-491, October 1970.
10. Nuclear Technology, " Plutonium Utilization in Comercial Power Reactors," pp. 107-317Vol. IS, No. 2, August 1972.
11. Nuclear Technology, "A Review of Plutontul Utilization in Thermal Reactors," pp. 78-176Vcl. 18, No. 2. May 1973.
12. W. R. Smalley, "Saxton Core II Fuel Perfonnance Evaluation Part 1: Materials," WCAP-3385-56,September 1971.
13. R. J. Nodvik, "Saxton Core II Fuel Performance Evaluation, Part II, Evaluation of MassSpectrometric and Radiochemical Analyses of Irradieted Saxton Plutonium Fuel," WCAP-3385-56,July 1970,
14. R. L. Thompson, A. J. Impink, and R. W. Colombos, "Saxton Core II Nuclear Operations- Sumary," WCAP-3385-55, December 1970.
15. T. E. Caye, "Saxton Plutonium Project. Quarterly Progress Report for the Period ending3/31/72," WCAP-3385-31, November 1972.
16. W. L. Orr, H. I. Sternbert, et al., " Nuclear Design of the Saxton Partial Plutonium Core,"EURAEC-1490, WCAP-3385-51 December 196r
>
17. E. G.- Taylor, " Critical Experiments for the Saxton Partial Plutonium Core," EURAEC-1493,WCAP-3385 'i4, December 1965.
18. E. A. Bassler, D. C. Fishcher, et al., * Mechanical, Thermal and Hydraulic Design of SaxtonPartial Plutonium Core," EURAEC-1491, WCAP-3385-52, December 1965.
,
19. A. Biancheria R. N. Stanutz, et al. , " Materials Design and Fabrication of the Saxton,
Partial Plutonium Core," EURAEC-1492 WCAP-3385-53, December 1965.i
11-49

|i
20. W. R. Smalley. " Evaluation of Saxton Core III Fuel Materials Performance " WCAP-3385-57,July 1974.
21. " Economic Utt1tration of Plutonium in Pressurized Water Reactors," Final Report WCAP-7160Vol. 1. February 1968.
22. " Economic Utilization of Plutonium in Pressurized Water Reactors," Final Report. WCAP-7150Vol. 2. february 1968.
23. J. Haley, "EEI - Westinghouse Plutonium Recycle Demonstration Program Progress Report forthe Period Ending Dec. 1970." WCAP-4167-2, March 1971.
24. J. B. Melehan, "EE! - Westinghouse Plutonium Recycle Demonstraticn Program Progress Reportfor the Period 10/71 - 3/72." WCAP-4167-4, December 1972.
25. T. W. Wallace. "EE! - Westinghouse Plutonium Recycle Demonstration Program Progress Reportfor the Period 4/73 - 9/73." WCAP-4167-6, December 1973.
26. " Plutonium Utilization in Bolling Water Reactors. Phase 1. Final Report." GECR-5566November 1967,
27. " Plutonium Utilization in Bolling Water Reactors, Phase II,1969 Annual Report." NEDC-12111,July 1970.'
28. " Plutonium Utilization in Boiling Water Reactors, Phase II January - June 1970," NEDC-12152September 1970.
,
29. " Plutonium utilization in Boiling Water Reactors. Phase II Semi-An' :a1 Report. July -December 1970," NEDC-12198.
30. 5. Y. Ogawa. D. L. Zimmerman, " Plutonium Utilization in Bolling Water Reactors, Phase II,Cost-Irradiation Examination of Four Fuel Rods Af ter One Cycle of Operativ.. in Big RockPoint Reactor," NEDC-10387. July 1971.
31. " Plutonium utilization in Boiling Water Reactors, Phase !! Semi-Annual Report, January -June 1971." NEDC-10586, December 1971.
32. " Plutonium Utilization in Bolling Water Mactois. Phase II Semi-Annual Report, July -December 1971." NEDC-10747. November 197L
33. " Plutonium utilization in Bolling Water Reactors Phase II Semi-Annual Report. January -June 1972 " NEDC-19796, January 1973.
34. T. L. Krysinskt. "Dresden 1 Plutonium Recycle Program, Semi-Annual Report for Pcriod Ending12/31/73." GU-5309 January 1974.
35. T. L. Krysinski, and M. Wan. "Dresden 1 Plutonium Recycle Program. Semi-Annual Report forPeriod Ending 6/30/13." GO-5304, June 1973. i
36. G. Hamilton. "Dresden 1 Plutonium Recycle Program. Semi-Annual Report for Period Ending12/31/72." CU-5290, January 1973.
'
37. G. Hamilton. "Dresden 1 Plutonium Recycle Program. Semi-Annual Report for Period Ending6/30/72." GU 5287. January 1973.
38.' M. P. LaBar. " Mechanical Design of the Dresden 1 Mixed Oxide Demonstration Assemblies."! GU-5292, March 1973.
,
,
| 39. L. D. Hower, Jr., " Mixed Oxide Fuel Pellet Fabrication and Fuel Rod Assembly for Dresden 1Batch 7 Reload." GU-5308 January 1974.
;
40. ' P. K. Doshi, and W. Brooks. "Dres' den Plutonium Demonstration Program. Proof Test Facility -,
Experiments and Analysis," GU 5285, October 1972..
41. G. Grochowski, G. Hamilton, and S. Israel, " Nuclear Design. Economics, and Safety Analysisi of the Dresden 1 Mixed Oxide Demonstration Assemblies," GU-5291 December 1972.|
,
l
II-50c|
|
. . __ ~ . _ - _. . _ _ _ _ _ . _ _ . - - - _ . . _ _ _ -- _ ____ _.___
42. L. Sani, G. Schileo, " Pluton 1;m Utilization in Thennal and Fast Reactors, Peaceful Usesof Atomic Energy," Proceedings of the Fourth International Conference, Geneva,1971,published by United Nations (New York) and International Atomic Energy Agency, Vienna,1972.
43. H. Bairtot and H. Van Den Broeck, " Plutonium Recycling in Light Water Reactors, PeacefulUses of Atomic Energy," proceedings of the Fourth International Conference, published byUnited Nations (New York) and Internat;onal Atomic Energy Agency, Vienna, 1972.
44. A. Artema, U. Belelli, and L. Sant, " Assessment and Experimental Investigation ofPlutonium Potential in ENEL Water Reactors, Plutonium as a Reactor Fuel," Proceedings ofthe Symposium at Brussels,1967, published by International Atomic Energy Agency, Vienna,1967
45. B. A. Zolotar EPRI Memo to limited distribution, "IAEA Panel on Plutonium Utilizationin Thermal Power Reactors; November 25-29, 1974, Karlsruhe, Germany," December 17, 1974.(Copy furnished to NRC Public Document Room)
46. E. C. Williams, Report by the Chief Inspector of Nuclear Installations on the Incidrnt inBuilding B204 at the Windscale Works of British ''uclear Fuels Limited on 26 September1975." British Department of Energy Report No. (W) P-11551, July 1974, Her Majesty'sStationery Office, 49 High Holborn, London, WCIV6HB,
47 E. R. Johnson, " Plutonium, Nuclear Materials Management," Journal of the Institute forNuclear Materials Management, Spring 1973.
48. D. E. Patterson, "The Accident Experience of the USAEC in the Shipmer!t of RadioactiveMaterial," Proceedings of the Second International Symposium on Packaging and Trans-portation of Radioactive Materials (CONF-681001), p.199 (1968).
49. W. C. McClugg ge, "The AEC Accident Record and Recent Changes in AEC Manual Chapter 0529,"a WL-SA-3906 1971).
50. A. W. Grella, "A Review of Five Years Accident Experience in the U.S.A. Involving NuclearTransportation (1971-1975)," Presented at the IAEA Seminar on Transportation on RadioactiveMaterials in August 1976.
51. New York vs. NRC et al., U.S. District Court, Southern District of New York, May 5,1975.
52. Public Law 94-79, August 9,1975.
53. H. C. Paxton, " Criticality Control in Operations with Fissile Material," LA-3366 (REV.)National Technical Information Service, Springf uld, VA 22151, November 1972, pp. 3-6.
54. "USAEC Serious Accidents, Issue #41," TID-5360, March 23,1953, p. 58.
55. "USAEC Serious Accidents, Issue #237." TID-5360, December 4, 1964, p. 23.
56. Nuclear Safety, Vol . 2, #4, p. 52; TID-5360, Suppl. 3, p. 20,1961.
57. "A Sumary of Accidents and Incidents Involving Radiation in Atomic Eneray Activities, June1945 through December 1955 " TID-5360. Technical Infonnation Center, Oak Ridge, TN 37830,1956.
58 "USAEC serious Accidents. Issue #130 " TID-5360, Suppi. 2, Navember 30, 1957, p. 23.;
1
59. "USAEC Serious Accidents, Issue #306 " December 1, 1969.)
60. Nuclear Fuel Services, Inc. "7th Quarterly Report for Oct.-Dec. 1967," January 29, 1968,Also "8th Quarterly Report for Jan.-Mar.1968," May 6,1968.
Gl. "CO:I Investigation Report," October 5,1968; NFS, License No. CSF-1, Docket No. 50-201.
62. "R0 Inspection Report," No. 70-1193/73-04, May 1973.
63. "R0 Inspection Report," No. 70-903/73-01, January 1973.
|
11-51,
,
|

64. S. E. Poet and E. A. Martell, " Plutonium-239 and Americium-241 Contamination in the DenverArea." Health Physics, 23, pp. 537-584, October 1972.3
65. P. W. Krey and E. P. Hardy, " Plutonium in Soil Around the Rocky Flats Plant," HASL-235,1970.
66. S. E. Hannond, " Industrial-Type Operations as a Source of Environmental Plutonium,"Proceedings of an Environmertal Plutonium Symposium, August 4-5, 1971, LA-4756, National i
Technical Information Service, Springfield, VA 22151. l
67 Environmental Statement Plutonium Recovery Facility, Rocky Flats Plant, Colorado,WASH-1507, January 1972, USAEC, Washington, D.C.
68. Regulatory Guide 3.12, " General Design Guide for Ventilation Systems of PlutoniumReprocessing and Fuel Fabrication Plants," August 1973, U.S. Atomic Energy Connission,Directorate of Regulatory Standards.
69. Regulatory Guide 3.16. " General Fire Protection Guide for Plutonium Processing and FuelFabrication Plants," January 1974.
70. Regulatory Guide 3.2, " Efficiency Testing of Air-Cleaning Systems Lontaining Devicesfor Removal of Particles," January 1973.
71. Regulatory Guide 3.20. " Process Offgas Systems for Fuel Reprocessing Plants," February1974.
.
11-52

4 s,.s a n u g n -ea,< .n- m- ,m-., e -- s - s- n 4 - w.- --,aw
i
GESMG:
CHAPTER III|
PROJECTED PLUT0NIUM RECYCLE INDUSTRY't
a
J
I
,
!
,
- -, - w~-

. _ _ _ _ _ _
CHAPTER III
PROJECTED PLUT0NIUM RECYCLE INDUSTRY
Paragraph Page
SUMMARY.................................... .......................... ............ III-l
1.0 INTRODUCTION.................................................................. Ill-6
2.0 CONSUMPTION OF ENERGY IN THE U.S......................... .. ......... ....... III-7
2.1 Relationship of Energy Consumption to Gross National Product............. III-7
2.2 Forecasts of Future Rates of Energy Consumption. . . . . . . . . . . . . . . . . . . . . . . . . III-73.0 POTENTIAL ENERGY RESOURCES.................................................... III-13
3.1 Fossil Fuels...... ......................... ............................ III-13
3.2 Hydro Tida l , and Geotherral Resources. . . . . . . . . . . . . . . . . . . . . . . . . . . . . . . . . . . III-14
3.3 Solar Energy........................................... ................. 111-14
3.4 Uranium.................................. III-15.......... ........... .......
3.5 Thermonuclear Fuels............................................ ......... III-15
3.6 Consumption of Resources................ ........... .................... III-16
4.0 ELECTRICAL ENERGY................ III-17. ..................... ....... ...... ....
4.1 Growth i n the Genera tion o f Electri ci ty. . . . . . . . . . . . . . . . . . . . . . . . . . . . . . . . !!!-17
4.2 Technologies Capable of Supplyi ng Electrici ty. . . . . . . . . . . . . . . . . . . . . . . . . . III-194.2.1 Fossil Fuel Power... . .................................. ..... .. III-19
4.2.2 Hydroelectric Power............................ .................. III-22
4.2.3 Geothermal Power....................... 111-22.........................
) 4.2.4 Solar Power.. ........................ .. ....................... III-23 i!4.2.5 Thermonuclear Power...................... .................... ... III-25
4.2.6 Nuclear Power.................................... . .............. 111-25
4.2.7 Conservation................................ ............. .. III-27...
4.2.8 NRC Conclusions................................................... III-29
4.3 Growth in Nuclear Electric Generating Capacity.......................... III-29
5.0 ROLE OF PLUT0NIUM RLCYCLE................................................... . III-31
5.1 Domestic Uranium Resources and Relation to Use of LWR's..... ............ III-31
5.2 Availability and Dependence on Foreign Supplies.......................... III-33
5.3 Relationship Between Pu Recycle and the Long Term Nuclear Option......... III-335.4 Availability of Plutonium............................ ....... III-34.... .....
6.0 THE LWR INDUSTRY IN THE YEAR 2000...... ............ ........... ............. III-34
6.1 The Components of the LWR Industry....................................... 111-38
6.1.1 Reactors............... .......................... ......... . III-38..
6.l.2 Mixed Oxide Fuel Fabrication........ . III-39................ .........
6.1.3 Fuel Reprocessing............................. ... . . III-40..........
6.l.4 The Supporting Uranium Cycle. III-40........... ................ ... .
6.1.4.1 Mine-Mill Complexes.............. ............ .. ....... III-41
6.1.4.2 UF Conversion............................. ........... . III-4266.1.4.3 Uranium Cnrichment. III-43.....................................
6.1.4.4 U0 Fuel Fabrication....... ............................ III-432
)

TABLE OF CONTENTS (Cont'd)
Paragraph Page
6.2 Tra ns po r ta t i o n . . . . . . . . . . . . . . . . . . . . . . . . . . . . . . . . . . . . . . . . . !!!-44.. ..... ....
6.3 W a s te Ma n a g emen t . . . . . . . . . . . . . . . . . . . . . . . . . . . . . . . . . . . . . . . . . . . . . . . . . . . . . . III-45
6.3.1 No Recycl e o f Urani um or Pl u toni um. . . . . . . . . . . . . . . . . . . . . . . . . . . . . . 111-46
6.3.2 Recycle of Uranium Only or Recycle of Both Uranium andPlutonium....................................................... III-47
APPr.NDIX A COMPUTER PRINTOUTS FOR CENTERLINE CASE (LOW GROWTH WITH NO BREE0ER)... III(A)-1
APPEi! DIX B GROWTH PROJECTIONS FOR NUCLEAR GENERATING CAPACITY..... .. III(B)-1........ .
REFERENCES................................... .... .. .... ...................... . III(R)-1
1
11
_ . _ _ _

i
CHAPTER III
PROJECTED PLUT0NIUM RECYCLE INDUSTRY
SUMMARY
This generic environmental statement analyzes the cumulative differences inenvironmental impacts that would result over the 26-year period from 1975 - 2000 ifonly uranium or' if both uranium and plutonium are recycled as compared to no recycle ofany fuel. These differences would result primarily from changes in fuel composition,from introduction of fuel reprocessing and from reduction in the quantity of naturaluranium resources required. The recycling of Pu would require changes in fuel compo-
. sition (adding Pu0 to the UO ) and the construction and operating of mixed oxide fuel2 2
fabrication plants. The reduction of required uranium resources would decrease thenumber .of mines, mills, UF conversion plants and uranium enrichment plants needed in6the uranium feed chain.
This chapter projects growth of the LWR industry through the remainder of thiscentury in terms of the size, nature and number of the various fuel cycle facilitiesthat would be required to support light water reactors under various fuel cycle options.The options considered are no recycle, recycle or uranium only and recycle of bothuranium and plutonium. These projections are part of the analyses of differentialenvironmental impacts presented in CHAPTER IV.and the economic analysis in CHAPTER XI.
In selecting a forecast of growth of the LWR industry for use, the NRC consideredprojections of growth in the consumption of energy in the US, of energy resources, andof growth in electrical generating capacity. Several different projections of crowth~1n total electric and nuclear generating capacity by Federal and private oroanizationsare presented. WASH-ll39 (updated), appropriately modified by the NRC, was selectedas the basis for sizing the LWR industry. The modification consisted of decreasing theestimate of nuclear generating capacity to reflect the recent withdrawal of commercialHigh Temperature Gas Cooled Reactors (HTGR's) from the market and to remove the effects
of the Fast Breeder Reactor (FBR). With no FBR's, all plutonium recovered from LWRspent fuel would be recycled in LWR's. From the list of projections considered, NRCselected two cases (ERDA Moderate Growth (High) With Breeder and ERDA Low Growth
Without Breeder) as a realistic bracket for the remainder of this century. The pro-jected growth of nuclear generating capacity was then centered on the lower of the twoprojections because it was considered to be the more realistic.*
* Concurrently, the Federal Energy Administration (FEA) was revising its pro-. jections through 1985. These projections (recently published in National Enerov -' Outlook Report No. FEA-N-75/713, February 1976) were a significant factor in
establishing that the ERDA low growth forecast with modifications was a "best choice."
||!t.
| III-l
,. . _ . -- - - _ _ _ _ _ _ --. --, _ _ . __ _ _

From the projected growth of the installed nuclear generating capacity in the USfrom 1975 through the year 2000, the number of model LWR's required to generate theprojected power was estimated and material balances were calculated for each step ofthe supporting fuel cycle. These material balances served as the basis for estimatingthe number of each type of model fuel cycle facility needed to support the estimatednumber of LWR's. The number of LWR's and supporting fuel cycle facilities estimated toconstitute the LWR fuel cycle industry from 1975 through the year 2000 with no recycle,with uranium recycle and with recycle of both uranium and plutonium are summarized at5-year intervals in Tables III-1. III-2 and III-3. The number of LWR's is the samefor all recycle options.
Environmental impacts of the industry were integrated over the 26-year period from1975 through the year 2000 and the industry was characterized at the end of that period.
III-2
_ _ _ _ _ .

Table III-l
THE PROJECTED LWR INDUSTRY FOR THE
PERIOD 1975-2000 WITH NO RECYCLE
Number of FacilitiesLWR Industry Annual
Components Capacity of Model 1975 1980 1985 1990 1995 2000
LWR's 1,000 MWe 37 71 156 269 400 507
Mines
Underground 20,000 ST ore 140 440 1,050 2,185 3,500 5,600Acres disturbed 1,400 4,400 10,500 21,850 35,000 56,000
Open Pit 200,000 ST ore 19 48 93 152 197 240
Acres cisturbed 21,700 32,000 106,000 173,300 224,600 273,600
Mills 1,050 ST U 0 10 25 45 71 94 10938
f 2 3 5 6 7UF Conversion Plants 15,000 MTU6
6Uranium Enrichment Plants 8.75 x 10 SWU 3 3 3 4 5 6
UO Fuel Fabrication Plants 1,500 MTU 9 6 6 6 8 92
6 3*Commercial Burial Grounds 1 x 10 ft 6** 6** 6** 6** 9 11
Federal Repositories forSpent Fuel 15,000 elements 0 0 1 1 2 2
,
* Total Capacity is 25 million cubic feet." Fewer required. Six is indicated because that many exist.
_ _ _ _ _ _ _ _ _ _ _ _ _ _ _ _ _ _ _ _ _ _ _ _ _ _ _ - _ . ._ _ _ _ _ - - _ - - _ _ _ _ _ _ _ _ _. . _ _ -
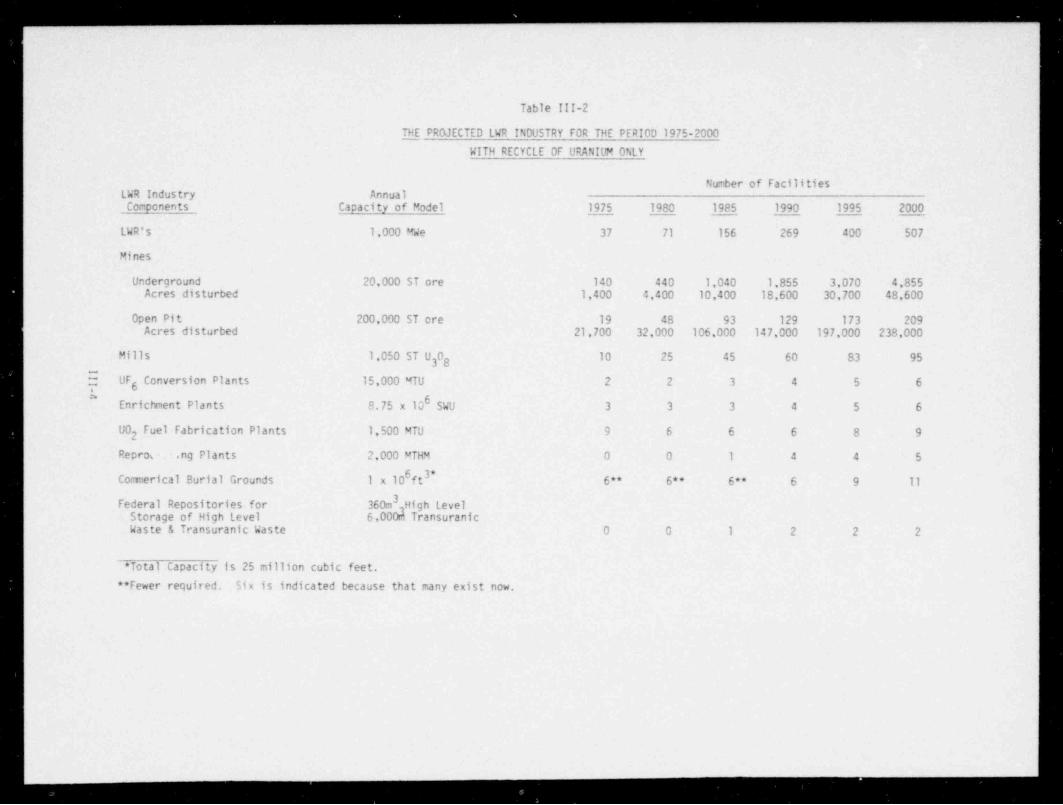
..
... .. . .
_ _ _ _ _ _ _ - - - _ _ _
' |
| |
| |
| |
| .
Table III-2 |
THE PROJECTED LWR INDUSTRY FOR THE PERIOD 1975-2000
WITH RECYCLE OF URANIUM ONLY
Number of FacilitiesLWR Industry AnnualComponents Capacity of Model 1975 1980 1985 1990 1995 2000
LWR's 1,000 MWe 37 71 156 269 400 507
Mines
Underground 20,000 ST ore 140 440 1,040 1,855 3,070 4,855Acres disturbed 1,400 4,400 10,400 18,600 30,700 48,600
Open Pit 200,000 ST cre 19 48 93 129 173 209Acres disturbed 21,700 32,000 106,000 147,000 197,000 238,000
Mills 1,050 ST U 0 10 25 45 60 83 9538
f UF Conversion Plants 15,000 MTU 2 2 3 4 5 66^' 0Enrichment Plants 8.75 x 10 SWU 3 3 3 4 5 6
UO Fuel Fabrication Plants 1,500 MTU 9 6 6 6 8 92
Repros= .ng Plants 2,000 MTHM 0 0 1 4 4 5
6 3*Comerical Burial Grounds 1 x 10 ft 6** 6** 6** 6 9 11
3Federal Repositories for 360m High LevelStorage of High Level 6,000$ TransuranicWaste & Transuranic Waste 0 0 1 2 2 2
* Total Capacity is 25 million cubic feet.
** Fewer required. Six is indicated because that many exist now.
- - - -
.

Table III-3
THE PROJECTED LWR INDUSTRY FOR THE PERIOD 1975-2000
WITH RECYCLE OF BOTH URANIUM AND PLUTONIUM
Number of FacilitiesLWR Industry Annual -
Components Capacity of Model 1975 1980 1985 1990 1995 2000
LWR's 1,000 MWe 37 71 156 269 400 507
Mines
Underground 20,000 ST ore 140 375 885 1,735 2,605 3,955Acres disturbed 1,400 3,750 8,900 17,400 26,000 39,600
Open Pit 200,000 ST ore 19 41 79 121 147 170Acres disturbed 21,700 46,800 90,000 138,000 167,600 194,000
Mills 1,050 ST U 0 10 21 38 56 70 7738
f UF nyersion M ants 15,000 MTU 2 2 3 4 5 56*
6Enrichment Plants 8.75 x 10 SWU 3 3 3 3 4 5
U0 Fuel Fabrication Plants 1,500 MTU 9 6 6 6 7 72
Reprocessing Plants 2,000 MTHM 0 1 1 3 4 5
M0X Plants 360 MTHM 0 1 2 3 6 86 3*Comercial Burial Grounds 1 x 10 f t 6** 6** 6** 6 9 11
3Federal Repositories for 360m High Level3Storage of High Level 6000m Transuranic
Waste & Transuranic Waste 0 0 1 2 2 2
* Total Capacity is 25 million cubic feet.** Fewer required. Six is indicated because that many exist now.
_ _ _ _ _ _ _ _ _ _ _ _ _ _ _ _ - _ _ _ _ _ _ _ _ _ _ _ _ _ _ _ _ _ . - __
_ _ _ _ _ _ _ _ _ _ _ _ _ _ _ _ _ _ _ _ - _
l.0 INTRODUCTIONT
| The purpose of this chapter is to present background information on the overallprojected national energy picture and its nuclear component, and to describe the growth
I of a nuclear fuel recycle industry that provides the basis for an assessment of theenvironmental impact and for an analysis of the costs versus the benefits of usingmixed-oxide fuels in light-water reactors. First, the rate of consumption of energyin the United States and a reasonable projection of its increase in the future arepresented. This is followed by a discussion of potential energy resources. Then thefraction of this energy that is likely to be utilized as electricity, the various tech-nologies for generating the electricity and the fraction of the total electrical gen-erating capacity that might reasonably be provided by light-water reactors is presented.The nuclear fuel cycle alternatives are discussed and the effect of utilizing plu-tonium on the conservation of domestic supplies of uranium is examined. The componentsof the fuel recycle industry and the growth that might be expected to the year 2000are described.
In the second part of this chapter, specific scenarios are selected and describedwhich represent, in the NRC staff's opinion, reasonable bounds to the development ofthe light-water reactor industry. These scenarios are independent of the complicationsof competing reactor types and will serve a* the basic cases for the assessment of theenvironmental impacts of plutonium recycle to light-water reactors. The particularscenarios selected allow these impacts to be quantified without introducing themultitude of considerations not germane to the purpose of this report.
Additional discussions of growth projections for nuclear capacity are presentedin Appendix B.
The information on energy consumption rates, electrical generation rates, andtechnologies capable of supplying electricity have been derived primarily from the workof the following:
Proposed Final Environmental Statement - Liquid Metal Fast Breeder Reactor,
WASH-1535, U. S. Atomic Energy Commission December 1974; the Energy Research
and Development Administration's February 1975 update of Nuclear Power Growth1974-2000, WASH-1139; United States Energy Through the Year 2000 (Revised),
Bureau of Mines, U. S. Department of the Interior, December 1975; and NationalEnergy Outlook - February 1976, Federal Energy Administration.
The NRC has reviewed the information and it appears the relev.:nt parts represent rea-sonable assessments of present knowledge and projections of future developments. Theinformation is summarized in this ch:pter, sometimes '.n the words of the subject reports,and reference is made to those reports for more complete discussions.
III-6

i
2.0 CONSUMPTION OF ENERGY IN THE UNITED STATES
2.1 Pelationship of Energy Consumption to Gross National Product
The history of industrialized nations has shown that economic progress depends, inpart, on the development and utilization of an abundant supply of energy. The positivecorrelation between a nation's per capita energy consumption and its per capita crossnational product is shown in Figure III-1.I Although this chart and other data suggestthat some countries may use energy more efficiently than others, the more industrializedcountries, with higher per capita gross national product, have higher per capita energyconsumption rates. The very close historic positive relationship between pross nationalproduct and energy consumption rate and between changes in gross national product andchanges in energy consumption rate for the US can be seen in Figures III-2 and III-3.3
Our consumption of nonrenewable resources of fossil fuel and the environmentalimpact associated with the consumption of most energy sources, indicate that energywill be used more effectively in the future. Sufficient attention must be given toefficiency and conservation.
Energy is consumed in the US primarily for transportation, space heating and indus-trial processing. The distribution of usage among major applications in 1968 is shownin Table 111-4.4 In 1974, the gross .nerge inputs to the hoasehold and commercial sector,the industrial sector, and the trans orta- lon sector, resper.tively, were 29%, 40% and31% of the total gross input of 73.1 quar tillion BTU.S
2.2 , Forecasts of Future Rates of Energy ( 3 umption
Projections of energy growth int the future hass been based on extrapolations ofpast experience, current trends, popt , stion growth r ates, anticipated changes in humanactivities, projected industrial prolucion, cost f erecasts and other factors. Because
so many technological, economic, soc ial ard anvie mmental changes could significantlyaffect the supply of energy and the demand, the projections are subject to uncertainties,the magnitude of which generally *.. crease with extension into the future.
In this environmental '.atement, the NRC is primarily concerned with the periodthrough the year 2000 becrase that appears to be as far into the future as projectionscan be made with a reasonable degree of accuracy. Most of the recent projections of thedemand for energy in the year 2000 fall in the range of about 135 to 210 quadrillionBTU.6 This may be compared with the consumptfin of about 73.1 quadrillion BTU in 1974. l
In an updating of previous !tudies, the Department of Interior has forecast that eneroy )will be consumed in the US through the year 2000 at the increasing rate shown in )Table III-5.7 The anticipated distribution of consumption among the major consumingsectors is shown in Table III-6.7 In 1974, about 58% of the electricity was consumedby the household and comercial sectcr and 42% was consumed by the industrial sector. |
The percentage consumed by tFe industrial sector was projected to rise to 50% in the |
year 2000.7
LII-7
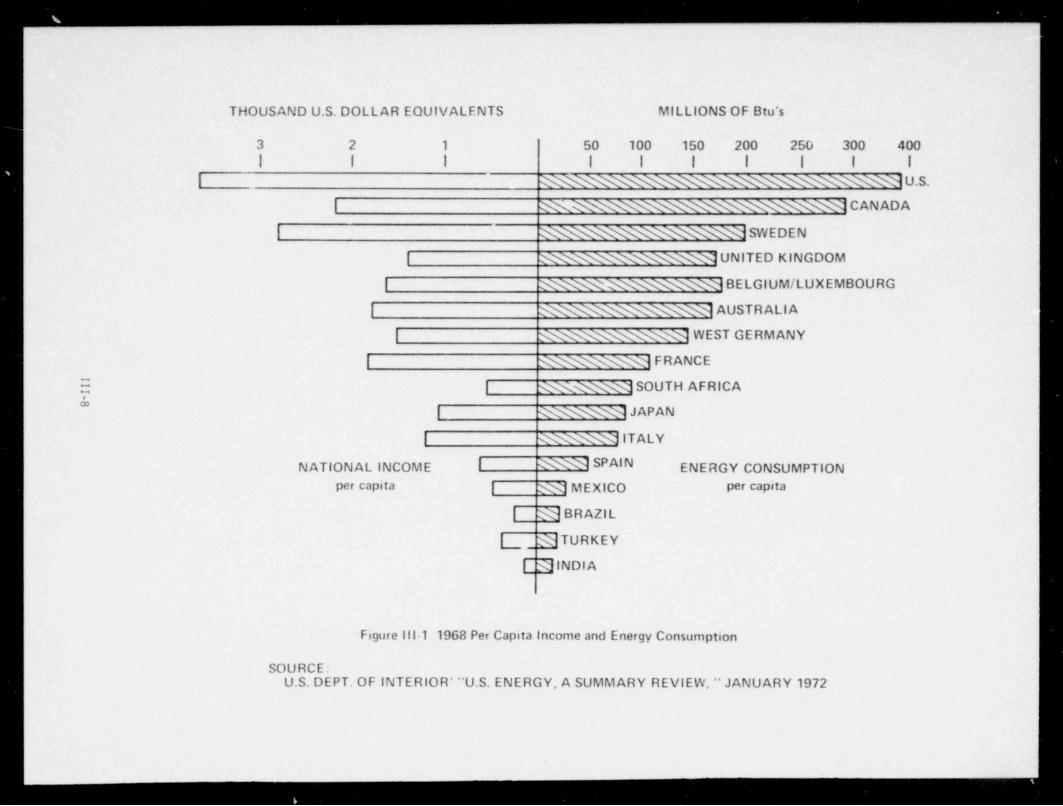
, . . . . . . . . . . . . ... . . . ..
. .. .,
_
THOUSAND U.S. DOLLAR EQUlVALENTS MILLIONS OF Btu's
3 2 1 50 100 150 200 250 300 4 00
| | | 1 l i I I I I
I AN % % % % % % % % % % % NN W WNU.S.1
| AN A % % % % N % N W % % % NN CANADA |
| A%N%NWWWWNSd SWEDENI NWNWWNWWNN UNITED KINGDOM
| KNWNAhhWWN BELGIUM / LUXEMBOURG
I A%%%%%%NN AUSTR ALi A| AWNWW%NN WEST GERMANY
| AN W % %NFRANCE
3 | xWhWN SOUTH AFRICA| A % % NN JAPAN
I AN W NNITALY
! NATIONAL INCOME | A W N SPAIN ENERGY CONSUMPTIONPer capita | |SS1 MEXICO Per capita
[@ BRAZllL J TURKEY
[3|NDIA
1
Figure lil-1 1968 Per Capita income and Energy Consumption |
SOURCE:U.S. DEPT. OF INTERIOR * "U.S. ENERGY, A SUMMARY REVIEW, " JANUARY 1972
_ _ -
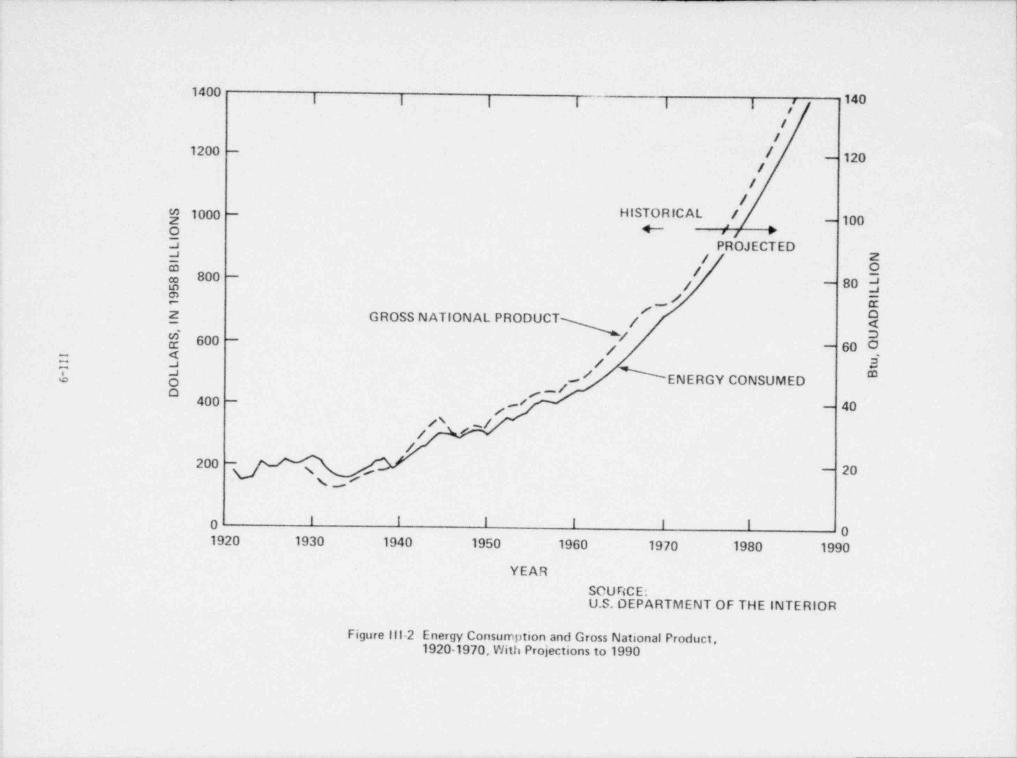
- _ _ .
14I I | | | | /
140
/
/1200 - / 120-
//
/* 1000 - HISTORICAL / 100f
-
4- |g >j PROJECTEDy / $
$ 800 -
80 3e f -
s E"/- o2 GROSS NATIONAL PRODUCT /
( 600 -
f 60 9-
= 3 / e[ g ' ENERGY CONSUMED-p
400 -
, 40-
/\ ~//
/200 -
g , - 20N/
i
I I I I I I0O
1920 1930 1940 1950 1960 1970 1980 1990
YEAR-
SCUF%CE:U.S. OEPARTMENT OF THE INTERIOR
Figure ill-2 Energy Consumption and Gross National Product,1920-1970, With Projections to 1990
- _ _ _ _ _ _ _ _ _ _ _ _ _ _ _ _ _ _ _ _ _

,| \ |)|
579 R
\-IO
1
1 R\ E10 T
NI
4 E
WHT
/ 0 F7 Ov 9 S\ 1 T
hENNIEMMTF RV O A
UPAE 4ED 7
* 5 R . 91
6 US.j/ 3'
9 BU-7
1 49
W,
1
PNGdb n
i'/u
a" y
R g0 A r
e6\ .' I 9 E n
1 Y EY \ nk / iG
!'/ sR / e
E gy nN -a
p- \'k -
E - " h- " C-
3\\ l
\ 5 i
\!i
5 l
I|r
i9 e
r.
1 u,
U \ igWl\ F\, A/" V\
t\.
0, !\'
5I ; 9
l 1! l
V ,
\\A \\\./ r 7
49
2 4 " 8 10 8 " ?! ywUg-*1 + *+
-
=b -
|| 1I |! |||| \ \|

_
Table !!I-4
ENERGY USAGE FOR VARIOUS APPLICATIONS (1968)4
Application Percent of Total
Transportation (fuel; excludes lubes and greases) 24.9
Space he6*.ing (residential and ccmercial) 17.9
Process suam* (industrial) 16.7
Direct heat (industrial) 11.5
Electric drive (industrial) 7.9
feedstocks, raw materials (commercial, industrial, andtransportation) 5.5
Water heating (residential and commercial) 4.0
Air corditioning (residential and commercial) 2.5
Refrigeration (rcsidential and co.inercial) 2.2
Lighting (residential and comercial) 1.5
Cooking (residential and comercial) 1.3
Electrolytic processes (industrial) 1.2
TOTAL 97.1
* Includes some uses for space heating, probably enough to bring space heatingto about 20%.
Table Ill-5
DEPARTMENT OF THE INTERIOR FORECAST OF U.S. ENERGY CONSUMPTION
Population Gross National Product Gross Energy Input Per Capita InputYear (million) (billion 1958 dollars) (quadrillion BTU) (million BTU)
1950 152 355 34.0 223
1960 181 488 44.6 247
1970 205 722 67.1 328
1974 212 821 73.1 345
1980 224 1092 87.1 389
1985 236 1294 104.0 441 1
2000 264 2105 163.0 617
l1
111-11

_ _ _ _ _ _ _ _ _ _ _ - _ _ _ _ _ _ _ - _ _ _ - _ _ _ _ _ _ _ _ _ _ _ _ _ _ _ -
Tablo !!!-67
PROJECTED DISTRIBUTION OF CONSUMPTION AMONG CONSUMING SECTORS
Fraction o' Gross Input by Year
Sector 1974 198. 1985 2000-
Household and Commercial 0.19 0.18 0.16 0.10
Industrial .29 .26 .22 .15' Transporta tion .25 .24 .23 .18
Electrical generation .27 .32 .38 .48
Synthetic gas and liquids -- .002 .015 .08
Table III-7S
FEDERAL ENERGY ADMINISTRATION FORECAST OF US ENERGY DEMAND
Gross Energy Input (quadrillion BTU)for Imported Oil Price
Year $8/ bbl $13/bbi $10/ bbl
1980 Reference Case 85.4 81.6 80.21985 Reference Case 103.4 98.9 97.3
Range * 95-106 92-102 91-101
1990 Reference Case 121.7 116.1 114.0
* Variability is related to assumptions concerning conservation, regulatiot,electrification, supply, and restrictions on energy development.
The Federal Energy Administration has recently revised its forecast for 1985 andextended the forecast to 1990.6 The result are summarized in Table III-7, and theanticipated distribution among consuming sectors is shown in Table III-8 for the ref-erence cases with imported oil costing $13/ bbl.8 The Federal Energy Administrationanalysis projects that the fraction of the electrical generation consumed by the House-hold and Commercial Sector will rise fre about 50% of the total in 1974 to 63% in1990.8 The projected rise in demand for energy is substantial but the rate of riseis sonewhat smaller than that forecast by the Department of the Interior. The distri-bution of energy consumption among consuming sectors in the two forecasts is similar,but the r deral Energy Agency projects a slower growth in electrical generation and ine
industrial usage of electricity.
1
!!!-12 '
_

Table III-8
FEDERAL ENERGY ADMINISTRATION DISTRIBUTION OF
ENERGY DEMAND AMONG CONSUMING SECTORS
Fraction of Total Demand1980 1985 1990
Household and Comercial .16 .15 0.14Industrial .28 .27 .27Transportation .25 .24 , .22
. Electrical Generation .31 .34 .37
Synthetics .0009 .0012--
Whether growth in the rate of consumption of energy such as that denr2ed above. is necessary or desirable is a matter of concern that has received in;reased atuantionsince the oil embargo of 1973/1974. Institution of measures to improve the efficiencyof usage and to conserve energy could lead to substantially lower consumption ratesthan those forecast by the Department of the Interior. Such measures are reflected inthe lower values of the range of energy demand forecast for 1985 by the Federal EnergyAdministration (Table III-7). As indicated in paragraph 4.1, the electrical generationcapacity growth rate selected as the basis for the GESMO analysis contemplates an effec-tive conservation of energy effort.
3.0 POTENTIAL ENERGY RESOURCES:J
'3.1 Fossil Fuels
Fossli fuels now provide about 94% of our total energy needs. Hydropower suppliesabout 4% and nuclear power about 2%. In 1974, about 10 of the fossil fuel energy wasobtained from 559 million tons of coal, 46% was from 6.070 million barrels of petroleumand 30% was from 21,512 billion cubic feet of natural ou.9 The declining reserves ofdomestic oil and gas as well as the projected growth in energy demand--in the U.S. andthroughout the world--indicate the need to develop additional practical sources of
Ienergy. Sources of energy and methods of utilizing those sources are described in,
detail in Section 6 of Reference 1.
Present estimates of the total energy obtainable from the estimated recoverable
resources of fossil fuels are shown in Tabl'e III-9.10 The nembers take into account>
the inefficiencie: generally experienced in recovery operations. Of the US resourceIIof 44.1 Q,* as much as 10 Q might be considered to be measured or proven reserves
; recoverable at or near present prices by use of established technology. Much of the1 remaining 34 Q is expected to be recoverable, but with increasing cost and difficulty.
|1
18i *Q units are usually used in reporting large quantities of energy. 1 Q = 10 BTU =
1000 quadrillion BTU.
t
III-13
. , - - -- . - - -. . -

.__ -
Table III-9"
TOTAL ESTIMATED RECOVERABLE RESOURCES OF FOSSIL FUELS
(Q units - 1018 BTUj
United States World (Includes U.S.)
Coal 34 200
Oil 1.4 14
011 Shale 7 17
Natural Cas 1.7 _10,
44.1 241
Snme esticates of U.S. fossil fuel resources range as high as 125 Q. All estimatesinclude, however, "t.ducated guesses" that considerable quantitles exist in undiscovereddeposits of marginal quality. Estimates of recoverable quantities of fossil fuels,such as those in Table III-9, r.ecessarily involve judgments that could result in sub-stantial overestimates or underestimates of the actual resources.
3.2 Hydro, Tidal, and Geo*hennal Resources
Estimates of the energy available from hydroelectric, tidal, and geothermal resourcesare presented in Table 111-10.
12Table 111-10
HYDROELECTRIC, TIDAL, AND GE0 THERMAL RESOURCES
United States ,__ World
Max Potential * Max PotentialkWh(e)/yr Q/yr** kWh(e)/yr Q/yr**
9 9Hydroelectric 500 x 10 0.005 4500 x 10 0.045
Tidal9 9(NorthAmerica) 260 x 10 .003 560 x 10 .006
Geothermal .001 .004
Total s0.009-0.012 s0.05
*In 1970 about 40% of the estimated maximum hydroelectric potential of the US had beendeveloped. A small fraction of the geothermal potential and none of the tidal potentialhad been developed.
** Equivalent to the energy in fossil or nuclear fuel that would otherwise be consumed toproduce the indicated electrical energy, assuming a conversion efficiency of 33-1/3t.
3.3 Solar Energy
Energy from the sun falls on the earth's atmosphere at a rate of about 130 wattsper square foot of exposed surface. Nights, weather, seasons, attentuation by theatmosphere, and variations in latitude rcduce this rate at the surface of the earth.
The rate at which solar energy is incident on the surface of the US ranges from about
111-14
. _ _ - _ _ _ _ _ - _ _ _ _ _ _ _ - _ _ _ _ _ _ _ _ _ _ _ _ _ _ _ _ _

_ _ _ _ _ _ _ _ _ _ _ _ _ _ _ _ _ _ _ _ _ _ _ _
12 watts per square foot for parts of Michigan and Wisconsin to about 24 watts persquare foot for southern Arizona and New Mexico. The total energy incident on the
9 13coterminous U.S. amounts to about 1.43 x 10 megawatt thermal years per year or43 Q per year.
3.4 Uranium
The present ERDA estimates of U.S. uranium resources in relation to cost of recoveryand the amount of energy obtainable therefrom are presented in Table 111-11. As isexplained in caragraph 1.2 of CHAPTER IV, Section F, the resources shown include thepotential resources. The Q values are based on fissioning of 1% of the uranium in lightwater reactors or 70% in breeder reactors.
Table III-11
U.S. URANIUM RESOURCES
Forward Costof U 08 U Us Resource Q at 1% of Q at 70% of3 3
Price /lb up to 1000 tons Energy Available** Energy Available**
$10* 1,275* 0.75 53
15* 2,050* 1.2 85
30* 3,560* 2.1 146
* Chapter IV, Section F Table IV F-2. Vast quantities of uranium would be recoverableat higher cost from granites, shales, and ocean waters.
** Based on 3.5 x 10¹⁰ BTU /lb of U fissioned.
3.5 Thermonuclear Fuels
If controlled thermonuclear fusion can be achieved and successfully applied, energycan be produced by reactions in which tritium nuclei combine with deuterium nuclei or
'deuterium nuclei combine with deuterium nuclel to form helium. The deuterium fuel canbe obtained by separating the hydrogen isotopes in sea water. Tritiun, however, doesnot occur in quantity naturally and must be produced by means of neutron absorption ialithium. An estimate of the energy resources that would be available from fusionreactions is shown in Table III-12.
13Table III-12
FUSION FUEL RESOURCES
Lithium resources 220 Q(*)
Deuterium resources 750,000,000 Q(**)(*) Based on estimated U.S. lithium deposits. Sea water, in which the lithium con-
centration is 0.1 ppm, is another possible source.(**) Assumes use of 10% of the deuterium in ocean waters.
III-15
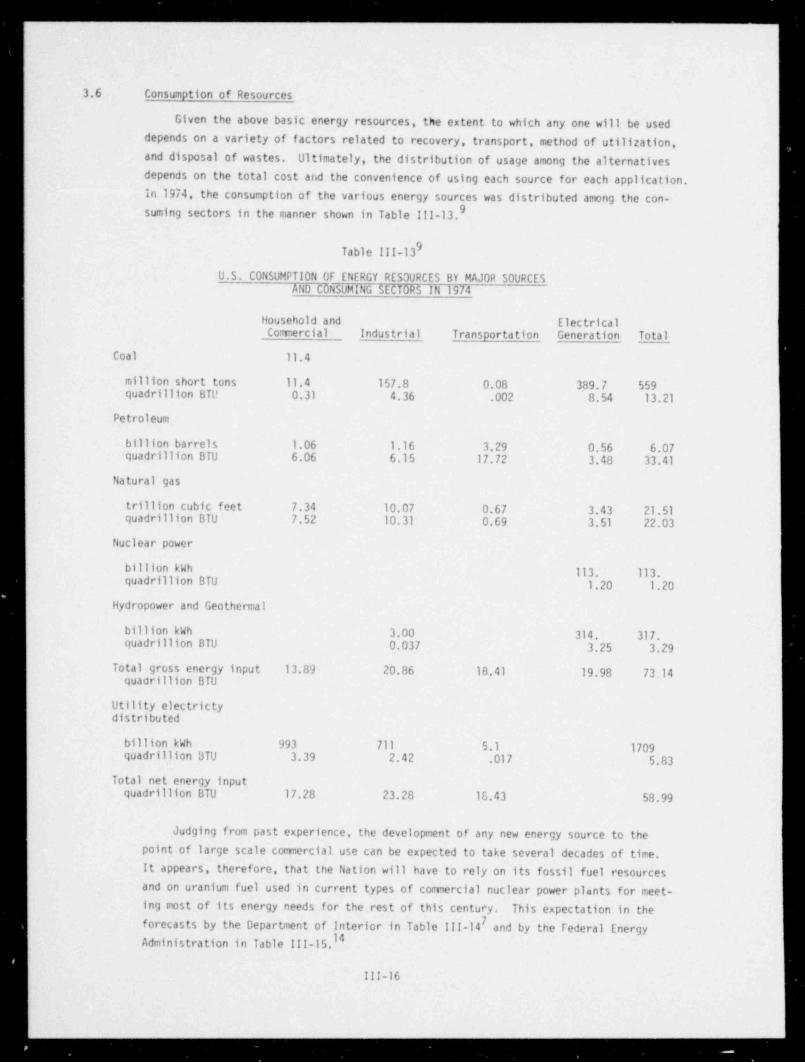
. _ _ _ _ _ _ _ _ _ _ _ _ _ _ _ _ _ _ _ _ _ _ _ _ _ _ - _ _ - _ _
3.6 Consumption of Resources
Given the above basic energy resources, the extent to which any one will be useddepends on a variety of factors related to recovery, transport, method of utilization,and disposal of wastes. Ultimately, the distribution of usage among the alternativesdepends on the total cost ar.d the convenience of using each source for each application.In 1974, the consumption of the various energy sources was distributed among the con-suming sectors in the manner shown in Table III-13.9
9Table III-13
U.S. CONSUMPTION OF ENERGY RESOURCES BY MAJOR SOURCESAND CONSUMING SECTORS IN 1974
Household and ElectricalCommercial Industrial Transportation Generation Total
Coal 11.4
million short tons 11.4 157.8 0.08 389.7 559quadrillion BTl! 0.31 4.36 .002 8.54 13.21
Petroleum
billion barrels 1.06 1.16 3.29 0.56 6.07quadrillion BTU 6.06 6.15 17.72 3.48 33.41
Natural gas
trillion cubic feet 7.34 10.07 0.67 3,43 21 .51quadrillion BTU 7.52 10.31 0.69 3.51 22.03
Nuclear power
billion kWh 113. 113.quadrillion BTU l.20 1.20
Hydropower and Geothermal
billion kWh 3.00 314, 317.quadrillion BTU 0.037 3.25 3.29
Total gross energy input 13.89 20.86 18.41 19.98 73.14quadrillion BTU
Utility electrictydistributed
billion kWh 993 711 5.1 1709quadrillion BTU 3.39 2.42 .017 S.83
Total net energy inputquadrillion BTU 17.28 23.28 16.43 58.99
Judging from past experience, the development of any new energy source to thepoint of large scale commercial use can be expected to take several decades of time.It appears, therefore, that the Nation will have to rely on its fossil fuel resourcesand on uranium fuel used in current types of commercial nuclear power plants for meet-ing most of its energy needs for the rest of this century. This expectation in the
7forecasts by the Department of Interior in Table III-14 and by the Federal EnergyAdministration in Table !!!-15.I4
l111-16
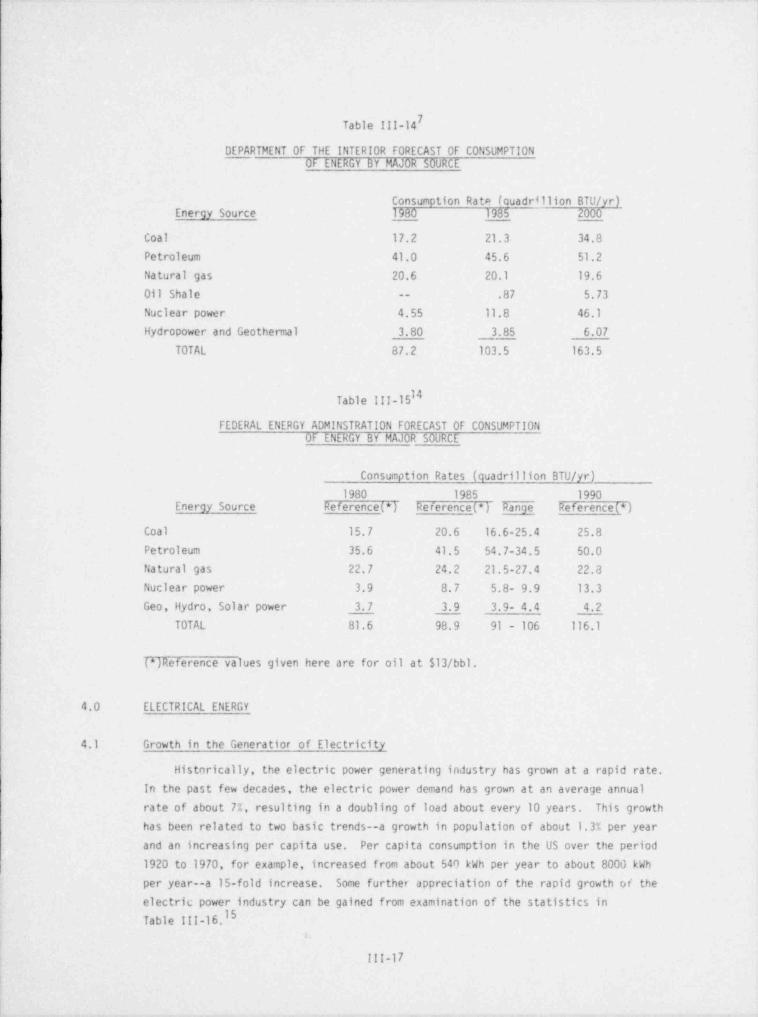
7Table 111-14
DEPARTMENT OF THE INTERIOR FORECAST OF CONSUMPTIONOF ENERGY BY MAJOR SOURCE
Consumption Rate (cuadrillion BTU /yr)Energy Source 1980 1985 2000
Coal 17.2 21.3 34.8
Petroleum 41.0 45.6 51.2
Natural gas 20.6 20.1 19.6
011 Shale -- .87 5.73Nuclear power 4.55 11.8 46.1
Hydropower and Geothermal 3.80 3.85 6.07
TOTAL 87.2 103.5 163.5
I4Table III-15
FEDERAL ENERGY ADMINSTRATION FORECAST OF CONSUMPTIONOF ENERGY BY MAJOR SOURCE
Consumption Rates (quadrillion BTU /yr)
1980 1985 1990Energy Source Reference (*) Reference (*) Range Reference (*)
Coal 15.7 20.6 16.6-25.4 25.8
Petroleum 35.6 41.5 54.7-34.5 50.0Natural gas 22.7 24.2 21.5-27.4 22.3Nuclear power 3.9 8.7 5.8- 9.9 13.3Geo, Hydro, Solar power 3.7 3.9 3.9- 4.4 4.2
TOTAL 81.6 98.9 91 - 106 116.1
(*) Reference values given here are for oil at $13/ bbl.
4.0 ELECTRICAL ENERGY
4.1 Growth in the Generatior of Electricity
Histnrically, the electric power generating industry has grown at a rapid rate.In the past few decades, the electric power demand has grown at an average annualrate of about 7%, resulting in a doubling of load about every 10 years. This growthhas been related to two basic trends--a growth in population of about 1.3% per yearand an increasing per capita use. Per capita consumption in the US over the period )
1920 to 1970, for example, increased from about 54') kWh per year to about 8000 kWhper year--a 15-fold increase. Some further appreciation of the rapid growth of theelectric power industry can be gained from examination of the statistics inTable 111-16.15
1.
III-17
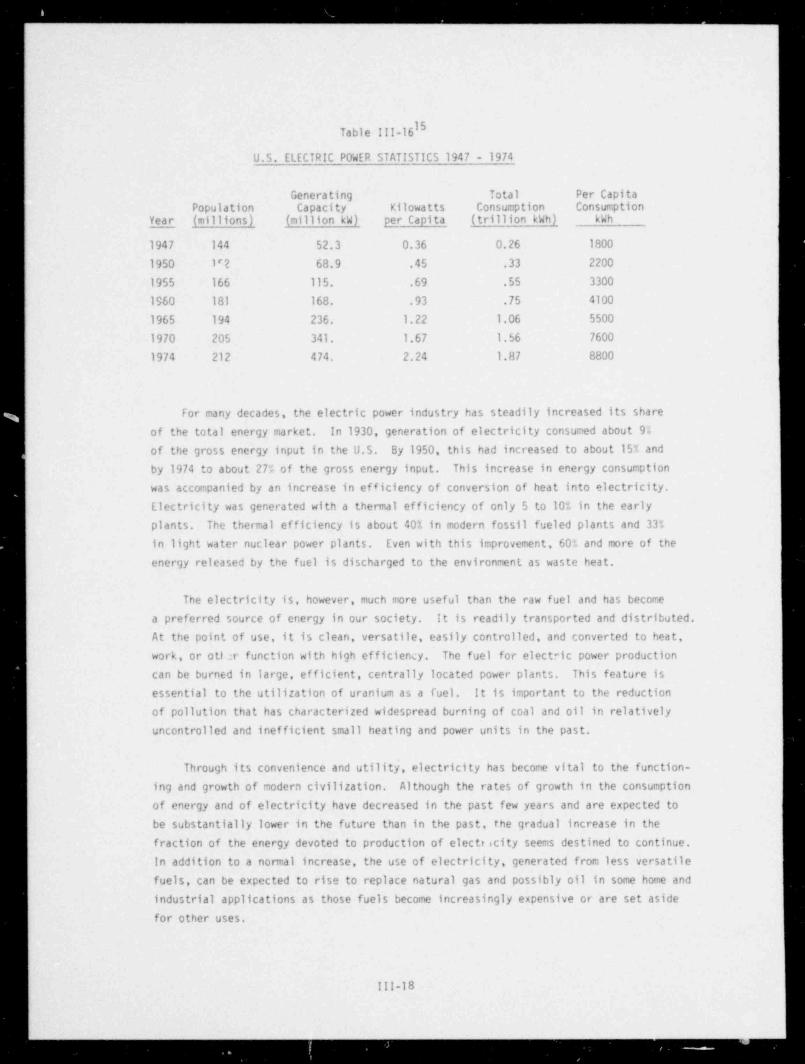
- _-_ _ _ _ - - _ _ - _ _ _ _--
15Table III-16
U.S. ELECTRIC POWER STATISTICS 1947 - 1974
Generating Total Per CapitaPopulation Capacity Kilowatts Consumption Consumption
Year (millions) (million kW) per Capita (trillion kWh) kWh
1947 144 52.3 0.36 0.26 1800
1950 l'2 68.9 .45 .33 2200
1955 166 115. .69 .55 3300
1960 181 168. .93 .75 4100
1965 194 236. 1.22 1.06 5500
1970 205 341. l.67 1.56 7600
1974 212 474. 2.24 1.87 8800
for many decades, the electric power industry has steadily increased its shareof the total energy market. In 1930, generation of electricity consumed about 9%of the gross energy input in the U.S. By 1950, this had increased to about 15% and
by 1974 to about 27% of the gross energy input. This increase in energy consumptionwas accompanied by an increase in efficiency of conversion of heat into electricity.Electricity was generated with a thermal efficiency of only 5 to 10% in the earlyplants. The thennal efficiency is about 40% in modern fossil fueled plants and 33%in light water nuclear power plants. Even with this improvement, 60% and more of theenergy released by the fuel is discharged to the environment as waste heat.
The electricity is, however, much more useful than the raw fuel and has becomea preferred source of energy in our society. It is readily transported and distributed.At the point of use, it is clean, versatile, easily controlled, and converted to heat,
work, or othr function with high efficiency. The fuel for electric power productioncan be burned in large, efficient, centrally located power plants. This feature isessential to the utilization of uranium as a fuel. It is important to the reduction
of pollution that has characterized widespread burning of coal and oil in relativelyuncontrolled and inefficient small heating and power units in the past.
Through its convenience and utility, electricity has become vital to the function-ing and growth of modern civilization. Although the rates of growth in the consumptionof energy and of electricity have decreased in the past few years and are expected tobe substantially lower in the future than in the past, the gradual increase in thefraction of the energy devoted to production of electricity seems destined to continue.In addition to a nonnal increase, the use of electricity, generated from less versatilefuels, can be expected to rise to replace natural gas and possibly oil in some home andindustrial applications as those fuels become increasingly expensive or are set asidefor other uses.
111-18 l
_ _ _ _ _ _ _ - - _ _ _ - _ _ _ _ _ _ - _ _ _ _ _ - _ _ _ _ _ _ _ _

_ _ _ _ _ _ _ _ _ _ _ _ _____ ______ _ _ _ _ - _ _ _ _ _ _ _ - _ _
|
Forecasts of the demand for electricity many years into the future contain manyuncertainties, even though they may be based on very elaborate models of the U.S.economy. As a result,. the projections of different individuals or group: vary widely.The forecasts of the growth in electrical generating capacity in the U.S. through theyear 2000, made by the Energy Research and Development Administration (ERDA) in 1975,are shown in Figure III-4. Also shown for comparison are data from the forecasts ofthe Federal Power Comission, the Department of the Interior, the Federal tnergyAgency, and the Electric Power Research Institute. After examining the results ofmany studies, the NRC concluded that the growth in total electrical generation capacityto the year 2000 could reasonably be expected to fall within the range of the ERDAModerate Growth /High and Low Growth forecasts. The bases for these two projectionsare sumarized below.
Moderate Growth /High: Reasonable conservation and improved utilization of energyare assumed along with continued improvement in the standard of living and developmentof the economy. The demand for electricity is projected to grow at an annual rate of6.25% through 1985 and 5.85% for the last 15 years of this century.
Low Growth: Stringent conservation of total energy is assumed with electricitycontinuing to provide an increasing portion of the total energy. Although electricalgeneration is projected to grow at a rate of only 5.8% per year through 1985 and 4.75%per year for the balance of the century, it would provide 51% of the total energyin 2000.16
4.2 Technologies Capable of Supplying Electricity
In 1974 in the U.S. 44.5% of the utility-generated electricity was produced incoal-fired plants, 33.2% was from oil or gas-fueled plants,16.2% was from hydro andgeothermal plants, and 6.0% was from nuclear plants.I4 These technologies are firmlyestablished and are expected to provide most of the electricity during the remainderof this century.
Other Federal agencies and private organizations have projected future electricalrequirements and estimated the quantity of electricity that each of the various tech-nologies could provide. These projections and estimates seem reasonable to NRC. On
that basis, NRC projected the LWR requirements from 1975 through the year 2000.
The established technologies for producing electrical energy and those with poten-tial significance beyond the year 2000 are summarized on the following pages. Conser-vation is also discussed.
4.2.1 Fossil Fuel Power
Generating plants that use fossil fuels as the source of heat are expected to bea major source of electrical energy as long as adequate resources exist. Because oiland gas are so much less abundant than coal in the US and are so valuable for trans-portation, chemical and other uses, the percentage of fossil-fuel based electricity
III-19-
. .. . . .. - - - _ _ _ _ _ _ _ _ _ _ _

__
!
I
i|
l
2200ERDA-HIGH
2000 -
D01-1887
ERDA-MODERATE HIGH
1800 -
ERDA-MODERATE LOW
.f. : FPC-1670~
ERDA-LOW
1400 -
$|E
{ 1200 -
-
[ EPRI-9956-U DOI-9001000 -g T FEA-1040 REF.5 -
(800 -'
FPC-800
001-648 "
FEA FEA-818 REF.600 - ACTUAL RANGE 718-906
FEA-620
400 -
200 -
1 I I I | | | 1 I I I I I I
1972 74 76 78 80 82 84 86 88 90 92 94 96 98 2000
YEAR
Figure lil-4 Forecasts of Growth in Total Electrical Generation capacity
III-20
. _ _ _ _ _ _ _

produced in coal fired plants is expected to riss from th2 57% of 1974 to 80% or moreby 2000.17,18
Improved thermal efficiency in fossil fueled plants (especially coal fired plants)could have significant economic and environmental impact. Higher thermal efficiencywould result in the burning of less fuel and the release of less gaseous pollutants perunit of electrical energy produced. The average thermal efficiency of fossil fueledplants in the U.S. increased from about 24% in 1950 to about 33% in 1970 and large plantsbeing constructed today have thermal efficiencies of about 40 percent. The consumptionof power by pollution abatement equipment and the increasing use of cooling towers willreduce the thennal efficiency of the plants. There are, however, developments aimedat reducing the losses and at raising the thermal efficiency of future plants. TheDepartment of the Interior projects an efficiency of 38 percent for fossil fueled plantsfor the year 2000 as compared with its estimate of 32 percent for 1974.I9
In the year 2000 the annual consumption of electricity in the U.S. is projectedto be 8,600 billion kWh for the ERDA Moderate /High forecast of generation capacity and7,020 billion kWh for the ER0A Low forecast.16 If the average thermal efficiency were40 percent and all the electricity were produced in coal fired plants, the correspondingrates of consumption would be 3.2 and 2.6 billion tons per year of bituminous coal(11,500 BTU /lb) or larger amounts of lower grade coal. This " ' res with a total of0.611 billion tons of coal consumed--about 0.390 billion tons A. ;enerating electricity
--in the U.S. in 1974. If the coal were a typical soft coal, 260 to 320 million tons ofash and 130 to 160 million tons of oxides of sulfur would have to be disposed of eachyear. Removal of the oxides of sulfur by reaction with limestone would, depending onthe process, require that limestone be supplied at a rate of 2.3 to 4.6 tons per tonof sulfur axides, amounting to a requirement of 300 to 700 millior. tons of limestone.
The U.S. reserves are sufficient to provide coal at the above rates for at leastseveral hundred years. The estimated reserve of coal containing 1% or less of sulfurand economically recoverable by current methods from established formations csuld pro-vide 3.2 billion tons of coal per year for about 40 years.20 The use of coal for otherpurposes can be expected to increase the total demand by 0.5 billion tons per year ormore in 2000.
The enormous expansion that wouId be required in the coal mining and transportationindustries, the large increase in qualified miners and the difficulty of preventingserious widespread degradation of the environment provide incentive for using othersources of energy for generating electricity to satisfy part of the demand. As pointedout above, the burning of coal produces large amounts of solid waste that must be dis-posed of and of gaseous pollutants that must be removed or maintained at safe levels.In the past, coal mining has been one of the most hazardous of industrial occupations,surface mining has spoiled large areas of the land, and the run-off from strip minedareas and from the refuse heaps at coal processing plants has polluted surface waters.This situation can be changed, but expanding the industry even ta levels presentlyprojected while reducing the hazards and insuring that air, land, and water are pro-tected would be a demanding task.
III-21
_.
4.2.2 Hydroelectric Power
In 1974, conventional hydroelectric power plants constituted about 13 percent ofthe installed generating capacity in the U.S. and produced just over 16 percent of theelectricity.14,18 Although the installed capacity and the annual production willincrease in years to come, the limited number of acceptable sites will cause thegrowth rate to fall below that of other segments of the industry.
The Federal Power Comission has estimated the conventional hydroelectric poten-tial of the coterminous U.S. to be 147,200 MWe and of the 50 states to be 179,900 MWe.lhese estimates take into consideration probable engineering feasibility but do notconsider economic feasibility, environmental constraints, and legislative prohibitions.These latter considerations will substantially reduce the number of developable sites.By 1974, more than 40 percent of the estimated potential in the coteminous states hadbeen developed, and the Federal Power Comission estimated that the capacity installedthere would reach 82,000 MWe or 56 percert of the potential by 1990.21 This would be
about 5 percent of the projected total generating capacity at that time.
The largest increase in hydroelectric capacity is expected to be in pumped storageprojects. These projects are normally constructed in conjunction with base loadgenerating plants with low fuel costs such as nuclear units. The Federal Power Comis-sion estimates that pumped storage capacity will increase from the 3700 MWe of installedcapacity in 1970 to about 70,000 MWe in 1990. This reduces the peak generating capa-city required of plants that use other fuels but does not decrease the total electricitythat must be generated by those plants.
4.2.3 Geothermal Power
This resource is regionally located. Gr :ermal steam provided about 0.1 percentof tre electricity consumed in the U.S. in lo4. This electricity was produced at the
400 MW installation of the Pacific Gas and Electric Co. at the Geysers in California.Plans call for expanding the capacity of that installation by about 100 MWe per yearuntil the ultimate capacity of the field [ estimated to be as much as 5000 MWe] isdeveloped. Beyond this de elopment, no firm plans have been made for future geothermalcapacity.22
Estimates of economically recoverable geothemal resources vary from the equivalentof less than one-half year of supply at the total consumption rates projected for theyear 2000, to several years and several hundred years at that same rate. The lowerestimates generally include only known hydrothernal reserves recoverable at present ormoderately higher cost by use of present or somewhat improved technology. The higherestimates assume technological breakthroughs and the extraction of heat from dry hotrock.
The environmental effects associated with a geothermal plant can vary considerablybut are significant. From present data it can be concluded that a 1000 MWe plantwould require several hundred wells spread over several thousand acres during a 30-year lifetime. Those wells would be connected to the generating plant by a network of
111-221
_ . _
<
9
' pipes, some as large as 30 in. diam. The steam from geothermal wells often contains~
large quantities of such noxious gases as hydrogen sulfide and arrvnonia. The liquidsusually contain large amounts of corrosive salts. Special provisions must be made forsafe disposal of the gases and liquids. The steam from geothermal sources is at a lowtemperature, so the thermal efficiency is low and 3 to 4 times as much heat is rejectedto the environment as would be rejected from a modern coal-fired plant of the samecapacity.
iSeveral studies have been made of the geothermal power capacity that might rea-sonably be developed in the U.S. by 2000. Generally, they conclude that a moderateresearch, development, and evploration program could lead to an installed capacity of
340,000 to 100,000 MWe by. 20 t ERDA proposes a program intended to provide a capa-city.of 40,000 to 100,000 MWe in 2000.24
4.2.4 Solar Power
Solar energy includes utilization of its several forms--photons from the sun, thewinds, thermal gradients of the oceans, and plant life. Solar energy is used now'ona small scale for heating water and for heating and cooling a few homes and commercial
. buildings. ' Development of such systems is being supported by ERDA and has generatedsubstantial commercial interest. Use of-solar energy can be expected to increase butat a rate that will depend on the cost of energy from other sources and on whetherother incentives are offered to encourage such use. Solar heating and cooling will' reduce, somewhat, the rate at which the demand for electricity might otherwise grow.The effect is not likely to be so large as to cause the growth in demand to fall out-
_
side the range of projections in Figure III-4
Radiation from the sun can be used to produce electricity by thermal conversion <
and by photovoltaic conversion. In the thennal conversion process, the energy is usedto generate steam which is expanded through a turbine to turn a generator to ger.erateelectricity in the conventional way. In the photovoltaic process, solar energy is "
converted directly into' electricity in solar cells. The technology is available to-produce electricity by either method. The problem lies in lowering the cost to acompetitive level.
,Two factors have an important bearing on the cost. The availability of solarpower is regional, i.e., the sun shines on any given location only part of each dayand not on every day of the year. Electrical, mechanical, or thermal storage capacitymust be'provided so that electricity can be supplied during period when the sun is notproducing.
. Solar _ energy incident on the earth is dilute. In the southwestern U.S., collec-ting surface spread over at least 6.400 acres (10 square miles) would be needed for asolar-thennal power plant to provide an electrical output equal to the output from a1000 MWe fossil-fueled or nuclear plant operating,' on the average, at 70% capacity. Aphotovoltaic pcwer plant of the same output and operating at an overall efficiency of
| 10% for collection, storage, and DC-AC conversion would require about 9.500 acres of |l'
! III-23 1
b
u
_ u _ _ _ _ _ , _ _ _ l

1~
l<
'$h.>' (.f8
---TEST TARGET (MT-3)
1.0 E22BMy @ EM
'l I.| [ 82 Ele $l- p -
1.25 1.4 1.61
4 6" *
MICROCOPY RESOLUTION TEST CHART
/// ||//.
"% %/ 4 /4' %I4 '' D 4%| & q+ > 3 p <>>.%s7477,g
a
+v 7/,~% <$z%
.
O i R' :. - &; , ,
.
-: . 4;
1 ;-
.
i:.
" ~ ~ ^ ^ ^ ~ ' ~ ^''~ * '' ' ~" ~
. ___- - ___ - .

es11 surfaco spread cy:r about 19.000 acrcs cf land. Larger arias would be requirsd~ in other parts of the country.
Although the fuel cost is zero, the present cost of the equipment would be schigh as to make the cost of electricity from a solar-themal or photovoltaic powerplant far greater than that from conventional sources. Substantial development pro-grams are underway to bring about the advances in materials, engineering, and manu-facturing that are necessary to bring the costs into the competitive range. Whetherthis can be accomplished is highly uncertain, but the ERDA program has as its objectivethe installation of a total of 50,000 to 95,000 We of capacity in solar-thermal andphotovoltaic power plants by the year 2000.24 This could reduce the need for electricityfrom other sources by about 3 to 6% in the year 2000.
Enormous amounts of energy are contained in the winds and in the themal gradientsof the seas and serious efforts will be made in the next several decades to developeconomical means of converting some of that energy into electricity. Windmills havebeen used for centuries and a turbine with an output of 1.25 MWe fed electricity intothe power grid in Vemont intermittently for several years in the 1940's. Improvedwind power units are being developed, and it is proposed that assemblies of unitshaving capacities in the range of 10 to 100 MWe be installed in the early 1980's.
Large numbers of wind machines would be required to meet a significant fractionof the projected needs. For example. it has been suggested that 1400 billion kWh or16 to 20 percent of the expected electrical generation in the year 2000 could beobtained from wind machines spread over an area of 350,000 square miles in the GreatPlains. Towers, 600 ft high and each containing an array of 20 machines with 50 ftdiam blades, would be centered on aach square mile of the area. An annual use factor
of 30 percent is considered to be on the high side so the storage capacity required toprovide fim power would be substantial. The ERDA program foresees the installationof 20,000 to 50,000 MWe of wind energy conversion systems by 2000.26
In many places in the tropical and subtropical regions, the ocean surface tempera-tures are between 7F ..J 85'F. The warm surface layer circulates toward the poles,where it is cooled, and flows back along the deep ocean trenches. In these lowerlayers of the ocean, say 2,000 ft below the surface, the temperature is 35 to 45'F.The temperature difference between the surface and the depths could be used to drive a
- Rankine-cycle heat engine and produce electricity. The thermal efficiency of a realplant would be 2 to 4 percent. The working fluid for the power cycle might be amonia,propane, or one of the freons.
Two practical difficulties appear to exist with power plants that operate onocean temperature diffecentials. Because the temperature difference is small, a verylarge amount of water must be transported between the depths and the surface and
circulated over a very large heat transfer surface. The design and construction of'large economical plants requires solutions to many technological problems. Also, mostfavorable sites tend to be some distance at sea. .Most plants must be seagoing plants
.
111-24
and the electricity must be transmitted long distances to load centers. Developmentprograms to resolve the technological and economic uncertainties are being supportedby ERDA with the objective of achieving a capacity of 10,000 to 25.000 MWe by the year
26 (about 0.6 to 1.5% of projected total electric power requirements for the year2000
2000).
4.2.5 Thennonuclear power
Controlled thermonuclear fusion offers the promise of a virtually limitlesssource of energy and has been the subject of large research and development programsthroughout the world for more than 20 years. Although great progress has been made inthe science and engineering of controlled thermor"Jelear devices, a self-sustainingreaction has yet to be demonstrated. Present program plans call for the demonstration
*colled fusion in test reactors in the early 1980's. Experimental power reactorsars .o De operated to produce useful amounts of electricity between 1985 and 1990. A
Icomercial scale demonstration power reactor is projected for 1997,27 but this may be
-optimistic. The advances in science and engineering that must be demonstrated beforecommercial plants can be built make it all but certain that controlled thennonuclearreactors will not help to satisfy the Nation's energy needs before 2000.
4.2.6 Nuclear Power
A substantial domestic industry has been established to supply and operate nuclearpower plants. In 1975 about 9 percer.t of the electricity consumed in the U.S. camefrom nuclear power plants. As of July 1976, 59 commercial nuclear power plants with atotal generating capability of over 41,000 MWe had been completed and licensed tooperate. In addition,157 plants with a generating capacity of about 170,000 MWe wereunder construction or on order.25 The combined capacity of all these plants is about25 percent of the total generating capacity projected for 1985.
Almost all these plants are LWR plants. It appears likely that almost all thecomercial nuclear power plants built in the U.S. between now and 2000 will be LWRplants. The only competitor for near-tenn use in the U.S. has been the high tempera-ture gas-cooled reactor (HTGR). The General Atomic Company, developer and promoter ofthe HTGR, announced on October 1975 that it was temporarily withdrawing from thecommercial HTGR business.
LWR's can make a significant contribution to U.S. electrical requirements for therest of this century beccuse it is unlikely that breeder reactors will generate morethan a few percent of U.S. electrical power during that period. Because uraniumresources are finite (Table III-8), breeder reactors may play a major role in thegeneration of nuclear power beyond the year 2000. The Liquid Metal Fast BreederReactor (LMFBR) has been under development in the U.S. since the mid-1940's and
presently is a major part of the ERDA program. Three experimental reactors have been
built and oeprated. A400-MW(t)reactorfortestingfuels, materials,andcomponentsis under construction. A demonstration plant, the Citnch River Breeder Reactor,designeo for an output of 350 MW(e), is awaiting a construction permit and is scheduled
III-25

. . _ .
. .
to begin operating in about 1983. Plans propose operation of the first connercial.LMFBR in 1993 and rapid expansion of LMFBR capacity thereafter. 'It is unlikely that-the electricity generation capacity in LMFBR plants in the year 2000 will constitutemore than a few percent of the total nuclear generating capacity.
The basic rationale for building most of the nuclear power plants now operating,being constructed, or on order, is that over the lifetime of the plant, the cost ofthe power produced is expected to be less than the cost of power from a fossil-fueledplant.
For the LWR nuclear technology, the cost of the nuclear fuel cycle 15 a small- part of the total cost of aenerating electricity. Further, the cost differential due- to the form or composition of the nuclear fuel used is a small part of the fuel cycle ,
cost and as a result makes only a-slight contribution to the total nuclear generatingcost.
Therefore, the recycle of plutonium in LWR's compared to no recycle is judged toplay a very small-part in any economic consideration that may result in the selection
4
of a particular nuclear plant over alternate technologies. Thus, the degree of pene-t ation of LWR nuclear power into the total electric power generation field is con-sidered to be essentially independent of the type of fuel.
There is reason to expect that the costs can remain competitive at least untilthe resources available at a maximum forward cost of $30 per pound of U 0 have been381
committed.4
In any comparison of the costs of electricity, the costs of environmental effectsaave to be understood. In many instances the effects can only be considered qualita-
;tively. In terms of land area affected at the plant site, there is no great difference
^
between a nuclear plant and a coal-fired plant. Since the LWR plant has a thennalefficiency of 33 percent, it discharges about 35 percent more heat to the surroundingarea than would a moderate coal-fired plant of equal capacity. To a considerableextent, this difference is manifest in the greater cost of the cooling water facilitiesnecessary to ensure that the plant will comply with Federal and State water, qualitystandards.
The nuclear plant is clean by comparison with a coal-fired plant. The volumes ofnuclear fuel and liquid and solid wastes are trivial when compared with the volumes ofcoal, noxious stack gas, ash, and, when 50 is removed. stack gas scrubber waste. The
2wastes from a nuclear plant are, however, radioactive. Special precautions and equip--
.
ment must be provided to contain mcst of the radioactivity and ensure that the radia-tion from the materials released will add only slightly to the natural background.
The uranium ore from which U 0 can be extracted for $30 per pound or less con-38tains at least 0.08 percent U 03 8 (see CHAPTER IV Section F, p. IV F-9). A 1000-MWeLWR, in which only 0.8 percent of the uranium is fissioned, would require the production
-
I!!.26
_ . .

_ _ _ _ _ _ ____ _ _ _ -
- of 650 tons cf such cro for tach day of. full power operation. Because the uranium oreLis processed to separate the U 0 at a plant near the mining site, only 0.52 tons has38to be shipped any distance. A modern 1000 MWe coal-fired plant burns about 8,950 tonsof coal for each day of full power operation. This great difference in amount ofmaterial that must be mined and transported accounts in large measure for the lowerfuel costs of nuclear plants and for the smaller, readily visible, damaging impact onthe environment.
As explained.in c'' APTER I, the uranium fuel that is removed from the reactor con-tains highly radioactive fission and transmutation products and plutonium. Because ofthe hazards associated with this material, appropriate precautions must be taken inhandling, shipping, and processing the irradiated fuel and in disposing of the wastesand safeguarding the plutonium. These matters are considered in great detail in otherparts of this report. Plants and equipment, procedures, and regulations, believed by
' th'e industry and the government to be more than adequate to ensure that t.e radio-activity and the plutonium will be safely controlled and confined in the reactor andthroughout the remainder of the fuel cycle, have been or are being developed. Thecosts of protecting the environment are contained in the plant and fuel cycle costs.
'4.2.7 Conservation.
Conservation of electricity through reductions in losses during transmission anddistribution, improvements in efficiency of end use devices, and reductions in end userequirements can. serve to considerably reduce the growth in usage of electricity andin generating capacity. Conservation was at least partly responsible for the lack of
28growth in demand in 1974 and 1975 and the more moderate forecasts of growth rates inthe future.
About 8 percent of the electricity that is generated is lost in transmission anddistribution to the customers. Transmission losses can be reduced by raising trans-mission voltages, reducing line currents, reducing line resistances by use of innova-tive cable systems and power control. Distribution losses can be reduced by optimizingthe load on transformers and reducing the current or resistance of the distributionlines. Research and development now in progress and that planned for the future mayresult in reduced transmission and distribution losses. The value of the encray savedmust, however, be balanced against the cost of the equipment. The balance may showthat measures necessary to make a substantial reduction in the 8 percent would not beeconomical.
The principal end uses of electricity and the rates of growth in consumption byuse-from 1960 through 1968 are shown in Table 111-17.29 Conservation programs under-taken by government and industry are aimed at increasing the efficiency of electrical
'
devices and reducing the waste in the applications of greatest consumption and greatestgrowth. . Better insulation and sealing of homes and connercial buildings, maintainingthe temperatures at 68'F or cooler in the winter and 78'F or wanner in the summer and
increased use of heat pumps can be expected to effect important savings in heatingand/or air conditioning applications. More conservative lighting practices and control
III-27
C- - _ _ _ _ _ _ _ _

_ . - _ _ - _ _ _ . - - - _ _ _ _ _ _
|-
l'of hot water usage can provide further savings. Improvement in the efficiencies of
' residential and comercial appliances and industrial equipment and processes can helpto reduce the rate of growth in demand for elect /icity. Numerous studies have indi-
.cated that by combining many conservation measures, the projected energy needs of theNation.for the year 2000 could be reduced by 25 percent or more without resorting to
.-an austere life style.' The forecasts used for specifying the ' size of the LWR industryfor this report were based on the precept that conservation would result in a substan-tial reduction in the historical rate of growth of consumption of electricity.
Table III-17,
CONSUMPTION AND GROWTH OF PURCHASED ELECTRICITY'SECTOR AND END USE 1%0-1%3
Consumption Average Annual RateS M tor and (trillion BTU)* of Growth 1960-1968. End Use 1960 1%8 (percent)
Residsntial
Space heating 29 134 24.3
Water heating 155 223 4.6Cooking 73 % 3.4
Clothes drying 23 51 10.4
Refrigeration- 122 250 9.3Air conditioning 48 154 15.6
Other** 292 462 5.6
Total 742 1,390 8.2
Commercial
Space heating nil nil
Water heating 70 84 ~2. '3
Cooking 5 8 6.0Refrigeration 193 244 3.0Air conditioning 200 370 8.0Other**. 2 373 27.7
Total 520 1,079 9.5
Industrial'
Electric drive 1324 1958' 5.0Electrolytic process 202 258 4.4Direct heat 79 130 6.4
-Other** SI 80 5.8,
-Electricity generation --350' -410 -2.0Total 1,306- 2,043 5.8 -
-Transportation 18 ~18
* Values are net values and do not include heat wasted in the production of electricity.**0ther inicudes lighting, TV sets, small appliances, elevators, business machines,
computers, etc.
111-28*
i
- ____ - _ _ _ - _ _ _ _ _ _ - - _ _ _ _ - _ _ _ _ _ _ _ _ _ _ _ _ _ _ _ _ _ _ _ _ _ - _ _ _ _ _ . _ . ___Y
_ - _ _ _ _ _ _ - _ _ _ _ _ _ _ _ _ _ _ - _ _ _ _ _ _ _ _ _ - _ _ _ _ _ __ --_-
11
I. 4.2.8 . NRC Conclusions
Projections by other federal agencies and private organizations concluded thatmost of the expansion from the 1974 capacity of about 476,000 MWe to the capacity of1,550,000 to 1,900,000 MWe forecast for the year 2000 will have to be by constructionof fossil-fueled and LWR nuclear power plants. The capacity of hydroelectric plants,including pumped storage might be expected to ir. crease by as much as 100,000 MWe.W Httle comercial generation of electricity can be expected from breeder reactorie INrmonuclear reactor plants. The ERDA research and development program projectsa total of 120,000 to 270,000 MWe of geothermal and solar electrical generating capa-city by the year 2000. In view of the technology that must be developed and the pilotand demonstration plants that must be operated successfully before commercial plantsare built, a combined capacity of 100,000 MWe could be considered an optimistic goal.Thus, it docs not appear that the new technologies under development by ERDA will impactsignificantly on the number of LWR's projected in this statement for the 26-year period |from 1975-2000. It appears that, depending on the degree to which conservation is |effective, 900,000 to 1,200,000 MWe of new fossil-fueled and LWR nuclear plants will beneeded in order to satisfy the projected demand.
4.3 Growth in Nuclear Electric Generating Capacity
Based on assessments of the resource base and projections of the total cost ofpower from nuclear plants versus'the cost from alternative sources, several forecastshave been made of the growth to be expected in nuclear power plant capacity to theyear 2000. The ERDA moderate high and low growth forecasts.30 and several others forcomparison.18,30.are shown in Figure III-5. Additional information on some of the
~
forecasts is given in Appendix B. Although the forecasts may differ in the rate ofgrowth predicted for the nuclear power generation capacity, almost all indicate that,absent a legislated mor torium or ban on nuclear plant construction, the electricitygenerated by nuclear plants can be expected to increase from the 6 percent of the totalgeneration in 1974 to 40% to 60% in 2000.
As part of its consideration of the various forecasts, the NRC modified the ERDAprojections to reflect certain factors. The ERDA projections are based on the com-mercialization of high temperature gas cooled reactors (HTGR's) in the 1980's and fastbreederreactors(LMFBR's)beginningin1993. The HTGR plants were removed from theERDA forecast due to the lack of commercial penetration. The FBR's were also removedto avoid the influence of the breeder reactors on the assessments of plutonium recyclein LWR's. This resulted in two modified forecasts--ERDA Moderate (High) WithoutBreeder and ERDA Low Without Breeder. These two projec.tions are also shown in FigureIII-5.
i
|
' As a result of study of the various forecasts, the NRC concluded that the ERDAModerate (High) With Breeder and ERDA Low Without Breeder projections defined reason-
able bounds for the range of growth in LWR nuclear power generation capacity thatcould be expected. TheERDAModerate(High)WithBreederandLowWithoutBreederforecasts project installed nuclear capacities of 197,000 and 156,000 MWe, respectively,
III-29
.. .- . . - . . . _ . . _ _ _ _ _ _ _ _ _ _ _ _ _ _ _ _ _ _ _ _ _ _ _ _ _ _ _ _ _ _ _ . __

_ _ _ _ _ - - _ _
,
~
FPC-982 REF. ERDA-MODERATE HIGH
_DOI-900
A.-- FPC-818 CONS. .,
800 - te
ERDA-MODERATE HIGHWITHOUT BREEDER
700 -
ERDA-LOW600 -
$2
{ 500 - ERDA-LOW WITHOUTBREEDER7
NU<% - 400 -
u
300 -
200 - FEA-220 REF.
100 -. DOI-75' ~ ~
FEA-77
I ' ' ' ' ' ' ' ' ' ' '01972 74 76 78L 80 82 84 86 88 90 92 94 96 ~ 98 2000
Y N A'R'
Figure 111-5 Forecasts of Growth in Nuclear Power Generation Capacity
III-30
- _ _ _ _ _ _ - - - - _ _ - _ _ _ _ - - _ _ _ - - - - _ _ _ _
in 1985 and 893.000 and 507.000 MWe, respectively, in the year 2000. NRC has chosGn~to base the industry size on the Low Without Breeder forecast because some reactors
have been cancelled and others have been deferred since the draft GESMO was issued in' 1974; thus, the lower projections of installed nuclear generating capacity are con-sidered realistic. FBR's are excluded so that aM plutonium generated in LWR's willbe recycled in LWR's. This removes the perturbation of FRB's from the analyses. The
' computer printouts of. the F.RDA Low Without Breeder forecast are presented in Appendix'
A of this chapter. These printouts are from the NUFUEL Program with corrections by242
Batte11e' Pacific Northwest Laboratories for the nuclear poisoning effects of Pu and
236U in recycle fuels.
The economic analyses presented in CHAPTER XI are centered on growth patterns
bounded by the Moderate (High) With Breeder case and the Low Without Breeder case.The Moderate (High) Without Breeder and Low With Breeder cases were also analyzed todetermine the seasitivity of the costs to the size of the LWR industry.
In the absence of other constraints, the growth in LWR nuclear power generationwill depend on the total cost of the electricity generated by nuclear power plants,including the costs of all the safeguards, compared to the cost of electricity gen-erated by other sources. If the growth of nuclear power is even less than forecast,the benefits will be less than forecast in this report. Because differential environ-mental impacts are also proportional to the quantity at auclear power generated, theyalso can be expected to change directly with the size of the LWR industry.
5.0 ROLE OF PLUT0NIUM RECYCLE
5.1 Domestic Uranium Resources and Relation to Us'e of LWR's
The analyses presented in this statement cover the 26-year period from 1975-2000,
a period during which reasonable projections may apply. A longer range projection,beyond that time frame into the next century, would have to include additional con-
'siderations such as the long term availability of uranium resources, the emergence ofother technologies such as laser enrichment and the contribution of other potentiallycheaper power' systems such as fusion, solar and geothermal. The ERDA estimates of thedomestic uranium resources that are economically recoverable, 3.6 million tons ofU 0 , are presented in Table !!!-11. The ERDA estimate is on the low side of a range33
of 2 to 10 million tons, which (CHAPTER XI) represents a spectrum of views by industrysources on_this subject. The ERDA estimate is considered to be conservative becauseit is based on reports that, historically, have been made to ERDA only when industry
is preparing to mine such resources.
24Figure III-6 shows the ERDA projection of the quantity of uranium that would be
committed for the various scenarios for projection of nuclear power generation.Scenario III is based on a projected. nuclear generation capacity of about 720 GWe in
the year 2000 with recycle of both uranium and plutonium. With no recycle, the same i
would fuel about 540 GWe. As shown, the ERDA estimate'of economically. quantity of U 033I recoverable uranium resources exceeds the projected uranium commitments for LWR's.
III-31
.
--m

.. _ . . . _ _ _ __
3.6------ - -- - -- - --
U.S. URANIUM RESOURCESNUCLEAR POWER GENER ATION
CAPACITY IN GWe3.0 -
720,
h3 2.5 -
g SCENARIOSo 0 No New initiatives* 1 Improved Efficiencies in End Use$ 2.0 - 11 Synthetics from Coal and Shale
Ill Intensive Electrificationo +-- 0 & ||5 IV Limited Nuclear Power
V Combination of All Technologiesuo 1.5 -
gigm I&Vzo
1.0 --
y,
200
0.5 -
ASSUMING PLUTONIUM RECYCLEAND 0.20 TAILS ASSAYS
I I I i 1
-1975 1980 1985 1990 1995 2000CALENDAR YEAR
Figure ill-6 Projected U 0 Commitments for Model LWR's38(Source: ERDA 48)
III-32
. _ . . . _ . . . . _

A second potential impact on the nuclear growth scenario depends not on the totalavailable uranium ore resource but on the ability of the mining and milling industry
,to produce sufficient refined U 0 to meet the demand on a year-by-year basis. Develop-38. ment of this capability by the industry does depend in part on the availability ofresources, since capital commitments to mines and mills will not be made until ore
deposits are confimed, but it also depends on the inherent ability of the industry to-expand rapidly enough to meet the demand. This limitation on ore production capability,if it occurs, may impact LWR power production in the mid-1980's.
While uranium and plutonium recycle can have an appreciable effect in stretchingout the potential power available from fixed ore resources by as much as 30%, theimpact of recycling fues on a near-term basis will be considerably less, reducing theore demand by about 16% in 1985 and about 20% in 1990 (see paragraph 1.5. CHAPTER IV.
Section F). This is because in a growing nuclear economy much of the ore will be neededto provide initial cores for new reactors and these new reactors will not contribute tothe overall production rate for several years after initial operation.
In sunnary, the supply of uranium ore available in this country mcy be an importantfactor in determining the long term (in the 21st century) size of the LWR industry. Ifthe supply is less than projected by ERDA, the installation rate of LWRs may be lowerthan projected; on the other hand if the supply is greater, more LWR's than projectedmay be built. In addition, independent of overall uranium supply, the growth of instal-led LWR generating capacity could be limited by the ability of the uranium mining-millingindustry to meet the demand. Uranium and plutonium recycle to LWR's could serve tomitigate any effects of uranium supply to some extent and allow the industry additionaltime to exploit alternate energy sources; however, for this analysis, recycle of only..uranium or recycle of both uranium and plutonium are not judged to affect the number ofLWR's in the time period considered by the GESMO Statement.
~
5.2 Availability and Dependence on Foreign Supplies
Uranium resources have been discovered and are being exploited in a number offoreign countries. Currently estimates of reasonably assumed uranium resources inthe $15 fib category outside the United States are slightly over one million tons withthe majority of the deposits (75%) occurring in Australia, Canada, and South and South-west Africa. (Additional details on foreign uranium resources are given in ~ paragraph1.3 of CHAPTER IV, Section F of this report.) However, expanding nuclear programs
'in other countries are expected to place heavy demands on these supplies. I This,plus the fact that dependence on foreign ore would leave a major source of U.S. elec-trical generation capacity depending on the vagaries of international politics (witnessthe current concerns over our dependence on imported petroleum), makes dependence on-
foreign uranium resources highly undesirable.
5.3 - Relationship Between pu Recycle and the Long Term Nuclear Option
.In the context of currently recognized technological capability and the avail-ability of fossil fuel reserves, nuclear power is envisioned as a major contributor to
111-33
_ _ _ _ - - _ _ _ _ _ _ _ _ _ _ _ _ _ _ .
_ _ _ _ _ _ -
i.
-the overall national energy supply in the twenty-first century. From the foregoingdiscussion on uranium ore resources and the demands made on them by " burner" reactorsit is clear that such a long term nuclear option can be sustained only by developmentof alternate " synthetic" supplies of fissionable material. There are two candidates
238 233 232in this area, plutonium bred from fertile U and U bred from fertile Th.
!
24The national plan for energy research and development envisions the former ofthe two options as the most promising. Therefore, the bulk of the ERDA research and j
development effort has been and will be directed toward the liquid metal fast breeder230reactor (LMFBR) concept which utilizes the U-Pu fuel cycle. If the ERDA plan is
realized, plutonium recycle will be required because it forms the basis of the fuelsupply for the breeder reactor. In this larger context, plutonium recycle to LWR'swill assume a relatively minor status. However, in the early stages of implementationof the nuclear plan, LWR plutonium production, reclamation, and utilization assumes amajor role, both because of its potential to augment a valuable natural resource andbecause LWR plutonium will be necessary for the initial charges to the first generationof breeder reactors. If the ERDA estimate of uranium resources is correct there willbe ample plutonium produced by LWR's to supply both the LMFBR initial core requirementsand provide a substantial incremente. contribution to LWR produced power. If the oresupplies are limited, LWR fuel will still have to ve reprocessed and the plutoniumsaved if the breeder program is to succeed. To the extent that plutonium is notneeded by the plutonium breeder concept, plutonium recycle to LWR's will allow anextension of the period during which LWR reactor power can utilized.
5.4 The Availability of plutonium
The cumulative quantity of fissile plutonium recovered from spent LWR fuel isshown in Table !!I-18 for the ERDA Low Case Without Breeder. In the year 2000, thecumulative quantity of fissile plutonium recovered is 689 metric tons (MT) for theuranium only recycle option and 790 MT for recycle of both uranium and plutonium.
Although this analysis centers on a case that excludes FBR's (Low Growth WithoutBreeders), the recycle of both uranium and plutonium in LWR's would result in thedevelopment of fuel cycle facilities needed for the FBR fuel cycle, such as reproces-sing plants, Pu0 conversi n facilities and MOX fuel fabrication plants. Unless both
2U and Pu are recycled in LWR's, these fuel cycle facilities might not be in placewhen needed for FBR's. Additional benefits would accrue from the fact that thesafeguards and transportation systems for plutonium would be in place. Conversely, ifLWR fuel is not recycled, there would be no comercial plutonium available to fuel theearly FBR's.
6.0 THE LWR INDUSTRY IN THE YEAR 2000
The LWR industry projected in the year 2000 for each of the three recycle optionsis shown graphically in Figures III-7, III-8, and 111-9. The materials flow is shownfor each step of the fuel cycle as well as the cumulative quantity of material proces-sed for the period 1975 through 2000 and the numbers of each type of fuel cyclefacility in the year 2000. (See also Tables 111-1. III-2 and III-3.)
j
111-34
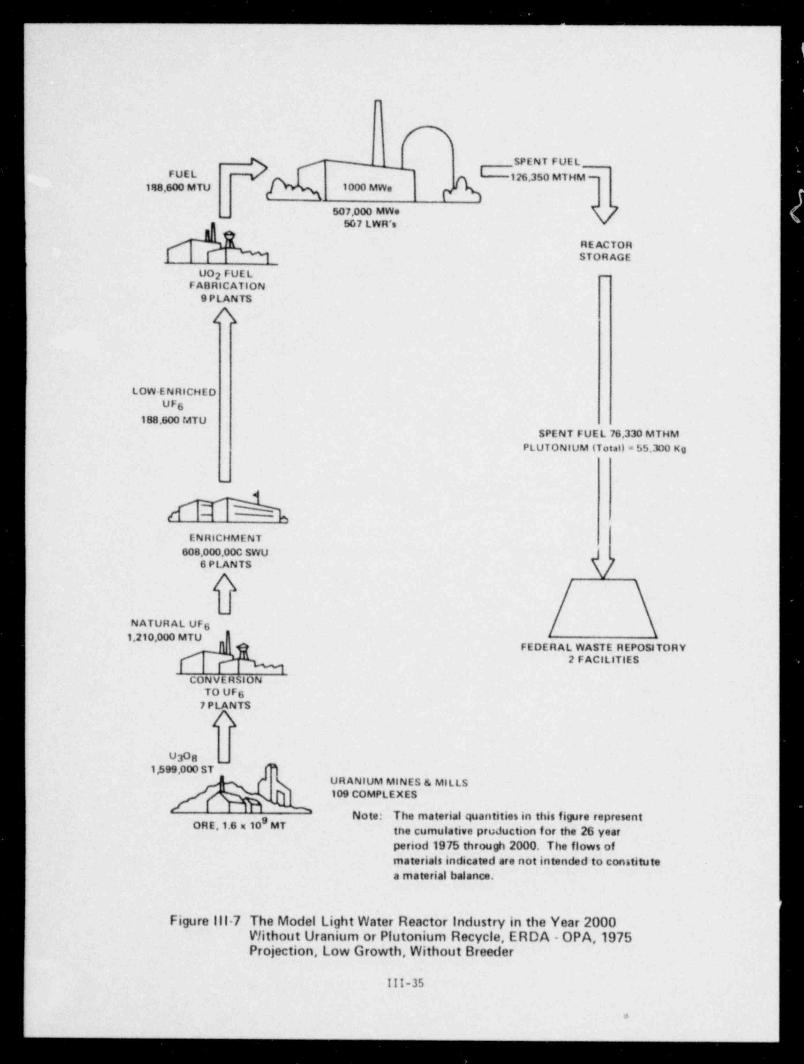
_ _ _ _ _ _ _ _ _ .
-
% SPENT FUELFUEL 126,350 MTHM -
148,600 MTU 1000 MWe p507,000 MWe
_
507 LWR's
REACTORSTORAGE
UO2 FUEL -
FABRICATION9 PLANTS
A
LOW ENRICHEDUF6
188.600 MTUSPENT FUEL 76,330 MTHM
PLUTONIUM iTotal) = $5,300 Kg
/ %ENRICHMENT
008,000.00C SWU6 PLANTS
A_
NATURAL UF6* '
FEDERAL WASTE REPOSITORY2 FACILITIES
CON V E RSION
TO UF6I7 PLANTS j
bU038 _
1J599.000 STURANIUM MINES & MILLS109 COMPLEXES
Note: The material quantities in this figure representORE,1.6 x 10, MT
the cumulative production for the 26 yearperiod 1975 through 2000. The flows ofmaterials indicated are not intended to constitute Ia material balance. |
|
Figure ill 7 The Model Light Water Reactor Industry in the Year 2000Without Uranium or Plutonium Recycle, ERDA - OPA,1975Projection, Low Growth, Without Breeder
III-35
#

_ _ _ _ _ _ _ _ _ _ _ _ _ _ _ _ _ _ _ _ _ _ _ _ _ _ _ _ _ _ _ _ _ _ - _ _ _ _ _ _ _ _ _ . -
9
O -
_
I SPENT FUEL1000 MW* 126.3SO MTHM6 M HM p
_807,000 MWe
607 LWR's
i
UO2 FUEL REPROCESSINGF ABRICATION 6 P LANTS
9 PLANTS -
E NRICHE D U F6188,800 MTU
ENRICHMENT R 'U813.400,000 SWU 114,100 MTU
GPLANTSHtGH LEVEL WASTES = 40,500 Cansters
(melmles 689 MT PuglNATUHAL UF T RANSURANIC WASTE S = 693,000 Drums61,000,000 MTU
VCONVE RSION
TO UFg
6 3 ANTS'
AV Os FEDERAL WASTE REPOSITOHYJ
1,431.000 ST 2 F ACILITIES- .
UR AN6UM Mi* DES & MILLS
95 COMPLEX [S8ORE,1.44 m 10 MT
Note: The meterial quantiths in this fieste representthe cumulative production for the 26 yearperiod 1975 through 2000. The flows of mater-leis indicated are not intended to constitute ameterial helence.
Figure 1118 The Model Light Water Reactor Industry in the Year 2000With Uranium Recycle Only, ERDA OPA,1975 Projection,Low Growth,V/ithout Breeder
!!I-36
_ _ _ .

!
-
j'FUEL , ,
SPfast FUELASSEMBLIES 1000 MWe A
126,350 MTHM ,
' 180,000 MTHM p'50>.000 MW. y
(E
" 507 LWR's
UO2 FUEL REPROCESSINGFABRICATION SPLANTS |
7 PLANTS '
PLUTONIUM
b 790 MT Pug
|
ENRICHED UF6163250 MTU RECOVER ED URANIUM
114,000 MTU
PuO2788 MT Pug
J uixEo OxioEFUEL F ABRICATION
< 8 PLANTS
E NRICHMENT523,000,000 SWU
5 PLANTS
NATURAL UF6
HIGH LEVEL WASTES = 40,500 CanistersNATUR AL UO2 TR ANSURANIC WASTES = 789,000 Drums
24,250 MTU
CON V E RSION
TO UF6S PLANTS
AU038
1.242,000 ST-
URANIUM MINES FEDERAL WASTE REPOSITORYAND MILLS 2 FACILITIES
77 COMPLEXES
8ORE,1.25 a 10 MT
Note: The .wterial quantities in this figure representthe camulative production for the 26 yearperiod 1975 through 2000, The flows ofmaterials indicated are not intended to constitutea material balance.,
MOX RODS25,350 MTM
Figure 111-9 The MOdel Light Water Reactor industry in the Year2000 With Uranium and Plutonium Recycle, ERDA - OPA, !1975 Projection, low Growth,WithOut Breeder
!I
-III-37

_ . . .
Table III-18
CUMULATIVE FISSILE PLUTONIUM RECOVERED FROM LWR's
(ERDA LOW CASE WITHOUT BREEDERS)
Recycle ofYear U Recycle Only (MT) Both U & Pu (MT)
1975 0 0
1980 0 12
1985 0 68
1990 142 190
1995 386 4 31
2000 689 790
Models based on estimated capacity and process were developed for each type of fuelcycle facility. These models are described in the various sections of CHAPTER IV.
The LWR industry projected in this chapter is an extrapolation of the presentindustry. It is the basis used throughout this statement for asse:. sing the incrementalenvironmental and economic impacts of recycling uranium only or recycling both unaniumand plutonium. Both recycle options are based on the assumptions that spent fuel willbe reprocessed, that liquid high level wastes will be solidified and that the solidi-fled wastes will be sent to a Federal respository and be managed by the Federal Govern-ment. Variations of those recycle options to reflect variations in timing are discussedas alternatives in subsequent chapters. Those alternatives are discussed in detail inC:tAPTER VIII and are compared in CHAPTER XI. The detailed economic analyses arealso presented in CHAPTER XI.
6.1 The Components of the LWR Industry
The cc ponents of the LWR industry will be described in more depth for each of thethree options:
No recycle-
- Recycle of uranium only
Recycle of both uranium and plutonium-
6.1.1 Reactors
More than 500 nuclear power plants of 1,000 MWe generating capacity each are pro-jected for the LWR industry in the year 2000 regardless of which option is under con-sideration. With no recycle or with recycle or uranium only, all 500 reactor, would-be fueled with slightly enriched U0 . If both uranium and plutonium were recycled, it
2
!!I-38
. . . . _

_ _ _ _ . - - _ - _ - - - - _ -.. .. .. ..
~
is likely that some of the fuel in about half the reactors would be mixed oxide and theremaining LWR's would be fueled with tiie standard type of slightly enriched U0 with
2no plutonium aoded.
- The light water reactor industry has two types of reactors, pressurized waterreactors (PWR's) and boiling water reacto*s (BWR's). For equivalent power ratings.BWR's typically have larger cores snd longer fuel residence times than PWR's; henre,the inventory of long half life nuclides including plutonium accumulated in the core isnoticeably larger in BWR's than in equivalent PWR's. Therefore, for purposes of assess--ing the potential environmental impact of LWR operations, the boiling water reactor hasbeen chosen as the basis for characterizing the model reactor. This was done to providean assured margin of safety for the evaluation of radioactive effluents at LWR sites.
If uranium and plutonium were both recycled,13.4% of the total fuel fabricatedfor the LWR industry over the 26-year period would be mixed oxide. In the year 2000, |
2.650 MTHM of M0X fuel and 10,850 MTH of UO fuel w uld be fabricated (Appendix III-A, I2
p. III A-8). This study assumes that the model plutonium recycle reactor would contain1.15 times as much plutonium as had been generated in its own fuel. The 1.15 self-generation rate (1.15 SGR) is discussed in CHAPTER IV, Section C. In the model reactor,
approximately 40% of the fuel rods contain mixed oxide and 60% contain low enrichedUO . Because 2.650 MTHM of the 13,500 MTHM fuel required for the industry in the year
22000 would be mixed oxide and because mixed oxide is assumed to be contained only inequilibrium SGR's, then it follows that the number of such equilibrium SGR's in theyear 2000 would be about 250.* Thus, with recycle of both uranium and plutonium,about half of the 500 reactors of 1,000 MWe each in the year 2000 would be using somemixed oxide fuel. The remaining half of the LWR's would be fueled solely with slightlyenriched UO '**'
2
6.1.2 Mixed Oxide Fuel Fabrication
Recycle of plutonium in light water reactors would require production of about25,000 MTHM of mixed oxide (UO2 + Pu0 ) fuels over the 26-year period and about 2,600g
MTHM in the year 2000. Production of 2,600 MTHM in the year 2000 is projected to takeplace in 8 model mixed oxide fuel fabrication facilities; each having a capacity of 360MTHM/yr.
Mixed oxide fuel fabrication would require special facilities that would not berequired for the options with no recycle of plutonium. Because of the toxicity and. radioactivity of the plutonium it is judged that manufacture of mixed oxide fuels in
x 507 = 24913 x.0.4An alternative calculation based upon 81.6 MT Puf from p. III A-8. 581 Kg Put in 1/3of the reactors (BWR's) f am CHAPTER IV, Section C) and 485 Kg Put in 2/3 of the
Pureactors (PWR's) (not reported elsewhere in this document) and f ratio of 0.6 yields. Vu~
an estimate of the number of 1.15 SGR's in 2000 as 264, i.e., abobt 250.
**The number of reactors employing some M0X fuel could be higher if some of them have11ess than an equilibrium 1.15 SGR loading of plutonium.
III-39.
'' -'-
- -- -
. . . . . . . . . .
_ _
- _ _ _ _
cxisting er modified low enriched UO fuels fabrication plants would not be feasible.2
There are currently no comercial production scale manufacturing plants for mlxed t xide*
fuel although five pilot scale plants with a total estimated capacity of 50 to 70MTHM/yr are licensed to fabricate mixed oxide fuel (CHAPTER IV, Section D). TheWestinghouse Electri- Corporation has applied for a license for a production scalefacility (Westinghouse Recycle fuels Plant) for the manufacture of mixed oxide fuelrods. This plant is planned for a nominal capacity of 200 MTHM/yr with eventual expan-sion to 400 MTHM/yr. If a decision is made by about 1977 to recycle Pu, comercialoperation could begin in the early 1980's.
It is anticipated that commercial mixed oxide fuel fabrication plants will bedesigned for large production capacities to take advantage of sc;1e. Larue throughputswill be important economically because the requirements for safety, safeguards and pro-tection of the environment for each new plant will make such plants capital intensive.
The net impact on the mixed oxide fuel fabrication industry of recycling plutoniumin LWR's is to increase the size of the industry from essentially none at present toabout 8 fuel fabrication facilities (360 MTHM/yr capacity each) by the year 2000,
6.1,3 Fuel Reprocessing
fuel reprocessing plants would be required if uranium or both urantum and plu-tonium were recycled.
The anticipated total reprocessing load would be approximately 115,000 MTHM over
the 26-year period and 10.250 MTHM in the year 2000. Thus, at the end of this centuryfive equivalent model reprocessing plants would be required if uranium only wererecycled of if both uranium and plutonium were recycled. This is discussed in detailin CHAPTER IV, Section E.
6.1.4 The Sufporting Uranium Cycle
The total demand for low enriched UO fuels during the entire period from 1975-2
2000 would be about 188,000 MTU if only uranium were recycled and about 163,000 Mfu ifboth uranium and plutonium were recycled. In the year 2000, the total annual den.andfor low enriched 00 fuels w uld be 13,500 MTU for no recycle or if only uranium were2
recycled and 10,850 MTU if both uranium and plutonium were recycled. These estimatesshow that recycle of both uranium and plutonium result in reductions of 13% for thetotal requirement for 00 ver the 26-year period and 207 for the requirement in the2
year 2000. -These reductions would be achieved by substituting a total of 25,330 MTHM
of mixed oxide fuel (UO2 + Pu0 ) f r low enriched 002 7 fuel from 1975 through 2000 and2.647 MTHM in the year 2000. About ninety-five percent of the mixed oxide fuel wouldbe non-enriched U0 . This study assumes that mixed oxide fuel would be made with2
recycle Pu0 diluted with natural 00 and that the natural U0 w uld be supplied to the2 2 2mixed oxide plants by the UF industry as an intennedtate product.6
lt'.40
_ _ _ _ _ _ _ _ _ _ _ _ _ _ _ - - _ _ _ _ _

._______ __ ______ - ______ - - -_ - - -
Thusi the individual components of the supporting uranium cycle would expirftncea decrease in ' demand if uranium only were recycled and a greater decrease if bothuranium and plutonium were recycled. The components of the supporting granium fuelcycle in which the decreased demand would be experienced are the following:
Mine-mill complexes-
- UF C "'' 0"6
- U enrichment
UO fuel fabrication-
2
6.1.4.1 Mine-Mill Complexes
'Mine-mill complexes * are postulated to consist of one mill and the associatedmines that provide ore to it. In the yee 2000, two sizes of mills are anticipated.The average capacity of existing mills is about 1,800 tons ** or ore per day, whereas
. the capacity of newer mills is expected to average 3,500 tons daily. It is assumedthat each mill would receive ore from both underground and open pit mines, 60% from
underground mines and 40% from open pit mines. The annual ore production of existingunderground mines averages aLaut 14,000 tons, but newer mines are expected to have an
average annual capacity of about 20,000 tons. The annual production of exit ting openpit mines averaged about 140,000 tons of ore in 1974 but the newer open pit nines areexpected to have an average annual capacity of 200,000 tons of are each. In the past,the ore grade has averaged about 0.2% U 0 ; in the year 2000, the grade is estimated to38average about 0.1% U 0 , meaning that twice as much are would have to be processed for38each ton of U 0 . A typical mine-mill complex in existence today consists of one mill,38about eight underground mines and one open pit mine. A typical newer mine-mill complexis postulated to consist of one mill, one open pit mine, and about 37 underground mines.
If uranium and plutonium are not recycled, the estimated U 0 required to fuel3gLWR's is 1,600,000 short tons over the 26-year period, and 113,900 short tons in the
year 2000. This would require processing about 125 million short tons of ore per year.in about 16 older mine-mill complexes that now exist and 93 newer mine-mill complexesfor a total of 109 mine-mill complexes in the year 2000.
-If only uranium is recycled, the projected U 0 requirements would be reduced by38170,000 tons (10.5%) over the 26-year period and by 15,000 tons (13.3%) in the year2000. : This would require processing about 125 million short tons of ore per / ear inabout 16 older mine-mill complexes that now exist and 93 newer mine-mill complexes fora total of 109 mine-mill complexes in the year 2000. The reduced quantity of ore andU0 could be processed by about 77 model mine-mill complexes (16 older, 61 newer).38
*The concept of "mine-mill complex" is used here to facilitate discussion of themining and milling industry. Accordingly, a conceptual model of an average sizemill and a group of average size mines to supply ore to the mill was developed.
. In actuality, the sizes of nills and mines vary widely and there is no " averagecomplex."
|
<
** Tons indicates short tons, and MT indicates metric tons.
III-41
- _ _ _ _ _ - _ - _ - .
. . , . . - -
f ,
'
[Nbothuranium'andplutoniumarerecycled,theU0 requirements could be38reduced by 22.3% over the 26-year period and 29.3% in the year 2000. The reducedquantity of ore and d 0 could be processed by about 77 model mine-mill complexes (1638
- older, 61 newer).,
Thus, the net effect of recycling only uranium or of recycling both uranium andplutonium in LWR's is to reduce the number of typical mine-mill complexes from 109 to |
95 and from 109 to 77, respectively. Because 16 complexes are already in place and. assumed to continue operating, recycling uranium only would reduce the number of newcomplexes required by 13% and recycle of both uranium and plutonium would reduce the
number by 29%.
- 6.1.4.2 UF Conversion6
Two types of plants are expected to convert U 0 to UF in the year 2000. One is38 6based.on an aqueous process using solvent ' extraction purification. It is called thewet process for UF because it is based on aqueous technology. ' The other uses the
6- Hydrofluor process (dry process), which is based upon nonaqueous technology wherein
purification is effected by distillation of volatile uranium 'exafluoride. The Hydro-~
h
fluor process produces relatively low volumes of liquio effluents. There are nowtwo operating commercial UF facilities. One uses-the dry process, is located at
6,
Metropolis, Illinois, and has the capacity to convert annually 14,000 tons of uranium*
as U 0 to UF . Theotherusesthewetprocess,islocatedatSequoyah,Ok|ahoma,and38 6has the capacity to convert annually 5,000 tons of U as' U 0 to UF '3g 6 $
> The UF conversion requirement for the 26-year period is projected to be 1,200,0006
MTU with no uranium or plutonium recycle, 1.100,000 MTU with recycle f uranium only.i and 920,000 MTU with recycle of both uranium and plutonium. In the year 2000, the' annual requirement for each of the 3 recycle options would be 87.300 MTU, 75.500 MTU
and 59,300 MTU, respectively.
Th' analysis assumes that the UF CUUV'#3 ion industry in the year 2000 would6 .
consist of the two existing facilities (with the wet process plant upgraded to a capa-city of 9,100 MTU/yr) plus 5, 6, or 7 new 15,000 MTU/yr plants, depending on whether thechoice is recycle of both uranium and plutonium, only uranium or no recycle. Becausethere appears to-be no unanimous preference for either process, it is expected that the
j> new facilities would be evenly divided between the two processes if only uranium isrecycled. If there is no recycle, or if both uranium and plutonium are recycled, it isassumed that four and three of the new plants, respectively, would use the dry process-
I and three and two, respectively, would use the wet process.
- Thus, in the year 2000, the recycle of uranium only would reduce the number of'>
'' 15,000 MTU/yr UF conversion plants from 7 to'6 and the recycle of both uranium and
6, plutonium would reduce the number of large plants from 7 to 5. To prorate associated*
environmental impacts, it is assumed.that if only uranium were recycled, the reduction
- would be about'l/2 of a 15,000 MTU/yr. wet process plant and 1/2 of a dry process plant.*
The reduction would be ore plant of each type if both uranium and plutonium were recycled. ~1
1
III-42 - !
, -- . - . .- - .
_ _ _ _ - _ ____ --
'6.1.4.3 ' Uranium Enrichment-
This study projects that the enrichment of uranium in the United States in theyear 2000 would be performed.in two types of enrichment facilities. One type wouldconsist of the three existing gaseous diffusion plants (owned by the U.S. Government)upgraded to provide an aggregate capacity of 27.7 million separative work units peryear (SW/yr). A second type would be gas centrifuge facilities that are expected tohave an annual capacity of about 8.75 million SW each. It is assumed that the first
.new enrichment plant would be an 8.75 million SW gaseous diffusion plant and that allsubsequent plants would utilize the gas centrifuge technique. The annual volume of lowlevel waste from a model gas centrifuge process is expected to be about 56 times greater
-than that from a model gaseous diffusion plant for the same quantity of separativework. However, the impact due to release of radiological effluents to the environmentis abt i the same for each type of plant.
The projected uranium enrichment demand for the 26-year period from 1975 throughthe year 2000 would be' 608 million SW if there is no recycle, 613 million SW if onlyuranium is recycled and 523 million SW if both uranium and plutonium are recycled. In
;
the year 2000 alone, the annual enrichment demand for no recycle, recycle of uranium |only or recycle of both uranium and plutonium would be 45, 45.5 and 36.1 million SW's,respectively. If uranium and plutonium were not recycled or if only uranium wererecycled, the enrichment requirement would be essentially the same and could be met bysix plants, i.e., the three upgraded facilities and three new facilities. If bothuranium and plutonium ara recycled, only two new facilities would be required. Thus,recycle of. both uranium and plutonium would reduce the size of the uranium enrichmentindustry by one 8.75 million SW/yr capacity plant.
6.1.4.4 UO Fuel Fabrication2
A typical UO fuel fabrication plant is expected to have an annual capacity of21,500 MTU/yr. It would be capable of processing slightly enriched UF into UO fuel
6 2assemblies. A typical facility would also be capable of processing its own dirty scrapusing a nitric acid based aqueous process. Two types of processes for converting UF
6to UO2 p wder are expected to be in use at the end of this centur). One is the tra-
- ditional amonium diurante (ADU) process wherein UF is reacted with water and amonia6
to yield a precipitate of ammonium diuranate and large volumes of liquid effluents,f_ The other process, which is often referred to as the dry conversion or direct conversion
process,; reacts UF wi'.h steam and hydrogen to yield UO . Although the dry process6 2when fully developed is expected to yield lower volumes os liquid effluents, this studyconservatively assumes all plants would use the ADU process.*
The projected requirement for U0 fuel fabrication for the 26-year period is2188,600 MTU if there is no recycle or if only uranium is recycled and 163,240 MTU ifboth uranium and plutonium are recycled.
In the year 2000, the projected 507 operating LWR's would require about 13,500 MT
of fuel. If there is no recycle or tf only uranium is recycled, the industry would be
*See CHAPTER IV, Section F, for more detailed description of plants.III-43
.. . . . . . . . .. . . . ,.. . . . . . . . .. . . . _ _ _ _ _ _ _ _ _ _ ___

____--__
the same and the entire 13.500 MT would be supplisd as UO fuel from nine 1,500 MTU/yr2
plants. If both uranium and plutonium are recycled, the UO fuel fabrication industry .2
would supply about 10,800 MTU and 7 plants woufd be required. This study assumes thatif both U and Pu were recycled, natural U0 w uld be used in the 2,650 MT of mixed
2oxide fuel requirement projected for the year 2000. This natural UO. would be suppliedj
to the mixed oxide plants by the UF conversion industry as an intermediate product.6
Thus, the environmental impact of the uranium fuel fabrication industry would beessentially the same if there is no recycle or if only uranium is recycled. However,if both uranium and plutonium are recycled, the effect would be the reduction in sizeof the industry from nine to seven 1,500 MTU/yr plants, thus saving two plants.
6.2~ Transportation
The impact *of the transportation component on the LWR industry for each of threeoptions is assessed in terms of differences in the numbers of total shipments of fuelto and from the reactors and shipments of various plant feedstocks, products, scrap andwastes.
If there is no recycle of uranium and plutonium, the significant transportationcomponent would consist of shipment of enriched UO fr m the enrichment plants to the
2fuel fabrication plants, shipment of unirradiated fuel assemblies to the reactor and,ultimately, shipment of irradiated fuel assemblies from the reactor to interim storaceor to a Federal repository. If only uranium is recycled, the significant transporta-tion component would consist of shipment of enriched UO fr m the enrichment plants to
2the fuel fabrication plants, shipment of unirradiated fuel assemblies to the reactor,shipment of irradiated fuel assemblies from storage at the reactor to a reprocessingplant and shipment of plutonium and high level waste to a Federal repository. Shipmentof irradiated fuel assemblies to a Federal repository would be eliminated.
If both uranium and plutonium were recyled, the significant transportation com-ponent would consist of shipment of enriched UO from the enrichment plants to the
2fuel fabrication plants, shipment of Pu to the MOX fuel fabrication plants, shipment ofM0X fuel rods to the UO fuel fabrication plants, shipment of unirradiated fuel assem-
2blies to the reactors, shipment of irradiated fuel assemblies from storage at thereactors to the reprocessing plants and shipment of high level waste to a Federalrepository. Shipment of plutonium to a Federal repository would be eliminated.
The total mileage and impacts from shipments of fuel material and waste materialsfor the three options are discussed in CHAPTER IV, Section G. Compared to no recycle,
the total shipping distances for the 26-year period (for categories of shipmentsaffected by recycle of U or both U and Pu) including return of empty containers would
' decrease by approximately 17% if only uranium is recycled and by about 6% if bothuranium and plutonium are recycled. The decrease is due to reduced shipments of spentfuel assemblies. The study assumes that for no recycle the spent fuel assemblies wouldbe shipped twice (first from the reactor to a spent fuel storage facility and later toa Federal repository) but for recycle of U or U and Pu, the spent fuel would be shipped
,
once (from reactor to reprocessing plant). Two significant mileage increases would |
III-44
_ _ _ _ _ _ _ _ . - - _ _ _ _ . _ . __ - _ _ _ _ _ _ - _ _ _ _ _ _ _ _ - _ _ _ _ _ _

. .
result from shipping Pu02 powder to the mixed oxide fuel fabrication plants and shippingmixed oxide fuel rods to the UO fuel fabrication plants. A mileage decrease would
2result from shipping less Pu02 to storage.
The recycle of uranium or both uranium anc nluto:fum would result in reduced totalshipping distances for radioactive wastes and for , anium ore and U 0 concentrates
38over the 26-year period and in the year 2000. Major mileage increases would resultfrom shipment of low level alpha waste * from reprocessing plants to a Federal repository.
Shipment of uranium ore from mines to mills and shipment of U 0 concentrates from38mills to UF6 conversion plants does not impact significantly on the environment; however,these shipments would be reduced if only uranium or both uranium and plutonium arerecycled. For example, if only uranium is recycled, the shipments would be decreasedby 10 percent over the 26-year period and by 13 percent in the year 2000. If bothuranium and plutonium are recycled, the shipments would be reduced by 13 percent overthe 26-year period and by 18.5 percent in~the year 2000.
Other reductions in shipping mileage would accrue from recycle both uranium andplutonium. Over the 26-year year period, shipments of UF to enrichment plants and low
6enriched UF to U0 fuei fabrication plants would be decreased by 13 percent. In the
6 2year 2000, these shipments would be decreased by approximately 20 percent.
Transportation is discussed in detail in CHAPTER IV Section G.
6.3 Waste Management '
Although radioactive wastes are produced in all steps of the fuel cycle If onlyuranium or both uranium and plutonium are recycled, the wastes produced at the separa-tion step of fuel reprocessing would contain more than 99% of the total activity of ellthe wastes produced. The reprocessing wastes contain virtually all of the fission;
products and transplutonium actinides plus about 0.5% of the uranium and plutoniumpresent in the spent fuel from LWR's. All other radioactive wastes are categorized asother than high level wastes. These other radioactive wastes are generated duringreactor operations, M0X fuel fabrication, fuel reprocessing (other than U and Puseparation) and 00 support cycle operations.
2
Other than high level wastes that contain in excess of some limit * of transuraniumalpha activity are a special subdivision of other than high level wastes and areexpected to be sent to a Federal repository. Designs of the disposal facilities arenot final but the concept is discussed in detail in the section on waste management.(CHAPTERIV,SectionH).
Other thal high level wastes that contain more than trace concentration of trans-urasium alphs activity are expected to be managed by burial at comercially operated
* Low level alpha wastes are other than high level wastes containing not more than traceconcentrations of transuranics, e.g.,10 nC1/g.
!!!-45

. ,
4
> . burial sites located on State or Federally owned land. These wastes are essentially' the same for any fuel' cycle option selected. A model burisl site consists of about
100 acres with a total capacity of 25 million cu ft of waste.-~
The solid wastes resulting' from reactor operations consist of spent ion exchange -.j
L resin,~ filters, filter sludge and evaporator bottoms. The quantity of this wastewould be about the same for all three options and the radioactive composition of Gie
- waste would not vary significantly. It is projected that the total wastes gener.ted' from all' LWR's over the 26-year period would be about 18 million drums (135 million cuft). Because this waste is not expected to contain.more than trace concentrations of *
transsuranium alpha activity, it could be sent to a comercial burial ground. Approxi-- mately 540 acres of commercial waste burial ground would be required for this reactor: generated waste. The projected cumulative waste for the 26-year period from 1975-2000is summarized for each of the three recycle options in Table III-19.
-
Table III-19~E PROJFCTED CUMULATIVE WASTE INVENT 0pV_
IN THE YEAR 2000
Fuel Cycle Option
jpeofWaste No Recycle U Recycle Only U and Pu Recycle.-
1. Spent Fuel Assemblies 400,000 37,000* 37,000*
' 2. High Level None 37,000 canisters 37,000 canisters
- -3. Transuranic Waste None 365,000 drums 460,000 drums
- 4. Hulls and Other Parts None 250,000 drums 250,000 drumsof Spent Fuel ElementsTransuranic Waste
5. Low Level Waste6 6 6'
-a. From Reactors 18 x-10 drums 18 x 10 drums 18 x 10 drums6 6 6b. From All Sources 20 x 10 drums 20 x 10 drums- 20 x 10 drums
*These 3i, s fuel assemblies would be in inventory awaiting reprocessing.' They wouldwould not be waste.
,
. No Recycle of Uranium or Plutonium :;6'3.1.;
-If there is no recycle of uranium or plutonium, there would be no reprocessing -. _
and the spent fuel elements themselves would constitute.the high level waste;'thus,more than' 99% of the activity in the waste resulting from the entire fuel cycle wouldrema'in in the spent fuel assemblies. For the 26-year period, the projected cumulative
- inventory of ' spent fuel in fuel assemblies would 'be about 126,350 MTHM or.about.,
- 400,000 fuel ' assemblies (based upon 2/3 of the reactors being PWR's and -1/3 being
BWR's). These spent fuel assemblies could remain up to 10 years or longer in storage-
, 1
*
III-46
: --_ _, - ;-._. -. __ _ _

- - - - - - - - .
. .. . .. .. ,
pools at the reactors or special storage facilities, but would ultimately be sent toFederal repositories for packaging and permanent storage. Two Federal repositoriesare projected for, the year 2000 (Table III-1). Spent fuel storage is discussed indetail in CHAPTER IV. Section K.
-
. 6.3.2 Recycle of Uranium Only or. Recycle of Both Uranium and Plutonium ;1
If only uranium is recycled, spent fuel would be reprocessed to recover usable235U and plutonium would be sent to a Federal repository. (As shown in Table III-2,two Federal repositories are projected for the year 2000.) The most difficult of the
~ radioactive wastes to handle from a standpoint of heat and shielding would be the highlevel liquid wastes (defined as aqueous waste resulting from operation of the first '
cycle extraction system and the concentrated waste of subsequent extraction cycles ina facility for reprocessing irradiated fuels). These wastes would contain essentiallyall of the fission products, transplutonfum elements and neptunium. They also wouldcontain about 1/2% of the uranium ed plutonium in the spent fuel. One of the majorsteps in the management of wastes would be converting high level liquid wastes and Pusolutions to solids pr or to transportation and storage.
It is assumed that solidified high level waste would be stored in canisters 10feet long and up to 14 in. in diameter. A canister would contain 6.28 cu ft of solidi-fied high level waste from about 3.14 MT of fuel processed. Thus, for the 26-yearperiod, the total solidified waste from the total reprocessing load of 115,000 MTHMwould be contained in about 37,000 canisters.
The same facilities would be used to store solidified high level waste if onlyuranium were recycled or if both ura' Nm and plutonium are recycled.
Final storage provisions now under consideration for high level waste consistof isolation in geologic formations such as saltbeds or shale. It is projected thatFederal facilities would be utilized to accommodate storage of spent fuel assembliesor all high level wastes accumulated through the year 2000 for each of the three fuelcycle options.
The recycle of both uranium and plutonium would result in the cumulative genera-tion for the 26-year period of approximately five million cu ft of transuranic waste in .the form of fuel hulls and other parts of fuel assemblies. Because this waste alsocontains activation products and small quantities of fission products, irterim storageat the reprocessing plant may be desirable to allow some decay of radionuclides thatemit penetrating beta and gamma radiation befon .ansferral to a Federal repository.
The recycle of uranium only would entall sending plutonium to permanent aeologicstorage, probably in the same Federal repository used to store high level waste. Theprojected total plutonium inventory for the LWR industry in the year 2000 is about1,000 MT-if only uranium were recycled.
III-47
. . - . . . . . . . . ._ _ - _ _ _ _ . _

_ _ , _ . - __
.
. . . . . . . _
<
_ >
;
If only uranium is recycled orijf both uranium and plutonium are recycled, theconversion of the recovered uranium.to UF would result in a total of about 110,000
6drums (SS-gal. ~ drums) of low level . waste over the 26-year period. - Recycle of plutonium;
~ would eliminate +he need to send plutonium to final storage. A detailed discussion ofwaste management is presented in CHAPTER IV, Section H.
.
I -'
,
s
.
b
.
n.
111-43-
-

. .
!
! REFERENCESi
*
1.. : U.S.' Dept. of the Interior. ."U.S. Energy, A Sumary Review," January,1972.
- 2. ' (a) U.S. Dept. of the Interior. " Energy Consumption and GNP, 1920-1970 With Projectionsto 1990."
(b) U.S. Dept. of the Interior, " Ratio of U.S. Energy Consumption to Real GNP."_(c) Renurces for the Future. "Per Capita World Energy Consumption and GNP (1965)."
3. .U.S. Dept. of the Interior " Energy Consumption and GNP, 1920-1970 With Projectionsto.1990."
.4. " Patterns of Energy Consumption in the United Statet.," prepared by Stanford ResearchInstitute for Office of Science and Technology, Executive Office of the President,January,1972.
5. National Energy Outlook FEA-N-75/713, Federal Energy Administration. February 1976.
,6 " Survey of Energy Consumption Projections," prepared at the request of Henry M. Jackson,'
Chairman, Comittee on Interim and Insular Affairs, U.S. Senate D S. GovernmentPrintingOffice, Washington,D.C.(1972).
7. W. G. Dupree, Jr. and J. S. Corsentino, " United States Energy Throt.gh the Year 2000"- (Revised), Bureau of Mines, U.S. Department of the Interior, December 1975.
8. Ref. 5. Appens r;. p. G-2 through G-25.
9. Ref.-5, p. G-3.
10. U.S. Atomic Energy Comission, " Liquid Metal Fast Breeder Reactor," WASH-1535, Vol 1 -Proposed Final Environmental Impact Statement. December,1974, p. 2.1-8.
11. Ref. 5, p. 68-70,137-138,192.
12. Ref. 10, p. 2.1-9.
13. . Ref.10, p. 2.1-11.
14. Ref. 5, p. 241.
15. ' Nuclear Power Growth 1974-2000, WASH-1139(74), United States Atomic Energy Commission,February 1974, p.6.
16.- Total Energy Electric Energy and Nuclear Power Projections, WASH-ll39(75), ERDA,February 1975, p.3.
17. Ref. 7, p. 28.
18. Ref. 5, p. 36.
19. Ref. 7, p. 36,
1 20. U.S. Atomic Energy Comission, " Liquid Metal' Fast Breeder Reactor, ." WASH-1535, Vol III -Proposed Final-Environmental Statement December,.1974, pp. 6A.2-7 ff.
.21. Ref. 20, p. 6A.3-7.
22.' [Ref.' 20,' p. 6A.4118.
'23. Ref. 20, p.~6A.4-18 f.
24.~ ERDA-48,'" Creating Energy Choices for.the Future," Vol. 2, p. 33.
25. NRC Compilation, July 1976.
i. .
I~ III(R)-1|!,
- w

,_
L
--
,
4
. 26'. Re'f. 16, p.' 33.
- 27. . Ref. 24, p. 83 f f.
128. - Ref. 5, p. -223.
" 29.- ' " Patterns of Energy Consumption in the United States," Office of Science and Technology -' Executive Office of the President.. January 1972,
f30. Ref. 16, p. ' 5. -
~ 31. Ref.;5, p. 36, 234, 243, G3, G23, G25.
- 32. "The Prospects for the World Nuclear Energy Market," Nuclear Engineering International'~
- (April /May 1976).
33.' Legassie, Roger, W.A., Energy Research' and Development Adminstration. " Oversight Hearings: on Nunear Energy - Overview of the Major issues." Statement before the Subcpmmitt lt on-
Ene:.gy and the Environment, 94th Congress,1st Session, April 28 and 29, and May 1 and 2:l' 75. .
34 National Power Scrvey. Technical Advisory Committee on Power Supply, "Repor' to theFederal Power Commission," February 1974. Unpublished.
35. ' Council on Environmental Quality. "A National Energy Conservation Program: The Half.and Half Plan." March'1974.
.36..-Energy. Policy Project of the Ford Foundation. "A Time to Choose, America's Energy- Future." ' Cambridge: . Ballinger Publishing Compan'' 1974.
37. U.S. Nuclear Regulato.y Commission, " Nuclear Energy Center Site Survey--1975." NUREG-0001,Parts II and V January 1976.
.
t
-
A
E
(:-:lII(R)-2'
i - < -
.
.
'[w| . - < . - - , - -. .-,

_ _ _ _ - _ _ _ _ _ _ _ _ _ _ _ -
APPENDIX A
COMPUTER PRINTOUTS FOR CENTERLINE CASE
(LOW GROWTH WITH NO BREEDER)
|'
This appendix consists of computer printouts from the NUFUEL Program for theERDA Low Growth Without Breeder case. Corrections for the nuclear poisoning effects ,
242 236of Pu and U in recycle fuels were made by Battelle Pacific Northwest Laboratories.
!..
..
III(A)-1
_ _ - _ _ _ _ _ _

_ _ _ _ _ _ _ _ - _ - _ _ _ _ _ . _ . - _ - . _ . _ . .-
<
' ALT 171 - CASE 9 16 AND 38 = 1.0W GROwfH - 7ee CF'- 1970 AI P - 19Al REC - NO FnR 3.15 76 .41 e02''
COMULa7ED RESULTS PLUTONIUM R(CYCLE
GnnSt Wl?HnW4WALS A7 anR 7 AILS ASS 4Y .300g NATURAL ~ PLU704tDM.
YEAR ORANIHM H-239 VALUL FN SEP knRK. U AS UF6 4 00n URANIUM RLOH'RCO-CV- -M7- -47- MT- * K SWU- -M7- - if- -M7- M7-
'
1974 Il9a. 31.6n5 4082. 33a5 6840 74 'd, 6 O.1975 int 4 33.%31 3%55. 3%%N. 68A2. 94??. 9. _ e.1976 1457 47.494 4"22. 4785. 9277 14186 O. 61977 Im49 St.onn 6211 5719 19299 15485 a. n.1478 194A. 54.75l 65bl. 59S9 13779 19485 6. 61979 .2641. 7 .o;; s9al. 7796. 15575. 179:5. O. O.t198a 79n%. 79.775 in2J3. 8554 17238. 25443, 184 1.1%M1 1166 88 364 18621. 9340. 19043. 76" f 7 794 9.1942 173n. 94.119 17499 10452. Pfl9J. 302ff. 463. 14.,,
1943 1Ali. 104.994 917 59 Il469 22761. 141 f 9 364 II.==**
1984. 5761 141.npV 19447. 15364. 30472. 34764 402. 12e*
}" 1995 57c1 15 .A9J 19 App. 16214 32743. 44449 449. 14.1h) 1946 9174 151.n99 18 0"f . 167a9 17A41. 48586 553. 17.
1957 6298. 174.172 73247 19348 37842. 53734 709,,_ 24.
27.19ma Amo9 Inn tps 73066 29%99 4c803 %5178 744e
1949 7414, 206.996 75l11. PE75R. 44915. 61017 A13. 25.1990 7841, 214 142 76501. 23944 47362. 64Rio. 1818 3 11991 A310, 237.479 74sJ7. 25645. SO498 6R726 1750 34.
h', TC2)1992 4722, 244.994 79376 27aR9 %1244 73434 1424. 411993 973%. 264 149 31070. 28949 56554 77125 1%An. ,
54.47
1994 947n. 26A.747 718 69 29mM3. Sn476 794dA. leg 7 ,-1995 9727, 27P.E46 37%I9 31177 en672. 83479 1949 be. {__j}1996 19191 297.A76 14132. 327%2. 63770 87747.. 1946 59.1997- In%79 301.s94 35JJ7 33974 66097 A9035 2006 63 ggsCg)1998 10%66 341.17s 35269 33041. 66102 At847, 2332.
,
7 31999 I n 7.14 3ne. Pan 3%7V4 34%92., A7334 914J5 24R6 7e.2000 18973 311.937 167tn. 35224 hA447 97401. 2586 ~ 87 ([[[)20al 14934 336.784 16359 35609 A9095, 91167 2694 85
ffhffh7002 18g24, 297 74M 33nd*. 33472. 65013 881J5.. 2P572003 10161. 31a.432 33973. 35511. 47968 4R;J9 247.4.. 91
77 .
-
m2EEE2
"
b
- _ _ _ _

_ . _ _ _ _ . _ _ _ _ _
AL7 Ill - CASEt 16 ANO 38 - Los emow?M - 70s CF = 1974 REff - 1941 #EC = too F44 3 19 74 81 .92
Cemut47E0 st$utf5 'PLuf0NIUlt #FCYCLE
IpeADIATFn NETURefs AT GDP TalLS A55Av e 3088 PLUTONIUteVFAR UmaNtem o-714 WALUE FN SEP W0s'N U A5 UF6 0300 #ECOVEnED-rv- -MT- -HT* hl* *N Swil- -Mf= -5T. -mT-1974 8 n.n09 p. 8. 6. 3 3.1975 4 o.ase e, 4. 8 8 a.1976 0, 0.000 f 0. 4. 9 81977 e. n.cas r a. 6. 8. s.197R 7=9 7 119 Iles . 77. 33J. 957 71979' 747. 7 394 3344 238. 124J. 1943, 4l'A4 1741. 9.479 545%. -74 1484 7236 71981 1491. 11 4e4 7811 -34 37e4. 2764 A.1942 1949 17.1aJ 7454 -18 1850. 2551. la.19a3 le87 14 464 8988 *37. 2163. 3402. II.I'844 7085. it.76F 9879 -e6 7341. 3187 13-.
|| 1985 7715 17.477 10 07. 87. 2773. 31*l. 14.1956 7 37 la.sta 17922. *lle. 7702. 3 men. 17.319h? 3377 27 844 15159 -704. 3293. 4449. 22e
" 1949 1874 24.a69 14'e 0 6. *172. 3600. 5214 24.19H9 477A. 29 714 70394. *374. 4114 5451. 26
71 44 *332. 4492. 6443. 3271690 4518 31 4371991 %354. 17 134 744fe. *751 5354 7347. 39 j g
4 77 * 1 -794. 6111. 47t a 4 V '/199# %a%3.4.7 77% 902 . 4.3i9 3 549i. .,34 3:in. 3 i. n25 . p 9.
1994 7141. Sa.4A" 34749 *4a5. 7204 97'4 547926 107b3. 54. "o1995 7m39 54.510 17541. *533. .8893. le5el. 59.190A alaa. 57.sga 1929a. -Ae).
1997 RAA4 61 711 41AJ6. *s33 R838. 12 t t e . 631999 9AA9 67 440 46516. -655. 9638. 13878 is. ,
1999 1o174. 7a.7es 49043 *728. 9941 12829 79e8 c77000 18131 69.518 498t6. -788 9733. 12583. 2
2nel 14147, 64.Aa2 49789 *4o6. 9513. IP3C3. 84.70a2 toAlp. 77.741 %I463. -A47 30060. 137ag, gg,-
7. bh2003 tim 6a. TA.9 5 56967. -918 11802. 73et. 50
Mha
_ _ _ _ _ _ _ _ _ _ _ _ _ _
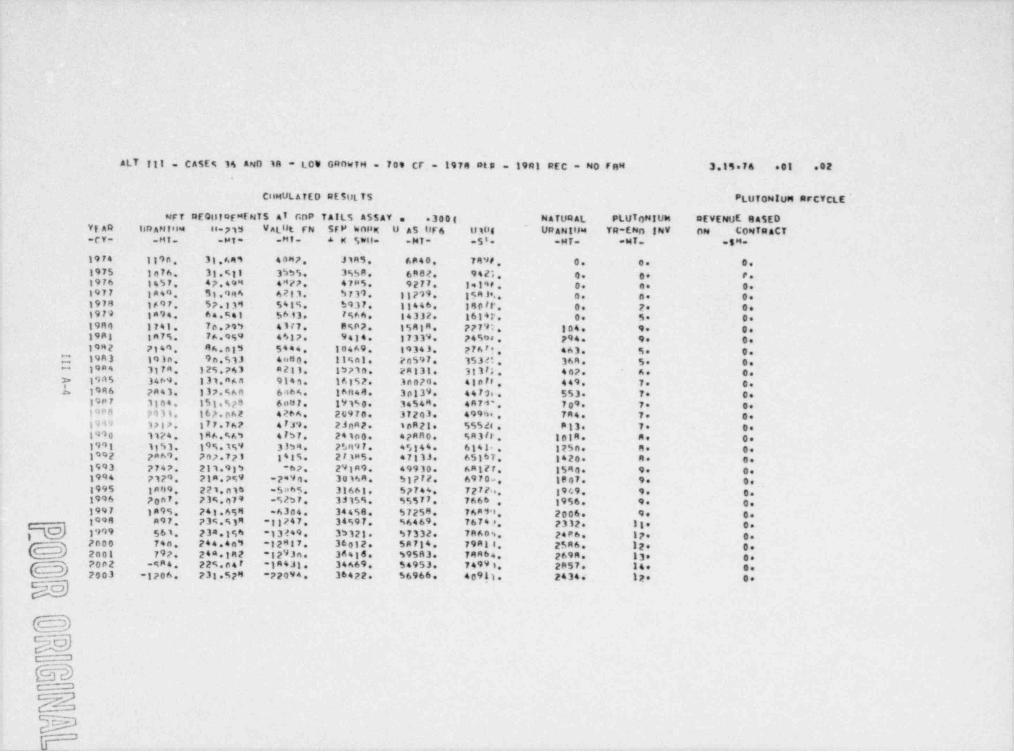
_ -_ - - _ . - - _ - ~.
ALT 111 . CASEM 14 AND in - LCS GROWTH = 709 CF, = 1974 #t e - 19Al REC - NO FRN 3.15 76 ott .02
CUMULATED RE50tTS P uf 0NIng AFCYCLE 'L
NF7 REQHfDFMfNTS 47 r.DP TAILS ASSAY PLUT NIUN #EVENUE 945EDVf AR - liRANfu4 88 719 VAL t FN SFP hosag U A5 IIF6 U108
- NATUGAL3005 OaU URANIU4 7R*ENn INW ON CONTRACT
.CY-- .Hi. .MT=- .NI- 4 W SWH= .Mia 58 -MT. -NT. =sM.
1974 1896 31.649 enM7 Jimi. 6840 7498 O. O. 9.1975 to76 31.%31 3555. 3%S8 6982. 9421 O. Se P.1976 1457 47.494 4877 47p5. 92FF. 19148 O. 4e S.1977 1A49 St.9m4 4213. S731 13799 154 9e.. O. 8. Se-1978 1897 57.139 545%. S937 19446 Ispir. 8. 2 Se1979 1894 64.441 5693. 7%A4 34332. 16147. O. 5 9.1989 1741., 70.794 41f7 E%A7. 154l8 77797 104. 9. Se1981 1A75. 76.959 4437. 9414. 17339 74%98 P94. 9. Os1982 7149 44.e15 54*4 184A9 19343 2 76 '' . 463. 9e D.
|| 19A3 193n. 9n.513 4 *.u n . Il%nt. yoS97 3534t . 36n. 5 O.1984 3174 125.743 8213. 13710. 2A131. 31373 407. Ae 0.
**
*= 1905 3464 131.nA4 914s. 16152. 3np70. 41078 449 7. O.k 1946 7443. 137. man 6n64. 16n44. 30139 4472.. 553 7. C.
19PF 1104 151.%29 688F. lY1%0 34548 4874'. 709 7* 0+19"R Pill. 167.eA2 4266 26970. 37243 49948.. 7A4. Te Sel449 1787 177.767 4FJ9 23nA2. 4pM21. 55528 #13. 7e De1990 11?4 18A.%A4 473F. 24100. 47AA0. %A3ft. 1984 Ae Oe1991 1153, 91 %.1%9 3334 ?$n9F. 45144 6141+ . 125n. 8. Ce1992 7869 7mp.775 141%. 273m5. 47133. 65167 1420 A. O.1993 7747 211.934 67. 291R9 49910. Aalif. 1590. 9. O.1994 7129 Pla.7%9 -?*99. 3e 144 51772 6970a. 1807. 9. Se1995 1809 221. nit -Sah5 31661. 57744 72FFu. 1949 9. 6.1996 70#I. 734.979 *523F. 33159* 955II.. 7666 1956. 9. O..
1997 1A9%. 741.654 =4304. 34450 57258 76899 2006. 9e 0.1994 m97 739.%39 13747 34%97. %4469 76748 7332. II. O.
f"lC2) 1999 561 23a.154 *13f49 35121 S7332. 78Aos. 24Pa. IP* 07000 74n. 244.4n9 -12917 36012. 58714 79All. 2546 12 Se2001 797. 24a.In2 jp93n. 3A416. S9583. Ten 6.. ps9n. 13 O.7002 -484 229.e47 *18431. 34469 54953. 7499 9 2957. 14. 9.2003 -1706 233 529 "P2094 36422. 56966 40911. 2434. 12 8
MV. R).
-
W-2
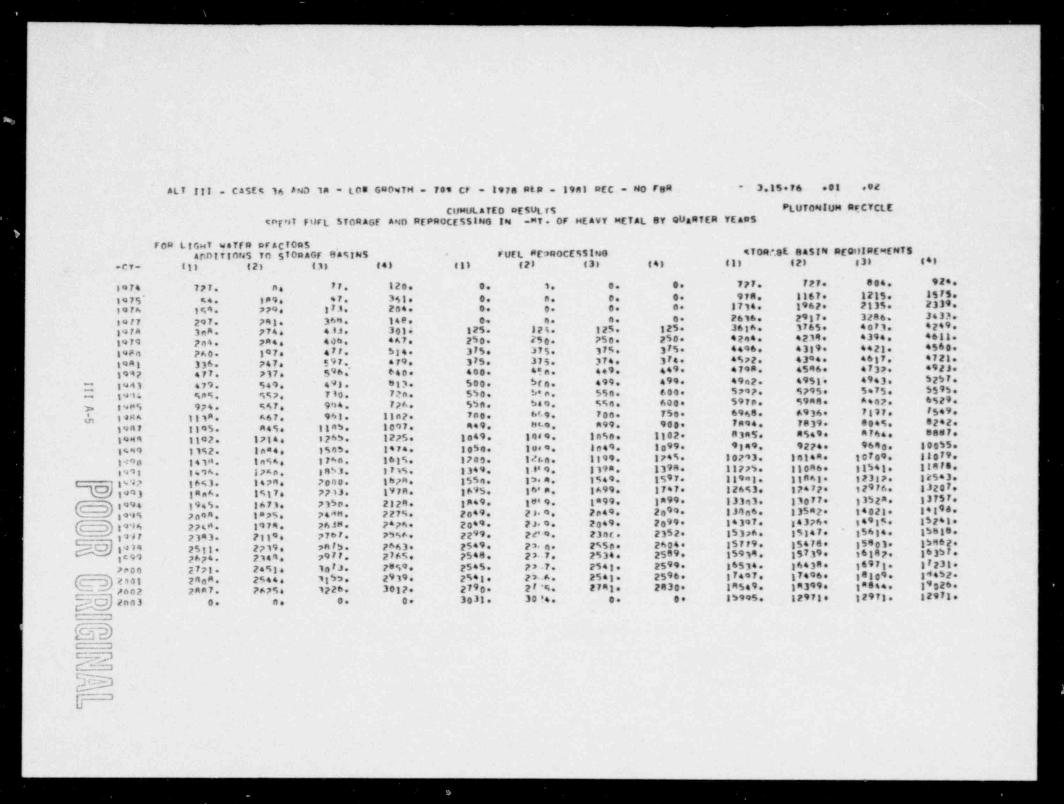
_ _ _
,
' alt !!! . CASEt 16 ANO 1A - t.05 G8097H - 7e9 CF - 197a #ts - I9al REC - No Fe4 3.15 76 .88 82*
Cue 80 LATED DESUL75 PLUT048UM #tCYCLEwresi furt STORAGE A.l0 ptPeoCESSING IN -MT. OF heavy METAL SY OUARTER YEARS
F0e LgGw? wsTTR OFAC70#5 .
FUEL #E9ROCE951NG STOR*.SE e45til SE0ill#EmENTSanntit0NS 70 STORAGF 04%Ild5 *
-CT- til (28 (33 tel til (28 (38 (4) til 628 838 849
77 120. 9. 1, s. g. 777. 727. Ste. 9241974 777. no1975* **. 189 47 341. 4. a. p. G. 97A. 1167. 1215. 1975.1974 1%9 779e 373 264. 9. O. 8. 8. 1714. 1962 2135. 2339.,
3977 297. 743 364 149. g. 4. 8. 4 2616. 2937. 3286. 3433.19F8 3nR. 774, 4 8J. Jets 125. 424. 125. 125. 3616. 1765. 4071. 4249
1979 2n4 PA4 400 447. 250. 250 750. 250 4244. 4239. 4394 461135 4496. 4319. 4423 4540.F3 5. 375 375.73984 PAG. 197. 477 514.3 4. 4572. 4394. 4637.- 4723.773 5. 375. 374.1981 336. 747. 597* 479
56 640 40s. **n. 449 449. 4798 4546. 4737. 4923.91997 477 717.
Z l'*43 479 549 498. 913 500 Sra. 499. 499. 49a2 495th 4943 525F.19 % %A9 %%7 710. 72p. 550. b? n. 55e. 600 5797 9795. 5*75. 5595.
.
2 8985 9ps. %67 944 776 553. Sa9 %se. 60s. 5978. 59AR. A4ep. 6529
& 14H4 ggqA. A67. 9%|. {{st. 793, 84 9. 70s. 750 6948. A934. 7417e 1549
1987 3395. A45. ggas. 3097. 449 ML9 neg. 90s. 7a94. 7339. eseg. 8242.
19H4 1g92. 1734 3265 1275. le49. 1889 le%e. 1102 8345. 2549. 4744. eseF.
1599 1152. In*4 194S. 1*74 1954. 1889 4049 1899. 9849 9274. 9693 19355.F
1**# I41". la5Ae 176a. 1635. 37es. Itse. Il99 174%. 19293. 18144. 10789 IIS 9
1998 1494 17's. 3453. 1745. 1349 I t' 9 3198 1398 18774. 310R6. 31541, 119F8
I U37 36%3. 1474 Poep. thpa. 3554. gw n. 3549 1597.. 339eg. glang. 32317. 32543.ja A. 1%37e 771J. 197A. 1695. 16's. IA99. 1747. 12453. 37472 129F6. 132871993 n
{, }3994 3945. 1671. 7150. 2329. 1849 18'9. ta99. gm99. 13343. 13077* 1352a. 3375F.9 9
89'89 7a98 1875. 7 4.e n . 727%. 2e49 23 9 2p49 2e 9 IJ4n6. 335a2 14g23 193 4.
( } 39'i4 2748 1979 P6JM. 7*76. 2049 2Ja 9 2049. 2099. 14397. 14376. 34935 15241
3987 2143. 2339e 7767 75%A. 22 9 2t'9 230t. 2352 15326. 35347. 35634. 15ste.9
3934 2511 2719e PAF5. 7643. 2549 2L n. 2%50 2604. 157F9. 15478. 35403 154622 65. 2548, 22-7. 2534. 2589 15934 15739. 16147 16357.tW3 2674 2144 7977 7
I.F 311 97 .6 33 514. 34434.7859 2545. P ,s .7.2543, 2599. 6 2
,1eFJ.pp00 2773 24%3i 4,,., . . . . 25.i. 2596. iT497. i7496. . .,9.is,. 29 w. 2sti.g /ac2 2544. 2. . 9gas 3 326.279 2F *%. 2743 2830 In549. gn399.
i2, ..7i. i297 .30322AA7. 7675, 1726 03. n . m .. .. .. i,995. i29,iem 2.e3 .. .. .. .
(=P)WDL
- ______ ____

_ . _ _ _ _ _ _ _ _ _ __ __ _ _ _ _ _ _ _ _ _ _ _
WJ
N Ue >e U
5IE m @=
me e .. e.o e . e..e .. e. e. e . . ee o . . e .e.
> O g e e M h m e e m me wh @ m me = M N N e h N om om me @* =em @ @@ mhempekheg@edhedmPEM=CermMmEJE N e e M P E 9 N 4 e M e s # es = t h P P e e Me em me f* WJ edede@MdMCemfMhee@keeekerdeMMk@ D E mL @ e @ O n t ow 9 0 e e e e e e m m t *> h ep t mm9 t m
M J WXO W NNNMMee@g>pemme@kgemmerh eDeem* 4 @ mummmm=NNNNNNNNNRM@
mo
M
C e e e e es e e s e en se e s e o e o e e e se e e ee e3 M MemeeNepMee=emb eMmW@@MMmmmek@J P #@mAmph Ne d e d n er e @ e d N A h h N N N d meW P eNMecah e W e e @ N Nd # @ p mk P @ @@ M o r ee
@ demhmeNebr@pmNcemp4NPed>Ehe=WN M e @ @ @ k t e m P- @ h e N e d @ m e h D N e d E G Ne @
mmmmNNNNNMMMMeeee@@@@We 8
L O e eo e ee e o ee o e s e e e s e e e e eo ee e e e ee> emeneeeerregemeeeeemeneeemmeneeQ @ W e @ ek M @4 > R N e Nm = 1>
0 e3
U ew O$ W
K J e o eo e e o e eo e e ee o e o e e o e e e ee e e e ee e= > e em e r N N s e e r a mmm e m Me e e c e os c omm ee J C M reNm*eh MMheRhot*meedeeeeeeeev9 4 > @ e e o m N M h e m e > R g.p e @ eMN@N4mNehemem U Nkkhd@RNee>OMm eMNtcathemmeekeem m mammNNNNANNANNNNNNNamam,
8 E.
**W e8*
,
5 J B e e e e se e e e e e e e e e e e e e e o e e s e e e e.e ew e eeeeeeeeeeeeeeeeeeeeeeeeeeeenee b @> M@m o
W0 &
>b ku k * = = m m m m m m m m m m e m m e = = = = = m m 4 m m ee m eE e~ eeeeeeeeeeeeeeeecocemesescomet6 C &D hk U
e0 W
SE* >3 g R e e e e e e e e ee e e e o e e e o e e e o e o e o e s e eQ Z eeeeeeeeeeeeeeceGemeeeeeeeeeesG @ > @C E C e
CE m
O. >J m
O8 3
4 3 e o e o e e e e o e e e e e e e e e e o e o e e e e e se ee 2 e h N e oc h > Nr > = NE Nd d e v e N E d e v eN e e dM & T O em AhveeeAnedemag #d 4 md a CF etW @ @@ @h4MSEmmS#Ne#hhE eNMOTNPMmO 3 4 Fe m mNC@c4CFM@@ eMEEEFOMM@@@@e2 C4 4
4 JM 4
'TW e e o e e o e o e e e e e e o e o e o e e o e e e e o e o e
# 3 e P t e t e @ m Ap a t etW AAAveteehNmeemeeN*,evrekk eeAew n a @eemed eeMMMeed MV e m e e e mM t m eg &ddweh@et@h me>mt4Okt4 h F. @ h C F V d e m edePek ehmkWEdeeMNmerU mmmmmmmmmmmmmmmmmmmme
e
mee c .e e ne . o .e .o .e e e e ee e e .e . . ..e .e.o.ee e c c e n c e s e e e . . . . . .e .em o se ceee==cecoceaeces>> zJ4
e . e <,he..mNM e < < h e , e m s M e e # h e c e mN Me > > hhhhme? ETTE CTTE @@PP*?P9?PeceMh 4 @ 9793@ ?? 27 28 8 7 22 77F 37F993 P eces> e = mammmmmme==mmme===mammmmmMsur
111 A-6 1q
l
- -
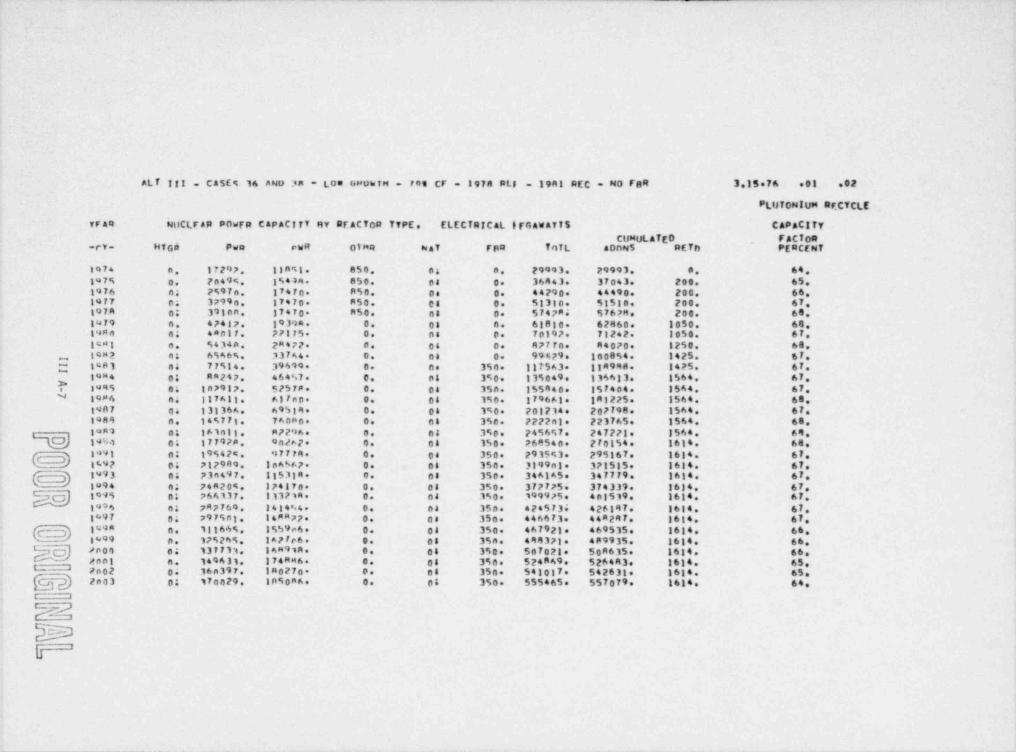
__ _ _ . _
.
7
Alf til . CASE % 16 AND 3a . LOW GNUwfM = F04 CF . 1974 RLI 1941 REC . NO Fe4 3.15 76 est .92
PLisfowlUM #F.C7CLE
VFAR bCLFAR POwFR C4PACITY RY REACTOR 77PE. ELECTRICat IFG4WAff5 CA*AClfy
CUMULATEO FAC704-ry. HTGi Pwe PWR OIMR ha7 rpR foTL aDON5 RETh
~
PENCENT
1974 n. 17297 18898 850 O& a. 79993. 29993. 6 64197% 0. Fn499 1%444. 850. 08 0 36443. 37043. 200. 651976 n; P%9Fa. 17470* 850. Os 0. 44290 44490. 200 661977 O& 37994 37470 R50. 88 6. 51330. 51510. 200. 67,197A n; 318cn. 17470 850. 68 0 574784 5767Me 200. 681479 n. 47417. 19394 O. Os n. 61810 62860. 1050. 6819Re n; tanlF. 77175 O. ps 0 70197. 71242. 1950. 67IS"1 n. 9434A. 2M4PP. 8 08 0. 47Ffc. 44070. 1250. 6849#2 65 6546%. 33744 O. 08 0 99479. 100854. 1425. 67~
1583 e4 77%I4 39619* 6. c. 350 1175A3 lin998. 1475. 67~
l'"4 08 A*247. 46457. O. el 3%0 135049 136633. 1564 67Y 8445 04 In>917. 57578. 8. 08 350. 155440. 157404. 3544 67N 8486 n4 Il7All. Alfep. 9. 08 190. 1796A1 181225. 1564 68
1987 04 13136A. 69514. O. 06 390 201234 207798. 1564 671989 n. 14%7Fl. 7AGRO. O. 08 350. 7272nl. 2237AS. 1564 68lon9 og 161stl. a729A. 6. et 350 7456%7. 247271 1564 sq.
T 19%4 0; 17797s. Onh7 4. 04 MO. 269540, 2Fol54. 1614 65l*91 c 195429 47774. 4. Os 350 291543. 295167 1614 67
' '
169? 04 717999 le6%A7+ 0. 08 350. 3199al. 371585. 1614. 67g g 1493 et 739497. 115314. O. et 350 34AIA5. 3477F9. 1614. 67
1994 4; 74R204 174574 O. 08 3%0. 377775. 374339. 1634 671999 et 766117. 111714 O. 64 390. 199975. 401519 1634 671996 0; 747769 1484%4 O. ca 350. 4745F34 426147. 1614 671697 a; 7975nt. 148877 O. Os 350 446673. 44R297. 1614 67149" n. 18166%. 1%S9e6. O. 08 350 46792). 469535. 1614. 66p g8699 p. 17924%. I A7 Fe6. 8. Os 358. 499371 489935. 1614 66# pot ca 137711 RAM 918. 9. 04 350 587021 A50 615. 1614 46Mont n. 149631. 174 mms. 6. 68 390 524849. 526433. 1614 657802 04 36n397. 1A0270 9. o8 350 541017. 542631 1614 65
Q[ 2603 0; 170029 ID50R6. O. OS 350. 555465. 557079. 1614 64
WMh
- _ _ _ _ _ _ - _ _ _ _ _ _ _ _ _ _ - _ _
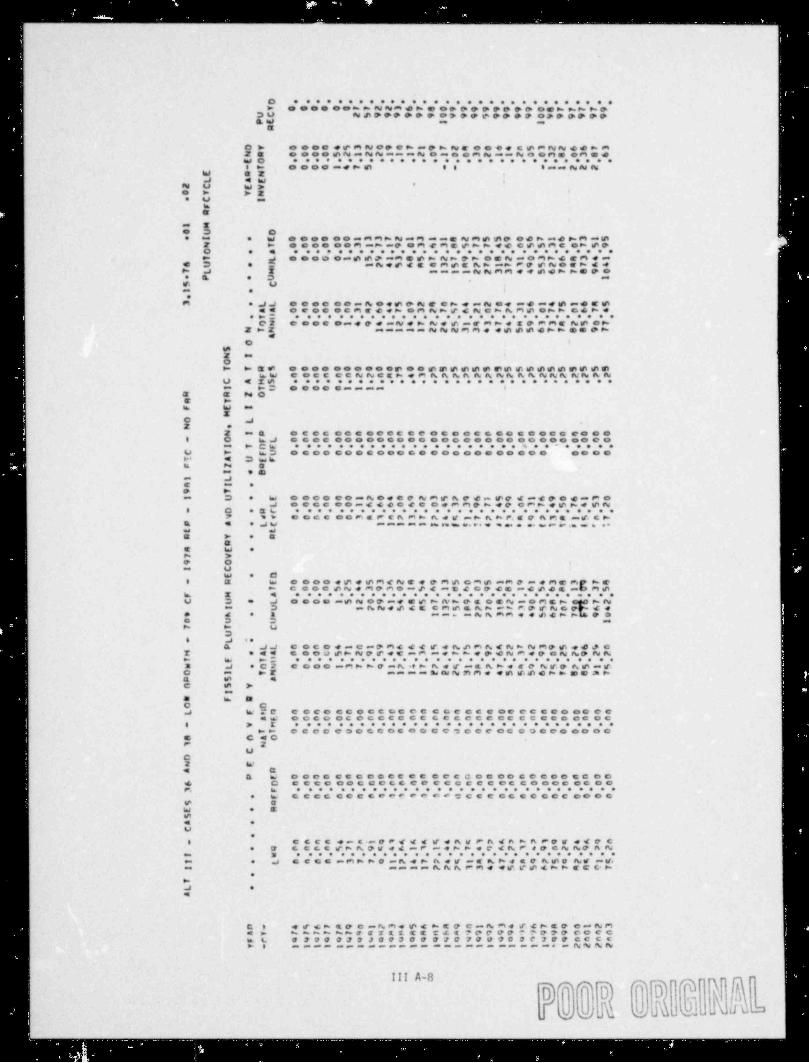
e
o e e e e e e e e see oe e o e e e e eo e eee e oe e e> eeeeeem>NNMeneempeoppemeewh>he
30 NAD9999Fe9DreP@@Pe79@PDP&W = =
R
Ob e e ee e e M N ep c h ap h N e e e e e c e M NN e e > M23 e p e o pN m N N am m N e m m e M N mm N e em m em m eWO * * * * * * * * * * * * * * e o e * ****e*** * * * *e > Omeemehm 0 e tamNNN
M E 2 tJ ew e*N U WD
e > > 3 'e U m
h8
em ee 3 C.e m e w e m ee m e = mmh N mM mme N Me pp ee n me >M me e
F > emeeeemmh=peMcMeckmede@@MC e> @ @ fQ e e o e e e o e e e e o e o e e e e e o e o e e o e e e ** e eg e ee w ome e r -M e e n Nn e n e e N m e Mn e eM e me
e s . wheedamme=Ah-- weeNee*<*b J E mmm=NNMMedme>>Spe* & e O =2 U ,
= e 4
eM eJJ e e e e ee m h ee@ O N e eh e nN ee me me @ me r *
44 e f e c e e M e d em e M h k # d N e h A M @ e> > ee k ee>" e o e e e o e o e e o e o e e o e o e e e e o e o e o e o eOE S e e e eme @ e =N e h N e e me M W e t p M ME Ne ok
2H2 mmm m m N N N M M 4 4@@@e>>ee@heO 8
Wgm *
- h. eeeeeeeees.ee.................bW esereCNNegmeMAhNhhANhhANhWNNhh
U ( Ze e * * * o e o e e e o e e e o e e e e e e e e m e e se e *>O eccesammm a=
R E NOE >
gmb
e a ,
3 *2 m a e e o c ea e oe ee e e e e e e e e ee e e ee e ee e e
8 C kJ eseeeeeeeooneeeeeeeeeeeeeeeecem >CW * ** * *e * * *e * * * e * * e * * *e * e * " * ** * *
U > w3 omeeeeeeeeeeeeeeeeeeeeee emeeM 4 3 wbu N e
m 9 8= Je m eD >m 3 e W emeopomhede@ NMcApep pedmepagmMe
J eeeeeemd4eeeeeeMMehereM>erkeWN8 O e 36 e e e e e e o e e o e e e o e e e o e o e e o e e o e e e e
7 => eeseeeMEPenMh ** e''o es se se een se e, er, e o e gn e. .a t. e, e. e m( C hnet =>AhM hME& 4 eJW ., e eeo ea > e a
S ie w e> >P O i= U i
w e d8 a w e c o n e e d eMd N e v e M m eMe mM e m e me Me he
> eeeecN4M@Me=#dmederdemecesmDMWk X g e e o e o e e e e e e e e e o e o e e ee e e e e e m e o eW 3 * J e m e e me N e @ me m e > N h e s e S N m e M a h kN
= 3 w hNe e d s C M m & A m mh MP#NO dee d e 3 ===mh&MMeece>> eee 3 D => > W
36 J **
& JJ esteeme=PMeedreNAMAdN>NMecee@cT ede s e e 9 @h N P r e e = M me h h e P W N M e @ e N hD N N> b >; e e e e e o e o e e o e o e o e o e o e o e e s e e e e o eB J eCF coce=Mh>9mA*tkAetmEAhes@ AreAma$C = >F pammbMNRMeemmee>>eem>a p 4C W >
ma b Wo GJ w.e e e e e e e e e e ee c e e e e e e e ee e e e e e ee e e
ew peoneGoGeCooC GetcoceC C S e m e em e Cg > g e e e e o e e e e e e o e o e e o e e e o e o e ee e e
km e s e c e se e c es e e c e g e e e ee e e e ee ee s ee - C40F 2
UC2 W4 S
k w e e e e ee e e e et e n e e t C e e ee e e e e e e e e n4 Q e e e e ee o G e & & e e e e e e e e es C o mec eG e eF. b e o e e e e * e * * * e e o e e e e e s e o e e e e e e e e
e w oce& emeGWFP e# m# e c e c oc e S oc c ee e nP OW * E@e eU
e$ ettt e n t *= O F 4 d d W e A d F h 4 h W h P O W edQC
e W &c6C (MA$WedmF meheefdAF#@ehh@ hNm E * * * * * * * * * * * * e * * * * * * * * * * * * * * * * ** O J GreC*Mhb@mAdb hew *I A b e E O k @ S NI m I8= mmmpNAAMMeeOf@4MMECCW
ekJ eg
~ ~ ~ ~ ~ ~ ,o m A. M. e @ d h. t @ .e & .M,e # d h E D e m N MR 9 efeh tp =. .. .. e --e.eeneee -
h L e298 933Je@ 309 #7@ F#W90 0f7Fesece> e meme mammmmmmm mme==m ene==* mNNNN j
,
!!! A-8AA W ~3T-
D D
3e A e 31 o

_ _ . _ _ _ _ . _ _ . _ _ _ _ _ _ _ _ _
tia e e e e e ee * * * ** * * ee o e e e e e e e ee e e **O eeeemeeeeeepenmeeeeeartdeewtememed4O
h tad.8 88
O4 *=an e- IO tei41
U e e o e e ee e e e e e ee e e e e oe e e e e e e e e eetnJ eh .3 e ese co m me se ee eeee m es e m e e ee me se.J E > E se
N U == g @ e- *
O > 48te#> E* U en E E tad
am an, enE U In.
CC *e+ r ae*3 & en too e e e e e o e eo e e e oee ee e ee e e e e ee o e eee e= ter 3 .o emeeeeeeeeeeeeeeeDooneeeeeeeee2 E D E ==
0 > c ena > .8 > en jt 3 U U Z ee '> .J 3 ** te.* b bE |0 %== D* lsJe 2 g he et e * ** * * * * e oe e e e e e o e e e * * * * e e o e **
M and 4O O O e O e m o e e e e a e e .e> e c e o en e e e m p == e op m&22 eeeeee***es * * * ** * * * * * == m N N e
r e e e > e w w e e n' *a e, r N a er N a s(er == c #s N n N == C* and am se se se N A gg m g , g, t g se g g p C D O g me d
aM , == se me se me3*
'.J 3
e. e e oe ee e e . . e e . . e e e e e e e e e e e e e e eeenJ O O O O O O O @ eft M M N fit En# N N N N N N N N N N N N N N N NE e E is
E EZb b4 ie .8 tO e2
1 e8
|te e o e o e e o e e o e o e o e o e o e e e e o e o e e e eeU + c e O O O O c O 4 e m m M m M M M M M m M Pt 8't ful C M I"1 f'Is N ftd N )itan E
& EOe b te6
*e ME .J ==p D4 2** as De
O ImJ' O .J X tad * * * * ** * * * * * * * * ** * * * * * * * * * * * * * *
a C D 00 C C C C C C C OC ecO e O O O C c C C D e C C OCM iit on J& *=the S & D 4=E se e e- E
t= Ind Z taJE 4 X b> U 1
iP ** 4*** EQ
g g,g e e e e o e e e e o e e e o e e e e o e e e o e e e e e o et 4 en .e ODODOOOOOOOOOOOOOOOOOOOOOODeDOb Z E **4 O O inU M > > In
tee Z **9 3OGo en. en ' b** E
T>g e i,g as e e =o e eee-o,ee +e*, ete e e e e ese one e.e e e e eeefoee.e
4., 1 C D O O O C C * E m e O > N 8% d. 4 == == P= r == ft * O == N * # =* c*Z E e > en =* 9 % M O O *e t t f E 4 > N @ 9 E f* * K NOa= b23 O N * M P3 4 4 @ > t 9 8%s F. af. > G C O f% tfl 4 h P43 ee A enJ en me a= en age fgs N N N f% fnd N NO s'E o *=C Z
3 eC * * * * * * * * * * * * * * * * * * * * * * * * * * * * * *,,3 e e > c h er 4 O d h e m m N e .- # m > 4 em f6 > A c sp 4 == eh ==
o it 8% C en P W N 4 C > ? ** m a e == 5 e f% p > d4 > == t == N E e e Nm0 3 D O 2n Pl > > *i == A X, =!%f*t'l 3 m ? % ==A == W &OA4eEE *t N
.J 3 ee ** o* =o fV m N '*t e e I. @ C 4 e *= E 3 p Sh 7C 2COGO Geg e ====emme==mesemes*s
C *2e
to
@ OCgo, C ag K e e e e e e e e e e e e e e e o e e e e e e o e e o e e e e
( fr g Z g @ C C f ge $h C $ o. [ @ me I @ 4 d Y Sk $k C $D d m b f $ |kg GEO hF h e b ** h Pm 4 9 4 f* m F F *= f% f% 4 # C e * E F 8' se ( 8* 4 W C
In# 3 DZ /t W M W @ @ ** N C M O 84 4 m C 90 m P ** @ P ** ** *e E E.v e C aa == se .* N 8% N m e e e er 4 @ k Pm CC@ OOC CCet C UE se so me seU t= 3 tes 3
sa Q9 i
C e
me. me g .J 1 e o e e e e o e o e e e e e e e o e o e o e e e e o e een at 4 me p- E e .e m a N o er e as a > .ws* c e r #- c is e e eem E la a == 4 K e O 4": > C e 8* 4 > d E se d #4 4 - e .% C s% e= fr. y c m ee == etag C O 2 4 ** * * C W tr 8" 8A e C f4 9 R fV e 4 s= f4 4 C e r C h b 8" h = = >
>= 4 == 4 O se 8"I e C P= @ N em O == O E ** 8 == 4 P= 4 N @ F 4 f%83Z b. 9= ense sese ese se se N N q=3 fuy gs; sep q e't @ E Oe e p *p 'gg"t.J eg E en egg gg) ggt en ggt p e
at O3Z3U
Zen -
4 @ O P" N N E T EE $ E $6 C me Ihd
C E K e' ** T @M 4 tf d C se Gh M 4 Bf ( D. C @ O me (%[ f89N N****d > e E T ? 2 P & P e 16 @?9OO OO
2. 9 @ 3 9. en9 .F .W. 7==.3. 7 '- .e 9 2. ?. se se s- =3 r. m. . =P .7 ?b LG J9 OC 3 3
= = se it #% sw *wC C eCp g a= e e m =.
l III A-9
D * P lD RD l' V <j
"
aMw 51- - n

' T,
Lou GRowfH - 709 CF - 197 4 PE P - 194 8 PEc - No F eR 3.15 76 01 .02' ALT til - CASE 9 36 AND 3A -
infAL FNetEHMENT UEMAND PLUTOIIIUse RFC7CLE _
GROS % WIT @ maw &LS IkeADl4TED RETUNH4 NET REGUIRFMENTS
7 EAR us spin.e U-235 W Alt E FTN ItRANIUM U-235 VALUE FTN UmANIUM U-235 VALUE FTet
-C7= Mi- *M7 -47- -MT- -MT- -MT. -M7- -MT. -MT*
1974 119e. 31.685 4082. e. 0.004 0. 1890 31.645 6e42..
1975 18744 31 511 3545. e. 0.000 8. Info. 31.581 3555
1976 1457, 47.49e 4822. c. 0 000 8 1957 42 49e 4e22.1977 ime1 gl.oP6 A213. a. 0 000 n. 1449 51 986 6733
bIm7A 194A, 54 7%I A563 269 2 133 1346. 1697 92 119 54t l
1979 7A41 71 916 A981 747 7.395 314a. 1494 64.541 5433.1943 79RS. 79 775 Im?33. 1241. 9.479 5959. 1741. 70 295 4377
1981 116A. A M .16 4 11623. 1491. 11 405 7411 1475 76.999 46121942 1739 9M.318 17999 15m9 12.343 7454 2149 86.015 5444,
1941 sal 7 144 998 12959 leef. 14.4A5 497a. 1930. 9o.533 anno.C 1984 5761. 141.e24 15042. 20M5. 15 767 9929 3174 125 263 821Ji
1995 %741 '198 693 1*A07. 223%. 17.877 18462. 3469 133 8A0 9140.*
12540 60661P 18W6 4174. 1%).a9d lanRA. 25J7. 18.534 12077. 2843.1987 Asal. 174 372 73247. 3177. 22.A44 15 59. 3104 151 578 6087'
1988 Anc . Imm.173 pin 66. 3074 26.eAl IAA04. 2933 162 0A2 4746e9
14A9 7434 pa%.996 '2%l31. 4226 29 234 2P194 3212 177.762 473 .8 71 6.565 475 .1990 7841 734*l"? 76983 455m. 31 687 2174A. 3324
1991 *189. 717 475 24e32 5156 37 136 74674. 3153. 195 349 33543
'1992 a72p. 744.998 79174. 5853. 42 275 27941 2469 202 7 3 14152
1943 973%. 749 349 130 p. 6493. 46 234 31137. 2742. 233 9 5 -62.7 3
1994 e478* 26M.747 11769. 7343. Se.44A 34259. 2329 218 259 -2490,
1995 9727 77p.%46 1251%. 7839 55 51e 37581 1949 223 016 5045 ~
i. ,l ,3.2007 235 074 ~5257In # 197 476 34a37. 8tna. 57.59A 3929n.1996c=g 1997 7 . 3,3 194 3 sin . 64 6 .n5 4 06. i 95 ,4i.6s. 6304
2 5 53e -1124731994 la%4A. 303 378 39769. 9669 67.n40 46514. 897 3
OCC 1999 In?34. 10n. MAS 35794. 1037e. 70 705 49043 563. 23a.lse 4132497
2000 19871* ilJ'937 3A218 10lJ3. 69 531 49a24. 740. 244 48h *l2819
2001 In9344 316 7R4 3A359. 10147. 64.692 492A9. ' 792. 248.lA2 -12 30.2002 Ine?". 797*7RN 33029. 10612. 72 241 58460 *5A4 725 047 -In433.
2063 In1A1 3te.432 33973, 1156e., 78.905 56067. -1206, 231 528 -22094f
3559
t- ====
w=='U=
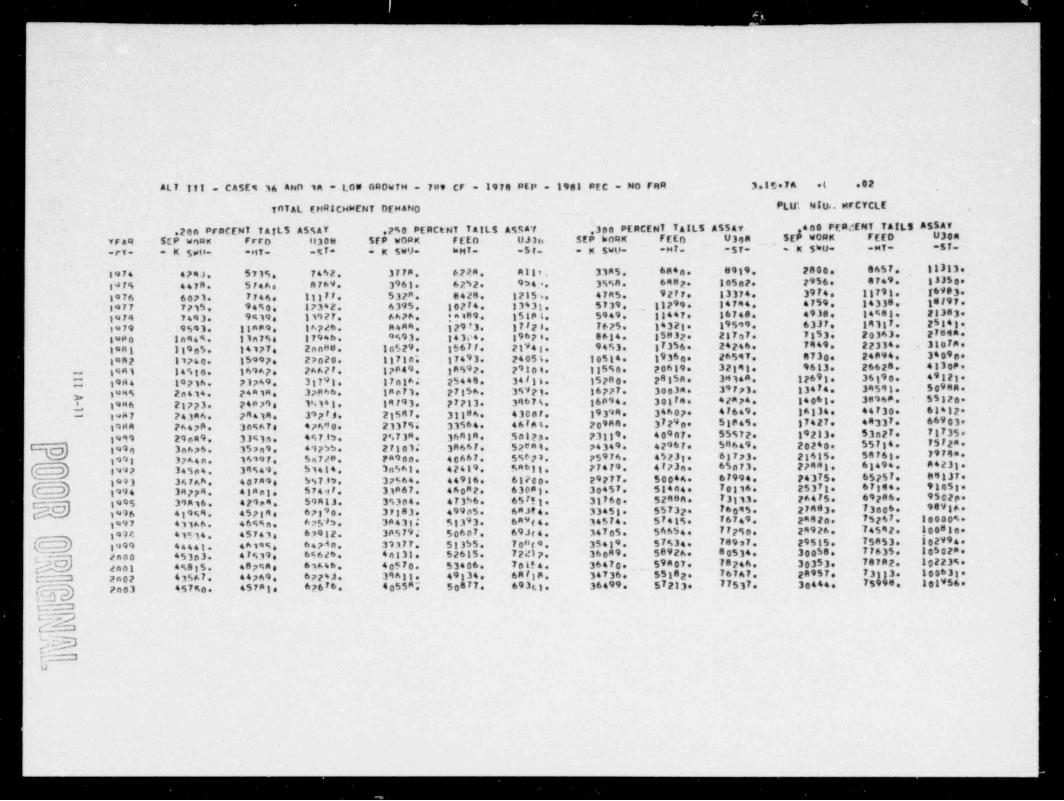
- - _ _
|
1978 PEI' = 1981 ptC = NO FAR 3.15 7A el .02ALT 171 - CASE 9 34 AND in * LOW GROW 7H = 709 CF =
intal EHRICHWENT DEMAND PLU', NIUS. MFCYCLE,
.20s PFACENT 7 AILS AS%AY .290 PERCtH7 TAILS ASSA'F 304 PERCENT falls ASSAY 400 PERtENT 7 AILS A55AfVFs4 $EP wnRK FrFD H30s 5FP WORK FEED UJ3h SEP knqK FEED U3ga SEE WORK FEED U304=rv. - K SwH= =H7- =%7* =K SWV- hMT= =5t= =K SWO= -H7= -57= * = K Shu. = se t. =57= ~
1974 spea. 5735 7442 377m. 6F24 Allt, 31A5. 684a. . 8919, 2800. 8457. , 18313.,1475 4478 5746 8769 3961. 6252. 9343. 3%%8 6487 10507. r956. 8749 13350
1976 6071. 7744. 11177 537a. 8428. 1215 .. 47R5. 92F7. 13374 3974 18791. 189831 197.8
1977 7715 94%0. 17342. 6395 10274 13431. 5739 . 112 9. 147m4 4759, 143389
1974 7493. 9419 11927 6476 !aiO9 15 8 P 5. 5949 11447. 16748 4938 14M88. 2838357 2 143._1979 9593. 11889 16726 R4R4 179 f 3. 17F23 7675. 1432 . 19599 6337 1411172 e9a.1980 1444%. . lin?5s 17946 9593. 14104 1967 e. 8614 15832 287a7. 7353. 20363.
1 356. 24246. 7449. 22334 3 tota.71881 11985. 14177e 286H8 18529 15671. 21V41 9493.
9 91 36o. 26597 8730 24P94 340 01982 11740 15997. 27c20. 1871p; 17493. 2405l. 195149 26628 41308.2 10s. 13550. 20619. 32191. 9613.
~ 361 0. 493211 597.1981 14510. 161Ap. 2A62F. 17849 8a-a
2 1 n. 39144 17691 985C 1984 19216. 21769 31791. 174164 25448. 34'll. 15780.gugi 2n414 2441A. 37n66 18p71. 271 6 3%'P l. 16777. 300 4. 39T73. 13474 34591. 5098n.5 3
.L 19M6 2typ3. 24p?9s % 141 19793. 77783. 39674 16P94. 30l 4. 42R24 14068 38'868 55320pi
2 414 3S773. 21547 313 4 4300F, 19394 34607 4T649 lA334. 44F30, 61412 ,4 8twA7 P4346.-*
323 51845. 17427. 4433 66903 l79 719M4 PAspR. 3e%A7s 476HO. 213794 33564. 46 fag. 20988*
1 213 53n27. 717359940 07 5557291999 29na9 3341m. 4%783. 2'.739 36MIR. 50128. 7311
% 1994 3nA76. 15sa9 417 % . 271014 3R667. 52 eat. 74349 42967. Sn649 20240 55714. 757 82
1993 3pA4p. 14197 Sn7/M. pa9an. 40667 5%673 p5976 452J . 61773. 21415. 58F68 79798I1992 345p4 39%49 51434 3n%61. 42419 Sabll. 77479 4773g. 65a73 27441. 61494 A4231
1993 36FAh. 40789s 55793 37%64 44936. 61780 29277. 5004n. 67994 34375. 6575f. 893JT.(M) 1994 3R774 4 tant. 57417, 3)A67. 460 2. 63083 30457 51444e 70116 25371 67894 910518
1995 39A16. 429p4 59RlJ. 353p4. 473S6. 65F11 31760 5288A. 73113. 2A475. 69286 9502p.
05. 27883 7300 98 vin.41 %4 45pl4e 67890. 37183. 499n5. 6aJte. 33451 5573 . 76 4 69 2199643 4699p. 675#3 3m431* 513 3. 6AW(4. 34574. 57415. 767 9, 24828. 7526I. 10000%.9 4189741166.14 45743. 6.3912. 38579 50607 69Jte. 34705. 566S4. 77p5p. 29926 74592. 100810
leitie. 35439 57%34. 78937 29515. 75853. 1029941999 44441 4A199 6474n. 31377 53355 70H
c 2000 45333. 47%39 65626 44133. 52615. 72217. 360A9 58926. 80534. 300 8 7F635. 105028e5
dant 4%8 5. 4879As 63A46 40570. 53406 70l!4 36470e.. 59A07. 78246 30353. 787p2. 10223%.1
2n02 43567 44769 6774J. 39631 49134 6Al e. 34736. 551 2 76747 24957. 73 3. 1006318lfg 4 55R. 50877. 693ct. 36499 57213 7753 30444. 75 8 101956.77pn03 457%0 45781 626 6 0
t_- J
WmMEE3 i,
g--
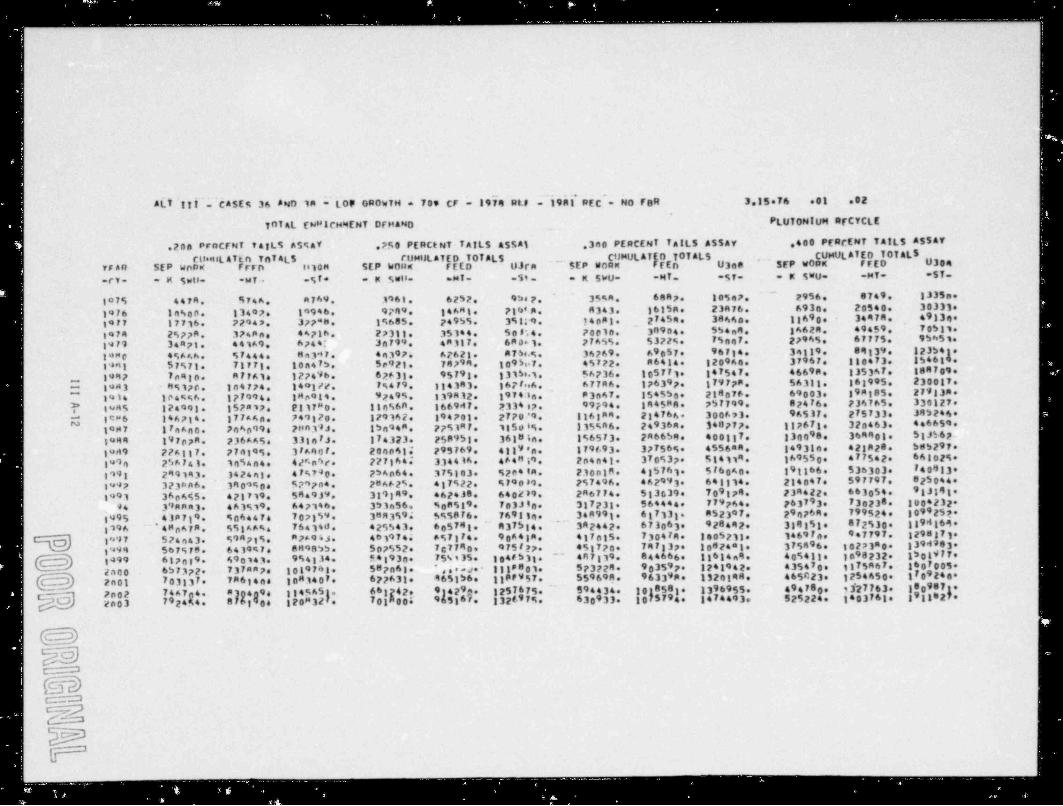
. .. . .. . . . . .. .. . .. . . . .. . .. . _ . . .
.
ND 1m U 'Op OnowfH * 709 CF . 1974 RL7 ~59H5' REC". NO F8R 3.15 76 eel .82ALT'It!". LASE % 36 A l'
PLUTONIUM RFCYCLETnTAL gwp!CHMENT DFNAND-_
.200 proCFNT TAILS ASMAY .750 PERCtNT 7 AILS ASSA1 340 PERCENT TAILS ASSAf 400 PERCENT TAILS ASSAT
runniL4 Tin int ALS CUMULATED TOTAL 3 CUMULAT(0 TOTALS CUMULATED TOTAL 5VFAR SEP wnner FFFD eq0n . SEP l#0nd FEED UJrn ~ $1'P 80AM FFEn U3e8 . _ SEP et0px FFE0 U304
K Swu. .NT. 57 *K SWU. -MT. 57.cf. .M gwu. -M74 57 . x swu. .MT. 51 . .
1075 4474 M74A. A769 3161. 6252. 954 p.~
35%A. 68Ap. 10547. ~~ 2956 8749 1335a.
1o76 le%0s. 13402. 19946, 9789 14AMt. Pl6* p. A343. 16358. 23A76. 693a. 20540, 3033349 34
19F7 17716. 72947 377*8 19685. 74955. 3% l;-9. 14 pal._ _ 2 454 38440. 18690 34478 17
1974 2%7pA. 374an, 44pth. 2p313. 35144 50P.4. Pople. 30904 SSe #e IA62A. 49459 70S11.n
3479 34mpt. 441A9 6p44I 3n799 4R3ti, 6M O. 3, 77655. 5372%. 75ggf. 7p945. &TFT$. 95451.
9 57. 96714. 3e119 89139 123541el*Me 45AAh. %F444. Mn347 443976 AF623 A T St.%. 36269. 6 0
8441 57%71 71771. 10a47S. Se921. 787 9 10947. 45722 n6414 120964. 3796F. 180473. 154689.9
fn le. A77Ala 127496 62631 9579 131Shi. 56736. 195771 147547. 46698 1353%7 188709.e 319471083' 85170. In4F74 14*1 4 7%4F9 134343. 16? f..A. 677A6. 176397 179778 56311 161995 230017.**
2F9 JA.91M185. 1lu l6 te4%%6. 177994. 1Ho984 9249%. 139R12. 19 7 41n. - P3n47. 1545S0 218a76. 69003.~
Y l*A% 124993 157a17. 2117"0. 186568 166947. 2334sp. 99794 194588. 757799. 824F6. 736765. 330127. |
y Icp6 146714 377AAn. 749120. 129162. 194701.' 2770'9 116184 234766 300623 9A53F. 275733. 39324415 94". 7751"F. 185e 4%. 115%A6. 24936n. 340p77. 11267 e 32a463. 44665916 994 PH83'J.1987 IF4Ano. 74 60
7 9 5 J$62..1899 197ppR. 236AA5. 33 nFJ. 174323. 258958 36184n. 1%6573 2n66Sg. 40011 1300 8. 364901 1
tung ppnggy. py n g g5,- 37640F. 204861 295769 4119'a. 179 f.9 3 37756%. 4556am. 14931a, 421A2 68b2978
1994 25AF4). 145444. 42Gn4F. 227164 334446 4648i9 Fo4n41 370537* 514119 169550 477542, 66102%.5f6 40.. 191166. 536303. F4081347%740 254c64. 3753e3 %2 P 418 230plR. 415763 01993 299143 3424n3
~ 57'7n4 25462%. 417922. %790 89 757496. 462993 641114 214047. 597797 e2 0445344? 323RA6 340S9841991 36c645. 421719 5849J9 319349 462438. 640289 286774. 5:3639. 709374 234422 663054. 91J19 .1
894 39mmn3. 4A3%19 647146 3 Sin 56. MoR519 703Jin. 317238 564444 779744 263793 73023 1004232*
2 67 n. 799524e 19992527311 852397. 9 6,995 4387 9 %064474 707159 3883594 5%5876. 76983g. 34A991 611 1 87 530 1894 69A3 5 4. ~ 342442 673063 928442 33915. 2 17 8319A '4Hp478 553AA%. 76434d. ~425543. 605791 1
o I497 524643 59471%. "?'96J. 4019745 6%71 4. 90641Re 417015. 730474* 3005213 1469fe. % 7797. 129817 .i 3
C""~) g499 63p339. 490143. ' 9%4134 841930 *754t35.104fS3g. ~ 4%37po. 74F337 10824al. 375496. 1027340 13948831999 5675F6. 6439%7. 8H98SS. 507%52. 7c774a. 975f77
4R7 39 844666 Ig614n9 405411 1890232 1504977.1
0 597 1241942 435470 IITSR47 160700s.2a00 6573P2 737mm7. 1019761. 587a63 ,...s.- 1138801. 573224. 9 310792407 #3407 67763). 465156. IIPf957. 559698. 9633 8. 1320148, 465023 12546509
2n01 70333 78634ee 108987).1
9 9 1257675. - 594434. 10185e3 1396955. 49478 d27763 1066 242.9 n] 42 )1
. 08,04 1345451.7802 74A7n4.m}61g96 9118201 001 536 132697%. 630 33 1075794 1474493e 525224. 1403761 18 9364 120#32 . 779 4%4.2003 2
E!59c==
c==
#=='e
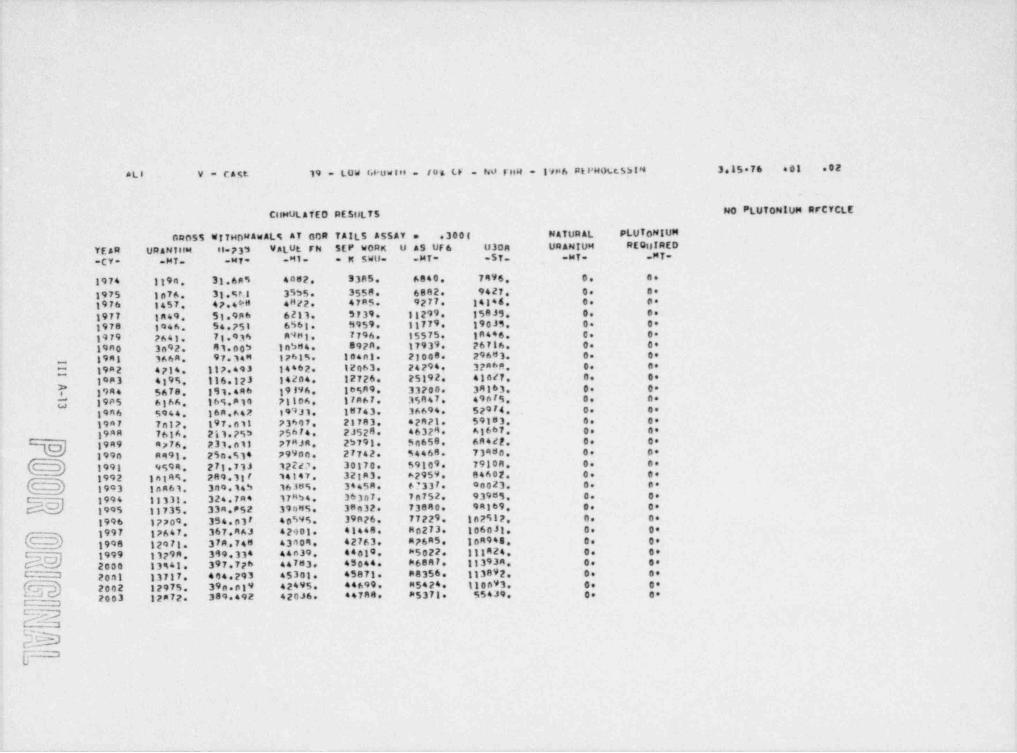
. . ~- - -
ALI v - cast 19 - Low r,powtu - tos (F ho FHM - IvM6 ptt'H04t5 big 3.15 76 =01 =02
.
NO PLUTOMIUM RFCYCLECuputATED RESOLTS
e .3004 NATURAL PLUTONIUMrien55 WITHDW4WALS At 00R TAILS ASSAYTEAR URANftf4 09-735 VALUL FN SEP WORM U A5 UF6 U30A URANIUM RE0tJIRED
-CV- -MT- -MT. MI- -M SWU- MT- -57. -MT= MT-
1974 1194 31.6n5 4082. 53m5 6840 7496 O. O.
1975 19 6 31 57,5 3555. 3558. 6882. 9427 O. Se7
1976 1457.- 47 4*# 4Hgg. 47m5. 9377, g4geg, g, p.
1977 IA49 51 986 6211. 5739 11299 158J1. 6. O.
1978 leen. 54 751 6561 M959 18779 190J5 O. Ce
1979 7641. 71 936 A9Mt. 7796. 15575. IM446. 8. 0*19n0 3n92. 41 005 In5n4. 592n. 17939 26716. 6 O.
19R1 3A6A. 97.14M 17615. leant. PIOOS. 29683. Se S.
:: 19a2 4214 117.493 14462. 12463. 24294 3286". 6. De
1983 419 116.12J 14204 12726. 25192 410t7 6. O..
2=1944 5670 191.4mb 19996, le5A9 33200. 39163. De 0
e
C7 1985 6166 165.814 71106 17867. 35447 498i5 O. De
19R4 5944, 16n.A42 19 '4 J ) . 18743. 36694. 52974 O. Os
1987 7al7 197.611 73697 21783 42R71. 59153 Se Se
1988 7616 211 255 75674. 2J524 46329 Al667 O. Se
ty 1949 4776 233.nli 77MJA. 25791 54658 6R442. O. Ce
1990 8491. 254 514 7990s. 27742. 54468. 73480. Se 0
27 .713 122d?. 30170. 59109 7910R. 9. De( ) 1991 9594 1
1992 14145 289.111 14147 321m3. 62959 84602. O. O.
h h 1903 lam 61. 349.145 16385. 34458 67337 08023. O. O.~
1994 18331. 324.7a4 17H54, 36307, 7m752 93959 8. De
1995 11735. 334.PS2 39445. 38n32. 73840. 94169 O. O.
1996 12709 354.p17 40595. 39M26. 77229 102512 6. De
1997 17647 367.463 42401. 41448 80273. 1060Jl. O. De
b h 1998 12971. 37A.748 43409 42763. R26 S. 10n940 Se 0A
1999 1129M. 399.334 44639 44019 85022. 111A24 O. O.
2000 13941. 397.72h 44783. 45044 86847 113934 O. Se
2031 13717 494 293 45301. 45871 88356 113892. 6 De
[gg g) 2002 12975. 39a.pl9 42495. 44699. M5424 130n93. 6 Os
2003 12872. 309.492 420J6. 44788. 85371 554J9 O. De
u ,j6- ,
L'
- _ _ _ _ . _ _ _ - _ _ _ _ _ _ _ _ _ _ _ _ _

. . -.
.
.- . . ..
.
. .. ..
-. - - - . . -
.
AL7 V - Cast 39 * low Spow?H * 70s CF * No Fee * 10n6 mErmoCE5584 3.15 76 03 .02
CepeuL ATED RESULT 5880 PLUTONIUM #rCYCLE
looA07 ATEn NE788RN5 A7 GDP TAILS ASSAT 4 300g PLUTONIUMYEAR URANlllM U-235 VAllet. FN SEP 180RK U A5 UF6 U304 RECOVERED*CV* *MT* *"T* *MT* K Swt8* *MT* *ST. *Mie*
1974 9 0 04# 0. 8 O. O. O.1975 8 0.000 a. O. 9. 8. Se1976 c. 0.000 8. O. 5. O. D.1977 c. n D00 6. 8. O. O. 8.e
1978 8 0.000 6. 6. 9 O, t.1979 6. 0 000 4. O. 9. 9. e.1980 p. a. ope c. O. O. O, p.19A1 S. 0.000 6. 6. 8 6. Se1982 6 0.80s 6. O. O. 6. a.=="
1943 a. n.aao a. 6. 6 O. a.? 19a4 6. 0.... O. O. O. 6. 6Z 19R5 A. 0.000 0. O. O. 6 91986 A46 g.n n 3p47. =pf. 717 2001 6*e19R7 7181 19.417 IInv%. 332. 3002. 5380. 1619mm agtn.- 34.947 735394 *152. 5327 85S9 3.11949 6901. 49.A9% 10589 *I44 7421. 198f . 4761990 7907 57.9e4 15884. * lot. 8604. 18063. 47.1991 none. 59 39# 17946. *3me. 8677 18787 46.1992 #199 67.In" 14h4A. *747. 9729 171'4 47e1993 mI9s. 67.s39 in3fs; *I7A. 9312. Ipn6n. 49.1994 Pjga. 67.1g3 .inhti. *2n%s 9275 12057 S.t
4 1995 8197 67.40s 185WA. *203. 92968 12103 57.! 1996 A397 67.%34 1RSMA. *183. 9330. 17117 S.t1997 8697 67.'no 40819e *80. 10l!8e 139W1. 5.3
'1990 9AR6 74.474 4549a. *lan. 11357 15720, 64.1999 telPl. 79.n94 47"J6 *212. Il6A6 15146, 67.CD 2008 10149 78.nTM 47dd9 *215. 18682. 15265. 6a.2001 10379 74 59J 47747. *167. . 11002. 15320. 7a.2002 10671 87.201 96191. *196. 12327. 16a29. ~ 762003 18667 9 360 54115. *180. 13545. 930s. 63
0
a@w
(o'ay

._ _ . -
' *
AL7 V - Cast 39 - LDW GROW 7H - 795 CF - NO rmR 4 1946 REfROCESSIN 3.15 74 .81 .82 ~|
CitHtJt.ATED RESULTS eso PLUTONIUe4 #FCYCLE,
!
mW7 REQHIREMENTS A7 AnP 7 AILS A554Y e 399( NA7 URAL PLU70MIUet WWENUS. BASED| YEAR US ANlt|M H*235 V4Lut FN SEP Wopn u A5 UF6 U30s ORANIUM YR-ENn INV Oss C0007AAC7
K SWU. -N7* ~57. -M7 -M7- kN-| -CV- -M7- -M7* MI- -
1974 Il9n. 31.6ms gnu?. 5195 6840 74W6 O. 8. 8.
1975 1974 31.511 3555. 35%8. 6an2. 9427 O. O. 8.e tp. 47ms, g277 14146 O. 6 8.n1976 1457 47.494
1977 1849 St.9mb 6213. b739 13299 15A35. O. 8 S.1978 1946 54 751 6568 5959 33779 190J5 6. O. 4. f
7 .936 89ml. 7796. 15575. BA446. 4. O. 81979 PA41. 1_
1980 3097 8 3.a ns 105me. 897s. 17939 26716 6. O. 8~~
1981 3668 97.34P 12485 10408 71008 296e3, 0, g. 37 1992 4714 Il2.49J 14462 1E063 74294 3pn6m. O. 8. 8
G 1993 419%. 116.373 14204 12726 75192 41027 O. 8. Se1984 567m. 151.4 n h 19396 10589 33200 3n363 O. O. 81945 6366, 165.41e 73106, 17A67 35a47, 49075 O. O. 819A6 $p94, 163,794- 14.MM6 18770 35977 509i2 O. 6 'O.1987 4629,, 177.599 175I7 21658 39819 53R73 O, 23. O.19A8 3a46 174.733 4tJ5 23hAO. 41201 53107 O, 54 s.1929 1773 1 R1.3 % .27bt, 25935 43237 57546 O. 96 S.N i990 na9 i93..,. Seio. 27 43 4%.66 62ai7 6 i. ..
4 1991 1994 217.541 .5704 30%50 SO432, 673Wl. O. 19R. 8, 3
1992 3985, 227.209 4499, 32424 $3730, 77408, e, 235, 8
(t } 1993 7644, 246.Ans -2190, 34634 58006 7795%. 6 294 81994 3134, 267,4nt 767 38%17, 63477 Al92s. 9 335 ..9
aa; i995 3%3 ,76.452 49 30,36, 652 .6066 .. 36 .
1996 4482,. 291.499 2 d l e ,. 40010 67894 903V5 O. 437 O.,
1997 3951, 30s.56J 1181 41528 70154 92034 O. 490. O.1995 37A4 304,777 -2447, 42943 73527 9372p. O. 555 g.{} .
1999 3337, 311.736 -3796 44231, 73136 96674 O. 621. 3
M 2000 3361 3 t e .64's -3446 45759 75204 9A673 6 699 S.2001 3538, 325,708 -2447 4603#. 76554, 9857 6 759 g.32002 P303, 307.qtn 75v5 44n95 73097 93263, 0, e35. 9b d) 2003 1204 299.nl -124Fe. ***74 71826 46254 e. a97, s.
MEssoa
'
__ _ _______ _____________ _ _ _ _ _ _ _ _ _ - _ _ _

_ _ _ _ _ _ _ - _,_
AL7 11 Ayn V = Cast % 33 ANU 19 - LOW GRowiH - 7en CF = NU fpR . 19A6 REPROCESSIM 3.15 76 01 .02
CUNULATED RESU 7S NO FLUTONIUsi RFCYCLEL9PEh? FUrt 570 RAGE AND REPROCESSING IN -M7. OF HEAVY NE7AL Bf 00 RTER YEARSA
FOR LIGHT wa7ER REACTORSADDIT 10NS TO STORAOF HastNS Ft'EL NEPROCESSING 570eA9" 8A5tN #E0HIREMENTS-CV- II) 12) 41) 14) ll) 12) 139 145 Ill 123 131 148
1974 727 8 71 328 O. 9. 8. 8. 777. 727. 004 924*1975 %.. Im9 47 361 8. D. 8. 9 97n. 1867. 1215. 1575.1976 154 ??9 fI a. 204. D. O. S. 8 1714. 19A2 2135. 23393477 .297. Pale 365 148. O. p. c. a. 2636. 2917. 3246. 3433.1974 3nA. 774 43J. Sole s.. G. O. 9 3741. 4015. 4440 47491979 234. P44 406 467. 8. D. O. 9 4954 5237. 5643. 6310.1980 260. 197. 4FF. Ste. 8. O. O. 8 63F0. 6567. 7044. F55s.1984 316. 747. 51f. 479 c. a. O. 6 7895. 4142 A739 921F.1982 477. 71F. S') h . 640. O. O. O. 8 9694 9937 18527. Ill671943 479. 449a 491. 013. 9. c. O. 8 11646 32195 12686. 13499O leas e 545. gq?. 7 10. 770. O. 9. 8 e. 14en4 14616. 15366 It006"" 1985 974. 947. 968 726. O. a. a. 8 17030. 17578e IR542. 1926e.}" 1984 113 AA7. 941. Inn?. 300. 35n. 349. 349 20146. 20423 75039. 21788
419R7 1195. A4%e 1805. 1997. 849. 84R. P50 850 22113. 22329. 72394. 22f 31
-a*
14R8 1897. 1714. 17 5 1275. 1450. 144n. 1447. 1498. 22173. 77139. 71957. 23684.6
lea 9 11%?. In44 1505 1474. 1799 If97. 1800 1949. 21217. 2e524. 70279 19054.1994 1418. 1456 1760. 16 5. 1950. 1950 1950 2000 19342. 18449. 14259 17874.3
1991 1496. 1260. IP5J. 17 5. 205 205n. 2a50 Plot. 17370. 16531 16314. 159693 01992 16%3 1478 7040. 1874 520 c. 704R. 2n47. 2097. 15%73. 14953 149 6. 14637.0led 3 IRo6. 1917. 7203. 19 8. 2050 20%e. 265n. 2099. 14393. 13860 14013. 13892.7
4494 1945. 1671. 7350. 237A. 2049. 705a. 2n49 920 9. 137A9 13411 137 2e 13741.1l'89 5 7098 147%. 74HH. 2275. 2049 2050. 2049. 2099. 137a9 13544. 14003.- 141791994 7744. 197A. 763u. 2476. 2049e 2090 2049. 2099. 14377. 143n6. 14094. 15 g.1997 2343. 2119 3767 75%6* 2799 2Jan. 2799. 2349. !$1n4. 15374. 15592 S h {e g8.1990 2511 2239. PRib. 2663 2549 255g. 2%49. 2%99. IS749 15449. 157F4. 15935.1999 7674 214A. 29FF. 2765. 2549. 7554. 2549. 2599. 15913. 15711 16138. 16304.
,7,771 ,2859 2,599. 163,77.77400 2491e 30 3. 2549 755n. 2549. 16476. 17 611690gg 3 01,1
1n. 25 4. 31s ..,noi 99 ,549 25s.. 2549. 59,. 11 19 I, 133 0 1 35. .2002 2447. 2675. 3226. 3012 2799 Pu00 2799. 2849. 18446. 19272 41 690. le0617n03 6 ne 0. 6 3049 3090 6 8 15n11 12762 12762 -12762
WEDC===
c===
ct=='

-
*
, | '. ALT V * CASE 34 ; Low GROWTH - 70s CF .'N0'Fmm - 19a6 REPROCESSIN ~ ~3.15 76 .01 .tk-
_ NO PLUTONIUM RfCYCLE
YTAR ANut|AL POWER ADDl710N5 RY REACing 77PE. EttC7PICAL k(8AwA775 GENE R A 7104*
. MILLIONS-cy. H7Go PWn Nwe 07HR hA7 FMR To7L RE7D CU40 of k wH
1074 4; 7193 4594. 850 Da S. 17634. 9. 29993 1902901975
~
01 3403. 3647 9. 88 0. 7050 200. 36043 2a54461976 01 547%. 1972 p. 68 0 7447. 8 4*290. 250443.1977 0; 7020. 6 O. 8. 9. 1870. O. 53310 2953171979 . 0; 611P. O. 6 Os 0. 4118. S. 57420 3305731979 0; 3304. 1978. O. 08 6. 5232 850. 41010. 366888,1980 es 56es. 2777 6. Os 0 e3n2. 6. 70192 4339701981 e; 6331. 6447 6. Se 0. 12778. 200. p2770. 476291.1982 0; 11492. 5342 O. 88 8. 16914. 175. 99429 563683.=.
|| 1943 ai 11849 5915 D. OS 350. 188344 0. I!7563 6664791984 et 18728 6817* 0. O. O. 17625e 139. 135049 7A4373,3,
2. 19n5 es 1467p. 6323 O. , 06 9. 20791 O. 19584G. 903407s. 1884 0; 14699 9172 5. 08 e. 21821 O. 179661. la46265
19R7 03 13799. Talm. 6. 06 c. 21573 9 201234.' 1883558.1884 0; I4405. 6SA2 O. e6 6 20967s 0. 222205. 1307040.1989 0. 17243. 6286 6. 6. O. 21456. a. 245657 14409661990 03 14917. 8016 O. C& 0 22933 50 268540. 15781771u91 n. 17497. 7516 6. 06 c. 25013 S. 293553. 1789443.1992 6. 17564. A7A4 O. 66 9 26348. O. 319901. 1867742.
G ) 1*91 04 17508 R7%4. O.' On 0 26264.~
0. 346145. 2018932.1994 O& 1770A. P992 O. S4 0 24560 6 372725. 2170994
'h ) 1895 03 18837. 904A. O. 06 6. 2720s. 8. 399925 23244873496 Os 16437. 8216 O. 03 0. 24648. 8. 424573. 2467422.
h33[2) 1997 05 14732. 7368* 8. 06 0. 22100 8 446673 2594310.1494 OI- 14164. 7044 8. 88 6 2124R. S. 467921e 2709941.l#99 0. 1160a. 6R00 O. O. O. 20400 8. 4A0321. 2A16040. I
h ) Pn00 02 17464 6212 O. 08 9. 18708. 8. 507021. 2910197 |an01 0. 11900. 5944 O. 66 0. 17448. 6. 5 4869 2993310. I2
c 152)c: 2n02 0s In764 53a4. S. 06 6. 16148. O. 541017 3063nie.2n43 08 9637. 4816 O. OS 0. 14448. O. 555445 3117615.
bm
| |EEEE3 j| 0
- _ _ _ _ .
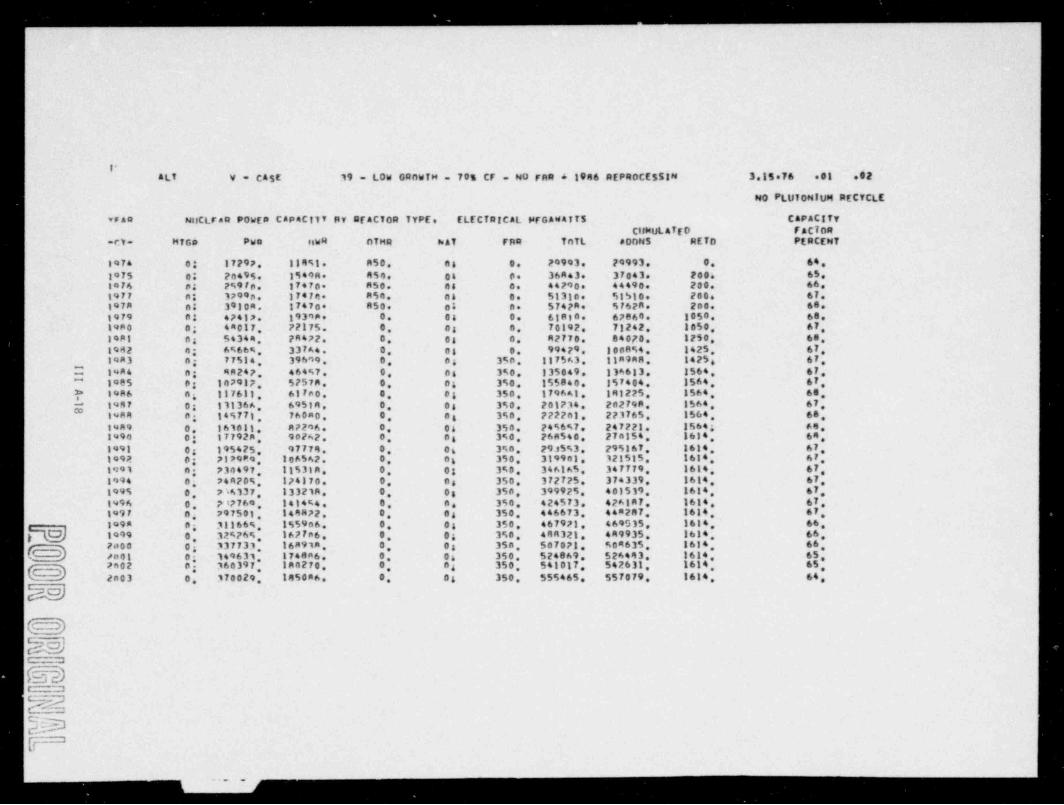
.-
. .. . .
. - - - - - - . -.
l'
AL7 V = CASE 19 - LOW ORowfH 705 CF - NO FRA e 1946 REPROCESSIN 3.15 76 .01 .02
NO PLUTONIUM RECYCLE
vran NtJCLram POWEp CAP 4C177 Ry BEACTOR 7YPE. ELEC7alCAL NFGAwa775 CAPACITYCilMULAT D FAC104E
= r.V . H7G# Pwe nwR 07MR ' h&T Fee 707L ADONS RE70 PERCEN7
j 1974 el 17797 184%1. A50 e6 9. 24993. 79993. 8 641875 0; 24495. 1949n. 454. On S. 36443. 37043e 200. 65l#76 p; 2%978. 17470 R50. 88 6. 44790 44490. 200. 661977 at 1799a. 17474 854 at 8. 51310. 51510. 200. 671978 n! 39304 1747o. 850. os a. 574?A. 576Pa. 2o0. 601979 O! 47417 19398. O. 64 8. 6 tele. 67860 1850 601980 0; enOlf. PPl?5. 6 Os 8 70192 71242 1850 671981 og 54344 PR472. O. Os 0 42770. 04070 1250, 601992 n; 6%66%. 337A4 O. el 0 99479 3008%4 1425 67,lea 3 a; 77514 39699 6 es 3%e. II75A3 Iln948 1425, 67
C 1984 n; 4R247, 464%7 O. Os 390 135049, 134633 1564 67le85 og 147917 57578 O, ca 350, 155040 157404 1564 67*
,
? 1986 a; 117611 6tfa0. O. Os 350 179AA1 191225 1564 60|
g 1987 0; 13l36A. 69514 D. Og 350 201714 282798 1564 671984 0; 145771, 76080 O. Og 3%0 PP2?nt. 271765 1564 6019A9 0 161031 n?296. O. On 350 7496%7. 247721. 1564; es.I'*94 0; 177928 902A2. O. Og 3%0 26A540, 27al54 1614 64
.1991 og 1954?S. 97774 O. Og 3%e. 29J5%3 295167 1614 671992 0; PIP 9R9 196542. O. Og 350, 3199nl. 121515 1614 671991 n; 734497 11531A. O. Og 3%0 34AIAS. 347779 1614 67,1994 0; 74APO%. 174170. O. Os 350 372775 374339 1614, 67,
O 350 399925 401539 1614 471995 6 Pi4337 13321R. O. .s. 390 4245n. 2Aia?. i6:4 67 Ji,96 c. ,i,76. i.i4%4 6. 67| 1997 og 797501 149872. D. Og 350, 446673 44m287 1634 ~66109A 0; 31166%. 1559ea. 6 Os 350 467973 469535, 1614
g 1099 0, 32%F6%, 1677a6 O. 0; 3%0 444321, 449935 1614 66! 7000 Os 337733 16891R. O. 03 35a. 507071 504635 1614 66,
enel 0; 149631 1748a6 O. Os 350 524069 526493 1614, 65,' '
3>0; 360397 18a270 O. og 350 541017, 542631 1614 657n02 ,
2003 0 370029 1850se. 9 Os 350 555465 557070 1614 66
oW2J
bdW51EDTr
.. - ,.

_ _ _ _ _ _ _ _ _ _ _ _ _ _ _ _ _ _ _ _ _ - _
C e o e o e e* * * * e e* * * * * * e se se e *e e o ee> e m es eem os es ee e ee e e e ee eee ee eeem
=3uEW
E
Ob emeseeeeee**mMM*MNemeemedeONe>28 e m e e m e O O e e e e e w h e N M k MM e e s p e M e e pWO e e e e e s e e e e e e e e e e e e e ce s e e se e o e eeu e e ee eem os oe me e kp e n d e@ hecempede i
'W g 2 meSMWANN>NS4mbeNeJ 4 W m m h WM M W @ @@@hEs |
N & WD |9 > >2
U m a
$g
e
me Q* m e w OOmeeeeeeeeOOOmpWmmecemecepepo !
'2 * omecomeeeeeONee@ m@ m ed e m e @p me @ rO e e e e e e e s e e e e e e e o e o e e e s e e e e s e e o e ** e e ee eee ee ee eNe e@ >> e se mp e pp eo co
@ 3 m mmmm> J* & eW W= O ee 2
M *JJ e s se ee e ee ee mm e de e c e @d WW @ @m dW r@44 e s e c e e e e e e e e N h t+ > m e m AN h N h h N h h N N
ok e e e e o e e e e e e o e e e e e e e m e e o e se * * * *O e e e e eee ee ee eN N m
2>4
O 1m :
- -.. Gemeeeeescoces.eeme...........IkW e m o c o c o c e se e N A #P O W r n A NA A NN N A NN
2 u e ze e e e e e s e o e e o e e e o e o e o ee s e e s e e e e e>3 e s ec eee ee ee eNN mm m
M - E NOW >W W mU KO gE =& 2 me eeeeocceeeeemeneesecoececeeeceW C wJ eeeoceDooonceeeeeoooO oooooooomC m >QW e o e o e ee o e e e * * * * e o e e e e s e e s e e o e e
> 63 SeescomenceeemseeeeeeececoceOO4 4 DwkC N a@ m te ;* J
m e9 h
3 e W oeeeeeeemoceeeemoeoconooopeooo |
E J eDeeceOOceOOOeCOceDemOOOOOOOOOE C *au e e o e o e e e * * e * e * * * e * e s e s e e *e e e e *6 2 3> e c ce c es co cc c c c ce C G e et CO c cO OO OO
ee a.uO 3
2 > e &G
G 6 e>
b OU U
w e O e e e e e e e e e e e O = N e c e b e c@ p o e me d'N m ke a we e > SOOOOOOOO OOON@ @@ MPeMP g N.N d M f N d e> 2 e e o e e e e e e o e o e e e * * e e e e e e es e e e e
3 e J e c om eee oc oc oc N Mc N> e Me @> o e m p e c @0 m 3 N@@ *CMcMcMe(NseMe
2 e & = = 4 &M M e e (.4 4 N E SZ 3 3m > e u3 3C J seE & JJ comecceeceee==dkMPA4+ emCMMmkMNO e4W c e c o a c c e O O O O N M mp h @ @ Eh@>OMhmWN4
W >3 e e o e o e e o e o e e o e e o e o e s e se e se e o e e1 J eCZ 00000D00eODO44"*@@ttomeF 44K@ 4mO m >Z mRW 444 4AS@md@@@>@J * 4
W >0 m
6 e@ OM W Pg eccceeeececeCCecCOC CC ececonoce
C O C G. O. C e. O C O O O SecGC OOGeOGOOCdw CcOCe s e e e * * * e o e en e s e s e s e e *> g e e e
>> conccoaccCoceDODOCD 0000000DooDO 4o
2U
WR
J g w ceceSceeeCococeecceCeocecocenem C OceeCCeceOOCCOeO C e c e C*cc c e O C C O GW g e o e e e o e o e e e o e o e o e e e s e o e e ee e o e eU e b- ceCOCCCCOe@CCOOceCC CC CCOOcceCO#
E9 e E
> e
eeCececCccceC==dh F@ Add C=ePFem>FA
e O C C CCCeCOeCCCNF*@ MF@ CAthC Fh =hAd3 e e o e e o e e e e e e e e o e o e o ee s e e ce e e e e
.e J CCCCCCeceCeCCd=mdVdE==CP etC@ CmmM4 WW4 W O @ @ r. @ @ d C M @
e>J e4
g 8 e r (k g r e mW M d @ C h e p e=NM+@Che@ OmNMt 4 > >>>hm>ECCESCCCCOPPPPP PrepecOOc I
ih G @ @ 3@ @@@ 3@ F#@@ @ @@ @@ @ @@ @@ @ 7@ CC CC> g a mmmmmmmme====== === =======NNgN I
a |%
III A-19'
1
ii
h . Ifu :o oJ oa 2. . . .

__ ._
M e e e e e e e o e e e e e ee e e o e e e o e e e e e e o eO oaoGooooCoOWWWW@@mmWW$mmm@meddEeOhw
J 4 ,
D4 m4 > EOWJZ
W e e o e e s e e e s e e e se o e e o e e o e e e e e e e eW C> J D oe o nom en em oe oo o ooo o e ce oo ooo ooJ 2pSmW u mgCWo > MWpKe u MZZW
h h kE uk
COm X E
O.3 EM W e o e e * * e o e e e se e o e e e e e o e o e e e oe e e
5 4 O oooooooooooooooooOOoooooooooo* W2 a_EmO >OM> J >M
@ 2 bOZmM a Da k* 4 b 29 >* O >W* 2 ZKkN * * * * e * * * e e e se e o e e o e e o e . . * * e * e eM W eO o c oo o oo oo oo o c k mee e me r m e e n w e e s eA22 ep**wed ed ee******PMm O PPEng AR hhAAAAAAAN@ -*W mM@hkeCEEEE@ W SSOm@ -
2M mmmmmEmJE
2 > e e e o e e e e e e e e o e e e e o e e e e o e e e e e o em W eacescommFMNNAANNNNNNNNNNNNNNNe o tw* K2w b4W e JO GE& obg M e e e o e e e e * * * e e ee e e e o e e e e o e e e e e e* O oOOOGOC44MMMMMMMMMMMMMMMMMNNWWd EE ECe # kWw M
J m0 O4 2
= >2 OWg JZ W e o e e o e e e o e o e e e e e e e o e e 's e e e o e e o eh a O CCeCGCCeceoCCCCCCCCCCCecccesaTbEmO 3>3m2 me>n
kWZW9 4 I b
u6 mku EO
z W e e e e e e e e e o e e e o e o e e o e o e e e e o e o e eW 4 M J O OOOOOOOOOOeOOceOGoOOOOOOOOOco@ mZEmM COM
J>>m8 W Im
OU bZ mm> E3 Z>C @ W W * * ' * * * * * * * * * * *** * *-* * .* ** * * * ** *
e C G O C G C C C C C o e C O c o c e c c o c' e B *E 6 1 O cocescoC M E6230
3 mdWQ MJ e m
FB
ep e e e e e o e o e e e o e e o e e e e e e e e e e O e e e eP F O k t h t m t C NC C r e P k k e e N A e = A m C A O d a
e QA emMr>+thmFGheCCheed@ eMOrtmPE 4M30 O S9% PMmT9AeEPh DEhePeNeOAPNeeNBJD m mmmNMNeepeptmns@@ CmmNNN%MMMN
e menommmmmmm
a
U *0D@( OWZ e u o e e * * e e o e e e e o e o e e e o e e e e e e e e eu 4 PRO C CCC OCCCCCOCP Cd AA P k k k 4h r.e n SC h h
6 eWm OEdF#CO@@@@ eP EENAE8 = >2 esmesmem-mmepammee
aC4 Ne@htetsteceOOOOE> O US mamm>3WO
M E2C *
.
=OJE e e e o e o e e e e e o e e a e e o e e e o e o e o e e o ee <= t a k e m e = = N M e r s a k > c e r c e. k N N w M o r r eCkEm e Ce@ *@Ath errg-M ScrevergC P 4 7. e F.k C32 C m e e @ C m A e mr m e t @ pAgh-Amh egCrOCM
N > > 4 > 4 e m M e @ me kN @ k o mMk o e @ N c 3 Om M e d a mJ 2>4E maammNNNMMmetedOO@@@e>>>>>>Wg CE20
YZm
Et erekWPCahmeedkePe=NMemdkEPomhM4> k hkkh >Cet SteEEEE P@@@@@@ 9900000kU O OOO OOOOOWOOO OOOOOOOOOO OO Ot t CC>g - === ===========m======= ===NWNA j
,
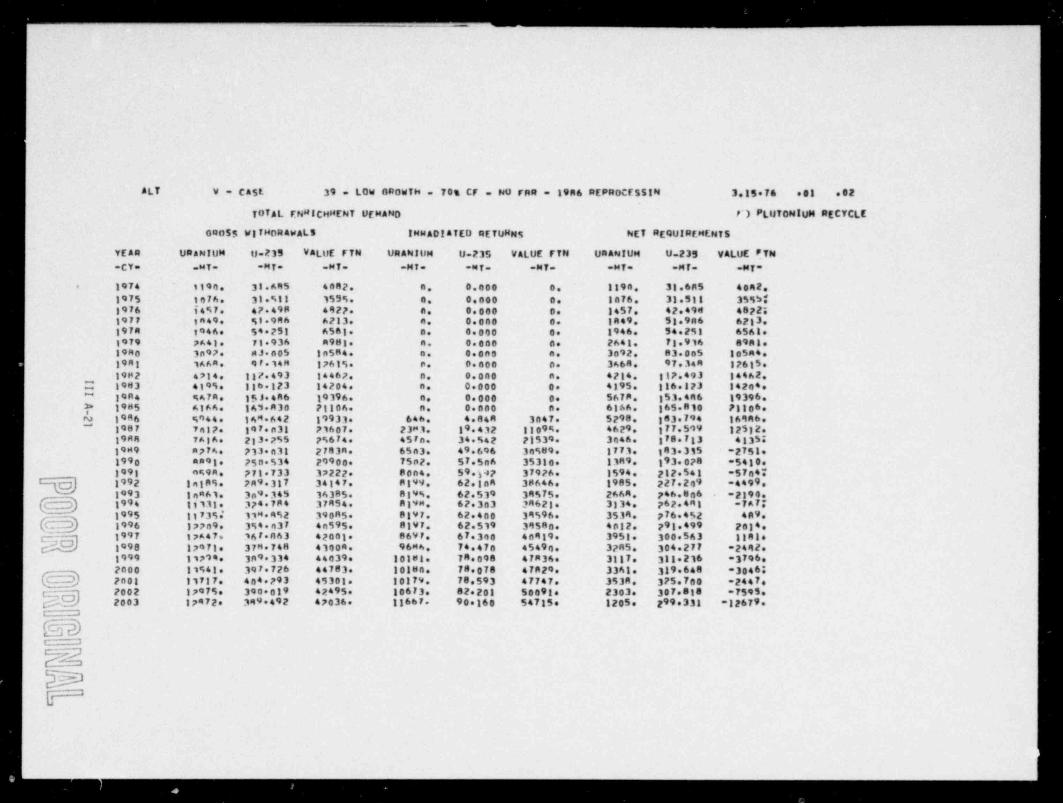
e -
ALT v - CA5L 39 - LOW GRowfH - 70s CF - No rne - 1986 REPROCE5 SIN 3.15 76 01 .02
total ENRICHNENT UEMAND F) PLUT0NIUN RECYCLE
090$$ WITHORawALS INNADIATED RETUNNs NET REQUIREMENTS
YEAR URANIUM U.235 VALUE FTN URANIUM U-235 VALUE FTN URAN!UM U-235 VALUE F7N-CY= MT- -MT- -MT- -MF- -47 -MT- -MT- -MT- -MT"
1974 1194. 31.695 4082. n. 0.000 6 1894 31 685 4042=
1975 1076 31.%11 1555. e. 0.000 c. lat6 31 513 3555!1976 i4%7. 47 498 4927 a. 0 000 c. 1457 42.494 40221
31977 1849 91 946 6213. n. 0 000 6. 1849 St.9n6 6211974 1946e 54 251 6583 O. 0 000 0 1946. 54 253 6561.1979 7A41 78 936 A981 n. 0 000 e. 2641. 78 916 89nl.1980 3n97. AJen0S In554. n. 0 0nD n. 3092. 83 005 1o54419RI 1AAm. 9F.14M 37615. p. 0 000 p. 3464 97.34R 1261519H2 4714 117 493 14467. n. 0.000 p. 4214 117.493 14462
O 1983 4195. 316 123 14204. n. 0 000 0 4195. 316 823 142e4** 19n4 4ATA. 151 4R6 19396. c. 0 000 0 5678 153 4n6 19396p 1985 A164. 14'J. A 30 21106. n. 0 000 p. 6166 165 810 7110 6N 1946 %944. 14M.642 19931 646 4.84R 3047. 5298 183 794 16946.~
1987 7elp. 197.p31 71607. 23"1. 19.432 110 4 4629 177.599 12512.91984 7A36. 233 7%5 256F4. 45Fn. 34 542 21539. 3c46. 178.7 3 4135;1
19H9 A774 733.n31 2F838 65a3. 49.696 34589. 177.1. 81 3 315 -2751.1990 an95 750 534 29900 75p2. 57.5a6 35310 1389 91 3 0?8 -5410.1991 9494 771 733 37222 80n4 59*b42 37976. 1594.- 212 541 -57n47
a 1992 Inl85. 7m9 317 34147. 8199 62. Inn 38646. 1985. 227 209 -44991993 In 61. 3n9 345 16385. 819%. 62 519 34575. 2A64 746.8a6 -2190.m
(w} 1994 11113 374.784 37454. Al9n. 62 303 24623 3134 762 4RI -7A7;
1995 11735! 13M.452 390ns. 8197. 62 400 39596. 3539 77 6 452 4R9h 1996 177n9. 354 437 en595. 8197 62 519 39580. 4012. 291 499 2014e
~
1997 17A47. 36F.463 42001 8697 67 340 en919. 3951. 300 543 1881e1998 17971 37M.748 4300m. 96H4 74.47a 45494. 3245 304 277 *2442.1999 1179e. 3m9 334 44039. IOlut. 74 098 47m36, 3117. 311 216 -3796e2000 11941 397 726 44783. 10lue. 78 078 47R29 3361. 319 648 -30461(w) 2nel 11717. 404 293 45301 30179 78.593 47747. 3538 375.700 -2447e2002 17975. 390 019 42495 106F3. 82 201 5009te 2303. 307 818 -7595%2003 17472 399 492 47036. 18667. 90 160 54715e 1205. 299 331 -12679. |
%2g,
2EE)̂u
-_ _ _ _ _ _ _ _ _ _ _ _ _ |

. . . . ._. .. .. ..
. ..
.-- - - - - - - - - - - - - - - - - _
.
ALT V = C4%F 39 = LOW GPowfM . 70s CF = NO FBR = 19A6 REPROCESSIN 3.15 76 .01 .42
7pT4L FNRICHMENT DEMAND NO PLUTONIUM RFCYCLE
.70s ProCENT 7 AILS ASSAY .250 PERCtNT 7 AILS A554f 300 PERCENT TalLS ASSAY 400 PF.RCEN7 7 AILS A554Yf VFan SEP wnnN FFED tJ30 s SEP w0ng pgEO UJ04 SEP WopM FEEN Uja8 SFP WOng FEED U30s#
K SWU. sM7- -57- . K SwU. -M7. -57= * K 58U= -M7* -57-- r.Y = * K SwU- *p7 -57* *
1974 42AG. 5714, 7462 3779 6228 Sill. 33M5. 684n. 8919 2000, 9657 11333.2 56. 8749 1335991975 4478. 5746. ATSW. 396t. 6252 9S47 3558. 6487 10542.
1976 6p73. 7746. 18177 5378 8428. 12156. 4785. 9277 13374. 3974. 18798 169931977 7735. 949n. 17548 6395 10274 13641 5739 11299. 15040. 4759 1433A. 190301978 7516 9A55. lande. 6647. 10713. 16174. 5959 18779. 17779 4940. 14943 22534.
72 589.1979 9a45. 13044. 14250. 8695. 141 2.7 1 575 217A3. 6456. 197341 a25. 77964 5
1 939. 25314 7389. 22713. 3204371980 11279 15p14 21720. 9959 16329 73045. 8928.1943 13147 17415 246M6 Il6aA. 19127 76#07, 10401 21008. 29445. 8604. 26543. 37265.1942 19243. 20165. 2A940. 13458 77116. 29269 12063. 24294. 32144 9982e 30751. 40749
217 37953. It45 , 33943. 4969359 01983 16egl. 2 t n .1 33794. 14184 22914. 34533. 12726.a
1984 2a94R. 27434 3764J. 19507. 30215. 40846. 16549 33200 44879 13 . ' . 42050. 56934.O 19F5 22567. 30039 39010. 1992 . 32628 47431. 17867. 35847. 46649 34..l. 45391. 59306.9
1996 23644. 2944a. 4e898 20917 32657 44634, 14784. 35995. 49279 15604 45A53. 63050p5 152 640514 1987 27336. 32943. 41369 243A7 36014. 47337. 9 73 43 . 527af. 19 9773 41 02 3
N 1988 29P41 337936 44825. 26444. 37115. 49J47. 73789 41259. 54949 19429 53547 71637.51 49 24103 43113 5Hn19 21798 56670 76014g4N9 3764 35144 47A47 2R989 38807. 9.
1990 3909 377.11 5p82s, 31337. 43118. 5613a. 7Ac41 45952 62723. 23422 60780 82267..
1993 38463 40969.' 5%024. 34112. 45240 6a739. 30711 50549. 67a45. 25637. 662 0. 88'1297 755. 27249.1992 4p413 43486 59849 36775. 48709 6%I92 J2623 53833 7 904. 151 60 72
1*93 43672 477%4 6134J. 38695. 52090 69760 34P43. 58102* 777A8 29 94.* 759 2 101584.741994 45973 50140. 64ASJ. 4e776 5523g, 736.14 jotte. 61577 82044. 30659. 80369 710 0571995 48174 52736 7a320. 42689 58049. 77435. 3844). 64683 86236. 32105. 84341 112347.1996 Snjst. 55474. 717d2. 44664 61056. 80669 40219 67996. 89a%3. 33580. 84569 1870001997 52773 57772. 7me92. 46178 63456. 87777. 41772 70246 92239. 9 563. 120359.3490g6 1
tr 1999 54npf. Se76n. 75662. 47957. 64722. 84576 43203. 71635 94342. 3611 . 93613. 123287.( >A 91999 55618. 596a7 745 9 49347 65873. 86666. 4450a. 7345 . 96697. 372 1 96067. 126434
340|17
( } 2n00 54974. 6171a. Sq333. 5n529 67515. 88357. 45529 7532 . 98745. 98458 912 107.02p01 57A99 62153. 79095 51400. 68732. 8724?. 46339. 76664 97416. 38741 100177 12 539.7
2402 56435. 59137 76335. Sall2. 65523. 84367. 45185. 73214 94353. 37036. 96015. 123959.2ng3 56502 58146. 75535. 50214. 642 8 83557. 45298. 7195 . 93532 37966. 94699 1231037
3
ac9E E
NMEE3b
t .__
~

y - e -
|
|
ALT y - cagg 39 . LOW OROWTH . 70% CF - NO FRR * 1986 REPA0CESSIN 3.11 76 set 82
TnTAl FNRICHNENT DEMAND 940 PLUTONIUM RFC7CLE|
| e200 PFRCENT TAILS AS%A7 .25" PERCtNT 74tLS A5547 .330 PERCENT TAIL 5 A55Av .400 PERrEN7 TAILS A5547I CilwuLATEn 707ALS CUMULATED TOTALS CelMutATED 70fAL9 CUseULATED TOTALS
YFAe SEP wnPM FFFD If 308 SEP WORM FEED UJeg SEP 80RK FEED U304 SEP WOpM FEED U394M SWU. -MT- -57- - K Suu- -Mi- *SI-I-rf. - K Swo- -47 -5 * -M Suu- *MT- -5f- -
*
1975 4474 5744 ny69 3961. 6252. 9547, 3558 6887. 109a2. 2956 8749 333531974 10508. 13497. 11946. 9289 1469). 2169n. 3343. 16154. 23476. 6934. 20540. 30J33
7 454. 3898 7 A. 11690. 3487M. 49364.71977 17716. 72947s 38494 156R5. 249"5. 35J39 legal.3 737. 56696. 16630 498 9 78'819 81978 29742 37797. 473AA. 27377 35667 53514. 20040
1979 39n96. 45mele 6%APF. 31027. 49A48 7131a. 27R37 54817 7843 , 230 6. 69553. 9949 e9 8 tle8a 4A175 6 ant 4. 86847 (Sent. 6616R. 94Jn4. 367A4. 72751 1937%3. 34475. 92766. 331537sept 50s77 7aea9 III53J. 97587 R52 6. 171191 47146. 93759. 333109 39079. 114449 16er979
11 453 165163. 49ebt. 34960s. 2e4546.8gwng 74FAs. 9nnste 13n4tJ. 6An46. le7417 15a4%9 597791483 96916. Il991A. 17n754 8073n. 330326. 1R4997. 710%5. 14324%. es3316. 596t3. 18t%42. 25764a.~
|| lon4 1:3764. 147790. 207857. 44737. 160542. 725834 88544. 176445 748105. 73344, 223593. 3844737 4444 88138 26 M 94 3. 3F3779e9 9tens 134111 377749, 74A467 IIRA63 193369 268272 106411 2322 2y,
4 to#6 157975. 747769 2877h6 13957F. 225926. 312WOA. 175195. 248777. 344363. 1g3747. 314936. 436M29.w 1087 19s290. 740fl7a 331335. 161764 76tR41 36c43m. 146936. 248 tin. 396871 123835. 36s9mm. 504b8e.
32 369. 451R40. 141664. 419534 S76Sim.91999 219311 274494, 1T%960. 190708 798955. 409f95. 170725.3089 247817. 189A7Fe 421477 219197 33F763. 46tf34. 196R79 3776R7 5098%9 161462 4767e4 652537
%F 5mp. IAAA54. 53h444 F34799.8l#94 7R7969 146c 9 47 ins 5 25n334 37Andt. %I7Has. 2749A9 41 634 2n
3993 321372 347877 52a8f#. f44446 424125 57mbo4. 7%5579. 469183 640477 232521 602775. 823741l*92 3477e5. 431sA4 58F9di. 3Fn6Fl. 472330 A41 f 95. 2na707. 573035 713187. 239F70. 473279. Vg4*af.
79 970 269868. 749206. 10204751993 40sm7 47dagn. 6517 1 359366 524420 713596. 373045 5R3314.7 9 0i45 798. 5780%4 71814*. 40nl47. 579654. 7RFIR9. 3%9FAl. 642695 673q14. 299527. 829574. 182 5371994 1
1995 4999pp. MelA73. 784494 447R37. A17Fna. 864664. 39A7n7. Tei37A. 95977e. 331637 9 39:5. 12399ta+1496 5 272 63Fl44 861746 487496. 698764 945273 439421 7753 I. 1e49123. 365219 10024"4. IJ56s99.I
leet Ae7543. A944Po. 93AA39 531A74 763439 1078000 480193. 845617 314341 400121 1994047. 147F357.. 6C 1994 6%As70. 757A4a 1013503. 533RP6 P76041 [IlP575. 573396. 9 72S . 1735644. 43424g. Il8FA60. 16006441 7
172 ceq.F1999 7122n9 Al236F. 1092p9V. 631233. M93864 Il99197 567896. 990704. 1332341 47345 . 3283727.361 563071 41 959380 1787F49. 613425. 1966024 143117 513522 1382185.7 42W. 68 7 6Pn00 769137 A736n%e 11 7
1 83foA.9125 525. 733141 1078112 1375011 659744. 11426Ma. 1528542 55 262 14823522n01 827011 ^35'54 0170 1622995. 584099 1578377.995 996 1327859 783?53. In93635. 1459J77. 7 4930 12g5907 230 6642n02 893446 7
2 7 6 712 7A5 . 171647 6260 5. 1673a76. 2230 672n03 939948. 10534014 14033 4 833467 1157913 1542 35. 750228.9 9
I J
-
2553E=='

- _ - _ _ _ _ _ - _ _ _ - _ _ _ - _ _ _ _ _ _ _ - _ _ _ -
,
AL T VI - ratt 4e . Low r.ponTH - 70e. CF - pn t ria - N0 pt pHnf F$$ING nR DEfYCLE 3.1%.76 .01 .021
|
Ctewft rif D Ff %DLis No PLllTONIUet prCYCLE
300g N Af t'R AL PLUTnNgupr.pn%% wi7sans, AW Alt at r,0P *ifeS 75SAY e
YF Ale efpa ra t am e s. P n V at tet r> $rr knug u .a 5 07 6 OJna Up A bs tisu WEossinf ts-CV- M7- - ** T - ni- . er e. u u. -se t . -St- -MT- esi-
1974 139a. 33 6 Pas 4"p7 3?s 5 e.8 4 0 TRV6 O. Se
1974 **'6 11.%31 1%5 kSp. f.p n 7 94et. n. O.197h 14%F. 47.49M 4*F7. 47PE. 9777 1414 F. . 8. c.
19'. s p e'3 %g.9Ph 6433. 57.19 33799 g s.n J%. O. a.
:vid i n e t, %4.7%t 6%ht, bn%9 g3739 19434 6. 6*
1979 7644. FI.91* "*"1. 8796. 15575. 19446 O. e.loko te97 Hi.pos in%he. Me78 37919 76746 O. a.1981 1sha. 97.144 1761%. 104e1 7tead. 79A"3 O. p.
1982 4714 Ilp.4e3 34*b?. RecA3. 74794 3786e. 6. p.
[* 19d3 4195 Il6.Ip3 147e4 Ir776. 75192 430/7 p. a.19'4 %A78 1%1.4a* 89JVA. IPA 49. 33700. 18163. 8. e.
Y 1**5 hing. 16%.810 site 6. I tm# 7. . sne r. 49nfu. O. p.i
% i9a. sne., is.. .P i9 n. tr743. un94 s794 o. O. ,
19a7 7els. 197. pit 716r7 71783. *7e71. M*Ihi. O. m. I
g9an 7agt, ;g3.pg3 7g%t4. p a r,; n . . g ;,P a . 63667 O. c.1989 P7 4 731.e31 7 F at Jn , p*,7'a n . e.g+ A fi . Apot7. c. D.7
194n pret. 7Ep.s)4 79'As n. 71742 %446". 7 3 8 ef.. O. c. I
1993 9691 771.73.9 sper?. 3rt70. %cte8 791an. O. p. |'
t oe,/ gagr%. 7ta.13 t 14:47. 3(te:4 674%9 e4 h eep. O. c.|twoj ins 61. in1.145 is ers. agate. > 7 3.3 7 9en(1 a. p.
195*4 33113. 3/4.tP4 17'*4 3bJe7. f e i',l. 939"%. 6. p.
3905 g g f .a s . ela.st7 194Mr.. Un12. 7 38780. 9Rlho. 4 a.1986 177n9 3?4.n18 44%%. 39876* 77E79 182532. O. m.
3907 37s.47 % 7. a s. t 4 7,,o g . 43 4h. nnp7 3. jet.pJ). O. p.
194b 17973, 17*.74M 4 3 s t.P . 4 t' 7 6 J . MFt 85 Ir>94A. 0* 6
3499 gi?9m. 1H9.134 44 49, 4*r39. >%077. 1118t4 O.O '.Pene 11641. Yif.7p* 4 4 Ft;1. 4b r.4 4. *ftNF. Il39Jh. 6.' O
L Font 11737 4n4 787 45 Set. 45871 *81%6 333497. p. p.
2002 1797%. 19n.n39 4749%. 4 * *^9 . *54T4 110e91 O. 0*3 9.457 oppJ6. 44FP8. e53T|. 55439 6 O.6Poo3 37aF7.
*
J@=c=
b=c=
Esotr '
c_ -
1

W.e
N ue >e u
3ee =
5-
e 3
.in O=
e e 3FB
.E. wa
. . . e. e . . . . o. . e . . e e .. . o e. .. ..4SSSSSSSSSSSS
oS O S & S E O SS S SF SGSG99** 4
5 40 %C>E>O4ou$$
u> ,
u !m8E
E
.feen4Ris.
E Oc, ,> .e .o .e .o .e .e .e .e .o .e .o .e .e .o .e .o .e .o .e .e .e.e .o .e .e .e .e .e .o .eW
!, cs& 38
4 **.
O 62 M
e4e o e o e o e e o e o e e o ee e e oe eo e e8 s e e e e o 4 .e aeooea33eeaoSenaeceeoeo' D9 C9ea@
E >G NeX
;e6 4 8
>
Ve9 4 E 4-
ee a e e e e o e e o e e e e e e o e e o e e ee o e ee e o e eh *= ee C 3 esgeooesseseomeseaeoneemomemosb go .d B er
= *** &ad
A.o es >w> W en 8
A
.Ce .Go9 -
' 2 e- g e e e e e e e o e e ee eo e e e e e e eo ee oe e o e eI > ar e= e s e e o c o e a e e s e e r s e e se r e s e o c c o a s s o -
c .g dg=S .x.I
<sea. reeo g>
> _
C >J W
& J 9 86mE 9tt SEeC8 EE EECDDE CE EU D D U na U Dg *P> eec&OCSCE etCE O C O O O e e C OG eC GS SOeG
(. s1 GCCE&CC &GeCG CC CCC CSCCG SC cC CCCEg e,. -t 6 e e o e e e o e e e e e e o e e e e o e ee e o eo e e e ee > aceaeeeeasasemceseccecocet cece
_=,.V .C
e .
.ec n. .' .s ,o e. .e .e - . ,e e. - , . .e .e , . , . . .e e.c
. . e ...
<> -
. ....- .. .. ,
, .> e a-
>- - s.
>,
p -- .64
. _ ~ , . . , , . >, , ,,mu,.,.,,_,,,_s....,-,,e,...,.,,,,,,.o_~.e.. . .,<-.. ,,, .,
, ,. , ,. ..--->--,, , :. ...___e_._._._____________ ~~~~>
m A-25 D"*0 *D 'T J
oJ.AAwe a
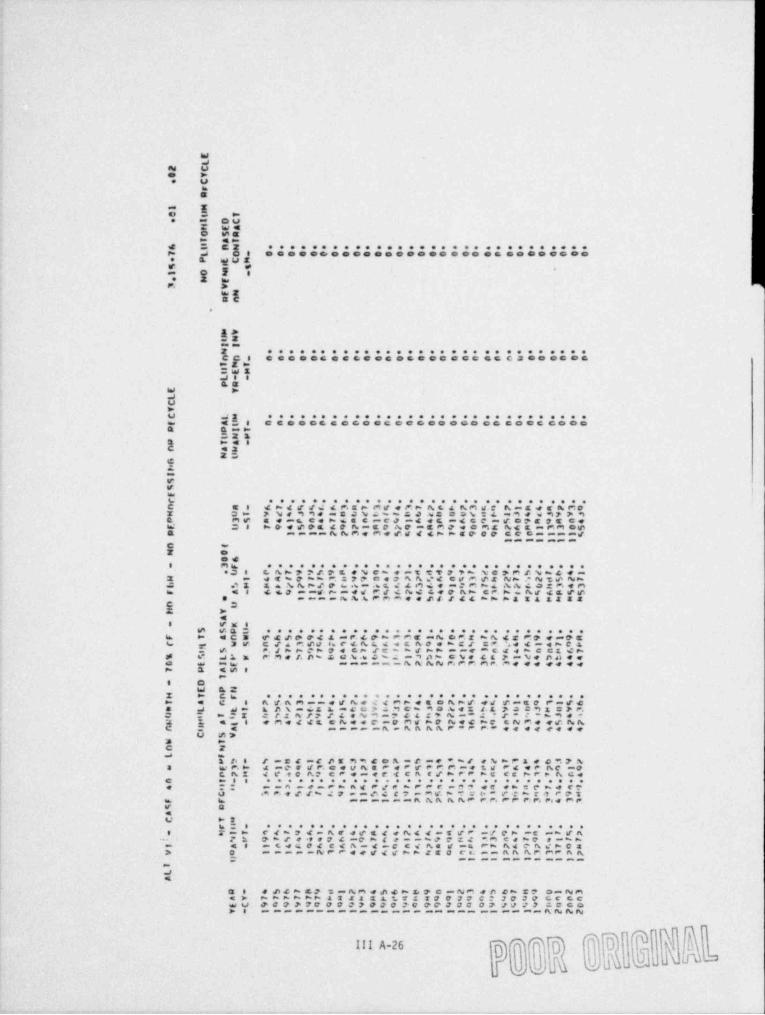
Wd
N Ue >e U
mB
E-c e
OU>
e aZ Weo maw tw
d 3 CZ e o e o ee e e ee e e e e e se e s e s e e e e e see e> J O 9 eemeeoomemooooooooooesooooooooe & WUZy ~ *m O I 8
,
e k 69. >
wtRC
e
1 *z-
um2 e e e e ee e e e e e e e e e e e e e e e e e e o e e e e eCC 8 esemosesteososeconocescamences>2>=WKJe s&M
W >dU>U J3 e o e o se e e s e e e o e e o e e ee os e e e o e e e .* 43 8 cementeocooceenococcescoaccocoQ Sm>
O2 12 >4 sC 43
2LT.=9V
I,*b o e o e ee o e e e e a e e o e e e o e o e e o e e e o e eC e e < > d r e s 4 M a > M t e r.> A t a A M a r A = E w r A MpZ 3> > Ne994 m 3 J N & * * & J .wa # 3 % 24 =9+ wMPDMR me a W at C4 kseEmC@ =4 *E =4GFm(OPE SE CeW 3 $ >@ W@@E 4@ N=EFAPmEM79 4ME ACE - M M oW& mammhhMgMd(d46>>EPOP ECG==mm#
mmmmmmm_
E Ded
e Mk e e o e es e o e e o e e o e e e e ee es e o e e e o e **J e C A > P S #. P E eNeh +=t TTP?h N e m m t. N h 4 e m
3 m w(h ehh e. 3P?ce2AA*d SWF #4 N > .a N % # Nh4 ei 1 & e .N A m # p s.w m.st d 4 M 6 e m 7 M h4 A A s @ Z F. e mb d a 66@ = =d+ m a d d Ptwhh 44@ Ak C F. k=At CE#@
g a m m = N A .k F m m e e # 4 #44hkhaE& E5 EEC 33 >
49 VE 4
@ y. g : o e e e ee e e e o s e e o e e e o e e e e e s e e e o e ok > 4C3 c4# ped 4mF4PhemE =NOF.2hAtrFSemps% y
. V. 3V G /s R ed es t L A s i e G N O e h EJ EP 2a 4 4=4NC6
e. J h > Omp4 Cn#Em A d>>=me=E44h C CE w' MW M di k F M e f. P h & U N.w G h 4 m G%e 4E PmNf D et @ em m = m m = A A' ai kA N Fo r k. M e, m 4 94 4444a w mw> & (M $
ee O
w L22 * ch e o e e e s e * * e e * * e e * * e e e = e o e e e e e e e> e C 0 MWAM-me#Ae<4MM*E o Am # ed @mEP Fm#@S g am & A%=s& LmSG 7 e9Ch 90 44E d. E* #~ : *h 9 4 *
P2 291 377C
.1 em e eMeddt e A e e c =O M d >F N*C=C E N M e e( AAm: E E F2 N #7 /& 4%Mm?KL 2% %=*4
yL 2 4 me===Ae AA AAF"F F* ee4W eg de
U @>' 3 >| c z
w h& h 9 / *SE-8#E MM C o A m f mf 'h/ f%bP1 d O97.\
S wM> a w e r d r. e * V A E F 49 fFP P=* La 94 49 AC =OL AZ ( 4* f 0 A? C F +mer( CA f/hPF >C Cs NFP AGg
C = 0 4 * * e * oo * * * e * * e e * * e e * e o e * e * e e * * *q 73 = =M e d-Ph h( Pgp h FF F =# 9 (E e>S Ph4 f?
4J S Ps f#gh 47ma@4 C7=RW>" EFFfFAr e e M Ps e" P TD* Tt 8
h k ======AAAAAP erF GeV FI
k* 6 e e o e se e e e e o e e e e e e o e e o e e o e e e e e oe Z~> cd6 7 t=At afste%44=E #F =f CM =t wh fA
-- e* h @h tefe? 4=eng #==h& FE4 *M Coh@ teh>C46 04 Ctha d=# Ed As s et FW Ad PAv>OS= 4 8 -
====NPP4ftsg>>gEO roam AAAmeenA> 0 =; = = = = = = = = = = = =
>d4
G $ d A4h EP t=AMdA4h &PC=NM 4 M eh EP OmNMe> >>hh m> A t 2 3 2ALTarp p 77 c? JF30 cetCwU O07330 O037OOO 70 @@ 330 07 JJ J3 ACGo7 0 n===m=======am====mm mme===ANAN
(
- - -

ALTdl-CatF e n . L W As*8'W T H - 7 0lt CF . leo Ft,pa - NO #F P6'tirf 55IkG on nECVCLE 31976 .81 .82CleMIL4TED PF50t it feel PLtifeneIUM #* CYCLEMrrest FUrg !.inaget gesp l>EIRUCF%%3NG IN -MT- nF I4Eavv seETAL RV OU llTEl TE345A
F 088 Linui WA TFP PF ACIO835,,a nt)l v i p.s9 to a: Inst AGF H8.Sth5 FUEL NgppnCFSSING 970Raef. RASIN RE988INEMEN75-rY= til (Pl f .I n t4l til IPD (J) 841 til (2) #38 (48
l974 777 n. it. 174 c. c. p. a. 777 727. Sgt. 924147% to. tag. *F. Je,I . a. n. a. p. 978 IIAF. 1215. ISIS.loya te a. ppg. lis. 734* 8. 4. O. 9 1714 1947 2135 23391977 797 7al. 3 '+ . 148 p. p. 9. e. 7A16 2917. 324A. 34J3.1974 1AR. 774, 43,1 Jel. 8. n. D. 9. JF48. 4015. 4448 4749l#F4 ?ne. Pae. 4 et . 67. p. p. O. e. 40%4 5737 5643. tile.leane pi n . 147 477 bl4. a. p. c. e. 417s. A567. F 44. 1559e0148) 3%. 247 E'8 7 479 p. n. a. p. Fe 95 A347. 8739 92371u97 477 717 S'* b . h44 o. p. a. g. 9694. 9937 18527 1814 F.1043 47w. 949 4'81. h l1. p. n. a. e. 18546 17195. 12*nA. IJ499_
- t utt e sa5. %*7s 7 3 ti. F79. p. n. D. S. 14aa4 14A16. 15366. lee 86.~lun% 974 EA7 964 ith. c. n. e. e. Ifels. 175FA. 18$47. 1926ss.Y l * *t h Ilia. **7 S'* I . 1147 e. n. p. p. 2eene. Ple73. 37e34. 2 81 J0y los ? lin%. .e 4 % . Ile S. Ita7. o. c. a. c. 24124. 2%175. ,629a. 27377.s
1484 l l *'. P. 1794. 17' 18'75. O. n. O. C. 2'*5A9 29743. 19049. 3t2iJ.14 ec'4leF9 33%7. I m8 4 1974 p. c. a. 4 1J675 347n9. 14254. 38488.
199n loin. 1996 17h0. 1851 % * 0. a. P. S. J'897S. ~Antal. 48941 4J$$61**91 1496. Ipan. In%J. 1715. O. 8. 8. ** 45&A2e 46312 4414%. 499e0.1492 IA=3. 14?P. Pn46. l # 7 88 4. a. D. 8 S I S %.3. 57942 549ep. 56sev.1493 Inn 6. 1%37. 7744. 197H. a. p. e. e. S8415. 6a337 A2334 64333.( 3 le94 IqeS. 1471. 673 0. 7178 o. n. O. p. 667%m. M933 ve243 It4 0''.gu95 p on, 1,e ps , p 4 'ea. ;Pr%. e, c. p. o. F4%nn. 76337. 7N87n. 88e95.
I 1996 774H. l#796 7488 E * 7fs. 6. n. O. 8 883343. n53pt. e7959, 9e3841497 3al. 9 77Af. 75%6 a. n. a. e. 927A7 94a eF6 190218.F,sii. 781 ,.
i.,,,.. i,4.st. i.7.54. iietu.;aes) . 94 ,,2 ,e,,. 7 ,.3. .. n. .. e. . ... 34.
1499 pap 4 7144 79FF. PfA4 e. a. a. e. IlJ!*7. 115469 14444. 1282114400 277I. 2 4 *. S . 3nF3. 1859 e. n. p. e. 82.9913. 824344 179457 134316h 3 2a03 78 n ti . 24446 % 111 5 ?W 9 O. O. O. 6 135374 13fAAA. 140873. 14JF62.Ano? 7887 7^79 1776 3937. n. c. p. 6 34h649 149274. 1925es. 152582.pn43 p. c. 9. O. O. e. D. 9 IS5S12. 155512 145$17 15b582.
E C$,
JE33b

_ _ _ _ _ _ _ _ _
lALT VI - rase en . Low nsiem7H - 7 0% s't - Ho p s;p - NO Rf P64Pf ES$1NG 054 RECVCLE 3.15 7A .01 .02
NO PLUfoNIUM prC7CLE
7FAQ 84NH8L 6'ow E s> .iml? lots % ley REACInn 7tPE, 71t.07plCAL PEGAWATIS bENERAllO*4MILLIONS
-rf- H 7 r rt Pwn m. 'i 01Hu HAT FHp intl RF ili CIWD CT 4WH
lure n. 7194 4594. m%e. c. p. 17A14 p. 79993 190790.1 M43. 2n%9466347% n. 14n1 ih*7. n. p. e. 70%c. 200.
1976 n. 5474 1977 9 ce n. 7447. 6. 44290. 25P4431477 c. 7n/s. n. n. 06 c. 7070. O. 51310. 2953|I.1974 n. Alld. C. P. n. n. Alle. 4. 574/M, 33g573,
1979 n. 11at. 1974 U. n. n.' 5217. R50. 61 Min. 3A6809I '< 9 6 n; 56e%. 7777. n. n. 6. Ala?. O. 70192. 413979t?dI p. A 113 . 6447. c. O. De 17F78 200. n2 Fin. 476791.1997 n. 31497 %I47. c. n. p. lAA14. 175. 99479 563ARJ.
II SA3. 666n79F1*R3 e. 11441 * ** 1% . U. n. 150. lH114. O._
twM4 p; inF2p. M9 7. o. ci n. 1747%. 139 134049 784171.~
1045 n. 1467n. 6171 O. n. n. 2nfat. O. 1%5940. 9034BT.~
p gana p. 14%99 9377. O. n. a. 71871 O. 179661. In4Anh5y luR7 n. I175%. 7bla. n. n. O. 21573. 6. 2ntF34 Ilm3551.
lupe n. 144A%. 6%"2 n. n. c. 24967. p. 272701 13nin40.ta*4 n. 1774s. 6716. c. p. p. 714 % A . O. 245697'. 144nm661990 n. l a'a l v . p g, l e . c. c. n. 27911. Sn. 269540. 157RITT.1991 n. 17 4*e 7 7516. n. as 0 Pse13 9 2935%^J. 1719663.
J 99pl. IPA 77621892 n. 17564 H7"4 U. D. n. 2^34P. n. i3993 c. 17500 47%6. p. 66 6 7APA4+ 0 346165. 201M9323444 p. 177ad. MH%7 fe . n. 8. 2656n. n. 372F75 2170994
9.h. O, n; 0 277a0 n. 399925 23744RI.1094 c. 1 s.1 l p . t
lu96 p; Im412 m2 a. n. n. n. 74 hen. n. 474573. 2467422le97 c. 14717 73%M. p. p. n. 27|an. n. 446673. 4594310.1999 n. 14364. f r.* 4 * t. n. n. 2124m. 6. 4679/1. 27a9991.
m ao. n. n. n. 2nede. C. 484373. FA160no.s1499 n. 116nn.2nin n. 17468 6717 se . 4 n. IR7a0 c. Sofo216 2910197
T 2001 0. 119D0. S ''' H . D. ne n. 17d4R. 6. S74969 2993130.(' 9 2002 n. In?64. 5344* n. n. n. IA34n. C. belelf. J063A30.
{ g pn03 c. 9637. 4816 G. O. n. 14448 O. 355465 JllT6l5.
22JG 0
E5'e)
YmESEE)b
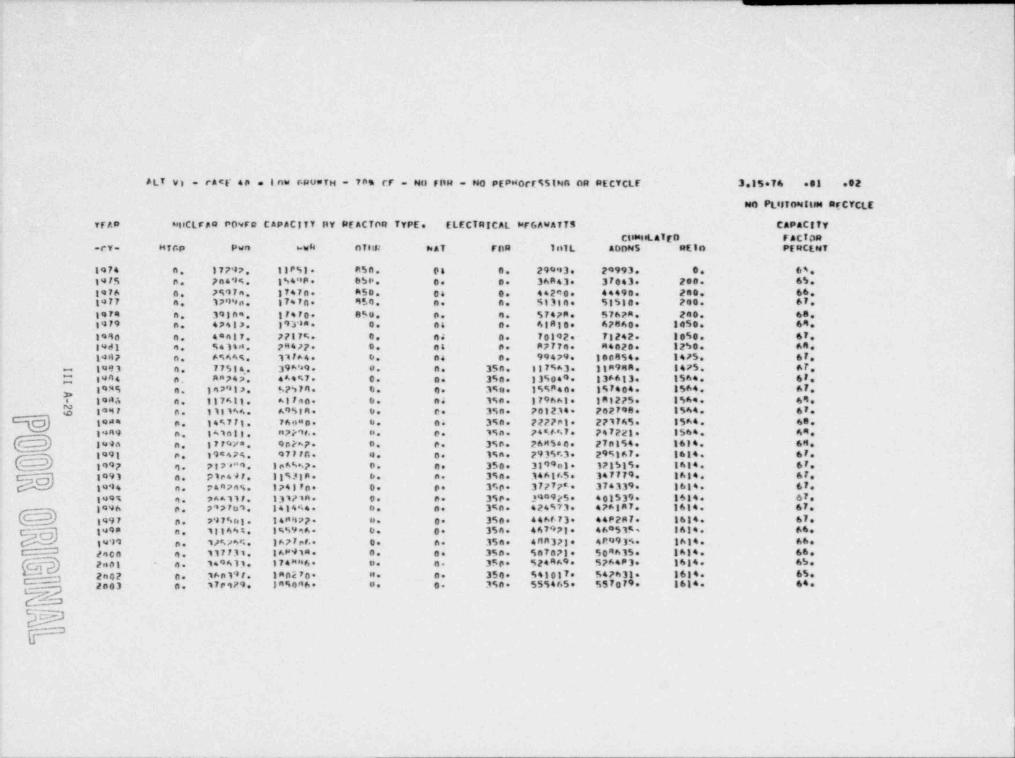
. . . - .-
ALT v) = rAct' op 1.nw r. pow?H = 789 rr = No fl1H = NO PEPdort%5ING OR RECYCLF 3.15 76 .el .92.
NO PLettogtlen prCYCLE
7FAp plectrAo Povro CAPACITT ftY REACTOR 7YPE. ELECTRICAL pr6AWA7TS CAPACITYCl#*teLAf tp FACION
-cV- Hf6p Pw9 * w84 n7 tis: NAT Ff1R lillL ADONS etic PtattwY
1974 n. 17797 IIPSI. A5n. On O. 29093. 29993. S. 64141% p. .7p49%. 3%44P. BSP. 6 e. 36843 3Fe43. 2es. 65.1976 c. 799Fa. 17470. h50 06 e. 44290. 44490. 240, 661977 4 1799n. 17470 950 n. a. %I314 51533. 240. 671974 n. 39tne. 174F0 859 p. 4 5747R. 5767A. 240, 681979 n. 47417 1931a. O. 06 c. 61810 47860. 305s. 69l*98 n. 4*alf. 7787%. s. 44 c. 70192 71242, less. 6714dl n. %41td. 7M477 c. en p. 87774 neeze. 125s. 641937 n. 696A%. 11FA4. D. e4 e. 99479 180454. 1475. 671493 n. 77584 395'.9. e. n. 35n. 137%A3. Ilm94R. 1475 AT.-.
Z 1444 n. **746 464%7. O. e. 3%e. 135049 136613. 1544 681995 e. 197917 *s?'s F A . D. O. 3%u. 1%%840. 197404. 1564 67p19d4 n. 197611. Aline. b. e4 1%n. 179668 lAl275. 1564 69e
3 iagt .. iii m . 69%ia. .. c. 3%n. i564 677,0:234 7,.2r9e.cg ,,,,i. , ,,65 iSA4 6e.io.. .. 14%7,1 ,6.... .. .. 39..
lAint n 7 p ot, . n. e. 1%n. 748.6%7. 747221 3564 691999 n.1,, /.l.g=g 9.-,. .. ,. 3%,. ,6 54.. ,7.ls4. i434 6..i 9a n. .
1991 c. 19847%. 977FA. 4. 6 1%n. 29 3 %'.3 * 29%367. 1614. 6F.1997 9 787."9 lea %A7 c. c. 350. 3199nt. 17851%. 1614 6F.1991 n. Ple497 11%319. b. n. 394. 14 61 f.5. 34F779 1614 6F.3494 n. 74n74s. 1745Fe. O. p. 3rp. 37777". 374319. 1614 67
c. p. 3%e. 390925 401539. 1634. 671397'"1994 e. PAA117.341444 D. a. 3%n. 424973 47 AIR 7 1634. 671996 p. 71proi.
1997 n. 797%hl. 148977 es. O. 3%e. 446f 73 44P287. 1614. 67,
tw9n n. 181694 1%%996 D. 6 354. 467471* 46*51%. 1614 66_ tw91 p. 1/% 76 r. . I A7 F et.. s. A. 354 408373 4P9934. 1614. 66.
W 440n 4. 117F31 IA#918 8. e. 350. %87073 504h15. 1614 66Pa01 - e. 1 9611. 374aa6 p. n. 350 924859* %76483 1614. 65.gQ2n42 c. 3An197. Imp 270 88 a. 350 941017. 547431 1614. 65.zoe3 p. 17e979 IRMcM6 o. c. 3%n. 555465 557eF9 1614 64
3330=="
_ - . __ __

_ _ _ _ _ . _ _ _ _ _ _ _ _ _ _ _ _ _ _ _ _ _ _ _ _ _ _ _ _ _ _ _ __.______ _
c e ee e o e e e e o e e o e o e e e e e e e e e e e oe e e> e er on e em oc ee oo oos ee o ee e e m e m oe e3UL ies
E *
O> e ce c e e o e me r e to e en o r e to e e o en o e o an e en #23 O ee O O O N e e N p M $ F me e 4 e ** * t0 fP ** e e p *e e d Pano O e e e e * * * e o e * * * * * e e e * * e e e e e e * * * e
e e= o eC e C == N M e @ .n o e 4 am > > pm C 3 e e e e e EP e e e eled R2 0 8 0 08 0 0 4 4 8 0 0 5 8 8 8 6 4 0 0 8 == a's ** **.A e and 8 0 8 8N U WD
D > >2e U me
h&
** 2o D O
o a o o c o c o a o v e r e p o p o c.= o e o r o p o c o c oe me e inn2 e= O 00 e C & f% e e #4 e M 4 e .= e d IP e t ||P se e d e se e d pC e 4 e e* * * e o e e e e e o e e o e e e e e e o e o e e e e ee- .4 e g e o g so gig #m e en op g g g pe yo p p g g g g p p gp p e e e e
O.J@ e 3 en se e seP- Xe ik e Daf Uee C e* 2
m eJ J e Ce C C C C C en es eo e o C N 8% o g e.,o e g c t v. ar.c # c c w en in en en en in c4 4 e f4 a4 sg .s f4 f4 #g #4 eg f4 N f4 N fu N 8% fuo>"* * * * * * * e o e oe e e e e e e e e e e e e e e o e o eO5 o CC o c. e. e.e2>2
4C
eZ ==C> >We o oc e m C e a c e co o y, in p g t. in in en e er. in e e e en an e
m te. C C e e C e #% f4 G C p= e e f4 f% f4 f% f4 f4 f% f%f%#4#41%8%f48%f4f4U 4 e e e o e e o e e o e e o e e o e e o e o e e e e e o e * **== >= O et e e se == =. es2 NO>
W W De.J EU .J> eb 2 e= 2 C CC CCC CC CC ccCCOCCCOC CCCCCoeOOC6 C w .J & OG C C C O C, CC OC COCeC ecoemGocoeaceC no 0= C 6 e e e ee e e e o e o e e o e o e o e o e e o e e e e e o e
> taJ O G G4 C C G C C ec OC C C G C C O G & Ca e o O O Ca S O O OE 4 3 ene en.C he C
me ogC
.J.: e ee- >4R 2 e LJ C 1e# 4 S e C O O e *e C O C e e C O e C C c e C C C C ee .J G 7 9- ? CC GC OS &CCCCCCC OCCC OOCCCein.s C e2 u e o e * * e * * * * * e e * e * * * * e o e e e * * * * e eL 2 3 > C eC ed i& CC ut &CCCCCCC CCccCeCcCCC 4
e .a U.2 a4 > e aled E& b o
:DC CZ
UJn e Ot a ene o OC eC e c e eo oc o C o e e o C e eo C e e o e o e o
e > G onG4OCC == CG TC394 COO C o.e.o C O C O C Oe ; e o e e o e e e o e e o e o e e e e o e e e e e o e e e eA = e .J C O C, ococoaooeCocooocoocoaaccoco
3b *=
. E * di ; e U
33 J e
a .4 .; C ec C C C C e CC CC CCCCCCCC CCCCCCCCeCta, e4 4 & 4.a O C C. C G C. C.o C O GCCCCCS@ o O O C C O C ef.Oy y e e o e e e e e o e e e e o e e e e e e e e o e e e
a eO r C OC CCCOC t. C CC CeCoCeeC eoCoCCeC aCai e- > ZC en 4Pm V. > *
me9 6 2
Cea,2 a C OC CCCCC CC OC Cccet CCeeC CeceCceo
> eb C CC CC C CC CC Ce C 5CCC Ce& CC CCC CCCCC3 y I, e eo e e o e e e o e o e o e o e e o e o e e e e o e e e eC > e= 5 C3 CC& =C CC C2 TCfCOCc? 3 C, 2 1* e C FOCS& C4CG 2
U3C te,a G
'A 6 O CeCCC C C CC C= C eetC e=cCeCcC2CCCC$ C O CC CLCCC CC CC &CCCCCC C CCGCOGCeCC
g e o e e e e o e e e o e e o e o e o e e e o e a e e o e e eC e k C &C eCC CC CC CC CCCCCCCC C& CCC&C CCCe tS
e 26W eerb *
C CeCC eCeeC ce eeeCeeCeeeC e C C"C C e C3 e & C CC CCC CC EC CC CC C =C C C 4CeeC eCC CCC
3 e a e e o e e o e o e e o e o e e o e e e e e e o e e o e e== e .,. C CC CC &CC CC cc&CCCCCCC C& CCCCCeCC>
e>.J edim
T 9 efC P= 8 t' e == N m e it d" r= c (* C N e e # d *= C OC == #4 m4> ***********=iC CE Et f* CCT C ? ? ? ** O .*" @ fP 'P(e o @ Oo
m. C 7. [email protected]=e= e-FC@
7. -@ 9. .Le. [email protected]. .*. 2. .e. .S. m. O. 3. 7. 2. 3 C .C. =O Ce. - = 4 eif pis NC CC
s g = = -
ia
- vy e Au h A L,
____ _ ____ _ _ _ _ _ _ - _ _ _ _ _ _ _ _ _ _ _ _ _ _ _ _ _ _ -__

e ee e e e e e e ee eee e e ee e. .eO e e e.e.o.e.e.e.e e$$$@@@@@@@@@@@@@@@4O306 ted
J *EO4 **e *= EO qpe.# I
.e .e .e .e .e .e .e .e .e .e .e .e .e .e .o .e .o .e .e .e .e.o .e.e.e.e .e .e.o .eww g ,> e g,
N U en g ID t=. > @ tois= Se U tit & 3 ene
As en b9- a Eg.-
. I !*w ...e .e .e .e .e .e. e.
..wr3 E OE ge . -
C >@@e- .4 e= *
.".J U Z. m -g- t== am%
* A ' em 2al" e=== C to en
M ine *C .e .e .o .e.e .e ea s c o e .e o .e .ec s .e.oo .e.o.e. . c .e.e.ee 2 2 a t= w o e e e o e * * ec c
Gm 25er e- C
|e lea2M3 **JF
e e o e e e e e e e e o e e e e o e o e o ee e==c .o e .e .e .e .o@ @ m f'I(b|%eIhr N %0% sib 0%fb I%f$% fib b Ib b I%d N N Nb O
* 3EC2
tad 46 4.J e .JU S>U *and
e e e e e o e e oe o e e e e e e o e e o e o e o e e eQ Mc .ea c c .oc e e fr. mm e m m m M M M M m m e m fr. Fe d%s f%f 4%s he C
2 EC =C
e ns.R
J *====.a
C e.er at >F G ned
* * * * * e e o e e o e o e o e e e o e e o e o e e o eg .J 3 to.* c c c C c c w c O C c .e .oc&cccCcCcccccccOc.b* .=
G Z D 3 *=2 D > J *=& == 4 == RInt > w Z es.& 4 1 lan
UO == bA 2C
c .oO c .e .e.e .ec c, c .o .e.ec .oc c c c .e.oc .o.e.ec .e.o.ee e e e o e e e e e o e ez WB as ett .J
as. 2 2 *=*Z C (* VZ .J e= > trhas een 3 =*
2. =Ua =im
O2 E-
Z e.=.; * * e e e o e e e e e .. ee * * e* * * * * ee ec c c c c c. c c c c c c c c e c G c . c c c . .es @ e w e e e
cco== 3 C cedE % 2b 6 23 C
e= J anJ
.#eh
e ==> K
e oe e e e e e e e e o e o e e e e o e e e e o e e e o e e e e
s f\ e* 4 h' C 4 8=I @ C* * F Ik # m= 4 c A e c $ 4 F k > 4 4 f4 lb @f es c *= c e 4 0 e f*' O'= V c == & c 4 f"!> e O fb c a= 8' ef* k e I h - f' C d(
9 3 D c .> *> an > n == L *t b G K P % bS% e 9 e % D D f.7 % 9 dr % EC .43 == == ** == N .% + 4 b # /* C * == K 3 P = = == N s% N "" *= "= ** N1 e se a= me == en == == es a= se =
G
1 *C.J
c .C. 1.4
e e . . . . e e . . . . . e . . e e e . . e e . . e e e e ec 4. F .a a aecccscccccseeceee,acccceeceecc-e to e 6 *=
Q '> Z46 9C4t# C USe > 3 nn; L4. , se & -
.O. eC e e e e e e e e e e e e o e o e e e e e e e e e e e o e e .== g a.1- er an 2 4==> s = t . .= .= N #* if er > er - 4 4 > e= es er e e e m e F c #4 a==
> a h 3 ** * Ei e 0 e e is d > & it a s #* c sk A F * ar == d * * ==(* 4 aeaF 4 ** o' 1 *= k C g af d c c R W % d fg gh C'4 4 *= 4 4 ed C ** #% C *= t., 4 s e > m # '.* 4
en e Z c e J. e.mT + f*g .7 == 4 == r %** in = = * F* (, J ==f*
J 7>42 *= == a= *= ** fns ib N m 8Pt M f 4 eli e#* # 4 (' ** *= P* c 1 4 Ec4e C 14 O
u2em
3 9 4 tf* =D em a e e == #% fr 4 ( t > e p . == N m e ett 4 em T & c == #4 me> >a-> > *- >= gr 84 c % c s, s 7 at T ? (* tI* t* T 7 9 ? ? ? O e e c
== .7. @.9. .F .G. .O 7. 2. a= e..g 3 3..e .p p & 2 0s == == .2. 0. 3 7 39 ecec'aU 2, 8= .. = == == N rw N av>0 . ..
III A-31 1 p RI
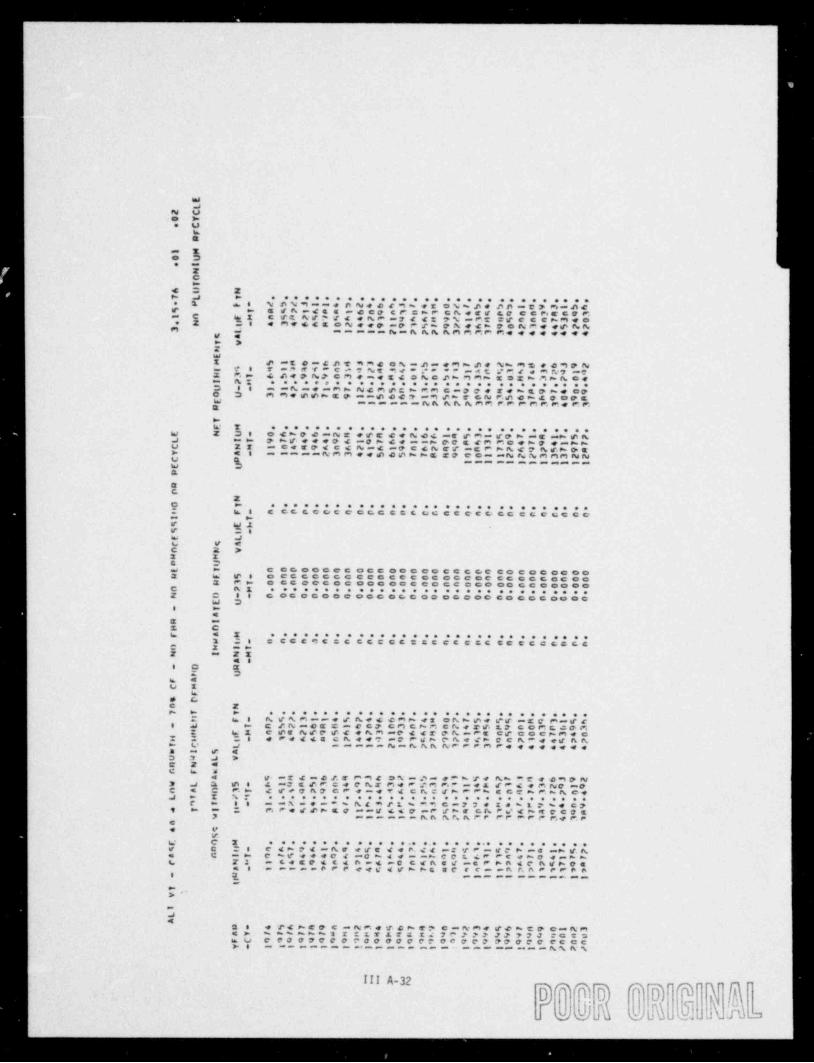
_ _ _ _ _ _ _ _ _ _ _ _
MJ
N Uo >e U
k&
= 1o 3e m
ECw
d 3 2> a * * e e o e s e e o e o e o e eo e e e se e s e e o ee e e* 1 * 6 N
A N 9 m m e. D N d e t 9 % erON%Ad A A = T P,*M m A tr > 5 thett weceCF CMP ch4ff && Cc E c F F.m C QK c 93 Af?t4 eAP m74 42 7%*FC EtccckMeo* 2 -t 4 Me6CE ONefe=PF#m PAeth poNMee@NNM. =. = = m m = N m A A A A M M P. P M e e e e e g e e
> >2wI # et e=&AT 9mcCA-Amem>AeNh
m t. m tv 9ee9PN= f I r **efe ce t NT 9e*?* ** -4 C VF # meZ F. m 4 Ae@N7cMemegdONeph mMm ESzh M* Ace
AZ e e o e e e e o e e . e e e e o e e e s s e e e e se s e=
3 0 g a mAmemmh Ne m e = > m m c mp p e r e h t o me opO 3 M Me m mh t e m=c e d ? m9 ch rcNF.eemdeorsw m a m m m m N h A A h m M F P P M M P 4 E F.R>k' Y e e o e e e e o e o e o e e se e e e s e ee e e o e e e .W Z 3 9 o t h e e = N r e c r e e A e 4 m e r m - r e h m e => m AJ => > MVeeepd =p > 4 e = => p o s t m e c e k e e m > >u Z I = c e r e d c d N e d me c 4 N e t -E P N A c ? A t h a t> 4 0 mam=A*mMe+@ech>EE@ Co==NNNMMMNNm
y Q ============w 3&
RC
3o = . . . e o e e e e e e e . . . . . e e e . e n e e e ee e .* k 8 c c c c c e c e n c c c c c o u c e c c ce cccccuccc= >r (2e ew JG V ec 3 >2 XG 3
e oc oc o e c oc c oc c oc e c c cc co c o c oc cow =a w ra o eccocccceccocococcoeecoccoccoa M> cecoccococcoocecccccococconocoC h 1 e s e e e * * * * * * * e e * * * * * e s s e e o e s e o e2 O I e e oc o c o c c o c o o G o o o o o o oo co n o c oo o cW 30 *
4E =5 Cg = g e e e e e e o e e o . . * * e s e e e e e es e e o ee o e
2 : s s ecc=cascccccesscccsceccccccccO 2 =>E = Z E
4 80 9 E
3h *O 1
h8 Lc Zp k > e o e e o e e e o e o e a e e . e e e o e s e e o e se o e
I g 3 At%M--e#Aesemp er OAhmeer-Ecm=#c9 J > C #NmeEE=@ c7 G M C h F. CN*FOLP ccMce@M= 6 1 cesN#P. ( C e A m me d i r P A m FE C#cockmeeT O s eF4 44 cAe47 =FPuh PA*m m m e = N = A A h A F F ,f > p c A = w ed AA> (* s m F4 ( degeega = # 43 M J >E 2 4C 6 4
e r - r 4 - e p.e e m s S N m # m ,e * A ff Am *TeempN3 J 3 @ t 4 m3 E # F. cd eAK MWF #M e* me& #F 4 e m h@ a@C * C m> d f*@ A7 CF e=*Td CACd*F F"
E c C "o F "e A cea > I N, r, _e m s. _< a _. ee e e e e e e e e e s e c _o ,e ,e .a .e .s ,e
e e e o ee _ *-
u - n_ ._ - F~, -
A - 7 ,A ~ < ~ e . c ,= M F -.., -, ma <-- c c..m-
-- A. Fr-Femer,
c. -V
c., .m. e ,e e . . e . . . . .. ..e e .
_ = _e e e . .. . . e
<---c--..e
, <~ * . e .A ,- - _. < . < . -=
o_.,.e_.<<,--.e.<,.,__e-.,.-~~--<A. -, . . _ - . . . .- F
z. e,, ,
.. _ . . _ . _ . _ . , ,. .,, c<. .e.o m o - , - . .,Me . ., --------m_F.m-:->
-J4
. . . ,<-.. cmA-e..~ecm~me,c-c.omAm4 > % m% mh* 1 r: 17 1rg 14 7a ??? JJ 97J 2ct s
@@ @ F_ _ m _ C_ C_ O_ P. O_ @k_ U, _
@
_ m _ _ f_?_ O O_ F_ P_2 &_& @ C @mmm-Ascc@@ p ec
m m s
irr A-32D*1D D ~T*
b<
oJ J _ JJ .1 3
-__
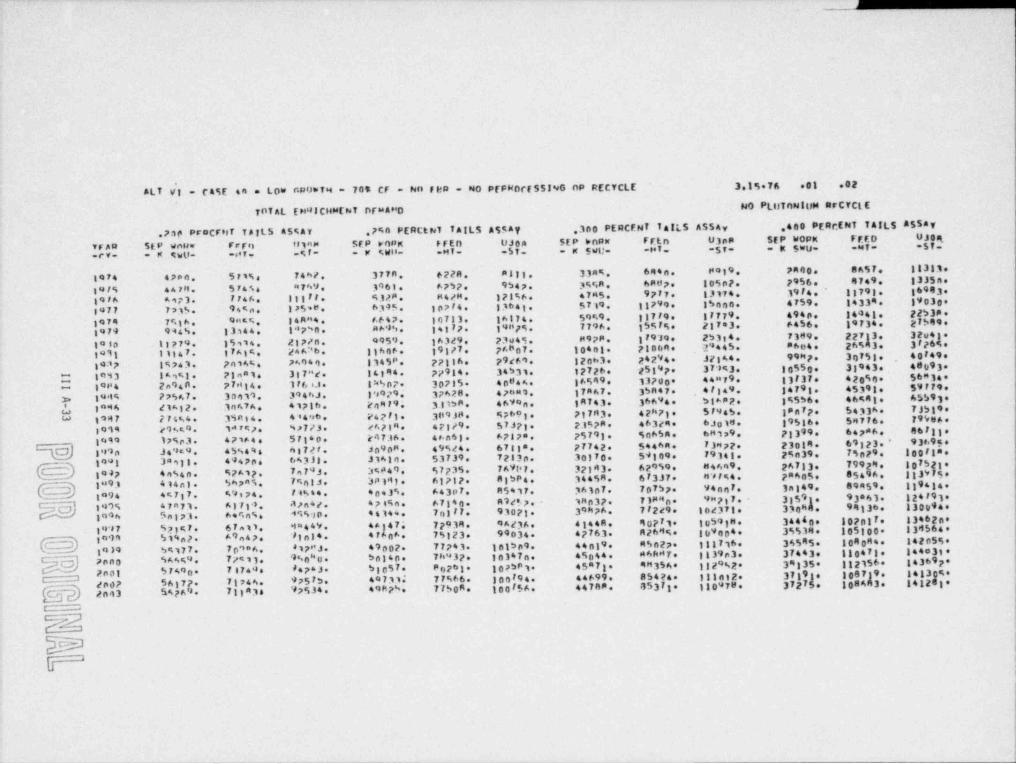
_ _ _ . - - _ _ _ _ _ _ _ _
ALT Eg . cast 4n . Low r.p0= Tt4 = 705 CF NO pep . NO Pf p6torf 55ING np RECYCLE 3.15 76 .81 .82
-
e40 PLilTONIUte krCYCttTOTAL EH'43CHMENT DFMA"D
.7.1P procrNT TAILS 45%A7 ,7%n PERCthT TAILS ASSAT 300 PERCFNI I4ILS A554v 4ee PERrEN7 TAILS Assay
.EP WORM ..FFOUJegS F
VFAR SEP wnHw Frren fliaM SFP 50pNF.F E O
UJ0s SEP knpr FEtn 03ppk 5wu. MT. 5T.
y % Wt i. MI. 51. . w Suu. .p1. .St..cv. . M twU. 97. .gf. .
1074 47po. 5Fi%s 74ht. 377A. 6228 allg. 33n%. 694n. N#19 7440. 8657 18313.
tuf% 44788 574%s a749 3961. 6747. 9547 3%%A. 6867 105pt. 2956. 4749 1335n.
1986 Asp 3. 7746 It3 Fi. 4328 H4/M. 171%6. 47M5. 9777 13174 3914. 13793 16993
1977 7 2%. 94En. 1 )S e ef . 6345. 3p774. 3364g. 5719 18799. 35nge. 4759. 14334 19030
1974 7%th. 9ma%. 14A"4 8447. 3c713. 16874. 59%9 187i9. 1I779 494e. 14441 22538.72 549.1 5F5. 217*3. 6456. 197345
39F9 9445. 13.144 197'* 0 . a b'8S . 343 77. 39"p%. 7796.
1980 13?79 15914 2t?7a. 0959 36329 23u41. M9?M. 17979e 253 4 7389. 22713, 37v432 445. 86e4. 26943. 3f?64.9
I age. 24 A 'b. 13646. 39377 pAB07. 1040l* PR0ne.F !geit 11147. I40 49.30 5177 t69 32nh3. 242 4 J7344 99hp.9 V34:'? 19743. pn14E. 7A041. 1345P. 77136, 48 9 *217 37'893. 10550 38943. 0359
O 1993 15m51 P l a.n 1. 3gyug. 14344. 77914. 34531. 17726.13 37. 42e50.. 56M347
1 84 2n946. 77dte. 3 F F, i.e . 14507 3p735 40844. 16549 13700 44"79.0
2 144% 77567. 33g11 344hJ. j '8979 37628. 4 pent. gyn67. 35n47 ,4f49 14798 45391 5VIF9e-3
d, pag 4 41432, an67A. 41716 24479 3 t38 46V9n. 1A743. 36694 51**2. 195S6. 46%41, 45$93
W 1997 PF4%4. 34ai4 4:496 P4?it. 309J8 9769g. pg7n3. 4th73 Sf445. lanFr. 54334 7Jbl9.g o'l4 29% 9 1dit7. %s7/3 #Afgn. 4pg/9 57Jpy, pg%pR. 46324, 6 J g UI . 39536, 5M776. 79986.
1499 37%c3 471A4. 57340 P4736. 4#n43 67478 75793 Sc65A. 6n339 pl399 647 6. 667118
l'896 J4 as4 45S44s 637?f. Jo908 49%de. 67138 PII42 5446n. I3nPF. 23014* 69323.* 93698.
p3 1021 3ng31. 49470s 66338 J14to. 53739 72130 30170 59109. 79341. 25n39 79pF9 200ft".
(- - ) 4047 en%4n. MPA17 7s74J. 3U49 57735. 7AVP7. 32343 6P959 H46n9 g67t). 79921 1075218
8 5P4. 34458. 6i3J7 H1794. 78405. 85496 133v753*89 1 414al. Sh78%. 7941J. 3819). 61717 1 9
e 43% 643p7 n5417. 36337, 7p?>p. venn7 3nl49 89959 11 414go94 estg7. %9,74 74%+4 n 93*63 124t93in 37 71M"n* 9"?t7. - 335AltS7 .
o 347% Ayny). 63734 A7n4f. 474%n. 67144 n
93071. ' 3 476 77229. 104371 3304 94136 130tp949 .
1o46 Sn373. 64%ns. 4%%9p. 44144 7el li.g wi7 %gg%F. 67a11 9844V. 45)47e 7?939. 9At36. 41448. 90? 1* 1951188 3444 10717. 1346 teeI 0
47 63 n269%. 199004 35534. 105100 1345647A n34 4FeA6 79123 99034go99 514np. A9.43, i0 4. 1420558
417"J. 4900F. 77743. 101589. 44019 R5n27 181716. 34545 10830 19 54177. 7p*6
a 7en0 SAA%4 7/*11. 940 c. balen. T h'* 3 7 10347n. 45044. 86hdf. I l 39e 3. 37443 180471 1448314
5 c57. 80261* 1075P1 4587 9M356 132*%2 39135 112356. 1436973 1
.- 2001 SF490* 7 4744 7476J. 8547 gl37,1 1967g9. img%.37 4 1413
56 717 9 49 77%66 geni 94. 44699. .,53,4 , l .i .n.g 2' g g' enop ss,3 7g. Ti 44., 9,7575. 49.7,31. 7150.. i00,56. . 6 3 i.47 .. 1 ..3 534 s. .,n,3 6 .
WZEED
'
b
_ _ _ _ _ _ _ _ _ _ _ _ ____ _ ____-- _
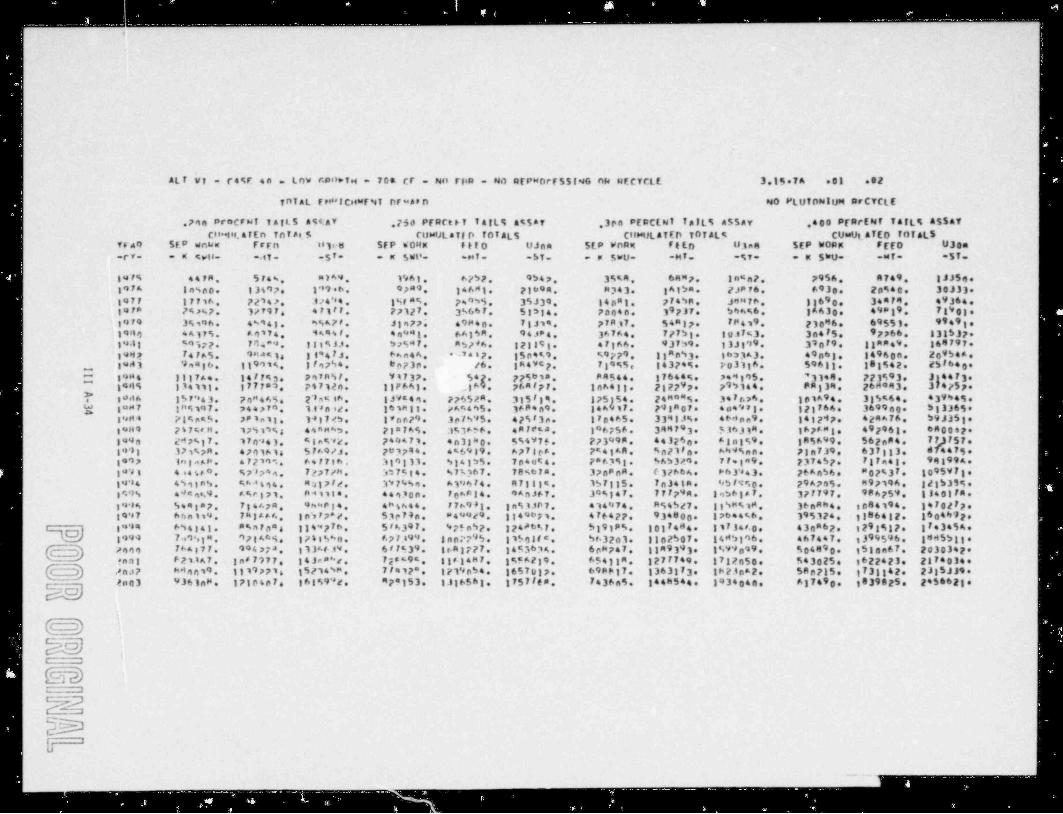
__
o
ALT VI - r44F en . Lnw rp0*TH 7CE CF - No risp - NO RFPW0rF55fgG ok NECYCLE 3.15 7A .01 .02-
fnfAL Fr*ICHuf91 Drwatn 40 PLUTONIUM AFCYCLE
.79n proCFNI TA{L$ A44.AY .?Se PFRrte T 14tL9 4%5Af ,3cn PERC[NI IstLS A5SAY 400 PrprENT TalLg A55af
Cimt u. 4 T E n in T A s. 5 ruuUtaffD TOTALS Cift91 LATED TOTAL % CUuUg_ATED TO7aL5Tran SEP wnks Frrn se3eu 5FP m'ORM Fif0 UJan SEP Wong FEED U3a4 SEP WOpN FEfD U30m
- K S Wl'- *HT= -5T- -r SwU- -M7. -%7- -N SkU- -uf- -5T.7-rY- - M twlf- ,17 - -5 *
, 147% 4478 5F4%. #769 1961. 6757. 9547 3%%4, 6447, InEn?. 7956 A749 IJ35ge| 197A In%no. 13497e 119.b. 9789 146dt. 21094 M343. gAthm. 2JPF6 6930. 20%40. 30J33
7 458 J8"76 18690, 34879 49364,107F 17716 7214). 4/4*84 1%f*%. 7995$. 35J39, 14a#1. F
lef* 7%s%7. 37797 471i7 77127 3%667 51534. Pocen. 3 737. 546%6 IA630, 49*19, 71903,9
3479 3%sq6. 4%943, h%A77 Jin77. 49M4n. 7tJ14 77837 54"l7 i"419 230 6. 6955). 994919
e 1940 4A175. A9974 9494f. 44**I. 6AISR. 94J84. 36764 77753 to9753. 3a475. 97766 13153714 ll 54577 784*.s. 33:533. Sp%gF. mg?dA. 121393 4F164 93739 13Ji99 390I9 IlmA49 368797.
,'tG4g T4FAS. 9H4( gg g g44Fj, 6hn44, ''I.57, g$p4%9, %9779, 3gA@hj. gD33A3. 4986). 14960n. 920 54A.30 542. 25f640gwA3 9,ag6, ggg9ts, 318754, #e73p. /6. gn4WCp. 7 9%5 14374%. 703136 59613 13,,
14H4 1117Ae. 141793. 797D%f. V4737. 542 775b38 P4544 37644%. 7e4395. '31*9 771%93. J 44F3-*1
194% 334111 177784 747124. IIP 66). ,369 764f77 InA433 2327 79 7 4144 pag 34 26He93. 3475p.9
l* tod6 157943. PnH a IJVE49. 776524 3 5.f39 175l5424"**S. 3*Fr.74 191694 315464 439945.
24.46s 2 '' n". th . .9. i2 766. 3699et. si3365: iaa7 la%1a7. pra, ii .e. 163aii. A=4 5. 3+n n9 i4A ir. 79:a07.39H4 Pl%ntS. painig. 341745 l'oc79 3p7%95. 475f3e. IFa465. 3391J%. 46 den 9 141717 42mA76 59J35 .1
gum 9 7%7%en. 17%34%g 44nM43, pgm}Ag. 353636. 4Aleta, 106756. 349793 136314 167An3 49 2 61 6800429
349s 247%37 170443. Sle%92. 749471 *n31NO. $%497s. 77349m. 4 4 326n. Atal%9 1A5649. 562np4. 7 7) F 5 7.1991 371%7R. 4701616 SFA9/J. 201744 456939 6778eA. 7541AA. %n?110 A%9%nn. 7|n739 637g33. 4744753497 togasp. aF249%. 64F7th, 7919133. %)4355. 704044. 7 8 f. 35 3 %A53do. 77*ta9 737457 Fifael. 99199A.3 4'd n 464470 %28744 7277/M. :075t4 %75367 78%67a. 370PnA. (37664. P 61443. 26AnS6e 807%37 199597114'84 4%1ga%. Ehd694 443774. 3974%e. A146F4. 471 tit. 3S7135. In34tn. 457990. 29^745. M97194 3215395.3G9% 4944%9 A%rg71. M4ttle. 449.106. 70^R14 943J67. 3*%)47 IIIp44* jab 6347 377797 986P59 tjeOlFA.
34*#4 544 gap, 734A7m. On=eg4 4hgA44 F76943. yngijpy, a14474 Ag4Sg7. g g %M%ip. 36a hee t084194 14T02F7n61046931997 ennii4 Th3AA6 3p477^#. 53efia. 84u4/9 3149671 4764P7. 934800 370ets6 395,174 3186412.i5 918%. 10l 4I84 11734AO. 43a 67. g29 gl7.74 114"7 h. 5'A397 47"oSP. 124#6"F. l e3454.nl*99 654141 8%8708 31
1999 7e953M. 978464. 17415h0. A?7399 Ino77 $. 11501(*. 563201. 1107$07. 14d5396 467447. g399596 18455139
/gon TAAg7T. 19427d. 313Aftv. 6ff*39 ItR3777 3453634 6ch?47 31A939). 1%99a99 %04890 1530n67 2030342{ }Fa n t P211A7 In87977 14 Je ahe. F;8595 stat 4M7 3%?A239 65431A. 127T749 1712450. 543025. g622473. 2874034
y y Ans? Mdec19 1119??16 15214%". 7'*12". !?196S4 1657017. 69PPlf. 13631 3 Ik23eA2. 58n?!5. 173142. 23:5J39.7
in03 9361n#. 171pto7 168%9'*2. 87*153. 3.836563. 17577e8 7436n5. 144h544. 1934040. A17490 1939025. 2956623e
'0 9
23152) ;
%duA
L

>
APPENDIX B
GROWTH PROJECTIONS FOR NUCLEAR GENERATING CAPACITY--
' At the end of 1975, 56 nuclear units representing a total capacity of over38,000 MWe were in commercial operation. The total ~ generating capacity for thecontiguous United States at that time was about 505,000 MWe; nuclear generatingcapacity represented 7.7. percent of the total. By 1985, nuclear units representing170,000 MWe or 20.4 percent of the total capacity of 785,000 MWe for the UnitedStates, are expected to be in comercial operation.I
Although capital and fuel costs have increased for nuclear power, they also haveincreased for' coal and oil. fired units so that nuclear generated steam has remainedcompetitive. It should be noted, also, that there are many other considerations inselecting a power plant in addition to cost, such as siting, environmental impact andfue1' availability. Taking these factors into account, the utility industry expects to
- add 164 nuclear units during the time frame 1975-1984. This amounts to about 170,000MWe of capacity or about 50 percent of the total capacity to be added.
Growth Projections for Nuclear Generating Capacity
A number of long term forecasts, scenarios and projections of nuclear capacityhave been published recently. Some of these are shown for the years 1985 and 2000 inTable III (B)-l' and include LWR, HTGR, LMFBR and fusion reactors. As in the case of
demand for electricity, the magnitude of the forecasts of nuclear capacity dependshighly on the assumptions that are made. For that reason, the assumptions for thevarious forecasts are summarized here. There is no real attempt to assess the likely.
1:probability of the various forecasts, scenarios or projections coming into being. This -
i study should only be viewed as an abbreviated tabulation of the more pertinent results.
- ERDA Update of WASH-ll39(74)32
On April 28, 1975 Roger Legassie, Assistant Administrator for Planning and-
[ Analysis, ERDA, presented in congressional testimony an update of WASH-1139(74) that
was completed in early 1975. These updated projections'do not specifically address thefuture impact of. expanded Federal energy research and development programs which is'
!- done later in "the Plan." The alternative projections presented should be viewed as: such rather than as a forecast or set of forecasts. They are the following:
$ High Case. This case reflects the Presidential objectives for 200 new nuclear-4: power plants through 1985 and a continuation of a concerted nuclear effort in the-
,
longer. term coupled with continued high rates c ,rowth in electric energy. For1985 this case would require that all plants maintain schedule as currently announced
^
. for ' operation by that date plus an additional 30,000 MWe be scheduled for installation~
; .in the w ie period.
III(B)-1,
;
:
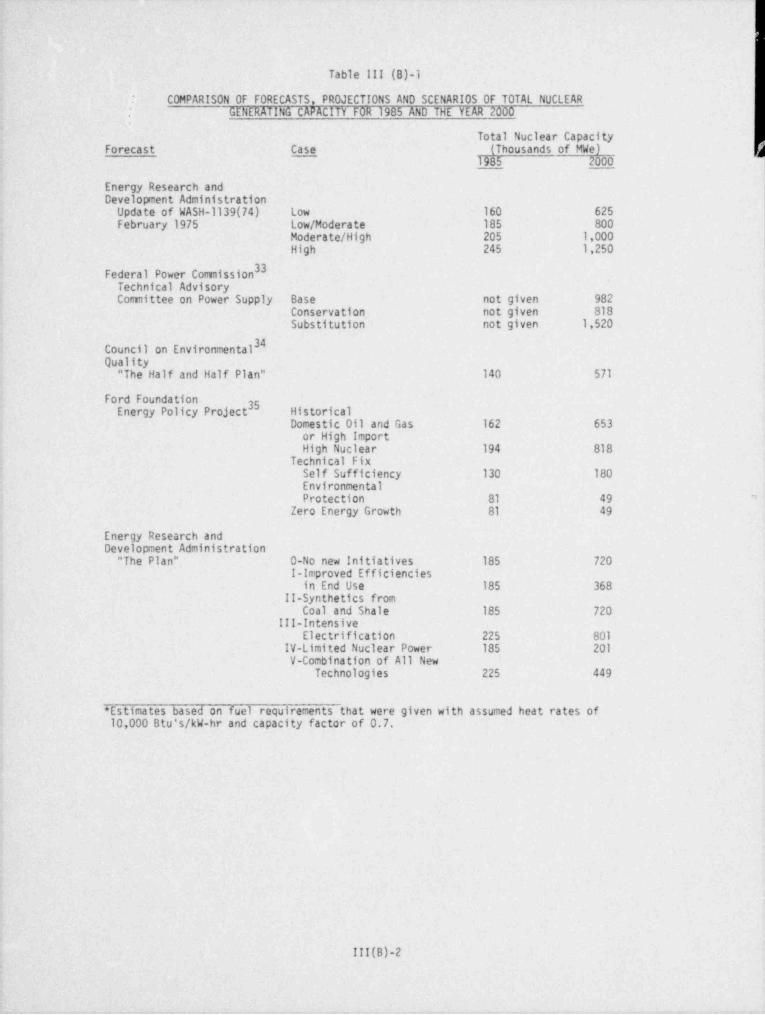
.
'
,
-
Table'!II'(B)-1'
<-' ' COMPARISON OF FORECASTS, PROJECTIONS AND SCENARIOS OF TOTAL NUCLEAR
| GENERATING CAPACITY FOR 1985 AND THE YEAR 2000*
4-Total Nuclear CapacityA .
. Case ' (Thousands of MWe)- ForecastJ_
' '
;- 1985 2000 ]Energy'Research and-
:
Development Administration'
: Update of WASH-1139(74) Low 160 625, February 1975- Low / Moderate 185 800-
Moderate /High 205' 1,000'
High 245 1,250
33Federal Power CommissionTechnical AdvisoryConunittee on Power. Supply Base not given 982'4
Conservation not given 818- Substitution ' not given 1,520
~ Council on'Environmenta134'Quality . .
; "The Half and Half Plan" 140 571
3 Ford Foundation35Energy Policy Project Historical
Domestic 011 and Gas 162 653or High Import
,
High Nuclear 194 818Technical Fix
* Self Sufficiency 130 180Environmental-,
t Protection 81 49 *
Zero Energy Growth 81 49
- Energy Research andDevelopment Administration
i ~"The Plan" 0-No new Initiatives 185 720,
I-Improved Efficiencies1 - in End Use 185 368
'
II-Synthetics fromCoal and Shale 185 720
III-IntensiveElectrification 225 801
IV-Limited Nuclear Power 185 201V-Combination of All New.
Technologies 225 449
* Estimates based on fuel requirements that were given with assumed heat rates of' 10,000 Btu's/kW-hr and capacity factor of 0.7.-
,
-
..
.
- III(B)-2.
4
v ee as -,e , - , s ,. - t--, t -

_ _ _ _ _ _ _ _ _ _ _ _ _ _ _ _ _ _ _ _ _ _ _
-Moderate /High Case--This case is primarily based on counting plants ordered in theshort run with some allowance for additional slippage ~in schedules. The longer termpresumes that nuclear power plants maintain an economic advantage over other typecentral station power plants and therefore capture the largest portion of new additions.
~
Moderate / Low Case--Within a setting of slower growth of electricity, the need for.new central station plants is reduced, and consequently, a similar type reduction innuclear power plants. While nuclear power maintains an economic advantage, the prob-lems of high capital costs and long lead times cause some shifting to fossil-fuelplants.
Low Case--This case presents the lowest ERDA forecast of nuclear capacity. Theassumption is made that delays in bringing nuclear plants on line continue to plaguethe industry. The sources of delay are manifold including late equipment deliveries,construction delays, strikes, poor labor productivity and regulatory problems. It isnot assumed that any particular source of delay is predominant or that any particularsource is corrected, but rather that some of these sources of delay will remain.During the long term, nuclear power plants are presumed to have only a marginaleconomic advantage over new technology fossil-fuel plants.
Federal Power Comission (FPC): Technical Advisory Committee on Power Supply (TACPS)33
The National Power Survey Technical Advisory Committee on Power Supply publishedf three hypothetical forecasts. The full implications of the forecasts were not
evaluated.I
Base--A hypothetical situation occurring if prior conditions of plentiful suppliesof low-cost oil and gas were to continue.
| Conservation--Higher prices of energy supplies but still having adequate oil andgas supplies available at those prices.
Substitution--The authors claim that this is the one the most likely to occur.
This case recognizes that the principal shortages will be concentrated in oil andnatural gas; that these fuels will become increasingly unavailable at any price; andthat coal and nuclear energy must be substituted for applications that currently use
I oil and natural gas.
34Council on Environmental Quality (CE0): The Half and Half Plan
. No assessment of the likelihood of the Half and Half Plan was stated. Some of theimplications for energy ' supply are that:
i '- Major reliance must be placed on coal and nuclear fission. Coal will in-
crease from 12.6 quadrillion Btu's in 1971 to 33.4 quadrillion Btu's in2000; nuclear. power from 0.4 to 35 quadrillion Stu's.
III(B)-3
.. . .. . . .. .. ._ _ _ _ _ _ _ _
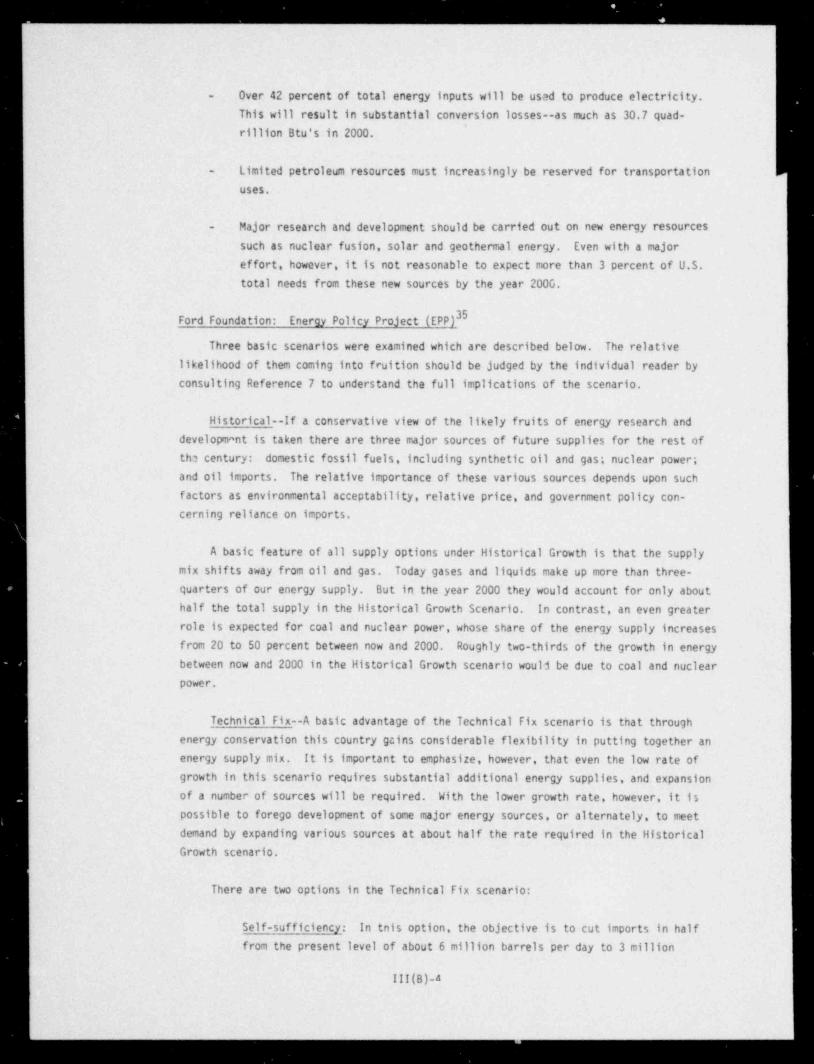
_ _ _ _ _ _ _ _ _ - _ _ - -
- Over 42 percent of total energy inputs will be used to produce electricity.This will result in substantial conversion losses--as much as 30,7 quad-rillion Btu's in 2000.
- Limited petroleum resources must increasingly be reserved for transportationuses.
- Major research and development should be carried out on new energy resources
such as nuclear fusion, solar and geothermal energy. Even with a majoreffort, however, it is not reasonable to expect more than 3 percent of U.S.total needs from these new sources by the year 200G.
Ford Foundation: Energy Policy Project (EPP)35
Three basic scenarios were examined which are described below. The relativelikelihood of them coming into fruition should be judged by the individual reader byconsulting Reference 7 to understand the full implications of the scenario.
Historical--if a conservative view of the likely fruits of energy research anddevelopmant is taken there are three major sources of future supplies for the rest ofth? century: domestic fossil fuels, including synthetic oil and gas; nuclear power;and oil imports. The relative importance of these various sources depends upon suchfactors as environmental acceptability, relative price, and government policy con-cerning reliance on imports.
A basic feature of all supply options under Historical Growth is that the supplymix shifts away from oil and gas. Today gases and liquids make up more than three-quarters of our energy supply. But in the year 2000 they would account for only abouthalf the total supply in the Historical Growth Scenario. In contrast, an even greaterrole is expected for coal and nuclear power, whose share of the energy supply increasesfrom 20 to 50 percent between now and 2000. Roughly two-thirds of the growth in energybetween now and 2000 in the Historical Growth scenario would be due to coal and nuclearpower.
Technical Fix--A basic advantage of the Technical Fix scenario is that throughenergy conservation this country gains considerable flexibility in putting together anenergy supply mix. It is important to emphasize, however, that even the low rate ofgrowth in this scenario requires substantial additional energy supplies, and expansionof a number of sources will be required. With the lower growth rate, however, it ispossible to forego development of some major energy sources, or alternately, to meetdemand by expanding various sources at about half the rate required in the HistoricalGrowth scenario.
There are two options in the Technical Fix scenario:
Self-sufficiency: In tnis option, the objective is to cut imports in half
from the present level of about 6 million barrels per day to 3 million
III(B) d
|
_ _ _ _ _ _ - _ - - -
barrels per day fir the period 1985-2000. Half the growth in this option.would come from nucleir power and coal.
4 Environmental protection: The thrust of this supply mix is to minimize
} demands' on environmentally controversial sources of energy: developments inpresently underdeveloped off shore areas, in Western coal and shale wherewater is scarce and reclamation difficult, and in nuclear power.
{
Zero Energy Growth (ZEG)--The energy supplies required for ZEG are not simplyscaled down versions of the supply schedules for higher growth scenarios. Some of themotivations that curtail growth in demand are reflected in the supply mix for ZEG.
A decision to level off energy consumption a decade hence might stem in part froma desire to avoid development that causes serious environmental problems. This meansavoiding the Atlantic and Pacific coasts, oil shale, and much western coal. It alsomeans avoiding the expansion of nuclear power. Similarly, concern over climatic
. alterations from burning fossil fuels would motivate a limit on the growth in fossilfuels. Further, a concern over the " big brother" syndrome would lead to the de-emphasisof large energy technologies in favor of small scale total energy systems, roof topsolar systems, organic waste energy systems, and wind power, and use of solar energycould help alleviate chronic air pollution. '
24Energy Research and Development Administration (ERDA): The Plan1
l' .There are six scenarios discussed. It is important to evaluate the ultimate= consequences of the various scenarios in order to appraise the relative likelihood of
their occurrence. Because the matters are quite complex it is advised that the reader- consult Reference 8. The supply assumptions for the scenarios will now be discussed.
Scenario 0--No New Initiatives
- Oil and gas production draws on remaining recoverable domestic resources
| According to lower estimates by the U.S. Geological Survey (1975) andthe National Academy of Sciences
.
'
l
Without tertiary or other new recovery
Coal and nuclear converter reactors continue to expand to meet elec-tricity demand, limited by ability to construct or convert plants
Other energy sources (e.g., geothermal, hydroelectric, and urban wastes)expand according to historic projections of existing technologies whichdo not reflect recognition of a serious energy problem
?
III(B)-5 |;
;
. _ _ - _ _ _ _ _ _ . . _.
_ _ _ _ _ _ _ _ _ _ _ _ _ _ _ _ _ _
Sctnario I--Improvrd Efficiencies in End Use
- Domestic oil and gas production is increased above the case case (Scenario 0)by new enhanced recovery technologies.
- Solar heating and cooling are ir.troduced.
- Geothermal heat is used for process and space heating.
- Waste materials are employed as fuels or are recycled to save new energy inproduction.
- Other assumptions are those of Scenar:o 0.
Scenario II--Synthetics frem Coal and Shale
- Substantial new synthetic fuels production is introduced from
Coal
Oil shaleBiomass
- Enhanced oil and gas recovery levels of Scenario I are included.
- Under used solar, geothermal, and waste sources included in Scenario 0 arenot included here.
- The assumptions, unless previously stated, are those of the previousscenarios.
Scenario III--Intensive Electrification- Electric power is intensively generated by coal and nuclear power as in prior
scenarios.
- New technology sources are introduced as available to generate electricity:
Breeder reactors
Solar electric (wind, thermal, photovoltaics and ocean thermal)Fusion
Geothermal electric
- A minimal contribution is assumed from waste materials (as in Scenario 0).
- Supply assumptions are consistent with Scenario 0.
III(B)-6
l
_ _ _ _ _ -
__-
Scenario IV--Lirait on Nuclear Power
- Converter reactor energy levels are constrained to 200,000 MWe. |
|
|- Coal electric is at the levels in other scenarios to permit coal to be !
employed for synthetics. ji1
- Additional sources of electricity depend on
Accelerated geothermal development (more than a factor of two over
Scenario III)
Accelerated solar development (a factor of two over Scenario III)
Fusion as in Scenario III
- Solar and geothermal heating are used (as in Scenarios ! and III).
- Synthetic fuels are produced from coal, shale, and biomass at the level ofScenario II.
Scenario V--Combination of All New Technologies
Scenario V analyzes a case in which a combination of all major energy packagesincluding nuclear, are simultaneously commercialized (i.e., improved end-use,synthetic fuels, and electrification). Complete success in all these complexendeavors is highly unlikely. The specific suppiy assumptions for this scenarioare the same as Scenarios 0 through IV.
Overview
The ERDA Update of WASH 1139(74) Low Case study assumption of 625,000 MWe of
nuclear capacity for the year 2000 is a representative forecast, scenario or projectioncompared to the many shown in Tcble ill B-1 which appear likely to occur. The Low Caseis very high under the assumption that the United States were to follow a Zero EnergyGrowth or Technica, rix Scenario envistaned by the Ford Energy Policy Project. Also,the Low Case is high compared to the ERDA Scenario I, Improved Efficiencies in End Use;Scenario IV Limited Nuclear Power; or Scenaria V. Combination of All Technologies.All three of these scenarios would likely require heavy government involvement toattempt to bring this about with no assurance of success.
Additional discussion of nuclear capacity projectio.v., with particular attentionto regional breakdown, may be found in the " Nuclear Energy Center Site Survey" report.
III(B)-7
..
. . - ..
_ _ _ _ _ _ _ _ _ _