Iron-Based Nanomaterials/Graphene Composites for ... - IRIS Unime
Upload
khangminh22Category
view
4download
0
Investigations of Earth- Abundant Metal Oxide
Nanomaterials for Solar Fuel Generation
by
Peter Mirtchev
A thesis submitted in conformity with the requirements
for the degree of Doctor of Philosophy
Department of Chemistry
University of Toronto
© Copyright by Peter Mirtchev 2015

ii
Investigations of Earth- Abundant Metal Oxide Nanomaterials
for Solar Fuel Generation
Peter Mirtchev
Doctor of Philosophy
Department of Chemistry
University of Toronto
2015
Abstract
Developing renewable energy technologies to mitigate anthropogenic climate
change is one of the biggest challenges facing humanity in the 21st century. Making
use of the Sun’s bountiful energy is society’s best hope for achieving cheap, efficient
renewable power on a global scale. Solar-assisted conversion of abundant
resources such as CO2 and H2O into valuable hydrocarbons is an attractive
proposition in this respect. This work investigates the synthesis and characterization
of nanoparticulate metal oxides based mainly on abundant iron and copper, and
their application as photocatalysts for CO2 reduction and H2 evolution from water.
We begin by presenting a general introduction to artificial photosynthesis and a brief
literature review of progress in the field. The synthesis, characterization, and hybrid
properties of novel Fe2O3/Cu2O hetero-nanocrystals are then described. These
nanoparticles represent one of the few examples of colloidal oxide-oxide hetero-
structured nanocrystals in the literature. In subsequent work, we explore Cu2O
nanocubes as a semiconducting scaffold for the synthesis of multi-component
photocatalytic architectures. This work then led us to study the activity of metallic Cu
on TiO2 as a model H2 evolution system and examine the effects of alcoholic
scavengers on product distribution in water splitting experiments. Finally, we discuss

iii
iron-copper delafossite CuFeO2 which was found to be an active catalyst for the
light-assisted hydrogenation of CO2 to CO. We conclude by summarizing some of
the lessons learned over the course of this work in trying to develop cheap, efficient
artificial photosynthesis catalysts, and attempt to provide useful guidelines that may
aid future researchers in this pursuit.

iv
Acknowledgements
Firstly I would like to thank my supervisor Geoff Ozin for giving me the
opportunity to work on a project in renewable energy, an area that I’ve always been
passionate about. Geoff’s efforts to secure funding ensuring the continued success
of this project were incredible and we are all indebted to his dedication. I would like
to thank the other members of my committee, past and present, Bob Morris, Greg
Scholes, Gilbert Walker and particularly Doug Perovic for opening the door to great
collaborations that resulted in helpful data. All of our academic collaborators
especially Dr. Frank Osterloh, Dr. Stephen Pennycook, Dr. Chuck Mims, Dr.
Zhenghong Lu and the rest of the solar fuels team deserve a mention for making this
research possible. Enormous thanks to our lab manager Sue Mamiche Afara, who
keeps our lab running smoothly and Dr. Navid Soheilnia who is the most
knowledgeable materials chemist that I have ever met. I’d like to acknowledge the
numerous people who have taught me all I know about the techniques that I’ve
learned to use over the course of the last 5 years: Kristine Liao for her XPS/UPS
knowledge, Veronika Hoepfner for gas chromatography, Paul, O’Brien and Amit
Sandhel for their help in sample testing, Eric Henderson for letting me help out on
the CQD project, and Neil Coombs and Ilya Gourevich at the microscopy facility for
their help in getting nanoparticle images on multiple occasions. And thanks to Anna
Liza Villavelez and the other staff members of the Graduate Office who were always
extremely helpful.
To my friends who had the pleasure of getting to know me, both inside and
outside grad school, I know who you are without having to list names. I hope you
enjoyed our time together as much I did and I hope our roads do not separate too far
while we get to where we’re going.
To my family who I can always rely on, thank you for raising me the way you
did and giving me every opportunity to do what I wanted to do. I wouldn’t have had it
any other way.

v
Table of Contents
List of Tables…………………………………………………….....................................viii
List of Figures……………………………......................................................................ix
List of Abbreviations……………………………………................................................xv
Chapter 1- Introduction to Solar Fuels
1.1 Scientific Motivation…………………………………………………………………1
1.2 Basics of Artificial Photosynthesis ………….………………………….………....2
1.3 Literature Overview ………….……………………………………..……………..11
1.4 Focus of This Thesis………….…………………………………………………...22
1.5 References…………………………………………………………………………24
Chapter 2 – Synthesis of Fe2O3/Cu2O Hetero-Structured Nanocrystals
2.1 Abstract……………………………………………………………………………..34
2.2 Introduction to Hetero-structured Nanocrystals…………………............. ……35
2.3 Results and Discussion……………………………………………………………42

vi
2.4 Conclusions………………………………………………………………………...55
2.5 Experimental………………………………………………………………………..55
2.6 References……………………………………………………………..................58
Chapter 3 – Electronic Properties and Applications of Fe2O3/Cu2O HNCs
3.1 Abstract……………………………………………………………........................64
3.2 Photoelectron Spectroscopy……………………………………………………...65
3.3 Gas Phase CO2 Reduction…………………………………..............................71
3.4 Ligand Removal & Dye Degradation……………………..................................76
3.5 Conclusions………………………………………..............................................84
3.6 Experimental…………………………………….................................................85
3.7 References……………………………………………........................................88
Chapter 4 - Investigations of Cu2O Nanocubes as Semiconducting
Scaffolds for Photocatalytic H2 Evolution and CO2 Reduction
4.1 Abstract……………………………………………………………………………..90
4.2 Introduction………………………………………………………..…....................91
4.3 Results and Discussion ……………………………………...............................92

vii
4.4 Conclusions…………………………………………........................................111
4.5 Experimental……………………………………………………………..............112
4.6 References…………………………………………………………....................116
Chapter 5 – Light-Assisted Hydrogenation of CO2 to CO Using a Mixed Metal
Oxide Delafossite, CuFeO2
5.1 Abstract…………………………………………………………..…....................120
5.2 Introduction……………………………………………………………………......121
5.3 Results and Discussion…………………………………………………............122
5.4 Conclusions……………………………………………………………………….136
5.5 Experimental……………………………………………………………..............137
5.6 References……………………………………………………………………......141
Chapter 6 – Conclusions & Future Outlook
6.1 Concluding Remarks……………………………………....…………...............143
6.2 Future Outlook for Solar Fuels……………………….....................................147
6.3 References………………………………………………………………………..150

viii
List of Tables
Table 1.1 - Reactions of interest in artificial photosynthesis and their
thermodynamic potentials………………………………………………………………….5
Table 1.2 – Summary of notable semiconductor-based CO2 reduction
systems …………………………………………………………………………………….13
Table 3.1 - Binding energy (eV) of Fe 2p core-level lines in γ-Fe2O3
nanocrystals, γ-Fe2O3/Cu2O HNCs, and commercial iron oxide nanopowders…….65
Table 4.1 - Rates of H2 evolution from water with Cu2O nanocubes and
related materials as the photocatalyst…………………………………………………101
Table 4.2 Rates of H2 evolution from water using P25/Cu (10%) mixture and
its separate components………………………………………………………………...107

ix
List of Figures
Figure 1.1 – US energy consumption by type…………………………………...1
Figure 1.2 – The process of artificial photosynthesis…………………………...2
Figure 1.3 – Light absorption, charge migration, and surface reactions in a
heterogeneous photocatalyst………………………………………………………………3
Figure 1.4 – Formation of an electron-hole pair in a semiconductor upon
excitation with light……………………………………………………………………….....4
Figure 1.5 – Positions of VB/CB energies with respect to the redox potentials
of surface molecules………………………………………………………………………..5
Figure 1.6 – Positions of the VB and CB potentials of various semiconductors
at pH=1 relative to the redox potentials of CO2 reduction to different products……..6
Figure 1.7 – Formation of an electron-hole pair and various recombination
pathways inside a semiconductor ………………………………………………………...7
Figure 1.8 – A semiconductor-metal junction where the metal acts as an
electron sink and reducing site for adsorbed reactants…………………………………8
Figure 1.9 – The role of sacrificial reagents in scavenging the majority charge
carriers shown for the water splitting process……………………………………………9
Figure 2.1 – Various morphologies of reported colloidal HNCs including
core/shell, dimer, trimer, and oligomer architectures…………………………………..36
Figure 2.2 – Illustration of the FM, SK, and VW modes for growth of a
secondary material onto a seed nanocrystal …………………………………………..38
Figure 2.3 – Schematic representation of charge carrier confinement regimes
in semiconductor hetero-nanocrystals…………………………………………………..41
Figure 2.4 – Schematic Illustration of a Type II hetero-nanostructure with an
electron rich domain for CO2 reduction and hole rich domain for H2O
oxidation…………………………………………………………………………………....41
Figure 2.5 – Crystal structures and lattice constants of the three components
of the heterostructured nanocrystals…………………………………………………….42

x
Figure 2.6 – 1H NMR spectrum of Fe(oleate)3; inset – IR spectrum of
Fe(oleate)3 ..………………………………………………………………………………..43
Figure 2.7 – TGA scans of Fe(oleate)3 and Cu(I)acetate showing the initial
decomposition temperatures of the precursors..……………………………………….44
Figure 2.8 – a) Representative TEM image and particle size distribution of
isolated Cu2O and b) γ-Fe2O3 nanocrystals..…………………………………………..44
Figure 2.9 – a, b) Low-resolution TEM images of HNCs and physical mixture
of γ-Fe2O3 and Cu2O showing the absence of any ordering into hetero-architectures
c) Particle size distribution of the γ- Fe2O3, Cu, and Cu2O domains in as-synthesized
HNCs dimers and oligomers……………………………………………………………...46
Figure 2.10 – a, b) HRTEM images of as synthesized HNCs c) EDX line scan
across dimer particle showing the Fe-rich and Cu-rich domains (d) PXRD patterns of
Cu2O, γ-Fe2O3, and γ-Fe2O3/Cu2O HNCs as thin films e) Raman spectrum of as-
synthesized γ-Fe2O3 nanocrystals showing the prominent A1g phonon mode at 701
cm-1 indicative of γ-Fe2O3…………………………………………………………………47
Figure 2.11 – a, b) HRTEM images and STEM/EELS maps of the γ-
Fe2O3/Cu2O nanocrystals c-e) STEM-EELS elemental map of Cu, Fe, and O
domains showing the compositional distribution over a larger
area………………………………………………………………………………………….49
Figure 2.12 – UV-VIS optical absorbance spectra of a) Cu2O nanocrystals b)
Cu2O excitonic absorption after 24 hour exposure to air and c) γ-Fe2O3, Cu2O, and γ-
Fe2O3/Cu2O HNCs…………………………………………………………………………50
Figure 2.13 – Percent distribution of isolated, dimer, and oligomer particles
as a function of reaction, time, temperature, and stoichiometry. Inset: Reaction yield
under optimal conditions of 15min, 150°C, and 1 mmol Cu(I) acetate precursor…..51
Figure 2.14 – a, b) Low resolution TEM images of Fe2O3/Cu2O HNCs after
size selective precipitation c) Particle size distribution following size-selective
precipitation of the HNCs…………………………………………………………………52
Figure 2.15 – a) Atomic resolution Z-contrast image of a typical HNC particle
b-d) STEM/EELS elemental maps obtained from Fe L2,3 (blue), Cu L2,3 (red), and O
K edges (green)……………………………………………………………………………53

xi
Figure 2.16 – a,b) HRTEM images of enlarged Cu@Cu2O/Fe2O3 HNCs c-f)
STEM/EELS elemental maps of Cu@Cu2O/Fe2O3 HNCs showing the core-shell
nature of the larger Cu domain and the smaller iron oxide domain………………….54
Figure 3.1 – XPS survey spectra of a) γ-Fe2O3 nanocrystals b) Cu2O
particles and c) γ-Fe2O3/Cu2O …………………………………………………………..66
Figure 3.2 – a) XPS spectra of Fe 2p core-level lines of commercial γ-Fe2O3
and Fe3O4 powders, and the as-synthesized γ-Fe2O3 nanocrystals b) XPS spectrum
of the Fe2p3/2 region of the HNCs and isolated γ-Fe2O3 nanocrystals c) XPS
spectrum of the HNCs O1s region with peak fitting i) O signal from γ-Fe2O3 ii) O
signal from Cu2O iii) O signal from carboxylate ligand d) XPS spectrum of the HNCs
Cu 2p region ……………………………………………………………………………….67
Figure 3.3 – a, b) The secondary electron cut-off region of the γ-Fe2O3/Cu2O
HNCs, their pure components, and the physical mixture of the isolated nanocrystals
c) Valence band edge photoemission spectra of HNCs and their
components………………………………………………………………………………...68
Figure 3.4 – Band energy diagram showing the valence and conduction band
edges and Fermi levels of the HNCs and their constituents. ………………………...69
Figure 3.5 – Optical absorption spectra of a) pure Cu2O b) pure γ-Fe2O3 and
c) γ-Fe2O3/Cu2O HNCs manipulated using the Tauc relation (Ref 58) to determine
their optical bandgaps …………………………………………………………………….70
Figure 3.6 – Scheme of the photocatalytic reactor design and GC/MS product
detection setup …………………………………………………………………………….72
Figure 3.7 – Rate of CO (top) and CH4 (bottom) production from CO2
hydrogenation at different temperatures ………………………………………………..73
Figure 3.8 – Surface photovoltage spectra of as-synthesized a) Cu2O NCs b)
Fe2O3 NCs c) Fe2O3/Cu2O HNCs d) separate components plus HNCs plus
trioctylamine ligand film …………………………………………………………………..74
Figure 3.9 – XPS spectra of the C1s and Fe2p regions before and after
removal of carbon contamination by exposure to X-ray beam for a period of 20
minutes ……………………………………………………………………………………..76
Figure 3.10 – FTIR spectra (left) and PXRD patterns (right) of HNCs before
and after heat treatment at 450°C for 24 hours in air …………………………………77

xii
Figure 3.11 – TEM images of a) HNCs following ligand removal by
calcination at 450°C and b) HNCs following ligand exchange with NOBF4 scale bars-
100nm ………………………………………………………………………………………78
Figure 3.12 – XPS spectra of a) C1s region b) Fe 2p region c) Cu 2p region
and d) UPS spectra of the secondary electron cut-off region of HNC films at a
distance of 5 cm from the UV source in the ZONE cleaner ………………………….79
Figure 3.13 – XPS spectra of a) C1s region b) Fe 2p region c) Cu 2p region
and d) UPS spectra of the secondary electron cut-off region of HNC films at a
distance of <1cm from the UV source in the ZONE cleaner …………………………81
Figure 3.14 – FTIR spectra (left) and TEM images (right) of γ-Fe2O3 NCs
before and after ligand exchange with NOBF4………………………………………….82
Figure 3.15 – a) Extent of MB photocatalytic degradation over various
catalysts as determined by monitoring the main absorption peak at ~ 667nm. b) UV-
Vis spectra of the MB aqueous solution at various intervals over the γ-Fe2O3/Cu2O
photocatalyst……………………………………………………………………………….83
Figure 4.1 – Scheme of Cu2O nanocube formation using sodium citrate as
chelating agent to control particle size…………………………………………………..92
Figure 4.2 – a,b) Dark and bright field TEM images of as synthesized Cu2O
nanocubes with an average size of 82 nm c,d) Dark and bright field SEM images of
Cu2O nanocubes on a TEM grid and glassy carbon electrode respectively………...93
Figure 4.3 – a) Particle size distribution of Cu2O synthesized using 0.75 and
0.25 equivalents of citrate b) PXRD pattern c) UV-VIS absorption spectrum and d)
FTIR spectrum of as-synthesized Cu2O nanocubes…………………………………..94
Figure 4.4 – top) PXRD patterns of Cu2O nanocubes heated at various
temperatures for 1 hour in air bottom) PXRD patterns of Cu2O cubes at increasing
times under 200°C in air…………………………………………………………………..95
Figure 4.5 – a-c) TEM images of as-synthesized Cu2O@TiO2 nanocubes
(scale bar 500 nm) d-f) Ti, Cu, and O elemental signals from EDX linescan of
Cu2O@TiO2 in Panel B……………………………………………………………………96
Figure 4.6 – top) PXRD pattern of as synthesized Cu2O@TiO2 nanocubes
showing absence of TiO2 reflections bottom) PXRD pattern of Cu2O@TiO2
nanocubes following heat treatment at 200°C for 3 days……………………………..97

xiii
Figure 4.7 – a) PXRD pattern of Cu2O@TiO2 composites after calcination at
400°C for 30 minutes under Ar b,c) TEM images of the composites before and after
heat treatment (scale bars 100 and 300 nm respectively)…………………………….98
Figure 4.8 – TEM images of Cu2O nanocubes decorated with various noble
metals a) Au (3%) b) Pt (10%) c) Coated with TiO2 and d) Pd (10%)……………...100
Figure 4.9 – a,c) Photographs of the aqueous phase photocatalytic testing
setup and reactor b,d) H2 evolution as a function of time from Cu2O@TiO2
nanocubes………………………………………………………………………………...102
Figure 4.10 – top) PXRD pattern of Cu2O-Pt@TiO2 particles before testing
bottom) PXRD pattern of Cu2O-Pt@TiO2 particles after testing; (inset) – photograph
of the catalyst suspension showing presence of metallic Cu………………………..103
Figure 4.11 – top) TEM image and PXRD pattern of commercial bulk Cu2O
powder used as a testing reference bottom) TEM image and PXRD pattern of
commercial Cu2O “nanospheres………………………………………………………..105
Figure 4.12 – a) Rates of CO and CH4 over multiple runs from bare Cu2O
nanocubes and Cu2O@TiO2 composites b) CH4 production rates from Cu2O-
Pt(3%)@TiO2 composite (no CO detected) c) CO and CH4 evolution rates on the
Cu2O-Pt(3%) sample over multiple runs……………………………………………….106
Figure 4.13 – a,c) H2 evolution rates as a function of Cu loading in Cu/TiO2
catalysts and H2 evolution profile with time over the P25/Cu (10%) catalyst b,d)
PXRD patterns of P25/Cu (10%) samples before and after testing………………...109
Figure 4.14 – Hydrocarbon and H2 evolution rates over various model
catalysts using different hole scavengers……………………………………………..110
Figure 5.1 – PXRD patterns of as synthesized delafossite CuFeO2 (top) and
CeFe2O4 (bottom)……………………………………………………………………….123
Figure 5.2 – a) PXRD pattern of the mixed 1:1 molar ratio iron/copper
precursor before heating at 900°C a,c,d) SEM images of CuFeO2 particles following
solid state reaction. Panel e) shows a CuFeO2 particle synthesized without the use
of NaOH b) SEM image of a CuFe2O4 particle after solid state reaction and
grinding……………………………………………………………………………………124
Figure 5.3 – a,c) EDX line-scans of CuFeO2 and CuFe2O4 particles showing
the presence of the expected elements (Scale bars 1μm and 2 μm respectively) c,d)
Quantitative signal intensities of the elements detected by EDX confirming expected
stoichiometric ratios of the metals……………………………………………………...125

xiv
Figure 5.4 – a) XPS survey spectrum of CuFeO2 b) PXRD pattern of CuFeO2
following ball-milling to reduce particle size c) PXRD diffraction patterns of CuFeO2
following prolonged heating at 450°C in air d) Diffuse reflectance spectra of CuFeO2
and CuFe2O4 ……………………………………………………………………………..126
Figure 5.5 – a) PXRD patterns of CuFeO2 powder after various amounts of
time at 900°C under Ar b) PXRD patterns of CuFe2O4 powder after calcination at
1000°C in air for various amounts of time ……………………………………………128
Figure 5.6 – TGA-DSC curves of CuFeO2 top) and CuFe2O4 bottom) at a
heating rate of 10°C/min. Arrows indicate temperatures where we performed PXRD
analysis …………………………………………………………………………………...129
Figure 5.7 – PXRD spectra of top) 1:1 molar ratio precursor for CuFeO2 prior
to heating middle) 1:1 molar ratio precursor after heating to 250°C and 550°C for a
period of time corresponding to the synthesis of the material bottom) 1:2 molar ratio
precursor (CuFe2O4) after heating at 450°C for amount of time corresponding to the
synthesis…………………………………………………………………………………..131
Figure 5.8 – a) CO production rate over CuFeO2 over a period of 90 hours
intense illumination b) GC-MS chromatogram of the CO peak showing the presence
of 13CO amongst the products c) 12CO and 13CO signals under alternating low and
high illumination intensities d) CO production rates over CuFeO2 and pure Fe3O4,
Fe3O4/Cu, and pure Cu control sample. Each bar corresponds to a testing run with
an average length of 7 hours……………………………………………………………133
Figure 5.9 – a) Top down SEM image of the CuFeO2 film prior to illumination
b) Cross-sectional SEM image of the CuFeO2 film used to determine approximate
thickness c) PXRD diffraction pattern of the CuFeO2 catalyst after testing showing
the presence of newly formed Fe3O4 and Cu phases (Inset – digital photograph of
discolouration following illumination……………………………………………………134
Figure 6.1 – A general schematic of solar fuels production describing many of
the proposed methods of converting CO2 to fuels using solar energy. The
approximate temperature requirements are color-coded, red = high, yellow =
ambient…………………………………………………………………………………….148

xv
List of Acronyms and Abbreviations
ALD – Atomic Layer Deposition
AM 1.5 – Air Mass 1.5 Solar Spectrum
AMU – Atomic Mass Unit
CB – Conduction Band
CVD – Chemical Vapor Deposition
DSC – Differential Scanning Calorimetry
EDX – Energy Dispersive X-Ray Spectroscopy
EELS – Electron Energy Loss Spectroscopy
FID – Flame Ionization Detector
FTIR – Fourier Transform Infrared
FTO – Fluorine-Doped Tin Oxide
HNC – Hetero-nanocrystal
HOMO – Highest Occupied Molecular Orbital
HRTEM – High Resolution Transmission Electron Microscopy
LUMO – Lowest Unoccupied Molecular Orbital
MB – Methylene Blue
NCs/NPs – Nanocrystals/Nanoparticles
NHE – Normal Hydrogen Electrode
PEC – Photoelectrochemical
PXRD – Powder X-ray Diffraction
RWGS – Reverse Water Gas Shift
SEM – Scanning Electron Microscopy
STEM – Scanning Transmission Electron Microscopy
TEM – Transmission Electron Microscopy

xvi
TGA – Thermogravimetric Analysis
TON – Turnover Number
UPS – Ultraviolet Photoelectron Spectroscopy
UV – Ultraviolet
VB – Valence Band
XPS – X-ray Photoelectron Spectroscopy

1
Chapter 1 – Introduction to Solar Fuels
1.1 Scientific Motivation
Humanity’s reliance on fossil fuels to produce energy and the associated
emissions of greenhouse gases which may have unpredictable effects on Earth’s
climate are arguably the greatest challenges facing society in the 21st century. With
global population expected to reach 10 billion by 2050, it is estimated that we will need
30 – 40 terawatts (TW) of power to maintain our current way of life compared to 17 TW
today.1,2 Currently, close to 80% of our energy needs are derived from the burning of
fossil fuels in the form of oil, coal, and natural gas, Figure 1.1. Technologies based on
renewable resources such as photovoltaics, wind turbines, and biomass conversion
account for only ~ 3% of our total energy production. It is clear that if we want to avoid
damaging changes to Earth’s climate and catastrophic pollution, we must devote
significant efforts to developing cheap, efficient renewable power.
Figure 1.1 US Energy Consumption by Type (Source: NPR,
http://tinyurl.com/pzve2kw, Accessed 20/4/2015)

2
Of the available renewable resources, solar energy stands out in terms of its
abundance. The total solar power irradiating the Earth’s surface is approximately ~ 105
TW per year, meaning that only 0.1% of this resource would be enough to sustainably
meet our needs, provided it can be harvested, converted, and stored.3 However, to date
it remains a significant challenge to efficiently capture and make use of solar power and
to do so in a cost competitive manner in relation to fossil fuels. As chemists, we possess
the necessary tools to develop the materials and processes to make this a reality.
1.2 Basics of Artificial Photosynthesis
As mentioned above, the 3 critical challenges related to utilizing solar power are
energy harvesting, conversion, and storage. Photovoltaic cells, which convert sunlight
into electricity, effectively address only the first two of these issues. Energy storage
continues to be problem in light of the inherent variability of solar irradiation caused by
the time of day and unpredictable weather fluctuations. A possible solution is offered by
the process of photocatalytic solar fuel generation whereby solar energy drives
chemical processes thereby directly converting abundant raw materials such as water
and carbon dioxide into hydrogen or basic hydrocarbons such as formaldehyde,
methanol, and methane, see Figure 1.2.3–5
Figure 1.2 The process of artificial photosynthesis (Reprinted with permission
from Ref (8) Copyright (2012) Royal Society of Chemistry)

3
The direct conversion of solar energy into chemical energy stored in bonds -
termed artificial photosynthesis – is an attractive proposition that allows the issues
associated with electricity storage to be bypassed.6–9 There are typically 3 main
processes that need to take place in an effective photocatalyst for artificial
photosynthesis as shown in Figure 1.3:
1. Light absorption
2. Charge separation and migration,
3. Surface reaction of the photo-generated charges with adsorbed reactant
species at a catalytic centre
In the following, we will discuss how these basic principles affect the
development of materials for efficient solar fuel production.
Figure 1.3 Light absorption, charge migration, and surface reactions in a
heterogeneous photocatalyst (Reprinted with permission from Ref (30) Copyright (2014)
John Wiley and Sons)
Semiconductors are attractive materials for light harvesting. They possess a
band gap: a lack of electronic states between a valence band (VB) filled with ground
state electrons and a conduction band (CB) that is empty of electrons at T=0K.10 The
“size” or energy separation between the top of the VB and the bottom of CB determines
the wavelength of light that a semiconductor can absorb. When light with sufficient
energy shines on a semiconductor, an electron is excited from the VB to the CB, leaving

4
“an electron hole” in the valence band, Figure 1.4. A hole is a quasi-particle that
essentially constitutes the absence of an electron and behaves as a positive charge.
Figure 1.4 Formation of an electron-hole pair in a semiconductor upon excitation
with light (Reprinted with permission from Ref (10) Copyright (2013) John Wiley and
Sons)
Since only photons with incident energy greater than the bandgap can be
absorbed, an overlap between the solar spectrum and the semiconductor’s absorption
profile is crucial for maximizing total light absorption. However, it is not simply a matter
of choosing materials with a narrow bandgap; the positions of the VB and CB edges
with respect to the redox potentials of the reactant adsorbates must also be taken into
account. As an example, the water splitting reaction H2O → H2 + ½ O2 is
thermodynamically unfavourable with ΔG = 237 KJ/mol under standard conditions.11
This corresponds to a ΔE = -1.23 V, meaning that a photocatalyst must have a bandgap
of at least 1.23 eV to drive this reaction. Some other common CO2 reduction reactions
and their minimum required potentials are listed in Table 1.1.12 For reduction reactions,
the CB edge must lie above the lowest unoccupied molecular orbital (LUMO) of the
adsorbed species. In other words the CB potential has to be more negative than the
reduction potential of the acceptor. On the other hand, the transfer of a positive hole to
a hole acceptor molecule requires that the top of the VB lie at a more positive potential
with respect to the highest occupied molecular orbital (HOMO) of the adsorbate. Figure
1.5 provides a helpful visual explanation of these guidelines. These considerations
create a necessary compromise between the opposing requirements of light absorption
and thermodynamic driving force.

5
Table 1.1 Reactions of Interest in Artificial Photosynthesis and Their
Thermodynamic Potentials
Common Reactions of Interest Required Potential, ΔE
H2O → H2 + ½ O2 ΔE = 1.23 V
CO2 + H2O → HCOOH + ½ O2 ΔE = 1.40 V
CO2 + H2O → HCHO + O2 ΔE = 1.34 V
CO2 + 2H2O → CH3OH + 3/2 O2 ΔE = 1.21 V
CO2 + 2H2O → CH4 + 2 O2 ΔE = 1.06 V
On one hand, a narrow band gap is advantageous as it maximizes solar
spectrum absorption. However as discussed above, the VB and CB edges have to span
the reduction and oxidation potentials of the desired reactions necessitating large
bandgaps. There are also overpotentials associated with the kinetic barriers of these
reactions that necessitate even larger driving forces. The general consensus is that for
a single domain photocatalyst, the optimal bandgap is in the range of 2.0 to 2.5 eV as
this allows absorption of some visible light and enough redox driving force for the half-
reactions of CO2 reduction and H2O oxidation.
Figure 1.5 Positions of VB/CB energies with respect to the redox potentials of
surface molecules (Reprinted with permission from Ref (10) Copyright (2013) John
Wiley and Sons)

6
Figure 1.6 shows band edge positions of several commonly studied
semiconductors superimposed onto the reduction potentials of CO2 to different products
versus the normal hydrogen electrode (NHE). From the figure, it becomes apparent that
very few semiconductors possess conduction band edges at potentials negative enough
to reduce to CO2 to the CO2- radical by direct electron injection. However, proton
assisted multi-electron reactions can be thermodynamically driven by a number of
materials to give products such as formic acid and carbon monoxide (HCOOH & CO,
2e-), formaldehyde (HCHO, 4e-), methanol (CH3OH, 6e-), and methane (CH4, 8e-).
Sections 1.4 and 2.2 will further discuss the selection of suitable semiconductors for the
work performed in this thesis.
Figure 1.6 Positions of the VB and CB potentials of various semiconductors at
pH =7 relative to the redox potentials of CO2 reduction to different products (Reprinted
with permission from Ref (10) Copyright (2013) John Wiley and Sons)
Following light absorption and formation of charge carriers in the form of a
negative electron and a positive hole, the processes of charge separation and migration
to the surface become crucial. Many competing recombination pathways exist and
present a critical factor in limiting the efficiencies of photocatalysts. Naturally, the
electron and hole have a Coulombic attraction due to their opposite charges. The
electrostatically bound electron-hole pair is termed an exciton. Notable, exciton
recombination can reach up to 90% within 10ns following excitation, thereby limiting the

7
number of free charge carriers in the material even prior to charge diffusion.11,13 The
typical distance travelled by charges is called the diffusion length, and it depends on the
material. Limiting the size of the photocatalyst to the nanoscale and introducing porosity
are useful strategies in minimizing the distance travelled by the carriers to reach the
surface. As a consequence of the shorter distances travelled the photogenerated
charges have a higher chance to reach the surface without recombining. Charge
recombination can occur inside the bulk of the semiconductor (volume recombination)
or once the charges reach the surface (surface recombination), Figure 1.7. It is typically
caused by crystalline defects in the bulk, which inhibit the migration of charges to the
surface. Amorphous materials and those with grain boundaries have therefore
traditionally been considered therefore a poor choice for photocatalysis. As a result,
well-defined nanocrystalline materials have received a lot of attention with a view on
overcoming these challenges.14,15
Figure 1.7 Formation of an electron-hole pair and various recombination
pathways inside a semiconductor (Reprinted with permission from Ref (15) Copyright
(2010) American Chemical Society)
The final stage of the artificial photosynthetic process is the redox chemistry at
the surface of the catalyst. This is heavily dependent on the available catalytic sites and

8
surface species present on the catalyst, and is perhaps the least clearly understood.
The surface reactions usually require a co-catalyst, typically a noble metal nanoparticle
or organometallic complex to be tightly interfaced with the semiconductor lowering the
kinetic barriers associated with CO2 activation. The metal acts as an electron sink,
accepting the photogenerated electrons which reach the semiconductor surface. For
this to happen, the metal’s Fermi level must be at a less negative potential than the
semiconductor CB, as illustrated in Figure 1.8. The metal’s Fermi level is then shifted
slightly upward to more negative potentials making the composite more reductive.16 This
forms a classic Schottky barrier at the nanoscale where the electrons accumulate in the
metal and are used to do reduction chemistry while the holes remain on the
semiconducting material.17,18 Charges migrating through the bulk of the catalyst and
reaching its surface are expected to participate in redox chemistry with the surface
adsorbates. However, photogenerated charges can also react with the catalyst itself,
performing unwanted redox chemistry that leads to its decomposition in a process
known as photocorrosion.3 Photocorrosion can either be reductive or oxidative
depending on the material and the redox potentials of those reactions. For example,
CdS is susceptible to oxidative photocorrosion by holes due to oxidation of its S2-
accompanied by leaching of Cd2+, Equation 1.1.19
CdS + 2h+ → Cd2+ + S (1.1)
Figure 1.8 A semiconductor-metal junction where the metal acts as an electron
sink and reducing site for adsorbed reactants (Reprinted with permission from Ref (10)
Copyright (2013) John Wiley and Sons)

9
Photocorrosion of the sulfide anion is common in metal sulfide semiconductors
although it has been known to happen in some oxides as well, namely ZnO and Cu2O.19
Preventing photocorrosion has been addressed by employing core-shell structures
where the active catalyst is coated by a stable inert oxide or by making use of bandgap
engineering and co-catalysts as will be discussed in Chapters 2,3, and 4.20,21 Attaching
co-catalysts to a light absorbing component such as a semiconductor also allows one to
test materials for activity in either of the two half reactions of interest, namely CO2
reduction or H2O oxidation by employing sacrificial reagents.19 For example, the setup
shown in Figure 1.9a would be useful in evaluating reduction products if a hole
scavenger such as MeOH or Na2S2O3 is sacrificially oxidized by the holes leftover in the
semiconductor. Similarly, an oxidizing agent such as a metal ion can be used to mop
up photogenerated electrons and allow the evaluation of O2 evolution activity from H2O,
as shown in Figure 1.9b for water splitting.19 It should be noted that even if a catalyst is
active for these half reactions, it may not be active for the overall process due to
recombination or corrosion issues as discussed above. In addition, employing sacrificial
reagents renders the process less “green” as the scavengers are typically obtained from
non-renewable sources. However, utilising sacrificial reagents remains a useful tool in
stabilizing catalysts that may be susceptible to photocorrosion and determining whether
a material is active for the reductive/oxidative reaction that it was intended for.
Figure 1.9 The role of sacrificial reagents in scavenging the majority charge
carriers shown for the water splitting process (Reprinted with permission from Ref (19)
Copyright (2009) Royal Society of Chemistry)

10
Free CO2 molecules are chemically inert with a linear geometry and D∞h
symmetry.10 Adsorption onto a semiconductor or metallic surface offers a way to
activate the CO2 molecule for reduction. The simplest model involves one-electron
transfer from the photoexcited catalyst to the LUMO of CO2 to give a CO2•- radical
species.22,23 Upon the acceptance of the electron, CO2 undergoes a change from linear
to bent geometry (C2v symmetry) and repulsion exists between the lone pairs on the
oxygen atoms and the unpaired electron on carbon.10 Therefore one-electron reduction
of CO2 to CO2•- radical is extremely unfavourable with a chemical potential of -1.9 V
versus NHE, Figure 1.6.24 As a result, very few, if any, semiconductors possess a CB
edge with a potential reductive enough to initiate this reaction. Proton-assisted multiple
electron reductions are significantly less demanding, comparable to the proton reduction
to H2 which is a one electron process, see Equations 1.2-1.7 below (E0 values versus
NHE at pH = 7).10
(1.2) CO2 + 2H+ + 2e- → HCOOH E0redox = -0.61 V
(1.3) CO2 + 2H+ + 2e- → CO + H2O E0redox = -0.53 V
(1.4) CO2 + 4H+ + 4e- → HCHO + H2O E0redox = -0.48 V
(1.5) 2H+ + 2e- → HCOOH E0redox = -0.41 V
(1.6) CO2 + 6H+ + 6e- → CH3OH + H2O E0redox = -0.38 V
(1.7) CO2 + 8H+ + 8e- → CH4 + 2H2O E0redox = -0.24 V
Multiple semiconductors are able to provide potentials that are reductive enough
to drive reactions like those listed above. However, there has been little experimental
evidence of such processes taking place due to the low likelihood of multiple protons
and electrons coming together in concerted fashion. The reactions are likely to proceed
through a series of one-electron transfer steps with the first electron transfer to CO2
thought to be the limiting step.25,26 Unfortunately, research in elucidating the mechanism
of such proton-coupled electron transfer reactions for CO2 reduction is still in its infancy
due to the complexities involved in identifying transient intermediates. From equations
1.2-1.7, it also becomes apparent that there are multiple gaseous and liquid-phase
11
products that can be formed depending on the number of protons and electrons taking
part in the process. Therefore, product selectivity and unwanted side reactions such as
proton reduction to H2 are further issues that must be addressed when trying to design
systems capable of reducing CO2 to hydrocarbons.
The demanding requirements outlined in this section explain why efficiencies of
artificial photosynthetic processes and in particular CO2 reduction have remained low;
finding materials with broad light absorption, efficient charge transport, and active
catalytic surfaces is extremely challenging. Section 1.3 provides a brief progress review
of the solar fuels field from its inception and growth to the current state-of-the-art
developments, with an emphasis on CO2 reduction.
1.3 Literature Overview
The list of materials that have been explored for CO2 reduction is extensive and
includes most metal oxides, metal sulfides, and to a lesser degree the metal nitrides
and phosphides. Many of the photocatalytically active compounds discussed in the
section were initially developed to study water splitting but have recently found use in
CO2 reduction because the structural and property requirements between the two
reactions are very similar. In general, minimizing recombination, high surface areas, and
low cost/toxicity are always desirable characteristics regardless of the class of
materials. Fujishima and Honda were among the first to report an artificial
photosynthetic process in 1972 when they used TiO2 to split water into H2 and O2 under
UV illumination.27 Halmann was the first to report reduction of CO2 in 1978 using a
single crystal GaP cathode, a carbon anode and a CO2 containing aqueous buffer
solution to which a voltage was applied.28 Shortly after, Inoue and Fujishima
investigated the use of semiconductor powders for CO2 reduction to hydrocarbons in
1979.29 Common semiconductors including TiO2, ZnO, CdS, WO3, and SiC were
illuminated by an ultraviolet Xe lamp while suspended in a saturated aqueous CO2
solution. Small amounts of formic acid, formaldehyde, methanol, and methane were
detected with the authors correlating the amount of product to the redox potential of the
CB edges of the various semiconductors. These early breakthroughs gave impetus to

12
the field and over the past two decades, the number of publications related to
photocatalytic CO2 conversion has skyrocketed.
Metal oxides are attractive mainly due to their chemical stability; most oxides are
easy to synthesize, air-stable, and possess large band gaps that help prevent
photodecomposition processes. Oxides with the metal in d0 (Ti4+, Nb5+, W6+)
configuration have especially been closely studied with TiO2 in particular being perhaps
the most commonly used photocatalyst material. Metals in the filled d10 configuration
(In3+, Ga3+, Sn4+) have also been found to be active.30 As opposed to d0 oxides, d10
oxides possess a conduction band mainly composed of hydridized s and p orbitals.
Mixing of these orbitals leads to a large dispersion in k-space and therefore a high
mobility of photogenerated charge carriers.10 The tops of the VB edge in d0 oxides
exhibit mainly O 2p character and are situated at very positive potentials (+ 2-3 V vs
NHE).31 Therefore, their bandgaps are usually too large to properly utilise the solar
spectrum if the CB edge is to be sufficiently negative to reduce CO2. Nevertheless, TiO2
has been the most common semiconductor used in photocatalysis for a number of
reasons. It is an inexpensive, widely abundant material and has been studied
extensively in terms of its absorption, charge transport and surface chemistry.15,32,33 Its
CB and VB levels are positioned such that the CO2 reduction and water oxidation half
reactions are thermodynamically feasible and it is stable to being degraded by
photocorrosion reactions.34 The standard TiO2 material used in photocatalysis is
referred to as P25, an 80%/20% mixture of the anatase and rutile polymorphs.
Electronic synergism between the two phases was proposed as the reason for the
enhanced activity of P25 compared to phase-pure TiO2 polymorphs.35 The main
drawback is its relatively large indirect, bandgap of 3.0 eV which means that TiO2 can
effectively only absorb approximately 5-10% of the solar spectrum, which severely limits
the numbers of photogenerated carriers and therefore its photocatalytic performance.10
Plenty of approaches have been developed to overcome TiO2’s poor absorption
including doping, sensitization, and hetero-structuring. Some notable results based on
TiO2 and other semiconductor photocatalysts for CO2 reduction are presented here and
summarized in Table 1.2. Section 4.3 presents our work on the H2 evolution activity of
Cu nanoparticle decorated P25 TiO2 composites.

13
Table 1.2 Summary of notable semiconductor-based CO2 reduction systems
Catalyst Reaction
Medium
Light
Source
Products Reference
Zn-doped p-type
GaP single crystal
Aqueous CO2
buffered solution
Hg lamp <
365 nm
Formic acid (major),
formaldehyde,
MeOH
Halmann,
ref 29
SiC, TiO2, GaP,
ZnO, CdS, WO3
powders
Semiconducting
powder dispersed
in CO2 aqueous
solution
500 W Xe
lamp with
various
filters
MeOH (major),
formaldehyde, formic
acid, methane
Inoue, ref
30
Anatase TiO2,
230nm diameter
Powder in
supercritical CO2
990 W Xe
lamp
Formic acid Kaneco,
ref 37
Cu-doped ZnO, Li-
doped TiO2
supported on MgO,
Al2O3, and SiO2
CO2 saturated
solution from
KHCO3 (pH 7.5)
250 W Hg
lamp
Acetone (major),
EtOH, MeOH,
formaldehyde, formic
acid, methane
Subrahma
nyam, ref
44
W18O49 nanowires CO2+H2O gas-
phase system
300 W Xe
lamp,
< 420 nm
Methane (major),
EtOH, acetone
Xi, Ref 67
Bi2WO6 hollow
microspheres
CO2 saturated
aqueous solution
300 W Xe
lamp,
< 420 nm
Methanol Cheng, ref
68
Zn2GeO4
nanoribbons
CO2+H2O gas-
phase system
300 w Xe
lamp
Methane Liu, ref 72
ZnS, CdS powders CO2 saturated
aqueous solution
150 W Hg
lamp <
290 nm
Formic acid Kisch, ref
80
CoPi anode,
NiMoZn cathode,
R. Eutropha
CO2 saturated
phosphate buffer
with R. Eutropha
N/A Isopropanol (major)
acetone, pyruvate
Nocera, ref
84

14
Table 1.2 cont`d
Cu2ZnSnS4
modified with Ru-
polymer
CO2 (aq) in
photoelectro-
chemical cell
Xe lamp,
< 400nm
filter
Formate (major), CO Arai, ref 86
p-GaP, pyridinium
electron shuttle
CO2 (aq) in
photoelectro-
chemical cell
200 W Xe,
arc lamp,
cutoff
filters
Methanol Bocarsly,
ref 88
InP/Ru cathode,
TiO2 anode
CO2 + H2O in
photoelectro-
chemical cell
Xe lamp,
< 400 nm
filter
Formate Sato, ref
94
TiO2-xNx hollow
nanocubes
CO2 + H2O gas
phase system
300W Xe
lamp with
AM 1.5
filter
Methane (major),
ethane, propane,
butane
Schaak,
ref 98
C3N4/Ru
multicomponent
structures
CO2 +
triethanolamine in
polar organic
solvents
400 W Hg
lamp, <
400 nm
Formic acid (major),
H2, CO
Maeda, ref
100
The early work on TiO2 artificial photosynthesis was mainly proof-of-concept
experiments utilising deep UV irradiation and bulk or microcrystalline catalysts with low
surface area and correspondingly low product evolution rates. The most typical setup is
a suspension of TiO2 particles in a CO2 saturated aqueous or alcoholic environment.36–
39 Rates in these reports are usually on the order of μmol/g cat/hour but can be
improved by increasing light intensity or CO2 pressure.40 Since the solubility of CO2 in
aqueous solutions is rather low which can lead to competitive H2 evolution, some
researchers have explored the option of using supercritical CO2 as the reaction
medium.37,41 In these studies, no gaseous products were detected although formic acid
was found in the aqueous phase with acidic media found to increase its production.
TiO2 particles embedded in SiO2 matrices have also been looked at with a view on

15
studying the effect of the reaction solvent.42,43 The dispersed TiO2/SiO2 composites
were found to give formate and CO at higher rates than bulk TiO2, with the product ratio
determined by the interaction of intermediates with the type of solvent. The detection of
C2 or C3 products is rare but has been previously reported using TiO2 photocatalysts.
Subrahmanyam et. al. looked at various metal oxides supported on SiO2, Al2O3, or MgO
and saw acetone and ethanol being formed as the major products with methane and
ethane formed in smaller amounts.44 CO2 reduction occurred preferentially on the basic
oxide supported systems although the acidic oxides were more selective for C2
products. The body of work on modifying TiO2 with various metallic co-catalysts is
immense. As mentioned in Section 1.2, the generally favourable effect of metal loading
on TiO2 is ascribed to the ability of metals to act as an electron sink, reducing charge
recombination in the semiconductor. Copper loading on TiO2 has been studied on
multiple occasions and the consensus has been that Cu particles are selective catalysts
for CH3OH production.45–49 Decoration of TiO2 with Pd nanoparticles has also been
shown to lead to formate and CO with prolonged irradiation leading to deactivation of
the catalyst due to oxidation of Pd to PdO.50,51 Modifications of TiO2 with noble metals
have also been investigated since their plasmonic excitations can help extend the
semiconductor’s absorption.52–54 Doping with up to 5 wt% Ag particles led to an increase
in the formation rates of CH3OH and CH4 compared to bare TiO2.53 Sensitization of TiO2
with organic dyes has also been widely studied since the pioneering work of Gratzel on
dye-sensitized solar cells.55 Visible light is absorbed by the dye whose LUMO level is
located a more negative potential than the TiO2 conduction band edge and the
photogenerated electron is injected into TiO2. The dyes used are organometallic
ruthenium or cobalt complexes.56,57 Enhancement of total reduction products using this
approach was seen by Liu et.al and Woolerton et.al. who attributed it to reduced
electron-hole recombination.58,59 Plenty of work has been carried out on coating TiO2 on
various surfaces and supports such as optical fibers, mesoporous materials, and glass
wool. These materials are more suitable to solid-gas interactions where the morphology
of the catalyst can have a significant effect on the rates. Optical fibers increase the path
length of light which comes in contact with the catalyst; TiO2 is usually coated onto the
fibers from solution by dip-coating. Wu et.al. deposited 50 nm thick films of Cu/TiO2

16
inside the walls of glass optical fibers and detected CH3OH production at μmol/g/h rates
demonstrating the utility of this setup.60 TiO2 coated onto glass wool and glass pellets in
conventional batch reactors have also proven effective catalytic architectures.36,61 The
large surface areas and porosities of mesoporous materials such as zeolites and metal-
organic frameworks have proved useful in the production of solar fuels. Substituting Ti
for some of the elements of the zeolites framework by ion-exchange results in a large
number of isolated Ti catalytic sites that were shown to be active in the presence of CO2
and H2/H2O.62–64 More sophisticated systems have recently begun to be reported using
multiple components. For example, Wang et.al. synthesized CdSe sensitized TiO2
particles decorated with Pt co-catalysts for visible light CO2 reduction.65 Electron
injected from CdSe into TiO2 migrated onto the catalytic Pt centers giving CH3OH, CO
and H2. Such architectures are beneficial as they allow each component to be optimized
separately and its effect on catalytic performance monitored.
The above has been a very brief summary of advances made using TiO2
photocatalysts for CO2 reduction. Despite being the most common material for this
application, TiO2 still has issues related to its limited absorption which are keeping
product formation rates lower than what is required for commercial purposes.
Nevertheless, it provides a convenient platform for studying the effects of co-catalysts,
sacrificial reagents, and reaction conditions as it is known to be active under standard
testing conditions. Other metal oxides have also been explored due to the afore-
mentioned limitations of TiO2. ZnO catalysis is probably the second most common
material although its large bandgap of 3.4 eV means that it too is only active under UV
light.66 Since the main motivation for exploring oxides besides TiO2 is their activity
under visible light, the following will mainly focus on narrow bandgap metal oxides.
Tungsten oxide is one of the aforementioned d0 metal oxides with a slightly narrower
bandgap of 2.7 eV. Ultrathin WO3-x nanowires containing oxygen vacancies were
synthesized by a solution phase route and found to photoreduce CO2 to CH4 under
visible light in the presence of water.67 The number of oxygen vacancies could be
controlled by oxidation with H2O2 and it was found that the number of vacancies would
decrease with increasing W oxidation state. Bismuth tungsten oxide microspheres,
Bi2WO6, were found to be more active than bulk Bi2WO6 producing methanol from CO2

17
at a rate of 16.3 μmol g-1 h-1.68 The microsphere morphology offered a large number of
active surface sites and permeability to allow transfer of reactants in and products out of
its porous structure. Notably, no co-catalysts were used to obtain these rates which is a
significant accomplishment especially under visible light irradiation. Catalysts including
niobium, especially the Nb5+ oxidation state have seen increased use in recent years.
Indium niobate, InNbO4, decorated with nickel or cobalt oxides was found to be
moderately active due to hetero-junctions formed with Ni0 and NiO on the surface.69
NaNbO3 loaded with Pt was investigated for reduction of CO2 to CH4 to compare the
effect of nanowires versus the bulk material. 70,71 Both forms were inactive in the
absence of photo-deposited Pt, however the nanowire sample produced significantly
more methane than the bulk. The increase was attributed to good crystallinity, large
surface area, and improved directional charge transfer along the length of the wires.
Another active nanowire material was recently reported by Zhou and co-workers.
Zn2GeO4 nanoribbons were prepared by a solvothermal approach with the addition of 1
wt% RuO2 and Pt as oxidative and reductive co-catalysts respectively.72 The product
formation rate was over an order of magnitude higher in the hetero-junction samples
compared to the bulk. InTaO4 has been explored extensively for water splitting but it
was not until recently that it was tested for CO2 reduction in the presence of water. Pan
et.al. reported a NiO/InTaO4 system capable of converting CO2 to CH3OH.69 InTaO4
was synthesized by a high temperature reaction between In2O3 and Ta2O5 with nickel
deposited by a solution-calcination method to give the most active hybrid catalysts.
Gallium oxide in the alpha polymorph has been shown to have good affinity towards
CO2 due to its surface OH groups.73 Its CB potential is also sufficiently reductive and so
Park et.al. prepared mesoporous gallium oxide and evaluated its activity for CH4
production compared to a commercial sample. A fivefold improvement was noted which
the authors correlated to better CO2 adsorption due to the larger surface area of the
porous sample. Cu2O is another very attractive material with an optimal bandgap which
has been studied for water splitting.74 Unfortunately it exhibits poor charge diffusion
properties and photocorrosion in aqueous solution.75 One of the few reports on Cu2O
used in CO2 reduction was published by Li and co-workers in 2011.76 SiC particles
decorated with Cu2O produced methanol from CO2 under visible light illumination at

18
higher rates than the separate components although the synergistic effect was not well
understood. Oxides such as the ones discussed above are typically simple to
synthesize as high surface area nanostructures and are chemically stable under the
reaction conditions of artificial photosynthesis. Combined with the ongoing
improvements in their catalytic performance, oxides may be the most promising material
for finding solutions to the CO2 reduction challenge on a global scale.
Sulfides such as CdS and ZnS have historically been widely employed as
photocatalysts due to their narrower bandgaps and well-studied uses as colored
pigments. Their VB edges consist of S 3p orbitals which are shifted to more negative
potentials than the corresponding oxides resulting in broader light absorption. As stated
earlier, perhaps their greatest drawback is the tendency of the sulfide anion to undergo
oxidative photocorrosion, which can be ameliorated by using sacrificial reducing agents.
Zinc sulfide is a wide band semiconductor with an energy gap of 3.6 eV and a CB edge
situated at -1.8 V vs NHE at pH 7.10 It has been shown to be capable of reducing CO2 to
formate and carbon monoxide in respectable photonic quantum yields. Henglein et. al.
looked at colloidal ZnS particles in the presence of alcohol scavengers and found that
the photogenerated charge carriers reacted with the various scavengers on a faster
time scale than charge recombination.77 Small 2-5 nm ZnS crystallites also showed
activity for formate production and competitive H2 evolution from CO2 saturated
aqueous solutions.78 Activity was attributed to low densities of surface defects and the
authors found that addition of Na2S as a suppressor of sulfur vacancies improved
product formation rates. A contrasting result was reported by Fujiwara et. al. who found
that sulfur vacancies cause an increase in activity when using CdS nanocrystals as
catalysts.79 The addition of excess Cd2+ created S vacancies on the particle surface due
to adsorption of extra Cd2+ cations. The S vacancies then provided sites for CO2
coordination and subsequent reduction to CO. ZnS particles have also been loaded
onto large surface area SiO2 supports, with the best results being obtained for a 13% by
weight sample.80 Addition of a Pt co-catalyst resulted in production of formaldehyde and
methanol as opposed to the 2e- product formate in the absence of Pt.80 The cooperative
interaction of both sulfides has also been investigated by Kisch et. al. who loaded CdS
particles onto ZnS supports.81 A 5 % CdS loading was found to increase activity 16-fold

19
compared to unmodified ZnS with the improvement attributed to higher charge
separation efficiency in the coupled semiconductor system. CdS, which has a
significantly narrower bandgap (2.6 eV) than ZnS and a more positive CB edge (-0.9 V
vs NHE), was used to reduce CO2 to CO under visible light irradiation using
triethylamine as hole scavenger. With recent advances in nano metal chalcogenide
synthetic techniques, some more sophisticated systems have been explored. For
example, CdS particles were dispersed on the inorganic clay montmorillonite and the
resulting composites showed activity for CH4 and CO production from CO2 dissolved in
NaOH(aq).82 More recently, Armstrong et.al. functionalized the surface of CdS
nanocrystals with an enzyme – carbon monoxide dehydrogenase – and observed CO
production from CO2 under visible light illumination.83 It was found that larger CdS
particles showed no activity due to grain boundaries acting as recombination centers
while the nature of the sacrificial electron donors also had an effect on the rates. In
2014, Nocera and co-workers reported a hybrid bioelectrochemical device where H2
and O2 generated from water splitting using cobalt phosphate and NiMoZn alloy as the
electrodes were combined with CO2 and converted into hydrocarbons by the genetically
engineered bacterium R. Eutropha.84 Other sulfides have received some attention
including MnS which was found to reduce bicarbonate to formate, acetate, and
propionate in solution with a quantum efficiency of 4.2%.85 The authors proposed that
MnS and related minerals may have been responsible for pre-biotic syntheses of carbon
based biomolecules. Bismuth sulfide, Bi2S3 possesses a very narrow bandgap of 1.3 eV
that renders it an attractive solar absorber. When used in conjunction with CdS,
Bi2S3/CdS composites exhibited activity for methanol production, with the highest rates
obtained for 15% Bi2S3 loading. Complex metal sulfides such as CuxAgyInzZnkSm where
the bandgap can be tuned based on the stoichiometric ratio of the various components
have also been explored.86 Decoration of the sulfide with catalytic amounts of RuO2
produced methanol although H2 was employed as the reducing agent instead of H2O. A
similar system was reported by Arai et. al. who used a Cu2ZnSnS4 (CZTS)
semiconductor as the light absorber modified with a Ru-based polymer.87 Electron
transfer from CZTS to the catalyst initiated CO2 reduction with preference over H2O
reduction, however an external bias was used to prevent photo-oxidation.87 As

20
evidenced by the work above, metal sulfides may still play an important part of artificial
photosynthetic systems going forward, particularly in the role of broad solar absorbers
decorated with active metallic co-catalysts.
Metal nitrides and phosphides have also been studied for CO2 reduction
applications, although to a lesser extent than the oxides or sulfides. Nitrides and
phosphides suffer from some of the same issues associated with metal sulfides
including oxygen and moisture sensitivity, and susceptibility to photocorrosion.
Nevertheless, gallium phosphide (GaP) is a very attractive material due to its optimal
bandgap of 2.3eV and highly reducing conduction band edge.88 Some of the earliest
works in the field such as those by Halmann and Inoue looked at GaP electrodes and
found them to be more active than TiO2 or ZnO electrodes under illumination.28,29 More
recently, Barton et.al. used GaP as an electrode in a photoelectrochemical cell for
CH3OH production from CO2 employing pyridine as a homogeneous co-catalyst.89,90
The selectivity of the process for CH3OH was remarkably high, nearing 100%, a factor
which was ascribed to pyridine/pyridinium acting as a one-electron shuttle to
sequentially transfer six electrons from GaP to CO2. Yang and co-workers have recently
reported the synthesis of large scale GaP nanowire arrays by a low cost VLS approach
that could offer an alternative to expensive single crystals of GaP.91,92
Indium phosphide (InP) is another material with a favourable bandgap that was
explored in early work by Canfield et.al.93 Sato and co-workers recently employed an
InP electrode modified with a molecular Ru complex to reduce CO2 to formate in an
electrochemical cell.94 The same authors then expanded this system by coupling the
InP/Ru cathode to a TiO2 based anode to perform the overall process of CO2 reduction
and H2O oxidation.95 Formate production was achieved at a conversion efficiency of
0.03% without an external bias, and while the efficiency is quite low, the authors
confirmed via isotope experiments that CO2 and H2O were indeed the carbon and
proton sources.95
Metal nitrides are most commonly applied as solid solutions in the form of oxide-
nitride alloys such as (Zn1+xGe)(N2Ox) and (Ga1-xZnx)(N1-xOx).96–98 The nitrogen serves
to introduce states inside the bandgap of the wider gap oxide materials thereby
narrowing it and improving light absorption. Oxynitrides such as TiO2-xNx and TaON

21
have also received attention and shown that they are capable of reducing CO2 to
methane and formate respectively.99,100 In the first case, the titanium oxynitride was
prepared from Cu3N nanocube templates that were oxidized to CuO, and the released
nitrogen was incorporated into a TiO2 coating to give the oxynitride. The resulting CuO-
TiO2-xNx catalysts produced methane under solar irradiation at competitive rates even
without noble metal co-catalysts. TaON was used as the semiconductor scaffold in a Z-
scheme type arrangement with organometallic Ru-complexes acting as sensitizer and
reduction catalyst.99 Another interesting material that has garnered a lot of attention
recently is the polymeric carbon nitride, C3N4.101,102 Although not strictly a metal nitride,
its visible light absorption and graphitic structure have attracted researchers, as has the
earth-abundance of its constituent elements. The graphitic C3N4 materials are usually
prepared by high temperature pyrolysis of organic compounds such as urea, melamine
or cyanamide.103–105 The graphitic structure enhances charge migration across the
planar C3N4 sheets and facilitates deposition of co-catalysts that can enhance rates
even further.106
This section has presented a brief overview of the historical and state-of-the-art
advances in artificial photosynthesis and specifically CO2 reduction. The latest focus in
the field is on developing low-cost materials with novel architectures to minimize charge
recombination and protect against degradation. Current state of the art efficiencies are
not high enough to make the process commercially viable, however the field is receiving
increasing global interest and the current pace of development bodes well for significant
breakthroughs in the near future. A more thorough outlook on the future of the field and
opportunities for advancement is given in Chapter 6. Finally, it should be noted that
some of the results presented in this section should be viewed with an abundance of
caution. The detection of carbon containing products such as CO, CH3OH, or CH4 has
historically been taken as sufficient evidence for CO2 reduction. However, isotope
labelling studies with 13CO2 have shown that in some cases carbon contamination
residual to the photocatalyst surface is the source of the products detected and not the
desired 13CO2.107,108 Care must be taken to eliminate residual carbon contamination
during the preparation of the catalysts and isotope labelling experiments are
indispensable in determining the carbon source of the detected products.

22
1.4 Focus of This Thesis
Having given an overview of artificial photosynthesis and a brief literature review,
this section will provide a summary description of the work contained in this thesis,
especially focusing on the motivations and over-arching ideas tying the different
chapters together.
The main topic of this thesis is the synthesis, characterization, and investigation
of the photocatalytic properties of earth-abundant metal oxide nanomaterials for solar
fuel production. Much of our motivation for focusing on low cost, abundant materials and
processes was based on the fact that the artificial photosynthesis challenge is global in
nature and any significant breakthroughs would need to make sense from an economic
point of view. We acknowledge that there are alternatives to this approach; developing
high-cost, high-efficiency renewable technologies for suitable applications is another
viable option. To give an example, organic solar cells are a massive topic of research
because the solubility of the active layers allows the cells to be solution-processed by
spin or spray coating at low costs.109 Typical laboratory organic photovoltaics are in the
range of 5-10% efficient at converting solar energy into electricity.110 In comparison,
triple junction solar cells based on III-IV semiconductors have achieved efficiencies of
over 44% under concentrated sunlight.111 These technologies are prohibitively
expensive for large scale implementation, but can find specific applications where cost
is not the primary concern. Similar trade-offs will be encountered in the field of artificial
photosynthesis as improving efficiencies clash with the higher costs of noble metal
catalysts or reaction conditions i.e. high temperatures, pressures, solar concentration
etc. The majority of the work in this thesis is based on materials that currently perform
poorly for solar fuel production but have the potential to be interesting if certain
fundamental challenges are solved. A further distinguishing characteristic of this work is
our focus on gas-phase heterogeneous CO2 reduction as opposed to catalyst
suspensions in CO2 saturated aqueous solutions. Working in the gas-phase allows us to
use high reactant pressures and circumvent the low solubility are correspondingly low
conversion rates of CO2 in water. We also believe that gas-solid heterogeneous
processes will ultimately prove to be safer and easier to implement when applied at

23
industrial scales. We therefore focus on the hydrogenation of CO2 to hydrocarbons such
as methane or methanol in the form of the well-known Sabatier and Reverse-Water-
Gas-Shift (RWGS) reactions, Equations 1.8 and 1.9:
CO2 + 4 H2 → CH4 + 2 H2O (1.8)
CO2 + H2 CO + H2O (1.9)
These reactions are currently driven thermochemically at temperatures on the
order of a few hundred degrees Celsius. Here we attempt to lower the energy demands
of these processes by using sunlight to lower the required reaction temperatures.
Occasionally we do explore aqueous H2 evolution experiments as a preliminary test to
gauge the activity of potential catalysts since H2 evolution imposes many of the same
material property requirements as CO2 reduction.
Generally, each of the following chapters begins with a sub-intro section
providing the reader with background and motivation behind the research. We then
report the synthetic preparation of the materials, followed by structural characterization
and any applicable catalytic performance testing for CO2 reduction or H2 evolution.
Chapters 2 and 3 detail our work on Fe2O3/Cu2O heteronanocrystals (HNCs). In
Chapter 2, we introduce the concept of HNCs and explain how hetero-structuring could
be useful for solar fuel production. The synthesis of the separate component
nanocrystals is presented first, followed by the newly-developed synthesis of the hetero-
nanocrystals. Chapter 3 exhibits the XPS/UPS surface studies of the HNCs, along with
gas-phase CO2 reduction results, ligand removal and liquid phase dye degradation
experiments. All of Chapter 2 and parts of Chapter 3 were published in J. Mater. Chem.
A, 2014, 2, 8525-8533. The following is a list of experimental contributions related to
those chapters:
Nanocrystal synthesis, characterization, and data analysis – Peter
Mirtchev with assistance from Elizabeth Jaluague
Photoelectron spectroscopy – Kristine Liao
STEM/EELS imaging – Qiao Qiao
Surface photovoltage spectroscopy – Zongkai Wu

24
Raman spectroscopy – Peter Mirtchev with assistance from Yao Tian
PI’s – Maria Varela, Kenneth Burch, Stephen Pennycook, Doug Perovic,
and Geoffrey Ozin
Chapter 4 is based on unpublished work on Cu2O nanocubes as a
semiconducting platform for deposition of metal co-catalysts and subsequent H2
evolution experiments from solution with sacrificial reducing agents. Chapter 5 presents
unpublished work on developing mixed iron & copper oxide delafossites (CuFeO2) and
spinels (CuFe2O4) for light-assisted CO2 hydrogenation. Experimental contributions
related to these two chapters are as follows:
Nanomaterial synthesis, characterization and data analysis – Peter
Mirtchev
Photoelectron spectroscopy – Kristine Liao
Gas-phase CO2 hydrogenation and diffuse reflectance – Paul O’Brien
Aqueous phase hole scavenger experiments – Peter Mirtchev with
assistance from Veronika Hoepfner
Ball milling – Navid Soheilnia
Chapter 6 serves as a concluding summary of the work and a discussion of
future directions in developing materials for artificial photosynthesis.
1.5 References
(1) Faunce, T. A.; Lubitz, W.; Rutherford, A. W.; MacFarlane, D.; Moore, G. F.; Yang, P.; Nocera, D. G.; Moore, T. A.; Gregory, D. H.; Fukuzumi, S.; et al. Energy and Environment Policy Case for a Global Project on Artificial Photosynthesis. Energy Environ. Sci. 2013, 6, 695.
(2) Lewis, N. S.; Nocera, D. G. Powering the Planet: Chemical Challenges in Solar Energy Utilization. Proc. Natl. Acad. Sci. U. S. A. 2006, 103, 15729–15735.
(3) Zhou, H.; Qu, Y.; Zeid, T.; Duan, X. Towards Highly Efficient Photocatalysts Using Semiconductor Nanoarchitectures. Energy Environ. Sci. 2012, 5, 6732.
(4) Gust, D.; Moore, T. A.; Moore, A. L. Solar Fuels via Artificial Photosynthesis. Acc. Chem. Res. 2009, 42, 1890–1898.

25
(5) Roy, S. C.; Varghese, O. K.; Paulose, M.; Grimes, C. A. Toward Solar Fuels : Photocatalytic Hydrocarbons. ACS Nano 2010, 4, 1259–1278.
(6) Barber, J. Photosynthetic Energy Conversion: Natural and Artificial. Chem. Soc. Rev. 2009, 38, 185–196.
(7) Gray, H. B. Powering the Planet with Solar Fuel. Nat. Chem. 2009, 1, 112.
(8) Royal Society of Chemistry. Solar Fuels and Artificial Photosynthesis; 2012.
(9) Turner, J. The Other Half of the Equation. Nat. Mater. 2008, 7, 770–771.
(10) Habisreutinger, S. N.; Schmidt-Mende, L.; Stolarczyk, J. K. Photocatalytic Reduction of CO2 on TiO2 and Other Semiconductors. Angew. Chemie - Int. Ed. 2013, 52, 7372–7408.
(11) Chen, X.; Mao, S. S. Titanium Dioxide Nanomaterials: Synthesis, Properties, Modifications and Applications. Chem. Rev. 2007, 107, 2891–2959.
(12) Liu, C.; Dasgupta, N. P.; Yang, P. Semiconductor Nanowires for Artificial Photosynthesis. Chem. Mater. 2014, 26, 415–422.
(13) Serpone, N.; Lawless, D.; Khairutdinov, R. Size Effects on the Photophysical Properties of Colloidal Anatase TiO2 Particles: Size Quantization versus Direct Transitions in This Indirect Semiconductor? J. Phys. Chem. 1995, 99, 16646–16654.
(14) Kubacka, A.; Fernández-García, M.; Colón, G. Advanced Nanoarchitectures for Solar Photocatalytic Applications. Chem. Rev. 2012, 112, 1555–1614.
(15) Chen, X.; Shen, S.; Guo, L.; Mao, S. S. Semiconductor-Based Photocatalytic Hydrogen Generation. Chem. Rev. (Washington, DC, United States) 2010, 110, 6503–6570.
(16) Wood, A.; Giersig, M.; Mulvaney, P. Fermi Level Equilibration in Quantum Dot-Metal Nanojunctions. J. Phys. Chem. B 2001, 105, 8810–8815.
(17) Kim, S.; Hwang, S. J.; Choi, W. Visible Light Active Platinum-Ion-Doped TiO2 Photocatalyst. J. Phys. Chem. B 2005, 109, 24260–24267.
(18) Bardeen, J. Surface States and Rectification at a Metal Semi-Conductor Contact. Phys. Rev. 1947, 71, 717–727.
(19) Kudo, A.; Miseki, Y. Heterogeneous Photocatalyst Materials for Water Splitting. Chem. Soc. Rev. 2009, 38, 253–278.

26
(20) Wang, J.; Tsuzuki, T.; Sun, L.; Wang, X. Reverse Microemulsion-Mediated Synthesis of SiO2-Coated ZnO Composite Nanoparticles: Multiple Cores with Tunable Shell Thickness. ACS Appl. Mater. Interfaces 2010, 2, 957–960.
(21) Vaidya, S.; Patra, A.; Ganguli, A. K. CdS@TiO2 and ZnS@TiO2 Core-Shell Nanocomposites: Synthesis and Optical Properties. Colloids Surfaces A Physicochem. Eng. Asp. 2010, 363, 130–134.
(22) Dimitrijevic, N. M.; Vijayan, B. K.; Poluektov, O. G.; Rajh, T.; Gray, K. A.; He, H.; Zapol, P. Role of Water and Carbonates in Photocatalytic Transformation of CO2 to CH4 on Titania. J. Am. Chem. Soc. 2011, 133, 3964–3971.
(23) Lee, J.; Sorescu, D. C.; Deng, X. Electron-Induced Dissociation of CO2 on TiO2(110). J. Am. Chem. Soc. 2011, 133, 10066–10069.
(24) Koppenol, W. H.; Rush, J. D. Reduction Potential of the Carbon Dioxide/Carbon Dioxide Radical Anion: A Comparison with Other C1 Radicals. J. Phys. Chem. 1987, 91, 4429–4430.
(25) Rasko, J.; Solymosi, F. Infrared Spectroscopic Study of the Photoinduced Activation of CO2 on TiO2 and Rh/TiO2 Catalysts. J. Phys. Chem. 1994, 98, 7147–7152.
(26) Gattrell, M.; Gupta, N.; Co, A. A Review of the Aqueous Electrochemical Reduction of CO2 to Hydrocarbons at Copper. J. Electroanal. Chem. 2006, 594, 1–19.
(27) Fujishima, A; Honda, K. Electrochemical Photolysis of Water at a Semiconductor Electrode. Nature 1972, 238, 37–38.
(28) Halmann, M. Photoelectrochemical Reduction of Aqueous Carbon Dioxide on P-Type Gallium Phosphide in Liquid Junction Solar Cells. Nature 1978, 275, 115–116.
(29) Inoue, T.; Fujishima, A.; Konishi, S.; Honda, K. Photoelectrocatalytic Reduction of Carbon Dioxide in Aqueous Suspensions of Semiconductor Powders. Nature, 1979, 277, 637–638.
(30) Tu, W.; Zhou, Y.; Zou, Z. Photocatalytic Conversion of CO2 into Renewable Hydrocarbon Fuels: State-of-the-Art Accomplishment, Challenges, and Prospects. Adv. Mater. 2014, 26, 4607–4626.
(31) Maeda, K.; Domen, K. New Non-Oxide Photocatalysts Designed for Overall Water Splitting under Visible Light. J. Phys. Chem. C 2007, 111, 7851–7861.

27
(32) Tachikawa, T.; Fujitsuka, M.; Majima, T. Mechanistic Insight into the TiO2 Photocatalytic Reactions: Design of New Photocatalysts. J. Phys. Chem. C 2007, 111, 5259–5275.
(33) Indrakanti, V. P.; Kubicki, J. D.; Schobert, H. H. Photoinduced Activation of CO2 on Ti-Based Heterogeneous Catalysts: Current State, Chemical Physics-Based Insights and Outlook. Energy Environ. Sci. 2009, 2, 745–758.
(34) Hernandez-Alonso, M. D.; Fresno, F.; Suarez, S.; Coronado, J. M. Development of Alternative Photocatalysts to TiO2: Challenges and Opportunities. Energy Environ. Sci. 2009, 2, 1231–1257.
(35) Jing, L.; Li, S.; Song, S.; Xue, L.; Fu, H. Investigation on the Electron Transfer between Anatase and Rutile in Nano-Sized TiO2 by Means of Surface Photovoltage Technique and Its Effects on the Photocatalytic Activity. Sol. Energy Mater. Sol. Cells 2008, 92, 1030–1036.
(36) Saladin, F.; Alxneit, I. Temperature Dependence of the Photochemical Reduction of CO2 in the Presence of H2O at the Solid/gas Interface of TiO2. J. Chem. Soc. Faraday Trans. 1997, 93, 4159–4163.
(37) Kaneco, S.; Kurimoto, H.; Ohta, K.; Mizumo, T.; Saji, A. Photocatalytic Reduction of CO2 Using TiO2 Powders in Liquid CO2 Medium. J. Photochem. Photobiol. A Chem. 1997, 109, 59–63.
(38) Kaneco, S.; Shimizu, Y.; Ohta, K.; Mizuno, T. Photocatalytic Reduction of High Pressure Carbon Dioxide Using TiO2 Powders with a Positive Hole Scavenger. J. Photochem. Photobiol. A Chem. 1998, 115, 223–226.
(39) Ku, Y.; Lee, W.-H.; Wang, W.-Y. Photocatalytic Reduction of Carbonate in Aqueous Solution by UV/TiO2 Process. J. Mol. Catal. A Chem. 2004, 212, 191–196.
(40) Mizuno, T.; Adachi, K.; Ohta, K.; Saji, A. Effect of CO2 Pressure on Photocatalytic Reduction of CO2 Using TiO2 in Aqueous Solutions. J. Photochem. Photobiol. A Chem. 1996, 98, 87–90.
(41) Kaneco, S.; Kurimoto, H.; Shimizu, Y.; Ohta, K.; Mizuno, T. Photocatalytic Reduction of CO2 Using TiO2 Powders in Supercritical Fluid CO2. Energy (Oxford) 1998, 24, 21–30.
(42) Liu, B.-J.; Torimoto, T.; Matsumoto, H.; Yoneyama, H. Effect of Solvents on Photocatalytic Reduction of Carbon Dioxide Using TiO2 Nanocrystal Photocatalyst Embedded in SiO2 Matrixes. J. Photochem. Photobiol. A Chem. 1997, 108, 187–192.

28
(43) Liu, B.-J.; Torimoto, T.; Yoneyama, H. Photocatalytic Reduction of Carbon Dioxide in the Presence of Nitrate Using TiO2 Nanocrystal Photocatalyst Embedded in SiO2 Matrixes. J. Photochem. Photobiol. A Chem. 1998, 115, 227–230.
(44) Subrahmanyam, M.; Kaneco, S.; Alonso-Vante, N. A Screening for the Photoreduction of Carbon Dioxide Supported on Metal Oxide Catalysts for C1-C3 Selectivity. Appl. Catal. B Environ. 1999, 23, 169–174.
(45) Adachi, K.; Ohta, K.; Mizuno, T. Photocatalytic Reduction of Carbon Dioxide to Hydrocarbon Using Copper-Loaded Titanium Dioxide. Sol. Energy 1994, 53, 187–190.
(46) Slamet; Nasution, H. W.; Purnama, E.; Kosela, S.; Gunlazuardi, J. Photocatalytic Reduction of CO2 on Copper-Doped Titania Catalysts Prepared by Improved-Impregnation Method. Catal. Commun. 2005, 6, 313–319.
(47) Tseng, I.-H.; Chang, W.-C.; Wu, J. C. S. Photoreduction of CO2 Using Sol-Gel Derived Titania and Titania-Supported Copper Catalysts. Appl. Catal. B Environ. 2002, 37, 37–48.
(48) Tseng, I.-H.; Wu, J. C. S.; Chou, H.-Y. Effects of Sol-Gel Procedures on the Photocatalysis of Cu/TiO2 in CO2 Photoreduction. J. Catal. 2004, 221, 432–440.
(49) Tseng, I.-H.; Wu, J. C.-S. Chemical States of Metal-Loaded Titania in the Photoreduction of CO2. Catal. Today 2004, 97, 113–119.
(50) Xie,T.-f.; Wang,D.-j.; Zhu,L.-j.; Li,T.-j.; Xu,Y.-j. Application of Surface Photovoltage Technique in Photocatalysis Studies on Modified TiO2 Photocatalysts for Photo-Reduction of CO2. Mater. Chem. Phys. 2001, 70, 103–106.
(51) Yui, T.; Kan, A.; Saitoh, C.; Koike, K.; Ibusuki, T.; Ishitani, O. Photochemical Reduction of CO2 Using TiO2: Effects of Organic Adsorbates on TiO2 and Deposition of Pd onto TiO2. ACS Appl. Mater. Interfaces 2011, 3, 2594–2600.
(52) Koci, K.; Obalova, L.; Solcova, O. Kinetic Study of Photocatalytic Reduction of CO2 over TiO2. Inz. Chem. i Proces. 2010, 31, 395–407.
(53) Krejcikova, S.; Matejova, L.; Koci, K.; Obalova, L.; Matej, Z.; Capek, L.; Solcova, O. Preparation and Characterization of Ag-Doped Crystalline Titania for Photocatalysis Applications. Appl. Catal. B Environ. 2012, 111-112, 119–125.
(54) Liu, Z.; Hou, W.; Pavaskar, P.; Aykol, M.; Cronin, S. B. Plasmon Resonant Enhancement of Photocatalytic Water Splitting Under Visible Illumination. Nano Lett. 2011, 11, 1111–1116.

29
(55) O’Regan, B.; Grätzel, M. A Low-Cost, High-Efficiency Solar Cell Based on Dye-Sensitized Colloidal TiO2 Films. Nature 1991, 353, 737–740.
(56) Nguyen, T.-V.; Wu, J. C. S.; Chiou, C.-H. Photoreduction of CO2 over Ruthenium Dye-Sensitized TiO2-Based Catalysts under Concentrated Natural Sunlight. Catal. Commun. 2008, 9, 2073–2076.
(57) Nguyen, T.-V.; Wu, J. C. S. Photoreduction of CO2 in an Optical-Fiber Photoreactor: Effects of Metals Addition and Catalyst Carrier. Appl. Catal. A Gen. 2008, 335, 112–120.
(58) Woolerton, T. W.; Sheard, S.; Reisner, E.; Pierce, E.; Ragsdale, S. W.; Armstrong, F. A. Efficient and Clean Photoreduction of CO2 to CO by Enzyme-Modified TiO2 Nanoparticles Using Visible Light. J. Am. Chem. Soc. 2010, 132, 2132–2133.
(59) Liu, S.; Zhao, Z.; Wang, Z. Photocatalytic Reduction of Carbon Dioxide Using Sol-Gel Derived Titania-Supported CoPc Catalysts. Photochem. Photobiol. Sci. 2007, 6, 695–700.
(60) Wu, J. C. S.; Lin, H.-M.; Lai, C.-L. Photo Reduction of CO2 to Methanol Using Optical-Fiber Photoreactor. Appl. Catal. A Gen. 2005, 296, 194–200.
(61) Saladin, F.; Forss, L.; Kamber, I. Photosynthesis of CH4 at a TiO2 Surface from Gaseous H2O and CO2. J. Chem. Soc. Chem. Commun. 1995, 533–534.
(62) Fu, Y.; Sun, D.; Chen, Y.; Huang, R.; Ding, Z.; Fu, X.; Li, Z. An Amine-Functionalized Titanium Metal-Organic Framework Photocatalyst with Visible-Light-Induced Activity for CO2 Reduction. Angew. Chemie - Int. Ed. 2012, 51, 3364–3367.
(63) Anpo, M.; Chiba, K. Photocatalytic Reduction of Carbon Dioxide on Anchored Titanium Oxide Catalysts. J. Mol. Catal. 1992, 74, 207–212.
(64) Anpo, M.; Takeuchi, M. The Design and Development of Highly Reactive Titanium Oxide Photocatalysts Operating under Visible Light Irradiation. J. Catal. 2003, 216, 505–516.
(65) Wang, C.; Thompson, R. L.; Baltrus, J.; Matranga, C. Visible Light Photoreduction of CO2 Using CdSe/Pt/TiO2 Heterostructured Catalysts. J. Phys. Chem. Lett. 2010, 1, 48–53.
(66) Navalón, S.; Dhakshinamoorthy, A.; Álvaro, M.; Garcia, H. Photocatalytic CO2 Reduction Using Non-Titanium Metal Oxides and Sulfides. ChemSusChem 2013, 6, 562–577.

30
(67) Xi, G.; Ouyang, S.; Li, P.; Ye, J.; Ma, Q.; Su, N.; Bai, H.; Wang, C. Ultrathin W18O49 Nanowires with Diameters below 1 nm: Synthesis, Near-Infrared Absorption, Photoluminescence, and Photochemical Reduction of Carbon Dioxide. Angew. Chemie, Int. Ed. 2012, 51, 2395–2399, S2395/1–S2395/9.
(68) Cheng, H.; Huang, B.; Liu, Y.; Wang, Z.; Qin, X.; Zhang, X.; Dai, Y. An Anion Exchange Approach to Bi2WO6 Hollow Microspheres with Efficient Visible Light Photocatalytic Reduction of CO2 to Methanol. Chem. Commun. 2012, 48, 9729.
(69) Pan, P.-W.; Chen, Y.-W. Photocatalytic Reduction of Carbon Dioxide on NiO/InTaO4 under Visible Light Irradiation. Catal. Commun. 2007, 8, 1546–1549.
(70) Shi, H.; Wang, T.; Chen, J.; Zhu, C.; Ye, J.; Zou, Z. Photoreduction of Carbon Dioxide Over NaNbO3 Nanostructured Photocatalysts. Catal. Letters 2011, 141, 525–530.
(71) Shi, H.; Zou, Z. Photophysical and Photocatalytic Properties of ANbO3 (A = Na, K) Photocatalysts. J. Phys. Chem. Solids 2012, 73, 788–792.
(72) Liu, Q.; Zhou, Y.; Kou, J.; Chen, X.; Tian, Z.; Gao, J.; Yan, S.; Zou, Z. High-Yield Synthesis of Ultralong and Ultrathin Zn2GeO4 Nanoribbons toward Improved Photocatalytic Reduction of CO2 into Renewable Hydrocarbon Fuel. J. Am. Chem. Soc. 2010, 132, 14385–14387.
(73) Calatayud, M.; Collins, S. E.; Baltanas, M. A.; Bonivardi, A. L. Stability of Formate Species on Β-Ga2O3. Phys. Chem. Chem. Phys. 2009, 11, 1397–1405.
(74) Morales-Guio, C. G.; Tilley, S. D.; Vrubel, H.; Grätzel, M.; Hu, X. Hydrogen Evolution from a Copper(I) Oxide Photocathode Coated with an Amorphous Molybdenum Sulphide Catalyst. Nat. Commun. 2014, 5, 3059.
(75) Zhang, Z.; Dua, R.; Zhang, L.; Zhu, H.; Zhang, H.; Wang, P. Carbon-Layer-Protected Cuprous Oxide Nanowire Arrays for Efficient Water Reduction. ACS Nano 2013, 7, 1709–1717.
(76) Li, H.; Lei, Y.; Huang, Y.; Fang, Y.; Xu, Y.; Zhu, L.; Li, X. Photocatalytic Reduction of Carbon Dioxide to Methanol by Cu2O/SiC Nanocrystallite under Visible Light Irradiation. J. Nat. Gas Chem. 2011, 20, 145–150.
(77) Henglein, A.; Gutierrez, M.; Fischer, C. H. Photochemistry of Colloidal Metal Sulfides. 6. Kinetics of Interfacial Reactions at Zinc Sulfide Particles. Berichte der Bunsen-Gesellschaft 1984, 88, 170–175.
(78) Kanemoto, M.; Shiragami, T.; Pac, C.; Yanagida, S. Semiconductor Photocatalysis. 13. Effective Photoreduction of Carbon Dioxide Catalyzed by Zinc

31
Sulfide Quantum Crystallites with Low Density of Surface Defects. J. Phys. Chem. 1992, 96, 3521–3526.
(79) Fujiwara, H.; Hosokawa, H.; Murakoshi, K.; Wada, Y.; Yanagida, S.; Okada, T.; Kobayashi, H. Effect of Surface Structures on Photocatalytic CO2 Reduction Using Quantized CdS Nanocrystallites. J. Phys. Chem. B 1997, 101, 8270–8278.
(80) Johne, P.; Kisch, H. Photoreduction of Carbon Dioxide Catalyzed by Free and Supported Zinc- and Cadmium Sulfide Powders. J. Photochem. Photobiol. A Chem. 1997, 111, 223–228.
(81) Kisch, H.; Lutz, P. Photoreduction of Bicarbonate Catalyzed by Supported Cadmium Sulfide. Photochem. Photobiol. Sci. 2002, 1, 240–245.
(82) Praus, P.; Kozak, O.; Koci, K.; Panacek, A.; Dvorsky, R. CdS Nanoparticles Deposited on Montmorillonite: Preparation, Characterization and Application for Photoreduction of Carbon Dioxide. J. Colloid Interface Sci. 2011, 360, 574–579.
(83) Chaudhary, Y. S.; Woolerton, T. W.; Allen, C. S.; Warner, J. H.; Pierce, E.; Ragsdale, S. W.; Armstrong, F. a. Visible Light-Driven CO2 Reduction by Enzyme Coupled CdS Nanocrystals. Chem. Commun. 2012, 48, 58.
(84) Gagliardi, C. J.; Chen, J. S.; Bediako, D. K.; Colón, B.; Way, J. C.; Silver, P. A.; Daniel, G.; Torella, J. P.; Gagliardi, C. J.; Chen, J. S.; et al. Efficient Solar-to-Fuels Production from a Hybrid Microbial–water-Splitting Catalyst System. Proc. Natl. Acad. Sci. 2015, 112, 201503606.
(85) Zhang, X. V; Martin, S. T.; Friend, C. M.; Schoonen, M. A. A.; Holland, H. D. Mineral-Assisted Pathways in Prebiotic Synthesis: Photoelectrochemical Reduction of Carbon(+IV) by Manganese Sulfide. J. Am. Chem. Soc. 2004, 126, 11247–11253.
(86) Liu, J.-Y.; Garg, B.; Ling, Y.-C. CuxAgyInzZnkSm Solid Solutions Customized with RuO2 or Rh1.32Cr0.66O3 Co-Catalyst Display Visible Light-Driven Catalytic Activity for CO2 Reduction to CH3OH. Green Chem. 2011, 13, 2029–2031.
(87) Arai, T.; Tajima, S.; Sato, S.; Uemura, K.; Morikawa, T.; Kajino, T. Selective CO2 Conversion to Formate in Water Using a CZTS Photocathode Modified with a Ruthenium Complex Polymer. Chem. Commun. (Cambridge, United Kingdom) 2011, 47, 12664–12666.
(88) Aurian-Blajeni, B.; Halmann, M.; Manassen, J. Electrochemical Measurement on the Photoelectrochemical Reduction of Aqueous Carbon Dioxide on P-Gallium Phosphide and P-Gallium Arsenide Semiconductor Electrodes. Sol. Energy Mater. 1983, 8, 425–440.

32
(89) Barton, E. E.; Rampulla, D. M.; Bocarsly, A. B. Selective Solar-Driven Reduction of CO2 to Methanol Using a Catalyzed P-GaP Based Photoelectrochemical Cell. J. Am. Chem. Soc. 2008, 130, 6342–6344.
(90) Morris, A. J.; McGibbon, R. T.; Bocarsly, A. B. Electrocatalytic Carbon Dioxide Activation: The Rate-Determining Step of Pyridinium-Catalyzed CO2 Reduction. ChemSusChem 2011, 4, 191–196.
(91) Sun, J.; Liu, C.; Yang, P. Communication of Gallium Phosphide Nanowires and Their Use for Visible- Light-Driven Hydrogen Production from Water Reduction Growth of Gallium Phosphide Nanowires and Their Use for Visible-Light-Driven Hydrogen Production from Water Reduction. 2011, 19306–19309.
(92) Liu, C.; Sun, J.; Tang, J.; Yang, P. Zn-Doped P-Type Gallium Phosphide Nanowire Photocathodes from a Surfactant-Free Solution Synthesis. Nano Lett. 2012, 12, 5407–5411.
(93) Canfield, D. Reduction of Carbon Dioxide to Methanol on N- and P-GaAs and P-InP. Effect of Crystal Face, Electrolyte and Current Density. J. Electrochem. Soc. 1983, 130, 1772.
(94) Arai, T.; Sato, S.; Uemura, K.; Morikawa, T.; Kajino, T.; Motohiro, T. Photoelectrochemical Reduction of CO2 in Water under Visible-Light Irradiation by a P-Type InP Photocathode Modified with an Electropolymerized Ruthenium Complex. Chem. Commun. (Cambridge, United Kingdom) 2010, 46, 6944–6946.
(95) Sato, S.; Arai, T.; Morikawa, T.; Uemura, K.; Suzuki, T. M.; Tanaka, H.; Kajino, T. Selective CO2 Conversion to Formate Conjugated with H2O Oxidation Utilizing Semiconductor/Complex Hybrid Photocatalysts. J. Am. Chem. Soc. 2011, 133, 15240–15243.
(96) Yan, S.; Yu, H.; Wang, N.; Li, Z.; Zou, Z. Efficient Conversion of CO2 and H2O into Hydrocarbon Fuel over ZnAl2O4-Modified Mesoporous ZnGaNO under Visible Light Irradiation. Chem. Commun. 2012, 48, 1048.
(97) Zhang, N.; Ouyang, S.; Kako, T.; Ye, J. Mesoporous Zinc Germanium Oxynitride for CO2 Photoreduction under Visible Light. Chem. Commun. 2012, 48, 1269.
(98) Liu, Q.; Zhou, Y.; Tian, Z.; Chen, X.; Gao, J.; Zou, Z. Zn2GeO4 Crystal Splitting toward Sheaf-Like, Hyperbranched Nanostructures and Photocatalytic Reduction of CO2 into CH4 under Visible Light after Nitridation. J. Mater. Chem. 2012, 22, 2033.
(99) Keita Sekizawa, Kazuhiko Maeda, Kazunari Domen, K. K. and O. I. Artificial Z Scheme Constructed with a Supramolecular Metal Complex and Semiconductor for the Photocatalytic Reduction of CO2. J. Am. Chem. Soc. 2013, 4596–4599.

33
(100) In, S.-I.; Vaughn, D. D.; Schaak, R. E. Hybrid CuO-TiO2-xNx Hollow Nanocubes for Photocatalytic Conversion of CO2 into Methane under Solar Irradiation. Angew. Chemie, Int. Ed. 2012, 51, 3915–3918, S3915/1–S3915/5.
(101) Wang, X.; Maeda, K.; Thomas, A.; Takanabe, K.; Xin, G.; Carlsson, J. M.; Domen, K.; Antonietti, M. A Metal-Free Polymeric Photocatalyst for Hydrogen Production from Water under Visible Light. Nat. Mater. 2009, 8, 76–80.
(102) Kuriki, R.; Sekizawa, K.; Ishitani, O.; Maeda, K. Visible-Light-Driven CO2 Reduction with Carbon Nitride: Enhancing the Activity of Ruthenium Catalysts. Angew. Chemie Int. Ed. 2015, 54, 2406–2409.
(103) Mao, J.; Peng, T.; Zhang, X.; Li, K.; Ye, L.; Zan, L. Effect of Graphitic Carbon Nitride Microstructures on the Activity and Selectivity of Photocatalytic CO2 Reduction under Visible Light. Catal. Sci. Technol. 2013, 3, 1253.
(104) Tu, W.; Zhou, Y.; Zou, Z. Versatile Graphene-Promoting Photocatalytic Performance of Semiconductors: Basic Principles, Synthesis, Solar Energy Conversion, and Environmental Applications. Adv. Funct. Mater. 2013, 23, 4996–5008.
(105) Dong, G.; Zhang, L. Porous Structure Dependent Photoreactivity of Graphitic Carbon Nitride under Visible Light. J. Mater. Chem. 2012, 22, 1160.
(106) Tu, W.; Zhou, Y.; Liu, Q.; Yan, S.; Bao, S.; Wang, X.; Xiao, M.; Zou, Z. An in Situ Simultaneous Reduction-Hydrolysis Technique for Fabrication of TiO2-Graphene 2D Sandwich-like Hybrid Nanosheets: Graphene-Promoted Selectivity of Photocatalytic-Driven Hydrogenation and Coupling of CO2 into Methane and Ethane. Adv. Funct. Mater. 2013, 23, 1743–1749.
(107) Yui, T.; Kan, A.; Saitoh, C.; Koike, K.; Ibusuki, T.; Ishitani, O. Photochemical Reduction of CO2 Using TiO2: Effects of Organic Adsorbates on TiO2 and Deposition of Pd onto TiO2. ACS Appl. Mater. Interfaces 2011, 3, 2594–2600.
(108) Yang, C.; Yu, Y.; Linden, B. Van Der; Wu, J. C. S. Artificial Photosynthesis over Crystalline TiO2 -Based Catalysts : Fact or Fiction? 2010, 74, 8398–8406.
(109) Krebs, F. C. Fabrication and Processing of Polymer Solar Cells: A Review of Printing and Coating Techniques. Sol. Energy Mater. Sol. Cells 2009, 93, 394–412.
(110) Lin, Y.; Li, Y.; Zhan, X. Small Molecule Semiconductors for High-Efficiency Organic Photovoltaics. Chem. Soc. Rev. 2012, 41, 4245.
(111) NREL. NREL Solar Cells Efficiency Chart 2015.

34
Chapter 2 – Synthesis of Fe2O3/Cu2O Hetero-Structured Nanocrystals
(Reproduced in part with permission from J. Mater. Chem A, 2014, 2, 8525-8533
Copyright 2014 Royal Society of Chemistry)
2.1 Abstract
This chapter describes the synthesis of γ-Fe2O3/Cu2O HNCs using a solution-
phase seeded-growth approach. It begins with an introduction to colloidal hetero-
nanocrystals (HNCs) and their nucleation and growth. The motivations behind the
selection of Cu2O and Fe2O3 are then explained as is the expected bandgap
engineering of a type II heterojunction which was hypothesized to improve their
eventual photocatalytic performance. The synthesis of the separate component particles
is outlined followed by the synthesis of the HNCs. γ-Fe2O3 nanocrystals were used as
seeds for the nucleation of metallic Cu followed by oxidation of the Cu domain to Cu2O
upon exposure to air. Structural characterization in the form of HRTEM, STEM/EELS,
UV-VIS, TGA, PXRD, and Raman data is presented. The iron oxide component was
found to likely be γ-Fe2O3 as opposed to Fe3O4 based on its Raman signature. A max
HNC yield of 72% was achieved by reducing particle growth time at a lower temperature
with respect to the individual component particles. Additional HRTEM images and
STEM/EELS mapping results are presented to further elucidate the mechanism of HNC
formation.

35
2.2 Introduction to HNCs
Colloidal inorganic nanocrystals are at the cutting edge of synthetic advances in
nanochemistry due to the high degree of control with which their sizes, shapes, crystal
structures, and surface functionalities can be engineered. Their unique size-dependent
properties make them a fascinating subject for study from a fundamental point of view
and their versatility makes them amenable to being used in numerous technological
applications including optoelectronics, catalysis, energy conversion, and biomedicine.1–4
Wet chemistry approaches in particular have been very successful in producing a
variety of semiconductor, oxide, and metal nanocrystals (NC’s) for the aforementioned
applications.5 Judicious selection of precursors, solvents, ligands, and reaction time and
temperature allows the thermodynamic and kinetic considerations controlling
nanocrystal growth to be controlled resulting in particles with sub-nm level
reproducibility. However, the continued requirement for materials with improved
performance and multiple functionalities has recently resulted in increased interest in
colloidal hetero-nanocrystals, HNCs, which contain two or more distinct materials in the
same nanoparticle.6–9 These inorganic domains are joined through chemical bonding
interfaces and exhibit heterojunctions without the use of organic molecule linking agents
or capping molecules. Figure 2.1 shows some of the different morphologies of HNCs
that have so far been reported in literature. These include most possible combinations
of semiconductors, metals, and insulators in core/shell, dimer, trimer, and branched
architectures. This increased level of complexity allows HNCs to exhibit multi-
dimensional functionalities beyond the limitations imposed by the structural and
compositional options of mono-component nanocrystals. This opens up many scenarios
where HNCs may be applied making use of their hybrid optical, electronic, magnetic,
and chemical properties. Semiconductor-metallic hybrids have already been shown to
improve photocatalytic performance by reducing charge recombination.10,11 Magnetic-
fluorescent particles have seen growing interest as recoverable bio-imaging labels.12,13
Coating photoluminescent particles with insulating oxides in a core-shell configuration
has been shown to significantly improve luminescence quantum yields.14,15

36
Figure 2.1 Various morphologies of reported colloidal HNCs including core/shell,
dimer, trimer, and oligomer architectures. (Reprinted with permission from Ref (6)
Copyright (2011) Royal Society of Chemistry)
Research on HNCs has expanded tremendously over the previous decade as
evidenced by reviews focusing on different classes of HNC materials, configurations,
and applications.16–18 The synthesis of colloidal HNCs requires an even higher degree
of synthetic ingenuity than that of single component particles. The
thermodynamic/kinetic parameters that typically control nanocrystal growth are here
complicated by the interplay of facet-specific reactivity, interfacial strain and atomic
diffusion or exchange.9 Simple one-component colloidal NCs in general are formed
upon decomposition of molecular precursors containing the desired elements in a liquid
solution of a high boiling point solvent and in the presence of stabilizing capping ligands.
Once the reaction is initiated at a certain temperature, the molecular precursors
decompose to form active ‘monomer’ species, which are the basic building blocks of
nanocrystals. The monomers aggregate to form small clusters that are
thermodynamically unstable and dissolve out of solution, unless they reach a critical
radius and overcome a critical free energy barrier thereby becoming thermodynamically
stable.19 Experimental parameters, such as temperature, heating rate, and the relative
concentration of precursors to stabilizers affects the growth rate of the resulting
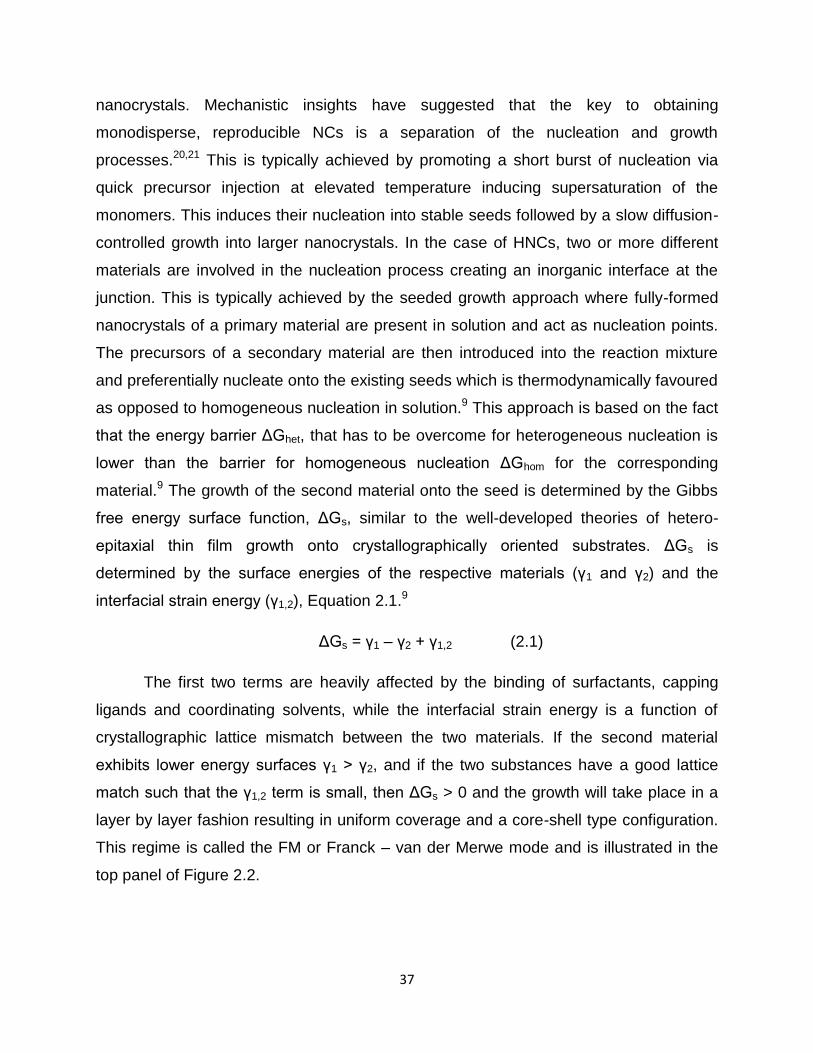
37
nanocrystals. Mechanistic insights have suggested that the key to obtaining
monodisperse, reproducible NCs is a separation of the nucleation and growth
processes.20,21 This is typically achieved by promoting a short burst of nucleation via
quick precursor injection at elevated temperature inducing supersaturation of the
monomers. This induces their nucleation into stable seeds followed by a slow diffusion-
controlled growth into larger nanocrystals. In the case of HNCs, two or more different
materials are involved in the nucleation process creating an inorganic interface at the
junction. This is typically achieved by the seeded growth approach where fully-formed
nanocrystals of a primary material are present in solution and act as nucleation points.
The precursors of a secondary material are then introduced into the reaction mixture
and preferentially nucleate onto the existing seeds which is thermodynamically favoured
as opposed to homogeneous nucleation in solution.9 This approach is based on the fact
that the energy barrier ΔGhet, that has to be overcome for heterogeneous nucleation is
lower than the barrier for homogeneous nucleation ΔGhom for the corresponding
material.9 The growth of the second material onto the seed is determined by the Gibbs
free energy surface function, ΔGs, similar to the well-developed theories of hetero-
epitaxial thin film growth onto crystallographically oriented substrates. ΔGs is
determined by the surface energies of the respective materials (γ1 and γ2) and the
interfacial strain energy (γ1,2), Equation 2.1.9
ΔGs = γ1 – γ2 + γ1,2 (2.1)
The first two terms are heavily affected by the binding of surfactants, capping
ligands and coordinating solvents, while the interfacial strain energy is a function of
crystallographic lattice mismatch between the two materials. If the second material
exhibits lower energy surfaces γ1 > γ2, and if the two substances have a good lattice
match such that the γ1,2 term is small, then ΔGs > 0 and the growth will take place in a
layer by layer fashion resulting in uniform coverage and a core-shell type configuration.
This regime is called the FM or Franck – van der Merwe mode and is illustrated in the
top panel of Figure 2.2.

38
Figure 2.2 Illustration of the FM Mode, SK Mode, and VW mode for growth of a
secondary material onto a seed nanocrystal (Reprinted with permission from Ref (9)
Copyright (2010) Elsevier)
If the secondary material exposes higher energy surfaces or if there is significant
lattice mismatch between the two domains, then the secondary material will deposit in
island-like formations as opposed to layer-by-layer in order to minimize its contact with
the surface of the seed. This growth mode is called the Volmer-Weber or VW mode and
results in non-core shell architectures such as the dimers and trimers shown in Figure
2.1. A third regime called the Stranski-Krastinov or SK mode can occur when the
secondary material initially deposits in a layer-by-layer fashion but switches to island
growth when the layers exceed a certain critical thickness and the interfacial strain term
becomes dominant.9

39
The majority of HNCs reported in literature are based on transition metal
chalcogenides because their syntheses are well studied and generally reproducible.
Many reports detail chalcogenides combined with other chalcogenides (CdSe/CdS,
CdSe/ZnS, CdS/EuS)2,22,23, metals (CdSe/Au)24 and oxides (CdS/Fe2O3)25–27 in a variety
of architectures. Functional devices ranging from solar cells28 to photocatalytic reactors
have also been demonstrated.29–31 However, metal chalcogenides suffer from chemical
stability issues and are susceptible to oxidation, photocorrosion32, and thermal
degradation which limits their performance for certain applications. Metal oxides are
typically more resistant to these problems but comparatively fewer papers exist on
metal oxide heterojunctions synthesized by colloidal chemistry methods.33–36 Cao and
co-workers synthesized UO2/In2O3 heterodimers by high temperature solution-phase
annealing of UO2 and In2O3 seeds and suggested that epitaxial growth preferentially
occurs at crystal facets where the first atomic monolayer has the strongest affinity for
the seed nanocrystal.37 Different methods to prepare ZnO/FexOy heterodimers have also
been reported and their magnetic/luminescent properties were investigated.38,39 Cozzoli
et al. synthesized binary γ-Fe2O3/TiO2 HNCs by heterogeneous nucleation of iron oxide
onto the longitudinal facets of anatase TiO2 nanorods in a ternary surfactant mixture
and described their mechanism of formation.40,41 Tremel and co-workers recently
reported the synthesis of core/shell and heterodimer Cu@Fe3O4 nanoparticles using
Cu(II) acetate and Fe(CO)5 as organometallic reagents.42 However, information about
the reaction yield, the extent of oxidation of the Cu component, and the electronic
properties of the particles was not provided.
Here we report for the first time, the synthesis of γ-Fe2O3/Cu2O HNCs by a
solution-phase seeded growth approach and investigate their structure and composition
by HRTEM, STEM/EELS, PXRD, and Raman spectroscopy. γ-Fe2O3 is an n-type
semiconductor with the inverse spinel structure of magnetite (Fe3O4) but with Fe (II)
vacancies in the octahedral sites. The α-Fe2O3 polymorph, hematite, has received a lot
of attention as a photoanode in PEC cells due to having a favorable bandgap (2.5 eV),
excellent stability, elemental abundance and a suitable VB edge position for H2O
oxidation.43–47 In its own right, Cu2O is an extremely promising material as a
photocathode as it is one of the only naturally occurring p-type metal oxides.48 It has a
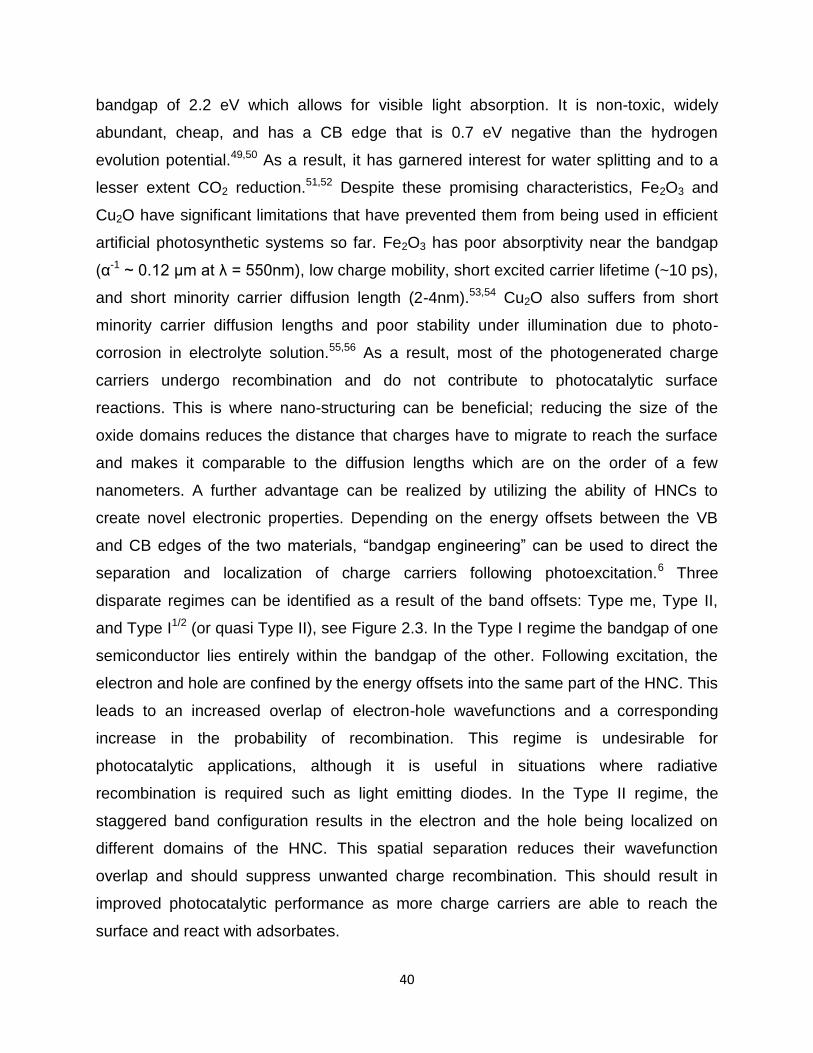
40
bandgap of 2.2 eV which allows for visible light absorption. It is non-toxic, widely
abundant, cheap, and has a CB edge that is 0.7 eV negative than the hydrogen
evolution potential.49,50 As a result, it has garnered interest for water splitting and to a
lesser extent CO2 reduction.51,52 Despite these promising characteristics, Fe2O3 and
Cu2O have significant limitations that have prevented them from being used in efficient
artificial photosynthetic systems so far. Fe2O3 has poor absorptivity near the bandgap
(α-1 ~ 0.12 μm at λ = 550nm), low charge mobility, short excited carrier lifetime (~10 ps),
and short minority carrier diffusion length (2-4nm).53,54 Cu2O also suffers from short
minority carrier diffusion lengths and poor stability under illumination due to photo-
corrosion in electrolyte solution.55,56 As a result, most of the photogenerated charge
carriers undergo recombination and do not contribute to photocatalytic surface
reactions. This is where nano-structuring can be beneficial; reducing the size of the
oxide domains reduces the distance that charges have to migrate to reach the surface
and makes it comparable to the diffusion lengths which are on the order of a few
nanometers. A further advantage can be realized by utilizing the ability of HNCs to
create novel electronic properties. Depending on the energy offsets between the VB
and CB edges of the two materials, “bandgap engineering” can be used to direct the
separation and localization of charge carriers following photoexcitation.6 Three
disparate regimes can be identified as a result of the band offsets: Type me, Type II,
and Type I1/2 (or quasi Type II), see Figure 2.3. In the Type I regime the bandgap of one
semiconductor lies entirely within the bandgap of the other. Following excitation, the
electron and hole are confined by the energy offsets into the same part of the HNC. This
leads to an increased overlap of electron-hole wavefunctions and a corresponding
increase in the probability of recombination. This regime is undesirable for
photocatalytic applications, although it is useful in situations where radiative
recombination is required such as light emitting diodes. In the Type II regime, the
staggered band configuration results in the electron and the hole being localized on
different domains of the HNC. This spatial separation reduces their wavefunction
overlap and should suppress unwanted charge recombination. This should result in
improved photocatalytic performance as more charge carriers are able to reach the
surface and react with adsorbates.
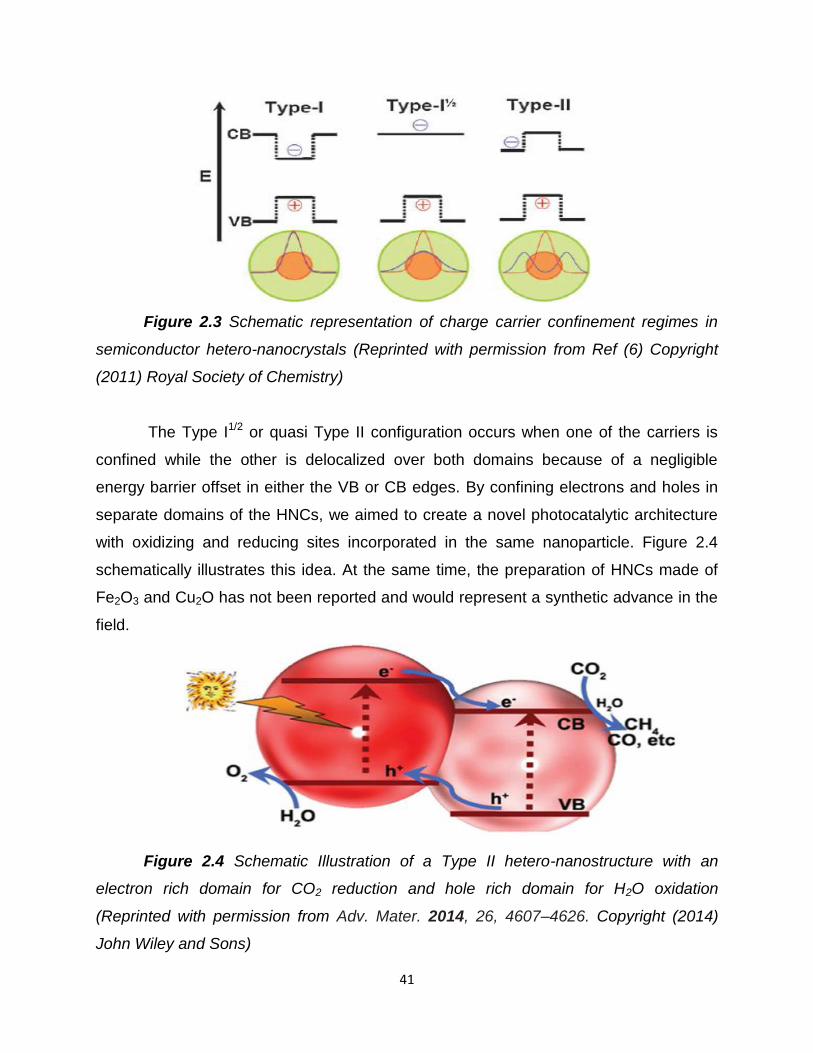
41
Figure 2.3 Schematic representation of charge carrier confinement regimes in
semiconductor hetero-nanocrystals (Reprinted with permission from Ref (6) Copyright
(2011) Royal Society of Chemistry)
The Type I1/2 or quasi Type II configuration occurs when one of the carriers is
confined while the other is delocalized over both domains because of a negligible
energy barrier offset in either the VB or CB edges. By confining electrons and holes in
separate domains of the HNCs, we aimed to create a novel photocatalytic architecture
with oxidizing and reducing sites incorporated in the same nanoparticle. Figure 2.4
schematically illustrates this idea. At the same time, the preparation of HNCs made of
Fe2O3 and Cu2O has not been reported and would represent a synthetic advance in the
field.
Figure 2.4 Schematic Illustration of a Type II hetero-nanostructure with an
electron rich domain for CO2 reduction and hole rich domain for H2O oxidation
(Reprinted with permission from Adv. Mater. 2014, 26, 4607–4626. Copyright (2014)
John Wiley and Sons)

42
2.3 Results and Discussion
As mentioned above, the compatibility of the crystal structures and lattice
constants of HNC components has a big effect on the resulting morphology with well
lattice-matched systems typically resulting in a core-shell configuration, and larger
mismatches resulting in dimer, and dumbbell-shaped particles due to the interfacial
strain energy. Figure 2.5 shows the crystal structures of γ-Fe2O3, Cu2O and metallic Cu
which is initially nucleated on the Fe2O3 seeds and then oxidized to Cu2O as will be
explained below. All 3 compounds crystallize in a cubic unit cell with lattice constants of
8.34 Å, 4.27 Å, and 3.61 Å respectively. In designing a synthesis for novel
heterostructures, the choice of which material should be used as the seed crystal can
be crucial. In the case of γ-Fe2O3/Cu2O we decided to employ the iron oxide
nanocrystals as seeds due to their reproducible synthetic protocols and their improved
stability under high temperature relative to Cu and Cu2O, which are susceptible to
oxidation and subsequent aggregation.
Figure 2.5 Crystal structures and lattice constants of the three components of
the heterostructured nanocrystals
Iron oxide nanocrystal seeds were prepared by a thermal decomposition of
Fe(oleate)3 in 1-octadecene at 320°C according to a modified literature procedure.57
Fe(oleate)3 was synthesized from FeCl3·6H2O and sodium oleate in a biphasic reaction
mixture and its structure confirmed by 1H NMR and IR spectroscopy, Figure 2.6. No

43
significant impurities were found in the precursor. The product was a waxy red liquid
that was used for Fe2O3 nanocrystal synthesis without additional purification.
Figure 2.6 1H NMR spectrum of Fe(oleate)3; inset – IR spectrum of Fe(oleate)3
Thermogravimetric analysis (TGA) of Fe(oleate)3 indicated a loss of the first
oleate ligand at 200°C followed by loss of the remaining two at 320°C in agreement with
published work, Figure 2.7.58 It has been suggested, that metal oleates decompose by
CO2 elimination to give thermal free radicals which can recombine, decompose into
smaller clusters, or react with other metal carboxylate species to propagate the
decomposition reaction.58 This leads to the formation of small metal oxide nuclei
alongside other byproducts such as H2, and CO although the exact reaction route and
stoichiometry has not been clearly determined. The temperature difference between the
nucleation (250°C – 300°C) and growth (320°C) is likely the reason for the good
monodispersity achieved in this reaction. The resulting iron oxide nanocrystals are
mainly spherical with an average size of 12.6 ± 1.5 nm although some cubic particles
are observed likely due to annealing the nanocrystals for an extended time at the
growth temperature of 320°C.

44
Figure 2.7 TGA scans of Fe(Oleate)3 and Cu(I)acetate showing the initial
decomposition temperatures of the precursors
Figure 2.8 a) Representative TEM image and particle size distribution of
isolated Cu2O nanocrystals b) Representative TEM image and particle size distribution
of isolated γ-Fe2O3 nanocrystals

45
The Cu@Cu2O particles were synthesized according to a modified literature
procedure by reduction of Cu(I) acetate to metallic Cu with trioctylamine at 270°C
followed by post-synthetic oxidation to Cu2O upon exposure to air.59 Spherical particles
with an average size of 13.8 ± 2.6 nm were produced as seen in Figure 2.8b. Initially,
the reaction mixture is a dark burgundy color indicating the presence of metallic copper.
Upon exposure to the atmosphere during workup, the mixture begins to turn dark green
as Cu oxidizes to Cu2O. The oxidation process takes several hours to go to completion
and doesn’t seem to induce any changes to the morphology of the initial particles,
although an increase in size of 1-2 nm can be observed due to oxygen diffusion into the
lattice. During HNC formation, the copper component is introduced by lowering the
injection temperature of the Cu(I) acetate precursor solution to 150°C and allowing for a
period of growth ranging from 15 to 60 minutes. It is interesting to note that nucleation of
metallic Cu is observed at the significantly lower temperature of 150°C in the HNC
synthesis as compared to 250°C when the bare Cu@Cu2O were made without pre-
existing γ-Fe2O3 seeds in solution. This is consistent with heterogeneous nucleation
being more thermodynamically favorable than homogeneous nucleation and suggests
that γ-Fe2O3/Cu2O HNCs form by a seeded growth mechanism. TGA scans of the Cu(I)
acetate precursor (see Figure 2.7) confirm its decomposition temperature in the range
of 120-160°C consistent with the above observation. Attempts to carry out the Cu(I)
acetate reduction on pre-formed γ-Fe2O3 seeds did not result in HNC formation
indicating that Cu nucleation only occurs in-situ. This suggests that the presence of an
oxygen deficient iron oxide phase may be responsible for chemically reducing the Cu+1
precursor to Cu0 with simultaneous oxidation of iron sites to Fe3+ upon exposure to air.
Figure 2.9a,b shows representative low-resolution TEM images of the resulting HNCs.
Three distinct particle morphologies are observed including isolated seeds, γ-
Fe2O3/Cu2O heterodimers, and higher oligomers consisting mainly of Cu2O/γ-
Fe2O3/Cu2O hetero-trimers. The γ-Fe2O3 component of the HNCs has an average
diameter of 11.6 ± 1.4 nm in agreement with the isolated iron oxide particles. In
contrast, the Cu2O components are significantly smaller with average diameters of 8.2 ±
1.9 nm and 7.1 ± 1.3 nm in the dimers and oligomers respectively as compared to 13.8
± 2.6 nm in the isolated particles. Control experiments were performed to confirm that

46
the HNC architecture was not a result of post-synthetic assembly, see Figure 2.9b. A
physical mixture of Cu2O and γ-Fe2O3 particles did not exhibit spontaneous ordering
into hetero-nanocrystals suggesting that the observed dimer and oligomer architectures
are a result of seeded growth of Cu on γ-Fe2O3 in solution.
Figure 2.9 a, b) Low-res TEM images of HNCs and physical mixture of γ-Fe2O3
and Cu2O showing the absence of any ordering into hetero-architectures c) Particle size
distribution of the γ- Fe2O3, Cu, and Cu2O domains in as-synthesized HNCs dimers and
oligomers
Figure 2.10a,b shows HRTEM images of the as-synthesized HNCs offering a
better view of the dimer, and trimer morphologies. To confirm that the particles consist
of distinct iron and copper-containing domains we performed energy-dispersive X-ray
analysis (EDX) on the HNCs as shown in Figure 2.10c. The resulting spectra are
overlaid with the TEM image of the examined particle, which shows the Fe and Cu
signals corresponding to separate iron (left) and copper oxide (right) domains. The

47
powder X-ray diffraction patterns of the pure iron oxide and copper oxide particles and
the HNCs are shown in Figure 2.10d.
Figure 2.10 a) Representative bright-field TEM image of as synthesized HNCs
(scale bar is 20 nm) b) HRTEM image showing isolated, dimer, and trimer morphologies
(scale bar is 5nm) c) EDX line scan across dimer particle showing the Fe-rich and Cu-
rich domains (the spectra are shifted up for clarity, scale bar 5 nm). d) PXRD patterns of
Cu2O, γ-Fe2O3, and γ-Fe2O3/Cu2O HNCs as thin films on a Si wafer e) Raman spectrum
of as-synthesized γ-Fe2O3 nanocrystals showing the prominent A1g phonon mode at 701
cm-1 indicative of γ-Fe2O3
The prominent Cu2O (111) reflection and the absence of metallic Cu reflections
indicate fully oxidized Cu2O particles. The pure iron oxide particles exhibit reflections
assigned to an inverse spinel structure, either Fe3O4 or γ-Fe2O3. This is typically the
case in solution phase syntheses which are limited by the boiling points of common

48
solvents. Formation of the thermodynamically stable α-Fe2O3 requires temperatures
above 400°C. The Fe3O4 and γ-Fe2O3 polymorphs cannot be distinguished by PXRD
because they have very similar crystal structures, with the only difference being the
presence of Fe(II) vacancies in the octahedral site of the gamma phase. Therefore,
Raman spectroscopy was used to distinguish between these phases as has been
reported previously.26 Pure Fe3O4 exhibits a A1g phonon mode at ~ 670 cm-1 which
broadens and shifts to ~700 cm-1 as the sample is oxidized to γ-Fe2O3.26,60 The Raman
spectrum of the pure iron oxide nanocrystals is shown in Figure 1e with the A1g mode
present at 701 cm-1 suggesting that the iron oxide component is likely γ-Fe2O3. The
PXRD spectrum of the HNCs in Figure 1c exhibits broadened reflections corresponding
to γ-Fe2O3. The Cu2O reflections are not apparent likely due to their lower abundance,
smaller size and a low signal-to-noise ratio caused by X-ray fluorescence from the γ-
Fe2O3 component.
Figure 2.11 shows a high resolution TEM image of a single γ-Fe2O3/Cu2O dimer.
The lattice spacing of the two domains were measured to be 0.247 Å and 0.294 Å
corresponding to the (111) and (220) planes of Cu2O and γ-Fe2O3 respectively. Figure
2.11b-e show electron energy loss spectroscopy (EELS) elemental maps tracing the
compositional distribution of a single dimer and over a larger area. The Fe and O
signals overlap perfectly giving the location of the γ- Fe2O3 seeds. The Cu-containing
domains are clearly visible adjacent to the predominant γ-Fe2O3 nanocrystals. The O
content of the Cu2O domains is also confirmed by the blue regions in Figure 2.11c,
confirming their oxidation from metallic Cu to Cu2O. The optical properties of the HNCs
are presented in Figure 2.12. Initially the dominant feature in the optical spectrum is a
Cu d-d transition at 572 nm which rapidly decreases in intensity as a result of oxidation
in air, Figure 2.12a.61 After allowing oxidation to proceed for 24 hours, the appearance
of a new feature at 620 nm is observed, Figure 2.12b. This spectral signature is
attributed to the excitonic transition of Cu2O in the range of 2.0-2.2 eV.62 The UV-VIS
spectra of pure γ-Fe2O3, the fully oxidized Cu2O component and the HNCs are shown in
Figure 2.12c. The HNC spectrum shows features of both constituent spectra including
the Cu2O transition and the tail into the UV characteristic of γ-Fe2O3.

49
Figure 2.11 a) HRTEM image of the γ-Fe2O3/Cu2O nanocrystals showing the
Cu2O (111) and γ-Fe2O3 (220) lattice planes b) HR-STEM image and STEM-EELS
elemental map obtained from the Cu L2,3 (red), Fe L2,3 (blue), and O K (green) edges,
showing the compositional distribution of a single heterodimer. Data acquired in an
aberration corrected Nion UltraSTEM100 operated at 100 kV c-e) STEM-EELS
elemental map of Cu, Fe, and O domains showing the compositional distribution over a
larger area. The color of the image is proportional to signal intensity with red indicating
the strongest signal and blue the weakest

50
Figure 2.12 UV-VIS optical absorbance spectra of a) Cu2O nanocrystals
showing initial Cu d-d transition up to 10 min after exposure to air b) Cu2O excitonic
absorption after 24 hour exposure to air and c) γ-Fe2O3, Cu2O, and γ-Fe2O3/Cu2O HNCs
We then examined the effect of varying the reaction parameters in an attempt to
maximize the yield of HNCs with respect to isolated particles. Figure 3 shows the
percentage particle distribution as a function of varying the reaction time, stoichiometry,
and Cu precursor injection temperature. In determining the yield of HNCs we consider
the proportion of dimers and higher oligomers in the total particle count. Increasing the
growth time at a fixed temperature of 150°C leads to a decrease in the yield of HNCs
from a total of ~65% to just over 30%. This is likely caused by thermal de-attachment of
the Cu component from the seeds upon prolonged heating. The injection temperature of
the Cu(I) acetate precursor also has an effect on HNC yield as seen in the right side of
Figure 4. The HNC yield decreases on increasing the injection temperature from 100°C
to 150°C, and 200°C. This effect is consistent with previous knowledge in the field of
hetero-nanocrystal synthesis; heterogeneous nucleation is facilitated by the seed
surface thereby lowering the activation energy for nucleation. However, using an
injection temperature of 100°C resulted in some colloidally unstable byproduct of bulk

51
Cu2O which had to be removed before the yield was determined. When the reaction
was repeated at 150°C, no bulk byproduct was observed and therefore 150°C was
identified as the optimal injection temperature despite giving a slightly lower HNC yield
than the 100°C reaction.
Figure 2.13 Percent distribution of isolated, dimer, and oligomer particles as a
function of reaction, time, temperature, and stoichiometry. Inset: Reaction yield under
optimal conditions of 15min, 150°C, and 1 mmol Cu(I) acetate precursor
Varying the amount of Cu(I) acetate precursor in the range of 1,2, and 4 mmol
while holding the growth time (15min), temperature (150°C) and amount of Fe(oleate)3
(2mmol) constant also had an effect on the yield. We found that using 1 mmol of Cu(I)
acetate (2:1 Fe:Cu molar ratio) results in higher HNC yield than when a 1:1 Fe:Cu ratio
was employed. This is likely caused by incomplete decomposition of Fe(oleate)3, as
evidenced by unreacted precursor that had to be removed by centrifugation post-
synthesis. Increasing the Cu(I) acetate amount to 4 mmol resulted exclusively in

52
isolated γ-Fe2O3 particles and bulk Cu2O precipitate. Under the optimal reaction
conditions identified in Figure 2.13, an HNC yield of 72% was achieved, consisting of
approximately 51% heterodimers and 21% trimers and higher oligomers. Upon size-
selective precipitation with ethanol, the trimers and larger oligomers can essentially be
removed from solution leading to fractions that are enriched in dimers with a
corresponding amount of remaining isolated γ-Fe2O3 particles, Figure 2.14.
Figure 2.14 a, b) Low resolution TEM images of Fe2O3/Cu2O HNCs after size
selective precipitation removing the majority of trimers and higher oligomers c) Particle
size distribution following size-selective precipitation of the HNCs
Further HRTEM and STEM/EELS analysis of the dimer-enriched samples is
shown in Figure 2.15. The atomic resolution z-contrast image of a typical HNC in

53
Figure 2.15a shows the crystallinity of the system although the interface at the junction
is not epitaxial. Interestingly Figure 2.15c shows the presence of a thin Cu shell around
the γ-Fe2O3 domain, likely from residual Cu. This suggests that Cu nucleates non-
epitaxially coating the entire Fe2O3 seed and then coalesces and crystallizes into a
distinct particle upon thermal annealing in solution. The overlap between the Cu and O
signals suggests that partial or complete oxidation to Cu2O has occurred during workup.
Figure 2.15 – a) Atomic resolution Z-contrast image of a typical HNC particle
b-d) STEM/EELS elemental maps obtained from Fe L2,3 (blue), Cu L2,3 (red), and O K
edges (green)

54
By varying the reaction conditions as discussed above, we can increase the size
of the Cu domains thereby preventing their complete oxidation to Cu2O and resulting in
Cu@Cu2O/Fe2O3 particles. By doubling the amount of Cu(I) acetate precursor injected,
larger polycrystalline Cu particles in the range of 12-17nm are formed compared to the
typical size of 6-10 nm under the optimized reaction conditions, Figure 2.16. The larger
size seems to prevent complete oxidation of the Cu core. Under these conditions, the
Fe2O3 seeds are significantly smaller than the overgrowing Cu domain although the
junction is still preserved. However, a thin shell of Cu around the Fe2O3 was not
observed as in Figure 2.15. This demonstrates some of the synthetic control available in
this reaction; however particles synthesized under the optimized conditions were used
in the applications described in the following chapter.
Figure 2.16 – a,b) HRTEM images of enlarged Cu@Cu2O/Fe2O3 HNCs c-f)
STEM/EELS elemental maps of Cu@Cu2O/Fe2O3 HNCs showing the core-shell nature
of the larger Cu domain and the smaller iron oxide domain

55
2.4 Conclusions
We successfully synthesized colloidal γ-Fe2O3/Cu2O hetero-nanocrystals by
thermal decomposition of Cu(I) acetate on γ-Fe2O3 at 150°C leading to the nucleation of
a metallic Cu domain followed by its conversion to Cu2O upon exposure to air. The
oxidation process could be followed to completion by monitoring the disappearance of
the Cu d-d transition and the growth of the Cu2O exciton peak by UV-VIS spectroscopy.
We achieved a yield of 72% HNCs with approximately 50% dimers and 21% higher
oligomers. Size selective precipitation was found to remove some of the oligomers
resulting in solutions enriched in dimers. HRTEM, EDX, and STEM/EELS mapping
confirmed that the particles are comprised of joined but distinct γ-Fe2O3 and Cu2O
domains without alloying or mixed phases. PXRD was inconclusive, but Raman
spectroscopy suggested that the iron oxide domain was likely γ-Fe2O3 as opposed to
Fe3O4. STEM/EELS showed residual copper around the iron oxide seeds indicating that
the particles likely form in a core-shell configuration during growth and segregate into
dimers and trimers upon annealing.
2.5 Experimental Details
Chemicals. Iron trichloride (FeCl3·6H2O, 97%), sodium oleate (82% fatty acid
basis) Cu(I) acetate 97%, trioctylamine (TOA, 98%), 1-octadecene (ODE, tech. 90%),
oleic acid (OA, tech. 90%), iron (II) oxide nanopowder, iron (II,III) oxide nanopowder,
and anhydrous organic solvents were purchased from Sigma Aldrich and used without
further purification.
Synthesis Procedures. All synthetic manipulations were done using standard
airless techniques. Fe-oleate was synthesized according to a previously reported
procedure.57 Iron trichloride (4.32 g, 16.0 mmol) and sodium oleate (14.6 g, 48 mmol),
were dissolved in 110 mL of 4:3:7 ethanol:water:hexane mixture and refluxed at 70°C
under Ar for 4 hours. The solution was cooled to room temperature; the upper organic
layer was separated and washed twice with 20 mL distilled water. Solvent was removed
on a rotary evaporator giving a viscous deep red liquid. The product was dried at 70°C
in a vacuum oven for 48 hours, resulting in Fe(oleate)3 in the form of a waxy red solid.

56
γ-Fe2O3 Nanocrystals – γ-Fe2O3 nanocrystals used as seeds in the synthesis of
HNCs were prepared according to a modified literature procedure.57 2g Fe(oleate)3, 14
mL 1-octadecene, and 0.35 mL oleic acid were added to a 100 mL 2-neck round bottom
flask and heated to ~60°C for 10 minutes to solubilize Fe(oleate)3. Using a spherical
heating mantle, the reaction mixture was heated to 320°C over the course of 20 minutes
at an average rate of 13°C per minute, under Ar flow. The temperature was maintained
at 320°C for 30 minutes, after which the reaction mixture was cooled to room
temperature and 5 mL toluene added. The nanocrystals were precipitated by addition of
excess EtOH, centrifuged at 7800 rpm for 20 minutes, and redispersed in heptane. Two
redispersion/precipitation cycles were performed to remove excess Fe(oleate)3.
Cu@Cu2O Nanocrystals – Cu@Cu2O core-shell nanocrystals were prepared
according to a modified literature procedure.63 0.245g Cu(I) acetate, 7.5 mL
trioctylamine, and 2 mL oleic acid were added to a 50 mL 3-neck round bottom flask in a
N2-filled glovebox. The flask was connected to a Schlenk line and degassed under
vacuum at 60°C for at least 30 minutes. The flask was then filled with Ar, heated to
180°C at a rate of 12°C per minute, and kept at that temperature for 45 minutes. The
reaction mixture was then heated to 270°C at 10°C resulting in a color change to deep
burgundy indicative of nucleation of elemental Cu. Particle growth was continued at
270°C for 45 minutes. The mixture was then cooled to room temperature, 5 mL of
toluene was added and the particles were precipitated by centrifugation in excess EtOH
at 7800 rpm for 20 minutes, followed by redispersion in heptane. Complete oxidation to
Cu2O was observed within 48 hours upon storage in air.
γ-Fe2O3/Cu2O HNCs – The γ-Fe2O3 seeds were synthesized as described above
but the particles were not isolated. Instead, following 30 minutes at 320°C, the reaction
mixture was cooled to 150°C, at which point a degassed, 60°C solution of 0.123 g Cu(I)
acetate, 7.5 mL trioctylamine, and 2 mL oleic acid was rapidly injected via metal
syringe resulting in a temperature decrease to ~ 120°C. The mixture was then rapidly
heated back to 150°C and particle growth was continued for 15-60 minutes. After the
completion of the growth period, the flask was cooled to room temperature, 5 mL
toluene was added, and the HNCs were precipitated by centrifugation in excess EtOH
57
at 7800 rpm for 20 minutes, followed by redispersion in heptane. Three
redispersion/precipitation cycles were performed to remove unreacted starting material
and free ligand.
General Characterization - TGA curves were acquired on a TA Instruments
Q500 thermogravimetric analyzer at a constant ramp rate of 5°C under N2 atmosphere.
UV-VIS absorption spectra were recorded on a Perkin Elmer Lambda 900 UV/VIS/NIR
spectrophotometer in dilute heptane solutions. NMR spectra of the precursors were
acquired on a Varian Mercury 400 MHz spectrometer in CDCl3.
Electron Microscopy - Low resolution TEM images were acquired on a Hitachi
H-7000 conventional TEM operating at 100kV. HRTEM images and STEM EELS
spectra were acquired on a Hitachi H-3300 ETEM, a JEOL JEM 2010 operating at
200kV and a Nion UltraSTEM100 operated at 100 kV and equipped with a Gatan Enfina
spectrometer. Sample preparation involved dropping a dilute nanocrystal solution on a
carbon coated Ni TEM grid. EDX analysis was performed on a Hitachi S-5200 SEM
operating in TEM mode using an Oxford Inca detector. Particle size and yield
determination was done manually using the free ImageJ software on a minimum of 200
particles. STEM HAADF images were obtained from an aberration corrected Nion
UltraSTEM200 dedicated STEM operating at 200 kV. STEM EEL spectra were obtained
from an aberration corrected Nion UltraSTEM100 dedicated STEM operating at 100 kV.
Powder X-Ray Diffraction - Powder X-ray diffraction patterns were recorded on
Siemens D5000 and Bruker D2 Phaser instruments using CuKα line as excitation
source. Samples were prepared by drop-casting a concentrated nanocrystal solution
onto Si(100) substrates to give films of at least 1 micrometer in thickness.
Raman Spectroscopy - Raman spectra were measured in backscattering
configuration utilizing a 532nm solid-state laser, Tornado Hyperflux U1 spectrometer,
and a cooled CCD detector. The spectral resolution was 5 cm-1 and the beam size on
the sample was 10 microns. The laser power was 0.5 mW to avoid laser induced
transition of γ-Fe2O3 to alpha-Fe2O3. Raman analysis samples were prepared by drop-

58
casting concentrated nanocrystal solutions onto a silica glass substrate to give a film of
at least 1 micrometer in thickness.
2.6 References
(1) Sargent, E. H. Infrared Photovoltaics Made by Solution Processing. Nat. Photonics 2009, 3, 325–331.
(2) Talapin, D. V; Rogach, A. L.; Kornowski, A.; Haase, M.; Weller, H. Highly Luminescent Monodisperse CdSe and CdSe/ZnS Nanocrystals Synthesized in a Hexadecylamine-Trioctylphosphine Oxide-Trioctylphosphine Mixture. Nano Lett. 2001, 1, 207–211.
(3) Kim, B. Y. S.; Rutka, J. T.; Chan, W. C. W. Nanomedicine. N. Engl. J. Med. 2010, 363, 2434–2443.
(4) Chen, X.; Shen, S.; Guo, L.; Mao, S. S. Semiconductor-Based Photocatalytic Hydrogen Generation. Chem. Rev. (Washington, DC, United States) 2010, 110, 6503–6570.
(5) Kwon, S. G.; Hyeon, T. Colloidal Chemical Synthesis and Formation Kinetics of Uniformly Sized Nanocrystals of Metals, Oxides, and Chalcogenides. Acc. Chem. Res. 2008, 41, 1696–1709.
(6) De Mello Donegá, C. Synthesis and Properties of Colloidal Heteronanocrystals. Chem. Soc. Rev. 2011, 40, 1512–1546.
(7) Costi, R.; Saunders, A. E.; Banin, U. Colloidal Hybrid Nanostructures: A New Type of Functional Materials. Angew. Chemie, Int. Ed. 2010, 49, 4878–4897.
(8) Cozzoli, P. D.; Pellegrino, T.; Manna, L. Synthesis, Properties and Perspectives of Hybrid Nanocrystal Structures. Chem. Soc. Rev. 2006, 35, 1195–1208.
(9) Carbone, L.; Cozzoli, P. D. Colloidal Heterostructured Nanocrystals: Synthesis and Growth Mechanisms. Nano Today 2010, 5, 449–493.
(10) Maynadie, J.; Salant, A.; Falqui, A.; Respaud, M.; Shaviv, E.; Banin, U.; Soulantica, K.; Chaudret, B. Cobalt Growth on the Tips of CdSe Nanorods. Angew. Chemie, Int. Ed. 2009, 48, 1814–1817.
(11) Zhang, L.; Blom, D. A.; Wang, H. Au-Cu2O Core-Shell Nanoparticles: A Hybrid Metal-Semiconductor Heteronanostructure with Geometrically Tunable Optical Properties. Chem. Mater. 2011, 23, 4587–4598.

59
(12) Yu, H.; Chen, M.; Rice, P. M.; Wang, S. X.; White, R. L.; Sun, S. Dumbbell-like Bifunctional Au-Fe3O4 Nanoparticles. Nano Lett. 2005, 5, 379–382.
(13) Jiang, J.; Gu, H.; Shao, H.; Devlin, E.; Papaefthymiou, G. C.; Ying, J. Y. Bifunctional Fe3O4-Ag Heterodimer Nanoparticles for Two-Photon Fluorescence Imaging and Magnetic Manipulation. Adv. Mater. (Weinheim, Ger.) 2008, 20, 4403–4407.
(14) Liong, M.; Lu, J.; Kovochich, M.; Xia, T.; Ruehm, S. G.; Nel, A. E.; Tamanoi, F.; Zink, J. I. Multifunctional Inorganic Nanoparticles for Imaging, Targeting, and Drug Delivery. ACS Nano 2008, 2, 889–896.
(15) Gerion, D.; Pinaud, F.; Williams, S. C.; Parak, W. J.; Zanchet, D.; Weiss, S.; Alivisatos, A. P. Synthesis and Properties of Biocompatible Water-Soluble Silica-Coated CdSe/ZnS Semiconductor Quantum Dots. J. Phys. Chem. B 2001, 105, 8861–8871.
(16) Scholes, G. D. Controlling the Optical Properties of Inorganic Nanoparticles. Adv. Funct. Mater. 2008, 18, 1157–1172.
(17) Reiss, P.; Protière, M.; Li, L. Core/shell Semiconductor Nanocrystals. Small 2009, 5, 154–168.
(18) Jinhao, G. O.; Hongwei, G. U.; Bing, X. U. Multifunctional Magnetic Nanoparticles: Design, Synthesis, and Biomedical Applications. Acc. Chem. Res. 2009, 42, 1097–1107.
(19) Zeng, J.; Wang, X.; Hou, J. G. Colloidal Hybrid Nanocrystals : Synthesis , Properties , and Perspectives. 33–39.
(20) Buonsanti, R.; Casavola, M.; Caputo, G.; Cozzoli, P. D. Advances in the Chemical Fabrication of Complex Multimaterial Nanocrystals. Recent Pat. Nanotechnol. 2007, 1, 224–232.
(21) Park, J.; Joo, J.; Kwon, S. G.; Jang, Y.; Hyeon, T. Synthesis of Monodisperse Spherical Nanocrystals. Angew. Chemie, Int. Ed. 2007, 46, 4630–4660.
(22) Chen, O.; Zhao, J.; Chauhan, V. P.; Cui, J.; Wong, C.; Harris, D. K.; Wei, H.; Han, H.-S.; Fukumura, D.; Jain, R. K.; et al. Compact High-Quality CdSe-CdS Core-Shell Nanocrystals with Narrow Emission Linewidths and Suppressed Blinking. Nat. Mater. 2013, 12, 445–451.
(23) Mirkovic, T.; Rossouw, D.; Botton, G. A.; Scholes, G. D. Broken Band Alignment in EuS-CdS Nanoheterostructures. Chem. Mater. 2011, 23, 181–187.
60
(24) Zhang, J.; Tang, Y.; Lee, K.; Ouyang, M. Tailoring Light-Matter-Spin Interactions in Colloidal Hetero-Nanostructures. Nature, 2010, 466, 91–95.
(25) McDaniel, H.; Shim, M. Size and Growth Rate Dependent Structural Diversification of Fe3O4/CdS Anisotropic Nanocrystal Heterostructures. ACS Nano 2009, 3, 434–440.
(26) Kwon, K.-W.; Lee, B. H.; Shim, M. Structural Evolution in Metal Oxide/Semiconductor Colloidal Nanocrystal Heterostructures. Chem. Mater. 2006, 18, 6357–6363.
(27) Kwon, K.-W.; Shim, M. γ-Fe2O3/II-VI Sulfide Nanocrystal Heterojunctions. J. Am. Chem. Soc. 2005, 127, 10269–10275.
(28) Tang, J.; Huo, Z.; Brittman, S.; Gao, H.; Yang, P. Solution-Processed Core-Shell Nanowires for Efficient Photovoltaic Cells. Nat. Nanotechnol. 2011, 6, 568–572.
(29) Rawalekar, S.; Mokari, T. Rational Design of Hybrid Nanostructures for Advanced Photocatalysis. Adv. Energy Mater. 2013, 3, 12–27.
(30) Kubacka, A.; Fernandez-Garcia, M.; Colon, G. Advanced Nanoarchitectures for Solar Photocatalytic Applications. Chem. Rev. (Washington, DC, United States) 2012, 112, 1555–1614.
(31) Amirav, L.; Alivisatos, A. P. Photocatalytic Hydrogen Production with Tunable Nanorod Heterostructures. J. Phys. Chem. Lett. 2010, 1, 1051–1054.
(32) Chen, S.; Wang, L.-W. Thermodynamic Oxidation and Reduction Potentials of Photocatalytic Semiconductors in Aqueous Solution. Chem. Mater. 2012, 24, 3659–3666.
(33) Buck, M. R.; Bondi, J. F.; Schaak, R. E. A Total-Synthesis Framework for the Construction of High-Order Colloidal Hybrid Nanoparticles. Nat. Chem. 2012, 4, 37–44.
(34) Choi, S.-H.; Na, H. Bin; Park, Y. Il; An, K.; Kwon, S. G.; Jang, Y.; Park, M.; Moon, J.; Son, J. S.; Song, I. C.; et al. Simple and Generalized Synthesis of Oxide-Metal Heterostructured Nanoparticles and Their Applications in Multimodal Biomedical Probes. J. Am. Chem. Soc. 2008, 130, 15573–15580.
(35) Casavola, M.; Buonsanti, R.; Caputo, G.; Cozzoli, P. D. Colloidal Strategies for Preparing Oxide-Based Hybrid Nanocrystals. Eur. J. Inorg. Chem. 2008, 837–854.

61
(36) Shi, W.; Zeng, H.; Sahoo, Y.; Ohulchanskyy, T. Y.; Ding, Y.; Wang, Z. L.; Swihart, M.; Prasad, P. N. A General Approach to Binary and Ternary Hybrid Nanocrystals. Nano Lett. 2006, 6, 875–881.
(37) Wu, H.; Chen, O.; Zhuang, J.; Lynch, J.; LaMontagne, D.; Nagaoka, Y.; Cao, Y. C. Formation of Heterodimer Nanocrystals: UO2/In2O3 and FePt/In2O3. J. Am. Chem. Soc. 2011, 133, 14327–14337.
(38) Chiu, W.; Khiew, P.; Cloke, M.; Isa, D.; Lim, H.; Tan, T.; Huang, N.; Radiman, S.; Abd-Shukor, R.; Hamid, M. A. A.; et al. Heterogeneous Seeded Growth: Synthesis and Characterization of Bifunctional Fe3O4/ZnO Core/Shell Nanocrystals. J. Phys. Chem. C 2010, 114, 8212–8218.
(39) Kostopoulou, A.; Thetiot, F.; Tsiaoussis, I.; Androulidaki, M.; Cozzoli, P. D.; Lappas, A. Colloidal Anisotropic ZnO-Fe@FexOy Nanoarchitectures with Interface-Mediated Exchange-Bias and Band-Edge Ultraviolet Fluorescence. Chem. Mater. 2012, 24, 2722–2732.
(40) Buonsanti, R.; Grillo, V.; Carlino, E.; Giannini, C.; Gozzo, F.; Garcia-Hernandez, M.; Garcia, M. A.; Cingolani, R.; Cozzoli, P. D. Architectural Control of Seeded-Grown Magnetic-Semiconductor Iron Oxide-TiO2 Nanorod Heterostructures: The Role of Seeds in Topology Selection. J. Am. Chem. Soc. 2010, 132, 2437–2464.
(41) Buonsanti, R.; Grillo, V.; Carlino, E.; Giannini, C.; Curri, M. L.; Innocenti, C.; Sangregorio, C.; Achterhold, K.; Parak, F. G.; Agostiano, A.; et al. Seeded Growth of Asymmetric Binary Nanocrystals Made of a Semiconductor TiO2 Rodlike Section and a Magnetic γ-Fe2O3 Spherical Domain. J. Am. Chem. Soc. 2006, 128, 16953–16970.
(42) Nakhjavan, B.; Tahir, M. N.; Natalio, F.; Gao, H.; Schneider, K.; Schladt, T.; Ament, I.; Branscheid, R.; Weber, S.; Kolb, U.; et al. Phase Separated Cu@Fe3O4 Heterodimer Nanoparticles from Organometallic Reactants. J. Mater. Chem. 2011, 21, 8605–8611.
(43) Lin, Y.; Yuan, G.; Sheehan, S.; Zhou, S.; Wang, D. Hematite-Based Solar Water Splitting: Challenges and Opportunities. Energy Environ. Sci. 2011, 4, 4862.
(44) Sivula, K.; Le Formal, F.; Grätzel, M. Solar Water Splitting: Progress Using Hematite (α-Fe2O3) Photoelectrodes. ChemSusChem 2011, 4, 432–449.
(45) Sivula, K.; Zboril, R.; Le Formal, F.; Robert, R.; Weidenkaff, A.; Tucek, J.; Frydrych, J.; Gratzel, M. Photoelectrochemical Water Splitting with Mesoporous Hematite Prepared by a Solution-Based Colloidal Approach. J. Am. Chem. Soc. 2010, 132, 7436–7444.

62
(46) Ling, Y.; Wang, G.; Wheeler, D. A.; Zhang, J. Z.; Li, Y. Sn-Doped Hematite Nanostructures for Photoelectrochemical Water Splitting. Nano Lett. 2011, 11, 2119–2125.
(47) Lin, Y.; Zhou, S.; Sheehan, S. W.; Wang, D. Nanonet-Based Hematite Heteronanostructures for Efficient Solar Water Splitting. J. Am. Chem. Soc. 2011, 133, 2398–2401.
(48) Paracchino, A.; Brauer, J. C.; Moser, J.-E.; Thimsen, E.; Graetzel, M. Synthesis and Characterization of High-Photoactivity Electrodeposited Cu2O Solar Absorber by Photoelectrochemistry and Ultrafast Spectroscopy. J. Phys. Chem. C 2012, 116, 7341–7350.
(49) Mahmoud, M. A.; Qian, W.; El-Sayed, M. A. Following Charge Separation on the Nanoscale in Cu2O-Au Nanoframe Hollow Nanoparticles. Nano Lett. 2011, 11, 3285–3289.
(50) Radi, A.; Pradhan, D.; Sohn, Y.; Leung, K. T. Nanoscale Shape and Size Control of Cubic, Cuboctahedral, and Octahedral Cu-Cu2O Core-Shell Nanoparticles on Si(100) by One-Step, Templateless, Capping-Agent-Free Electrodeposition. ACS Nano 2010, 4, 1553–1560.
(51) De Jongh, P. E.; Vanmaekelbergh, D.; Kelly, J. J. Cu2O. Electrodeposition and Characterization. Chem. Mater. 1999, 11, 3512–3517.
(52) Paracchino, A.; Laporte, V.; Sivula, K.; Graetzel, M.; Thimsen, E. Highly Active Oxide Photocathode for Photoelectrochemical Water Reduction. Nat. Mater. 2011, 10, 456–461.
(53) Li, L.; Yu, Y.; Meng, F.; Tan, Y.; Hamers, R. J.; Jin, S. Facile Solution Synthesis of α-FeF3·3H2O Nanowires and Their Conversion to α-Fe2O3 Nanowires for Photoelectrochemical Application. Nano Lett. 2012, 12, 724–731.
(54) Kennedy, J. H.; Frese Jr., K. W. Photooxidation of Water at α-iron(III) Oxide Electrodes. J. Electrochem. Soc. 1978, 125, 709–714.
(55) Gerischer, H. On the Stability of Semiconductor Electrodes against Photodecomposition. J. Electroanal. Chem. Interfacial Electrochem. 1977, 82, 133–143.
(56) Engel, C. J.; Polson, T. A.; Spado, J. R.; Bell, J. M.; Fillinger, A. Photoelectrochemistry of Porous P-Cu2O Films. J. Electrochem. Soc. 2008, 155, F37–F42.

63
(57) Park, J.; An, K.; Hwang, Y.; Park, J.-G.; Noh, H.-J.; Kim, J.-Y.; Park, J.-H.; Hwang, N.-M.; Hyeon, T. Ultra-Large-Scale Syntheses of Monodisperse Nanocrystals. Nat. Mater. 2004, 3, 891–895.
(58) Bao, N.; Shen, L.; An, W.; Padhan, P.; Heath Turner, C.; Gupta, A. Formation Mechanism and Shape Control of Monodisperse Magnetic CoFe2O4 Nanocrystals. Chem. Mater. 2009, 21, 3458–3468.
(59) Yin, M.; Wu, C.-K.; Lou, Y.; Burda, C.; Koberstein, J. T.; Zhu, Y.; O’Brien, S. Copper Oxide Nanocrystals. J. Am. Chem. Soc. 2005, 127, 9506–9511.
(60) Jubb, A. M.; Allen, H. C. Vibrational Spectroscopic Characterization of Hematite, Maghemite, and Magnetite Thin Films Produced by Vapor Deposition. ACS Appl. Mater. Interfaces 2010, 2, 2804–2812.
(61) Wooten, F. Optical Properties of Solids. 1972, pp. 260.
(62) Rice, K. P.; Walker, E. J.; Stoykovich, M. P.; Saunders, A. E. Solvent-Dependent Surface Plasmon Response and Oxidation of Copper Nanocrystals. J. Phys. Chem. C 2011, 115, 1793–1799.
(63) Yin, M.; Wu, C.-K.; Lou, Y.; Burda, C.; Koberstein, J. T.; Zhu, Y.; O’Brien, S. Copper Oxide Nanocrystals. J. Am. Chem. Soc. 2005, 127, 9506–9511.

64
Chapter 3 – Electronic Properties and Applications of Fe2O3/Cu2O
Heterostructured Nanocrystals
(Reproduced in part with permission from J. Mater. Chem A, 2014, 2, 8525-8533
Copyright 2014 Royal Society of Chemistry)
3.1 Abstract
This chapter includes further characterization of Fe2O3/Cu2O nanocrystals and
their first use as photocatalysts for CO2 reduction. Photoelectron spectroscopy data is
used to determine the absolute VB and CB energies of the particles and compare them
to known standards confirming the desired type II band alignment. The oxidation states
and chemical environment of the surface elements are determined and found to agree
with the results of Chapter 2. Surface photovoltage experiments of the as-synthesized
nanocrystals suggested that the organic ligand shell was preventing reactions with the
desired adsorbates from occurring at the surface and giving false positives in gas-phase
CO2 reduction testing. We then investigated methods to remove the organic capping
molecules including solution-phase ligand exchange, thermal treatment, and ultraviolet
photolysis. We examined the effects of the UV photolysis process on the band energies
of our materials by XPS/UPS. When used for organic dye degradation in aqueous
solution, the HNC performed more effectively than their separate components, though
activity for gas-phase CO2 conversion was not observed.

65
3.2 Photoelectron Spectroscopy
In order to fully determine the chemical and electronic properties of γ-
Fe2O3/Cu2O HNCs we performed an X-ray/ultraviolet photoelectron spectroscopy (PES)
study of our materials. PES is a useful, non-destructive tool for studying the chemical
and electronic structure of nanocrystalline samples as it can provide information about
elemental composition, oxidation state, and density of states near the Fermi level.1 The
presence of both Cu and Fe in the HNCs was confirmed by the characteristic Fe and Cu
2p doublets in the XPS survey scans, see Figure 3.1. We further employed XPS to
ascertain that the iron oxide component of our HNCs was indeed γ-Fe2O3 as
determined by Raman spectroscopy. XPS has previously been used to differentiate
between Fe2O3 and Fe3O4 based on the difference in binding energy between Fe2+ and
Fe3+.2,3 Figure 3.2 shows the Fe 2p core-level peaks of the as-synthesized pure iron
oxide nanocrystals and commercial γ-Fe2O3 and Fe3O4 nanopowders analyzed under
the same conditions. The binding energies of the Fe 2p1/2 and Fe 2p3/2 peaks are
summarized in Table 3.1 which indicates that the nanocrystalline iron oxide lines closely
correspond to the commercial γ-Fe2O3 powder thereby confirming our assignment.
Table 3.1 Binding energy (eV) of Fe 2p core-level lines in γ-Fe2O3 nanocrystals,
γ-Fe2O3/Cu2O HNCs, and commercial iron oxide nanopowders
Sample Fe 2p3/2 Energy Fe 2p1/2 Energy
γ-Fe2O3 Nanocrystals 710.2 eV 723.9 eV
γ-Fe2O3/Cu2O HNCs 709.4 eV 723.0 eV
Commercial γ-Fe2O3
Nanopowder
710.6 eV 724.4 eV
Commercial Fe3O4
Nanopowder
710.9 eV 724.8 eV
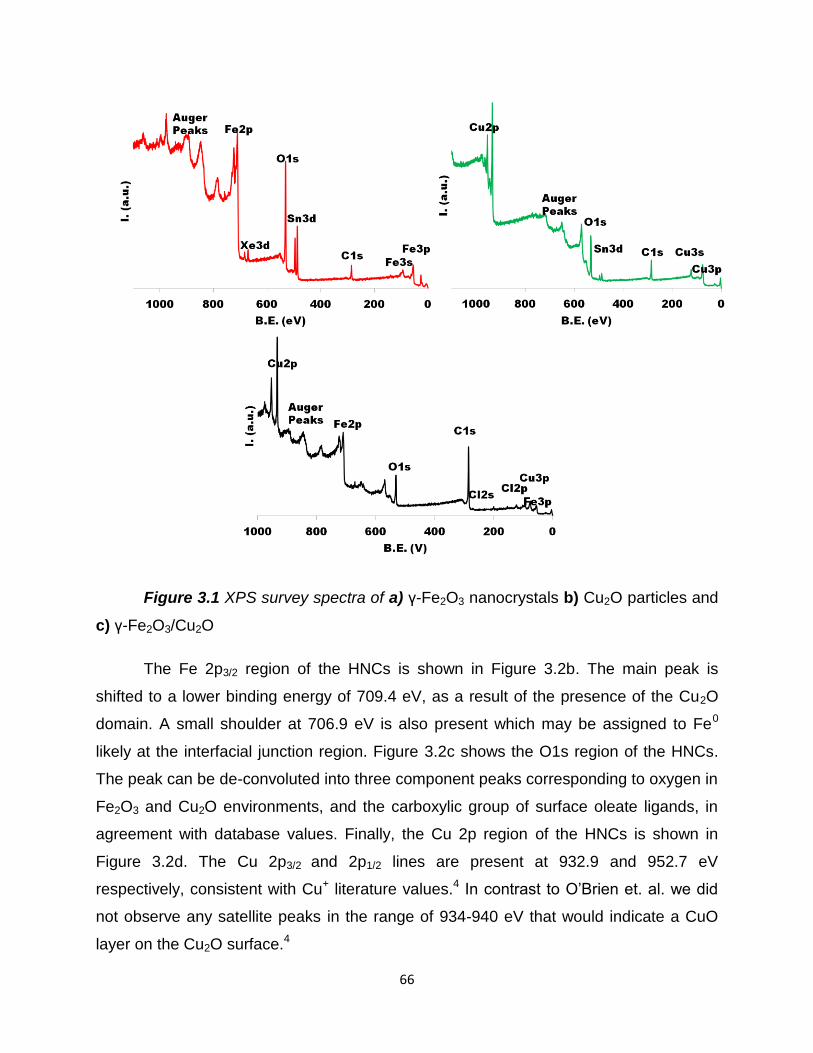
66
Figure 3.1 XPS survey spectra of a) γ-Fe2O3 nanocrystals b) Cu2O particles and
c) γ-Fe2O3/Cu2O
The Fe 2p3/2 region of the HNCs is shown in Figure 3.2b. The main peak is
shifted to a lower binding energy of 709.4 eV, as a result of the presence of the Cu2O
domain. A small shoulder at 706.9 eV is also present which may be assigned to Fe0
likely at the interfacial junction region. Figure 3.2c shows the O1s region of the HNCs.
The peak can be de-convoluted into three component peaks corresponding to oxygen in
Fe2O3 and Cu2O environments, and the carboxylic group of surface oleate ligands, in
agreement with database values. Finally, the Cu 2p region of the HNCs is shown in
Figure 3.2d. The Cu 2p3/2 and 2p1/2 lines are present at 932.9 and 952.7 eV
respectively, consistent with Cu+ literature values.4 In contrast to O’Brien et. al. we did
not observe any satellite peaks in the range of 934-940 eV that would indicate a CuO
layer on the Cu2O surface.4
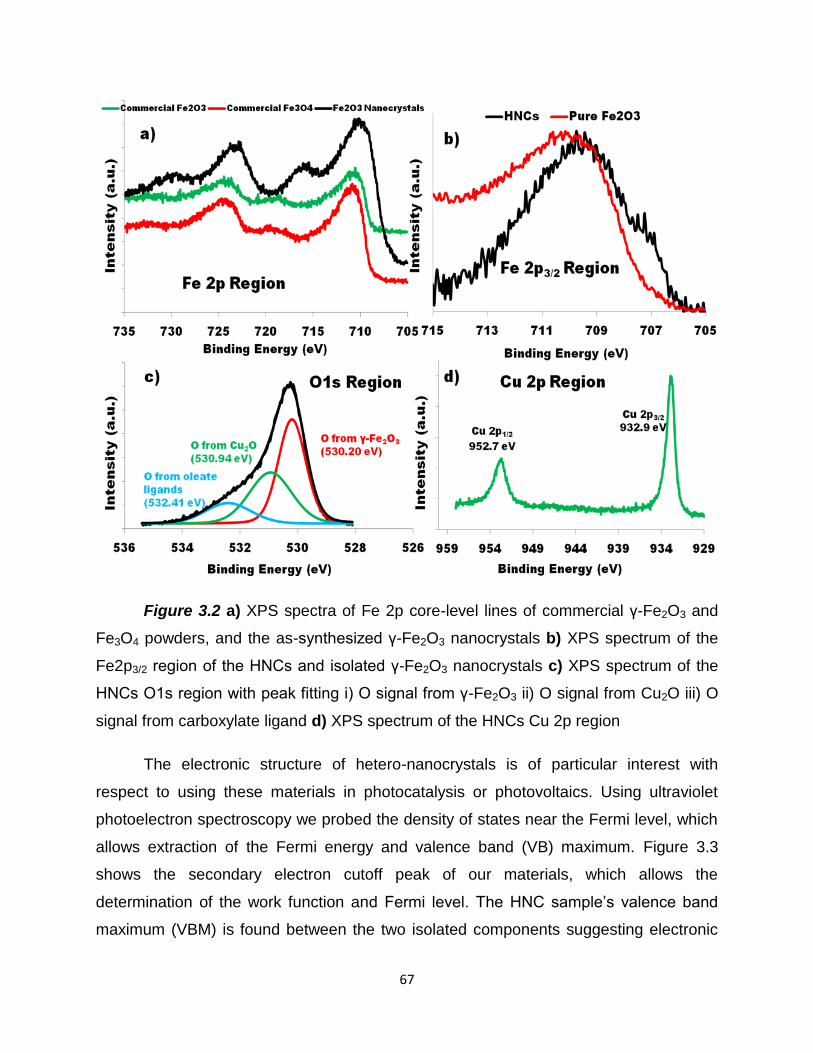
67
Figure 3.2 a) XPS spectra of Fe 2p core-level lines of commercial γ-Fe2O3 and
Fe3O4 powders, and the as-synthesized γ-Fe2O3 nanocrystals b) XPS spectrum of the
Fe2p3/2 region of the HNCs and isolated γ-Fe2O3 nanocrystals c) XPS spectrum of the
HNCs O1s region with peak fitting i) O signal from γ-Fe2O3 ii) O signal from Cu2O iii) O
signal from carboxylate ligand d) XPS spectrum of the HNCs Cu 2p region
The electronic structure of hetero-nanocrystals is of particular interest with
respect to using these materials in photocatalysis or photovoltaics. Using ultraviolet
photoelectron spectroscopy we probed the density of states near the Fermi level, which
allows extraction of the Fermi energy and valence band (VB) maximum. Figure 3.3
shows the secondary electron cutoff peak of our materials, which allows the
determination of the work function and Fermi level. The HNC sample’s valence band
maximum (VBM) is found between the two isolated components suggesting electronic
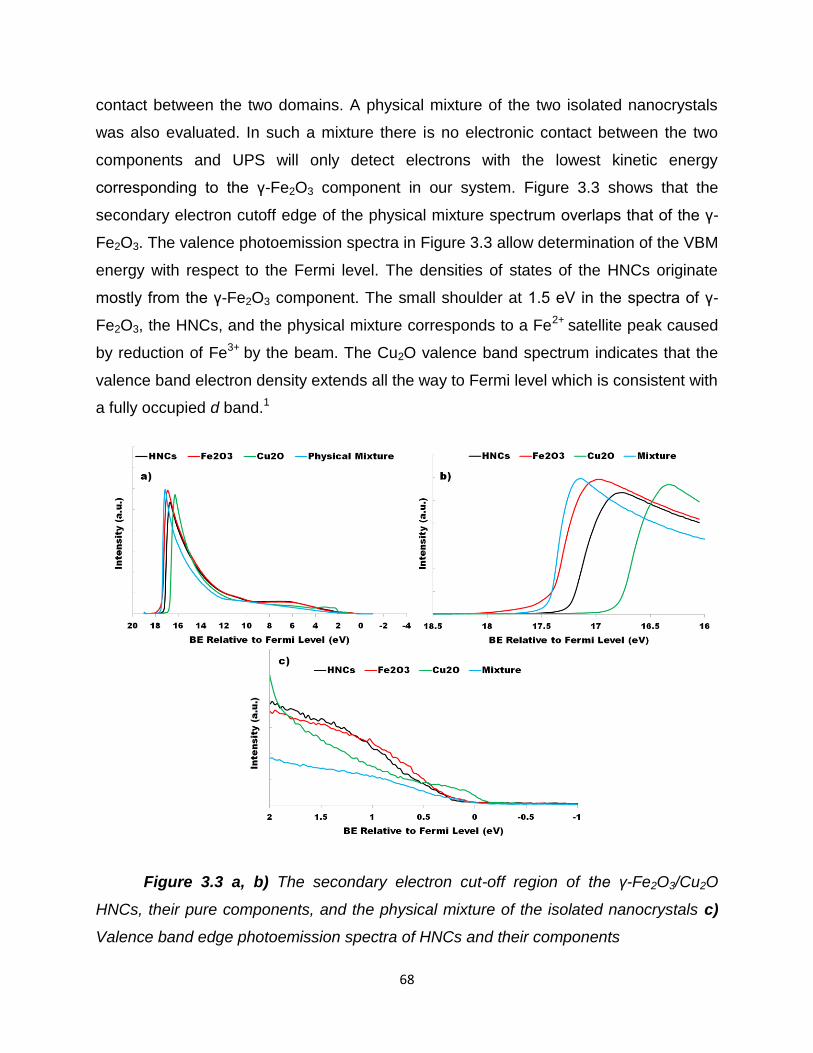
68
contact between the two domains. A physical mixture of the two isolated nanocrystals
was also evaluated. In such a mixture there is no electronic contact between the two
components and UPS will only detect electrons with the lowest kinetic energy
corresponding to the γ-Fe2O3 component in our system. Figure 3.3 shows that the
secondary electron cutoff edge of the physical mixture spectrum overlaps that of the γ-
Fe2O3. The valence photoemission spectra in Figure 3.3 allow determination of the VBM
energy with respect to the Fermi level. The densities of states of the HNCs originate
mostly from the γ-Fe2O3 component. The small shoulder at 1.5 eV in the spectra of γ-
Fe2O3, the HNCs, and the physical mixture corresponds to a Fe2+ satellite peak caused
by reduction of Fe3+ by the beam. The Cu2O valence band spectrum indicates that the
valence band electron density extends all the way to Fermi level which is consistent with
a fully occupied d band.1
Figure 3.3 a, b) The secondary electron cut-off region of the γ-Fe2O3/Cu2O
HNCs, their pure components, and the physical mixture of the isolated nanocrystals c)
Valence band edge photoemission spectra of HNCs and their components

69
Having determined the position of the valence band maxima of the HNCs and
their constituents by UPS, we can construct an electronic band energy diagram as a
step towards understanding the charge carrier behavior in our system. Figure 3.4 shows
the Fermi levels, and conduction and valence band energies of the HNCs, their
individual components, and the corresponding commercial samples. The positions of
the conduction band (CB) minima were calculated by adding the bandgap as
determined by UV-VIS spectroscopy, see Figure 3.5, to the valence band maxima found
by UPS.5
Figure 3.4 Band energy diagram showing the valence and conduction band
edges and Fermi levels of the HNCs and their constituents. The commercial samples
of copper and iron oxides were evaluated under the same conditions for comparison

70
Figure 3.5 Optical absorption spectra of a) pure Cu2O b) pure γ-Fe2O3 and c) γ-
Fe2O3/Cu2O HNCs manipulated using the Tauc relation (Ref 58) to determine their
optical bandgaps
The Fermi level and valence band maximum of the HNCs is found to be between
those of γ-Fe2O3 and Cu2O pointing to contributions from both components. In
agreement with the literature on the bulk materials, we found that γ-Fe2O3 and Cu2O
nanocrystals are intrinsically n-doped and p-doped, likely from anion and cation
vacancies, respectively. Considering the staggered type II band alignment, a
photoexcited electron in the conduction band of Cu2O would relax to the conduction
band of γ-Fe2O3, promoting its separation from the hole in the Cu2O valence band.
Alternatively a two-photon Z-scheme could also be observed where initial excitation of
γ-Fe2O3 and relaxation into the VB of Cu2O is followed by absorption of a secondary
photon and promotion to its CB analogous to the process in Photosystems I and II.

71
3.3 Gas-phase CO2 Reduction
The overall reaction between CO2 and H2O is highly endergonic, with the majority
of the energy used in the kinetically more difficult water oxidation reaction. Therefore,
catalysts that simultaneously drive CO2 reduction and H2O oxidation without an external
bias are rare and operate at very low efficiencies.6 Vast improvements in H2O splitting
systems have opened the possibilities for a sustainable and economically competitive
supply of H2 as a reactant gas. The hydrogenation of CO2 with H2 is thermodynamically
favourable relative to the reaction between H2O and CO2. Thus, H2 generated
separately via solar-driven water splitting can be used in the subsequent photocatalytic
reduction of CO2 to maximize the potential of the harvested sunlight. CO2 reduction
photocatalysts that operate in an H2 environment at moderate temperatures provide
valuable insights into CO2 reduction mechanisms and provide opportunities for the
discovery of active cathode components in a scalable artificial photosynthetic process.
The majority of CO2 reduction photocatalysts reported in the literature operate at room
temperature or 80 °C for aqueous and gas phase reactions, respectively. Here we
evaluate γ-Fe2O3/Cu2O HNCs for photo-assisted CO2 reduction using H2 as the
reducing agent in a batch process. CO2 hydrogenation to methane has been well known
since the beginning of the 20th century. It was first discovered by Paul Sabatier and
involves the reaction of CO2 and H2 at high temperatures (300-400°C) and pressures
over nickel or ruthenium heterogeneous catalysts dispersed on solid supports, Equation
3.1.7 The reaction is exothermic, with an enthalpy of ΔH = -165 KJ/mol. The process
has been proposed for use onboard spacecraft to produce water for human use from
waste H2 generated by water electrolysis and CO2 emitted by respiration.
CO2 + 4 H2 → CH4 + 2 H2O (3.1)
The reverse water gas shift reaction can also occur under similar conditions,
Equation 3.2. The methane and carbon monoxide generated by these reactions can be
fed into existing natural gas infrastructure or added to Fischer Tropsch processes
respectively. Here we attempt to lower the required temperatures for generating these
products from CO2 by partially driving these processes with solar energy.

72
CO2 + H2 CO + H2O (3.2)
Films of γ-Fe2O3/Cu2O were drop-cast from hexane solutions onto glass
substrates, dried in vacuo and introduced into the reactor. Figure 3.6 shows a
schematic diagram of the multi-reactor and the spectral output of the metal halide lamp
used in this study.
Figure 3.6 Scheme of the reactor design and GC/MS setup
Samples were irradiated for 16 hours following which products were manually
sampled from the reactor. The full details of the testing procedure are given in the
Experimental section. The presence of CO and CH4 was detected at nmol/hr rates, as
shown in Figure 3.7. The empty reactor and reactor+sample were first tested at room
temperature providing us with background rates of hydrocarbon production. Under
illumination and in the absence of additional heating, the sample heated up to 67°C and
product concentrations approximately doubled. Even with an empty reactor, the product
rates were higher under illumination relative to in the dark. However, no increase was
detected in the presence of the catalyst relative to the empty reactor under light. The
detection of hydrocarbons in the absence of a catalyst pointed to a background level of

73
carbon contamination likely arising from rubber tubing, O-rings, or sample
contamination from handling. Under the combined effects of heating and illumination
such that the thermocouple in contact with the sample read 150°C, the rates increased
several fold. In the case of CO, the highest rate of 30 nmol/hr was obtained for the
empty reactor under illumination indicating that the catalyst had no effect. In the case of
CH4, a rate of 2 nmol/hr was reached for the sample under illumination which was
twofold higher than the catalyst in dark or the empty reactor. However, we suspected
that the CH4 produced originated from degradation of the organic capping ligands under
the combined effects of heat and light.
Figure 3.7 – Rate of CO (top) and CH4 (bottom) production from CO2
hydrogenation at different temperatures

74
We hypothesized that the organic ligand shell on the surface likely prevents
adsorption of reactant gases and prevents charges from reacting at the particle surface
as well as providing false positives in hydrocarbon detection. To study whether the
photoactivity of the samples was inhibited by the ligands, we employed surface
photovoltage spectroscopy (SPS). SPS is a contactless technique that probes contact
potential difference changes (ΔCPD) in thin films upon excitation with light.8 SPS
spectra allow photochemical charge separation to be monitored concurrently with the
sample’s light absorption. The dominant ΔCPD signal is expected to correlate with
excitation of electrons from the valence to the conductions band under illumination with
light energy comparable to the film’s bandgap.
Figure 3.8 Surface photovoltage spectra of as-synthesized a) Cu2O NCs b)
Fe2O3 NCs c) Fe2O3/Cu2O HNCs d) separate components plus HNCs plus trioctylamine
ligand film

75
Comparisons of SPS and UV/VIS absorption spectra for pure Cu2O, pure Fe2O3
NPs, and Fe2O3/Cu2O HNCs are shown in Figure 3.8a-c. The onset energy of the SPS
spectra and UV/VIS absorption do not correspond to each other. This suggests the
photovoltage signal in the SPS spectrum is not caused by excitation of the
nanoparticles. All three samples produced similar SPS spectra, Figure 3.8d. We
suspect that the SPS signal is from the excitation of FTO film itself, and that the organic
ligand trioctylamine can accept the holes from the FTO therefore magnifying the
response of FTO. This was confirmed in the SPS spectrum of trioctylamine on FTO in
Figure 3.8d. This spectrum reproduces all features of the nanocrystal spectra. In
summary, the SPS experiment did not observe photochemical charge transfer in the
nanoparticle samples. The likely reason is that electron or hole transfer from the NPs to
the substrate is blocked by the organic surfactants, which form an insulating layer.
Having observed the deleterious effects of the organic capping layer on the
photoelectrochemical properties of the particles, we performed additional XPS
measurements looking at C1s region which would indicate the presence of surface
carbon species, Figure 3.9a. The prominent peak at a binding energy of 286 eV is due
to carbon in sp3 configuration and the shoulder at 289 eV likely indicates the presence
of carbonyls. Surface carbon in XPS can be sputtered away by exposing a region of the
sample film to continuous X-ray irradiation which is energetic enough to break carbon-
carbon bonds. Over a period of 20 minutes, we sputtered away approximately 3nm of
carbon and the resulting XPS spectrum is shown in Figure 3.9c. A clear twofold
reduction in the signal intensity is observed as is the disappearance of the shoulder at
289 eV. With increased cleaning time, it is expected that the surface carbon can be
largely removed from the surface. We also looked at the effect of the carbon shell on
the other elemental peaks present in the sample. The Fe2p region before and after
sputtering is shown in Figure 3.9b,d. After cleaning, the signal to noise ratio is
significantly improved and identification of the fine structure of the Fe peaks is much
easier. Unfortunately, removing carbon contamination in this way is not practical as it is
time consuming and only works on exceedingly small areas of the sample. We therefore
set out to investigate other methods of removing surface carbon ligands.

76
Figure 3.9 XPS spectra of the C1s and Fe2p regions before and after removal of
carbon contamination by exposure to X-ray beam for a period of 20 minutes
3.4 Ligand Removal & Dye Degradation
Our first attempt to remove the ligands inherent in the particles synthesis was
based on a heat treatment of the nanocrystal film at elevated temperature. Such
calcination is straightforward to do as it simply pyrolyzes any surface carbon species
although leftover carbon may still be present as a “carbon black” residue. Another
concern is that the prolonged heating in air may alter the crystal structures of the
nanoparticles. Alloying of the separate HNC domains was also a concern at higher
temperatures, and therefore we selected 450°C as the calcination temperature, which
should be high enough to burn off surface carbon but not high enough to destroy the
hetero-structures. As-synthesized nanoparticles in heptane were drop-cast on Si
substrates and calcined at 450°C for 24 hours. Surface carbon content was monitored
by FTIR. The as-synthesized particles are capped with a mixture of oleic acid and

77
trioctylamine as evidenced by the dominant C-H stretch signal in the FTIR spectrum in
Figure 3.10. Following heat treatment, the FTIR is essentially featureless which
indicates complete removal of any carbon species from the surface of the film. The
PXRD patterns of the film before and after heating are shown in the right panel of Figure
3.10. The particles do not seem to have undergone a phase change despite the
prolonged heating at elevated temperature. The reflections of the iron oxide phase are
still dominant and the signal-to-noise ratio has improved due to the removal of the
amorphous carbon shell.
Figure 3.10 FTIR spectra (left) and PXRD patterns (right) of HNCs before and
after heat treatment at 450°C for 24hours in air
The heat treatment also had certain drawbacks. The removal of organic
surfactants leads to a loss in solubility and film quality subsequently suffers. The
prolonged heating in the absence of separating ligands also leads to sintering of the
particles and a loss of the HNC architecture. Figure 3.11a shows a TEM image of the
HNC particles after heat treatment. The nanocrystals have aggregated to sizes
exceeding 100 nm and the well-defined nature of the HNC domains has not been
preserved. As a result, thermal calcination of nanoparticle films does not seem to be an
effective method of ligand removal even though it is capable of removing most of the
surface carbon species.

78
Figure 3.11 TEM images of a) HNCs following ligand removal by calcination at
450°C and b) HNCs following ligand exchange with NOBF4 scale bars- 100nm
We then began exploring other methods of removing carbon contamination from
thin films of inorganic nanoparticles. Our experience with electron microscopy led us to
think about existing sample cleaning processes for hydrocarbon elimination from
sample grids in SEM and TEM. These treatments efficiently remove hydrocarbons
under reduced pressure and deep UV irradiation to break carbon-carbon bonds.
Oxygen or air plasma then reacts with the hydrocarbons to give species such as H2O,
CO, CO2 which are pumped away from the sample chamber. We used Hitachi’s ZONE
SEM cleaner and evaluated its effect on surface carbon contamination by XPS and
UPS. We tested the ZONE cleaner’s performance at two different distances from the UV
source and investigated the effect of time on carbon removal. The sample film was
placed as close as possible to the lamp (<0.5cm) or relatively far away (5cm). XPS
spectra were recorded after 5, 10, 20, and 50 total minutes of treatment. The data when
the sample was held relatively far from the lamp is summarized in Figure 3.12.

79
Figure 3.12 XPS spectra of a) C1s region b) Fe 2p region c) Cu 2p region and d)
UPS spectra of the secondary electron cut-off region of HNC films at a distance of 5 cm
from the UV source in the ZONE cleaner
There is a pronounced decrease of approximately 30% in the intensity of the
carbon signal shown in Figure 3.12a after cleaning for a total of 50 minutes. Carbon
removal seems to quite efficient up to 10 minutes but the effect decreases with
prolonged cleaning. Therefore the treatment was not continued beyond 50 minutes. The
shoulder peaks corresponding to carbonates were still present, indicating that those
species were not effectively removed. The Fe and Cu 2p regions in Figure 3.12b,c show
a significant improvement in signal intensity due to carbon removal after only 5 minutes
of ZONE cleaning. Subsequent cycles seem to have no big effect on signal strength.
The secondary electron cutoff region of the UPS spectrum is shown in Figure 3.12d.
The left-hand x-intercept is used to calculate the work function of the material, and so

80
the observed shifts show how easily the work function can be influenced by extraneous
surface species. The shoulder peaks are likely due to substrate effects, but there is a
clear shift to lower binding energies which decreases with increasing treatment time.
We then performed a similar XPS/UPS analysis while holding the sample film as
close as possible (<1cm) to the UV lamp inside the reactor. Carbon removal was a lot
more efficient compared to when the sample was held at 5cm from the lamp, Figure
3.13a. The carbon signal is reduced to roughly 1/3 of its original level after 20 minutes
treatment, and is essentially reduced to zero after 50 minutes. There is a much more
pronounced shift to lower binding energies with increasing treatment time likely caused
by increased sample charging. The Fe and Cu 2p signals in Figure 3.13b,c show a
similar signal enhancement as the 5cm sample even after only 5 minutes of cleaning.
Interestingly, the signal after 50 minutes is significantly lower than expected for both Fe
and Cu. This is possibly associated with a surface rearrangement caused by the
prolonged exposure to UV light or it could be an artifact. The secondary electron cutoff
spectra in Figure 3.13d show a huge variation in the work function of the materials.
Such variations of over 8 eV are unlikely to be realistic even under UV irradiation and
high vacuum conditions. We suspect that severe surface charging and material
degradation occurs when the film is held close to the lamp. Based on these results, 20
minutes was selected as the optimum time for future ZONE cleaning treatments of
carbon-coated nanomaterials. The ZONE treated films were then tested for photo-
assisted CO2 reduction using the conditions described above. We did not see any
increase in the production rates of CO and CH4, which were still barely in the nmol/hr
range. Such low concentration of isotope-labelled products was approaching the
detection limit of our GC/MS instrument, and we decided that it was not worth
performing isotope labelling experiments with 13CO2 as rates that low are likely to be
due to remaining carbon contamination and not genuine CO2 reduction.

81
Figure 3.13 XPS spectra of a) C1s region b) Fe 2p region c) Cu 2p region and d)
UPS spectra of the secondary electron cut-off region of HNC films at a distance of <1cm
from the UV source in the ZONE cleaner
After attempting to remove carbon from thin films of our particles, we switched
our attention to solution-phase ligand exchange protocols which have been growing in
versatility over the last few years.9–11 The majority of these protocols aim to remove
long-chain organic surfactants to improve the electronic properties of colloidal
nanocrystals for applications in photovoltaics and solar energy conversion. This typically
involves introducing much shorter, charged capping molecules which reduce
interparticle spacing and enable increased electronic coupling of neighboring
nanocrystals. Murray et. al. recently developed a ligand exchange methodology
employing nitrosonium tetrafluoroborate (NOBF4) to replace hydrocarbon ligands and
solubilise nanocrystals in polar hydrophilic solvents.11 It was shown that NOBF4 was
effective in stabilizing a number of different materials including Fe3O4, TiO2, and FePt.11
We chose to use this protocol to attempt to exchange oleic acid and trioctylamine on the
surface of HNCs with the charged BF4- ion. Performing the ligand exchange on the

82
isolated γ-Fe2O3 particles was successful; the particles became soluble in
dimethylformamide.
Figure 3.14 FTIR spectra (left) and TEM images (right) of γ-Fe2O3 NCs before
and after ligand exchange with NOBF4
FTIR did not show any residual carbon post-exchange and TEM images of the
resulting polar-soluble particles indicated that the particles maintained their size and
shape although some aggregation into large clusters was observed, Figure 3.14. When
we performed the ligand exchange on HNCs particles, we observed aggregation of the
particles and loss of the HNC architecture, see Figure 3.11b. Solubility in DMF was poor
compared to the isolated iron oxide nanocrystals because of their much larger particle
sizes. Evidently, the Cu2O domains were not stable to NOBF4 since the separate Fe2O3
particles withstood the ligand exchange.
Despite the aggregation observed after ligand exchange process, we elected to
proceed and use the HNC particles in liquid phase dye degradation. Dye degradation
experiments are among the simplest ways to demonstrate photocatalytic activity. An
organic dye is added to an aqueous suspension of the catalyst and its UV-VIS
absorption monitored over time under illumination. The dyes are typically oxidatively
degraded by holes in the semiconductor’s valence band. We predicted that the type II

83
band alignment between γ-Fe2O3 and Cu2O will lead to reduced overlap electron and
hole wavefunctions and extend the lifetime of the carriers. The charge carriers should
then more efficiently carry out surface-based redox reactions with adsorbed reactants
compared to the separate components. To show this experimentally, we evaluated the
photocatalytic degradation of methylene blue (MB) using γ-Fe2O3/Cu2O HNCs, their
separate components, and TiO2 as a reference photocatalyst. The bare Cu2O and
Fe2O3 were also treated with NOBF4 prior to the dye degradation test. The ligand
exchange renders the nanocrystal surface accessible for dye adsorption which was
allowed to proceed for 40 minutes in the dark prior to illumination. The performance of
the various catalysts under illumination is shown in Figure 3.15a.
Figure 3.15 a) Extent of MB photocatalytic degradation over various catalysts as
determined by monitoring the main absorption peak at ~ 667nm. b) UV-Vis spectra of
the MB aqueous solution at various intervals over the γ-Fe2O3/Cu2O photocatalyst

84
The HNCs exhibit a higher rate of MB degradation than their components despite
the loss of the heterostructure. A synergistic effect between the copper and iron oxide
phases is likely occurring leading to improved charge separation. Methylene blue
degradation is thought to proceed through aromatic ring opening hydroxylation driven by
hydroxyl radicals generated upon neutralization of OH- groups by photogenerated
holes.12 This process will occur more efficiently if electron-hole recombination is
suppressed in the γ-Fe2O3/Cu2O composites. However, a control experiment with P25
TiO2 exhibited much improved activity compared to the HNCs despite its inferior visible
light absorption. The lower relative performance of HNCs can be explained by poor
dispersion of the aggregated HNCs in aqueous solution following ligand exchange. In
contrast, P25 has a hydroxylated surface which makes it much more soluble in water.
Figure 3.15b also shows the temporal UV-Vis spectra of the MB solution which exhibit a
decrease in both the aromatic and chromophoric absorbance maxima of MB indicating
that dye is being degraded and not simply decolorized.
3.5 Conclusions
In this chapter, we studied the surface properties of Fe2O3/Cu2O by XPS/UPS,
investigated ligand exchange and removal techniques, and applied the materials to gas
phase CO2 reduction and aqueous methylene blue degradation. The binding energy of
the Fe2p region of the as-synthesized particles confirmed that the iron oxide domain
was likely γ-Fe2O3 as determined by Raman spectroscopy in Chapter 2. UPS allowed
us to construct a band diagram of the components in the system and confirmed the type
II band alignment between Cu2O and Fe2O3. The HNCs were found to have an
intermediate VB/CB edges and work function due to contributions by both domains. The
particles did not exhibit a surface photovoltage response likely due to the insulating
nature of the capping ligands. We investigated UV photolysis, thermal calcination, and
solution-phase ligand exchange as different options for ligand removal and found that
the latter two, though effective, led to aggregation and loss of the HNC architecture. The
UV treatment was less effective with up to 30% carbon still present after 20 minutes.
Complete carbon removal was possible after prolonged UV treatment but the irradiation
seemed to have a questionable effect on the HNC films, inducing huge shifts in the work

85
function which were likely not realistic. Applying the HNCs to photo-assisted CO2
hydrogenation produced nmol/hr rates of CO and CH4 which were attributed to
background carbon contamination from the ligands. The UV-cleaned samples did not
show improved rates however HNCs treated with NOBF4 were found to be more active
than their separate components for aqueous phase methylene blue degradation. A
synergistic effect between the Cu2O and Fe2O3 phases was likely responsible despite
the loss of the HNC architecture.
3.6 Experimental Section
General Characterization - Powder X-ray diffraction (PXRD) was performed on
a Bruker D2-Phaser X-ray diffractometer, using Cu Kα radiation at 30 kV. Fourier
transform infrared spectroscopy (FT-IR) was performed using a Perkin Elmer Spectrum-
One FT-IR fitted with a universal attenuated total reflectance (ATR) sampling accessory
with a diamond coated zinc selenide window. UV-VIS absorbance of the samples was
measured using a Lambda 1050 UV/VIS/NIR spectrometer from Perkin Elmer. Low
resolution TEM images were acquired on a Hitachi H-7000 conventional TEM operating
at 100kV.
Photoelectron Spectroscopy - XPS/UPS spectra were acquired using a PHI
5500 instrument. An Aluminum K-alpha light source with X-ray wavelengths of 1486.7
eV under UHV conditions (< 1 x 10⁻⁹ Torr) was used for XPS spectra. Photons with
energy of 21.22 eV generated by helium plasma with a back pressure of 2 x 10⁻⁵ Torr
were used for UPS spectra. A beam of Xenon ions with kinetic energy of 3.0 eV was
used to sputter-clean the sample surface of organic ligand prior to analysis. Sputtering
was performed for an average of three minutes corresponding to a sputtering depth of ~
2nm. Samples for XPS/UPS analysis were prepared by drop-casting dilute nanocrystal
solutions on p-doped Si(100) or FTO substrates to give a film of ~50 nm thickness. The
substrates were cleaned of organics by immersion into 3:1 NH4OH:H2O2 solution at
50°C for 12 hours prior to film formation.
Gas Phase Photocatalytic Measurements - Gas-phase photocatalytic rate
measurements were conducted in a custom fabricated 1.5 mL stainless steel batch

86
reactor with a fused silica view port sealed with Viton O-rings. The reactors were
evacuated using an Alcatel dry pump prior to being purged with the reactant gases H2
(99.9995%) and CO2 (99.999%) at a flow rate of 6 mL min-1 and a stoichiometry of
either 4:1 (stoichiometric for Sabatier reaction) or 1:1 (stoichiometric for reverse water
gas shift reaction). During purging, the reactors were sealed once they had been heated
to the desired temperature. The reactor temperatures were controlled by an OMEGA
CN616 6-Zone temperature controller, with a thermocouple placed in contact with the
sample. The pressure inside the reactor during reaction was monitored during the
reaction using an Omega PX309 pressure transducer. Reactors were irradiated with a
1000 W Hortilux Blue metal halide bulb or a Newport 300 W Xe Lamp (at a distance of 4
cm and a light intensity of 2.2 suns) for a period of 16 hours. Product gases were
analyzed by a flame ionization detector (FID) and thermal conductivity detector (TCD)
installed in a SRI-8610 Gas Chromatograph (GC) with a 3’ Mole Sieve 13a and 6‘
Haysep D column. The reactor was held in a custom designed stand. Heating was
supplied from a heated copper block fixed below the fixed catalyst bed. A thermocouple
was in contact with the top of the reactor so that the reactor maintained a constant
temperature of 150 °C. Samples were prepared by drop-casting nanocrystal solutions
onto high resistivity glass slides (2 inch by 2 inch) to give a sample loading in the range
of 20-50 mg followed by drying of the films in vacuo at 60°C overnight.
Surface Photovoltage Measurements - Solutions of Cu2O NPs, pure Fe2O3
NPs, and Cu2O/Fe2O3 hetero-structured NPs, dispersed in hexane, were drop coated
one FTO substrates, and dried in air. The drop-coating was repeated 5 times to achieve
films with sufficient thickness. Trioctylamine (TOA) films were made by coating an FTO
substrate for 6 hours, followed by washing with methanol, and drying in air overnight.
UV/VIS absorption spectra were recorded for the solutions. Surface photovoltage
Spectroscopy (SPS) measurements were conducted using a vibrating gold Kelvin probe
(Delta PHI Besocke) mounted inside a home-built vacuum chamber (<10-4 mbar). Film
Samples were illuminated with monochromatic light from a 150 W Xe lamp filtered
through an Oriel Cornerstone 130 monochromator (1-10 mW·cm-2). The SPV spectra
were corrected for drift effects by subtracting dark scan background.

87
Ligand Exchange and Removal – Solution phase ligand exchange with
nitrosonium tetrafluoroborate was performed according to the published procedure by
Murray et.al.11 Briefly, 5 mL of NC dispersion in heptane (~5 mg/mL) was combined with
5 mL of dichloromethane solution of NOBF4 (0.01 M) at room temperature. The resulting
mixture was shaken gently until the precipitation of NCs was observed, typically within 5
min. After centrifugation to remove the supernatant at 7800 rpm for 5 min, the
precipitated NCs were re-dispersed in acetonitrile. To purify NCs, toluene and heptane
(1:1 by volume) were added to aggregate the NC dispersion. After centrifugation,
acetonitrile was again added to redisperse NCs to form a stable colloidal dispersion.
Ligand removal by thermal treatment was performed on drop-coated nanocrystal
films on glass substrates. A solution of NCs in heptane (~5 mg/mL) was drop cast onto
a glass slides to give a film of several hundred nanometers in thickness. The film was
calcined in an oven at 450°C in air for 24 hours and the powder was scraped off the film
with a spatula in order to do PXRD.
Ligand removal by ZONE cleaning was performed on nanocrystal films drop-cast
from heptane solutions using the ZONE SEM cleaning system from Hitachi. The films
were placed in the ZONE cleaner at distances of 50mm and <10mm from the UV light
source and ZONE cleaning was performed for a duration of 5, 10, 20, or 50 minutes.
The pressure inside the chamber was ~ 10-4 Torr. Analysis of the carbon content by
XPS was performed at the above time intervals and the sample was placed back in the
ZONE cleaner
Photocatalytic Dye Degradation - 25 mg of the various catalysts following
ligand exchange with NH4SCN were added to 100 mL of 2.5 mg/L MB aqueous solution
in a Pyrex round bottom flask. The suspensions were stirred in the dark for 40 min in
order to reach an adsorption-desorption equilibrium prior to exposure to light. A 120W
Xe lamp equipped with an AM 1.5 filter was used as the light source. The reactor was
placed approximately 5 inches from the light source resulting in an average illumination
intensity of 1.3 Suns. The degradation of MB was monitored by taking aliquots from the
reaction suspension at various intervals and following the intensity of the main
absorbance peak at ~667nm. The suspended catalyst was removed by centrifugation
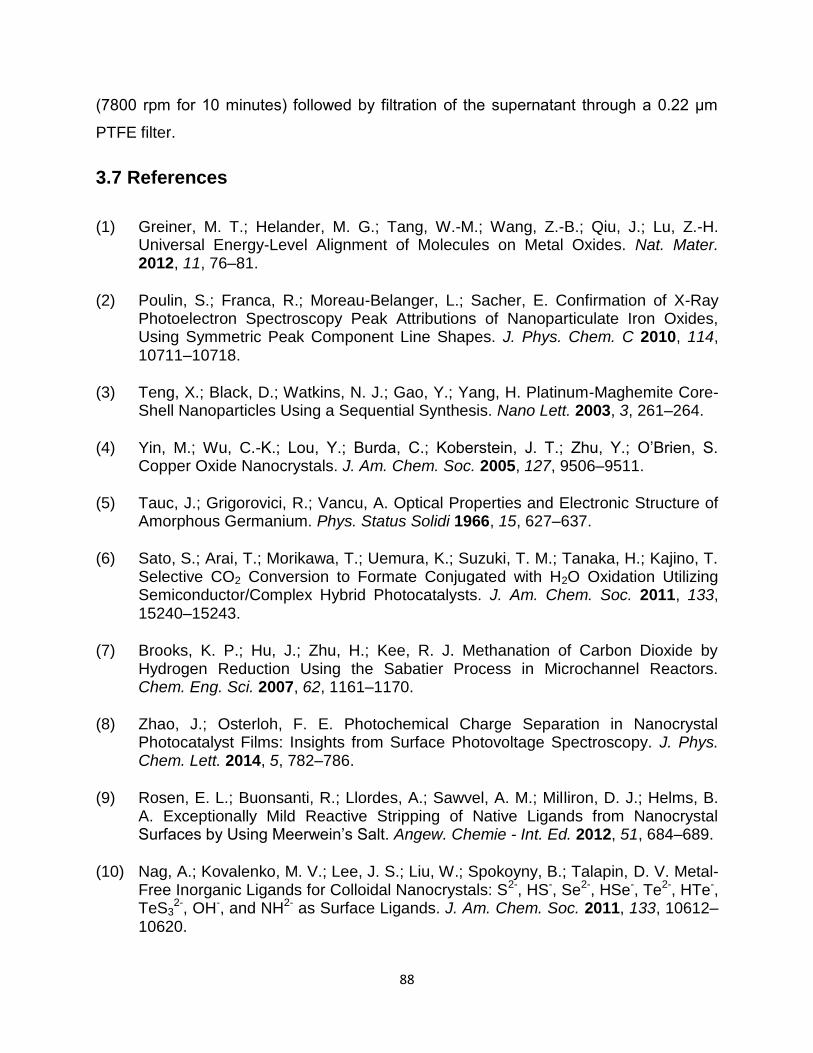
88
(7800 rpm for 10 minutes) followed by filtration of the supernatant through a 0.22 μm
PTFE filter.
3.7 References
(1) Greiner, M. T.; Helander, M. G.; Tang, W.-M.; Wang, Z.-B.; Qiu, J.; Lu, Z.-H. Universal Energy-Level Alignment of Molecules on Metal Oxides. Nat. Mater. 2012, 11, 76–81.
(2) Poulin, S.; Franca, R.; Moreau-Belanger, L.; Sacher, E. Confirmation of X-Ray Photoelectron Spectroscopy Peak Attributions of Nanoparticulate Iron Oxides, Using Symmetric Peak Component Line Shapes. J. Phys. Chem. C 2010, 114, 10711–10718.
(3) Teng, X.; Black, D.; Watkins, N. J.; Gao, Y.; Yang, H. Platinum-Maghemite Core-Shell Nanoparticles Using a Sequential Synthesis. Nano Lett. 2003, 3, 261–264.
(4) Yin, M.; Wu, C.-K.; Lou, Y.; Burda, C.; Koberstein, J. T.; Zhu, Y.; O’Brien, S. Copper Oxide Nanocrystals. J. Am. Chem. Soc. 2005, 127, 9506–9511.
(5) Tauc, J.; Grigorovici, R.; Vancu, A. Optical Properties and Electronic Structure of Amorphous Germanium. Phys. Status Solidi 1966, 15, 627–637.
(6) Sato, S.; Arai, T.; Morikawa, T.; Uemura, K.; Suzuki, T. M.; Tanaka, H.; Kajino, T. Selective CO2 Conversion to Formate Conjugated with H2O Oxidation Utilizing Semiconductor/Complex Hybrid Photocatalysts. J. Am. Chem. Soc. 2011, 133, 15240–15243.
(7) Brooks, K. P.; Hu, J.; Zhu, H.; Kee, R. J. Methanation of Carbon Dioxide by Hydrogen Reduction Using the Sabatier Process in Microchannel Reactors. Chem. Eng. Sci. 2007, 62, 1161–1170.
(8) Zhao, J.; Osterloh, F. E. Photochemical Charge Separation in Nanocrystal Photocatalyst Films: Insights from Surface Photovoltage Spectroscopy. J. Phys. Chem. Lett. 2014, 5, 782–786.
(9) Rosen, E. L.; Buonsanti, R.; Llordes, A.; Sawvel, A. M.; Milliron, D. J.; Helms, B. A. Exceptionally Mild Reactive Stripping of Native Ligands from Nanocrystal Surfaces by Using Meerwein’s Salt. Angew. Chemie - Int. Ed. 2012, 51, 684–689.
(10) Nag, A.; Kovalenko, M. V.; Lee, J. S.; Liu, W.; Spokoyny, B.; Talapin, D. V. Metal-Free Inorganic Ligands for Colloidal Nanocrystals: S2-, HS-, Se2-, HSe-, Te2-, HTe-, TeS3
2-, OH-, and NH2- as Surface Ligands. J. Am. Chem. Soc. 2011, 133, 10612–10620.

89
(11) Dong, A.; Ye, X.; Chen, J.; Kang, Y.; Gordon, T.; Kikkawa, J. M.; Murray, C. B. A Generalized Ligand-Exchange Strategy Enabling Sequential Surface Functionalization of Colloidal Nanocrystals. J. Am. Chem. Soc. 2011, 133, 998–1006.
(12) Houas, A. Photocatalytic Degradation Pathway of Methylene Blue in Water. Appl. Catal. B Environ. 2001, 31, 145–157.

90
Chapter 4 – Investigations of Cu2O Nanocubes as Semiconducting Scaffolds for
Photocatalytic H2 Evolution and CO2 Reduction
4.1 Abstract
This chapter presents our work on the synthesis, characterization, and
gas/aqueous phase CO2 reduction and H2 evolution activity of Cu2O nanocubes. We
used a hydrophilic approach to reproducibly synthesize Cu2O nanocubes followed by
characterization of their structural and electronic properties by electron microscopy, X-
ray diffraction, and photoelectron spectroscopy. We then developed a solution-phase
coating approach to uniformly deposit TiO2 on the surface of Cu2O to give core-shell
Cu2O@TiO2 composites. Decoration of the Cu2O cubes and Cu2O/TiO2 composites with
noble metal co-catalysts such as Au, Pt, and Pd was then performed by photo-
deposition. The resulting catalysts were tested for light assisted gas-phase CO2
hydrogenation and H2 evolution from water/alcohol mixtures employing a sacrificial hole
scavenger. In the aqueous phase, it was found that bare Cu2O cubes and many of the
synthesized composites were inactive as photocatalysts for these reactions, however
some activity was observed with samples that had apparently undergone reduction of
Cu2O to Cu0 under irradiation. Therefore we then studied the performance of
commercial Cu0 nanopowder dispersed on P25-TiO2 as a model system and found the
optimal Cu loading for H2 evolution. We concluded the aqueous phase study by
examining the effects of the alcoholic hole scavengers (MeOH, EtOH) and metal co-
catalysts (Au, Pt, Cu) on product selectivity using TiO2 as a proven semiconductor
scaffold. We found that light-assisted reforming of the hole scavenger to CO, CH4 and
higher hydrocarbons is responsible for product formation along with H2O reduction. In
the gas phase, we detected possible evidence for light enhancement of product
formation over the Cu2O-based catalysts but the rates of CO and CH4 were too low to
be confirmed with isotope labelling experiments.

91
4.2 Introduction
In the previous chapter, we described the challenges caused by the presence of
organic capping ligands on the surfaces of photocatalytic nanomaterials. These
insulating long-chain hydrocarbons hinder electronic coupling between neighboring
nanocrystals, prevent reactant molecules’ access to the nanoparticle surface, and can
decompose under testing conditions to give false positive signals in hydrocarbon
detection. Unfortunately, high temperature solution phase synthetic methods invariably
make use of these molecules to prevent nanocrystal aggregation and provide solubility
in organic solvents. Their complete removal by ligand exchange or calcination can be
challenging as it typically results in undesirable chemical and structural changes to the
nanoparticles’ inorganic cores. As a result, we decided to focus on aqueous synthetic
procedures which rely on charge stabilization of colloids for solution stability. Typically,
hydrophilic synthetic methods have resulted in comparatively poor control of size,
shape, and crystallinity relative to high temperature non-aqueous approaches. Recently,
a number of reproducible aqueous synthetic methods have been reviewed yielding
various nanocrystalline metals and metal oxides.1–7 In this chapter, we will continue to
focus on Cu2O which is one of the most promising cathode materials for solar fuel
applications. Its narrow bandgap, favourable energetics, elemental abundance, and low
cost are some of the reasons why there has been a growing interest in developing
systems based on this material. Numerous papers reporting reproducible syntheses of
Cu2O nanocubes, octahedra, nanowires, and hollow particles have recently been
published.8–13 In terms of shape, nanocubes were chosen for our study because of their
ease of synthesis and ability to be converted into other shapes if needed.9,14 Studies
demonstrating Cu2O’s potential for water splitting, dye-degradation, gas sensing, and as
electrode material in lithium ion batteries have been published.15–19 Most of the
challenges associated with Cu2O revolve around its oxidative and reductive instability in
aqueous solution and poor charge carrier diffusion length.20 The general strategy to deal
with these issues is deposition of a metal co-catalyst that acts an electron sink to
simultaneously promote charge separation and alleviate self-photocorrosion of Cu2O.21–
24 The rest of this chapter will describe our work in using Cu2O nanocubes as a template
for the development of multi-component solar fuel photocatalysts.

92
4.3 Results and Discussion
Aqueous Cu2O nanocubes were synthesized from Cu(SO)4·5H2O by a modified
literature procedure.25 Initially, Cu(SO)4·5H2O was converted to the corresponding
hydroxide, Cu(OH)2, by treatment with NaOH. Sodium citrate was added to the
precursor solution to act as a chelating agent for Cu2+ thereby reducing the
concentration of Cu(OH)2 with increasing amount of citrate added. Addition of ascorbic
acid as the reducing agent gave Cu2O nanocubes over the course of a 30 minute
reaction at room temperature. By controlling the amount of citrate added, the size of the
corresponding cubes could be varied in the range of 50-100 nm, see Figure 4.2.
Formation of copper citrate reduces the concentration of Cu(OH)2 crystallites which act
as seeds for the nucleation of Cu2O following reduction with ascorbic acid. Fewer seeds
go on to form larger particles whereas higher Cu(OH)2 concentrations lead to a larger
number of seeds and correspondingly smaller cubes, Figure 4.1.
Figure 4.1 Scheme of Cu2O nanocube formation using sodium citrate as
chelating agent to control particle size (Reprinted with permission from Ref (25)
Copyright (2013) Royal Society of Chemistry)
An average particle size of 82 nm was observed when the molar ratio of citrate to
copper sulfate was maintained at 0.75:1. When the ratio is reduced to 0.25:1, the
increased number of Cu(OH)2 seeds reduces the average particle size to 58 nm.

93
Nanocubes were the only morphology observed for the particles by TEM. The
monodispersity of the synthesis is quite high, with a standard deviation of only 5% for
the regular prep and 9% for the reduced citrate synthesis. In the absence of citrate,
small 30-50 nm Cu2O cubes agglomerate into larger structures of over 100 nm in
diameter. By imaging a film of nanocubes on a glassy carbon electrode, we confirmed
that there is significant porosity in the nanocrystal film which we hypothesized would
allow reactant molecules in the aqueous and gas phases to infiltrate and reach the
majority of particle surfaces.
Figure 4.2 a,b) Dark and bright field TEM images of as synthesized Cu2O
nanocubes with an average size of 82 nm (scale bar 100nm) c,d) Dark and bright field
SEM images of Cu2O nanocubes on a TEM grid and glassy carbon electrode
respectively
The powder X-ray diffraction pattern of the nanocubes in Figure 4.3b indicated
that the sample was pure cuprite (Cu2O) without any impurity phases. Using XPS we
found a small amount of Cu2+ present on the surface of the cubes indicating residual
copper sulfate precursor or a thin shell of CuO. Its absence from the PXRD spectrum

94
indicated that it is likely a very thin or amorphous Cu2+ layer. The FTIR spectrum
suggested that the particle surface is generally free of carbon species. The citrate and
ascorbate species present on the surface are not covalently bound and are likely
washed away during purification of the nanocubes. A weak OH peak in the FTIR
indicates surface hydroxides or adsorbed moisture, and there is no evidence of C-H
stretching modes.
Figure 4.3 a) Particle size distribution of Cu2O synthesized using 0.75 and 0.25
equivalents of citrate b) PXRD pattern c) XPS scan of Cu2p region and d) FTIR
spectrum of as-synthesized Cu2O nanocubes
Once we had confirmed the synthesis of the cubes by TEM and PXRD, we
turned to studying their thermal oxidation stability which is a concern for Cu2O as it
contains copper in the unstable +1 oxidation state. We first heated the powdered
nanocubes for 1 hour at temperatures ranging from 100°C – 500°C in air and looked at
the resulting PXRD patterns. The cubes were stable at 100°C and 200°C under these

95
conditions as seen in the top of Figure 4.4. After 1 hour at 300°C, the Cu2O cubes
began to partially convert to CuO, and after treatment at 500°C the oxidation was
essentially complete. Based on these results, we selected 200°C as the temperature to
conduct a prolonged heating of the cubes, shown in the bottom of Figure 4.4. At 200°C,
no oxidation was observed after 4 hours of heating in air, which was crucial for
depositing a thin shell of TiO2 and its crystallization, as explained below.
Figure 4.4 top) PXRD patterns of Cu2O nanocubes heated at various
temperatures for 1 hour in air bottom) PXRD patterns of Cu2O cubes at increasing
times under 200°C in air

96
With a view on further improving the stability of our Cu2O nanocubes, we
developed a solution phase approach to coating them with a thin layer of TiO2. Cu2O is
prone to photo-degradation since the redox potentials of Cu1+ reduction to Cu0 and Cu1+
oxidation to Cu2+ in aqueous solution are both found within the energy range of the
Cu2O bandgap. In order to prevent the Cu2O surface from coming in contact with the
surrounding electrolyte, coating it with a protective layer of another metal oxide has
been shown to be a useful strategy. Gratzel and co-workers employed this method to
stabilize thin films of Cu2O with a thin layer of aluminum zinc oxide deposited by ALD.15
Here we used a slow hydrolysis of Ti(OBu)4 in alcoholic solution to lay down a
conformal amorphous TiO2 coating on the pre-formed Cu2O cubes. Figure 4.5 shows
TEM images of the resulting core-shell particles confirming complete surface coverage.
We also performed an EDX analysis which confirmed the presence of a thin TiO2 shell
on the surface of the cubes. Based on the TEM images and EDX signal intensities, we
estimated that the thickness of the TiO2 shell was in the range of 20-40 nm.
Figure 4.5 a-c) TEM images of Cu2O@TiO2 nanocubes (scale bar 500 nm) d-f)
Ti, Cu, and O elemental signals from EDX linescan in Panel B

97
Figure 4.6 top) PXRD pattern of as synthesized Cu2O@TiO2 nanocubes
showing absence of TiO2 reflections bottom) PXRD pattern of Cu2O@TiO2 nanocubes
following heat treatment at 200°C for 3 days
Interestingly, when we looked at the PXRD patterns of the resulting core-shell
particles we did not see any reflections corresponding to TiO2, see Figure 4.6 (top). The
thickness of the TiO2 layer as determined by TEM should be enough to give a sufficient
X-ray diffraction signal therefore its absence suggested that the TiO2 layer was
amorphous. An amorphous TiO2 layer might be effective in preventing Cu2O
decomposition but it is likely to adversely affect charge transport in the particles and
subsequently their photocatalytic performance. Therefore we attempted to crystallize
the TiO2 by thermal treatment in air at 200°C, a temperature at which the underlying
Cu2O cubes were found to be stable. We started out by heating for several hours but
did not observe any noticeable change in the PXRD patterns and so we continued the

98
heat treatment up to a period of 3 days. The results are shown in Figure 4.6. We still did
not observe any TiO2 reflections, but a partial oxidation of Cu2O to CuO had taken
place. It was apparent that 200°C was not a sufficiently high temperature for TiO2
crystallization. We then increased the temperature to 400°C and performed the heat
treatment under Ar atmosphere to try and prevent oxidation of the nanocubes to CuO.
Under these conditions, we found that a heating time of 30 minutes was sufficient to
crystallize the TiO2 coating to a mixture of anatase and rutile polymorphs, Figure 4.7.
Figure 4.7 a) PXRD pattern of Cu2O@TiO2 composites after calcination at 400°C
for 30 minutes under Ar b,c) TEM images of the composites before and after heat
treatment (scale bars 100 and 300 nm respectively)
PXRD confirmed that the cuprite crystal structure had been largely maintained
even under elevated temperature due to the inert atmosphere. TEM images of the
Cu2O@TiO2 composites taken before and after calcination indicate that the treatment

99
induced partial agglomeration of the particles into larger clusters of an average size in
the range of 200-400 nm. The increased contrast of the image following calcination is
caused by the crystalline TiO2 coating. With the TiO2 layer being no longer transparent
under the electron beam, we were not able to confirm that the underlying cube
morphology was preserved. However, Cu2O was still present by PXRD.
Once we had a developed an effective method to coat the Cu2O nanocubes in a
shell of crystalline TiO2 without changing its crystallinity, we turned our attention to the
deposition of noble metal co-catalysts to act as active sites on the semiconductor
cubes. Plenty of publications exist on the topic of decorating Cu2O nanomaterials with
metals such as Au, Pt, and Pd.21,26–28 The most straight forward approach is simple
galvanic replacement of Cu+ with a cation that is more easily reduced on the
electrochemical series, although this often results in poor size control of the resulting
metal particles. Here we decided to employ photo-deposition by decomposing labile
metal precursors under UV irradiation. The Cu2O nanocubes were first illuminated in
order to excite electrons to the conduction band and improve the efficacy of metal cation
reduction. A solution of the metal ions in ethanol was then injected and irradiated for a
further period of time to complete the deposition. We varied the mass loadings of Pt, Au,
and Pd in the range of 2-10%. The small size and relatively low loadings of the
deposited metals made them difficult to detect by PXRD however the particles were
clearly visible by TEM as seen in Figure 4.8. We were able to successfully deposit small
(2-5 nm) particles of the above metals on bare Cu2O cubes and Cu2O@TiO2
composites. In the case of Cu2O/Metal particles, our motivation was to utilise the metal
domains as reduction centers where photogenerated electrons would funnel and reduce
CO2 or H2O to hydrocarbons or hydrogen. To protect Cu2O from oxidation, we
employed sacrificial reducing agents in the aqueous phase during testing to soak up
photogenerated holes. In the case of Cu2O@TiO2, the titania shell should act as a
barrier to photocorrosion of the Cu2O core, while being thin enough for photogenerated
electrons to tunnel through and reach the Pt sites on the surface. We chose to do an in-
depth study of the Cu2O/Pt system as Pt has been shown to be a very promising
reduction co-catalyst when used in conjunction with other semiconductors such as TiO2,
CdSe and Nb3O7OH.29–32

100
Figure 4.8 TEM images of Cu2O nanocubes decorated with various noble
metals a) Au (3%) b) Pt (10%) c) Coated with TiO2 and d) Pd (10%)
We started by testing the materials discussed so far for aqueous phase CO2
reduction and/or H2 evolution from water employing a sacrificial hole scavenger. We
utilised a 300 W Xe lamp and an AM 1.5 filter to simulate solar radiation and selected
MeOH as the hole scavenger. We elected to do preliminary testing on H2 evolution from
water instead of aqueous CO2 reduction because the reaction is kinetically simpler but
imposes many of the same light absorption, stability, and charge transport
requirements. It can therefore be used as a pre-screening tool on potential
photocatalysts. A photograph of the reactor setup is shown in Figure 4.9a and the
101
results are summarized in Table 4.1. Of all the samples tested, only the Cu2O@TiO2
and Cu2O-Pt@TiO
2 calcined samples produced any H2 from H2O/MeOH under AM 1.5
illumination. To clarify, these two samples represent Cu2O nanocubes coated with
crystalline TiO2 and Cu2O cubes decorated with Pt nanoparticles and subsequently
crystalline TiO2 respectively. Some general observations can be made from the data in
Table 4.1. The bare Cu2O cubes on their own are inactive likely due to charge
recombination within the particles or a lack of suitable surface activating sites for H2
evolution. The cubes were stable in aqueous solution under AM 1.5 which could be an
indication that carrier generation and charge transport within the nanocube volume was
the main issue. The stability was somewhat unexpected in view of Cu2O`s well-known
problems regarding photocorrosion although it could be a further indication that
electron-hole recombination in the Cu2O cubes was ultra fast and the charges did not
reach the surface.
Table 4.1 Rates of H2 Evolution from Water with Cu2O Nanocubes and Related
Materials as the Photocatalyst
Sample Rate of H2 Production
Bare Cu2O N/A
Cu2O@TiO
2 amorphous N/A
Cu2O@TiO
2 calcined 70 μmol g
-1 h
-1
Cu2O/Pt N/A
Cu2O/Au N/A
Cu2O/Pd N/A
Cu2O@TiO
2-Pt amorphous N/A
Cu2O@TiO
2-Pt calcined N/A
Cu2O-Pt@TiO
2 amorphous N/A
Cu2O-Pt@TiO
2 calcined 19 μmol g
-1 h
-1
Cu2O/WS
2 N/A
None of the Cu2O/Metal composite samples showed any activity either despite
the presence of the noble metal reducing sites. Again, this points to charge
recombination or insufficient charge generation by the cubes. We also looked at WS2

102
nanosheets developed in our lab as a co-catalyst but did not observe any activity.33 The
samples coated with TiO2 were the ones to show observable rates of H2 evolution. We
looked at Cu2O@TiO
2 with an amorphous or crystalline TiO2 coating, and observed an
average H2 production rate of 70 μmol /g h only with the calcined sample. This held true
across all tested samples; none of the amorphous samples showed any activity
confirming the importance of crystallinity to charge transport. For Cu2O@TiO
2, an
induction period was observed as seen in Figure 4.9b, where no H2 was produced in the
first few hours of the reaction, but a linear production rate was observed overnight.
Figure 4.9 a,c) Photographs of the aqueous phase photocatalytic testing setup
and reactor b,d) H2 evolution as a function of time from Cu2O@TiO2 nanocubes

103
We studied the Cu2O@TiO2 sample by PXRD before and after testing in Figure
4.10. The presence of Pt could not be confirmed by PXRD as expected, however
reflections attributed to the Cu2O core and TiO2 shell were clearly present. The
presence of metallic Cu after testing was also clearly observed indicating reduction of
Cu+1 to Cu0. It is possible that electrons generated on Cu2O migrated to the TiO2/Cu2O
interface and were unable to tunnel through the TiO2 layer. The accumulated electrons
then likely reduced Cu+1 to the metallic Cu seen in the PXRD pattern.
Figure 4.10 top) PXRD pattern of Cu2O-Pt@TiO2 particles before testing
bottom) PXRD pattern of Cu2O-Pt@TiO2 particles after testing; (inset) – photograph of
the catalyst suspension showing presence of metallic Cu

104
We also tested a series of 4 similar samples consisting of combinations of Cu2O,
Pt, and TiO2. The samples labelled Cu2O@TiO2-Pt were made by photo-depositing
platinum particles on Cu2O@TiO2 composites such that the Pt sites were depositing on
TiO2. The remaining two samples, labelled Cu2O-Pt@TiO2, were synthesized by photo-
depositing 3% Pt directly on the Cu2O cubes and then coating the entire assembly in a
thin layer of TiO2. The calcined Cu2O-Pt@TiO
2 sample was the second to show any
activity at an average rate of 19 μmol H2 /g h. The fact that both active samples
exhibited a TiO2 surface could be a sign that its surface chemistry is required to reduce
protons and could explain the lack of activity for Cu2O. No reductive decomposition was
seen in the Cu2O-Pt@TiO2 sample where Pt particles were present between the Cu2O
and TiO2 layers. However, we did not observe any activity for this sample. The active
Cu2O@TiO2 and Cu2O-Pt(3%)@TiO2 samples did not produce any hydrocarbon
products when tested in 0.1 M NaHCO3 as a source of CO2. We then suspected that the
nanocube morphology could be another reason why we were not observing products
from the majority of our catalysts. The cubes are typically terminated with {100} facets
which may have been inactive and so we purchased two commercial forms of Cu2O: a
bulk powder in the micron range and a sample labelled Cu2O “nanospheres” with
particle sizes in the 50-100nm range. Both of these samples exhibited irregular particle
morphologies that expose additional facets not seen in the nanocubes. Figure 4.11
shows the characterization we performed on these commercial samples prior to testing.
Both samples were nearly pure crystalline Cu2O however, the “nanospheres” were quite
poorly defined and did not show any identifiable nanoparticles, but rather a network of
interconnected copper oxide species. Regardless, when tested neither sample
produced H2 under the same testing conditions as above.

105
Figure 4.11 top) TEM image and PXRD pattern of commercial bulk Cu2O
powder used as a testing reference bottom) TEM image and PXRD pattern of
commercial Cu2O “nanospheres
Following the aqueous phase tests where we observed possible activity from two
of the samples, we decided to proceed with gas-phase testing. In the gas phase, the
absence of an electrolyte to conduct H+ could eliminate many of the photocorrosion
concerns around Cu2O-based materials. Light assisted CO2 hydrogenation was
performed under the standard conditions described in Chapter 3 and outlined in the
experimental section. We tested bare Cu2O nanocubes as a reference along with Cu2O-
Pt and the active Cu2O@TiO2 and Cu2O-Pt(3%)@TiO2 catalysts. Samples were
prepared by drop-casting nanocrystal ethanolic solutions onto high resistivity quartz
substrates and drying in vacuo. The results are summarized in Figure 4.12. We
detected the presence of CO and CH4 at rates of approximately 1 nmol/hr, similar to the
rates we previously observed from Cu2O/Fe2O3 HNCs. The experiments were repeated
two or three times and showed good reproducibility from batch to batch. We first
compared the bare Cu2O cubes with the core-shell Cu2O@TiO2 particles.

106
Figure 4.12 a) Rates of CO and CH4 over multiple runs from bare Cu2O
nanocubes and Cu2O@TiO2 composites b) CH4 production rates from Cu2O-
Pt(3%)@TiO2 composite (no CO detected) c) CO and CH4 evolution rates on the Cu2O-
Pt(3%) sample over multiple runs

107
The latter consistently produced slightly higher hydrocarbon evolution rates
including an amplifying effect under irradiation in the case of CO. The Cu2O-
Pt(3%)@TiO2 sample only produced methane and no CO as seen in Figure 4.12b with
a twofold rate enhancement under light. Finally, the Cu2O-Pt particles gave both CO
and CH4 at similar nmol/hr rates; once again CO rates were higher under illumination
whereas CH4 production was the same under dark and light conditions. The absence of
a light effect in the case of CH4 suggests that it was being produced from carbon
contamination sources and not CO2 reduction. The light enhancement observed for CO
could be promising however the overall rates were still too low to be confirmed with
13CO2 isotope labelling by GC/MS. Based on this data, we concluded that the Cu2O
nanocube catalysts were not active under these conditions for the gas phase
hydrogenation of CO2. After observing H2 production activity for the Cu2O@TiO2
sample, we hypothesized that it may have been caused by the reduction to Cu0 seen in
Figure 4.10. A Cu/TiO2 system formed in-situ by reduction of Cu2O@TiO2 could be an
effective water reduction catalyst as it contains a metal-semiconductor junction to
separate charges, and a catalytic metal site. We synthesized a model Cu/TiO2 catalyst
by simple physical grinding of commercial P25 and nanoparticulate Cu powders. We
varied the % Cu loading in the range of 0.1% to 50% and also looked at pure Cu
nanopowder and pure P25 particles as controls. Using the aqueous phase testing
setup, we obtained rates of H2 production that were up to 2 orders of magnitude higher
than those obtained using the catalytic systems based on Cu2O nanocubes, Table 4.2.
Table 4.2 Rates of H2 evolution from water using P25/Cu (10%) mixture and its
separate components
Sample Rate of H2 Production
(mmol g-1 h-1) Cu Nanopowder N/A
P25 TiO2 0.23 ± 0.02 P25/Cu (0.1%) 0.30 ± 0.9 P25/Cu (1%) 4.0 ± 0.8
P25/Cu (10%) 3.9 ± 0.9 P25/Cu (50%) 1.6 ± 0.9

108
Bare TiO2 produced H2 at a rate of ~230 μmol g-1 h-1 compared to the highest
rate of 70 μmol g-1 h-1 obtained using the Cu2O@TiO2 system. The fact that TiO2 which
only absorbs approximately 4% of the solar spectrum performed better than the Cu2O-
based systems indicates that charge generation and/or surface chemistry was inefficient
in the Cu2O nanocubes. When various amounts of Cu were added, a significant
increase in H2 evolution was observed. Maximum rates on the order of 4.0 mmol g-1 h-1
were obtained for the 1% and 10% Cu loading catalysts, Figure 4.13. Amounts of CH4
and CO in the μmol range were also found which are likely a product of side reactions of
the hole scavenger since no additional carbon source such as NaHCO3 had been
added except the alcoholic scavengers. The effect of scavengers on product distribution
will be discussed below. PXRD patterns taken before and after testing did not show any
structural changes caused by illumination. We also performed a control experiment
where we prepared a physical mixture of Cu nanopowder and Cu2O nanocubes in the
same fashion as the Cu/TiO2 mixture. Once again, this system was inactive despite the
presence of the metal, indicating that the Cu2O cubes were not effective in photo-
generating charge carriers.

109
Figure 4.13 a,c) H2 evolution rates of a function of Cu loading in Cu/TiO2
catalysts and H2 evolution profile with time over the P25/Cu (10%) catalyst b,d) PXRD
patterns of P25/Cu (10%) samples before and after testing
We studied the effect of different hole scavengers (MeOH, EtOH etc.) and
different metallic co-catalysts (Au, Pt) on the product distribution over P25 samples. Our
findings are summarized in Figure 4.14. All catalysts were tested under AM 1.5
illumination with 25 % v/v scavenger in deionized water. Control reactions in the dark
and in the absence of a catalyst did not result in any detectable products above the
background. Pure P25 produced mainly hydrogen with small amounts of CO and trace
CH4. This result was in good agreement with the data in Table 4.2 on pure P25. We
then looked at the effect of the alcohol scavenger on the products over a P25/Pt (1%)
catalyst which was prepared in the same way as the P25/Cu samples earlier.

110
Figure 4.14 Hydrocarbon and H2 evolution rates over various model catalysts
using different hole scavengers
In the presence of MeOH, H2 is the predominant product with a production rate of
almost 15 mmol g-1 h-1. Recall that using the P25/Cu (1%) sample, we obtained an
average rate of 4 mmol g-1 h-1. The dramatic increase in H2 production compared to the
bare P25 sample was noted, confirming the beneficial effects of metal semiconductor
junctions on photocatalysis. CH4 is seen as a side product at a rate of ~ 12 μmol g-1 h-1.
If EtOH is used as the scavenger, hydrogen production is relatively unchanged but the
amount of CH4 produced increases drastically to ~260 μmol g-1 h-1. We suspect that this
is due to decarboxylation of acetic acid under illumination; a pathway termed the photo-
Kolbe reaction.34,35 EtOH likely undergoes consecutive 2e- oxidations to acetaldehyde

111
and then acetic acid. Acetic acid then reacts with a further oxidizing equivalent to give
CH4 and CO2 according to Equations 4.1 and 4.2. Ethane was also detected as a
relatively minor product as per Equation 4.3.
(4.1) CH3COOH + h+ → •CH3 +CO2 + H+
(4.2) •CH3 + CH3COOH → •CH2COOH + CH4
(4.3) 2 CH3COO- → CH3CH3 + 2CO2
We then looked at the effect of changing the co-catalyst on product distribution.
We prepared P25/Au (1%) samples by physical grinding of Au and TiO2 nanopowders
as was done for Pt and Cu. We still obtained H2 as a major product albeit at significantly
lower amounts compared to Pt. Interestingly, the most abundant product when using
MeOH as the scavenger was CO which was not detected for P25/Pt. The mixture of CO
and H2 produced by the P25/Au system is referred to as syngas. In the presence of
EtOH, CH4 is produced at the expense of CO likely similar to the pathway using P25/Pt.
We also looked at two inorganic scavengers, sodium iodide (NaI) and sodium
thiosulfate (Na2S2O3) to rule out the presence of carbon. We did not see any detectable
amounts of hydrocarbons or H2 above the background levels of these products. This
data indicates that the identity of the organic scavenger is very important in determining
the products of aqueous “water splitting” experiments. Furthermore, the protons in the
scavenger undergo rapid exchange with protons from H2O so that the products detected
originate from both H2O and the scavenger. Therefore it is hard to decouple genuine
water splitting from MeOH/EtOH reforming and many published results in the field
should be viewed with caution if water splitting is claimed as the sole method of H2
evolution.
4.4 Conclusions
In this chapter we investigated Cu2O nanocubes as a semiconducting scaffold for
the synthesis of multiple component photocatalytic architectures. We first described the
synthesis and provided characterization of the nanocubes using TEM, powder X-ray
diffraction and XPS. The nanocubes were reproducibly synthesized with sizes on the
range of 50-100 nm and were found to contain much lower levels of carbon species on
the surface as compared to the Fe2O3/Cu2O particles in Chapters 3 and 4. We then

112
developed a methodology for coating the nanocubes with a conformal layer of
amorphous TiO2 and crystallizing it via heat treatment under inert conditions. We then
deposited noble metals (Au, Pt, Pd) by photo-decomposition of labile precursors onto
the bare Cu2O cubes and the core-shell Cu2O@TiO2 and tested these materials for H2
evolution from H2O/MeOH solutions under illumination. We found the majority of the
catalysts were inactive with the exception of Cu2O@TiO2 and Cu2O/Pt@TiO2 which
gave modest rates in the μmol g-1 h-1 range. Both of these samples exhibited a
crystalline TiO2 surface and we observed metallic Cu by PXRD in the case of
Cu2O@TiO2 which led us to believe that we were in fact forming Cu/TiO2 hetero-
structures. We then prepared this model system by simple mixing and grinding of its two
components and found that it exhibited H2 production rates that were 2 orders of
magnitude higher than the samples derived from Cu2O nanocubes. Cu loadings of 0.1,
1, 10 and 50% w/w were tested and the 1% w/w found to give the highest rates. Finally,
we studied the effect of the hole scavenger and co-catalyst on a working H2 evolution
scaffold, namely TiO2. We found vastly different amounts of H2, CO, CH4, and higher
hydrocarbons were produced depending on the nature of the scavenger and the metal.
These products likely arise from simultaneous H2O reduction and MeOH/EtOH
reforming and so it is difficult to claim these processes as pure water splitting. We also
tested the active samples for gas phase light-assisted CO2 hydrogenation to CO and
CH4. In the case of CO, we saw some evidence of a catalytic effect in the presence of
light, however the rates were still very low (nmol h-1) and we were not able to confirm
that the hydrocarbons originated from CO2 reduction or from extraneous carbon
contamination.
4.5 Experimental Section
General Characterization - All chemicals were purchased from Sigma Aldrich
and used directly without further purification. Powder X-ray diffraction (PXRD) was
performed on a Bruker D2-Phaser X-ray diffractometer, using Cu Kα radiation at 30 kV.
Fourier transform infrared spectroscopy (FT-IR) was performed using a Perkin Elmer
Spectrum-One FT-IR fitted with a universal attenuated total reflectance (ATR) sampling
accessory with a diamond coated zinc selenide window. UV-VIS absorbance of the

113
samples was measured using a Lambda 1050 UV/VIS/NIR spectrometer from Perkin
Elmer.
Cu2O Nanocubes – Cu2O nanocubes were synthesized according to a modified
literature procedure.25 The Cu2O nanocubes were synthesized from copper sulfate
(CuSO4, 99%), sodium hydroxide (NaOH, 99%), trisodium citrate dihydrate
(C6H5Na3O7.2H2O, 99%), and ascorbic acid (C6H8O6, 99.9%). In a typical procedure, a
round-bottom flask was filled with 300 mL of deionized water and 0.265 g (0.9 mmol) of
trisodium citrate was added with vigorous stirring until dissolved. Then, 1 mL of 1.2 M
CuSO4 solution (1.2 mmol) was rapidly injected using a pipette. After 5 min, 1 mL of 4.8
M NaOH (4.8 mmol) solution was injected into the solution. The clear blue solution
immediately turned turbid blue, indicating the precipitation of Cu(OH)2. After another 5
min, 1 mL of 1.2 M (1.2 mmol) ascorbic acid was injected as reducing agent. The color
of the solution rapidly changed from blue to green to light orange. The solution was
stirred at room temperature for 30 minutes accompanied by a color change to bright
orange at the end. The reaction mixture was centrifuged at 4000 rpm for 2 minutes to
separate the cubes which were then dispersed in 30 mL of deionised water. The
process was repeated 3 more times with the particles dispersed in absolute EtOH after
the final washing. The nanocubes can be stored in solution or as a powder if the EtOH
is evaporated in a drying oven at 60°C.
Cu2O@TiO2 nanocubes – 30 mg of powdered Cu2O nanocubes were dispersed
in 20mL anhydrous EtOH in a 50ml round bottom flask with magnetic stirring. 2.5 mL of
a 0.1 M Ti(OBu)4 solution in EtOH were added dropwise and the mixture was stirred for
2 hours in air at room temperature. 1.2 mL of 1:3 H2O:EtOH mix was added dropwise
and stirred for another 2 hours. The Cu2O@TiO2 particles were centrifuged at 4000 rpm
for 2 minutes and redispersed in 20 mL absolute EtOH.
Deposition of Pt, Au, Pd – Metal nanoparticles of Pt, Au, Pd were deposited
onto Cu2O nanocubes or Cu2O@TiO2 composites by photo-decomposition of H2PtCl6,
HAuCl4, or Pd(acetate)2 under UV irradiation. The loadings were calculated on a mass
percent basis and were in the range of 1-10% metal. Powdered Cu2O or Cu2O@TiO2

114
nanocubes were dispersed in ~20 mL absolute EtOH with magnetic stirring in a 100 mL
round bottom flask. The flask’s exterior was wrapped in aluminum foil and a UV finger
light source was used to illuminate the dispersions for one hour in order to activate the
surface and create energetic electrons for subsequent reduction of metal salts.
Appropriate amounts of the noble metal precursors were introduced with a 1 mL syringe
from ethanolic solutions and the UV irradiation was continued for another hour. The
particles were then centrifuged at 4000rpm and redispersed in water or absolute
ethanol.
Electron Microscopy - Low resolution TEM images were acquired on a Hitachi
H-7000 conventional TEM operating at 100kV. SEM Images and EDX spectra were
acquired on a Hitachi S-5200 operating at 30kV using an Oxford Inca detector.
Additional SEM images were acquired on a FEI Quanta FEG 250 Environmental SEM.
Sample preparation involved dropping a dilute nanocrystal solution on a carbon coated
Ni TEM grid.
Photoelectron Spectroscopy - XPS/UPS spectra were acquired using a PHI
5500 instrument. An Aluminum K-alpha light source with X-ray wavelengths of 1486.7
eV under UHV conditions (< 1 x 10⁻⁹ Torr) was used for XPS spectra. Photons with
energy of 21.22 eV generated by helium plasma with a back pressure of 2 x 10⁻⁵ Torr
were used for UPS spectra. A beam of Xenon ions with kinetic energy of 3.0 eV was
used to sputter-clean the sample surface of organic ligand prior to analysis. Sputtering
was performed for an average of three minutes corresponding to a sputtering depth of ~
2nm. Samples for XPS/UPS analysis were prepared by drop-casting dilute nanocrystal
solutions on p-doped Si(100) or FTO substrates to give a film of ~50 nm thickness. The
substrates were cleaned of organics by immersion into 3:1 NH4OH:H2O2 solution at
50°C for 12 hours prior to film formation.
Gas Phase Photocatalytic Measurements - Gas-phase photocatalytic rate
measurements were conducted in a custom fabricated 1.5 mL stainless steel batch
reactor with a fused silica view port sealed with Viton O-rings. The reactors were
evacuated using an Alcatel dry pump prior to being purged with the reactant gases H2

115
(99.9995%) and CO2 (99.999%) at a flow rate of 6 mL min-1 and a stoichiometry of
either 4:1 (stoichiometric for Sabatier reaction) or 1:1 (stoichiometric for reverse water
gas shift reaction). During purging, the reactors were sealed once they had been heated
to the desired temperature. The reactor temperatures were controlled by an OMEGA
CN616 6-Zone temperature controller, with a thermocouple placed in contact with the
sample. The pressure inside the reactor during reaction was monitored during the
reaction using an Omega PX309 pressure transducer. Reactors were irradiated with a
1000 W Hortilux Blue metal halide bulb or a Newport 300 W Xe Lamp (at a distance of 4
cm and a light intensity of 2.2 suns) for a period of 16 hours. Product gases were
analyzed by a flame ionization detector (FID) and thermal conductivity detector (TCD)
installed in a SRI-8610 Gas Chromatograph (GC) with a 3’ Mole Sieve 13a and 6‘
Haysep D column. The reactor was held in a custom designed stand. Heating was
supplied from a heated copper block fixed below the fixed catalyst bed. A thermocouple
was in contact with the top of the reactor so that the reactor maintained a constant
temperature of 80 °C. Samples were prepared by drop-casting nanocrystal solutions
onto high resistivity glass slides (2 inch by 2 inch) to give a sample loading in the range
of 20-50 mg followed by drying of the films in vacuo at 60°C overnight.
Aqueous Photocatalytic Testing - All photocatalytic tests were performed in a
home built, gas-tight pyrex reactor with a quartz window. The photocatalyst powder (1
gL-1) was dispersed in distilled water and methanol (25 vol%, HPLC grade). Prior to
each run, the reactor was purged with nitrogen for 20 min and the first sample was
taken before the photocatalytic reaction was started. A Newport 120 W or 300 W Xe
lamp was used for solar irradiation and an air mass (AM) 1.5 filter (Newport) was
applied to simulate the direct solar spectrum when the sun is at a zenith angle of 48.28.
To test the long-term stability of the photocatalyst and the reproducibility of the H2
formation, the reactor was purged after a few hours to remove all products and start a
new formation cycle. Gas samples were extracted with a gas-tight syringe, separated by
gas chromatography (GC, Agilent 7820A GC) equipped with a thermal conductivity
detector (TCD). A 1.5 m Molesieve 13 X column (80–100 mesh) was used for the
separation of H2, O2, and N2, and an integrated 1 m Haysep Q column (80–100 mesh)

116
was used to first separate CO2 and water vapour to avoid contamination of the
Molesieve column.
4.6 References
(1) Huang, M. H.; Chiu, C.-Y. Achieving Polyhedral Nanocrystal Growth with Systematic Shape Control. J. Mater. Chem. A Mater. Energy Sustain. 2013, 1, 8081–8092.
(2) Wang, C.; Fang, J. Octahedral Noble-Metal Nanoparticles and Their Electrocatalytic Properties. ChemSusChem 2013, 6, 1848–1857.
(3) Kundu, P.; Anumol, E. A.; Ravishankar, N. Pristine Nanomaterials: Synthesis, Stability and Applications. Nanoscale 2013, 5, 5215–5224.
(4) Zhang, L.; Niu, W.; Xu, G. Synthesis and Applications of Noble Metal Nanocrystals with High-Energy Facets. Nano Today 2012, 7, 586–605.
(5) Wang, X.; Zhuang, J.; Peng, Q.; Li, Y. A General Strategy for Nanocrystal Synthesis. Nature, 2005, 437, 121–124.
(6) Xiong, Y.; Xia, Y. Shape-Controlled Synthesis of Metal Nanostructures: The Case of Palladium. Adv. Mater. (Weinheim, Ger.) 2007, 19, 3385–3391.
(7) Lim, B.; Wang, J.; Camargo, P. H. C.; Jiang, M.; Kim, M. J.; Xia, Y. Facile Synthesis of Bimetallic Nanoplates Consisting of Pd Cores and Pt Shells through Seeded Epitaxial Growth. Nano Lett. 2008, 8, 2535–2540.
(8) Singh, D. P.; Neti, N. R.; Sinha, A. S. K.; Srivastava, O. N. Growth of Different Nanostructures of Cu2O (Nanothreads, Nanowires, and Nanocubes) by Simple Electrolysis Based Oxidation of Copper. J. Phys. Chem. C 2007, 111, 1638–1645.
(9) Siegfried, M. J.; Choi, K.-S. Directing the Architecture of Cuprous Oxide Crystals during Electrochemical Growth. Angew. Chemie, Int. Ed. 2005, 44, 3218–3223.
(10) Siegfried, M. J.; Choi, K.-S. Electrochemical Crystallization of Cuprous Oxide with Systematic Shape Evolution. Adv. Mater. (Weinheim, Ger. 2004, 16, 1743–1746.
(11) Li, H.; Liu, R.; Zhao, R.; Zheng, Y.; Chen, W.; Xu, Z. Morphology Control of Electrodeposited Cu2O Crystals in Aqueous Solutions Using Room Temperature Hydrophilic Ionic Liquids. Cryst. Growth Des. 2006, 6, 2795–2798.
117
(12) Wang, W.; Wang, G.; Wang, X.; Zhan, Y.; Liu, Y.; Zheng, C. Synthesis and Characterization of Cu2O Nanowires by a Novel Reduction Route. Adv. Mater. (Weinheim, Ger.) 2002, 14, 67–69.
(13) Chang, Y.; Zeng, H. C. Manipulative Synthesis of Multipod Frameworks for Self-Organization and Self-Amplification of Cu2O Microcrystals. Cryst. Growth Des. 2004, 4, 273–278.
(14) Siegfried, M. J.; Choi, K.-S. Elucidating the Effect of Additives on the Growth and Stability of Cu2O Surfaces via Shape Transformation of Pre-Grown Crystals. J. Am. Chem. Soc. 2006, 128, 10356–10357.
(15) Morales-Guio, C. G.; Tilley, S. D.; Vrubel, H.; Grätzel, M.; Hu, X. Hydrogen Evolution from a Copper(I) Oxide Photocathode Coated with an Amorphous Molybdenum Sulphide Catalyst. Nat. Commun. 2014, 5, 3059.
(16) Hara, M.; Kondo, T.; Komoda, M.; Ikeda, S.; Shinohara, K.; Tanaka, A.; Kondo, J. N.; Domen, K. Cu2O as a Photocatalyst for Overall Water Splitting under Visible Light Irradiation. Chem. Commun. 1998, 357–358.
(17) Zhang, J.; Liu, J.; Peng, Q.; Wang, X.; Li, Y. Nearly Monodisperse Cu2O and CuO Nanospheres: Preparation and Applications for Sensitive Gas Sensors. Chem. Mater. 2006, 18, 867–871.
(18) Xu, H.; Wang, W.; Zhu, W. Shape Evolution and Size-Controllable Synthesis of Cu2O Octahedra and Their Morphology-Dependent Photocatalytic Properties. J. Phys. Chem. B 2006, 110, 13829–13834.
(19) Poizot, P.; Laruelle, S.; Grugeon, S.; Dupont, L.; Tarascon, J. M. Nano-Sized Transition-Metal Oxides as Negative-Electrode Materials for Lithium-Ion Batteries. Nature 2000, 407, 496–499.
(20) Zhang, Z.; Dua, R.; Zhang, L.; Zhu, H.; Zhang, H.; Wang, P. Carbon-Layer-Protected Cuprous Oxide Nanowire Arrays for Efficient Water Reduction. ACS Nano 2013, 7, 1709–1717.
(21) Zahran, E. M.; Bedford, N. M.; Nguyen, M. a.; Chang, Y. J.; Guiton, B. S.; Naik, R. R.; Bachas, L. G.; Knecht, M. R. Light-Activated Tandem Catalysis Driven by Multicomponent Nanomaterials. J. Am. Chem. Soc. 2014, 136, 32–35.
(22) Read, C. G.; Steinmiller, E. M. P.; Choi, K.-S. Atomic Plane-Selective Deposition of Gold Nanoparticles on Metal Oxide Crystals Exploiting Preferential Adsorption of Additives. J. Am. Chem. Soc. 2009, 131, 12040–12041.

118
(23) Kuo, C.-H.; Yang, Y.-C.; Gwo, S.-J.; Huang, M. H. Facet-Dependent and Au Nanocrystal-Enhanced Electrical and Photocatalytic Properties of Au-Cu2O Core-Shell Heterostructures. J. Am. Chem. Soc. 2011, 133, 1052–1057.
(24) Ho, J.-Y.; Huang, M. H. Synthesis of Submicrometer-Sized Cu2O Crystals with Morphological Evolution from Cubic to Hexapod Structures and Their Comparative Photocatalytic Activity. J. Phys. Chem. C 2009, 113, 14159–14164.
(25) Chang, I.-C.; Chen, P.-C.; Tsai, M.-C.; Chen, T.-T.; Yang, M.-H.; Chiu, H.-T.; Lee, C.-Y. Large-Scale Synthesis of Uniform Cu2O Nanocubes with Tunable Sizes by in-Situ Nucleation. CrystEngComm 2013, 15, 2363.
(26) Pang, M.; Wang, Q.; Zeng, H. C. Self-Generated Etchant for Synthetic Sculpturing of Cu2O-Au, Cu2O@Au, Au/Cu2O, and 3D-Au Nanostructures. Chemistry 2012, 18, 14605–14609.
(27) Li, Q.; Xu, P.; Zhang, B.; Wu, G.; Zhao, H.; Fu, E.; Wang, H.-L. Self-Supported Pt Nanoclusters via Galvanic Replacement from Cu2O Nanocubes as Efficient Electrocatalysts. Nanoscale 2013, 5, 7397–7402.
(28) Pastor, E.; Pesci, F. M.; Reynal, A.; Handoko, A. D.; Guo, M.; An, X.; Cowan, A. J.; Klug, D. R.; Durrant, J. R.; Tang, J. Interfacial Charge Separation in Cu2O/RuOx as a Visible Light Driven CO2 Reduction Catalyst. Phys. Chem. Chem. Phys. 2014, 16, 5922–5926.
(29) Hmadeh, M.; Hoepfner, V.; Larios, E.; Liao, K.; Jia, J.; Jose-Yacaman, M.; Ozin, G. A. New Hydrogen-Evolution Heteronanostructured Photocatalysts: Pt-Nb3O7 (OH) and Cu-Nb3O7(OH). ChemSusChem 2014, 7, 2104–2109.
(30) Zhang, Z.; Wang, Z.; Cao, S.; Xue, C. Au/Pt Nanoparticle-Decorated TiO2 Nano Fibers with Plasmon- Enhanced Photocatalytic Activities for Solar-to-Fuel Conversion. J. Phys. Chem C, 2013, 117, 25939-25947.
(31) Wang, W. N.; An, W. J.; Ramalingam, B.; Mukherjee, S.; Niedzwiedzki, D. M.; Gangopadhyay, S.; Biswas, P. Size and Structure Matter: Enhanced CO2 Photoreduction Efficiency by Size-Resolved Ultrafine Pt Nanoparticles on TiO2 Single Crystals. J Am Chem Soc 2012, 134, 11276–11281.
(32) Wang, C.; Thompson, R. L.; Baltrus, J.; Matranga, C. Visible Light Photoreduction of CO2 Using CdSe/Pt/TiO2 Heterostructured Catalysts. J. Phys. Chem. Lett. 2010, 1, 48–53.
(33) Mahler, B.; Hoepfner, V.; Liao, K.; Ozin, G. Colloidal Synthesis of 1T-WS2 and 2H-WS2 Nanosheets : Applications for Photocatalytic Hydrogen Evolution. J. Am. Chem. Soc. 2014, 136, 14121-14127.

119
(34) Yui, T.; Kan, A.; Saitoh, C.; Koike, K.; Ibusuki, T.; Ishitani, O. Photochemical Reduction of CO2 Using TiO2: Effects of Organic Adsorbates on TiO2 and Deposition of Pd onto TiO2. ACS Appl. Mater. Interfaces 2011, 3, 2594–2600.
(35) Kraeutler, B.; Bard, A. J. Heterogeneous Photocatalytic Synthesis of Methane from Acetic Acid - New Kolbe Reaction Pathway. J. Am. Chem. Soc. 1978, 100, 2239–2240.

120
Chapter 5 – Light-Assisted Hydrogenation of CO2 to CO Using a Mixed Metal
Oxide Delafossite, CuFeO2
5.1 Abstract
This chapter details our work on the synthesis, characterization and
photocatalytic testing of mixed copper-iron delafossite, CuFeO2, and spinel, CuFe2O4,
as a continuation of our work on Cu2O and Fe2O3 described in previous chapters. We
synthesize the materials from stoichiometric precursor mixtures of metal salts followed
by high temperature solid state reaction to give the desired phases. We characterize the
resulting mixed metal oxides by SEM, PXRD, and EDX and study their formation by
TGA/DSC and PXRD over the course of the heat treatment. We found that both
precursors are first converted to a mixture of Fe3O4 and CuO, which forms the mixed
oxide phases upon continued heating at temperatures above ~800°C. The optimal
annealing times to give phase-pure materials were identified and both ternary oxides
were found to be stable in air post-synthesis with heating up to 450°C. Lacking solubility
in water, CuFeO2 and CuFe2O4 were found to be inactive for aqueous phase H2
evolution from water. When tested for light-assisted CO2 hydrogenation under intense
illumination (~ 20 Suns), CO was produced at an average rate of at least 0.1 mmol g-1 h-
1 over the CuFeO2 catalyst. Isotope labelling experiments with 13CO2 confirmed that the
products largely originated from CO2 reduction and not adventitious carbon
contamination. PXRD analysis of the active catalyst after testing determined that
CuFeO2 transformed to a mixture of metallic Cu and likely Fe3O4 as a result of the
testing conditions. However, despite the apparent structural change, the CO evolution
activity of CuFeO2 was found to be stable over the course at least 90 hours under
intense illumination. Control experiments with the identified by-product phases, namely
Cu, Fe3O4 and a physical mixture of the two, indicated that iron oxide is likely the active
component. Interestingly, the activity of the Fe3O4 and Fe3O4/Cu samples degraded
after prolonged illumination, in contrast to the CuFeO2. Future work on this system will
involve confirming the active components, increasing catalyst surface area, and
decoration with co-catalysts to study changes in product yield and distribution.

121
5.2 Introduction
As a continuation of our progress towards the discovery of earth abundant metal
oxides for solar energy conversion, this chapter details our work on mixed metal oxides
of iron and copper, namely delafossites with general formula A(+1)B(+3)O2 and spinels,
A(+2)B2(+3)O4. Having developed expertise working with the binary oxides Cu2O and
Fe2O3, we were interested in incorporating these metals in a single catalyst for solar fuel
generation. As has been emphasized previously, there is huge interest in developing
efficient photoelectrodes based on metal oxides due to their low cost and
thermodynamic stability.1 Unfortunately most oxides possess large bandgaps that
require ultraviolet excitation and are typically n-type, meaning that that they are suitable
for driving oxidation reactions using holes, the minority charge carriers. Photocathode
reactions such as CO2 reduction and H2 evolution require a p-type electrode, preferably
with significant solar spectrum absorption. Some examples based on III-V
semiconductors such as GaAs and GaP, or WSe2 have been reported; however, their
performance depends on expensive high-vacuum processing and deposition techniques
such as CVD and ALD.2–4 The metal pnictides and chalcogenides are also known to
require high overpotentials and are relatively unstable in aqueous solution under
illumination.5,6 Notably, p-type metal oxides have received little attention and represent
an interesting area of study. A recent report described a p-type spinel CaFe2O4
photoelectrode capable of producing hydrogen from water.7 In CaFe2O4, the valence
band primarily has O 2p character and the conduction band is dominated by Fe 3d
states.8 Based on this example, it appears that oxides with Fe 3d-dominated CB states
are energetic enough to drive CO2 reduction. Relative to oxides with valence bands
dominated by O 2p states, VBs consisting of mainly copper 3d10 character have been
calculated to result in higher energy VB edges and therefore smaller bandgaps.9 With
this in mind, Cu(I) delafossite materials such as CuCrO2, CuAlO2, CuRhO2 have been
investigated and shown to be stable in aqueous environments and under excitation.10–12
The stability under illumination was attributed to the fact that optical excitations in
CuMO2 compounds involve metal-to-metal transitions between the Cu d10 orbitals and
the other metal’s 3d states which should protect the metal-oxide bonds and improve
stability.13 Based on all of the above considerations, the most promising candidate

122
among the delafossites is CuFeO2; it is naturally p-type due to Cu vacancies in its
structure and unlike Cu2O, has been reported as stable under reductive conditions.14
Furthermore, it has a bandgap of about 1.5 eV and its conduction band, located at - 0.4
V versus the reversible hydrogen electrode (RHE), is suitably positioned to reduce
water under illumination.15 This chapter will describe our work on the synthesis,
characterization and photocatalytic properties of CuFeO2 and its related spinel
CuFe2O4.
5.3 Results and Discussion
There are two predominant approaches in literature to synthesizing CuFeO2:
electrodeposition, and high temperature solid-state reaction. Solid-state approaches are
amenable to producing much larger quantities of material but require long reaction times
at high temperatures due to slow diffusion in the solid state. Electrodeposition
approaches are less energy-intensive and have the advantages of good thin film
formation which enables electrochemical characterization. On the other hand, the
amount of material deposited is small and many cycles may be required to achieve films
thick enough to maximize photocurrent generation. Both approaches involve annealing
or crystallization under inert gas due to the presence of copper in the +1 oxidation state,
which is unstable in ambient conditions. Here we used a 1:1 molar ratio of iron and
copper nitrate hydrates, Fe(NO3)3·9H2O & Cu(NO3)2·5/2 H2O, as starting materials
followed by addition of excess NaOH to give a mixed Cu/Fe oxide-hydroxide precursor
powder. The powder was then heated at 900°C in a tube furnace under Ar atmosphere
for varying periods of time to give the desired delafossite CuFeO2, Figure 5.1. When a
2:1 ratio of iron to copper was used and we heated the resulting powder in air at
1000°C, the related CuFe2O4 spinel phase could be obtained. Both phases were
obtained largely without any impurities as judged by PXRD, which has a detection limit
of approximately 5% by weight. SEM images of the two materials are presented in
Figure 5.2 and show the irregular shapes and large sizes of the resulting mixed metal
oxides. Delafossite and spinel are both high temperature phases and require extended
heating above ~650°C and 700°C respectively in the case of a solid state reaction.
Prolonged heating in the absence of structure-directing agents tends to lead to large

123
particle sizes so the CuFeO2 and CuFe2O4 particles are on the order of a few
micrometers.
Figure 5.1 PXRD patterns of as synthesized delafossite CuFeO2 (top) and
CuFe2O4 (bottom)
The BET surface area of the two materials was identical at 2 m2/g. The particles
lacked a consistent morphology; SEM images show large micron-sized chunks dotted
with smaller domains on the order of several hundred nanometers. The powders are
grinded manually in a mortar and pestle following solid-state synthesis, which likely
accounts for the fragmentation into smaller chunks. The synthesis of CuFeO2 can also
be performed without the use of NaOH, which can introduce sodium impurities on the

124
surface as was determined by XPS. By simply mixing the two precursors in EtOH and
evaporating to dryness, a precursor powder can be obtained that gives comparably-
sized particles of CuFeO2 when subjected to heat treatment at 900°C under Ar. An
NaOH-free particle is shown in Figure 5.2d notable for its smoother surface and lack of
fragmentation.
Figure 5.2 a) PXRD pattern of the mixed 1:1 molar ratio iron/copper precursor
before heating at 900°C a,c,d) SEM images of CuFeO2 particles following solid state
reaction. Panel e) shows a CuFeO2 particle synthesized without the use of NaOH b)
SEM image of a CuFe2O4 particle after solid state reaction and grinding

125
Apart from PXRD, we also confirmed the identity of the mixed metal oxide
phases by EDX, Figure 5.3. Performing EDX line-scans across a single CuFeO2 or
CuFe2O4 particle gave the stoichiometrically expected 1:1 or 1:2 ratio of Cu to Fe. No
other elements were found above the background signal which was arbitrarily assigned
as titanium.
Figure 5.3 a,c) EDX line-scans of CuFeO2 and CuFe2O4 particles showing the
presence of the expected elements (Scale bars 1μm and 2 μm respectively) c,d)
Quantitative signal intensities of the elements detected by EDX confirming expected
stoichiometric ratios of the metals
XPS analysis of CuFeO2 confirmed the 1:1 Fe:Cu ratio that was found by EDX as
well as the presence of Na on the surface as was discussed above. We then tried to
reduce the particle size and increase the surface area of CuFeO2 by ball milling the
powder since surface area is a crucial consideration in catalysis. A high energy ball mill
was used which combines centrifugal forces with ceramic ZrO2 balls as the grinding

126
tool. We were able to obtain a much larger proportion of smaller particles with sizes in
the range of a few hundred nanometers up to 1 micron and the BET surface area of the
material increased to 4 m2.
Figure 5.4 a) XPS survey spectrum of CuFeO2 b) PXRD pattern of CuFeO2
following ball-milling to reduce particle size c) PXRD diffraction patterns of CuFeO2
following prolonged heating at 450°C in air d) Diffuse reflectance spectra of CuFeO2
and CuFe2O4
Unfortunately, undesired abrasion of ZrO2 took place as shown in the PXRD
pattern in Figure 5.4b. The PXRD shows that post ball milling, the material was mainly
composed of ZrO2; CuFeO2 was present as a minor phase. We were unable to prevent

127
this by reducing the rotation speed of the ball mill and ratio of ZrO2 to sample, therefore
we ruled out ball milling as a viable method for increasing the surface are of our
materials. Figure 5.4c shows the PXRD pattern of CuFeO2 heated at 450°C in air over
the course of 24 hours. We don’t observe any oxidation or degradation of the material
indicating that once formed CuFeO2 is actually quite stable in air despite the fact that its
synthesis requires inert atmosphere. The optical properties of the two mixed oxides
were determined from the diffuse reflectance spectra shown in Figure 5.4d. The spectra
were fitted with a modified Kubelka Munk function to determine the optical band gap of
each sample.16 For CuFeO2, a bandgap of 0.9-1 eV was calculated based on a direct
forbidden transition. The value of the optical gap of CuFeO2 has been reported as being
in the range of 1.3-1.6 eV based on spectroscopic data and DFT modelling.14,17 In the
case of CuFe2O4, an optical band gap of 1.2-1.4 eV has been reported in literature,
however, we did not observe any transitions in that energy range.18 A featureless
reflections spectrum was seen for CuFe2O4 indicative of pseudo-metallic behaviour and
a small bandgap.
Having successfully synthesized the mixed metal oxides, we then aimed to study
their crystallization as a function of time in an attempt to reduce the reaction time and
temperature required to obtain phase-pure materials. Our first step was to look at the
PXRD patterns of CuFeO2 and CuFe2O4 at different periods of time after calcination at
900°C and 1000°C respectively. For CuFeO2, the heating profile includes a fast
temperature ramp up to 900°C over the course of an hour followed by an extended
period of crystallization at that temperature. The PXRD of the powder following the ramp
up without any crystallization period is shown in Figure 5.5a. It shows that the sample is
already largely composed of delafossite with minor impurity phases consisting of CuO
and likely Fe3O4. For clarity, we have omitted the diffractograms obtained after 5 and 10
hours of calcination which show the progressive decrease of the impurity phase with
increasing time. The sample calcined for 20 hours is essentially phase-pure CuFeO2
without any impurity phase by PXRD. It should be noted that the time required to obtain
phase-pure materials scales with the amount of sample; larger scale reactions require
correspondingly longer reaction times. Performing the same study on CuFe2O4 gave
similar results; the desired spinel phase was overwhelmingly the major component after

128
1 hour at 1000°C. CuO and Fe3O4 were once again identified as impurity phases which
decrease and eventually disappear with increasing calcination time.
Figure 5.5 a) PXRD patterns of CuFeO2 powder after various amounts of time at
900°C under Ar b) PXRD patterns of CuFe2O4 powder after calcination at 1000°C in air
for various amounts of time
We also performed a TGA/DSC study of the heat treatment process in order to
gain information about the temperatures associated with precursor conversion to the
desired mixed oxide phases. We set the heating rate of the TGA experiment to

129
10°C/min to correspond to the heating rate used in synthesizing the materials and
performed the runs under argon and air for CuFeO2 and CuFe2O4 respectively. The
TGA curve for the spinel showed a continuous mass loss up to 400°C followed by a
gradual increase which could be explained by precursor decomposition and subsequent
reaction with atmospheric O2.
Figure 5.6 TGA-DSC curves of CuFeO2 top) and CuFe2O4 bottom) at a heating
rate of 10°C/min. Arrows indicate temperatures where we performed PXRD analysis
The TGA curve of the 1:1 CuFeO2 precursor shows a steep mass loss followed
by a plateau in the range of 300°C - 800°C and smaller mass loss past 800°C. The DSC

130
scan seems to indicate 3 phase transitions based on the local maxima in Figure 5.6. We
hypothesize that the delafossite precursor is first converted to Fe3O4 and CuO around
300°C followed by annealing until 800°C at which point crystallization of CuFeO2 takes
place. The arrows indicate temperatures at which a phase transition was suspected to
have taken place; PXRD was used to probe the composition of the material at these
temperatures in Figure 5.7. A PXRD pattern of the 1:1 molar ratio precursor is shown at
the top of Figure 5.7. It shows that prior to heating the precursor is a mixture of CuO
and amorphous iron oxide/hydroxide components. After heating to 250°C over a period
of 25 minutes and annealing at that temperature for 45 minutes, there is little change
observed in sample composition; broad peaks corresponding to CuO are the only
features in the diffractogram. If heated to 550°C and annealed for 45 minutes,
reflections attributed to Fe3O4 begin to appear in the precursor’s PXRD pattern. This
agrees well with the phase transition observed at this temperature in the DSC scan. A
similar mixture of Fe3O4 and CuO is seen when the 2:1 precursor for CuFe2O4 is heated
to 450°C. Based on this data, we can conclude that the precursors are first converted to
a mixture of Fe3O4 and CuO which reacts to form the desired mixed metal oxide at
temperatures above ~800°C based on the stoichiometric metal ratio in the precursor.
Thermal treatment of the corresponding binary oxides is a typical way to synthesize
ternary mixed oxides and has been reported in the preparation of CuFeO2 from CuO,
Fe2O3 and CuFe2O4.19,20
The as-prepared materials were found to be inactive for H2 evolution from
water/MeOH mixtures. The main issue was likely the complete lack of solubility and low
surface area of both CuFeO2 and CuFe2O4 in water due to an absence of surface
functional groups. We increased catalyst loading from the usual 10 mg up to 1g in an
attempt to increase H2 production but the rates obtained were comparable to control
experiments with pure H2O and H2O/MeOH under illumination but in the absence of a
catalyst. We concluded that these materials are a lot more amenable to being tested as
powdered catalysts in a gas-solid heterogeneous system and explored their activity for
light-assisted CO2 hydrogenation.

131
Figure 5.7 PXRD spectra of top) 1:1 molar ratio precursor for CuFeO2 prior to
heating middle) 1:1 molar ratio precursor after heating to 250°C and 550°C for a period
of time corresponding to the synthesis of the material bottom) 1:2 molar ratio precursor
(CuFe2O4) after heating at 450°C for amount of time corresponding to the synthesis

132
Gas phase hydrogenation experiments were carried out as described in previous
chapters with the exception that the intensity of irradiation was increased up to 20 Suns.
The reactor was kept at room temperature with the only source of heat being the
photothermal effect by the lamp. Under such high photon fluxes, our group has reported
that both photochemical and thermochemical processes can contribute to catalysis.21 A
thermocouple in contact with the sample determined the temperature at the surface of
the film to be approximately 50°C although the local temperature of catalyst particles
may be much higher. Under these conditions, we obtained significant activity for the
reverse water gas shift (RWGS) hydrogenation of CO2 to CO over the CuFeO2 catalyst,
see Figure 5.8. An average CO production rate of approximately 0.1 mmol g-1 h-1 was
calculated which corresponds to 5 µmol g-1 Sun-1 h-1. These rates compare well with our
groups previously published results on CO2 hydrogenation over In2O3-xOHy nanocrystals
and Ru/Si nanowires.21,22 It should be noted that the calculated values are a
conservative estimate of the actual CO production rates. The amount of CO produced
saturated the FID detector on our GC, restricting the peak area used in the calculations
to only 60-70 % of its full value. In addition, normalizing the rate per unit mass is an
overestimation as only ~1/5 of the catalyst film is under illumination and produces
products, as will be discussed below. The CO evolution activity of the CuFeO2 sample is
reproducible and stable over time; we repeated the testing several times and sampled
the amount of CO produced after each run, Figure 5.8a. The activity remains constant
at an average rate of 0.1 mmol g-1 h-1 over a total of more than 90 hours under intense
illumination with 20 Suns. To confirm the origin of CO production, we performed
experiments using isotope-labelled 13CO2 as the reactant gas and analyzed the
products by GC-MS. Figure 5.8b shows the relative intensities of the 28 atomic mass
unit (AMU) peak of 12CO and the 29 AMU peak corresponding to 13CO. The 13CO peak
dominates and we can calculate that over 70% of the CO signal originates from
reduction of 13CO2 to 13CO. No detectable amounts of 13CO are found in the dark or
when an inactive reference catalyst is tested under the same conditions. Corma et.al.
recently published the photocatalytic hydrogenation of CO2 to CO and CH4 on a number
of supported metal oxide catalysts.23 As part of the study, the authors investigated the
use of commercial nanopowders of Fe2O3 and Fe3O4 which were found to produce CO

133
at %CO2 conversions rates of 51.0% and 12.3% respectively. These conversions
correspond to CO production rates of approximately 7 mmol g-1 h-1 for Fe2O3 and 1
mmol g-1 h-1 for Fe3O4. These rates are roughly one order of magnitude higher than the
rates observed with our CuFeO2-derived catalysts. We suspect the significantly lower
surface area of our materials (2 m2/g vs ~100 m2/g) is responsible.
Figure 5.8 a) CO production rate over CuFeO2 over a period of 90 hours intense
illumination b) GC-MS chromatogram of the CO peak showing the presence of 13CO
amongst the products c) 12CO and 13CO signals under alternating low and high
illumination intensities d) CO production rates over CuFeO2 and pure Fe3O4, Fe3O4/Cu,
and pure Cu controls. Each bar corresponds to a run with an average length of 7 hours
At this point, we became interested in the origin of activity of the CuFeO2 films.
We noticed a visible discolouration in the area of the film that had been exposed to light
and performed PXRD analysis on the catalyst after testing to determine if structural

134
changes had occurred. Figure 5.9c shows the resulting PXRD pattern and a digital
photograph of the film after illumination.
Figure 5.9 a) Top down SEM image of the CuFeO2 film prior to illumination b)
Cross-sectional SEM image of the CuFeO2 film used to determine approximate
thickness c) PXRD diffraction pattern of the CuFeO2 catalyst after testing showing the
presence of newly formed Fe3O4 and Cu phases (Inset – digital photograph of
discolouration following illumination)
The presence of Fe3O4 or γ-Fe2O3 and Cu phases is evident, likely as a
by-product of CuFeO2 transformation. It should be noted that despite the fact that

135
CuFeO2 still appears to be the dominant phase, the by-product phases were only
located on the illuminated area of the film whereas PXRD samples the film as a whole.
It is therefore likely that conversion to Fe3O4 and Cu is complete under light of this
intensity. This will be verified in future experiments by only looking at the PXRD pattern
of the illuminated spot. Figure 5.9a,b shows SEM images of the catalyst film prior to
testing; no morphological change is seen after the apparent decomposition of CuFeO2.
Despite the apparent degradation of the original CuFeO2 catalyst, CO production
remained stable after continued illumination of the same sample area, Figure 5.8a. A
sample sputtered with 50nm of Ru was also tested but did not show significantly
improved rates compared to CuFeO2. We then varied the intensity of the light source as
shown in Figure 5.8c. Under low illumination (3 Suns), we did not observe any 13CO by
GC-MS; only a low signal attributed to 12CO contamination was detected. We then
illuminated the same sample with light of 20 Sun intensity and observed the typical
amounts of 13CO being evolved. We then decreased the lamp intensity down to 3 Suns
again, and once more did not see any 13CO. This indicated that the sample is not
activated by an initial illumination under high light intensity, but rather that the high light
intensity is necessary for activity. Finally, we hypothesized that the component
responsible for activity was not CuFeO2 but one or both of the decomposition by-
product phases. We prepared films of pure Cu, pure Fe3O4, and a 50 w/w % mixture of
Fe3O4/Cu from the corresponding commercially available nanopowders. Pure Cu was
not active but the Fe3O4 and Fe3O4/Cu samples produced comparable rates of 13CO as
the CuFeO2 films, suggesting that the iron oxide component was the active phase in our
system. However, both control samples sharply decreased in activity upon repeated
testing in contrast to the CuFeO2 catalyst which maintained its performance for over 90
hours, see Figure 5.8d. The Fe3O4 films were prepared from nanoparticle powders in
the 50-100 nm size range and could sinter and aggregate leading to the observed loss
of activity. The cause of the unexpected stability of the CuFeO2-derived materials will be
investigated further in future experiments. The observation that iron oxide is the active
component agrees well with literature reports, where iron oxide is a major component in
the most widely applied water gas shift catalyst (75% Fe2O3, 10% Cr2O3, 0.2% MgO,
balance volatiles).24 This mixture is typically used in high temperature WGS processes

136
in the range of 320 - 450°C and so its activity at room temperature under illumination
could be a good way to reduce the energy requirements of the process. In the interest
of determining whether the activity we observed was indeed catalytic or simply
stoichiometric, we performed a quick “back of the envelope calculation” to estimate the
number of active metal sites in our films. In the case of a typical overnight run using the
CuFeO2 catalyst, we obtain a minimum of 1 mmol CO, or approximately 6 x 10²⁰
molecules of product. Using liberal over-estimates for the particle size, film thickness
and area, we calculate that the number of metal atoms in the illuminated sample is
approximately 3.9 x 10²⁰. Keeping in mind that we included Cu atoms in the calculation,
as well as all metal sites in the bulk of the catalyst particles, the likely number of active
sites is much lower. This suggests that the turnover number is greater than 1, which
would be indicative of a catalytic process. Much work remains to be done on this system
beginning with investigating the increased stability of the CuFeO2-derived catalysts. We
would also like to explore new synthetic approaches to reducing particle size and
increasing surface area. We will monitor catalytic performance with various cut-off filters
which block parts of the solar spectrum as well as investigate if hydrocarbons such as
CH4 can be produced with co-catalysts or different reaction conditions.
5.4 Conclusions
This chapter was mainly focused on the chemical and physical properties and
photocatalytic activity of a mixed metal oxide delafossite, CuFeO2, for the photo-
assisted hydrogenation of CO2 to CO. CuFeO2 was synthesized according to a standard
high temperature solid state method from iron and copper nitrate precursors at 900°C
under an Ar atmosphere. Using a combination of PXRD and TGA/DSC we determined
the optimal reaction time and crystallization temperatures required to obtain phase pure
CuFeO2 and its related spinel CuFe2O4. The materials were inactive for H2 evolution
from water due to a lack of solubility, but CuFeO2 produced significant amounts of CO
when tested for the reverse water gas shift reaction under 20 Suns illumination in the
gas phase. The detection of mostly 13CO by GC-MS indicated that CO2 reduction was
genuine and not a result of carbon contamination. The catalytic activity of the CuFeO2
was stable over prolonged irradiation. As a result of the high light intensity, we found

137
that CuFeO2 was decomposing to a mixture of Fe3O4/γ-Fe2O3 and metallic Cu. We
tested these phases as control samples and found that the iron oxide domain was likely
responsible for the activity, however the control films largely deactivated under intense
sunlight in contrast to CuFeO2. Future experiments will attempt to enhance surface
area, determine the origin of the stability, and examine the effect of co-catalysts on the
rate and product distribution. Light-driven catalysis of the water gas shift reaction at
significantly reduced temperatures could be a promising contribution towards reducing
the energy requirements of that process.
5.5 Experimental Section
General Characterization - All chemicals were purchased from Sigma Aldrich
and used directly without further purification. Powder X-ray diffraction (PXRD) was
performed on a Bruker D2-Phaser X-ray diffractometer, using Cu Kα radiation at 30 kV.
Absorption and reflection measurements were performed using a Lambda 1050
UV/VIS/NIR spectrometer from PerkinElmer equipped with an integrating sphere with a
diameter of 150 mm and a center mount holder. Nitrogen Brunauer-Emmet-Teller (BET)
adsorption isotherms were obtained at 77 K using a Quantachrome Autosorb-1-C.
TGA/DSC curves were acquired on a TA Instruments Q500 thermogravimetric analyzer
at a constant ramp rate of 5°C under Ar or air atmosphere. Ball milling was performed
for a total of 5 hours with a Fritsch Pulverisette 7 planetary micro mill using ZrO2 balls as
the ceramic material at 1000 rpm. The amount of CuFeO2 used was 3g along with 20g
of ZrO2 balls with a diameter of ~1cm each. The sample had to be periodically taken out
and cooled down to room temperature.
Synthesis of CuFeO2 & CuFe2O4 – To prepare the precursor for CuFeO2
deposition, 1.392 g (6 mmol) of Cu(NO3)2·5/2 and 2.424 g (6 mmol) of Fe(NO3)3·9H2O
were dissolved in 40 mL of absolute EtOH at room temperature. 1.2 g (30 mmol) of
NaOH were dissolved in a further 40 mL of EtOH with slight heating by heat gun on the
outside of a 50 mL round bottom flask. The warm NaOH solution was added to the
metal precursors and allowed to react under vigorous magnetic stirring for 30 minutes at
room temperature. The mixture was centrifuged at 2000 rpm for 5 minutes and washed

138
with deionized water 3 times and EtOH once. The powder was dried in vacuo for 48
hours at 60°C and grinded up in an agate mortar and pestle. The precursor was placed
in an alumina crucible inside a tube furnace and purged with flowing Ar for 1hour at
room temperature followed by a gradual ramp to 900°C over the course of 1 hour. The
temperature was held at 900°C for varying amounts of time (0-20 hrs) to study the effect
of time on the crystallization. CuFe2O4 was prepared in the same way except 0.696 g (3
mmol) of Cu(NO3)2·5/2 were used and the mixed precursor powder was treated in air at
1000°C in a box furnace. Alternatively, CuFeO2 the use of NaOH by simply dissolving
the desired stoichiometric ratio of starting materials in 50 mL of absolute EtOH and
heating on an oil bath to evaporate the solvent. Subsequent heat treatment gives the
desired delafossite and eliminates the need to wash away sodium hydroxide. CuFe2O4
is not accessible without the use of NaOH.
Catalyst Fabrication - Sample films were prepared for photocatalytic testing by
drop-casting 100 mg of each sample powder – suspended via sonication in absolute
EtOH – onto 1” × 1” binder free borosilicate glass microfiber filters (Whatman, GF/F, 0.7
μm) placed on top of a vacuum filtration funnel held under very weak vacuum. The
borosilicate filters were then dried in vacuo at 60°C for 48 hours. For samples
containing Ru, the CuFeO2 powder was first drop-cast on high resistivity glass
substrates (2 inch by 2 inch). The wafers were initially cleaned with piranha solution
(H2SO4:H2O2 = 3:1 by volume) for 3 h and then rinsed with de-ionized water. Ru was
sputtered onto these samples in a custom-built sputtering system (Kurt J. Lesker Co.)
by radio frequency (RF) magnetron sputtering using a 99.95% pure Ru sputtering target
purchased from Angstrom Sciences, Inc. The base pressure of the sputtering chamber
was pumped down to 1 × 10 −7 Torr before argon was introduced into the chamber at a
flow rate of 20 sccm. The chamber pressure was set to 3 mTorr during the deposition,
which was carried out at room temperature. The forward power was 100 W and the
substrate-to-target distance was 14 cm. The sputtering process was terminated when
10 nm of Ru, as measured from an in-situ thickness monitor (SQM-242 from Sigma),
had been deposited. The CuFeO2/Ru was then scraped off the glass substrate,

139
suspended in absolute EtOH (2 mL) and drop-cast onto the borosilicate glass microfiber
filter for testing
Electron Microscopy - Low resolution TEM images were acquired on a Hitachi
H-7000 conventional TEM operating at 100kV. SEM Images and EDX spectra of the
particles were acquired on a Hitachi S-5200 operating at 30kV using an Oxford Inca
detector. Sample preparation involved dropping a dilute nanocrystal solution on a
carbon coated Ni TEM grid. Images of the catalyst films were acquired on an FEI
Quanta FEG250 operating at 20kV. The catalyst film was glued on a standard aluminum
SEM pin stub mount for imaging.
Photoelectron Spectroscopy - XPS/UPS spectra were acquired using a PHI
5500 instrument. An Aluminum K-alpha light source with X-ray wavelengths of 1486.7
eV under UHV conditions (< 1 x 10⁻⁹ Torr) was used for XPS spectra. Photons with
energy of 21.22 eV generated by helium plasma with a back pressure of 2 x 10⁻⁵ Torr
were used for UPS spectra. A beam of Xenon ions with kinetic energy of 3.0 eV was
used to sputter-clean the sample surface of organic ligand prior to analysis. Sputtering
was performed for an average of three minutes corresponding to a sputtering depth of ~
2nm. Samples for XPS/UPS analysis were prepared by drop-casting dilute nanocrystal
solutions on p-doped Si(100) or FTO substrates to give a film of ~50 nm thickness. The
substrates were cleaned of organics by immersion into 3:1 NH4OH:H2O2 solution at
50°C for 12 hours prior to film formation.
Aqueous Photocatalytic Testing - All photocatalytic tests were performed in a
home built, gas-tight pyrex reactor with a quartz window. The photocatalyst powder (20
gL-1) was dispersed in distilled water and methanol (25 vol%, HPLC grade). Prior to
each run, the reactor was purged with nitrogen for 20 min and the first sample was
taken before the photocatalytic reaction was started. A Newport 120 W or 300 W Xe
lamp was used for solar irradiation and an air mass (AM) 1.5 filter (Newport) was
applied to simulate the direct solar spectrum when the sun is at a zenith angle of 48.28.
To test the long-term stability of the photocatalyst and the reproducibility of the H2
formation, the reactor was purged after a few hours to remove all products and start a

140
new formation cycle. Gas samples were extracted with a gas-tight syringe, separated by
gas chromatography (GC, Agilent 7820A GC) equipped with a thermal conductivity
detector (TCD). A 1.5 m Molesieve 13 X column (80–100 mesh) was used for the
separation of H2, O2, and N2, and an integrated 1 m Haysep Q column (80–100 mesh)
was used to first separate CO2 and water vapour to avoid contamination of the
Molesieve column.
Gas Phase Photocatalytic Measurements - Gas-phase photocatalytic rate
measurements were conducted in a custom fabricated 1.5 mL stainless steel batch
reactor with a fused silica view port sealed with Viton O-rings. The reactors were
evacuated using an Alcatel dry pump prior to being purged with the reactant gases H2
(99.9995%) and CO2 (99.999%) at a flow rate of 6 mL min-1 and a stoichiometry of
either 4:1 (stoichiometric for Sabatier reaction) or 1:1 (stoichiometric for reverse water
gas shift reaction). During purging, the reactors were sealed once they had been heated
to the desired temperature. The reactor temperatures were controlled by an OMEGA
CN616 6-Zone temperature controller, with a thermocouple placed in contact with the
sample. The pressure inside the reactor during reaction was monitored during the
reaction using an Omega PX309 pressure transducer. Reactors were irradiated with a
1000 W Hortilux Blue metal halide bulb or a Newport 300 W Xe Lamp (at a distance of 4
cm and a light intensity of 2.2 suns) for a period of 16 hours. Product gases were
analyzed by a flame ionization detector (FID) and thermal conductivity detector (TCD)
installed in a SRI-8610 Gas Chromatograph (GC) with a 3’ Mole Sieve 13a and 6‘
Haysep D column. The reactor was held in a custom designed stand. The thermocouple
was placed at the front face of the sample and shielded from incident light unless
otherwise specified. Isotope tracing experiments were performed using 13CO2 (99.9
atomic% Sigma Aldrich). Isotope product gases were separated using a 60 m GS-
Carbonplot column and measured using an Agilent 7890A gas chromatographic mass
spectrometer (GC-MS).

141
5.6 References
(1) Woodhouse, M.; Parkinson, B. A. Combinatorial Approaches for the Identification and Optimization of Oxide Semiconductors for Efficient Solar Photoelectrolysis. Chem. Soc. Rev. 2009, 38, 197–210.
(2) McKone, J. R.; Pieterick, A. P.; Gray, H. B.; Lewis, N. S. Hydrogen Evolution from Pt/Ru-Coated P-Type WSe2 Photocathodes. J. Am. Chem. Soc. 2013, 135, 223–231.
(3) Khaselev, O.; Turner, J. a. A Monolithic Photovoltaic-Photoelectrochemical Device for Hydrogen Production via Water Splitting Science 2014, 280, 425-427.
(4) Lin, Y.; Battaglia, C.; Boccard, M.; Hettick, M.; Yu, Z.; Ballif, C.; Ager, J. W.; Javey, A. Amorphous Si Thin Film Based Photocathodes with High Photovoltage for Efficient Hydrogen Production. Nano Lett. 2013, 13, 5615–5618.
(5) Aurian-Blajeni, B.; Halmann, M.; Manassen, J. Electrochemical Measurement on the Photoelectrochemical Reduction of Aqueous Carbon Dioxide on p-Gallium Phosphide and p-Gallium Arsenide Semiconductor Electrodes. Sol. Energy Mater. 1983, 8, 425–440.
(6) Preusser, S.; Herlem, M.; Etcheberry, A.; Jaume, J. The Photodissolution of InP. Electrochim. Acta 1992, 37, 289–295.
(7) Ida, S.; Yamada, K.; Matsunaga, T.; Hagiwara, H.; Matsumoto, Y.; Ishihara, T. Preparation of p-Type CaFe2O4 Photocathodes for Producing Hydrogen from Water. J. Am. Chem. Soc. 2010, 132, 17343–17345.
(8) Matsumoto, Y.; Obata, M.; Hombo, J. Photocatalytic Reduction of Carbon Dioxide on p-Type CaFe2O4 Powder. J. Phys. Chem. 1994, 98, 2950–2951.
(9) Galakhov, V. R.; Poteryaev, A. I.; Kurmaev, E. Z.; Anisimov, V. I.; Bartkowski, S.; Neumann, M.; Lu, Z. W.; Klein, B. M.; Zhao, T.-R. Valence-Band Spectra and Electronic Structure of CuFeO2. Phys. Rev. B 1997, 56, 4584–4591.
(10) Saadi, S.; Bouguelia, A.; Trari, M. Photocatalytic Hydrogen Evolution over CuCrO2. Sol. Energy 2006, 80, 272–280.
(11) Gu, J.; Yan, Y.; Krizan, J. W.; Gibson, Q. D.; Detweiler, Z. M.; Cava, R. J.; Bocarsly, A. B. p-Type CuRhO2 as a Self-Healing Photoelectrode for Water Reduction under Visible Light. J. Am. Chem. Soc. 2014, 136, 830–833.
(12) Smith, J. R.; Van Steenkiste, T. H.; Wang, X. G. Thermal Photocatalytic Generation of H2 over CuAlO2 Nanoparticle Catalysts in H2O. Phys. Rev. B - Condens. Matter Mater. Phys. 2009, 79, 2–5.

142
(13) Thurston, T. R.; Wilcoxon, J. P. Photooxidation of Organic Chemicals Catalyzed by Nanoscale MoS2. J. Phys. Chem. B 1999, 103, 11–17.
(14) Read, C. G.; Park, Y.; Choi, K.-S. Electrochemical Synthesis of p-Type CuFeO2 Electrodes for Use in a Photoelectrochemical Cell. J. Phys. Chem. Lett. 2012, 3, 1872–1876.
(15) Prévot, M. S.; Guijarro, N.; Sivula, K. Enhancing the Performance of a Robust Sol-Gel-Processed P-Type Delafossite CuFeO2 Photocathode for Solar Water Reduction. ChemSusChem 2015, 8, 1359-1367.
(16) López, R.; Gómez, R. Band-Gap Energy Estimation from Diffuse Reflectance Measurements on Sol-Gel and Commercial TiO2: A Comparative Study. J. Sol-Gel Sci. Technol. 2012, 61, 1–7.
(17) Ong, K. P.; Bai, K.; Blaha, P.; Wu, P. Electronic Structure and Optical Properties of AFeO2 (A = Ag, Cu) within GGA Calculations. Chem. Mater. 2007, 19, 634–640.
(18) Reitz, C.; Suchomski, C.; Haetge, J.; Leichtweiss, T.; Jagličić, Z.; Djerdj, I.; Brezesinski, T. Soft-Templating Synthesis of Mesoporous Magnetic CuFe2O4 Thin Films with Ordered 3D Honeycomb Structure and Partially Inverted Nanocrystalline Spinel Domains. Chem. Commun. 2012, 48, 4471.
(19) Bassaid, S.; Chaib, M.; Omeiri, S.; Bouguelia, a.; Trari, M. Photocatalytic Reduction of Cadmium over CuFeO2 Synthesized by Sol-Gel. J. Photochem. Photobiol. A Chem. 2009, 201, 62–68.
(20) Gu, J.; Wuttig, A.; Krizan, J. W.; Hu, Y.; Detweiler, Z. M.; Cava, R. J.; Bocarsly, A. B. Mg-Doped CuFeO 2 Photocathodes for Photoelectrochemical Reduction of Carbon Dioxide. J. Phys. Chem. C 2013, 117,
(21) O’Brien, P. G.; Sandhel, A.; Wood, T. E.; Jelle, A. a.; Hoch, L. B.; Perovic, D. D.; Mims, C. A.; Ozin, G. A. Photomethanation of Gaseous CO2 over Ru/Silicon Nanowire Catalysts with Visible and Near-Infrared Photons. Adv. Sci. 2014, 1.
(22) Hoch, L. B.; Wood, T. E.; O’Brien, P. G.; Liao, K.; Reyes, L. M.; Mims, C. A.; Ozin, G. A. The Rational Design of a Single-Component Photocatalyst for Gas-Phase CO2 Reduction Using Both UV and Visible Light. Adv. Sci. 2014, 1.
(23) Sastre, F.; Puga, A.V.; Liu, L.; Corma, A.; Garcia, H. J. Am. Chem. Soc. 2014, 136, 6798-6801.
(24) Newsome, D. S. The Water-Gas Shift Reaction. Catal. Rev. 1980, 21, 275–318.

143
Chapter 6 – Conclusions and Future Outlook
6.1 Concluding Remarks
In the work presented in this thesis, we explored the potential of various earth
abundant metal oxides to be used as catalysts for light assisted generation of fuels from
CO2 and H2O. Our approach was driven by a focus on low cost materials that currently
lack practical efficiencies but have the potential to be scaled to globally significant
quantities with improved performance. We approached this challenge from a synthetic
materials chemistry perspective based on our expertise in nanomaterials. In doing so,
we made use of a number of synthetic methods to access the desired materials. In
Chapters 2 and 3, we used high temperature, organic-phase, colloidal chemistry
techniques to obtain previously unreported oxide-oxide heterojunction nanocrystals
based on Fe2O3 and Cu2O. We then transitioned to low-temperature, aqueous phase
approaches to prepare Cu2O nanocubes and various multicomponent architectures. In
chapter 5, we prepared mixed metal oxides based on Cu and Fe using classic solid-
state chemistry techniques. Some key findings and advances presented in the thesis
include:
Synthesis of novel Fe2O3/Cu2O hetero-structured nanocrystals and elucidation
of their hybrid properties
Evaluation of low-pressure UV photolysis for organic ligand removal on colloidal
nanocrystals by XPS and comparison to thermal and colloidal ligand-exchange
techniques
Studying the effect of hole scavengers on gas-phase product distribution for
water splitting experiments in the presence of widely used P25 and P25/(Pt, Au)
catalysts
Investigating the light-assisted hydrogenation of CO2 to CO by an iron/copper
delafossite, CuFeO2
Future work will focus on the CuFeO2 system and determining the origin of its
apparent catalytic properties for CO2 hydrogenation. Firstly we would like to increase

144
the particle’s surface area by decreasing their average size. Infiltrating the channels of
commercially available periodic mesoporous SiO2 with the CuFeO2 precursors would
confine the growth of the delafossite to within the pores of the SiO2 structure. The
template can then be dissolved away with NaOH(aq) to give the delafossite in
nanoparticulate form. We would then examine the effect of surface area on product
rates. In terms of further gas-phase testing, we would like to examine the effect of light
intensity and wavelength on the observed rates. A series of long-wavelength pass filters
(ex. 400 nm, 500 nm etc) will be used to block out the shorter wavelengths of the visible
spectrum while we monitor activity. Based on the narrow bandgap of CuFeO2, the entire
visible spectrum would be expected to contribute to its photocatalytic properties. In
addition, we have plans to perform a full light intensity study by varying the illumination
from 1 Sun to 25 Sun equivalents in order to establish a minimum illumination threshold.
We will then switch testing from a batch to a flow setup which will enable us to do
continuous product as a function of illumination or temperature and test powders as
opposed to thin films. In the flow reactor, we will be able to heat the catalyst to
temperatures up to 500°C and monitor its performance in the absence of illumination.
This will give us some insights into how much of the activity is driven by a photothermal
effect as opposed to a photocatalytic one. There are plans to vary the reactant gases;
we are equipped to detect the products of water splitting and so it would be interesting
to study if CuFeO2 is able to drive gas-phase overall water splitting. If the sample
transforms into Cu and Fe3O4, the metal component could be a reducing site with
oxidation taking place on the oxide.
At this stage it would be useful to summarize some of the lessons learned over the
course of this work, which may be valuable to fellow researchers in the field of artificial
photosynthesis. One of the main challenges that we encountered was dealing with the
presence of organic capping ligands on the surface of our nanoparticulate catalysts.
Molecules containing long hydrocarbon chains and a polar head group such as
oleylamine, oleic acid, or trioctylphosphine oxide are invariably used to mediate the
growth of nanocrystals in organic solvents and to provide solubility in non-polar media.
Unfortunately, they also insulate adjacent nanocrystals from electronic coupling, prevent
reactants reaching the nanoparticle surface and can give false positive hydrocarbon

145
signals when testing for CO2 reduction products by GC. In Chapter 3, we described the
main techniques for removing hydrocarbon ligands including solution-phase ligand
exchange, thermal calcination, and UV photolysis. For applications that require
nanocrystals to be soluble, chemical removal by ligand exchange is the preferred
approach. Care must be taken in ascertaining that the incoming ligand reacts only with
the organic shell and not the inorganic nanocrystal core as we observed using NOBF4
and the Fe2O3/Cu2O HNCs. For applications where thin films or nanocrystal powders
are desired, physical carbon removal methods are more suitable. Simple thermal
treatment may be effective as long as it does not induce structural changes in the
nanocrystals. UV photolysis was found to be very effective and faster than thermal
treatment in removing carbon contamination and we recommend other researchers to
consider this method as an option. One drawback of this technique is the slow “batch”
throughput which limits the efficiency of the process. Surface rearrangements caused
by prolonged UV irradiation can also occur as evidenced by the UPS data in Chapter 3.
Overall, we would advocate avoiding the use of long-chain hydrocarbons whenever
possible by using aqueous phase synthetic methodologies. High temperature reactions
in organic media afford exquisite control over particle size and shape but this many not
be necessary for many applications where monodispersity is not crucial. We would also
like to state the importance of 13C isotope labelling for determining whether the detected
products of CO2 reduction experiments originate from CO2 or from adventitious carbon
contamination. Many publications omit this experiment but still report active catalysts.1–3
Relevant control experiments such as carrying out the desired reactions in the absence
of light and/or CO2 are certainly useful and support manuscripts’ claims of
photocatalysis. However, using 13CO2 as the reactant gas and detecting 13C-labelled
products by GC-MS remains the most convincing way to demonstrate genuine reduction
of CO2 to hydrocarbons.
The nature of the reaction medium is another consideration that must be carefully
taken into account by researchers. Most publications report liquid-phase systems where
the active catalyst is suspended in CO2-saturated aqueous or organic solutions. This
setup has several drawbacks as the solubility of CO2 in water is quite low and the
presence of the electrolyte can contribute to catalyst decomposition through
146
photocorrosion. These challenges can be largely resolved by using light-assisted gas-
solid heterogeneous catalysis. In the gas-phase, high pressures of reactant gases are
easily achieved and catalyst degradation may be less of an issue. We believe that
working in the gas-phase is the better approach when it comes to doing artificial
photosynthesis on industrial scales whereas aqueous setups are better suited to
preliminary testing in laboratory environments. In terms of materials development, we
believe it will be difficult to discover a single “magic bullet” material with the required
light absorption, charge transport, and surface chemistry properties which can drive
overall CO2 reduction or H2O splitting. Multi-component architectures which combine
light absorbing and catalytic domains have been shown to be capable of driving these
processes albeit at very low efficiencies of fractions of a percent.4 An advantage of
these approaches is they allow for separate optimization of each functional domain
which can then be interfaced with other components in the final device. In particular,
combining semiconductor light absorbers with molecular catalysts is a very promising
approach that combines efficient solar absorption with selective CO2 conversion. The
major limiting factor here is still the catalysis itself regardless of whether one uses
metal/semiconductor surfaces, organometallic complexes, or nanocrystals.5–8
Developing efficient, earth-abundant H2 and O2 evolving catalysts along with those
capable of reducing CO2 to hydrocarbons will remain a topic of intense interest in the
coming years.
Furthermore, we have increasingly found that the classical solid state physics way
of thinking is unable to fully describe the complexities of CO2 reduction. Judicious
selection of materials with proper conduction and valence band energies is not sufficient
to ensure CO2 conversion; the surface chemistry of the catalyst is evidently equally
important. We noted evidence of this with Cu2O nanocubes in Chapter 4 which were
completely inactive when it came to doing chemistry with CO2 and H2O despite having
energetically suitable band energies. It is therefore crucial for researchers to develop an
understanding of the surface active sites, kinetics, and reaction mechanisms of potential
nanoparticulate catalysts. As an example, our group recently reported a detailed
spectroscopic and DFT analysis of the surface reaction chemistry responsible for the
light-driven conversion of CO2 to CO by hydroxylated indium oxide nanocrystals.9 We

147
proposed a reaction mechanism whereby surface active sites of In2O3-x(OH)y are
composed of a Lewis basic hydroxide adjacent to a Lewis acidic indium, which in the
presence of an oxygen vacancy, assist the adsorption and heterolytic dissociation of H2
which enables the reaction of CO2 to form CO and H2O. The proximal Lewis acid and
base sites suggest a mechanism analogous to molecular Frustrated Lewis pairs, an
exciting discovery for surface chemistry on semiconductors. Elucidating similar
structure-property-activity relationships will be a crucial step for future researchers in the
field of solar fuels.
6.2 Future Outlook for Solar Fuels
In this concluding section of the thesis, we would like to share our views on the
current directions and future development of solar fuel technologies towards
commercialization, once again with an emphasis on CO2 as the primary carbon source.
Several approaches currently being considered including solar-driven photocatalytic,
photo-electrochemical, and electrochemical CO2 conversions, alongside CO2
hydrogenation with solar derived H2, and solar-driven thermochemical processes.10 It is
evident that two principal routes emerge from the myriad CO2 conversion technologies
summarized in Figure 6.1:
1. Catalytic conversion using solar derived H2
2. Direct CO2 reduction with H2O
In the first route, CO2 is hydrogenated by H2 derived from solar energy through
various technologies including photo-electrochemical water splitting, electrolysis, and
thermochemical methods. Water electrolysis is a commercially demonstrated
technology, and has reasonably high system efficiencies. Coupling electrolytic modules
with photovoltaic panels is a near-term solution to producing clean hydrogen with
reasonable solar to H2 efficiencies of approximately 10%.6
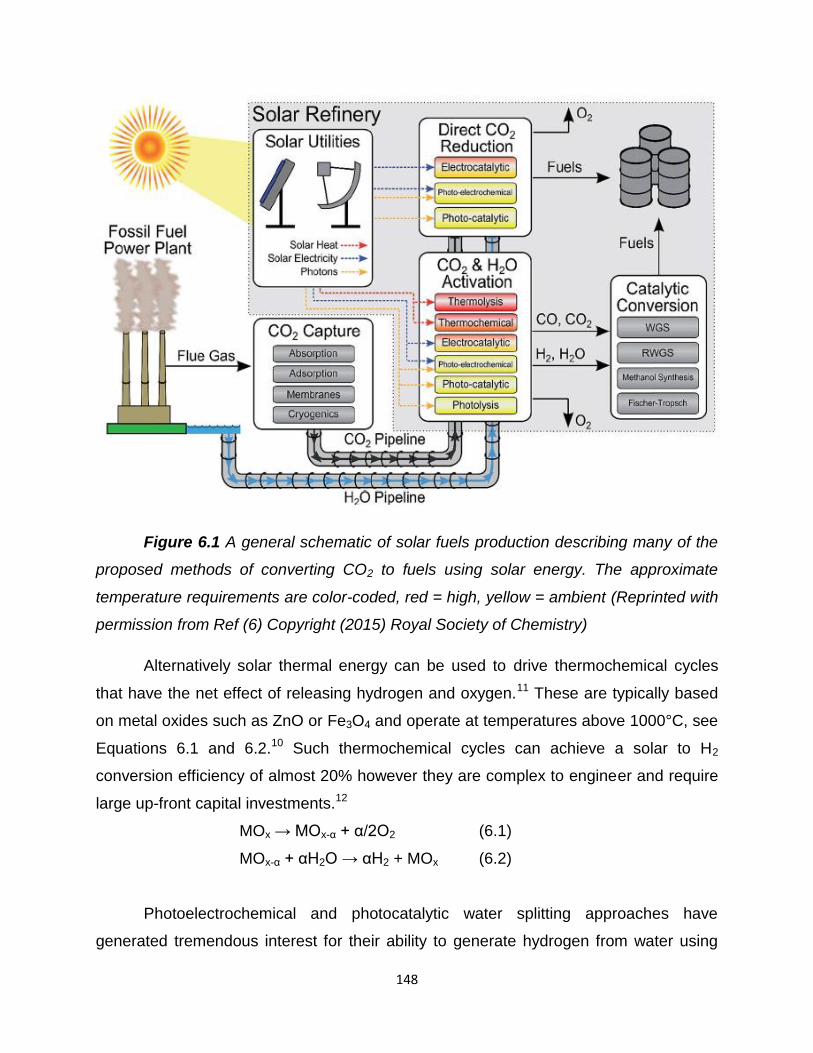
148
Figure 6.1 A general schematic of solar fuels production describing many of the
proposed methods of converting CO2 to fuels using solar energy. The approximate
temperature requirements are color-coded, red = high, yellow = ambient (Reprinted with
permission from Ref (6) Copyright (2015) Royal Society of Chemistry)
Alternatively solar thermal energy can be used to drive thermochemical cycles
that have the net effect of releasing hydrogen and oxygen.11 These are typically based
on metal oxides such as ZnO or Fe3O4 and operate at temperatures above 1000°C, see
Equations 6.1 and 6.2.10 Such thermochemical cycles can achieve a solar to H2
conversion efficiency of almost 20% however they are complex to engineer and require
large up-front capital investments.12
MOx → MOx-α + α/2O2 (6.1)
MOx-α + αH2O → αH2 + MOx (6.2)
Photoelectrochemical and photocatalytic water splitting approaches have
generated tremendous interest for their ability to generate hydrogen from water using

149
only solar irradiation or a small applied potential. Important strides have been made in
recent years towards improving the performance of these technologies but many issues
still remain. Photo-electrochemical cells are only able to achieve competitive H2
evolution rates using expensive multi-junction systems such as Nocera’s artificial leaf.13
Despite using earth abundant electrodes such as CoPi and NiMoZn alloy, the
engineering cost of this system was deemed too high for commercialization. In a similar
vein, photocatalytic systems are attractive for their simplicity but efficiencies lag even
further behind PEC technology. The state of the art catalyst based on a Ga1-xZnxN1-xOx
solid solution with a mixed Rh-Cr oxide co-catalyst only achieves a solar to H2
conversion of 0.2 %.14 The H2 generated by the above methods can then be used to
reduce CO2 to fuels using mature industrial processes as has been discussed earlier. In
particular, the reverse-water–gas-shift reaction (RWGS) can be used to convert CO2
and hydrogen to CO and water as we observed in Chapter 5. CO mixed with hydrogen
in varying proportions produces syngas, which can be used to synthesize a variety of
products, including methanol, dimethylether, or hydrocarbons through Fischer–Tropsch
synthesis. There also exist direct routes for hydrogenating CO2 to products
hydrocarbons including methanol, methane, and formic acid.
Besides these indirect hydrogenation approaches, CO2 can also be directly
converted to fuels using H2O and solar energy electrocatalytic, photo-electrochemical,
thermochemical, or photocatalytic methods. The simplicity of such direct CO2
conversion processes in this category makes them very attractive despite the fact that
these technologies are not as mature as those in the previous section. The major
challenge is twofold; firstly CO2 solubility in the aqueous phase is low which leads to low
reduction rates. Additionally, H2 evolution from water competes with CO2 reduction
because of its similar thermodynamic reduction potential thereby lowering CO2
conversion efficiencies. Nevertheless, important progress has been made in the
electrocatalytic, photo-electrochemical, and photocatalytic conversion of CO2. Much of
the electrocatalytic work has been done on metal surfaces with copper being most
effective at producing hydrocarbons from CO2.15 The major product is usually CO on
Ag, Au, and Pd, formate on Pb, Hg, In, Cd, and Sn, and hydrogen on Ni, Pt, Fe and Ti.6
Semiconductor surfaces have also been investigated with the most common

150
photocathodes being Si, p-InP, p-GaAs, and p-CdTe.16 Many semiconductor systems
are designed to operate in organic solvents instead of water to circumvent competitive
H2 evolution. Common solvents include acetonitrile, dimethylformamide, methanol, and
ionic liquids, but the use of such additives renders the overall process less
sustainable.10,16 It quickly becomes evident that the major challenge of CO2 reduction is
catalytic in nature. In particular conversion rates and selectivities lag far behind those of
water splitting prohibiting any economically viable implementation of CO2 conversion
catalysis. At the same time, this means that there is a huge incentive for chemists to
come up with materials solutions to these challenges. A number of well-funded research
centres are currently tackling CO2 reduction including the Joint Centre for Artificial
Photosynthesis (JCAP) in California, the DOE-sponsored Argonne-Northwestern Solar
Energy Research Center, and the SUNCAT Centre for Interface Science and Catalysis
at Stanford Unieversity.6
As society moves towards reducing our dependence on fossil fuels and the
implementation of more sustainable energy resources, we are faced with one of our
biggest technological challenges yet. In order to attract the attention of the general
public and lawmakers, solar fuel technologies must reach a point of commercial
competitiveness with fossil fuels. With a sustained collaborative effort among
researchers from the fields of chemistry, chemical engineering, materials science, and
physics, we are capable of realizing our goal of an energy economy based on
renewable fuels. We fully believe that with continued funding and extensive research
efforts focused on developing cheap, efficient catalyst materials to overcome the
challenges of insufficient activity, poor product selectivity and low stability, the
technology of solar fuels will move towards commercialization in the near future.
6.3 References
(1) Liang, Y. T.; Vijayan, B. K.; Gray, K. A.; Hersam, M. C. Minimizing Graphene Defects Enhances Titania Nanocomposite-Based Photocatalytic Reduction of CO2 for Improved Solar Fuel Production. Nano Lett. 2011, 11, 2865–2870.
(2) Liu, Q.; Zhou, Y.; Kou, J.; Chen, X.; Tian, Z.; Gao, J.; Yan, S.; Zou, Z. High-Yield Synthesis of Ultralong and Ultrathin Zn2GeO4 Nanoribbons toward Improved

151
Photocatalytic Reduction of CO2 into Renewable Hydrocarbon Fuel. J. Am. Chem. Soc. 2010, 132, 14385–14387.
(3) Xi, G.; Ouyang, S.; Li, P.; Ye, J.; Ma, Q.; Su, N.; Bai, H.; Wang, C. Ultrathin W18O49 Nanowires with Diameters below 1 nm: Synthesis, Near-Infrared Absorption, Photoluminescence, and Photochemical Reduction of Carbon Dioxide. Angew. Chemie, Int. Ed. 2012, 51, 2395–2399, S2395/1–S2395/9.
(4) Sato, S.; Arai, T.; Morikawa, T.; Uemura, K.; Suzuki, T. M.; Tanaka, H.; Kajino, T. Selective CO2 Conversion to Formate Conjugated with H2O Oxidation Utilizing Semiconductor/Complex Hybrid Photocatalysts. J. Am. Chem. Soc. 2011, 133, 15240–15243.
(5) Luo, J.; Im, J.; Mayer, M. T.; Schreier, M.; Nazeeruddin, M. K.; Park, N.; Tilley, S. D.; Fan, H. J.; Grätzel, M. Water Photolysis at 12.3% Efficiency via Perovskite Photovoltaics and Earth-Abundant Catalysts. Science 2014, 345, 1593-1596.
(6) Sastre, F.; Puga, A. V; Liu, L.; Corma, A.; García, H. Complete Photocatalytic Reduction of CO2 to Methane by H2 under Solar Light Irradiation. J. Am. Chem. Soc. 2014, 136, 6798–6801.
(7) Manthiram, K.; Beberwyck, B. J.; Alivisatos, A. P. Enhanced Electrochemical Methanation of Carbon Dioxide with a Dispersible Nanoscale Copper Catalyst. J. Am. Chem. Soc. 2014.
(8) Finn, C.; Schnittger, S.; Yellowlees, L. J.; Love, J. B. Molecular Approaches to the Electrochemical Reduction of Carbon Dioxide. Chem. Commun. 2012, 48, 1392.
(9) Ghuman, K. K.; Wood, T. E.; Hoch, L. B.; Mims, C. A.; Ozin, G. A.; Singh, C. V. Illuminating CO 2 Reduction on Frustrated Lewis Pair Surfaces: Investigating the Role of Surface Hydroxides and Oxygen Vacancies on Nanocrystalline In2O3−x (OH)y. Phys. Chem. Chem. Phys. 2015, 17, 14623–14635.
(10) Herron, J. A.; Kim, J.; Upadhye, A. A.; Huber, G. W.; Maravelias, C. T. A General Framework for the Assessment of Solar Fuel Technologies. Energy Environ. Sci. 2015, 8, 126–157.
(11) Steinfeld, A. Solar Thermochemical Production of Hydrogen - A Review. Sol. Energy 2005, 78, 603–615.
(12) Ferreira, L. S.; Trierweiler, J. O. Modeling and Simulation of the Polymeric Nanocapsule Formation Process. IFAC Proc. Vol. 2009, 7, 405–410.
(13) Reece, S. Y.; Hamel, J. a.; Sung, K.; Jarvi, T. D.; Esswein, a. J.; Pijpers, J. J. H.; Nocera, D. G. Wireless Solar Water Splitting Using Silicon-Based Semiconductors and Earth-Abundant Catalysts. Science 2011, 334, 645–648.

152
(14) Maeda, K.; Teramura, K.; Lu, D.; Takata, T.; Saito, N.; Inoue, Y.; Domen, K. Photocatalyst Releasing Hydrogen from Water. Nature 2006, 440, 295.
(15) Yano, J.; Yamasaki, S. Pulse-Mode Electrochemical Reduction of Carbon Dioxide Using Copper and Copper Oxide Electrodes for Selective Ethylene Formation. J. Appl. Electrochem. 2008, 38, 1721–1726.
(16) Kumar, B.; Llorente, M.; Froehlich, J.; Dang, T.; Sathrum, A.; Kubiak, C. P. Photochemical and Photoelectrochemical Reduction of CO2. Annu. Rev. Phys. Chem. 2012, 63, 541–569.
Copyright © 2022 FDOKUMEN