Bioinspired reduced graphene oxide nanosheets usingTerminalia chebula seeds extract
8
Bioinspired reduced graphene oxide nanosheets using Terminalia chebula seeds extract Sireesh Babu Maddinedi a , Badal Kumar Mandal a,⇑ , Raviraj Vankayala b , Poliraju Kalluru b , Sreedhara Reddy Pamanji c a Trace Elements Speciation Research Laboratory, Environmental and Analytical Chemistry Division, School of Advanced Sciences, VIT University, Vellore 632014, India b Department of Chemistry, National Tsing Hua University, Hsinchu 30013, Taiwan, ROC c Department of Physics, Sri Venkateswara University, Tirupati, India highlights A green eco-friendly synthesis method for T. chebula mediated reduced graphene oxide. HPLC, FTIR and Raman results explained the stabilization of graphene sheets. Adsorption of polyphenols on the surface of graphene sheets stabilizes it. graphical abstract A simple and efficient method for the reduced graphene oxide production by the eco-friendly deoxygena- tion of graphene oxide using the seed extract of T. chebula. The phytochemicals in the T. chebula extract are responsible for the reduction and also stabilizes by functionalizing on the surface of the graphene sheets. HO O O O O HO O O HO O O O O HO OH O O O O article info Article history: Received 24 October 2014 Received in revised form 30 January 2015 Accepted 6 February 2015 Available online 21 February 2015 Keywords: Graphene oxide Terminalia chebula Polyphenols Nanosheets abstract A green one step facile synthesis of graphene nanosheets by Terminalia chebula (T. chebula) extract mediated reduction of graphite oxide (GO) is reported in this work. This method avoids the use of harmful toxic reducing agents. The comparative results of various characterizations of GO and T. chebula reduced graphene oxide (TCG) provide a strong indication of the exclusion of oxygen containing groups from graphene oxide and successive stabilization of the formed reduced graphene oxide (RGO). The functionalization of reduced graphene oxide with the oxidized polyphenols causes their stability by preventing the aggregation. We also have proposed how the oxidized polyphenols are accountable for the stabilization of the formed graphene sheets. Ó 2015 Elsevier B.V. All rights reserved. Introduction Graphene is a novel class of material of significant interest with one atom thickness; possess exceptional electrical, thermal and mechanical properties [1]. These extraordinary features offer great potential applications in different fields such as nanoelectronics [2], composites [3–7], fuel cells [8], super capacitor [9] as well as sensors [10] and catalysis [11]. However, several approaches have been reported for the syn- thesis of graphene such as micro mechanical exfoliation of graphite http://dx.doi.org/10.1016/j.saa.2015.02.037 1386-1425/Ó 2015 Elsevier B.V. All rights reserved. ⇑ Corresponding author. Spectrochimica Acta Part A: Molecular and Biomolecular Spectroscopy 145 (2015) 117–124 Contents lists available at ScienceDirect Spectrochimica Acta Part A: Molecular and Biomolecular Spectroscopy journal homepage: www.elsevier.com/locate/saa
Transcript of Bioinspired reduced graphene oxide nanosheets usingTerminalia chebula seeds extract

Spectrochimica Acta Part A: Molecular and Biomolecular Spectroscopy 145 (2015) 117–124
Contents lists available at ScienceDirect
Spectrochimica Acta Part A: Molecular andBiomolecular Spectroscopy
journal homepage: www.elsevier .com/locate /saa
Bioinspired reduced graphene oxide nanosheets using Terminalia chebulaseeds extract
http://dx.doi.org/10.1016/j.saa.2015.02.0371386-1425/� 2015 Elsevier B.V. All rights reserved.
⇑ Corresponding author.
Sireesh Babu Maddinedi a, Badal Kumar Mandal a,⇑, Raviraj Vankayala b, Poliraju Kalluru b,Sreedhara Reddy Pamanji c
a Trace Elements Speciation Research Laboratory, Environmental and Analytical Chemistry Division, School of Advanced Sciences, VIT University, Vellore 632014, Indiab Department of Chemistry, National Tsing Hua University, Hsinchu 30013, Taiwan, ROCc Department of Physics, Sri Venkateswara University, Tirupati, India
h i g h l i g h t s
� A green eco-friendly synthesismethod for T. chebula mediatedreduced graphene oxide.� HPLC, FTIR and Raman results
explained the stabilization ofgraphene sheets.� Adsorption of polyphenols on the
surface of graphene sheetsstabilizes it.
g r a p h i c a l a b s t r a c t
A simple and efficient method for the reduced graphene oxide production by the eco-friendly deoxygena-tion of graphene oxide using the seed extract of T. chebula. The phytochemicals in the T. chebula extractare responsible for the reduction and also stabilizes by functionalizing on the surface of the graphenesheets.
HO
O O
OO HO
O
O
HO OO
OO
HO
OHOO O
O
a r t i c l e i n f o
Article history:Received 24 October 2014Received in revised form 30 January 2015Accepted 6 February 2015Available online 21 February 2015
Keywords:Graphene oxideTerminalia chebulaPolyphenolsNanosheets
a b s t r a c t
A green one step facile synthesis of graphene nanosheets by Terminalia chebula (T. chebula) extractmediated reduction of graphite oxide (GO) is reported in this work. This method avoids the use of harmfultoxic reducing agents. The comparative results of various characterizations of GO and T. chebula reducedgraphene oxide (TCG) provide a strong indication of the exclusion of oxygen containing groups fromgraphene oxide and successive stabilization of the formed reduced graphene oxide (RGO). Thefunctionalization of reduced graphene oxide with the oxidized polyphenols causes their stability bypreventing the aggregation. We also have proposed how the oxidized polyphenols are accountable forthe stabilization of the formed graphene sheets.
� 2015 Elsevier B.V. All rights reserved.
Introduction
Graphene is a novel class of material of significant interest withone atom thickness; possess exceptional electrical, thermal and
mechanical properties [1]. These extraordinary features offer greatpotential applications in different fields such as nanoelectronics[2], composites [3–7], fuel cells [8], super capacitor [9] as well assensors [10] and catalysis [11].
However, several approaches have been reported for the syn-thesis of graphene such as micro mechanical exfoliation of graphite

118 S.B. Maddinedi et al. / Spectrochimica Acta Part A: Molecular and Biomolecular Spectroscopy 145 (2015) 117–124
[12], chemical vapor deposition [13], epitaxial growth on electri-cally insulating surfaces [14], the exfoliation and reduction of gra-phite oxide [15–17]. Moreover, the lower yield production of thefirst three methods are not well suitable for the applications inbulk scale, whereas graphene oxide reduction has become thepromising route for the large scale synthesis of graphene.
Furthermore, several chemical methods have been developedusing chemical reducing agents like hydrazine [18–20], sodium bor-ohydride [21,22], hydroquinone [23] and dimethylhydrazine [24].Due to the toxic and hazardous nature of some of these chemicalsthese approaches are less promising route for biological applica-tions of the synthesized graphene. Therefore, the demand for thenew, ecofriendly and easily scalable biosynthetic approaches forgraphene synthesis is mounting up.
During last few years, environmental friendly and greenmethods for the synthesis of graphene have been reported usingdifferent biomolecules [25]. For example, the uses of L-ascorbicacid [26], reducing sugar [27] and protein bovine serum albumin[28], and casein [29] have been used in the reduction of grapheneoxide. In addition, some of the interesting alternative greenmethods include the use of green plants and their extracts forecofriendly biosynthesis of graphene.
Recently, different nanoparticles (NPs) such as gold, silver andplatinum were effectively synthesized using plant extracts. Ourgroup has shown that plant extracts can act as good reducing agentsfor the reduction of noble metal ions into their nanoparticles[30,31]. Generally, plant extracts contains different types ofpolyphenols which are converted to the corresponding oxidizedquinone forms in the presence of reactive oxygen and hence theseplant extracts have adequate potential to reduce GO. In this work,we have introduced a green method of graphene synthesis usingTerminalia chebula (T. chebula) plant seed aqueous extracts asreducing agents. T. chebula is a plant used in ayurvedic medicinedue to its antibacterial and strong cardio tonic properties. Naturalpolyphenols that are present in the extracts of T. chebula areresponsible for the reduction and stabilization of graphene sheets.
Experimental section
Materials
Graphite powder (100 mesh, 99.9995%), sodium nitrate(NaNO3), concentrated sulfuric acid (98%), potassium permanganate(KMnO4), hydrogen peroxide (H2O2, 30%), and all organic solventswere purchased from Sigma–Aldrich, Bangalore.
Preparation of GO
Graphene oxide was chemically prepared from natural graphiteflakes using the mixture of concentrated sulfuric acid and KMnO4
by the modified Hummers method [32]. In brief, 0.5 g of graphiteflakes and 0.5 g of sodium nitrate were stirred in 23 mL of 12.1 MH2SO4 (98%) with a magnetic stirrer for 15 min at 0–5 �C. Then4 g of KMnO4 was slowly added into the above mixture by keepingthe temperature below 20 �C. Then the mixture was allowed to stirat 40 �C for 90 min in water bath followed by dilution with 50 mLof double distilled water with vigorous stirring for 10 min. Theresulting dark brown suspension further was treated slowly with6 mL of 30% H2O2 solution followed by dilution with 50 mL doubledistilled water. The resulting GO nanoparticles were washed sev-eral times with deionized water to remove excess of manganesesalt until neutrality was reached. Finally, the purified GO wasdispersed in water (1 mg/mL) followed by exfoliation usingultrasonication in an ultrasonic bath for about 3 h. The formedstable dispersion was used for further experiments.
Preparation of plant seed extract
T. chebula plant seeds were collected and washed with waterand then dried under sunlight. 3.5 g of finely ground powder ofT. chebula seeds was added to 200 mL of deionized water andheated at 90 �C on water bath for 1 h, cooled and filtered through0.2 lm cellulose nitrate membrane filter paper.
Preparation of reduced graphene oxide
About 200 mL of GO solution was added to 200 mL aqueousextract of T. chebula seeds and mixed well by manual shaking.pH of the above solution was adjusted to 12 by using NH4OH.The resulting suspension was refluxed on a water bath at 90 �Cfor about 24 h. The completion of reduction of GO was confirmedby change in the color of GO from yellowish brown to black (alsoconfirmed by UV–Vis analysis). A precipitate of reduced GO settleddown due to the loss of oxygen moieties present in graphene oxideafter the reduction.
Characterization
Fourier transform infrared (FTIR) study was carried out over therange of 4000–400 cm�1 in the diffuse reflectance mode at a res-olution of 4 cm�1 by JASCO FTIR 4100 instrument using KBr pellets.Sample was prepared by mixing TCG powder with KBr powder andpelletised. UV–Visible spectra were analyzed by Jasco V-670 UV–Vis double beam spectrophotometer after dispersing the driedTCG sample in double distilled water and the spectra was mea-sured against the double distilled water as blank. The X-ray diffrac-tion (XRD) study was performed at room temperature by a BrukerD8 Advance diffractometer with Cu Ka radiation (k = 1.54 Å) overthe range of 2h of 3–80� with a scanning rate of 4�/min and witha step size of 0.02�. The instrument was calibrated with lanthanumhexaboride (LaB6) prior to analysis. Scanning electron microscopy(SEM) and energy dispersive X-ray spectroscopy (EDS) analysiswere done by using a Carl Zeiss SEM instrument attached to EVOMA 15 (Oxford Instrument). The solid TCG powder was spread overthe surface of carbon tape adhered on a metallic disk. Images weretaken at diverse magnification for the sample surface. ASimultaneous EDS spectrum was taken at selected areas on theTCG solid surface to get the surface atomic distribution. Ramanspectral analysis was carried out by using a Senterra R200-L appa-ratus (Bruker Optics) by passing laser light of 532 nm wavelength.High resolution transmission electron microscope (HRTEM) imageswere taken with JEOL-2100 F electron microscope at an operatingvoltage of 200 kV. Samples were prepared by dispersing dried TCGin water (1 mg mL�1) under ultrasonic conditions which furtherplaced a drop of it on a Lacey Carbon Coated Copper Grid and driedunder vacuum. A simultaneous measurement of SEAD pattern wasalso carried out. Dynamic light scattering (DLS) analysis was car-ried out by Malvern Instruments. Sample was prepared by dispers-ing TCG powder in water by sonication (1 mg mL�1). HPLC analysiswas done using Perkin Elmer 200 Series HPLC equipped withUV–Vis Detector (k = 192–700 nm) and a 200 Series pump.Mobile phase was prepared using 32% of acetonitrile and 0.1 MHCl and pH was adjusted to 3 using dilute HCl. Samples were pre-pared by mixing the extract with the mobile phase. High resolutionX-ray photoelectron spectroscopy (HRXPS) measurements weretaken with a PHI Quantera SXM, scanning X-ray microprobe(ULVac-PHI Inc.). Measurements were carried out by homoge-neously depositing the dry TCG powder on the surface of siliconwafer pasted with a copper tape. Thermogravimetric analysis(TGA) was carried out for TCG, by using a thermal analyzer, TG50(Simadzu) at heating rate of 10 �C/min with a nitrogen flow rateof 30 mL/min. Diffuse reflectance spectroscopic (DRS) studies were

S.B. Maddinedi et al. / Spectrochimica Acta Part A: Molecular and Biomolecular Spectroscopy 145 (2015) 117–124 119
performed by using Jasco V-670 UV–Vis spectrophotometer withdried powder of TCG.
Results and discussion
The synthetic procedure involved in the preparation ofgraphene from graphene oxide is illustrated in Fig. 1, which isshown by the color change from brownish yellow to black. Afterthe completion of reduction, reduced graphene oxide settled downas precipitate, suggesting the loss of oxygen containing moietiespresent in the graphene oxide.
UV-Visible spectra analysis
The reduction process of graphene oxide was examined by tak-ing the UV–Visible absorption spectra of RGO as a function of time.UV analysis showed a maximum absorption peak of 232 nm of GOwhich was ascribed to the p–p⁄ transitions of the aromatic C–Cbonds and a weak shoulder appeared at 300 nm due to n–p⁄ tran-sitions of C@O bonds. Completion of reduction was confirmed bythe establishment of new peak and a red shift of characteristic peakat 232 nm to 275 nm (Fig. 2), indicating the restoration of elec-tronic conjugation of graphene sheets. The performance of reduc-ing agent can be estimated by the maximum red shift valueobserved [33]. For instance, our T. chebula extract reduced gra-phene oxide showed an absorption peak at 275 nm, which is higherthan that of hydrazine [34] and phenyl hydrazine [35] reduced gra-phene (270 nm), indicating the efficient reducing ability ofpolyphenols present in T. chebula extracts. The typical broad shoul-der appeared at 367 nm may be due to the presence of polyphenolsthat are attached on the surface of graphene nanosheets whichprevents agglomeration of graphene [36,37].
Fig. 1. Schematic illustration of Terminalia chebula mediated reduction of grapheneoxide.
0.1
1.4
0.5
1
200 800400 600
Abs
Wavelength [nm]
232 nm
275 nm
367 nm
Fig. 2. UV–Visible spectra of (a) GO (green) (b) TCG (blue). (For interpretation of thereferences to color in this figure legend, the reader is referred to the web version ofthis article.)
FTIR study
Further, Fourier transform infrared (FTIR) spectroscopic studiesof pure GO and TC reduced GO samples were performed to knowthe extent of reduction (Fig. 3). It is observed that GO shows abroad band in the range of 3100–3400 cm�1 corresponding to theO–H stretching vibrations. The absorption band around1722 cm�1 is due to C@O stretch of carbonyl group and a band at1618 cm–1 corresponds to the O–H bending and epoxide ring vibra-tions. The narrower absorption peak around 1050 cm�1 is due tothe C–O stretching vibrational peak of carboxylic (COOH) groupspresent on the surface of graphene oxide. The absorption band ataround 1400 cm�1 may be due to the presence of tertiary alcohol(C–OH) group. The FTIR spectra of dried TCG shows a significantdecrease in the intensities of absorption bands (O–H, C@O, C–Oand tertiary C–OH bands) corresponding to the oxygen functionali-ties present in the graphene oxide, which establishes the deoxy-genation and the results are similar to the results obtained fromthe graphene synthesized by using plant extracts [38].
XRD study
Fig. 4 shows the XRD diffractogram which approves T. chebulaextract induced reduction of GO to graphene. The GO shows a sin-gle basal reflection diffraction peak at 11.2� (002) withcorresponding interlayer d-spacing of 0.77 nm, revealing theintercalation of water and other oxygen containing groupsbetween the layers of graphite upon oxidation. Conversely, TCGformed after the reduction of GO with T. chebula extract showeda broad diffraction peak at 2h of 26.6� from (111) crystal planewith corresponding d-spacing of 0.33 nm. The disappearance ofpeak at 2h of 11.2� and a relatively decreased d-spacing value ofgraphene formed when compared with GO, indicating the com-plete removal of oxygen containing groups in GO after reduction.
SEM and EDS analysis
We further investigated the morphology of GO and TCG by SEManalysis. Fig. 5A clearly showed the existence of stacked layers ofsolid GO with rough surface. However, the surface roughness ofGO may be due to the oxidation of sheets. Compared to GO, theTCG also showed the layered structures but are thin and existswith lower height (Fig. 5B). The EDS spectrum of the synthesizedGO and TCG showed the oxygen percentage of GO and TCG are43.2, 24.8 atom% (as revealed in Fig. 5C and D), confirming the exis-tence of oxygen in the T. chebula reduced graphene even after thereduction, which may be due to the surface oxidized polyphenols.This finding is further confirmed by XPS study.
TEM analysis
HRTEM microscopic images of TCG (which are shown inFig. 6A–C) showed a transparent, silk like appearance of ultra thingraphene sheets after reduction. It is also shown that the edges ofthe suspended graphene films tend to fold back, permitting thecross-sectional view of the films. From Fig. 6B, it is clearly con-cluded the formation of three layered graphene sheets. Theselected area electron diffraction (SAED) pattern of grapheneshows a typical sharp polycrystalline ring pattern composed ofmany diffraction spots (Fig. 6D), representing the loss of long rangeorganization between the formed graphene nanosheets.
HPLC analysis
HPLC analysis is performed to know the polyphenolicconstituents present in the aqueous extract of T. chebula seeds.

500100015002000300040001/cm
%T
3300
.20
1708
.93
3172
.90
1722
.43
1618
.28
1402
.25
1053
.13
GO-2
GO-2
TC
Fig. 3. FTIR spectra of GO (blue) and dried TCG (pink). (For interpretation of the references to color in this figure legend, the reader is referred to the web version of thisarticle.)
Fig. 4. XRD patterns of GO and TCG.
Fig. 5. SEM images and EDS spectr
120 S.B. Maddinedi et al. / Spectrochimica Acta Part A: Molecular and Biomolecular Spectroscopy 145 (2015) 117–124
Fig. S1A is showing the presence of four different phytochemicalsin T. chebula aqueous extract namely, ascorbic acid, gallic acid,pyrogallol and methyl gallate which are known by comparing withthe retention times of the respective standards under the sameinstrumental conditions. Further, the presence of gallic acid asmajor constituent in T. chebula extract indicates its predominantrole in the reduction of GO to TCG (Fig. S1A).
Mechanism
The suggested mechanism for the reduction of GO by T. chebulaextract is shown in Fig. S1C. The surface of the GO containsdifferent oxygen containing groups such as epoxide, hydroxyl,and carbonyl [39]. Under basic conditions both the epoxide andcarbonyl groups may be converted into hydroxyl groups. T. chebulaplant extract contains four different types of polyphenols namely,
a of GO (A, C) and TCG (B, D).
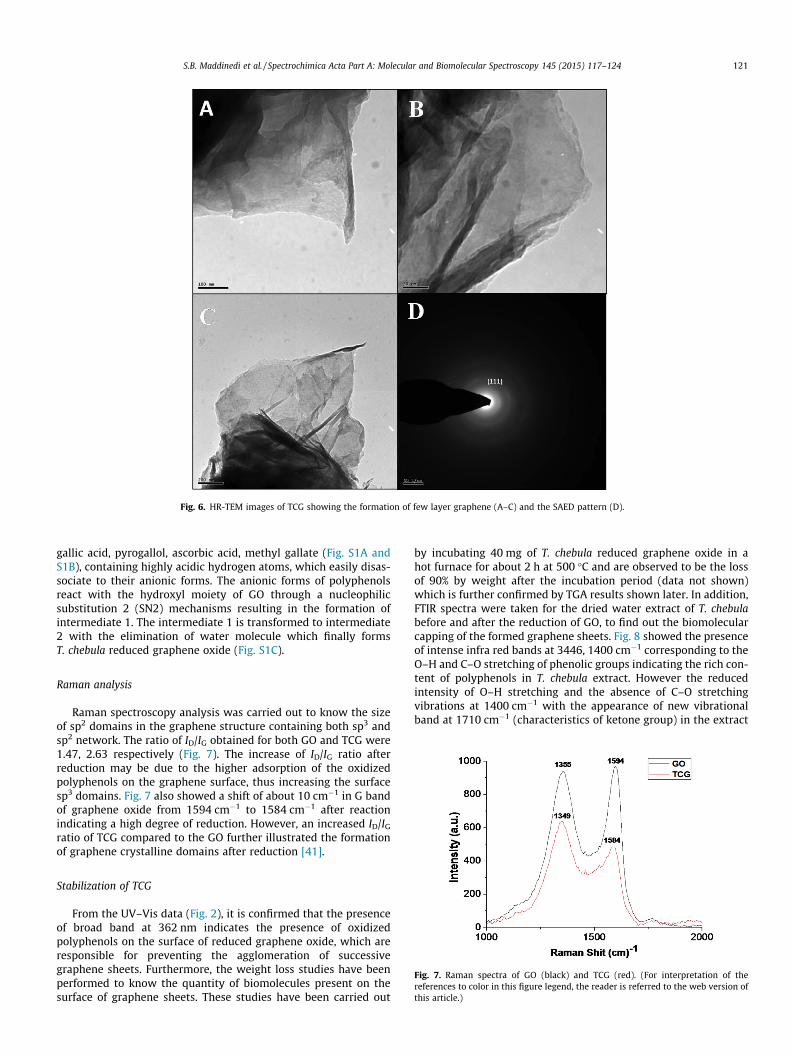
Fig. 6. HR-TEM images of TCG showing the formation of few layer graphene (A–C) and the SAED pattern (D).
S.B. Maddinedi et al. / Spectrochimica Acta Part A: Molecular and Biomolecular Spectroscopy 145 (2015) 117–124 121
gallic acid, pyrogallol, ascorbic acid, methyl gallate (Fig. S1A andS1B), containing highly acidic hydrogen atoms, which easily disas-sociate to their anionic forms. The anionic forms of polyphenolsreact with the hydroxyl moiety of GO through a nucleophilicsubstitution 2 (SN2) mechanisms resulting in the formation ofintermediate 1. The intermediate 1 is transformed to intermediate2 with the elimination of water molecule which finally formsT. chebula reduced graphene oxide (Fig. S1C).
Raman analysis
Raman spectroscopy analysis was carried out to know the sizeof sp2 domains in the graphene structure containing both sp3 andsp2 network. The ratio of ID/IG obtained for both GO and TCG were1.47, 2.63 respectively (Fig. 7). The increase of ID/IG ratio afterreduction may be due to the higher adsorption of the oxidizedpolyphenols on the graphene surface, thus increasing the surfacesp3 domains. Fig. 7 also showed a shift of about 10 cm�1 in G bandof graphene oxide from 1594 cm�1 to 1584 cm�1 after reactionindicating a high degree of reduction. However, an increased ID/IG
ratio of TCG compared to the GO further illustrated the formationof graphene crystalline domains after reduction [41].
Fig. 7. Raman spectra of GO (black) and TCG (red). (For interpretation of thereferences to color in this figure legend, the reader is referred to the web version ofthis article.)
Stabilization of TCG
From the UV–Vis data (Fig. 2), it is confirmed that the presenceof broad band at 362 nm indicates the presence of oxidizedpolyphenols on the surface of reduced graphene oxide, which areresponsible for preventing the agglomeration of successivegraphene sheets. Furthermore, the weight loss studies have beenperformed to know the quantity of biomolecules present on thesurface of graphene sheets. These studies have been carried out
by incubating 40 mg of T. chebula reduced graphene oxide in ahot furnace for about 2 h at 500 �C and are observed to be the lossof 90% by weight after the incubation period (data not shown)which is further confirmed by TGA results shown later. In addition,FTIR spectra were taken for the dried water extract of T. chebulabefore and after the reduction of GO, to find out the biomolecularcapping of the formed graphene sheets. Fig. 8 showed the presenceof intense infra red bands at 3446, 1400 cm�1 corresponding to theO–H and C–O stretching of phenolic groups indicating the rich con-tent of polyphenols in T. chebula extract. However the reducedintensity of O–H stretching and the absence of C–O stretchingvibrations at 1400 cm�1 with the appearance of new vibrationalband at 1710 cm�1 (characteristics of ketone group) in the extract

500100015002000300040001/cm
%T
3446
.79 14
00.3
2
3446
.79
1710
.86
TCE AR
TCE AR
TCE BR
Fig. 8. FTIR spectra of T. chebula leaf extract before reduction (green) and after reduction (red). (For interpretation of the references to color in this figure legend, the reader isreferred to the web version of this article.)
Fig. 9. (A) Dynamic light scattering spectrum of TCG aqueous dispersion, (B) TGA thermogram of TCG, (C) optical diffuse reflectance spectra of T. chebula reduced grapheneoxide.
122 S.B. Maddinedi et al. / Spectrochimica Acta Part A: Molecular and Biomolecular Spectroscopy 145 (2015) 117–124

S.B. Maddinedi et al. / Spectrochimica Acta Part A: Molecular and Biomolecular Spectroscopy 145 (2015) 117–124 123
after the reduction further confirmed the conversion of polyphe-nols into their quinone forms during the deoxygenation of GO.From these studies, it is assumed that the oxidized polyphenolsinteract with TCG sheets by p–p stacking interactions that gener-ate electrostatic repulsions between the graphene layers resultingin the stabilization of individual graphene sheets. The p–p interac-tions between graphene sheets and the oxidized polyphenols havebeen represented in Fig. S2A.
XPS study
Further, high-resolution XPS C1s spectrum of prepared TCG(Fig. S2B and C) showed the presence of typical C1s peaks at284.2, 286.2, 288, 289 eV corresponding to C@C, C–O–H, C@O,O–C@O respectively. However, the higher intense peak at286.2 eV and the other peaks corresponding to the remainingoxygen functionalities are due to the biomolecular capping onthe surface of TCG, which is also further supported by the presenceof high intense C–O–H peak (533.1 eV) and other peak for C@O(532 eV) in the O1s spectrum [40].
DLS analysis
We also employed DLS analysis to know the size distribution ofTCG particles in aqueous dispersion by using the standard spheri-cal model (Fig. 9A). After the prolonged sonication, the graphenesheets are broken into particles and the average particle size ofthe graphene particles present in the TCG dispersion measuredby using DLS is 1014 nm.
TGA
Further to confirm the presence of oxygen containing groups,thermal stability of TCG was examined by TGA (Fig. 9B).Thermogram of as synthesized TCG exhibits a weight loss of14.5% below 200 �C due to the loss of absorbed water, oxygen func-tionalities and the other biomolecules present on the surface ofgraphene sheets. Subsequently, it also exhibited a large weight lossof 86% at 500 �C, because of the pyrolysis of the remaining oxygencontaining groups and also due to the burning of the ring carbon.This higher weight loss at 200 �C when compared to the graphenesynthesized by using other green methods is clearly indicating thehigh accumulation of biomolecules on the surface of graphenesheets after reduction [41,42].
Band gap studies
The optical band gap of RGO was calculated from UV–Visiblespectra by the following equation as a = c (hm � Ebulk)1/2/hm, wherehm is the photon energy, a is absorption coefficient, c is a constant,and Ebulk is bulk ‘band gap’. Fig. 9C shows the plot drawn betweenhm versus (ahm)2 for the formed graphene, by using UV–Visiblespectroscopy at the wavelength range from 200 nm to 2400 nm.The band gap was obtained by the extrapolation of a linearregression to the X-axis in the plot and the gap was found to be3.74 eV. The value of band gap is observed to be in almost similaragreement with previous reports obtained by using aqueous leafextracts of Colocasia esculenta and Mesuaferrea Linn and anaqueous peel extract of Citrus sinensis [39].
Conclusions
In summary, we demonstrate a green, low-cost ecofriendly syn-thetic route for the synthesis of graphene by using polyphenolsfrom T. chebula seed extracts. HPLC analysis identified the
polyphenols present in T. chebula extract. It is also found thatpolyphenols in T. chebula are not only responsible for the deoxy-genation, but also for stabilization of formed graphene nanosheetsby preventing their aggregation. This paper further opens up anenvironmental friendly method to synthesize a biocompatible gra-phene in large scale by using naturally occurring polyphenols richplant extracts.
Acknowledgments
Mr. S.B.M. greatly acknowledges the help of VIT University,Vellore-632014, India for the financial help and platform given todo this research. Also, he acknowledges the help from Departmentof Chemistry, National Tsing Hua University, Hsinchu-30013,Taiwan ROC and NIIST, CSIR, Thiruvananthapuram-695 019, India.
Appendix A. Supplementary data
Supplementary data associated with this article can be found, inthe online version, at http://dx.doi.org/10.1016/j.saa.2015.02.037.
References
[1] A.K. Geim, K.S. Novoselov, Nat. Mater. 6 (2007) 183–191.[2] Y. Xuan, Y.Q. Wu, T. Shen, M. Qi, M.A. Capano, J.A. Cooper, P.D. Ye, Appl. Phys.
Lett. 92 (2008) 013101–013103.[3] X. Yang, Y. Tu, L. Li, S. Shang, X.M. Tao, ACS Appl. Mater. Interfaces 2 (2010)
1707–1713.[4] H. Fan, L. Wang, K. Zhao, N. Li, Z. Shi, Z. Ge, Z. Jin, Biomacromolecules 11 (2010)
2345–2351.[5] H. Bai, C. Li, X. Wang, G. Shi, Chem. Commun. 46 (2010) 2376–2378.[6] S. Sun, P. Wu, J. Mater. Chem. 21 (2011) 4095–4097.[7] M. Fang, J. Long, W. Zhao, L. Wang, G. Chen, Langmuir 26 (2010) 16771–16774.[8] C. Liu, S. Alwarappan, Z. Chen, X. Kong, C. Li, Biosens. Bioelectron. 25 (2010)
1829–1833.[9] M. Stoller, S. Park, Y. Zhu, J. An, R.S. Ruoff, Nano Lett. 8 (2008) 3498–3502.
[10] C. Lu, H. Yang, C. Zhu, X. Chen, G. Chen, Angew. Chem. Int. Ed. 121 (2009)4879–4881.
[11] L. Qu, Y. Liu, J. Baek, L. Dai, ACS Nano 4 (2010) 1321–1326.[12] K.S. Novoselov, A.K. Geim, S.V. Morozov, D. Jiang, Y. Zhang, S.V. Dubonos, I.V.
Grigorieva, A. Firsov, Science 306 (2004) 666–669.[13] M. Eizenberg, J.M. Blakely, Surf. Sci. 82 (1970) 228–236.[14] C. Berger, Z. Song, X. Li, X. Wu, N. Brown, C. Naud, D. Mayou, T. Li, J. Hass, A.N.
Marchenkov, E.H. Conrad, P.N. First, W.A. Heer, Science 312 (2006) 1191–1196.[15] S. Stankovich, D.A. Dikin, D.R.D. Piner, K.A. Kohlhaas, A. Kleinhammes, Y. Jia, Y.
Wu, S.T. Nguyen, R.S. Ruoff, Carbon 45 (2007) 1558–1565.[16] A. Bagri, C. Mattevi, M. Acik, Y.J. Chabal, M. Chhowalla, V.B. Shenoy, Nat. Chem.
2 (2010) 581–587.[17] S. Park, R.S. Ruoff, Nanotechnology 4 (2009) 217–224.[18] S. Park, J. An, J.R. Potts, A. Velamakanni, S. Murali, R.S. Ruoff, Carbon 45 (2007)
1558–1565.[19] J.R. Lomeda, C.D. Doyle, D.V. Kosynkin, W.F. Hwang, J.M. Tour, J. Am. Chem. Soc.
130 (2008) 16201–16206.[20] V.C. Tung, M.J. Allen, Y. Yang, R.B. Kaner, Nat. Nanotechnol. 4 (2008) 25–29.[21] Y. Si, E.T. Samulski, Nano Lett. 8 (2008) 1679–1682.[22] R. Muszynski, B. Seger, P.V. Kamat, J. Phys. Chem. C 112 (2008) 5263–5266.[23] G. Wang, J. Yang, J. Park, X. Gou, B. Wang, H. Liu, J. Yao, J. Phys. Chem. C 112
(2008) 8192–8195.[24] S. Stankovich, D.A. Dikin, G.H.B. Dommett, K.M. Kohlhaas, E.J. Zimney, E.A.
Stach, R.D. Piner, S.T. Nguyen, R.S. Ruoff, Nature 442 (2006) 282–286.[25] S.B. Maddinedi, B.K. Mandal, Int. J. Nano Sci. Technol. 3 (2014) 46–61.[26] J. Gao, F. Liu, Y. Liu, N. Ma, Z. Wang, X. Zhang, Chem. Mater. 22 (2010) 2213–
2218.[27] C. Zhu, S. Guo, Y. Fang, S. Dong, ACS Nano 4 (2010) 2429–2437.[28] J. Liu, S. Fu, B. Yuan, Y. Li, Z. Deng, J. Am. Chem. Soc. 132 (2010) 7279–7281.[29] S.B. Maddinedi, B.K. Mandal, R. Vankayala, P. Kalluru, S.K. Tammina, H.A.K.
Kumar, Spectrochim. Acta Part A Mol. Biomol. Spectrosc. 126 (2014) 227–231.[30] M.K. Kumar, B.K. Mandal, M. Sinha, T. Krishnakumar, Spectrochim. Acta Part A
Mol. Biomol. Spectrosc. 86 (2012) 490–494.[31] M.K. Kumar, M. Sinha, B.K. Mandal, A.R. Ghosh, K.S. Kumar, P.S. Reddy,
Spectrochim. Acta Part A Mol. Biomol. Spectrosc. 91 (2012) 228–233.[32] S.D. Perera, R.G. Mariano, N. Nijem, Y. Chabal, J.P. Ferraris, K.J. Balkus, J. Power
Sources 215 (2012) 1–10.[33] M.J.F. Merino, L. Guardia, J. Paredes, S.V. Rodil, P.S. Fernández, A.M. Alonso,
J.M.D. Tascón, J. Phys. Chem. C 114 (2010) 6426–6432.[34] D. Li, M.B. Muller, S. Gilje, R.B. Kaner, G.G. Wallace, Nat. Nanotechnol. 3 (2008)
101–105.[35] V.H. Pham, T.V. Cuong, T.D.N. Phan, H.D. Pham, E.J. Kim, S.H. Hur, E.W. Shin, S.
Kim, J.S. Chung, Chem. Commun. 46 (2010) 4375–4377.

124 S.B. Maddinedi et al. / Spectrochimica Acta Part A: Molecular and Biomolecular Spectroscopy 145 (2015) 117–124
[36] S. Gorinstein, M. Weisz, M. Zemser, K. Tilis, A. Stiller, I. Flam, Y. Gat,Bioengineering 75 (1993) 115–120.
[37] J. Sun, F. Liang, Y. Bin, P. Li, C. Duan, Molecules 12 (2007) 679–693.[38] D. Mhamane, C. Rode, W. Ramadan, B. Lefez, M. Fawzy, B. Hannoyer, A. Rana, S.
Ogale, M. Dubey, Green Chem. 13 (2011) 1990–1996.
[39] S. Thakur, N. Karak, Carbon 50 (2012) 5331–5339.[40] H. Mao, J. Ma, Y. Liao, S. Zhao, X. Liao, Catal. Sci. Technol. 3 (2013) 1612–1617.[41] T. Kuila, S. Bose, P. Khanra, A.K. Mishra, N.H. Kim, J.H. Lee, Carbon 50 (2012)
914–921.[42] L. Li, G. Xiao, C. Chen, R. Li, D. Yan, J. Mater. Chem. A. 1 (2013) 1481–1487.