
The 26 May 2006 magnitude 6.4 Yogyakarta earthquake south of Mt. Merapi volcano: Did lahar deposits...
9
The 26 May 2006 magnitude 6.4 Yogyakarta earthquake south of Mt. Merapi volcano: Did lahar deposits amplify ground shaking and thus lead to the disaster? T. R. Walter, R. Wang, and B.-G. Luehr GeoForschungsZentrum Potsdam, Telegrafenberg, D-14473 Potsdam, Germany ([email protected]) J. Wassermann and Y. Behr Sektion Geophysik, LMU Mu ¨nchen, Theresienstrasse 41/IV, D-80333 Munich, Germany S. Parolai GeoForschungsZentrum Potsdam, Telegrafenberg, D-14473 Potsdam, Germany A. Anggraini GeoForschungsZentrum Potsdam, Telegrafenberg, D-14473 Potsdam, Germany Physics Department, Gadjah-Mada University, Yogyakarta, Indonesia E. Gu ¨ nther, M. Sobiesiak, H. Grosser, H.-U. Wetzel, and C. Milkereit GeoForschungsZentrum Potsdam, Telegrafenberg, D-14473 Potsdam, Germany P. J. K. Sri Brotopuspito Physics Department, Gadjah-Mada University, Yogyakarta, Indonesia P. Harjadi Meteorological and Geophysical Agency (BMG), Jl. Angkasa I No. 2, Kemayoran, Jakarta 10720, Indonesia J. Zschau GeoForschungsZentrum Potsdam, Telegrafenberg, D-14473 Potsdam, Germany [1] Indonesia is repeatedly unsettled by severe volcano- and earthquake-related disasters, which are geologically coupled to the 5 – 7 cm/a tectonic convergence of the Australian plate beneath the Sunda Plate. On Saturday, 26 May 2006, the southern coast of central Java was struck by an earthquake at 2254 UTC in the Sultanate Yogyakarta. Although the magnitude reached only M w = 6.4, it left more than 6,000 fatalities and up to 1,000,000 homeless. The main disaster area was south of Mt. Merapi Volcano, located within a narrow topographic and structural depression along the Opak River. The earthquake disaster area within the depression is underlain by thick volcaniclastic deposits commonly derived in the form of lahars from Mt. Merapi Volcano, which had a major influence leading to the disaster. In order to more precisely understand this earthquake and its consequences, a 3-month aftershock measurement campaign was performed from May to August 2006. We here present the first location results, which suggest that the Yogyakarta earthquake occurred at 10–20 km distance east of the disaster area, outside of the topographic depression. Using simple model calculations taking material heterogeneity into account we illustrate how soft volcaniclastic deposits may locally amplify ground shaking at distance. As the high degree of observed G 3 G 3 Geochemistry Geophysics Geosystems Published by AGU and the Geochemical Society AN ELECTRONIC JOURNAL OF THE EARTH SCIENCES Geochemistry Geophysics Geosystems Research Letter Volume 9, Number 5 15 May 2008 Q05006, doi:10.1029/2007GC001810 ISSN: 1525-2027 Click Here for Full Articl e Copyright 2008 by the American Geophysical Union 1 of 9
Transcript of The 26 May 2006 magnitude 6.4 Yogyakarta earthquake south of Mt. Merapi volcano: Did lahar deposits...
The 26 May 2006 magnitude 6.4 Yogyakarta earthquakesouth of Mt. Merapi volcano: Did lahar deposits amplifyground shaking and thus lead to the disaster?
T. R. Walter, R. Wang, and B.-G. LuehrGeoForschungsZentrum Potsdam, Telegrafenberg, D-14473 Potsdam, Germany ([email protected])
J. Wassermann and Y. BehrSektion Geophysik, LMU Munchen, Theresienstrasse 41/IV, D-80333 Munich, Germany
S. ParolaiGeoForschungsZentrum Potsdam, Telegrafenberg, D-14473 Potsdam, Germany
A. AnggrainiGeoForschungsZentrum Potsdam, Telegrafenberg, D-14473 Potsdam, Germany
Physics Department, Gadjah-Mada University, Yogyakarta, Indonesia
E. Gunther, M. Sobiesiak, H. Grosser, H.-U. Wetzel, and C. MilkereitGeoForschungsZentrum Potsdam, Telegrafenberg, D-14473 Potsdam, Germany
P. J. K. Sri BrotopuspitoPhysics Department, Gadjah-Mada University, Yogyakarta, Indonesia
P. HarjadiMeteorological and Geophysical Agency (BMG), Jl. Angkasa I No. 2, Kemayoran, Jakarta 10720, Indonesia
J. ZschauGeoForschungsZentrum Potsdam, Telegrafenberg, D-14473 Potsdam, Germany
[1] Indonesia is repeatedly unsettled by severe volcano- and earthquake-related disasters, which aregeologically coupled to the 5–7 cm/a tectonic convergence of the Australian plate beneath the Sunda Plate.On Saturday, 26 May 2006, the southern coast of central Java was struck by an earthquake at 2254 UTC inthe Sultanate Yogyakarta. Although the magnitude reached only Mw = 6.4, it left more than 6,000 fatalitiesand up to 1,000,000 homeless. The main disaster area was south of Mt. Merapi Volcano, located within anarrow topographic and structural depression along the Opak River. The earthquake disaster area withinthe depression is underlain by thick volcaniclastic deposits commonly derived in the form of lahars fromMt. Merapi Volcano, which had a major influence leading to the disaster. In order to more preciselyunderstand this earthquake and its consequences, a 3-month aftershock measurement campaign wasperformed from May to August 2006. We here present the first location results, which suggest that theYogyakarta earthquake occurred at 10–20 km distance east of the disaster area, outside of the topographicdepression. Using simple model calculations taking material heterogeneity into account we illustrate howsoft volcaniclastic deposits may locally amplify ground shaking at distance. As the high degree of observed
G3G3GeochemistryGeophysics
Geosystems
Published by AGU and the Geochemical Society
AN ELECTRONIC JOURNAL OF THE EARTH SCIENCES
GeochemistryGeophysics
Geosystems
Research Letter
Volume 9, Number 5
15 May 2008
Q05006, doi:10.1029/2007GC001810
ISSN: 1525-2027
ClickHere
for
FullArticle
Copyright 2008 by the American Geophysical Union 1 of 9

damage may have been augmented by the seismic response of the volcaniclastic Mt. Merapi deposits, thiswork implies that the volcano had an indirect effect on the level of earthquake destruction.
Components: 4683 words, 7 figures, 1 table.
Keywords: Yogyakarta earthquake; lahar; site effects; soil amplification; Mt. Merapi Volcano.
Index Terms: 5480 Planetary Sciences: Solid Surface Planets: Volcanism (6063, 8148, 8450); 8488 Volcanology: Volcanic
hazards and risks; 8486 Volcanology: Field relationships (1090, 3690).
Received 31 August 2007; Revised 22 February 2008; Accepted 8 March 2008; Published 15 May 2008.
Walter, T. R., et al. (2008), The 26 May 2006 magnitude 6.4 Yogyakarta earthquake south of Mt. Merapi volcano: Did lahar
deposits amplify ground shaking and thus lead to the disaster?, Geochem. Geophys. Geosyst., 9, Q05006, doi:10.1029/
2007GC001810.
1. Introduction
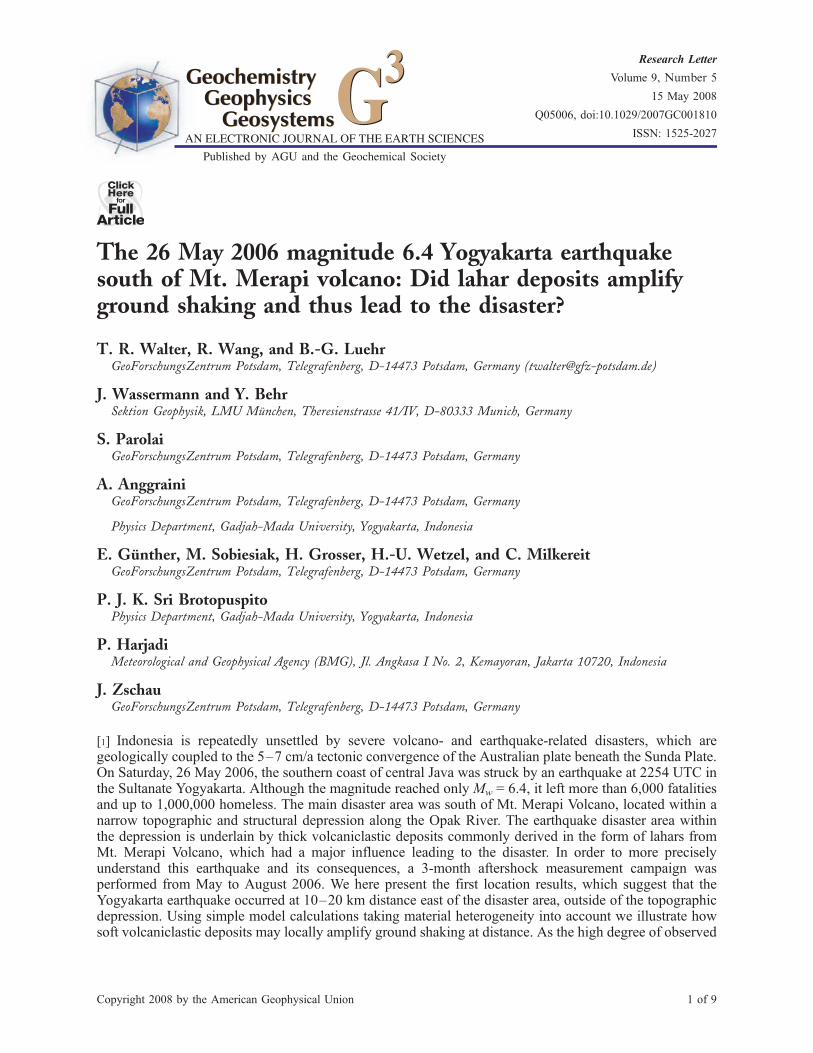
[2] Mount Merapi Volcano, located in central Java(Indonesia, Figure 1), initiated a new eruptive phaseafter 4.5 years of quiescence, as detected by increas-ing volcanic seismicity in March 2006 [Siebert andSimkin, 2002]. The first pyroclastic avalanche wasreported on 11 May 2006, prompting officials toevacuate 22,000 people from the volcanic slopesand northern part of Yogyakarta. Instead of theawaited volcano eruption, however, a devastatingearthquake occurred to the south of the volcano. Theevent was near the city Yogyakarta, on Saturday,26 May 2006, at 2254 UTC (Sunday, 27 May 2006,at 5:54 A.M. local time). While recent studies havesuggested that the earthquake triggered increasedactivity at Mt. Merapi [Harris and Ripepe, 2007;Walter et al., 2007a], it appears that the volcanoeruption had only minor contribution to the earth-quake [Walter et al., 2007a]. This paper investigatesan indirect effect of the volcano. As shown herein,the May 2006 earthquake caused damage toinhabited areas underlain by remobilized volcani-clastic deposits (lahar deposits; see Figure 2) [Walteret al., 2007b]. We analyze the May 2006 earthquakedamage area and the first data of aftershock meas-urements, suggesting that the volcaniclastic sedi-ments underneath the earthquake disaster areaplayed a significant role by amplifying the seismicwaves. We show that aftershocks were located at10–20 km distance eastward of the damage area,and we perform a simulation to study how theground shaking was amplified by the soft sediments.
2. The 26 May 2006 Earthquake
[3] Teleseismic data suggested that the 26 May2006 earthquake main shock hypocenter was rela-
tively shallow at 20–30 km distance to the citycenter of Yogyakarta (Table 1). In this area, thepresence of a major southwest-northeast trendingfault is thought to limit the area of tectonic subsi-dence of the Yogyakarta graben [Rahardjo et al.,1977]. As a result, the most likely origin of thisearthquake was interpreted to be this dip-slip fault.The fault is striking parallel to the Opak River,hereafter referred to as the Opak River Fault(Figure 3). Along a 30 km stretch of the OpakRiver Fault, the 26 May earthquake caused severedamage to the densely populated area, leavingabout 6,000 dead, 50,000 injured and between0.5 and 1 million homeless [Consultative Groupon Indonesia (CGI), 2006]. The destructive con-sequences of the earthquake were unprecedented inthis region, with hundreds of thousands housesdestroyed or damaged, including destruction ofthe historical Hindu temples of Prambanan (9thcentury A.D.) and the Sultans tomb (17th centuryA.D.) at Imogiri. The total loss is estimated at over3 billion U.S. dollars [CGI, 2006]. There are nowritten records of similar devastating earthquakesin this region.
[4] The Harvard Centroid-Moment-Tensor (CMT)solution suggests a moment magnitude of Mw = 6.4(see Table 1), and significant strike-slip rupture tothe east of the disaster area (Harvard-CMT, id#200605262253A,date26May200622:54:5.3GMT,Lat = �8.03, Lon = 110.54, Depth = 21.7, Mrr =�1.220, Mss = �3.360, Mee = 4.570, Mrs = 0.600,Mre = 0.623, Mse = 1.130, Mw = 6.4, NP1:strike = 323, dip = 77, slip = �176, NP2: strike =232 dip = 86, slip =�13; http://www.globalcmt.org/CMTsearch.html). The information given bythe U.S. National Earthquake Information CenterFast-Moment-Tensor (FMT) is Mw = 6.5, and
GeochemistryGeophysicsGeosystems G3G3
walter et al.: 2006 yogyakarta earthquake 10.1029/2007GC001810
2 of 9
shows the earthquake to be on the southern sectionof the Opak River Fault (NEIC, id# 0605262254,date 26 May 2006 22:54:1.18, Lat = �8.007, Lon =110.286, Depth = 28, Mrr = 1.12, Mtt = �7.72,Mff = 6.63, Mrt = �0.13, Mrf = �0.41, Mtf = 1.47,MW 6.5, NP1: strike = 141, dip = 87, slip = 177,NP2: strike = 231, dip = 87, slip = 3, http://earthquake.usgs.gov/eqcenter/eqinthenews/2006/usneb6/, http://neic.usgs.gov/neis/eq_depot/2006/,2007). Therefore, the NEIC FMT location appar-
ently confirms the suspected Opak River Fault asthe most likely earthquake source.
3. Temporary Network of the GermanTask Force for Earthquakes
[5] In order to record the aftershock activity, a rapidresponse team of the German Task Force for Earth-quakes (GTF), together with the SeismologicalDivision of Badan Meterologi & Geofisika (BMG)
Figure 1. (a) Location map. (b) Merapi Volcano (red triangle) and the earthquake area on Java Island, Indonesia,with historical earthquake data shown by small black circles. (c) Shaded relief map of the Yogyakarta area, city centershown by white square symbol. The 26 May 2006 teleseismic locations and focal mechanisms are provided byNational Earthquake Information Center (NEIC) and Harvard Centroid-Moment-Tensor (CMT). Circle indicateslocation of Figure 2 photographs; inserted box indicates map view dimensions in Figure 3.
GeochemistryGeophysicsGeosystems G3G3 10.1029/2007GC001810walter et al.: 2006 yogyakarta earthquake 10.1029/2007GC001810
3 of 9

and the Gadjah Mada University (UGM) Yogya-karta set up the first seismometers on 31 May 2006.The network layout encompassed the earthquakedisaster area along the Opak River Fault surround-ing the area of expected aftershock activity (Figure3). At the time of deployment, the exact location ofthe earthquake epicenter was not known. Moreover,since no primary surface ruptures allowed us toestimate the active fault, stations were arranged inorder to cover a large area. On day 7 after theearthquake, the team had completed the set-up of atemporary network of 12 seismic stations (typeMark L4–3D 1 Hz and Earth Data Logger EDL).The average interstation distance was about 10 km,being smaller near the Opak River Fault (4 km)and larger at greater distances (16 km). The stationsthus spanned an area of about 1,200 km2 surround-ing the earthquake destruction area in the district of
Yogyakarta and recorded about 2,000 events withinthree months.
3.1. First Aftershock Location Results
[6] While the complete analysis of this unique dataset has just barely begun, the study of the first 10%of the events (using the Hypo71PC program [Leeand Lahr, 1972] and a 1-D velocity layered crustal
Figure 2. Example of a lahar deposition zone on thesouth flank of Merapi volcano, photographed at theBoyong River Bridge at three months time distance(courtesy of F. Lavigne). (a) Land-used flanks of thevalley in December 1994. (b) Volcaniclastic sedimentdeposition photographed in February 1995. Thisexample illustrates the fast sedimentation rates anddeposition of unconsolidated volcaniclastic material, thesites of which may be especially dangerous during anearthquake. For more details about this site see Lavigneet al. [2000].
Figure 3. Shaded relief map of the area of Yogyakartaarea, with Mt. Merapi Volcano in the north andYogyakarta City in the center (dashed area). The thickblack NE-SW trending line is the Opak River Fault,thought to be the source of the May 2006 earthquakedisaster. Note that this is also bounding the regioncovered by young volcanic deposits [Rahardjo et al.,1977] and the main distant deposition zone of lahars assuggested by UNOSAT [2006]. White triangles mark thetemporary network of the seismic stations that were setup to record aftershocks, together with three-letterstation codes for the stations further discussed in thispaper. Teleseismic locations indicated by stars.
Table 1. Double Couple Parameters for Nodal Plane 1and 2 of the NEIC and Harvard Main Shock Solutionsa
Name
Nodal Plane 1 Nodal Plane 2
Strike Dip Rake Strike Dip Rake Depth Mag
NEIC 141 87 177 231 87 3 28.0 6.5HRV 323 77 �176 232 86 �13 21.7 6.4
aHRV, Harvard; NEIC, National Earthquake Information Center.
Both mechanisms suggest strike slip faulting but also have a CLVDcomponent (not shown here). See for details Harvard-CMT (2007) andNEIC (2007).
GeochemistryGeophysicsGeosystems G3G3
walter et al.: 2006 yogyakarta earthquake 10.1029/2007GC001810
4 of 9
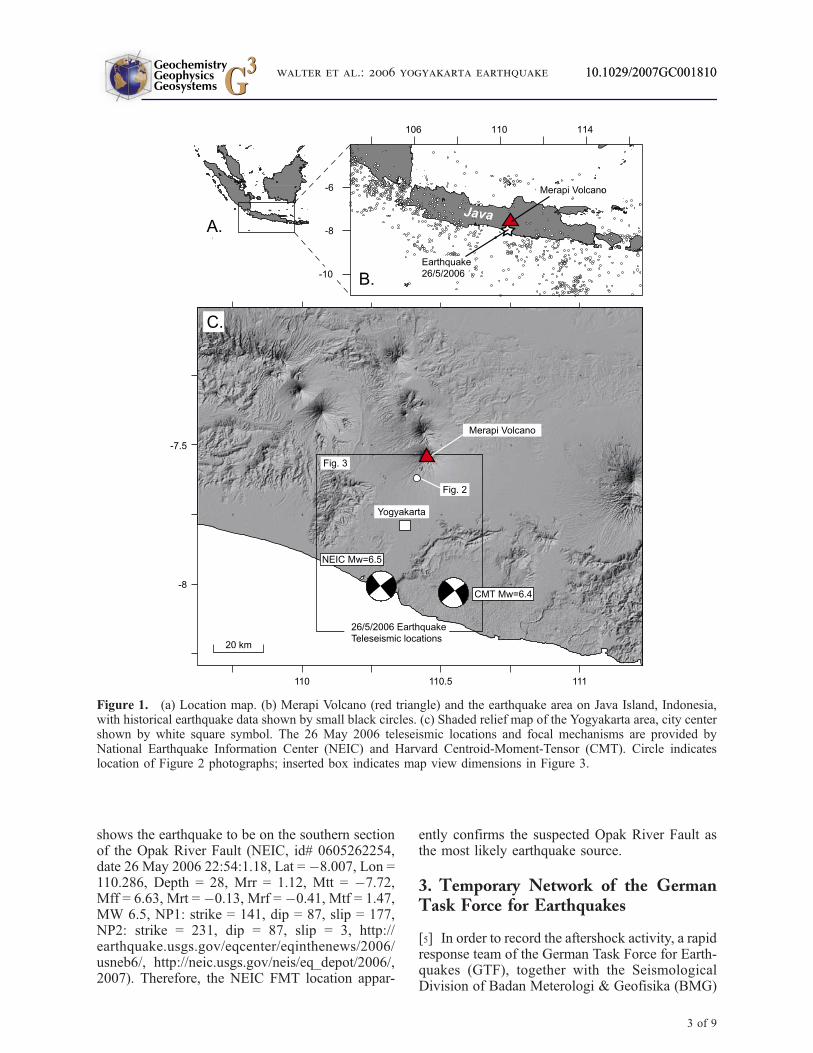
model derived for the area by the MERAMEXseismic tomography project in the area [Koulakovet al., 2007; Wagner et al., 2007]) already providesimportant new insights in location and geometry ofthe earthquake rupture plane. The results surpris-ingly show that the aftershock hypocenters are notaligned along the Opak River Fault as originallythought, but rather at a hitherto unidentified fault10–20 km further to the east, within the moun-tainous and less populated area of Gunung Kidul.Most of the aftershocks align in a northeast-south-west direction (N037�E), parallel to the Opak RiverFault. About 90% of the data is along-strike within19 km and across-strike within 4 km. Toward thenortheastern and southwestern ends of the mainaftershock cluster, the data appears to scatter spa-
tially. The depth of the bulk of the aftershocks is at8–15 km, the dip of the active fault appears to besubvertical, although further studies will be re-quired to obtain more accurate information.
3.2. Local Amplification
[7] The private sector house stock was most heavilyaffected by the earthquake. About 160,000 houseswere destroyed by the earthquake and another>250,000 damaged in the densely populatedYogyakarta area [CGI, 2006]. In comparison, theAceh 12/26/2004 earthquake destroyed about130,000 houses and damaged about 150,000.According to a report published by NationalDevelopment Planning Board, and the provincial
Figure 4. (left) Earthquake damage area and (right) aftershock locations. (left) Within the six most affected districtsmore than 35% of the total housing stock suffered damage [UN Cluster Atlas, 2007], being most severe along theOpak River Fault. The earthquake damage area is shown by the number of destroyed and heavily damaged houseswithin the affected villages [after International Federation of Red Cross, 2006; UN Cluster Atlas, 2007]. (right) Firstresults of GTF aftershock localizations (red dots) show an event cloud 10–20 km to the east of the damage area. Thecross section A-B shows the hypocenters of the aftershocks, the distance to the earthquake disaster area, and also thepresence of volcanic sediments along the Opak River basin. Geologic structures (faults and sediment location) afterRahardjo et al. [1977].
GeochemistryGeophysicsGeosystems G3G3
walter et al.: 2006 yogyakarta earthquake 10.1029/2007GC001810
5 of 9

and local governments of Yogyakarta and centralJava, more houses were affected in the Yogyakartaearthquake area than in Aceh and Nias after the 12/26/2004 and 03/28/2005 earthquakes combined[Consultative Group on Indonesia, 2006]. Boen[2006] observed that damaged or collapsed build-ings were non-engineered constructions, mainly 1–2 story houses. Most of the destroyed houses werenon-reinforced half or one brick thick masonrybuildings held together with lime mortar of poorquality. The number of engineered buildings thatcollapsed is relatively small, where buildings withreinforced concrete structures showed often a dam-aged first soft story [Boen, 2006]. However, it wasobserved that some areas were more damaged thanothers, suggesting that local geological conditionsmight have also played a role in damage distribu-tion. Areas of severe damage were found at Jetis,Imogiri, Sewon, Bantul, Prambanan in Sleman,Gantiwarno, and Wedi in Klaten.
[8] Assuming that the structure highlighted by theaftershock distribution indicates the location of the26 May main shock, the question arises if thesevere damage southeast of Yogyakarta city, pre-viously explained as due to the vicinity to the OpakRiver fault, could have been instead resulted fromsite amplification.
[9] The seismic waveforms recorded by the GTFmay provide further insights into this process. Therecording of 9 aftershocks at station IMO (withinthe more damaged area) and station PEL (lessdamaged area) have been analyzed; both stationlocations highlighted in Figures 3 and 4. An Swave signal window was selected starting beforethe S wave arrival and ending when 90% of energy
was reached. The Fourier spectra of the signal werecalculated and smoothed using the Konno andOhmachi window [Konno and Ohmachi, 1998].We obtain the horizontal-to-vertical spectral ratioH/V [Lermo and Chavez-Garcia, 1993] after cal-culation of the root mean square (RMS) average ofthe horizontal components. The H/V spectral ratioallows us to estimate possible frequency dependentsite amplification. A high degree of damage isexpected if the fundamental frequency of the soilapproaches the frequency of vibrating buildings.As shown in the average H/V spectral ratios ofFigure 5, station PEL experienced small amplifi-cation whereas at station IMO significant amplifi-cations are depicted in the frequency band ofinterest for 1–2 storey buildings (3–9 Hz), whichcan be estimated by the relation 1/f = (0.05 � h)3/4where h is the height (in m) of the building[Wiegel, 1970].
[10] The reason for this site amplification may beexplained as follows. Station IMO is located in anarea that is defined to lie within the 2nd danger zoneof Mt. Merapi volcano, meaning that it is notdirectly threatened by eruptions but may be invadedby lahars rich in clastic material in suspension[Lavigne et al., 2000; Rahardjo et al., 1977]. Thedeposited clastic material is generally soft, consist-ing breccias and pyroclastic deposits (tuffs, ash)reaching a thickness of 150–200 m [Rahardjo etal., 1977]. The weathered and remobilized productsof these deposits can be found in the plain to thesouth of Merapi. The H/V spectral ratio detected atstation IMO may thus be related to the localpresence of young volcanic deposits, that progres-sively infilled the tectonic graben bound by theOpak River Fault. Therefore, a role of site effects inincreasing damage has to be considered in under-standing the amount and distribution of damagesdue to the 26 May Yogyakarta earthquake.
3.3. Computer Simulation
[11] As shown above, the alignment of therecorded aftershocks correlates well with the rup-ture mechanism provided by the teleseismic mo-ment tensor solutions (Harvard-CMT and NEIC;see section 2). In this section, we perform computersimulations in order to elucidate the distance be-tween the damage area and the aftershock area. Weassume that the aftershocks represent the fault ofthe M6.4 main shock, and consider a rupture planewith the center of the slip distribution being set tothe center of the 20 � 10 km2 aftershock area withits upper edge at 6 km depth. As rupture mecha-
Figure 5. Frequency versus H/V amplitude comparedat two GTF stations. Station PEL is located southeast ofYogyakarta City on bedrock in an area less affected bythe earthquake, whereas station IMO is located inImogiri, a village hardest hit by the earthquake (see alsoFigure 3). The frequency band implies that localamplification could have played a role at IMO, whichis located near the Opak River, probably due tounderlying soft sediments.
GeochemistryGeophysicsGeosystems G3G3
walter et al.: 2006 yogyakarta earthquake 10.1029/2007GC001810
6 of 9
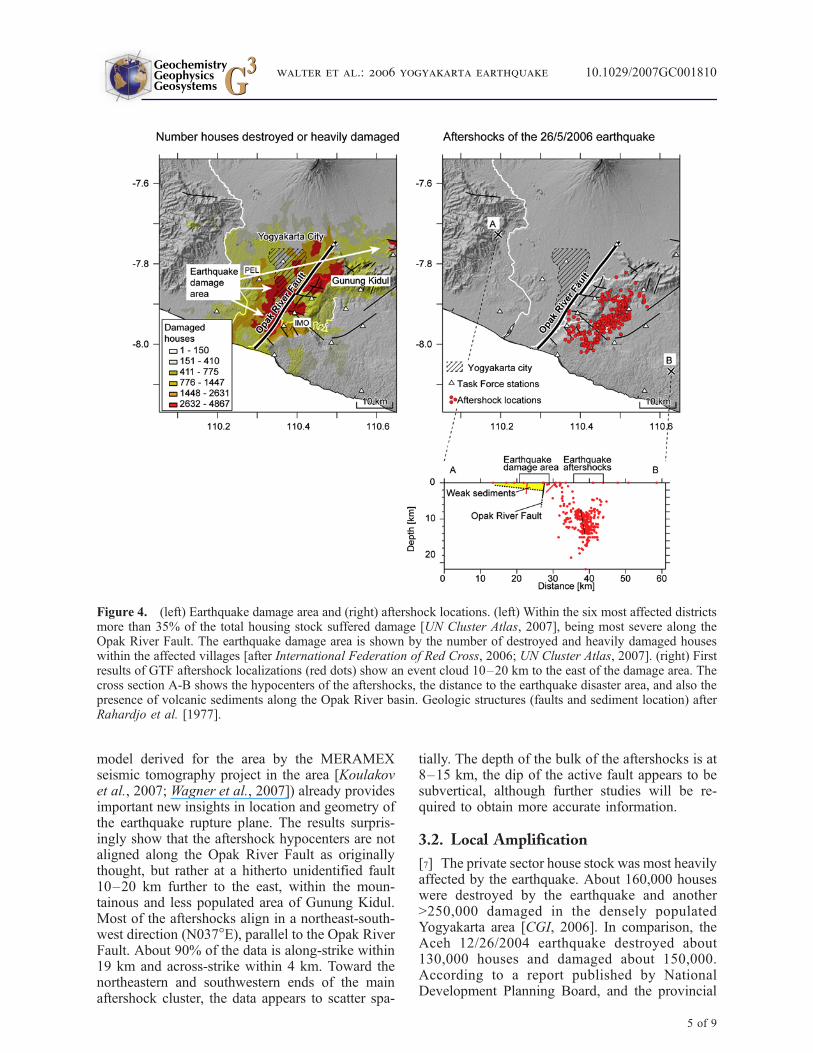
nism we use the double-couple focal solutiondetermined by Harvard (232�/86�/�13�). The rup-ture plane is divided into 2 � 2 km2 sourcepatches. A circular rupture front propagation isassumed, with a rupture velocity set to 2 km/s.We performed two types of models. In model 1, wedefine a laterally homogenous 1-D layered model.This model is hence considering stable bedrock,without any site effects. In model 2, we add asoft sedimentary cover along the Opak River.The 150 m thickness of the sedimentary coverwas extrapolated from the published geologicalmap [Rahardjo et al., 1977]. First, we calculatesynthetic seismograms for the bedrock model usingthe reflectivity method [see alsoMuller, 1985]. Thesite effect is then included by convolution betweenthe bedrock synthetics and the transfer functionof the local sediment cover. From the syntheticseismograms we derive the peak ground accelera-tion shown in Figure 6.
[12] We note that a stress drop on the active fault isnot analyzed and that these models do not take intoaccount topography or other complex lateral ge-ometry effects. In addition, the models assume thesedimentary cover along the Opak River, from thecoast until north of Gunung Kidul, that have athickness = 150 m, a shear velocity = 500 m/s anda quality factor Q = 20. Even though the models
are a simplification of a much more multifacetedgeology, the results exemplify how the earthquakemay have had a great destructive potential at 10–20 km distance to the rupture plane. In the area ofhighest damage, the peak ground acceleration isfound to be about 200–300% larger than expectedif underlain by stable bedrock. Our work illustratesan influence of the soft volcaniclastic sedimentarycover along the Opak River that significantlyincreased the destructive potential of the May2006 Yogyakarta earthquake.
4. Discussion
[13] The May 2006 earthquake was one of thedeadliest earthquakes in Java in historical times.Although the most recent magnitude estimationsare only between 6.4 and 6.5 (Harvard-CMT andNEIC; see section 2), the scale of destruction isunprecedented in this region.
[14] In order to precisely measure and analyze thesource, causes and effects of this earthquake, weinstalled a network of 12 temporary seismic sta-tions, which recorded aftershocks for a duration ofthree months. The results presented in this studyare revealing that the aftershocks are located in aregion where no active fault was previously iden-
Figure 6. Shake maps. Computer models of the peak ground acceleration (PGA) induced by the 26 May 2006 M6.4earthquake. Warmer colors indicate a larger PGA, calculated for (left) laterally homogeneous model (model-1) and(right) heterogeneous model with site effect (model-2) that considers soft sediments along the Opak River. Model thatconsiders 150 m thick soft sediments along the Opak River suggests the highest acceleration in the zone of softsediments, i.e., at 10–20 km distance from the aftershock region. The damage area well correlates with thedistribution of PGA amplification.
GeochemistryGeophysicsGeosystems G3G3
walter et al.: 2006 yogyakarta earthquake 10.1029/2007GC001810
7 of 9

tified. Assuming that the aftershocks delineate themain fault rupture plane, the distance to the damagearea is 10–20 km. While the NEIC FMT solutionsuggests the earthquake to be on the southernsection of the Opak River Fault, the HRV solutionsuggests a location more to the northeast. In com-bination, the solutions may indicate also a morecomplex (e.g., northeasterly) rupture propagation,which would be in line with the non-double couplecomponent indicated in updated earthquake mech-anism estimations (Table 1).
[15] On the basis of H/V spectral ratio at selectedstations, geological information of the substratumand our model simulations that consider a softvolcaniclastic layer, this study suggests that localamplification of the seismic waves had a signifi-cant influence leading to the disaster (Figure 7).The soft sediments are mainly redeposited andaltered volcaniclastics originating from the activeMt. Merapi volcano to the north, with thicknesses
that are thought to be greatest (�200 m) in thedamage area near the Opak River [Rahardjo et al.,1977]. Significant sediment deposition occurs be-cause of the three main factors [Lavigne andThouret, 2003]: (1) pyroclastic material withmillions of cubic meters in volume that accumulateduring volcanic active phases, (2) high rainfallintensity often exceeding 40 mm in 2 h duringthe rainy season, and (3) dense south-directeddrainage pattern. Lahars along the Boyong Rivermay deposit sediments exceeding annually200,000 m3/km2 at sedimentation rates of morethan 3 cm/min [Lavigne and Thouret, 2003]. Thesediments in the basin are accordingly derivedfrom pyroclastic flow and surge deposits, lavadome rockfalls and material along the rivers. Here,we used simplified parameters to consider thesediment mechanical properties as well as theirthickness distribution.
[16] In our model calculations, we have set thequality factor (Q) of the soft cover equal to 20. Thisis a valid estimate accounting for both intrinsicattenuation and the scattering effect. Different Qvalues may slightly influence the resonance effect,especially for large sediment thicknesses. Howev-er, for the herein studied scenario of thin sedimentcover, the site amplification is dominantly con-trolled by the seismic impedance contrast to thebedrock. Field observations also show that topo-graphic effects may have had an important role,where for instance buildings along the topographiccrest of the Gunung Kidul Mountains were heavilydestroyed, while the region located directly abovethe aftershocks has suffered comparable moderatedestruction [CGI, 2006; UN Cluster Atlas, 2007].Future studies thus need to consider the threedimensional topographic effects, in order to betterunderstand the geometric influence of basins andhills in the region, see also [Ripperger et al., 2003].Similarly, the three dimensional structure derivedfrom local tomography studies [Wagner et al.,2007] may improve localization, modeling andinterpretation of both damage distribution andearthquake aftershocks. Nevertheless, this workdemonstrates that the 1-D effects shown by theH/V spectral ratio already provide a first explana-tion of damage distribution in the Yogyakarta area.
[17] Although its relatively small energy release,the 26 May 2006 earthquake had therefore variousdistant effects: (1) the earthquake triggered in-creased volcanic activity at the 50 km distant Mt.Merapi Volcano, where the magma extrusion rateand the number of pyroclastic flows suddenly
Figure 7. Sketch illustrating how lahar deposits maylead to earthquake disaster. (a) North-south profile,Merapi volcano to the north (left), zone of lahardeposition in the lowland plain to the south (right).Lahar deposition zone is indicated by red color. (b) East-west profile showing Ija Mountains to the west (left) andGunung Kidul Mountains to the east (right). TheYogyakarta damage area (shown by house symbol),located in the lowland plain flanked by the twomountains, is underlain by unconsolidated volcaniclasticdeposits derived from Mt. Merapi Volcano. Aftershocksare shown below this profile by red dots. Profilelocations A and B are indicated in Figure 3.
GeochemistryGeophysicsGeosystems G3G3
walter et al.: 2006 yogyakarta earthquake 10.1029/2007GC001810
8 of 9
tripled [Walter et al., 2007a], and (2) the earth-quake caused destruction at 10–20 km distancealong the Opak River due to soil amplification (thiswork). Other even farther effects at volcanoes ineast Java are currently debated [Cyranoski, 2007;Harris and Ripepe, 2007; Manga, 2007]. Thus, theYogyakarta earthquake had destruction and trigger-ing effects both at many kilometers distance. Insummary, this work sheds some light onto thecomplex interdependency of the causes and effectsin a seismically and volcanically active environ-ment, and suggests the importance to link seismicand volcanic hazard evaluations.
5. Conclusions
[18] Although the destruction area and the knownfault traces suggested that the 26 May 2006 earth-quake occurred along the Opak River Fault, ourstudy points toward a hitherto unknown fault at about10–20 kmdistance to the east. Thiswork emphasizedthe effects of soft volcaniclastic lahar deposits alongthe Opak River and that the damage was mainlyconcentrated in an area where large amplification ofground motion might have occurred.
Acknowledgments
[19] Our special thanks go to our colleagues and collaborators
in Indonesia who made this fast response possible. Andrea
Heyn, Counsellor for Science, Technology and Environment at
the German Embassy in Jakarta was of great help for logistical
support. The proximal lahar deposition photographs were
kindly provided by Franck Lavigne. We appreciated very
detailed and constructive comments by G-Cubed editors and
reviewers. Continuous financial support for Task Force field
missions by Hannover Re is greatly acknowledged.
References
Boen, T. (2006), Yogya earthquake 27 May 2006:Structuraldamage report, member report, 22 pp., Earthquake Eng.Res. Inst., Oakland, Calif.
Consultative Group on Indonesia (2006), Preliminary damageand loss assessment, Yogyakarta and central Java naturaldisaster: A joint report of BAPPENAS, the provincial andlocal governments of D.I. Yogyakarta, the provincial andlocal governments of central Java, and international partners,in The 15th Meeting of the Consultative Group on Indonesia(CGI) Jakarta, June 14, 2006, 140 pp., Jakarta.
Cyranoski, D. (2007), Indonesian eruption: Muddy waters,Nature, 445, 812–815 PubMed, doi:10.1038/445812.
Harris, A. J. L., and M. Ripepe (2007), Regional earthquake asa trigger for enhanced volcanic activity: Evidence fromMODIS thermal data, Geophys. Res. Lett., 34, L02304,doi:10.1029/2006GL028251.
International Federation of Red Cross (2006), Damage map,International Federation of Red Cross and Red Crescent So-
cieties, Java Earthquake Response reference maps, 1 p., Uni-ted Nations in Indonesia, Jakarta, 23 June.
Konno, K., and T. Ohmachi (1998), Ground-motion character-istics estimated from spectral ratio between horizontal andvertical components of microtremor, Bull. Seismol. Soc. Am.,88(1), 228–241.
Koulakov, I., et al. (2007), P and S velocity structure of thecrust and the upper mantle beneath central Java from localtomography inversion, J. Geophys. Res., 112, B08310,doi:10.1029/2006JB004712.
Lavigne, F., and J. C. Thouret (2003), Sediment transportationand deposition by rain-triggered lahars at Merapi Volcano,central Java, Indonesia, Geomorphology, 49(1–2), 45–69,doi:10.1016/S0169-555X(02)00160-5.
Lavigne, F., J. C. Thouret, B.Voight, H. Suwa, andA. Sumaryono(2000), Lahars at Merapi volcano, central Java: An overview,J. Volcanol. Geotherm. Res., 100, 423–456, doi:10.1016/S0377-0273(00)00150-5.
Lee, W. H. K., and J. C. Lahr (1972), HYP071: A computerprogram for determining hypocenter, magnitude, and firstmotion pattern of local earthquakes, 100 pp., U.S. Geol.Surv. Open File Rep.
Lermo, J., and F. J. Chavez-Garcia (1993), Site effect evalua-tion using spectral ratios with only one station, Bull. Seismol.Soc. Am., 83, 1574–1594.
Manga, M. (2007), Did an earthquake trigger the May 2006eruption of the Lusi mud volcano?, Eos Trans. AGU, 88(18),201, doi:10.1029/2007EO180009.
Muller, G. (1985), The reflectivity method: A tutorial, J. Geo-phys., 58, 153–174.
Rahardjo, W. Sukandarrumidi, and H. Rosidi (1977), Geologicmap of the Yogyakarta quadrangle, Java, scale 1:100,000,8 pp., Geol. Surv. of Indonesia, Minist. of Mines, Jakarta.
Ripperger, J., H. Igela, and J. Wassermann (2003), Seismicwave simulation in the presence of real volcano topography,J. Volcanol. Geotherm. Res., 128(1–3), 31–44, doi:10.1016/S0377-0273(03)00245-2.
Siebert, L., and T. Simkin (2002), Volcanoes of the world: Anillustrated catalog of Holocene volcanoes and their erup-tions, Global Volcanism Program Digital Inf. Ser., GVP-3,Smithsonian Inst., Washington, D. C.
UN Cluster Atlas (2007), Java Earthquake Response — OneYear Review, United Nations Coordination Centre for Yogya-karta and Central Java and the Office of the Resident/Humanitarian Coordination in Indonesia. Compiled fromthe One Year Commemoration Conference, 25–27 May2007, Yogyakarta, 125 pp., Jakarta, Indonesia.
UNOSAT (2006), Mt Merapi—Areas at risk from future la-hars, Indonesia maps, VO-2006–000048-IDN (3), Prod. ID716, Geneva, 9 June.
Wagner, D., I. Koulakov, W. Rabbel, B-.G. Luehr, A. Wittwer,H. Kopp, M. Bohm, and G. Asch (2007), Joint inversionof active and passive seismic data in central Java, Geophys.J. Int., 170(2), 923 – 932, doi:10.1111/j.1365-246X.2007.03435.x.
Walter, T. R., R. Wang, M. Zimmer, H. Grosser, B. Luhr, andA. Ratdomopurbo (2007a), Volcanic activity influenced bytectonic earthquakes: Static and dynamic stress triggering atMt. Merapi, Geophys. Res. Lett., 34, L05304, doi:10.1029/2006GL028710.
Walter, T. R., et al. (2007b), Soft volcanic sediments com-pound 2006 Java earthquake disaster, Eos Trans. AGU,88(46), 486, doi:10.1029/2007EO460002.
Wiegel, R. L. (1970), Earthquake Engineering, 518 pp.,Prentice-Hall, Englewood Cliffs, N. J.
GeochemistryGeophysicsGeosystems G3G3
walter et al.: 2006 yogyakarta earthquake 10.1029/2007GC001810
9 of 9