Weld Formation Mechanism and Microstructural Evolution of ...
Upload
grenoble-inpCategory
view
1download
0
A microstructural cluster-based description of diffuse and localizedfailures
N. Hadda(1), F. Bourrier(2), L. Sibille(3), F. Nicot(2), R. Wan(1) & F. Darve(3)
(1)Department of Civil EngineeringUniversity of Calgary, Calgary, Canada.
(2)Geomechanics Group, ETNAIrstea, Grenoble, France.
(3)Laboratoire Sols Solides Structures RisquesUJF-INPG-CNRS, Grenoble, France.
ABSTRACT: This paper presents the analysis of microstructural mechanisms observed during both localizedand diffuse failures in granular media, highlighting similarities and differences in their characteristics. Two-dimensional DEM (Discrete Element Method) granular assemblies with medium dense and dense packingswere subjected to different biaxial loading paths to induce either a localized or diffuse failure mode. A clusterbased analysis is proposed to investigate interactions of particles at the mesoscale through the calculation of thesecond-order work from microscopic variables. It is shown that such analysis of clusters together with secondorder work facilitates precise shear band pattern recognition during localized failure. The evolution of suchclusters in terms of their spatial distribution, size and number of particles involved, as well as the role played bystrong and weak phases, describes the nature of the failure at every stage during loading. Such microstructuraldescriptors can predict the propensity of the specimen to fail either according to a diffuse or a localized mode.
1 INTRODUCTION
The identification of the underlying micromechanicsof failure processes in granular media remains elusivedespite numerous studies on the various factors lead-ing to failure. Failure has always been related to eitheran instability criterion such as the vanishing of thesecond order work (Hill 1958) or associated with con-tact networks (Radjai et al. 1999, Iwashita and Oda2000) namely strong and weak phases, connectivity,cycles and force chain networks (Tordesillas et al.2010), force chain buckling (Tordesillas 2007) andinter-particles relative motions (Kuhn & Bagi 2004).
Recently, it was shown (Nicot et al. 2012) thatthe genesis of failure in an assembly of particles isclosely related to the sign of the second order workat contacts and its spatial evolution during loadinghistory (Hadda et al. 2013). For instance, based ondirectional analyses (Gudehus 1979) performed on adense and loose DEM specimens, it was found thatthe macroscopic second order work is in good agree-ment with the second order work computed from mi-croscopic variables. Furthermore, the same study re-
vealed that local instabilities within a granular assem-bly described by negative or zero values of the sec-ond order work at the contact level are in line with thevanishing of the macroscopic second order work. Thisfinding was obtained from some statistical analysesfocusing on the population and the spatial distribu-tion of contacts exhibiting negative values of secondorder work, herein denoted c−, along all strain probedirections, including those which were proven to beunstable.
For instance, the spatial distribution of c− con-tacts is closely related to the emergence of the failuremode, i.e. diffuse and localized. As such, it seems thatthe understanding of failure process and the trigger-ing of modes is closely associated with how disperseor concentrated the spatial distribution of c− contactsis. The concentration of c− contacts conveys the no-tion of proximity between unstable particles and inthe limit refers to finding the most loaded particleswith the most c− contacts. Hence the notion of localinstability is most suitably pursued by calculating thesum of second order work at all c− contacts for a givenparticle.
Geomechanics from Micro to Macro – Soga et al. (Eds)© 2015 Taylor & Francis Group, London, ISBN 978-1-138-02707-7

In this paper, and in continuity with our previ-ous studies, the agreement between microscopic andmacroscopic second order works is briefly reviewedalong a drained biaxial compression. Then, attentionis focused on the extent to which c− contacts relate tothe observed failure mode, namely localized and dif-fuse. Finally, a cluster based approach is introducedin order to highlight the key role of c− contacts indescribing failure at the mesoscale through an aggre-gation phenomenon.
2 FAILURE MODE ALONG DIFFERENTLOADING PATHS
2.1 Numerical model
It is well recognized that the failure mode dependsessentially on the density of the granular packing andmay be influenced by the loading direction. Thus, inorder to achieve distinct failure modes through nu-merical simulations, two specimens S1 (dense) and S2
(medium dense) were considered and each was sub-jected to a different loading in order to undergo a lo-calized and a diffuse failure respectively.
Both specimens S1 and S2 originate from the sametwo-dimensional discrete element model (Cundall& Strack 1979) consisting of 21,000 particles andthey differ only in their initial density (packing).The inter-particle interaction is governed by a cohe-sionless contact law and involves three mechanicalparameters: the normal contact stiffness kn, thetangential contact stiffness kt and the friction coef-ficient µ incorporated at the contact level throughthe Coulomb friction law. The characteristics andmechanical parameters are given in Table 1.
The open source discrete element code Yade(Smilauer et al. 2010) was used to perform all the sim-ulations presented in this paper.
Table 1: Physical and mechanical parameters of bothspecimens S1 (dense) and S2 (medium dense).
S1 S2 UnitParticles diameter range 6-18 mmDensity (ρ) 3,000 Kg/m3
kn/D(*) 356 (MPa)
kt/kn 0.42 -µ 0.7 -κ = kn
p(**)(p = 300 kPa) 1,200 -
Height / Width 1.85 1.35 -Void ratio (e) 0.174 0.217 -Coordination number (z) 4.20 3.36 -
(*) D denotes the mean diameter between two particles in contact.(**) κ and p denote respectively the normalized contact stiffness
and the mean pressure.
The granular assemblies were both compacted froman initially sparse cloud of particles to an isotropicstate by moving the four rigid frictionless walls to-ward the center of the specimen until the isotropicpressure σ1 = σ2 = 300 kPa is reached. Both spec-imens S1 and S2 were then subjected to a drained
biaxial compression. This compression is carried outby imposing a constant strain rate (ε1 = 0.01 s−1) asthe walls move in the axial direction, and maintainingconstant the lateral pressure using a servo-control. Ina second simulation, the medium dense specimen S2
was loaded along a proportional strain path. This typeof loading constraints the lateral strain to evolve pro-portionally to the axial strain at each time step suchthat ε2 = −ε1/R (where R is a constant) as wallsmove in the axial direction at a constant strain rate(ε1 = 0.01 s−1). Note that for R < 1, the loading pathis dilatant, for R > 1, the loading path is contractantand the case of R = 1 coincides with the isochoricloading path. In this study, S2 was loaded along a di-latant proportional strain path with R = 0.8.
0 3 6 9 12 150
100
200
300
400
500
600
q [
kP
a]
(1)
(5)(4)
(3)
(2)
S2
S1
[3][4]
[2]
[1]
[5]
0 3 6 9 12 15−1
−0.5
0
0.5
1
1.5
ε1 [%]
εv [
%]
(5)(4)
(3)
(2)
(1)
S1
S2
[5]
[4]
[3][2]
[1]
Figure 1: Evolution of the deviatoric stress q and the volumetricstrain εv in terms of the axial strain ε1 along the drained biaxialloading performed on S1 and S2.
The evolutions of the deviatoric stress q = σ1 − σ2and the volumetric strain εv in terms of the axial strainε1 for S1 and S2 resulting from the classic drainedcompression are plotted in Figure 1. As described,the specimen S1 shows a typical behavior of a dila-tant dense granular medium with a distinctive q peak,while the specimen S2 exhibits a behavior akin to amedium dense granular medium with a volumetriccontractancy up to 5% of axial strain followed by di-latancy.
2.2 Localized failure
According to the incremental deviatoric strain ∆εdevfields displayed in Figure 2-a, the dense specimenhas clearly underwent a localized failure with a clearshear band after the limit stress state is reached. In-cremental volumetric strains, ∆εdev, were computedbetween each successive pair of stress states identi-fied in Figure 1. At the beginning (see snapshot 1), the

strain field is homogenous. The snapshot 2 shows notonly the fact that strain localizations are well devel-oped at the peak, but also these have already startedto define the shear band pattern observed after peakthrough several thin incipient shear bands. After thepeak (see snapshots 3-5), a unique shear band is ob-served while all others have disappeared. Contrary towhat has been observed for S1, it appears that thereis no persistent shear band appearing after failure forthe medium dense specimen S2 as shown in Figure2-b. However, the incremental deviatoric strain fieldscomputed before peak appear to be similar for bothS1 and S2 samples.
a) (1) (2) (3) (4) (5)
b)
Figure 2: Incremental deviatoric strain fields computed at thestress states 1 to 5 along the drained biaxial compression per-formed on S1 (a) and S2 (b).
2.3 Diffuse failure
Based on these results reported in the previous sec-tion, the medium dense specimen, compared to thedense one, is more susceptible to undergo a diffusefailure along a proportional strain path with a reason-able value of R. Figure 3 shows the evolution of thedeviatoric stress q in terms of the mean pressure p.The deviatoric stress q reaches a peak and then bothq and p start to decrease until they both vanish. Thepeak of q for such loading path is not of relevancywhen it comes to failure; rather one should considerthe peak of σ1 − σ2/R which represent the mixedlimit stress state at which the second order work cri-terion is verified (Nicot et al. 2013). Figure 3 showsthat σ1 − σ2/R also passes through a peak, whichis slightly exceeded afterward before both σ1 and σ2vanish.
The incremental deviatoric strain fields corre-sponding to the stress states chosen along the pro-portional strain path displayed in Figure 4 seem to bequite well homogenous until the vanishing of stresses.Very weak strain localizations can show up intermit-tently, but they soon fade away. In this case, and onthe contrary of what has been observed along thedrained compression, the failure is diffuse and devel-ops within the whole granular packing instead of be-ing localized within a shear band.
0 50 100 150 200 250 3000
10
20
30
40
50
60
q [
kP
a]
p [kPa]
(4)
(3)
(2)
(1)
0 0.5 1 1.5 2−80
−60
−40
−20
0
20
40
ε1 [%]
σ1 −
σ2/R
(4)(3)(2)
(1)
Figure 3: Evolution of the deviatoric stress q and σ1 − σ2/R interms of the mean pressure p and the axial strain ε1 respectivelyalong the proportional strain path loading performed on S2.
(1) (2) (3) (4)
Figure 4: Incremental deviatoric strain fields computed at thestress states 1 to 4 along the proportional strain path loading per-formed on S2.
3 SECOND ORDER WORK FROMMICROSCOPIC VARIABLES
For granular media, it has been shown (Nicot et al.2012) that the second order workW2 can be expressedin terms of microscopic variables as:
W2 =∑c
∆f c∆lc +∑p
∆fp∆x (1)
The first term of Eq. (1) is a summation overcontacts and involves the incremental variations ofthe contact force ∆f c and branch vector ∆lc. Thesecond term, a summation over particles, accountsfor the inertial effects that may occur during loading.It involves the incremental variation of the resultantforce ∆fp applied on the particle and the variationin position ∆x experienced by the particle duringloading.
In the absence of inertial effects (quasi-staticregime), which is the case in this study, the contri-bution of the second term is negligible and W2 is re-duced to:
Wm2 =
∑c
∆f c∆lc (2)

First of all, it is interesting to compare the secondorder work computed from microscopic variable Wm
2
with the second order work computed from tensorialvariable W2 = ∆σ : ∆ε (Nicot et al. 2007), whereσ and ε are the Cauchy stress tensor and strain ten-sor respectively, and to see to what extent they areequal along a drained biaxial compression. For thispurpose, both second order works were computed be-tween each two successive stress-states chosen at aregular interval along the loading path.
0 1 2 3 4−30
−20
−10
0
10
ε1 [%]
Sec
ond o
rder
work
[J/
m3]
W2
W2
m
Figure 5: Comparison between the second order works com-puted from both macroscopic and microscopic variables alongthe drained compression and the proportional strain loading pathperformed on S1 and S2 respectively.
Figure 5 shows that the two second order workexpressions, computed differently, agree with eachother especially before failure along the classic biax-ial compression performed on S1. The vanishing ofthe second order work corresponds to the peak of q(i.e. the limit stress state). After failure, a deviationbetween the two curves may be observed, especiallywhen the specimen undergoes a sharp softening (localavalanche). This phenomenon is usually accompaniedby the release of inertial effects, whose contributionmay become effective, and thus should be accountedfor while computing the second order work from mi-croscopic variables.
a) (1) (2) (3) (4) (5)
b)
Figure 6: Spatial distributions of c− contacts computed at thestress states 1 to 5 along the drained compression performed onS1 (a) and states 1 to 4 along the proportional strain loading pathperformed on S2 (b).
This good agreement is confirmed through thespatial distributions of c− contacts identified at the
stress-states 1-5 (Figure 6-a) and 1-4 (Figure 6-b)along the biaxial compression performed on S1
and the proportional strain path performed on S2
respectively. Let’s recall here that c− contacts accountfor those which exhibit a zero or negative value ofw2 = ∆f c∆lc. Each c− contact is presented by ablack dot in the snapshots displayed in Figure 6. Atthe beginning, the spatial distribution of c− contactsalong the biaxial compression is quite homogenous(snapshots 1 and 2). Further c− contacts becomemore and more concentrated within the shear band(characterized by the incremental deviatoric strainfield) as the axial strain increases. However, the widthof the shear band defined by c− contacts is relativelylarger than the one derived from the incrementaldeviatoric strain field. For the proportional strainloading path, c− contacts seems to be homogeneouslydistributed before and after failure with no particulardistinguishable structure. Note that in the last snap-shot, the sparse number of c− contacts is due to theloss of contacts within the sample resulting from thestatic liquefaction, and not to a switch of contactsfrom negative to positive values of w2.
The second order work computed from micro-scopic variables was proven to be in line with the van-ishing of the macroscopic second order work. More-over, the mode of failure can be directly predictedby means of the spatial distribution of c− contacts.Hence, it definitely constitutes a powerful and suit-able tool for the identification of the underlying microstructural mechanisms governing the failure process.
4 CLUSTERS DEFINITION BASED ON C−CONTACTS
Based on the results shown above regarding c−
contacts evolution and distribution during diffuse andlocalized failures, and according to other findings(Hadda et al. 2013) reporting the strong relationbetween the increase of c− contacts number andinstability, the distance between c− contacts seemsto play a key role in triggering failure within agranular assembly, especially when the latter comeclose together. It is definitely clear, that c− contactsconcentrated within the shear band (Figure 6-a)are much closer to each other compared to thoseoutside the band. Moreover, during diffuse failure,the proportional strain loading path seems to preventc− contacts from getting much closer, dispersingtheir concentrations before they get larger. Thus, itis quite interesting to focus the investigations onc− contacts gatherings for a better understanding offailure triggering and process.
When c− contacts come so close to each other, thisresults into another or more contacts belonging to agiven particle turning into c− contacts. Thus, a gath-ering of c− contacts can be identified from the most

loaded particles and such particles, are most likely toimply∑c∈p
∆f c∆lc ≤ 0 (3)
as they sustain more and more c− contacts.
Regardless of the number of c− contacts comparedto the total number of contacts belonging to a givenparticle, if the condition (3) is fulfilled, then the parti-cle is likely to be part of a cluster made of at least twoparticles in contact of that kind. Hence, such particleis denoted by p−.In this section, interest will be focused on the evolu-tion and distribution of p− clusters along both con-sidered loading paths which led to different failuremodes.
0 1 2 3 4 5 60
200
400
600
800
Tota
l num
ber
of
clust
ers
(5)
(4)(3)
(2)
(1)
0 1 2 3 4 5 60
5
10
15
Mea
n s
ize
of
clust
ers
in t
erm
s of
par
ticl
es
0 1 2 3 4 5 60
10
20
30
40
Per
centa
ge
of
par
ticl
es i
nvoved
wit
hin
clu
ster
s
ε1 [%]
Figure 7: Evolution of the number, mean size of p− clustersand the number of particles involved within clusters along thedrained compression performed on S1.
Figure 7 shows respectively the evolution of the to-tal number, the mean size of p− clusters and the per-centage of particles involved within the clusters forS1 while undergoing a localized failure. The largestnumber of clusters formed is reached at the peak ofq, involving naturally the largest number of particles.Then, a sharp decrease is observed just after the peakfollowed by a fluctuation around a constant value.The ongoing increase of the mean size of p− clustersduring the sharp decrease of the number of clustersright after the peak emphasizes a crucial phase of thelocalized failure process. This phase corresponds tothe appearance of the persistent shear band, through-out which, already existing clusters enlargement and
extinction processes take over cluster growth. This re-sult is consistent with what has been observed throughthe evolution of the incremental deviatoric strain dur-ing localized failure (Figure 2-a).
0 0.5 1 1.50
500
1000
1500
2000
To
tal
nu
mb
er o
f cl
ust
ers
(4)
(3)(2)(1)
0 0.5 1 1.50
2
4
6
8
Mea
n s
ize
of
clu
ster
s in
ter
ms
of
par
ticl
es
0 0.5 1 1.50
10
20
30
40
Per
cen
tag
e o
f p
arti
cles
inv
ov
ed w
ith
in c
lust
ers
ε1 [%]
Figure 8: Evolution of the number, mean size of p− clusters andthe number of particles involved within clusters along the pro-portional loading path performed on S2.
Identically, Figure 8 shows p− clusters evolutionfor S2 while undergoing a diffuse failure. Surpris-ingly, the evolution of the number of p− clustersdoes not show any particular tendency of failureoccurrence. In contrast with localized failure, diffusefailure is characterized by an almost constant numberof p− clusters all along the proportional loading pathafter a rapid modest increase at the beginning of theloading and a spontaneous extinction when staticliquefaction fully took place.Figure 8 shows also a very narrow spread of the meansize of p− clusters compared to the one observed dur-ing the localized failure, which means that p− clustersformed during such loading preserve almost the samesize with a very restricted extension. However, ateach peak of σ1 − σ2/R, a slight increase of p−clusters mean size is observed with almost the samenumber of particles involved within clusters beforethe peak. Thus, some clusters grow larger duringthese failure stages but obviously their enlargementis very limited in size and very short in time.
Noticeably, the total number of p− clusters formedduring diffuse failure overwhelm those formed duringlocalized failure and involve more p− particles. Moreor less 30% of particles are involved within p− clus-ters during diffuse failure while this value is reachedonly at peak during localized failure and is further re-duced to 15%. This phenomenon, which persists dur-
ing diffuse failure, occurs only at peak during local-ized failure.
a) (1) (2) (3) (4) (5)
b)
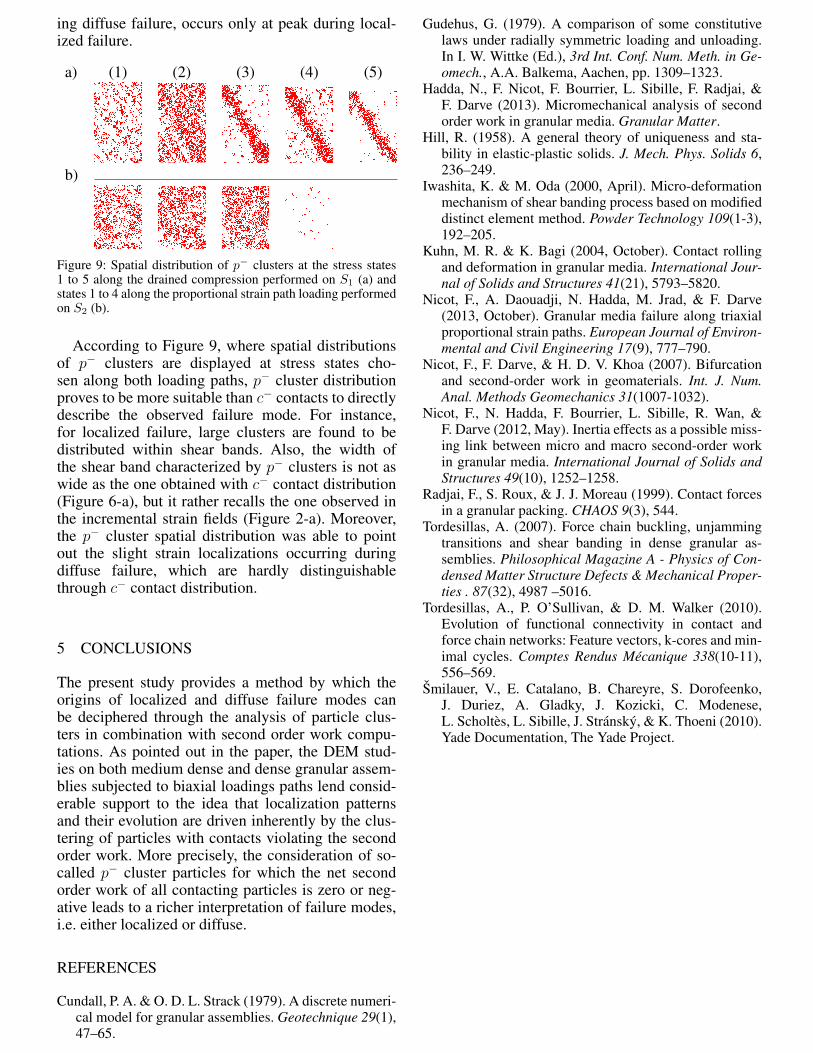
Figure 9: Spatial distribution of p− clusters at the stress states1 to 5 along the drained compression performed on S1 (a) andstates 1 to 4 along the proportional strain path loading performedon S2 (b).
According to Figure 9, where spatial distributionsof p− clusters are displayed at stress states cho-sen along both loading paths, p− cluster distributionproves to be more suitable than c− contacts to directlydescribe the observed failure mode. For instance,for localized failure, large clusters are found to bedistributed within shear bands. Also, the width ofthe shear band characterized by p− clusters is not aswide as the one obtained with c− contact distribution(Figure 6-a), but it rather recalls the one observed inthe incremental strain fields (Figure 2-a). Moreover,the p− cluster spatial distribution was able to pointout the slight strain localizations occurring duringdiffuse failure, which are hardly distinguishablethrough c− contact distribution.
5 CONCLUSIONS
The present study provides a method by which theorigins of localized and diffuse failure modes canbe deciphered through the analysis of particle clus-ters in combination with second order work compu-tations. As pointed out in the paper, the DEM stud-ies on both medium dense and dense granular assem-blies subjected to biaxial loadings paths lend consid-erable support to the idea that localization patternsand their evolution are driven inherently by the clus-tering of particles with contacts violating the secondorder work. More precisely, the consideration of so-called p− cluster particles for which the net secondorder work of all contacting particles is zero or neg-ative leads to a richer interpretation of failure modes,i.e. either localized or diffuse.
REFERENCES
Cundall, P. A. & O. D. L. Strack (1979). A discrete numeri-cal model for granular assemblies. Geotechnique 29(1),47–65.
Gudehus, G. (1979). A comparison of some constitutivelaws under radially symmetric loading and unloading.In I. W. Wittke (Ed.), 3rd Int. Conf. Num. Meth. in Ge-omech., A.A. Balkema, Aachen, pp. 1309–1323.
Hadda, N., F. Nicot, F. Bourrier, L. Sibille, F. Radjai, &F. Darve (2013). Micromechanical analysis of secondorder work in granular media. Granular Matter.
Hill, R. (1958). A general theory of uniqueness and sta-bility in elastic-plastic solids. J. Mech. Phys. Solids 6,236–249.
Iwashita, K. & M. Oda (2000, April). Micro-deformationmechanism of shear banding process based on modifieddistinct element method. Powder Technology 109(1-3),192–205.
Kuhn, M. R. & K. Bagi (2004, October). Contact rollingand deformation in granular media. International Jour-nal of Solids and Structures 41(21), 5793–5820.
Nicot, F., A. Daouadji, N. Hadda, M. Jrad, & F. Darve(2013, October). Granular media failure along triaxialproportional strain paths. European Journal of Environ-mental and Civil Engineering 17(9), 777–790.
Nicot, F., F. Darve, & H. D. V. Khoa (2007). Bifurcationand second-order work in geomaterials. Int. J. Num.Anal. Methods Geomechanics 31(1007-1032).
Nicot, F., N. Hadda, F. Bourrier, L. Sibille, R. Wan, &F. Darve (2012, May). Inertia effects as a possible miss-ing link between micro and macro second-order workin granular media. International Journal of Solids andStructures 49(10), 1252–1258.
Radjai, F., S. Roux, & J. J. Moreau (1999). Contact forcesin a granular packing. CHAOS 9(3), 544.
Tordesillas, A. (2007). Force chain buckling, unjammingtransitions and shear banding in dense granular as-semblies. Philosophical Magazine A - Physics of Con-densed Matter Structure Defects & Mechanical Proper-ties . 87(32), 4987 –5016.
Tordesillas, A., P. O’Sullivan, & D. M. Walker (2010).Evolution of functional connectivity in contact andforce chain networks: Feature vectors, k-cores and min-imal cycles. Comptes Rendus Mecanique 338(10-11),556–569.
Smilauer, V., E. Catalano, B. Chareyre, S. Dorofeenko,J. Duriez, A. Gladky, J. Kozicki, C. Modenese,L. Scholtes, L. Sibille, J. Stransky, & K. Thoeni (2010).Yade Documentation, The Yade Project.
Copyright © 2022 FDOKUMEN