Regular Physical Activity in Old Age - WUR eDepot
162
Regular Physical Activity in Old Age Effect on Coronary Heart Disease Risk Factors and Weil-Being Jantine Schuit
-
Upload
khangminh22 -
Category
Documents
-
view
1 -
download
0
Transcript of Regular Physical Activity in Old Age - WUR eDepot

Regular Physical Activity in Old Age
Effect on Coronary Heart Disease Risk Factors
and Weil-Being
Jantine Schuit
Promotor: Dr. ir. F.J. Kok
Hoogleraar in de Humane Epidemiologie
Co-promotor: Dr. E.G. Schouten
Universitair hoofddocent bij de Vakgroep Humane
Epidemiologie en Gezondheidsleer
"- . ~ i IS? V" fe>
Albertine Jeannette Schuit
Regular Physical Activity in Old Age
Effect on Coronary Heart Disease Risk Factors
and Weil-Being
Proefschrift
ter verkrijging van de graad van doctor
op gezag van de rector magnificus,
dr. C.M. Karssen,
in het openbaar te verdedigen
op maandag 16 juni 1997
des namiddags te vier uur in de Aula
van de Landbouwuniversiteit te Wageningen
rs^.-W/Yi^

This study was supported by a grant from the Netherlands Heart Foundation and
Praeventiefonds
CIP-DATA KONKINKLIJKE BIBLIOTHEEK, DEN HAAG
Schuit, A .J .
Regular physical activity in old age
Effect on coronary heart disease risk factors
and well-being/ A .J . Schuit. -[S.l.:s.n.].
Thesis Landbouw Universiteit Wageningen. -With ref.-
With summary in Dutch
ISBN 90-5485-711-0
Subject headings: physical activity/elderly people/
coronary heart disease risk factors/well-being
Cover: Wim ter Brake (design), Marcel Verweij (photography)
Printing: Ponsen & Looijen BV Wageningen
® A .J . Schuit, Wageningen, the Netherlands
BIBLIOTHEEK LANDBOUWL'NIVERSiThTT
WAGEMNGFN

f) o 'A4
STELLINGEN
1. Regelmatig bewegen op oudere leeftijd is gunstig voor het cardiovasculaire
risicoprofiel.
(Dit proefschrift).
2. Een bewegingsprogramma verbetert de fysieke conditie en competentie van
ouderen, en daarmee de kwaliteit van leven.
(Dit proefschrift).
3. Sportbeoefening door ouderen beklijft beter wanneer uitgevoerd in
groepsverband dan individueel.
(Dit proefschrift).
4. Het evalueren van confouding gebeurt grondiger wanneer de gevonden
associatie niet verklaarbaar is, dan wanneer deze wel verklaarbaar is.
5. Het doen van onderzoek bij ouderen wordt beloond met lessen in
levenswijsheid.
6. Aangezien het risico op een trombotische aandoening verhoogd is bij
ouderen als gevolg van de vergevorderde aderverkalking, is het gunstig
beïnvloeden van de fibrinolyse vooral bij hen van belang voor de
volksgezondheid.
7. Het verlengen van de tijd dat een voetgangersstoplicht op groen staat, kan
het wandelen van ouderen in de stad stimuleren.
8. De voortdurende veranderingen in de Nederlandse spelling dwingen met
name ouderen tot 'hersengymnastiek'.
9. Angst (bijv. BSE besmetting) is een belangrijker drijfveer voor het
veranderen van leefstijl dan het potentiële effect op de volksgezondheid
(bijv. lichamelijke activiteit).

10. De simultane stijging van de populariteit van de smartlap (Witte rozen-De
smartlap is de schaamte voorbij, in: NRC 12 april 1997) en de daling van
die van de hamlap (Nederland in de greep van de varkenspest, in: Varkens
1997;3:14-17) zijn een treffend voorbeeld van een niet-causale associatie.
1 1 . Het door sommigen gesuggereerde verband tussen haarkleur en intelligentie
van vrouwen, verdwijnt bij toenemende leeftijd.
12. Retorische vraag: 'And is not bodily habitus spoiled by rest and illness, but
preserved for a long time by motion and exercise.' (Socrates)
Stellingen behorende bij het proefschrift
Regular Physical Activity in Old Age
Effect on Coronary Heart Disease Risk Factors and Well-Being
van Jantine Schuit
Wageningen, 16 juni 1997

Voor alle deelnemers
aan dit onderzoek
Abstract
Regular physical activity in old age: Effect on coronary heart disease risk factors and well-being PhD thesis by Albertine J. Schuit, Department of Epidemiology and Public Health Wageningen Agricultural University, Wageningen, The Netherlands June 16, 1997.
Background. Regular physical activity is considered an important aspect of a healthy lifestyle. It may improve fitness, physical competence and may lower the risk of coronary heart disease (CHD). However, until now, data on the effects of regular exercise on CHD risk factors in elderly are limited, and there is a particular lack of data about the training effects on recently indicated risk factors, such as fibrinolytic and coagulation factors, and factors involved in the autonomic regulation of the heart. Methods. We have conducted a randomised, controlled intervention study, which addressed the effect of a 6 months training programme on 'classical' and 'new' CHD risk factors and well-being in 229 (intervention: 143 and control:86) apparently healthy, free-living elderly men and women (60-80 years). Results. Physical fitness (maximal exercise capacity) improved significantly in subjects of the intervention group (mean increase 14.1 Watt , 95%CI: 10.1-18.1, + 9%), compared to the controls. Among the classical CHD risk factors, only the reduction in serum triglyceride concentration in women was significant (-0.11 mmol/L, 95%CI: -0.22-0.0, -7%). Blood pressure, high- and low density lipoprotein and total serum cholesterol concentration changed in a favourable direction, but not significantly from the control group. No effect of training on body weight and fasting insulin concentration was found. Among the new risk factors, the concentration of tissue type plasminogen activator (t-PA), a fibrinolytic factor, was significantly increased ( + 0.07 lU/mL, 95%CI: 0.0-0.14,-1-11%) in subjects of the intervention group, while plasminogen activator inhibitor (PAI-1, inhibitor of fibrinolysis) was reduced, but not significantly different from the controls. These changes reflect an increase in fibrinolytic activity. However, fibrinogen concentration increased ( + 0.18 g/L 95%CI 0.04-0.32,+6%). In addition, heart rate variability was increased and heart-rate-adjusted-QT interval was reduced in subjects of the intervention group (P<0.05). Both changes probably represent increase in parasympathetic activity and a more favourable autonomic regulation of the heart. Finally, physical self-efficacy was significantly improved in the subjects of the intervention group. Symptoms of depression were reduced, but not significantly different from the controls.
Conclusion. Regular physical activity beneficially affected CHD risk factors, physical fitness and self-efficacy, which are important determinants of the quality of life and longevity in elderly. The magnitude of the benefits on CHD incidence remain unclear, since there is little information on the predictive value of the new risk factors in elderly. However, since elderly, in general, have advanced atherosclerosis and autonomic dysbalance, the improvements of these factors may be of particular importance in this age-group. In conclusion, our observations underline the importance of a public health policy aiming at stimulating regular physical activity in elderly people.
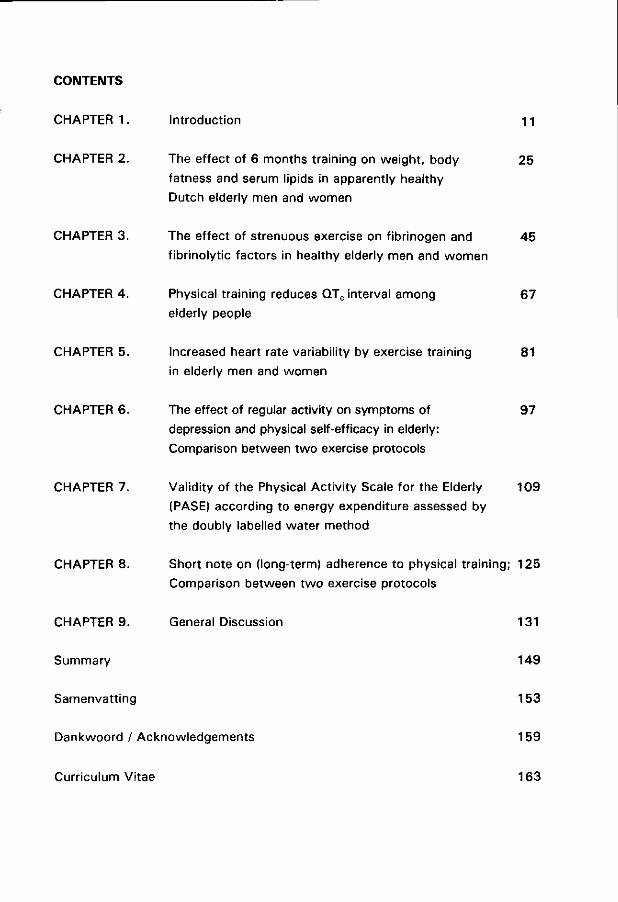
CONTENTS
CHAPTER 1. Introduction 11
CHAPTER 2. The effect of 6 months training on weight, body 25
fatness and serum lipids in apparently healthy
Dutch elderly men and women
CHAPTER 3. The effect of strenuous exercise on fibrinogen and 45
fibrinolytic factors in healthy elderly men and women
CHAPTER 4. Physical training reduces QTC interval among 67
elderly people
CHAPTER 5. Increased heart rate variability by exercise training 81
in elderly men and women
CHAPTER 6. The effect of regular activity on symptoms of 97
depression and physical self-efficacy in elderly:
Comparison between two exercise protocols
CHAPTER 7. Validity of the Physical Activity Scale for the Elderly 109
(PASE) according to energy expenditure assessed by
the doubly labelled water method
CHAPTER 8. Short note on (long-term) adherence to physical training; 125
Comparison between two exercise protocols
CHAPTER 9. General Discussion 131
Summary
Samenvatting
Dankwoord / Acknowledgements
Curriculum Vitae
149
153
159
163

CHAPTER 1
General Introduction
11

Chapter 1
Regular physical activity is an important aspect of a healthy lifestyle. It
increases aerobic capacity and strength (fitness), and may improve physical
competence and quality of life. In elderly, it may prolong vitality by slowing
down the ageing process, and increase longevity.1 However, the proportion of
inactive people increases with ageing. In the Dutch population, about 5 6 % of
elderly men and women above 65 is not physically active during leisure t ime,
and only 17 % is physically active 3 times a week for more than 20 minutes, in
walking, gardening or sports.2
Next to improvement of fitness and physical competence, regular activity
may also reduce risk of chronic conditions, such as hypertension, type II
diabetes and coronary heart disease (CHD).3"5 Physical inactivity is recognised
as an independent risk factor of CHD,6 but it also affects CHD risk factors.7"9
The potential beneficial role of exercise may be of particular importance in
elderly, since they are generally less physically active than younger subjects.
Moreover, elderly generally have more advanced atherosclerosis, and risk of
myocardial infarction is greater than in middle-aged people.
Before addressing the rationale and design of the study, a brief
introduction on the effects of physical activity on CHD (risk factors) is given,
and the importance of risk factors at older age is discussed.
Physical activity and CHD
Evidence of an independent role of physical activity in the primary prevention of
CHD has grown in recent years. One of the first epidemiological studies
addressing the issue of physical activity was published by Morris et a/.,10 who
observed a twofold-increased risk of CHD in sedentary postal carriers and bus
conductors, as compared to postal carriers who walked their route. Later, after
the 1970's, researchers started to investigate the association between leisure
time physical activity and CHD. Especially studies performed by Paffenbarger et
a/.11 and Blair er a/.12 have confirmed the findings of an elevated risk of CHD
mortality among the least active subjects. In a meta-analysis, Berlin and
Colditz13 suggested a dose-response relationship between physical inactivity
and risk of coronary heart disease, based on the fact that a stronger association
12
General Introduction
was observed when the high activity group was compared wi th a sedentary
group than when it was compared with a moderately active group. Part of this
meta-analysis was based on an earlier extensive review of Powell et al.,1 who
also reported a twofold-increased risk of heart attack in sedentary men as
compared to men who were physically active in either jobs or recreational
pursuits. This relative risk of CHD associated with physical activity is similar to
that of smoking.
Physical activity and CHD risk factors
Many factors are involved in the development of CHD, e.g. high serum low
density lipoprotein concentration, low serum high density lipoprotein
concentration, high blood pressure, obesity and insulin resistance. Next to
these, so-called classical risk factors, new CHD risk indicators have emerged.
Recently, factors involved in the athero-thrombotic process (elevated plasma
concentration of factor VII, plasminogen activator inhibitor-1, fibrinogen and
homocysteine) were associated with increased incidence or recurrence of
CHD.14"19 Also, a reduced heart rate variability and a prolonged QT interval,
characteristics derived from the electrocardiogram, were associated wi th
cardiovascular disease, independent of other risk factors, in an apparently
healthy population.20,21 These recently established risk factors will be discussed
later on in this chapter.
In several epidemiological studies, physical activity was associated wi th
the classical, as well as some of the new risk factors. Reports show that
regular physical activity may produce a more favourable lipoprotein profile, help
to manage body weight, increase insulin sensitivity, fibrinolytic activity and
parasympathetic tone, and lower blood coagulation and blood pressure.3'7"9'22"24
Importance of CHD risk factors at older age
The predictive value of CHD risk factors in elderly is less clear than among
middle-aged subjects. Epidemiological studies that have investigated the role of
classical risk factors in elderly, show inconsistent results,25 '26 although evidence
13

Chapter 1
accumulates that hypercholesterolemia and hypertension have predictive value 27 28 29
among the elderly. The discrepancies observed in these studies may be
partly explained by three aspects: (a) elderly are survivors, and may therefore
be less susceptible to the effect of the risk factors, (b) the level of the risk
factors may not reflect the level, these subjects had during most of their life;
risk factors may change with ageing and consequently misclassification can
occur, (c) wi th increasing age, there may be other risk factors that become
more important, in addition to the classical risk factors.
Elderly, in general, have more advanced atherosclerosis and a higher
prevalence of hypertension. Consequently, medical complications such as
plaque rupture, which may result in thrombus formation and possibly occlusion
of a coronary artery, are more likely to occur. Risk indicators, including
fibrinogen and fibrinolytic factors are associated with thrombosis and the
progression of atherosclerosis30 and may therefore be of more significance in
elderly27 than in younger subjects. In addition, sympathetic activity increases
wi th advancing age, which may indirectly lead to electrical instability of the
heart. Improvement of the autonomic balance by increasing parasympathetic
activity, may elevate the fibrillation threshold and prevent ventricular fibrillation,
which may ultimately lead to sudden death. In the following, recently
established CHD risk factors, which are likely to be associated with physical
activity, are briefly introduced.
Fibrinogen
Fibrinogen is a large glycoprotein, mainly synthesised in hepatocytes, wi th a
half life between 3 to 4 days. It is an acute phase reactant and its synthesis is
stimulated by cytokines. Fibrinogen has several functions, but the main function
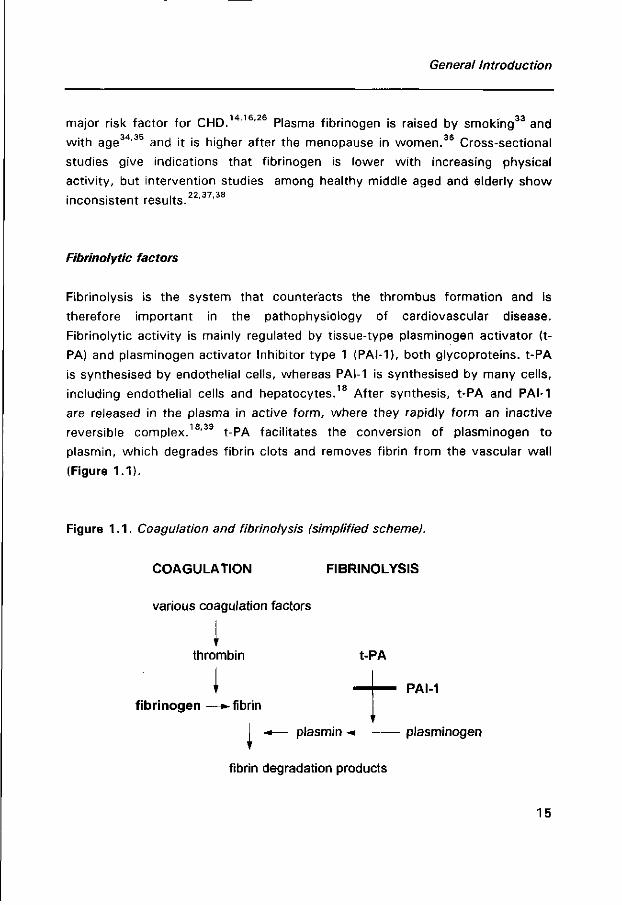
is in the clotting process. Fibrinogen is transformed into fibrin (under influence
of thrombin), which together with platelets forms blood clots (Figure 1.1).
Fibrinogen also promotes the aggregation of activated platelets. Moreover, the
amount of fibrinogen determines blood f low properties and fibrinogen and its
split products are present in atherosclerotic plaques.33 Elevated fibrinogen is
associated with the incidence of CHD in men in various studies.14 Although
there is still controversy whether elevated levels may be a simple reflection of
the extent of underlying atheroma, most researchers now consider fibrinogen a
14
General Introduction
major risk factor for CHD.1 4 1 6 , 2 Plasma fibrinogen is raised by smoking33 and
with age34,35 and it is higher after the menopause in women.3 6 Cross-sectional
studies give indications that fibrinogen is lower wi th increasing physical
activity, but intervention studies among healthy middle aged and elderly show ?? 37 38
inconsistent results. ' '
Fibrinolytic factors
Fibrinolysis is the system that counteracts the thrombus formation and is
therefore important in the pathophysiology of cardiovascular disease.
Fibrinolytic activity is mainly regulated by tissue-type plasminogen activator (t-
PA) and plasminogen activator Inhibitor type 1 (PAI-1), both glycoproteins. t-PA
is synthesised by endothelial cells, whereas PAI-1 is synthesised by many cells,
including endothelial cells and hepatocytes.18 After synthesis, t-PA and PAI-1
are released in the plasma in active form, where they rapidly form an inactive
reversible complex.18,39 t-PA facilitates the conversion of plasminogen to
plasmin, which degrades fibrin clots and removes fibrin from the vascular wall
(Figure 1.1).
Figure 1.1. Coagulation and fibrinolysis (simplified scheme).
COAGULATION FIBRINOLYSIS
various coagulation factors
1 thrombin
I fibrinogen —»-fibrin
- * — plasmin -* plasminogen \
fibrin degradation products
15
Chapter 1
PAI-1 is a rapid inhibitor in this process by binding to t-PA. PAI-1 is increased in
subjects with ischaemic heart disease, and elevated PAI-1 levels are a risk
factor for myocardial reinfarction in young subjects.15 Several studies show that
PAI-1 antigen is positively associated with body mass index, serum triglyceride
concentration, fasting insulin concentration and blood pressure, and inversely JQ QQ QC
associated wi th physical activity. ' " t-PA activity correlates positively wi th
physical activity.19 Earlier studies have shown a positive association between
physical activity and fibrinolytic activity.40,41
Heart rate variability
Heart rate variability (HRV) is the amount of spontaneous fluctuations around
the mean heart rate, due to internal and external processes. It is used as a tool
to investigate the sympathetic and parasympathetic function of the autonomic
nervous system. Reduced HRV is associated with a two-to-three-fold increased
risk of total mortality42 and cardiac events20 in healthy as well as myocardial
infarction patients.43 The biological mechanism underlying this association
remains unclear. Probably, a reduced HRV reflects diminished parasympathetic
activity. Sympathetic dominance in the autonomic cardiac control, may lead to
electrical instability44 and cause ventricular arrhythmias. Subjects with a high
sympathetic drive more often have coronary atherosclerosis.45 Next to being a
contributor to the pathogenesis of CHD, low HRV may also reflect subclinical
CHD. HRV diminishes with ageing, stress and smoking.46 Most studies
investigating the effect of physical activity on HRV have been performed in
heart patients. These studies primarily show increase in HRV after training.
However, studies performed in healthy middle aged and elderly subjects have
come up with inconclusive results.24 '47
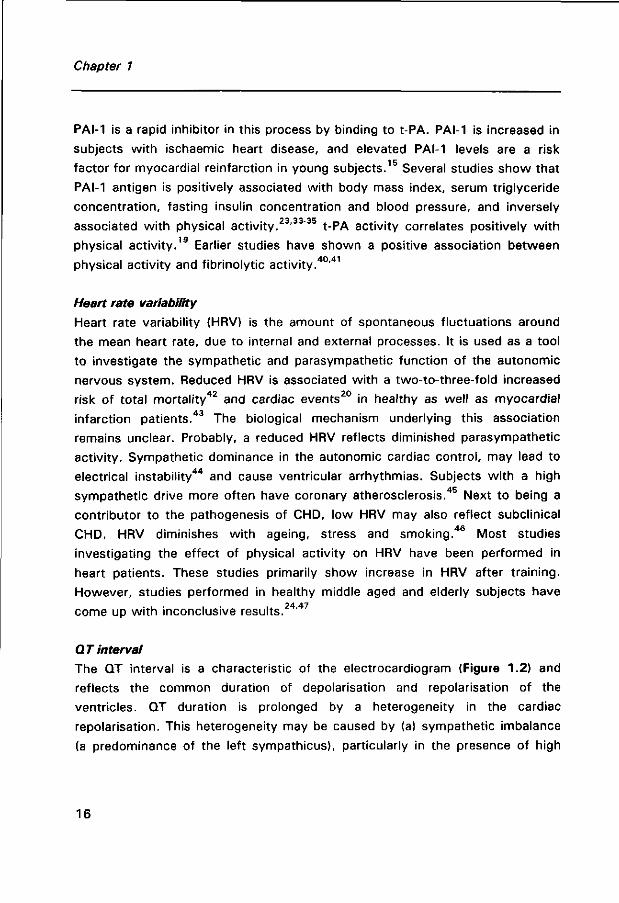
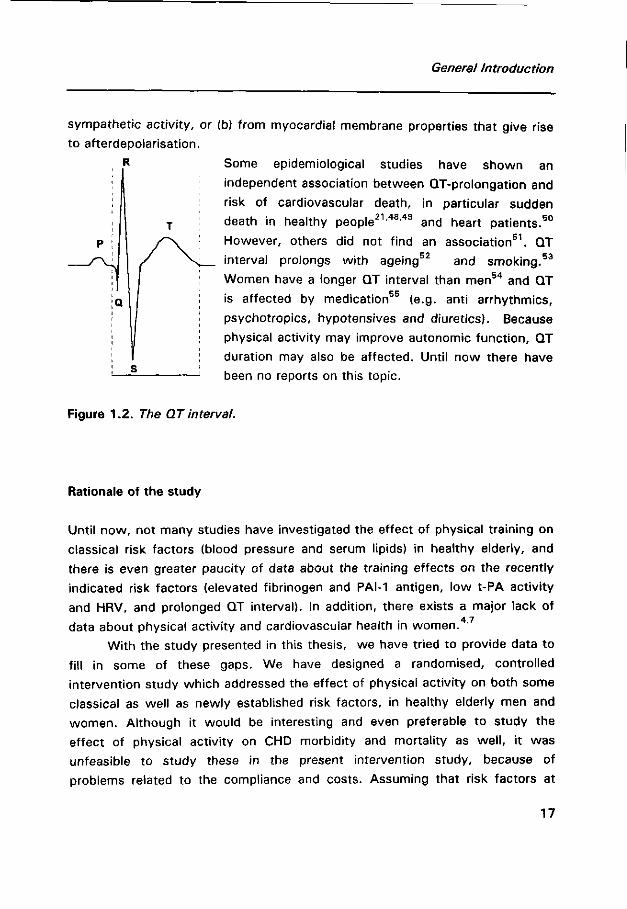
QT interval
The QT interval is a characteristic of the electrocardiogram (Figure 1.2) and
reflects the common duration of depolarisation and repolarisation of the
ventricles. QT duration is prolonged by a heterogeneity in the cardiac
repolarisation. This heterogeneity may be caused by (a) sympathetic imbalance
(a predominance of the left sympathicus), particularly in the presence of high
16
General Introduction
sympathetic activity, or (b) from myocardial membrane properties that give rise
to afterdepolarisation.
Some epidemiological studies have shown an
independent association between QT-prolongation and
risk of cardiovascular death, in particular sudden
death in healthy people21,48,49 and heart patients.50
However, others did not find an association51. QT 53 interval prolongs with ageing and smoking.
Women have a longer QT interval than men5 4 and QT
is affected by medication55 (e.g. anti arrhythmics,
psychotropics, hypotensives and diuretics). Because
physical activity may improve autonomic function, QT
duration may also be affected. Until now there have
been no reports on this topic.
Figure 1.2. The QT interval.
Rationale of the study
Until now, not many studies have investigated the effect of physical training on
classical risk factors (blood pressure and serum lipids) in healthy elderly, and
there is even greater paucity of data about the training effects on the recently
indicated risk factors (elevated fibrinogen and PAI-1 antigen, low t-PA activity
and HRV, and prolonged QT interval). In addition, there exists a major lack of 4 7
data about physical activity and cardiovascular health in women. '
With the study presented in this thesis, we have tried to provide data to
fill in some of these gaps. We have designed a randomised, controlled
intervention study which addressed the effect of physical activity on both some
classical as well as newly established risk factors, in healthy elderly men and
women. Although it would be interesting and even preferable to study the
effect of physical activity on CHD morbidity and mortality as wel l , it was
unfeasible to study these in the present intervention study, because of
problems related to the compliance and costs. Assuming that risk factors at
17
Chapter 1
older age still have a predictive value, intervention studies managing these risk
factors seem appropriate.
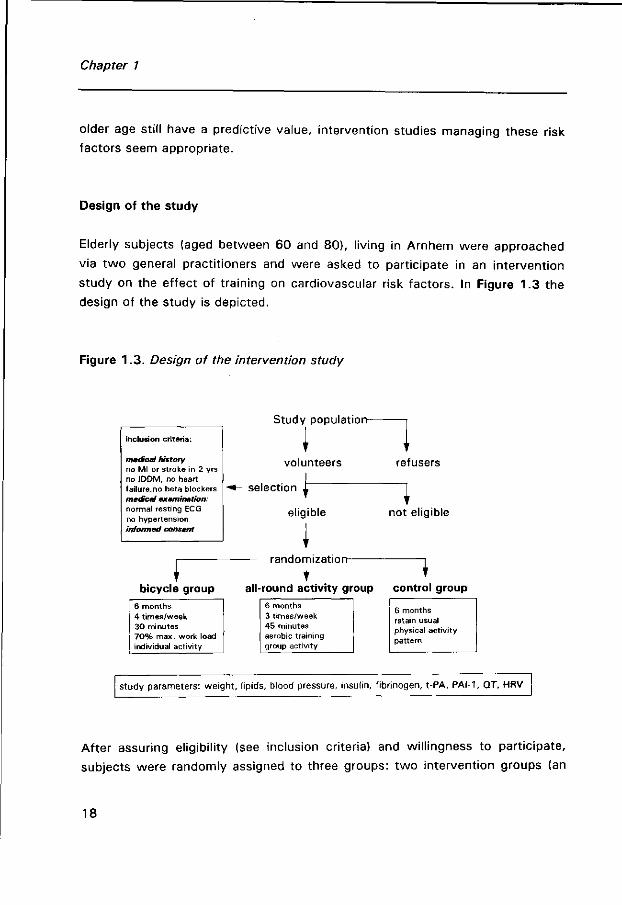
Design of the study
Elderly subjects (aged between 60 and 80), living in Arnhem were approached
via two general practitioners and were asked to participate in an intervention
study on the effect of training on cardiovascular risk factors. In Figure 1.3 the
design of the study is depicted.
Figure 1.3. Design of the intervention study
inclusion criteria:
medical history no Ml or stroke in 2 yrs no IDDM, no heart failure.no beta blockers medical examination: normal resting ECG no hypertension informed consent
Study population-
volunteers
selectior
bicycle group 6 months 4 times/week 30 minutes 7 0 % max. work load individual activity
^
eligible
refusers
not eligible
— randomization 1
all-round activity group control group 6 months 3 ttmes/week 45 minutes aerobic training group activity
6 months retain usual physical activity pattern
study parameters: weight, lipids, blood pressure, insulin, fibrinogen, t-PA, PAI-1, QT, HRV
After assuring eligibility (see inclusion criteria) and willingness to participate,
subjects were randomly assigned to three groups: two intervention groups (an
18
General Introduction
exercise bicycle group and all-round activity group) and a control group. On
average, randomisation results in comparability of all factors that may affect
outcome of the study, even those factors that are not known to the investigator
and which could therefore not be controlled for in observational studies. The
purpose of the study was to recruit 100 subjects in both bicycle and control
group and 50 subjects in the all-round activity group.
The intervention period was 6 months. This period was primarily based
on results of previous physical activity intervention studies, investigating lipid
changes, which reported effects only after 6 months. A longer period would
probably have affected the compliance, which would lead to an underestimation
of the effect attributable to the training programme.
A ' run-in' period, before the actual randomisation, to improve compliance
during the intervention, did not seem feasible, since we believed that the ' run-
in' ideally should include physical activity and this would have affected the
outcome of the main study.
Adherence to the intervention protocol was stimulated by regular visits
and phone calls. In the bicycle group, adherence was checked by a self-
reporting cycling record. In the all-round activity group, the sports instructor
kept a attendance list, in which the motivation and effort of the participant was
reported as well.
We were interested in the physiological effects of 6 months' training and
not in the feasibility of a training programme in elderly, therefore we used the
' intention to protocol' design, meaning that only those who stayed in the
programme for 6 months were included in the analyses, regardless of the
adherence to the exercise programmes during these months.
Outline of the thesis
In this thesis, the effects of a 6 months' training programme on classical and
new CHD risk indicators in healthy elderly men and women are addressed. In
Chapter 2, the effect of 6 months' training on lipids and body weight is
reported. Chapter 3 to 5 describe the effect of training on the new risk
indicators of CHD. Chapter 3 deals with the effect of training on fibrinolytic
19
Chapter 1
factors and fibrinogen, Chapter 4 deals with training effects on QT interval and
Chapter 5 describes training effects on HRV. The training effects on fibrinolysis,
fibrinogen and HRV were studied in a subpopulation, for budgetary reasons.
Although changes in risk factors may be very important in reducing risk of
CHD, the subjective well-being of the elderly participating in the training
programme is of equal importance. This is described in Chapter 6. in Chapter 7
we describe the validity of the physical activity questionnaire 'PASE' (Physical
Activity Scale for the Elderly), which was used in our study. The validity of the
PASE was assessed, using energy expenditure assessed by the doubly labelled
water. Chapter 8 briefly addresses the long-term adherence of regular exercise
among subjects of the intervention groups. In this chapter the two exercise
protocols are compared. Finally, in Chapter 9, the results of the study are put in
broader perspective. Methodological considerations of the study, as well as
public health implications and suggestions for future research are reported in
the general discussion.
References
1. Paffenbarger RS, Hyde RT, Wing AL, Lee IM, Kampert JB. Some interrelations of physical
activity, physiological fitness, health and longevity. In: Physical activity, fitness, and health.
International proceedings and consensus statement, eds. Bouchard C, Shepard RJ,
Stephens T. page 119-133. Human Kinetic Publishers Inc. 1994
2. Backx FJG, Swinkels H, Bol E. How physically (in)active are Dutch adults during their leisure
time. Maandbericht Gezondheid CBS, 1994;3:4-16.
3. Hagberg JM, Seals DR. Exercise training and hypertension. Acta Med Scan, Suppl.
711:131-136.
4. Manson JE, Rimm EB, Stampfer MJ, Colditz GA, Willett WC, Krolewski AS, Rosner B,
Hennekens CH, Speizer FE. Physical activity and incidence of non-insulin-dependent
diabetes mellitus in women. Lancet 1991:338;774-778.
5. Powell KE, Thompson PD, Caspersen CJ, Kendrick JS. Physical activity and the incidence of
coronary heart disease. Ann Rev Health 1987;8:253-287.
6. Fletcher GF, Blair SN, Blumenthal J, Caspersen C, Chaitman B, Epstein S, Falls H, Sivarajan
Froelicher ES, Froelicher VF, Pina IL. Statement on exercise: benefits and recommendations
for physical activity programs for all americans. Circulation 1992;86:340-344.
7. Haskell WL. The influence of exercise on the concentration of triglycerides and cholesterol
in human plasma. Exerc Sport Rev 1984;12:205-244.
20

General Introduction
8. Schwartz RS, Shuman WP, Larson V, Cain KC, Fellingham GW, Beard JC, Kahn SE,
Stratton JR, Cerquiera MD, Abrass I. The effect of intensive endurance training on body fat
distribution in young and older men. Metabolism 1991;40:545-551.
9. Holloszy JO, Schultz J, Kusnierkiewicz, Hagberg JM, Ehsani AA. Effects of exercise on
glucose tolerance and insulin resistance. Brief review and some preliminary results. Acta
Med Scand Suppl 1986;711:55-65.
10. Morris JN, Kagan A Pattison DC, Gardner MJ. Incidence and prediction of ischaemic heart-
disease in London busmen. Lancet 1966;2:552-559.
11 . Paffenbarger RS, Wing AL, Hyde RT. Physical activity as an index of heart attack risk in
college alumni. Am J Epidemiol 1978;108:161-175.
12. Blair SN, Kohl HW, Paffenbarger RS, Clark DG, Cooper KH, Gibbons LW. Physical fitness
and all-cause mortality. A prospective study fo healthy men and women. JAMA
1989;262:2395-2401.
13. Berlin JA, Colditz GA. A meta-analysis of physical activity in the prevention of coronary
heart disease. Am J Epidemiol 1990;132:612-628.
14. Ernst E, Resch KL. Fibrinogen as a cardiovascular risk factor: a meta-analysis and review of
the literature. Ann Intern Med 1993;18;956-963.
15. Hamsten A, Walldius G, Szamosi A, Blombäck, de Faire U, Dahlen G, Landou C, Wiman B.
Plasminogen activator inhibitor in plasma: risk factor for recurrent myocardial infarction.
Lancet 1987;2:3-8.
16. Meade TW, Chakrabarti R, Haines AP, North WRS, Stirling Y, Thompson SG. Haemostatic
function and cardiovascular death: early results of a prospective study. Lancet 1980;1:
1050-1053.
17. Ueland PM, Refsum H. Plasma homocysteine, a risk factor for vascular disease: plasma
levels in health, disease, and drug therapy. J Lab Clin Med 1989;114:473-501.
18. Dawson S, Henney A. The status of PAI-1 as a risk factor for arterial and thrombotic
disease: a review. Atherosclerosis 1992;95:105-117.
19. Benderly M, Graff E, Reicher-Reiss H, Behar S, Brunner D, Goldbourt U, for the bezafibrate
infarction prevention (BIP) Study Group. Fibrinogen is a predictor of mortality in coronary
heart disease patients. Arterioscler Thromb Vase Biol. 1996;16:351-356.
20. Tsuji H, Larson MG, Venditti FJ, Manders ES, Evans JC, Feldman CL, Levy D. Impact of
reduced heart rate variability on risk for cardiac events. The Framingham Heart Study.
Circulation 1996;94:2850-2855.
2 1 . Dekker JM, Schouten EG, Klootwijk P, Pool J, Kromhout D Association between QT interval
and coronary heart disease in middle-aged and elderly men. The Zutphen Study. Circulation
1994;90:779-784.
22. Stratton JR, Chandler WL, Schwartz RS, Cerqueira MD, Levy WC, Kahn SE, Larson VG,
Cain KC, Beard JC, Abrass IB. Effects of physical conditioning on fibrinolytic variables and
fibrinogen in young and old healthy adults. Circulation 1991;83:1692-1679.
21
Chapter 1
23. Ponjee GAE, Janssen EME. Hermans J, Wersch JWJ. Regular physical activity and changes in risk factors for coronary heart disease: a nine months prospective study. Eur J Chem Clin Biochem 1996;34:477-483.
24. Seals DR, Chase PB. Influence of physical training on heart rate variability and baroreflex
circulatory control. J Appl Physiol 1989;66:1886-1895.
25. Hulley SB, Newman TB. Cholesterol in the elderly. Is it important? (Editorial). JAMA
1994;272:1372-1374.
26. Bulpitt CJ, Fletcher AE. Prognostic significance of blood pressure in the very old.
Implications for the treatment decision. Drugs Aging 1994;5:184-191.
27. Weijenberg M. Prospective studies on coronary heart disease in the elderly, the role of
classical and new risk factors. Thesis Agricultural University Wageningen. 1996.
28. Castelli WP, Wilson PWF, Levy D, Anderson K. Cardiovascular risk factors in the elderly.
Am J Cardiol 1989;63:12H-1 9H.
29. Benfante R, Reed D, Frank J. Do coronary heart disease risk factors measured in the elderly
have the same predictive roles as in the middle aged. Comparisons of relative and
attributable risks. Ann Epidemiol 1992;2:273-282.
30. Smith EP. Fibrinogen, fibrin and fibrin degradation products in relation to atherosclerosis.
Clin in Haematol 1986;15:355-370.
31 Kannel WB, D'Agostino RB, Belanger AJ. Update on fibrinogen as a cardiovascular risk
factor. Ann Epidemiol 1992;2:457-466.
32. Maat de MPM. Regulation and modulation of the plasma fibrinogen level. Thesis Erasmus
University Rotterdam, 1995
33. Gris JC, Schved JF, Feugeas 0, Aguilar-Martinez P, Arnaud A, Sanchez N, Sarlat C. Impact
of smoking, physical training and weight reduction on FVII, PAI-1 and hemostatic markers in
sedentary men. Thrombosis and Haemostasis. 1990;64:516-520
34. Mehta J, Mehta P, Lawson D, Saldeen T. Plasma tissue plasminogen activator inhibitor
levels in coronary artery disease: Correlation with age and serum triglyceride concentration.
J Am Coll Cardiol 1987;9:263-268.
35. Krobot K, Hense HW, Cremer P, Eberle E, Keil U. Determinants of plasma fibrinogen:
Relation to body weight, waist-to-hip ratio, smoking, alcohol, age, and sex. Results from the
second MONICA Augsburg Survey, 1989-1990. Arteriosclerosis and thrombosis
1992;12:780-788.
36. Lindoff C, Petersson F, Lecander I, Martinsson G, Âstedt B. Passage of the menopause is
followed by haemostatic changes. Maturitas 1993;17:17-22.
37. Connely JB, Cooper JA, Meade TW. Strenuous exercise, plasma fibrinogen and factor VII
activity. Brit Heart J 1992;67:351-354.
38 Rankinen T, Rauramaa R, Väisänen S, Halonen P, Penttilä. Blood coagulation and fibrinolytic
factors are unchanged by aerobic exercise or fat modified diet. Randomized clinical trial in
middle aged men. Fibrinolysis 1994;8:48-53.
22
General Introduction
39. Kluft C. Constitutive synthesis of tissue-type plasminogen activator (t-PA) and plasminogen
activator inhibitor type 1 (PAI-1): Conditions and therapeutic targets. Fibrinolysis
1994;8:(suppl 2);1-7.
40. Korsan-Bengtsen K, Wilhelmsen L, Tibblin G. Blood coagulation and fibrinolysis in relation to
degree of physical activity during work and leisure time. Acta Med Scand 1973;193:73-77.
4 1 . Ferguson EW, Bernier LL, Banta GR, Yu-Yahiro J, Schoomaker EB. Effects of exercise and
conditioning on clotting and fibrinolytic activity. J Appl Physiol 1987;62:1416-1421.
42. Tsuji H, Venditti FJ, Manders ES, Evans JC, Larson MG, Feldman CL, Levy D. Reduced
heart rate variability and mortality risk in an elderly cohort. The Framingham heart study.
Circulation 1994;90:878-883.
43. Bigger TJ Jr, Fleiss JL, Rolnitzky LM, Steinman RC. The ability of several short-term
measures of RR variability to predict mortality after myocardial infarction. Circulation
1993;88:927-34.
44. Schwartz PJ, Priori SG. The long QT syndrom. In: Zipes D.P., Jalife J. (eds). Cardiac
electrophysiology: from cell to bedside. Philadelphia. W.B. Saunders Company, 1990:589-
605.
45. Yeung A, Vekshtein V, Krantz D, Vita JA, Ryan TJ, Ganz P, Selwyn AP. The effects of
atherosclerosis on the vasomotor response of coronary arteries to mental stress. N Engl J
Med 1991;325:1551-1556.
46. Kristal Boneh E, Raifel M, Froom P, Ribak J. Heart rate variability and disease. Scand J
Work Environ Health 1995;21:85-95.
47. Boutcher SH, Stein P. Association between heart rate variability and training response in
sedentary middle-aged men. Eur J Appl Physiol 1995;70:75-80.
48. Algra A, Tijssen JGP, Roelandt JRTC, Pool J, Lubsen J. QTc prolongation measured by
standard 12-lead electrocardiography is an independent risk factor for sudden death due to
cardiac arrest. Circulation 1991;83:1888-1894.
49. Schouten EG, Dekker JM, Meppelink P, Kok FJ, Vandenbroucke JP, Pool JP. QT Interval
prolongation predicts cardiovascular mortality in an apparently healthy population.
Circulation 1991;84:1516-1523.
50. Peters RW, Byington RP, Barker A, Yusuf S. Prognostic value of prolonged ventricular
repolarization following myocardial infarction: The BHAT experience. J Clin Epidemiol
1990;43:167-172.
51 . Goldberg RJ, Bengtson J, Chen Z, Anderson KM, Locati E, Levy D. Duration of the QT
interval and t total and cardiovascular mortality in healthy persons (The Framingham Heart
Study Experience). Am J Cardiol. 1991;67:55-58.
52. Simonson E. Differentiation between normal and abnormal in electrocardiography. St.Louis:
The C.V. Mosby Company, 1961.
53. Piha SJ. Cardiovascular autonomic reflexes in heavy smokers. Journal of the Autonomic
Nervous system 1994;48:73-77.
23
Chapter 1
54. Rautaharju PM, Zhou SH, Wong S, Calhoun HP, Berenson GS, Prineas R, Davignon A. Sex
differences in the evolution of the electrocardiographic QT interval with age. Can J Cardiol.
1992;8:690-695.
55. Singh BN, Hollenberg NK, Poole-Wilson PA, Robertson JIS. Diuretic-induced potassium and
magnesium deficiency: relation to drug-induced QT prolongation, cardiac arrhythmias and
sudden death. Journal of Hypertension 1992;10:301-316.
24
CHAPTER 2
The effect of 6 months training on weight, body
fatness and serum lipids in apparently healthy Dutch
elderly men and women
A J Schuit, EG Schouten, T Miles, WJ Evans, WHM Saris, FJ Kok.
submitted for publication
25
Chapter 2
ABSTRACT
The purpose of the study was to investigate the effect of a 6-months' training
programme on changes in body weight and lipid concentrations, and their
interrelationship, in a group of 229 elderly men and women, aged 60 to 80
years. The elderly were randomly assigned to a control group or a supervised
aerobic training group, which exercised 3-4 times a week for 6 months.
During the intervention, no significant changes were observed in weight
or body fatness in subjects of the training group. Serum HDL, LDL, total
cholesterol and triglycerides changed in a favourable direction in elderly of the
intervention group, but only triglyceride concentration in women was
significantly reduced as compared to controls (intervention: mean -0.11 SE
0.06, control: mean 0.06 SE 0.06 mmol/L). Regression analysis showed that
the intervention-control difference in lipid change was independent of changes
in weight, body fat, energy intake or total fat intake. Both change in weight and
body fat percentage were unrelated to change in lipid concentration.
In conclusion, regular physical exercise in an elderly population resulted
in a significant reduction in triglycerides in women. Only a trend towards
favourable changes in concentration in the other lipids was observed. Change in
lipid concentration could not be attributed to change in weight or body fat.
26
Body composition and serum lipids
INTRODUCTION
Advancing age is associated with profound changes in body composition. Body
fat increases substantially, " while skeletal muscle mass decreases.6 The age-
associated increased fat mass accumulates mainly in the trunk.7 Distribution of
fat mass in the abdominal region has been associated with development of
atherosclerosis, insulin resistance, hyperlipidemia, hypertension and the
occurrence of cardiovascular disease and diabetes mellitus in men8"12 and wo-„ 8-11,13-15
men.
Increase in fat mass with ageing results mainly from declining physical
activity (and a declining metabolic rate) coupled wi th an energy intake not
matched to the declining need,16"19 rather than being a consequence of the 1 3 20
ageing process itself. Both cross-sectional ' as well as training intervention
studies21"25 show a relationship between physical activity and body fat among
elderly persons. It has been suggested that the reported beneficial effects of
training on lipids,26"30 like a reduction in triglycerides and increase of HDL
concentration are merely a result of weight or fat loss, induced by training,28,31" 34 and not a weight-independent effect of training, which is proposed by
others.35,36 Also a change in energy percentage of fat intake as a consequence
of higher energy intake may affect lipoprotein concentration.
Until now, not many intervention studies have been conducted among
non-obese healthy elderly men and women, investigating the effect of training
on plasma lipid concentration and body weight. Therefore, we studied the
effect of regularly performed aerobic exercise on plasma lipids in a considerably
large group of Dutch elderly men and women randomly assigned to an exercise
group and a sedentary control group, without interfering with food intake. In
addition, we investigated the role of body weight and body fat in this
association.
SUBJECTS AND METHODS
Subjects
Eight hundred and twenty nine elderly, aged between 60 and 80, patients of
two general practitioners and residents of Arnhem, the Netherlands, were asked
to participate in an intervention study on the effect of training on cardiovascular
27
Chapter 2
risk factors. The general practitioners had selected these persons, using the
following exclusion criteria: subjects wi th myocardial infarction or stroke in the
past two years, insulin dependent diabetes mellitus, unstable angina pectoris,
heart failure, and hypertension were not eligible.
One hundred and f ifty two men and 166 women volunteered for
participation (43% of the invited men and 3 5 % of the invited women). All
volunteers provided informed consent according to the guidelines of the Medical
Ethical Committee of the Agricultural University Wageningen. Compared to
refusers, volunteers were somewhat younger (men 68.5 ± 5.5 vs 71.5 ± 5.6
years, women 67.8 ± 5.4 vs 70.5 ± 5.4 years), and less often considered
themselves inactive as compared to peers (men 4 9 % vs 77%, women 4 8 % vs
77%).
The volunteers were screened by a physical examination, which
consisted of a resting supine and upright 12-lead electrocardiogram and blood
pressure measurement. Subjects wi th no signs of present cardiovascular
disease underwent a graded maximal exercise test. Subjects with ischaemic
response (ST-depression > 2 mm) or those who were limited by heart failure
during the exercise test were excluded from the study. In total 39 men (25.7%)
and 50 women (30.1%) were excluded for medical reasons, which left us wi th
a study population of 113 men and 116 women.
Randomisation and follow up
All 229 eligible subjects were randomly assigned to one of three protocols: an
exercise bicycle group (48 men and 48 women), an all-round activity group (25
men and 22 women) or a control group (40 men and 46 women). Husbands
and wives were randomised together. During the intervention 12 men and 19
women stopped wi th the bicycling programme (32%), 6 men and 5 women left
the all-round activity group (23%) and 2 men and 2 women (5%) dropped out
of the control group. Drop out in the bicycle group was mainly due to motivati
on problems (50%) and medical indication (40%). In the all-round activity group
7 elderly dropped out immediately after assignment, because they could not be
present at the scheduled sport hours, due to other obligations, 4 elderly
subjects stopped the programme because of medical reasons. Musculoskeletal
problems were by far the most important medical reason for a premature
28
Body composition and serum lipids
withdrawal (63%). Three subjects prematurely left the training programme
because of cardiovascular disease. Subjects in the control group all left the
study because of family circumstances.
Training
Subjects in the exercise bicycle group performed aerobic training during half a
year, four times a week for 30 minutes. They exercised at a heart rate corres
ponding to 7 0 % of their maximal exercise capacity, which was individually
determined in the baseline maximal exercise test. The subjects received an
bicycle ergometer at home which recorded their pulse rate. Adherence to
bicycle protocols was captured in 3 ways; as a proportion of the target
intensity, as an average percent of target days per week, and as a proportion of
target time spent in every training session. The rate of adherence for each
measurement was similar for men and women, namely; training intensity (97%
and 98%), frequency (86% and 81%) and time spent (94% and 84%).
Subjects in the all-round activity group gathered 3 times a week for a 45
minutes' training session during half a year, led by an experienced sports
instructor. The training consisted of aerobic exercise (ball games, exercise to
music), callisthenics and flexibility exercises. The attendance in the all-round
group was 7 2 % for men and 81 % for women.
Subjects in the control group were asked to maintain their habitual
activities during the intervention period, but were not restricted from
undertaking more physical activity, if desired.
Since both the bicycle and all round training protocols were similar wi th
respect to intensity, duration and frequency and both programmes aimed at
increasing aerobic capacity, for this report the groups were combined. Changes
in the maximal exercise capacity and maximal oxygen consumption (determined
in a sub-group, since there were no facilities available at the start of the study)
were not different between the bicycle and all-round group. Therefore,
comparable effects were expected on the study parameters. All participants
were free to choose their own diet for the full period of the intervention.
29
Chapter 2
Measurements
The measurements were performed identically before and after the intervention
period.
Body mass index. Body height was measured (to the nearest 0.005 m)
using a wall-mounted measuring tape. The subjects were standing without
shoes. Body weight was measured on a calibrated weighing scale to the
nearest 0.5 kg with the participants clothed in underwear.
Body fat. Body fat was estimated using the equation of Durnin and
Womersley,37 based on the sum of four skinfolds: triceps (halfway between the
acromion and the olecranon), biceps (same level as triceps, directly above the
centre of the cubital fossa), subscapula (about 2 cm below the tip of the
scapula, at an angle of 45 to the lateral side of the body), suprailiac (just above
the iliac crest, in the axillary line). In addition, we measured quadriceps
(halfway between the iliac crest and the patella in a vertical line) and fibula (on
the fibula at the level of the greatest circumference). Skinfolds were measured
in triplicate at the left side of the body with a Harpenden skinfold calliper
(Holtain/Tanner-Whitehouse; Holtain Ltd, Crymmych, UK). Pre and post
measurements were performed by one person.
Serum lipids. A sample of fasting blood was drawn between 9.00 and
10.00 am, with subjects sitting down. Serum was obtained and stored at
-80°C. Total cholesterol was analysed via enzymatic CHOD-PAP-Monotest
method of Boehringer, triglycerides concentration via GPO-PAP method of
Boehringer and high-density lipoprotein (HDL) was measured according to the
method of Lopez Virella.38 Low-density lipoprotein (LDL) was calculated using
Friedewald formula.39
Maximal exercise capacity. The maximal work rate (Wmax) was
measured on a bicycle ergometer. The initial work load was 60 Watt for men
and 30 Watt for women. Every three minutes, work load was increased wi th 30
Watt. This protocol was applied in order to obtain a near steady state at each
level and to perform cardiovascular screening simultaneously. The test was
stopped when the subjects were exhausted or when there was a medical
indication for premature halt. Maximal exercise capacity was determined
through interpolation by summing up 10 Watt for every extra full minute of
cycling on a certain work load.
30
Body composition and serum lipids
Questionnaires on physical activity and food intake. Physical activity was
measured with the Zutphen Study Questionnaire.40 Energy- and fat intake were
determined with a food frequency questionnaire.41
Data analysis
Mean lipid concentration, body weight, body fat, maximal exercise capacity and
lifestyle factors at baseline were compared between control group and
intervention group. The association at baseline between body weight and body
fat, wi th lipid concentration was studied, using regression analysis. The effect
of the exercise programme on lipid concentration, weight, body fat and
skinfolds as well as on maximal exercise capacity, energy and fat intake was
tested using Students t-test, comparing changes in intervention and control
group. Paired t-test was used to study changes in lipid concentrations
compared to baseline concentration within the groups. In addition, regression
analysis with lipid change as dependent variate and intervention/control group
(dummy) and confounders as independent variâtes was used to estimate the
training effects independent of changes in energy intake, fat intake, weight or
body fat during the intervention. Three men and 2 women of the intervention
group had missing values on the pre intervention lipid measurement and were
excluded. One woman and one man of the intervention group were excluded
from all analyses, because of extreme dieting and weight loss. Therefore
baseline data are presented for intervention group: 69 men and 67 women;
control group: 40 men and 46 women. Intervention effects, studied in the
subjects with complete follow up, included 51 men and 43 women of
intervention group and 38 men and 44 women of control group. Three subjects
were non fasting during the blood sampling and were excluded from data
analysis regarding triglycerides. Data-analyses were performed with SAS 6.09
(Statistical Analyses System; SAS Institute Inc. Cary, USA).
31
Chapter 2
RESULTS
Baseline results
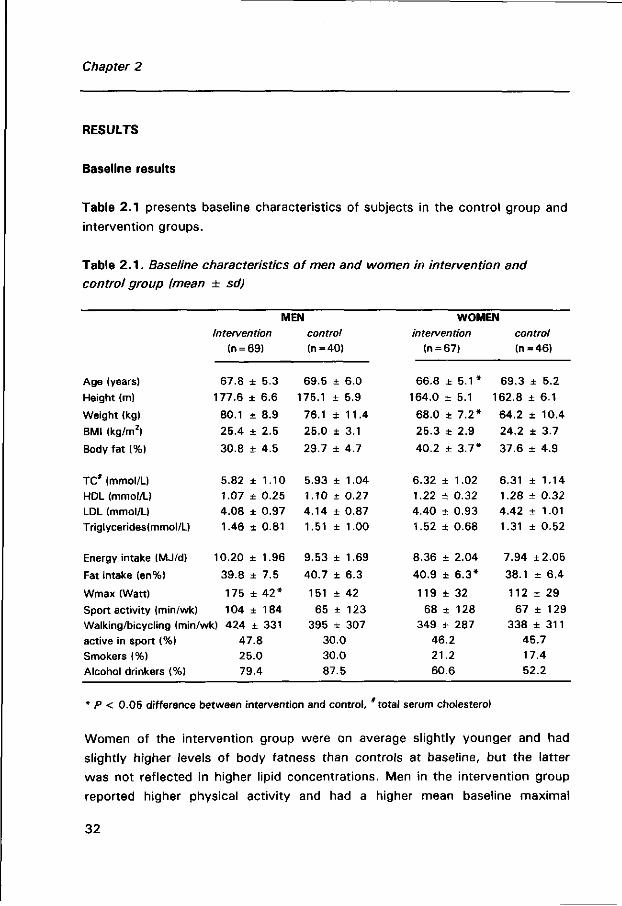
Table 2.1 presents baseline characteristics of subjects in the control group and
intervention groups.
Table 2 . 1 . Baseline characteristics of men and women in intervention and
control group (mean ± sd)
Age (years)
Height (m)
Weight (kg)
BMI (kg/m2)
Body fat (%)
TC* (mmol/L) HDL (mmol/L)
LDL (mmol/L) Triglycerides(mmol/L)
Energy intake (MJ/d)
Fat intake (en%)
Wmax (Watt)
Sport activity (min/wk)
MEN Intervention
(n = 69)
67.8 ± 5.3
177.6 ± 6.6
80.1 ± 8.9
25.4 ± 2.5
30.8 ± 4.5
5.82 ± 1.10 1.07 ± 0.25 4.08 ± 0.97
1.46 ± 0.81
10.20 ± 1.96
39.8 ± 7.5
175 ± 4 2 *
104 ± 184 Walking/bicycling (min/wk) 424 ± 331
active in sport (%) Smokers (%) Alcohol drinkers (%)
47.8 25.0 79.4
control (n=40)
69.5
175.1
76.1
25.0
29.7
5.93 1.10 4.14
1.51
9.53
40.7
151
65 395
± 6.0
± 5.9
± 1 1 . 4
± 3.1
± 4.7
± 1.04
± 0.27 ± 0.87
± 1.00
± 1.69
± 6.3
± 42
± 123 ± 307
30.0 30.0 87.5
WOMEN intervention
(n = 67)
66.8 ± 5 . 1 *
164.0 ± 5.1
68.0 ± 7 .2*
25.3 ± 2.9
40.2 ± 3 .7*
6.32 ± 1.02
1.22 + 0.32 4.40 ± 0.93 1.52 ± 0.68
8.36 ± 2.04
40.9 ± 6 .3*
119 ± 32
68 ± 128 349 ± 287
46.2 21.2
60.6
control (n = 46)
69.3 ± 5.2
162.8 ± 6.1
64.2 ± 10.4
24.2 ± 3.7
37.6 ± 4.9
6.31 ± 1.14 1.28 ± 0.32 4.42 ± 1.01
1.31 ± 0.52
7.94 ±2.05
38.1 ± 6.4
112 ± 29
67 ± 129 338 ± 311
45.7 17.4 52.2
* P < 0.05 difference between intervention and control, total serum cholesterol
Women of the intervention group were on average slightly younger and had
slightly higher levels of body fatness than controls at baseline, but the latter
was not reflected in higher lipid concentrations. Men in the intervention group
reported higher physical activity and had a higher mean baseline maximal
32
Body composition and serum lipids
exercise capacity than the men in the control group. The remaining characteris
tics were not significantly different between intervention and control group.
Nearly half of the population was already active in sport at baseline (46% of the
women and 4 1 % of the men). Subjects who were active in sport had a
significantly higher mean serum HDL cholesterol (mean 1.23, SE 0.03 vs mean
1.12, SE 0.03, P<0.01) and a significantly lower mean triglyceride
concentration (mean 1.33, SE 0.06 vs mean 1.57, SE 0.07, P<0 .05 ) .
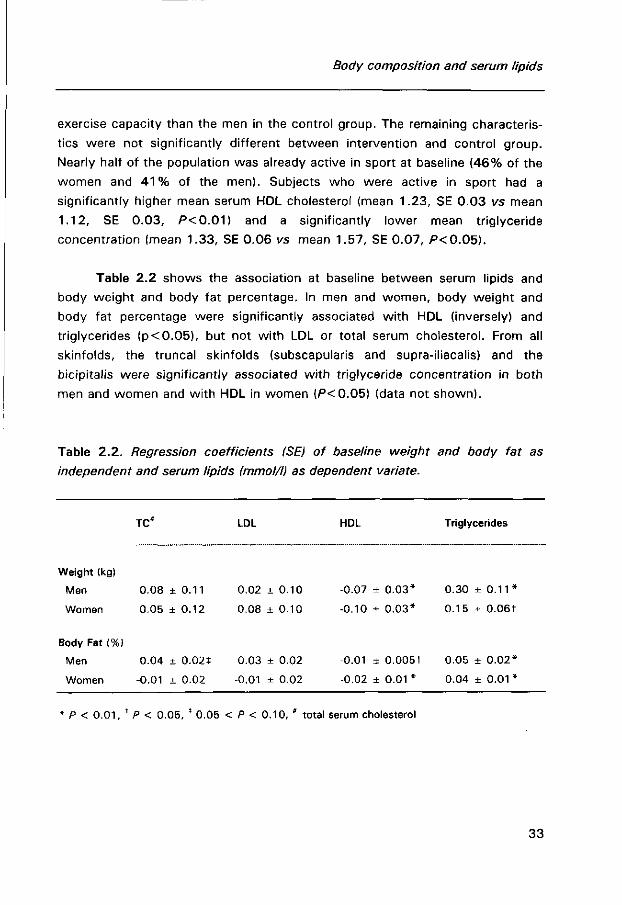
Table 2.2 shows the association at baseline between serum lipids and
body weight and body fat percentage. In men and women, body weight and
body fat percentage were significantly associated with HDL (inversely) and
triglycerides (p<0 .05) , but not wi th LDL or total serum cholesterol. From all
skinfolds, the truncal skinfolds (subscapularis and supra-iliacalis) and the
bicipitalis were significantly associated wi th triglyceride concentration in both
men and women and with HDL in women (P<0.05) (data not shown).
Table 2.2. Regression coefficients (SE) of baseline weight and body fat as
independent and serum lipids fmmol/l) as dependent variate.
TC* LDL HDL Triglycerides
Weight (kg)
Men
Women
Body Fat (%)
Men
Women
0.08 ± 0.11
0.05 ± 0.12
0.04 ± 0.02*
-0.01 ± 0.02
0.02 ± 0.10
0.08 ± 0 . 1 0
0.03 ± 0.02
-0.01 ± 0.02
-0.07 ± 0 .03* 0.30 ± 0 . 1 1 *
-0.10 ± 0 .03* 0.15 ± 0.06t
-0.01 ± 0.005t 0.05 ± 0 .02*
-0.02 ± 0 . 0 1 * 0.04 ± 0 . 0 1 *
* P < 0 .01, f P < 0.05, * 0.05 < P < 0.10, * total serum cholesterol
33
Chapter 2
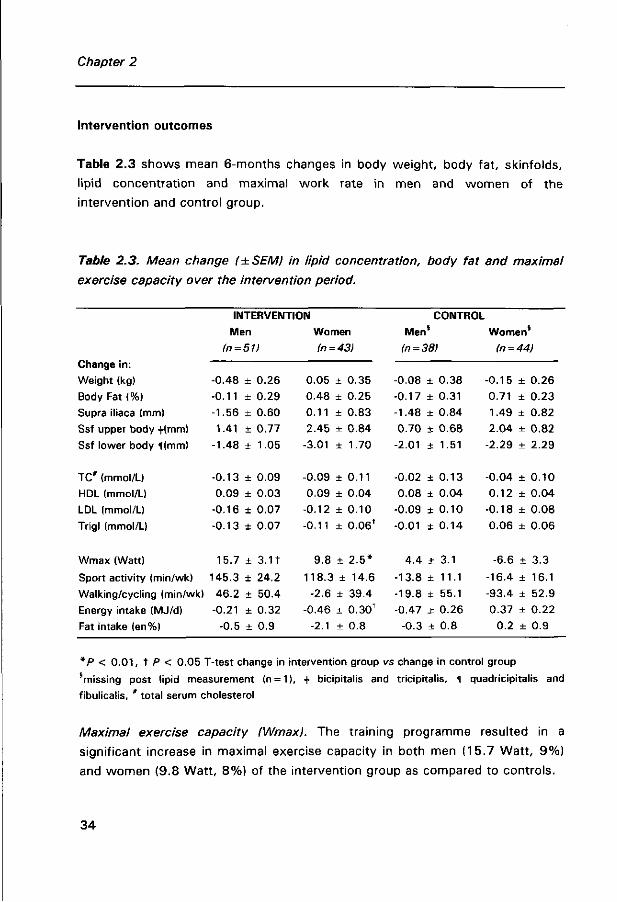
Intervention outcomes
Table 2.3 shows mean 6-months changes in body weight, body fat, skinfolds,
lipid concentration and maximal work rate in men and women of the
intervention and control group.
Table 2.3. Mean change (±SEM) in lipid concentration, body fat and maximal
exercise capacity over the intervention period.
Change in:
Weight (kg)
Body Fat (%)
Supra iliaca (mm)
Ssf upper body +(mm)
Ssf lower body 1(mm)
INTERVENTION
Men Women
(n = 51) (n = 43)
CONTROL
-0.48 + 0.26
-0.11 ± 0.29
-1.56 ± 0.60
1.41 ± 0.77
-1.48 + 1.05
0.05 ± 0.35
0.48 ± 0.25
0.11 ± 0.83
2.45 ± 0.84
-3.01 ± 1.70
Men' (n = 38)
Women (n = 44)
-0.08 ± 0.38 -0.15 ± 0.26
-0.17 ± 0.31 0.71 ± 0.23
-1.48 ± 0.84 1.49 ± 0.82
0.70 ± 0.68 2.04 ± 0.82
-2.01 ± 1.51 -2.29 ± 2.29
TC# (mmol/L)
HDL (mmol/L)
LDL (mmol/L)
Trigl (mmol/L)
-0.13 + 0.09 -0.09 ± 0 . 1 1 -0.02 ± 0.13 -0.04 ± 0.10
0.09 ± 0.03 0.09 ± 0.04 0.08 ± 0.04 0.12 ± 0.04
-0.16 ± 0.07 -0.12 ± 0.10 -0.09 ± 0.10 -0.18 ± 0.08
-0.13 ± 0.07 -0.11 ± 0.06' -0.01 ± 0.14 0.06 ± 0.06
Wmax (Watt) 15.7 ± 3.11 9.8 ± 2 .5*
Sport activity (min/wk) 145.3 + 24.2 118.3 ± 1 4 . 6
Walking/cycling (min/wk) 46.2 ± 50.4 -2.6 ± 39.4
Energy intake (MJ/d) -0.21 ± 0.32 -0.46 ± 0.30 t
Fat intake (en%) -0.5 ± 0.9 -2.1 ± 0.8
4.4 ± 3.1 -6.6 ± 3.3
-13.8 ± 11.1 -16.4 ± 16.1
-19.8 ± 55.1 -93.4 ± 52.9 -0.47 ± 0.26 0.37 ± 0.22
-0.3 ± 0.8 0.2 ± 0.9
*P < 0 .01, t P < 0.05 T-test change in intervention group vs change in control group
'missing post lipid measurement (n = 1 ), 4. bicipitalis and tricipitalis, 1 quadricipitalis and
fibulicalis, # total serum cholesterol
Maximal exercise capacity (Wmax). The training programme resulted in a
significant increase in maximal exercise capacity in both men (15.7 Watt, 9%)
and women (9.8 Watt, 8%) of the intervention group as compared to controls.
34
Body composition and serum lipids
Body weight and body fat. The subjects of the intervention group did not
significantly reduce their weight or skinfolds as compared with the controls.
The percentage of men who reduced their weight 1 kg or more, however, was
higher in the intervention groups (45.5%) than in the control group (23.7%)
(P = 0.03). In women this percentage was not significantly different, 36 .4% and
38 .6% respectively.
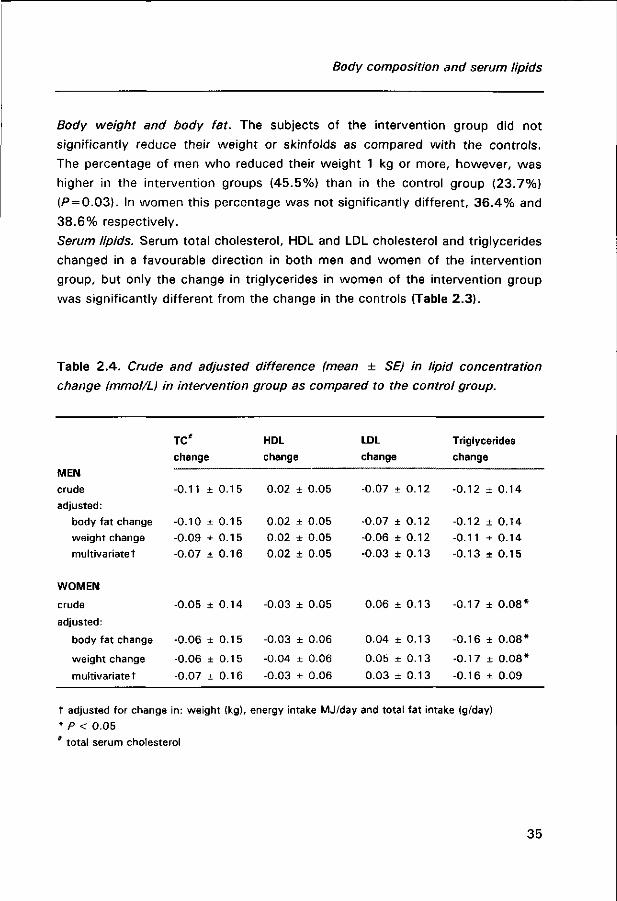
Serum lipids. Serum total cholesterol, HDL and LDL cholesterol and triglycerides
changed in a favourable direction in both men and women of the intervention
group, but only the change in triglycerides in women of the intervention group
was significantly different from the change in the controls (Table 2.3).
Table 2.4. Crude and adjusted difference (mean ± SE) in lipid concentration
change (mmol/L) in intervention group as compared to the control group.
MEN crude
adjusted:
body fat change
weight change
multivariatet
WOMEN
crude
adjusted:
body fat change
weight change
multivariatet
TC#
change
-0.11
-0.10
-0.09
-0.07
-0.05
-0.06
-0.06
-0.07
±
±
±
+
±
±
±
±
0.15
0.15
0.15
0.16
0.14
0.15
0.15
0.16
HDL
change
0.02
0.02
0.02
0.02
-0.03
-0.03
-0.04
-0.03
± 0.05
± 0.05
± 0.05
± 0.05
+ 0.05
± 0.06
± 0.06
± 0.06
LDL
change
-0.07
-0.07
-0.06
-0.03
0.06
0.04
0.05
0.03
± 0.12
+ 0.12
± 0.12
± 0.13
± 0.13
± 0.13
± 0.13
± 0.13
Triglycerides
change
-0.12
-0.12
-0.11
-0.13
-0.17
-0.16
-0.17
-0.16
± 0.14
± 0.14
± 0.14
+ 0.15
± 0 .08*
± 0 .08*
± 0 .08*
± 0.09
t adjusted for change in: weight (kg), energy intake MJ/day and total fat intake (g/day)
* P < 0.05
* total serum cholesterol
35
Chapter 2
The mean difference in lipid change between intervention and control group,
adjusted for change in weight or body fat percentage or change in weight,
energy intake and total fat intake is shown in Table 2.4. In general, effect of
training on lipid concentration was independent of changes in weight, body fat
or food intake. Only difference in LDL concentration change between interven
tion and control group was reduced in men and women after multivariate
adjustment. In women, the difference in total cholesterol change between
intervention and control group became slightly more pronounced after
adjustment, while in men the difference slightly decreased. Neither change in
weight, or body fat percentage, nor change in food intake were significantly
associated with a change in lipid concentration. In additional analyses, we
excluded subjects using cholesterol lowering drugs (n = 5) from all analyses.
Exclusion of these subjects, however, did not affect the outcome of the study.
DISCUSSION
In a group of apparently healthy Dutch men and women, 60 to 80 years old,
we found that a community based supervised exercise programme resulted in
small effects on body composition and blood lipids. A significant reduction in
triglycerides was found in women, but not in men. Serum HDL, LDL and serum
total cholesterol changed in a favourable direction in the intervention group, but
changes were not significantly different from the changes in the control group.
In this group of elderly subjects, training effects on lipids were not mediated by
changes in body weight or total body fat, as was suggested earlier, ' or by
changes in energy or fat intake.
Change in maximal capacity (9%) was somewhat lower than reported in
other studies. But since our group was not completely sedentary at baseline
(shown by the relatively high baseline values of maximal exercise capacity),
improvement in physical fitness was expected to be somewhat lower. Mean
increase in time spent on sport activity indicates that subjects of the interventi
on group did not exchange their old sport activities for the new training
programme. Also time spent on walking and bicycling did not decrease in the
intervention group. We may therefore conclude that the intervention programme
36
Body composition and serum lipids
was successfully followed and a considerable difference in activity with the
control group was achieved.
Selective study population and drop out
Our study population consisted of healthy elderly subjects. Not only were
subjects with cardiovascular disease excluded for reasons of protection, partici
pants were also more active than refusers. The participating subjects had
normal baseline lipid concentrations. Only 3% of the subjects had a serum total
cholesterol concentration above 8 mmol/L. As previously reported, subjects
with a raised lipid concentration tend to experience greater lipid alterations by
exercise than subjects who have normal lipid concentration.42 We therefore did
not anticipate exceptional changes in lipid concentration and the observed small
to moderate changes were probably more in the line of expectation. The health
related selection limits generalizability of our results, but does not violate the
validity of the study. A selective drop out during the intervention could,
however, have biased our results. Of the 229 men and women enrolled in the
intervention study, 46 dropped out (20%). Men who dropped out of the study
had a lower baseline serum total cholesterol concentration (mean 5.36 mmol/L
p<0 .05) and women who stopped prematurely gave themselves a lower score
for health status, had more symptoms of depression and were less active in
sport as compared to the subjects who completed the protocols (p<0 .05) .
Since we did not collect post-intervention blood samples of subjects who
dropped out during the intervention period, we reported on the effects of
training for those who were able and willing to complete the protocols. To
investigate possible bias by selective drop out we have applied a general linear
mixed model, which efficiently uses the full available data. This procedure
estimates mean effects, corrected for non-random missing data, using
maximum likelihood,43 hereby minimising possible bias in the results due to
selective drop out. The results of this procedure were very similar to the ones
reported. In fact, significant differences were even more strongly significant,
due to gain in efficiency. Therefore, we assume that drop out in our study has
not confounded the results to a great extent.
37

Chapter 2
Contamination of control group
An improvement in lifestyle (nutrition and physical activity) among subjects in
the control group, as a result from participating in a physical activity
intervention study can not be ruled out. Some of the participants were very
disappointed in being assigned to the control group and although mean activity
during intervention is slightly decreased in this group, it is still possible that
some subjects may have increased their activity pattern. To investigate a
possible contamination of the control group, we performed a regression analysis
in which the effect of change in time spent on sport activity (hour/wk) in the
past 6 months on lipid concentration and body weight was investigated,
disregarding the intervention assignment. This way changes in activity, relative
to baseline activity, for each subject in both control and intervention group
could be distinguished. The regression showed that 1 hour increase in sport per
week was associated with a significant decrease in serum total (men: -0.05
mmol/L, women -0.08 mmol/L) and LDL cholesterol (women -0.05 mmol/L)
(P<0.05) . Triglycerides were reduced in men (-0.03 mmol/L) and women (-0.01
mmol/L), but not significantly. Adjustment for change in weight (kg) or body fat
percentage, change in food consumptions and initial sport activity in the model
did not markedly affect the beta for change in sport activity in both men and
women. These results varied slightly from the results of the intervention per se,
especially regarding change in LDL and triglycerides concentration in women.
Increase in sport activity of 1 hour per week in the past 6 months was
associated with a reduction in weight of 0.15 kg/hour*wk" in men (P = 0.07)
and increase of 0.09 kg/hour*wk_1 in women (P = 0.40). No associations were
found in relation to body fat percentage.
Anthropometric measurements
In this study we used anthropometric measurements, which are relatively easy
to perform, cheap and feasible in large field studies. However, the accuracy of
predicting body fat from skinfolds is limited. Nearly all formulas underestimate
the percentage body fat,44 since they are based on young and middle-aged
subjects. The best predictor of body fat content in elderly people using
38
Body composition and serum lipids
anthropometric data seemed to be the equation of Durnin and Womersley37,
which was used in this study.44 Although pre- and post-measurements were
performed by one person, errors may have occurred in the estimated changes.
However, assuming non differentiality, this would merely cause an underesti
mation of the interrelationships.
Other training studies
Randomised intervention studies investigating the effect of training on lipid
concentration in healthy elderly subjects are far less in number than in middle
aged subjects. Most training studies in elderly are conducted in male and obese
subjects and little is known about training effects in non-obese healthy elderly
women. The diversity of training protocols (which are often combined wi th diet
intervention) and study populations makes it hard to compare our results wi th 33
other studies. A few studies, however, need to be mentioned. Hughes et al.
investigated the effect of exercise in glucose-intolerant older subjects, while
their weight was maintained. Like in our study, no significant effects on lipid
indexes were observed. The authors concluded that this might be due to the
lack of substantial weight loss. This assumption was, however, recently
contradicted by data from Fox et al.,A5 who studied the effect of diet and
exercise in moderately obese older women. Although body weight was signifi
cantly reduced in these women, no significant changes in blood lipid were
observed. Katzel et al.32 reported that obese men following an aerobic exercise
training did not significantly reduce body weight and did not beneficially change
their lipid levels, while men undergoing a weight loss intervention did. They also
reported that elderly men had smaller declines in triglycerides and total serum
cholesterol than middle aged had. King et al.11 showed that elderly subjects,
aged 50-65, increased HDL only after 2 years of regular moderate training.
They hypothesised that the time frame needed to achieve HDL changes may be
longer for elderly people than that reported previously for younger populations.
Also the intensity of a training programme is suggested as an important
determinant of lipid change.29,30 It was proposed that mainly vigorous exercise
training may enhance lipoprotein lipase activity (maybe through increase in
insulin sensitivity), which accelerates turnover of triglycerides and enhances
clearance of triglyceride rich lipoproteins. Training in our study consisted of
39

Chapter 2
exercise 3 to 4 times a week, for 40 minutes at about 7 0 % of their maximal
capacity. We believed that in this age group it was not feasible to make the
training programme more vigorous or longer. This would probably have affected
the compliance and increased drop out. This proved to be true for the partici
pants in the bicycle group, who found the programme hard to comply w i th,
especially in the second half of the intervention period. Also the higher drop out
caused by motivation problems in this group is in agreement with this.
A small decline in body weight and body fat percentage, as observed in
our study, was also reported earlier. Also greater effects on body composition
were found in men as compared to women. Women who follow a training
programme seem to preserve their energy balance more strongly than men.4 6 , 4 7
Westerterp et a/.46 proposed that women following a training programme may
compensate for the increased energy expenditure with an increase in energy
intake. This did not hold for the women of our study. In fact, women of the
intervention group had significantly reduced their energy intake, according to
the food frequency questionnaire. Probably, loss of fat mass coincided with
increase in muscle mass, resulting in a stable body weight.
In summary, in healthy elderly subjects, following a 6 months community based
intervention programme, a reduction in serum triglycerides (only in women
significant) and a trend towards improvement in HDL and total cholesterol was
observed (not statistically significant). Although small, the changes observed in
our study may be important in relation to cardiovascular risk. Recently,
Weijenberg et al.AB showed that both total cholesterol and serum HDL are still
important in predicting coronary heart disease in elderly men. They reported
that a 0.26 mmol/L increase in HDL was associated with 20% reduction in the
incidence of coronary heart disease, while a 1.00 mmol/L decrease in total
serum cholesterol was associated with 30% reduction in mortality from
coronary heart disease. Earlier, Zimetbaum et al. also showed that an
unfavourable lipoprotein profile at advanced age, still increased the risk of
cardiovascular morbidity and mortality in both men and women.
It remains to be solved whether a change in lipid concentration at older
age can still affect coronary risk. Apart from a possible preventive role in
hyperlipidemia and obesity, physical activity has undisputed positive effects on
40

Body composition and serum lipids
physical, social and emotional functioning. Especially in elderly people it seems
important for maintaining health and independence.
References
1. Novak LP, Aging, total body potassium, fat free mass and cell mass in males and females
between ages 18 and 85 years. J Geront 1972;438-443.
2. Enzi G, Gasparo M, Biondetti PR, Fiore D, Semisa M, Zurlo F. Subcutaneous and visceral
fat distribution according to sex, age and overweight, evaluated by computed tomography.
Am J Clin Nutr 1986;44:739-746.
3. Schwartz RS, Shuman WP, Bradbury VL, Cain KC, Fellingham GW, Beard JC, Kahn SE,
Stratton JR, Cerqueira MD, Abrass IB. Body fat distribution in healthy young and older
men. J Geront 1990;45:M181-M185.
4. Borkan GA, Hults DE, Gerzof SG, Robbins AH, Silben CK. Age changes in body
composition revealed by computed tomography. J Geront 1983;38:673-677.
5. Kohrt WM, Malley MT, Dalsky GP, Holloszy JO. Body composition of healthy sedentary
and trained young and older men and women. Med Sei Sports Exerc 1992;24:832-837.
6. Steen B. Body composition and aging. Nutr Rev 1988;46;45-51.
7. Kuczmarski RJ. Need for body composition information in elderly subjects. Am J Clin Nutr
1988;50;1150-1157.
8. Chumlea WC, Baumgartner RN, Garry PJ, Rhyne RL, Nicholson C, Wayne S. Fat
distribution and blood lipids in a sample of healthy elderly people. Int J Obesity
1992;16:125-133.
9. Ettinger WH, Wahl PW, Kuller LH, Bush TL, Tracy RP, Manolio TA, Borhani NO, Wong ND,
O'Leary DH. Lipoprotein lipids in older people: results from the cardiovascular health
study. Circulation 1992;86:858-869.
10. Campbell AJ, Busby WJ, Horwarth CC, Robertson MC. Relation of age, exercise,
anthropometric measurements and diet with glucose and insulin levels in a population aged
70 years and over. Am J Epidemiol 1993;138:688-696.
11. Stevens J, Gautam SP, Keil JE. Body mass index and fat patterning as correlates of lipids
and hypertension in an elderly, biracial population. J Geront 1993;48:M249-254.
12. Ward KD, Sparrow D, Vokonas PS, Willett WC, Landsberg L, Weiss ST. The relationships
of abdominal obesity, hyperinsulinemia and saturated fat intake to serum lipid levels: The
Normative aging study. Int J Obesity 1994;18:137-144.
13. Roberts SB, Young VR, Fuss P, Heyman MB, Fiatarone MA, Dallai GE, Cortiella J, Evans
WJ. What are the dietary energy needs of elderly adults? Int J Obesity 1992;16:969-976.
14. Haarbo J, Hassager C, Riis BJ, Christiansen C. Relation of body fat distribution to serum
lipids and lipoproteins in elderly women. Atherosclerosis 1989;80:57-62.
41
Chapter 2
15. Kaye SA, Folsom AR, Sprafka JM, Prineas RJ, Wallace RB. Increased incidence of diabetes
mellitus in relation to abdominal adiposity in older women. J Clin Epid 1991;44:329-334.
16. Davy KP, Evans SL, Stevenson ET, Seals DR. Adiposity and regional body fat distribution
in physically active young and middle age women. In J Obes 1996;20:777-783.
17. Poehlman ET, Toth MJ, Bunyard LB, Gardner AW, Donaldson KE, Colman E, Fonong T,
Ades PA. Physiological predictors of increasing total and central adiposity in aging men
and women. Arch Int Med 1995;155:2443-2448.
18. Kohrt WM, Obert KA, Holloszy JO. Exercise training improves fat distribution pattern in 60
to 70 years old men and women. J Geront 1992;47:M99-M105.
19. Reaven PD, McPhillips JB, Barrett-Connor EL, Criqui MH. Leisure time exercise and lipid
and lipoprotein levels in an older population. J Am Ger Soc 1990;38:847-854.
20. Meredith CN, Zackin MJ, Frontera WR, Evans WJ. Body composition and aerobic capacity
in young and middle-aged endurance-trained men. Med Sei Sports Exerc. 1987; 19:557-
563.
2 1 . Schwartz RS, Shuman WP, Larson V, Cain KC, Fellingham GW, Beard JC, Kahn SE,
Stratton JR, Cerquiera MD, Abrass I. The effect of intensive endurance training on body
fat distribution in young and older men. Metabolism 1991;40:545-551.
22. Evans WJ. Effects of exercise on body composition and functional capacity of the elderly.
J Geront 1995;50A: 147-1 50.
23. Sidney KH, Shepard RJ, Harrison JE. Endurance and body composition of the elderly. Am
J Clin Nutr 1977;30:326-333.
24. Campbell WV, Crim MC, Young VR, Evans WJ. Increased energy requirements and
changes in body composition with resistance training in older adults. Am J Clin Nutr
1994;60:167-175.
25. Houmard JA, McCulley C, Roy LK, Bruner RK, McCammon MR, Israel RG. Effects of
exercise training on absolute and relative measurement of regional adiposity. Int J Obesity
1994;18:243-248.
26. Haskell WL. The influence of exercise on the concentration of triglycerides and cholesterol
in human plasma. Exerc Sport Rev 1984;12:205-244.
27. King AC, Haskell WL, Young DR, Oka RK, Stefanick ML. Long term effects of varying
intensities and formats of physical activity on participation rates, fitness and lipoproteins
in men and women aged 50 to 65 years. Circulation 1995;91:2596-2604.
28. Ready AE, Drinkwater DT, Ducas J, Fitzpatrick DW, Brereton DG, Oades SC. Walking
program reduces elevated cholesterol in women postmenopause. Can J Cardiol
1995;11:905-912.
29. Wood PD, Haskell WL, Blair SN, Williams PT, Krauss RM, Lindgren FT, Albers JJ, Ho PH,
Farquhar JW. Increased exercise level and plasma lipoprotein concentrations: a one-year
randomized, controlled study in sedentary, middle aged men. Metabolism 1983;32:31-39.
30. Williams PT, Wood PD, Haskell WL, Vranizan K. The effect of running mileage and
duration on plasma lipoprotein levels. JAMA 1982;247:2674-2679.
3 1 . Tran ZV, Weltman A. Differential effects of exercise on serum lipid and lipoprotein levels
seen with changes in body weight. JAMA 1985;254:919-924.
42
Body composition and serum lipids
32. Katzel LI, Bleecker ER, Colman EG, Rogus EM, Sorkin JD, Goldberg AP. Effects of weight
loss vs aerobic exercise training on risk factors for coronary heart disease in healthy
middle-aged and older men, A randomized controlled trial. JAMA 1995;274:1915-1921.
33. Hughes VA, Fiatarone MA, Ferrara CM, McNamara JR, Charnley JM, Evans WJ.
Lipoprotein response to exercise training and a low-fat diet in older subjects with glucose
intolerance. Am J Clin Nutr 1994;59:820-826.
34. Williams PT, Wood PD, Krauss RM, Haskell WL, Vranizan KM, Blair SN, Farquhar JW.
Does weight loss cause the exercise-induced increase in plasma high density lipoproteins?
Atherosclerosis 1983;47:173-185.
35. Owens JF, Matthews KA, Wing RR, Kuller LH. Can physical activity mitigate the effects of
aging in middle aged women. Circulation 1992;85:1265-1270.
36. Blumenthal JA, Emery CF, Madden DJ, George LK, Coleman RE, Riddle MW, McKee DC,
Reasoner J, Williams RS. Cardiovascular and behavioral effects of aerobic exercise training
in healthy older men and women. J Geront 1989;44:M147-1 57.
37. Durnin JVGA, Womersley J. Body fat assessed from total body density and its estimation
from skinfold thickness: measurements on 481 men and women aged from 16 to 72
years. Br J Nutr 1974;32:77-97.
38. Lopez-Virella MF, Stone P, Ellis S, Colwell JA. Cholesterol determination in high-density
lipoproteins separated by three different methods. Clin Chem 1977;23:882-884.
39. Friedewald WT, Levy Rl, Frederickson DS. Estimation of the concentration of low-density
lipoprotein cholesterol in plasma, without use of preparative ultracentrifuge. Clin Chem
1985;31:499-502.
40. Caspersen CJ, Bloemberg BP, Saris WHM, Merritt R, Kromhout D. The prevalence of
selected physical activities and their relation with coronary heart disease risk factors in
elderly men: The Zutphen Study. Am J Epidemiol 1991;133:1078-1092.
4 1 . Feunekes GIJ, Staveren van WA, De Vries JHM, Burema J, Hautvast JGA. Relative and
biomarker-based validity of a food frequency questionnaire estimating intake of fats and
cholesterol. Am J Clin Nutr 1993;58:489-496.
42. Lokey EA, Tran ZV. Effects of exercise training on serum lipids and lipoprotein
concentration in women: a meta analysis. Int J Sports Med 1989;10:424-429
43. SAS Technical Report P-229. Changes and Enhancement. Release 6.07. Cary NC SAS
Institute Inc. 1992, 620 pp.
44. Visser M, Van den Heuvel E, Deurenberg P. Prediction equations for the estimation of
body composition in the elderly using anthropometric data. Br J Nutr 1994;71:823-833.
45. Fox AA, Thompson JL, Butterfield GE, Gylfadottir U, Moynihan S. Effects of diet and
exercise on common cardiovascular disease risk factors in moderately obese older women.
Am J Clin Nutr 1996;63:225-233.
46. Westerterp KR, Meijer GL, Janssen EME, Saris WHM, Ten Hoor F. Long term effects of
physical activity on energy balance and body composition. Br J Nutr 1992;68:21-30.
47. Després JP, Tremblay A, Nadeau A, Bouchard C. Physical training and changes in regional
adipose tissue distribution. Acta Med Scand 1988;723[suppl]:205-212.
43

Chapter 2
48. Weijenberg MP, Feskens EJM, Kromhout D. Total and high density cholesterol as risk
factors for coronary heart disease in elderly men during 5 years of follow-up. The Zutphen
Study. Am J Epidemiol 1996;143:151-158.
49. Zimetbaum P, Frishman WH, Lock Ooi W, Derman MP, Aronson M, Gidez LI, Eder HA.
Plasma lipids and lipoproteins and the incidence of cardiovascular disease in the very
elderly. The Bronx Aging Study. Arteriosclerosis and Thrombosis 1992;12:416-423.
44

CHAPTER 3
The effect of strenuous exercise on fibrinogen and
fibrinolytic factors in healthy elderly men and women
A J Schuit, EG Schouten, C Kluft, M de Maat, PPCA Menheere, FJ Kok
Thrombosis and Haemostasis: in press
45

Chapter 3
ABSTRACT
The elevated incidence of thrombotic disease in elderly people may be
associated wi th the increase in plasminogen activator inhibitor-1 (PAI-1) and
fibrinogen wi th ageing. Cross-sectional studies report an inverse relation of PAI-
1 and fibrinogen with physical activity, but training studies show inconsistent
results.
In a controlled intervention study among elderly subjects (aged 60-80
years) we observed a moderate decrease in PAI-1 antigen (4%, -2.1 ± 2.4
ng/mL), a significant increase t-PA activity ( 1 1 % , 0.07 ± 0.04 lU/mL) and an
unexpected significant increase in fibrinogen (6%, 0.18 ± 0.07 g/L) in subjects
following a 6 months intensive training programme as compared to controls.
Reduction in PAI-1 antigen was significantly associated with a decrease in
triglycerides (ß=10.3 ng/mL per 1 mmol/L, P<0.01) and insulin (ß = 2.37 ng/ml
per 1 mU/L, P = 0.07). Increase in fibrinogen coincided with a rise in C-reactive
protein (P<0.001) .
These data suggest that regular intensive activity may increase
fibrinolytic activity in a moderate way, but may also cause chronically elevated
plasma levels of acute phase proteins in elderly subjects.
46
Fibrinogen and fibrinolysis
INTRODUCTION
Atherosclerosis is a progressive condition of multifactorial origin. Of central
importance in its pathogenesis are disorders of lipid metabolism. In the last few
years, however, it has become evident that also haemostatic factors like
fibrinogen and plasminogen activator inhibitor (PAI-1) may be critically involved
in the process of atherogenesis and in subsequent thrombosis.1,2 Elevated
fibrinogen levels can affect atherogenesis by multiple processes, such as
formation and growth of arteriosclerotic lesions,3 proliferation and migration of
smooth muscle cells,4 '5 promotion of aggregation of activated platelets6 and
deterioration of the blood f low properties.7 PAI-1 plays a central role in
fibrinolysis, by its inhibitory binding to tissue type plasminogen activator (t-PA).
t-PA facilitates the conversion of plasminogen to plasmin, which degrades fibrin
clots and removes fibrin from the vascular wall.
PAI-1 is considered to be linked to symptoms of the insulin resistance
syndrome, such as overweight (central obesity), impaired glucose tolerance,
elevated blood pressure, increased VLDL and triglycerides and decreased HDL. 10 It has even been hypothesised that an increased PAI-1 level could be the link
between insulin resistance and coronary heart disease.11 A recent study in mice
suggested that adipose tissue itself may be an important contributor to the
elevated PAI-1 plasma levels in obese. Both PAI-1 and fibrinogen levels increase
with ageing,12,13 in women especially after the menopause. This rise may be
one of the explanations of the elevated incidence of thrombotic disease in
elderly persons.
Epidemiological cross-sectional studies have shown that active middle
aged persons have lower fibrinogen and PAI-1 levels as compared to non-active
persons.15,17 However, the few reported intervention studies in healthy
individuals18"22, mainly in middle aged men, generally failed to show an effect of
physical training on PAI-1 and f ibrinogen.19,21,23 One exercise intervention study
showed significant and pronounced beneficial changes in both fibrinogen and
fibrinolytic factors in healthy elderly men, but not in young men.18 However,
this study did not comprise a control group and the number of subjects was
rather low.
47
Chapter 3
It remains unclear whether the observed association between physical
activity with fibrinogen and fibrinolytic activity in cross-sectional studies was
confounded by physical fitness and health. To further explore a possible
beneficial role of exercise on coagulation and fibrinolysis in elderly people, we
investigated the effect of a 6 months intensive training programme on
fibrinogen, PAI-1 antigen and t-PA activity in a group of Dutch men and
women, aged 60 to 80, randomly assigned to an intervention group and control
group. In addition, we studied the relationship of levels of PAI-1, t-PA and
fibrinogen with characteristics of the insulin resistance syndrome, both cross-
sectionally and prospectively.
SUBJECTS AND METHODS
Subjects
829 independently living men and women, age 60 to 80, were requested via
their family physician to participate in a controlled intervention study on the
effect of exercise on cardiovascular risk factors. The general practitioners had
selected these elderly subjects according to the following inclusion criteria; no
myocardial infarction or stroke in the past two years, no insulin dependent
diabetes mellitus, no unstable angina pectoris and no heart failure or hyperten
sion. 152 men (44%) and 166 women (35%) volunteered to participate.
Compared to refusers, participants were somewhat younger and less frequently
considered themselves inactive as compared to their peers.
The volunteers were screened by a medical history questionnaire and a
physical examination, which comprised resting electrocardiogram and blood
pressure measurement. Subjects with no signs of cardiovascular disease under
went a graded maximal exercise test. Elderly people with signs of heart failure
or an ST-depression of more than 2 mm during the exercise test were excluded
from the study. As a results of the screening 39 men and 50 women were
excluded, leaving a group of 113 men and 116 women. Laboratory
measurements were performed in an aselect sample of 88 men and 94 women.
Informed consent with the procedures was obtained from each subject before
48
Fibrinogen and fibrinolysis
entry into the study. The experimental protocol was approved by the Medical
Ethics Committee of the Agricultural University Wageningen.
Randomisation and follow up
Men and women were randomly assigned to an exercise bicycle group (48 men
and 48 women) and a control group (40 men and 46 women). We assigned
slightly more subjects to the exercise bicycle group, because we expected a
higher drop out in this group. During the intervention period 12 men and 19
women stopped with the training programme, mainly due to lack of motivation
(50%) and medical reasons (40%). Drop out among the subjects of the control
group (2 men and 2 women) was caused by family circumstances. Fibrinogen,
PAI-1 antigen and t-PA activity were only determined in subjects who
completed the protocols (74 men and 72 women), and there were missing
values of 1 man and 1 woman, leaving us a study population of 73 men and 71
women.
Protocols and adherence
Subjects assigned to the exercise bicycle group received an exercise bike at
home, which had a pulse recording facility. They trained four times a week for
30 minutes during 6 months. The intensity of the training was based on the
maximal exercise test, which was administered at baseline. After a run-in period
of 4 weeks, the intensity increased from a heart rate corresponding to 50% of
their maximal work rate to a heart rate corresponding to 7 0 % of their
maximum. Adherence to the programme was checked with a cycling record.
Adherence to intensity, frequency and duration of training of subjects who
completed the programme was 97%, 86%, 9 4 % and 98%, 8 1 % , 8 4 % for men
and women respectively. Subjects in the control group were asked to maintain
their habitual activities, but were not discouraged from undertaking more
exercise.
49
Chapter 3
Maximal exercise capacity
Every subject underwent a graded maximal exercise test on an ergocycle before
and after the intervention period. The initial work load was 30 Watt for women
and 60 Watt for men. Every three minutes the work load was increased wi th 30
Watt. The test was stopped when a subject was exhausted or when there was
a medical indication for a premature halt. Maximal exercise capacity (Wmax)
was determined through interpolation, by summing up 10 Watt for every extra
full minute of cycling on a certain work load.
Anthropometry
Anthropometry was measured by the same person before and after
intervention. Body weight was measured on a calibrated weighing scale wi th
subjects wearing only light underwear. Body height was measured using a wall-
mounted measuring tape, the subject standing without shoes. Body mass index
(BMI) was calculated as weight divided by height squared (kg/m2).
Assays
Before and after the intervention period blood samples were drawn from all
participants without stasis between 9:00 and 10:00 AM after an overnight fast.
The volunteers were at least for twenty minutes at rest before the puncturing of
the ante-cubital vein. The subjects were required to abstain from smoking or
drinking tea or coffee in the morning of the venepuncture. All subjects had
refrained from alcohol consumption and strenuous activity the day before the
sampling. The last training in subjects of the intervention group was minimal 2
days before the venepuncture. This way acute effects of training, smoking or
alcohol consumption could be avoided.24 The first 5 ml of blood were used for
measuring lipids. Citrated blood, sampled for determination of fibrinogen, t-PA
and PAI-1 was put on melting ice and centrifuged for 30 minutes at 1800 x g at
4° C within one hour after venepuncture. Plasma aliquots were snapfrozen and
50
Fibrinogen and fibrinolysis
stored at -80°C. Plasma fibrinogen was determined by the method of Von
Clauss,25 using the reagents of Dade, by the MLA electra 1000C. PAI-1 antigen
was determined with Innotest of Innogenetics, Antwerp, Belgium and carried
out according to the manufacture procedure.26 t-PA was measured wi th bio-
functional immunosorbent assay (BIA) from Biopool, Umea, Sweden. C-reactive
protein (CRP) was determined with a home made enzyme immuno assay, using
antibodies from Dakopatts, Denmark and CRP standard serum of Behringwerke,
Marburg, Germany was used as calibrator. High density lipoprotein (HDL) was
measured according to the method of Lopez Virella27 and triglyceride
concentration via GPO-PAP method of Boehringer. Insulin has been measured
by radioimmunoassay using a commercially available insulin kit of Pharmacia
(Uppsala, Sweden). In addition to the manufacturers protocol, samples,
standards and controls are pre-treated with cold PEG 6000 (polyethyleneglycol)
in a 1 to 1 ratio in order to eliminate interference from (auto)insulin antibodies
or proinsulin. Mean inter-assay coefficient of variation was below 7%. Fasting
insulin was determined only in a subgroup (35 men, 28 women).
Data-analysis
Mean baseline concentration of fibrinogen, PAI-1 antigen, t-PA activity, insulin
and lipids were calculated for subjects in the intervention and the control group.
Baseline associations were investigated with linear regression analysis. In
addition, crude and adjusted mean differences in PAI-1 antigen, t-PA activity
and fibrinogen between elderly persons active in sport at baseline
(light/moderate and strenuous) and non-exercising elderly were calculated,
using regression analysis. Adjustment was made for age (5-year categories),
alcohol consumption (yes, no) and smoking (smoker, ex smoker, never smoker)
using indicator variables. Changes in PAI-1 antigen, t-PA activity, fibrinogen
and characteristics of the insulin resistance syndrome over the intervention
period were compared between the intervention and control group, using
Students t-test. In addition, we stratified the analysis for smoking habits,
engagement in sport at baseline and age (60-70 and 70-80 years).
51
Chapter 3
To investigate whether changes in the fibrinolytic factors and fibrinogen
coincided wi th changes in insulin resistance in subjects of intervention and
control group, we performed a regression analysis in which change in
fibrinolytic factors and fibrinogen were included as dependent variate and
intervention assignment and change in features of the insulin resistance
syndrome were included as independent variâtes. Mean baseline CRP, but not
mean change in CRP was logtransformed because of its skewed distribution.
The statistical package we used was SAS 6.09 (Statistical Analyses System;
SAS Institute Inc. Cary, USA).
RESULTS
Baseline data
Table 3.1 presents mean baseline characteristics of men and women in the
intervention and control group. Elderly persons of our study had normal mean
body mass index and lipid concentrations. No differences were observed
between men and women (intervention and control group combined) in mean
( ± SD) PAI-1 antigen (52.6 ± 29.2 and 52.8 ± 29.0 ng/mL respectively),
fibrinogen (3.19 ± 0.70 and 3.19 ± 0.52 g/L respectively) and t-PA activity
(0.64 ± 0.33 and 0.64 + 0.35 lU/mL respectively) (data not shown in table).
The study population comprised a rather large proportion of elderly persons
who were already engaged in sport activities at the study entry.
Table 3.2 shows the association between PAI-1, t-PA and fibrinogen on the one
hand and age, factors of the insulin resistance syndrome on the other. In this
elderly population PAI-1 antigen was positively associated with body mass
index, diastolic blood pressure, triglycerides, HDL (inversely), fasting glucose
and fasting insulin. In men (data not shown), PAI-1 antigen was also inversely
associated with physical fitness (ß = -1.5 ng/ml per 10 Watt increase). Although
less strongly than PAI-1 antigen, t-PA activity was inversely associated with
body mass index and diastolic blood pressure and positively associated with
HDL (particularly in women). Fibrinogen was related with HDL, fasting insulin
52
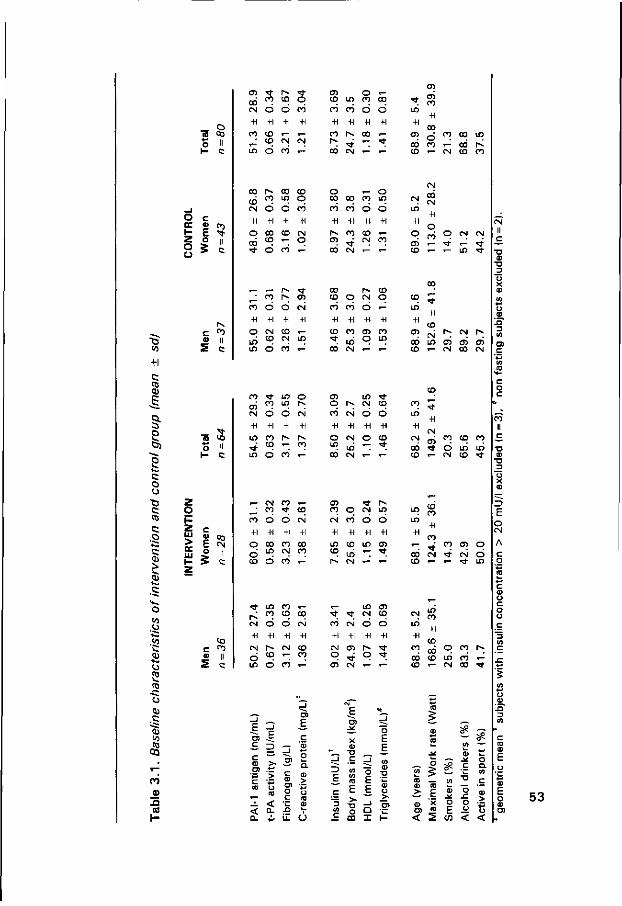
" G co
_ o <o 03 S ii 1 - c
CT) OD CM
+1
m ,J m
•* o
6 •H
CO CD Ó
r~ co
ó +l
i—
CM co
-̂O co
-H t—
CM
*-
<n co CÖ
+l
co p~ CO
tf) CÓ
+l
i^ ' t CM
O CO
ó +1
CO •-; *—
,_ CD
d +1
t—
' t
*—
• *
in
+i
co CO co
cr> co
+l
co d CO *—
O c ce u o, t E ^
o
o *
C P5
» || 2 c
co CO
+1
o
r~ oo co co m o d d co
oo ' t o
co CD CM CO T - O
o . - o co oo co m co co d o +i +i +i +i
CT) st 00 CM
CO CD i -CM CO
i n
+1
q CT) CD
« - CM CD CO
00 CM
"7
co
+i
q in
CO o +i
CM CO
O +l
CD CM
' t en CM
+1
in
oo CD
co
+i
CD ' t
O CO
+1 co
in'
CM o +i
CT)
q
CO o
«-+i
co in
CD in
+l CT) CO
+1 CO CM in
1 - ' t i n ^ t
CM co CM
CM II c
T) CD
• D D
O) c
C to
fe)
1 c o CJ
c CO
c
c
.CJ
cj
CO
• c c j Q) .C "53 <o
. S 0Q
CO
_ ;* ID Co O
I -
2 O
c « co E CN O II
co ' t m
öS n ^ CM O O
+1 +1 +1
in co r~ r-~ / co ^ co
CM CO CO > t
in CM co d co ^
CT)
q cö CM
+i +l
O CM " > Lri 00 CM
i n %t CM co
CT) CO o
CM CO
o +1
CO
CM i n
CD in co m CD
- t
CD -5 S 3
O)
E
o a.
E "_
x E
•D E
E E -L < < D- ._ a- ^ U- O
(0 •— >• . -^ £ ca x
co i n
+1
CT)
co co
II c
' t
CM
+1
CM
d m
in co O +1
p~ CD
d
co CD O +1
CM
CÓ
00 CM
+1
CD co
5 co
+1
CM
q CT)
' t CM
+1
CT) ' t CM
in CM
o +1
q
CD CD
o +1
' t ' t
CM in
+l co
CÓ co
1 0 +l
T ' t 00 CM
i n co
. - CM CD ' t
13 E o CM
CM O ^ - i n
oo co in co <-
to w
_ tü o -e "c ^ - 'I co (ü
- I 0) X O) 'S < 2
0) o -if . c o o E £
C/) <
co
3
53
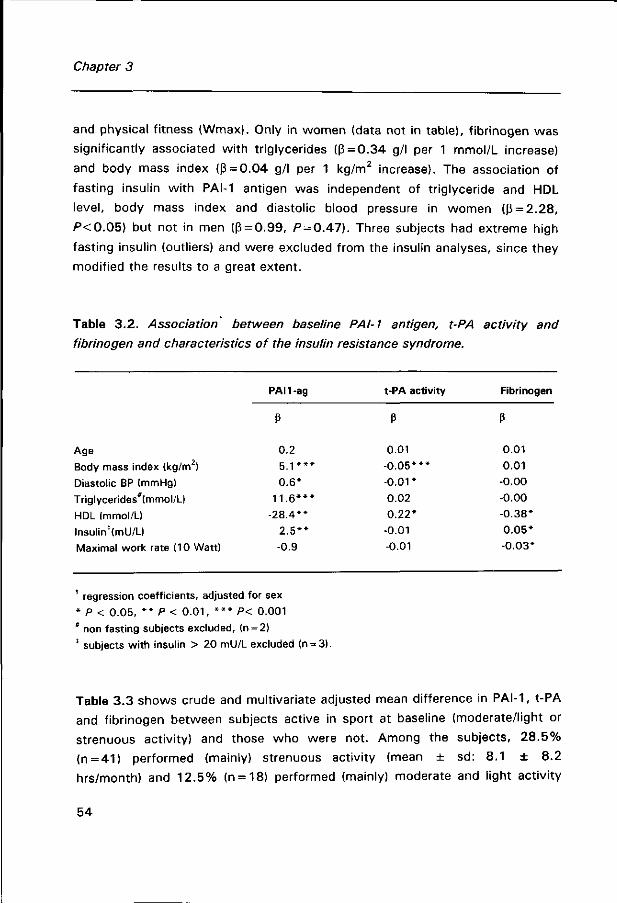
Chapter 3
and physical fitness (Wmax). Only in women (data not in table), fibrinogen was
significantly associated with triglycerides (ß = 0.34 g/l per 1 mmol/L increase)
and body mass index (ß = 0.04 g/l per 1 kg/m2 increase). The association of
fasting insulin with PAI-1 antigen was independent of triglyceride and HDL
level, body mass index and diastolic blood pressure in women (ß = 2.28,
P<0 .05) but not in men (ß = 0.99, P = 0.47). Three subjects had extreme high
fasting insulin (outliers) and were excluded from the insulin analyses, since they
modified the results to a great extent.
Table 3 .2. Association^ between baseline PAI-1 antigen, t-PA activity and
fibrinogen and characteristics of the insulin resistance syndrome.
Age
Body mass index (kg/m )
Diastolic BP (mmHg)
Triglycerides*(mmol/L)
HDL (mmol/L)
lnsulin'(mU7L)
Maximal work rate (10 Watt)
PAI1-ag
P
0.2
5 . 1 * * *
0.6*
11 .6 * * *
-28.4**
2 .5**
-0.9
t-PA activity
ß
0.01
-0 .05***
-0 .01*
-0.02
0.22*
-0.01
-0.01
Fibrinogen
P
0.01
0.01
-0.00
-0.00
-0.38*
0.05*
-0.03*
' regression coefficients, adjusted for sex
* P < 0.05, * * P < 0 .01, * * * P< 0.001
* non fasting subjects excluded, (n = 2)
* subjects with insulin > 20 mU/L excluded (n = 3).
Table 3.3 shows crude and multivariate adjusted mean difference in PAI-1, t-PA
and fibrinogen between subjects active in sport at baseline (moderate/light or
strenuous activity) and those who were not. Among the subjects, 28 .5%
(n = 41) performed (mainly) strenuous activity (mean ± sd: 8.1 ± 8.2
hrs/month) and 12.5% (n = 18) performed (mainly) moderate and light activity
54
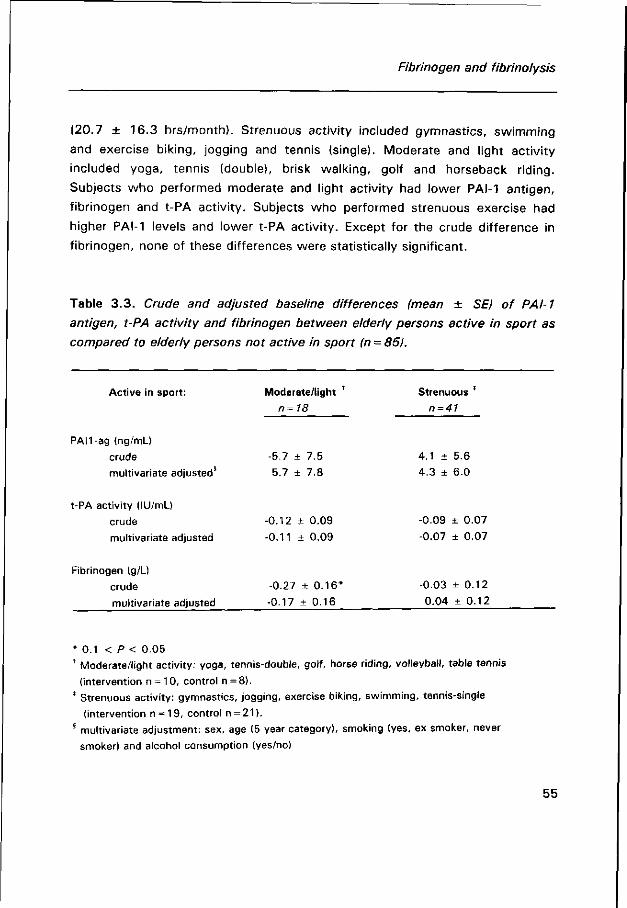
Fibrinogen and fibrinolysis
(20.7 ± 16.3 hrs/month). Strenuous activity included gymnastics, swimming
and exercise biking, jogging and tennis (single). Moderate and light activity
included yoga, tennis (double), brisk walking, golf and horseback riding.
Subjects who performed moderate and light activity had lower PAI-1 antigen,
fibrinogen and t-PA activity. Subjects who performed strenuous exercise had
higher PAI-1 levels and lower t-PA activity. Except for the crude difference in
fibrinogen, none of these differences were statistically significant.
Table 3.3. Crude and adjusted baseline differences (mean ± SE) of PAI-1
antigen, t-PA activity and fibrinogen between elderly persons active in sport as
compared to elderly persons not active in sport (n = 85).
Active in sport:
PAH-ag (ng/mL)
crude
multivariate adjusted
t-PA activity (lU/mL)
crude
multivariate adjusted
Fibrinogen (g/L)
crude
multivariate adjusted
Moderate/light '
n=18
-5.7 ± 7.5
-5.7 ± 7.8
-0.12 ± 0.09
-0.11 ± 0.09
-0.27 ± 0.16*
-0.17 ± 0.16
Strenuous *
n=41
4.1 ± 5.6
4.3 + 6.0
-0.09 + 0.07
-0.07 ± 0.07
-0.03 ± 0.12
0.04 ± 0.12
* 0.1 < P < 0.05 * Moderate/light activity: yoga, tennis-double, golf, horse riding, volleyball, table tennis
(intervention n = 10, control n = 8).
* Strenuous activity: gymnastics, jogging, exercise biking, swimming, tennis-single
(intervention n = 19, control n = 21). 8 multivariate adjustment: sex, age (5 year category), smoking (yes, ex smoker, never
smoker) and alcohol consumption (yes/no)
55
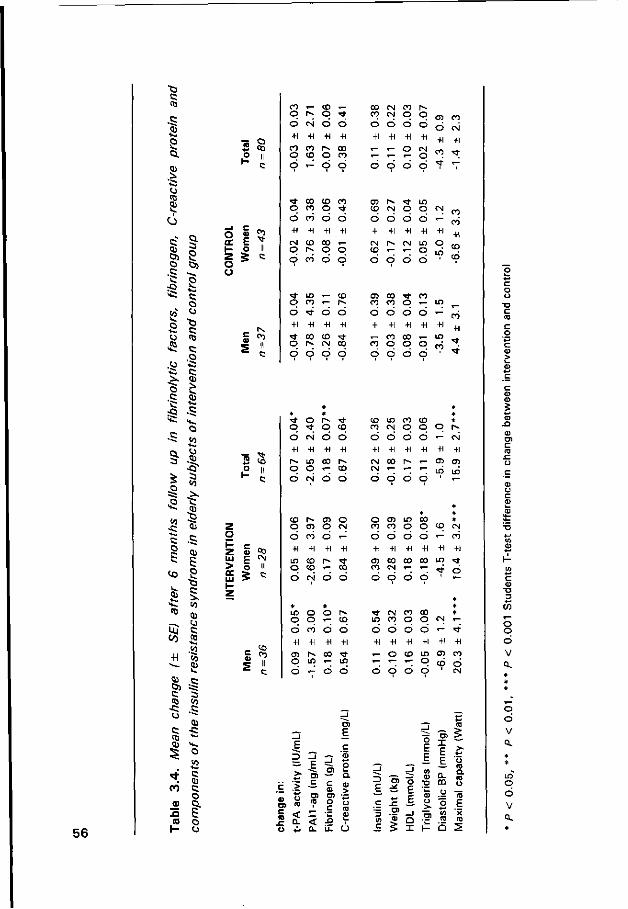
•G C (0
.C
Ä S
> -a u «3
S I
c Ol o .c
o
Ci
-H
1 o u "Ö c to c .o c CD
:Q -S * 's.
•s s •s <0
à I H«. t/J
Uj c
55 s. .=
P )
0)
(0
5 6
O
c Oj
c
I O
3 § p II
£ en E * o II
> oc
03 CM
«3 CO II C
co • -q r̂ ó esi +i +i
co co O co
oo CN m CO C N O
Ö Ó Ó
+1 +1 +1
«- «- o
en co Ó CN
o o
n- oo co co O CO O "*
o o o o
cn r^ CO CN O O CN
o co +i +i
o o +1 +1
CN CD 00 T -o r» o o
o o o o +1 +1 +1 +1
CM r-~ cN m • - o
O CO o o o o o o
LO «-co <-
m co * n co co o * - LO
II
o +1
< * o
• *
+1 00
o +i
co CN
O
+1
00
o +1
èo
o +1
co o
o +1
oo o
o +1
o
.-+1
LO
co
3 S ° II
o +1 r~ o
CN
+1 LO O
O +1 co *"
o +1 r» co
o +i CM CN
o +1 oo "~
o +1 r~ *~
o +1
*"
«-+1 CD
i n
CN
+1 en LO
o O O o
>* o r> <* o ' t o co
o o o o
co
+1
' t
co in co CD CO CN O O O
O CN O O
CD l>» 05 o o en o CN
o o o o
O Cl U) B) co co o o
co o +1 +1
o o o +1 +1 +1
o «- co +1 +1 +1
LO co O CO r-Ó CN Ó O
oo en co co oo to ^ n. ™ r T <* 6 O O O O ' <-
iß o o r> O O T- CO
»fr CN CO 00 LO co o o CN
o co +1 +1
o o +1 +1
i"» oo LO • -
O r- O O
o o o o •- "tf +1 +1 +1 +1 +1 +1 * - o co to en co
co ó o 6 o 6 ó CN
_ l E 2
4-<
> o ra
<r n
_i E ra c ra ra
< 0.
5 Ol c CU O) o Ç
n Li.
ra E c S3 o o . 0>
o ra co
U
_ i
3 E
"3 Ui c
CD
ra
£
j
"5 F E
_i r ï I
_i
ö E
co
o
1-
ra E E
a. m o o CA
O
ra
>-*̂ ' o co ra o ra E X
^
- o
CO CU
c o
" O 3
O o 6 v o.
o 6 v o.
LO o 6 v Q.
Fibrinogen and fibrinolysis
Changes during intervention
Table 3.4 shows the mean change in the acute phase proteins, physical fitness
and some characteristics of the insulin resistance syndrome for men and
women in intervention and control group. Subjects of the intervention group
significantly increased their physical fitness, men with 12% and women with
8%. Also, t-PA activity was significantly increased among subjects of the
intervention group compared to the change in the control group. Mean PAI-1
antigen was modestly decreased in the subjects of the intervention group. The
greatest decrease was observed in women who were inactive before the
intervention (13%, -7.6 ± 5.9 ng/mL). Mean change in PAI-1 antigen was
however not significantly different from the changes in the controls.
Unexpectedly, fibrinogen was significantly increased in subjects of the
intervention group as compared to the controls, notably among men aged 70 to
80 (mean 0.25 ± SE 0.25 mg/L) and women, who were previously not active
in sport (mean 0.34 ± SE 0.14 mg/L). Note, however, that increase in
intervention men was smaller than the fall in the controls. Effects of training
were not different among smokers as compared to non smokers (data not
shown).
Table 3.5 shows the crude and multivariate adjusted mean difference in PAI-1
antigen, t-PA activity and fibrinogen between the intervention and control group
(ß of intervention). The multivariate adjusted regression coefficients of
intervention are attenuated for PAI-1 antigen as compared to the crude
coefficients, indicating a possible mediating role of the adjusting factors in the
training response. Change in triglycerides was significantly associated wi th
change in PAI-1 antigen (P < 0.01). Increase in fibrinogen was significantly
associated with a decrease in HDL. The latter association attenuated after
inclusion of change in C-reactive protein (a marker of inflammation and a
possible marker for atherosclerosis) in the model, which itself was highly
correlated with fibrinogen change. Adjustment did not affect the observed
difference in change of t-PA activity in intervention and control group.
57
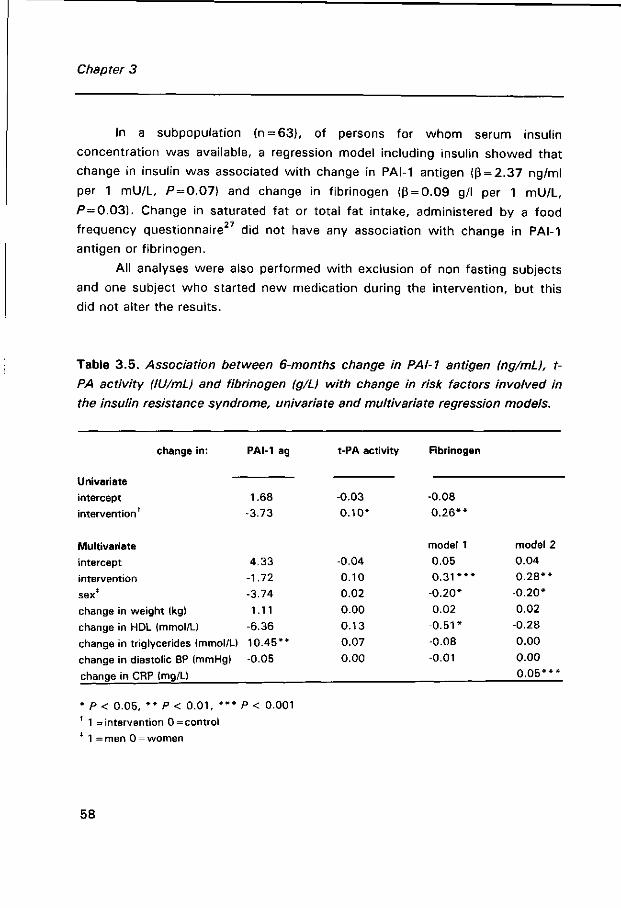
Chapter 3
In a subpopulation (n = 63), of persons for whom serum insulin
concentration was available, a regression model including insulin showed that
change in insulin was associated wi th change in PAI-1 antigen (ß = 2.37 ng/ml
per 1 mU/L, P = 0.07) and change in fibrinogen (ß = 0.09 g/l per 1 mU/L,
P = 0.03). Change in saturated fat or total fat intake, administered by a food
frequency questionnaire27 did not have any association with change in PAI-1
antigen or fibrinogen.
All analyses were also performed with exclusion of non fasting subjects
and one subject who started new medication during the intervention, but this
did not alter the results.
Table 3.5. Association between 6-months change in PAI-1 antigen (ng/mL), t-
PA activity (lil/mL) and fibrinogen (g/L) with change in risk factors involved in
the insulin resistance syndrome, univariate and multivariate regression models.
change in:
Univariate intercept
intervention
Multivariate
intercept
intervention
sex*
change in weight (kg)
change in HDL (mmol/U
change in triglycerides (mmol/U
change in diastolic BP (mmHg)
change in CRP (mg/L)
PAI-1 ag
1.68
-3.73
4.33
-1.72
-3.74
1.11
-6.36
10.45**
-0.05
t-PA activity
-0.03
0.10*
-0.04
0.10
0.02
0.00
0.13
0.07
0.00
Fibrinogen
-0.08
0 .26**
model 1
0.05
0 . 3 1 * * *
-0.20*
0.02
-0 .51*
-0.08
-0.01
model 2
0.04
0 .28**
-0.20*
0.02
-0.28
0.00
0.00
0 .05* * *
* P < 0.05, * * P < 0 .01, * * * P < 0.001
' 1 = intervention 0 = control
* 1 =men 0 = women
58
Fibrinogen and fibrinolysis
DISCUSSION
Several studies have identified increased fibrinogen and PAI-1 as predictors of
coronary heart disease in healthy subjects ' ' and patients. ' Both factors
attribute to risk similar to serum total cholesterol. In a controlled intervention
study among elderly people we observed that a 6 months training programme
resulted in a moderately increased fibrinolytic activity (decrease in PAI-1 antigen
and increase in t-PA activity) in both men and women of the intervention group.
Reduction in PAI-1 was significantly associated with a decrease in triglycerides.
Unexpectedly, fibrinogen was significantly increased in elderly subjects
following the exercise programme, especially in women not previously engaged
in sports. Increase in fibrinogen was significantly associated with a rise in C-
reactive protein, which suggests a contribution of an acute phase response.
The cross sectional analysis showed a lower fibrinogen level in subjects active
in moderate sport at baseline, but correction for age, smoking and alcohol
consumption attenuated the difference.
The selective nature of our study population (41 % was active in sport at
baseline) limits generalizability of the results. It is, however, neither feasible nor
ethical to conduct a 6 months intervention study among less f it elderly
subjects, who are more prone to risk of coronary heart disease and sport
injuries. Also in our study less fit elderly had more problems with adherence to
the programme and were more prone to drop out. Unfortunately, we do not
have information on fibrinogen or fibrinolytic factors in subjects who dropped
out of the study and we do not know whether this selective drop out may have
confounded the association. Since greater effects are expected in less fit
elderly, we assume that this selective drop out may have caused an
underestimation of the effect.
Fibrinogen
Until now cross-sectional studies gave strong indication for an inverse
relationship between exercise and fibrinogen and also in patients beneficial
59

Chapter 3
effects of training were observed.33 However, most training studies in healthy
persons failed to observe a significant training effect on f ibrinogen,19,21 except
for Stratton et al.,}8 who did find a reduction in fibrinogen in elderly men
undertaking strenuous exercise. These men, however had extremely high
fibrinogen levels (3.57 ± 0.79 g /L) and regression to the mean could have
played a role. In our study, the observed increase in fibrinogen was apparent in
most subjects of the intervention group and not caused by a few outliers.
Although unexpected, our results are not completely opposite to
previously reported studies. Ponjee et al.2Z also observed a significant increase
in fibrinogen of 0.78 g/L in middle aged subjects preparing for running half a
marathon. Recently, Montgomery et al}6, reported an increase in fibrinogen, in
men two days after a very strenuous training programme, which gradually
declined after four days. This increase was thought to be due to an 'acute
phase response' to the strenuous exercise. Earlier Weight et a/.35 reported
increases in fibrinogen and CRP, 48 hours after extreme exercise in competitive
distance runners. Although the activity level in our group was not as strenuous
as mentioned in the study of Montgomery, it is possible that less intensive
bouts of exercise already lead to elevated acute phase protein levels in elderly
persons. The longer recovering process in elderly as compared to middle aged
and young subjects, may prolong the acute phase response and consequently
may lead to chronically elevated acute phase protein levels when they exercise
intensively on a regular base. (Note that subjects with arthritis did not have
higher baseline concentration of CRP or fibrinogen, nor did they have a larger
increase in these proteins after exercise intervention). The study of Rankinen et
al.,™ in which subjects who exercised 6 times a week for 6 months had an
increase in fibrinogen, while those who exercised less had a decrease in
fibrinogen (not significant), is in line with this hypothesis. Also our baseline data
suggest more favourable effects of moderate exercise than strenuous exercise.
Moderate activity was, however, performed more frequently and over a longer
period of time than strenuous exercise. In contrast wi th our baseline results,
Connelly et al.36 reported significantly lower fibrinogen levels in subjects
performing strenuous exercise than mild exercise.
Another possible explanation for the observed elevated levels of
fibrinogen and CRP in our study (although less likely) may be that these are a
60
Fibrinogen and fibrinolysis
consequence of regression of atherosclerosis induced by training. The repair
process, during atherosclerotic regression, may be accompanied by increases in
pro-inflammatory proteins, such as fibrinogen and CRP. Reason for not
observing significant changes in CRP in the intervention group may be due to
the short half life of CRP (6 hrs) as compared to fibrinogen (2.5 days). Finally,
next to physical stress, the exercise programme could also have caused
psychological stress, which is also related to increased levels of f ibrinogen.37,38
Clearly, more research is needed to clarify effects of training on fibrinogen.
Present knowledge does not provide sufficient proof that elderly persons should
avoid high intensity activity.
PAI-1 antigen and t-PA activity
Subjects in our intervention group had an increased fibrinolytic potential after 6
months training, due to a beneficial shift in PAI-1 and t-PA, which may be a
result of a reduced formation of t-PA/PAI-1 complexes. Our results are in line
with earlier described studies, although less convincing. Ponjee et al.22 found a
75% reduction in PAI-1 antigen in 34 sedentary men and women who had been
training for 36 weeks. Stratton et al.}B observed a reduction in PAI-activity
(58%) and increase in t-PA activity (141%) in 13 elderly men following a 6
months intensive training programme.
Contrary to participants in these studies, our group of elderly was not
completely sedentary at baseline. In fact, 4 1 % of our population was already
engaged in sport activities. When we included solely sedentary subjects in our
analysis, greater training effects were observed, especially in women. Still,
some other training studies did not find any effect on fibrinolytic activity. In the
mentioned study of Stratton, an intensive training programme did not affect
fibrinolysis in young males. Also De Geus et al.20, Rankinen et al.19 and
Anderssen et al.21 did not observe significant changes in fibrinolytic factors in
response to a training programme. Yet, the intensity and frequency of the
training programmes of these studies was similar to our study (De Geus: 2.5
hours per week 7 0 % of maximal exercise capacity, Rankinen: 2 to 6 times a
61
Chapter 3
week on an intensity of 55 to 65% of V02max, Anderssen: 3 times a week 60-
8 0 % of peak heart rate). The different study designs and populations make
comparisons difficult and so far no conclusive statement can be made on the
relationship between physical activity and fibrinolysis.
Relationship between fibrinogen, PAI-1 antigen and insulin resistance
In this study we were interested in the question whether changes in fibrinogen
and fibrinolytic activity induced by training were accompanied by changes in
features of the insulin resistance syndrome. Various studies have reported an
association between PAI-1 and fibrinogen with triglycerides, HDL and diastolic
blood pressure, but failed to show an independent association with insulin
sensitivity or glucose tolerance.39,4° Our study confirmed the association
between the acute phase proteins and body mass index, triglycerides, HDL and
diastolic blood pressure in an elderly population, but the associations were
stronger in women than in men. This might be explained by 1) greater inter
person variation of insulin resistance in women, leading to increased statistical
discrimination 2) a possible higher prevalence of insulin resistance in women.
Decrease in PAI-1, was accompanied by a reduction in triglycerides
(significant), body mass and insulin and an increase with HDL, indicating a
possible mediating role of insulin resistance in the association between physical
activity and PAI-1. Until now only a few other studies have looked into the 20 22 41 22
interrelationship between the changes in these properties. ' ' Ponjee et al 20
and the Geus et al. do not find a relationship between training induced
changes in PAI-1 and maximal oxygen consumption, diastolic blood pressure,
lipids and body fat. Boman et al.,4} on the other hand, observed a significant
reduction in PAI-1 in subjects doing a 14-day skiing tour, which appeared to be
mediated through change in body fat mass and increased insulin sensitivity.
In summary, the present data suggest beneficial effects of physical training on
fibrinolysis. Fibrinogen and CRP were, however, elevated in subjects following
the intervention programme. It is unclear whether this represents a favourable
or an unfavourable effect. Since increase in fibrinogen coincided with an
62
Fibrinogen and fibrinolysis
increase in fibrinolytic activity, there is not sufficient reason to expect higher
coagulability in these elderly. Possibly a shift in the balance between
coagulation and fibrinolysis has occurred. This shift may provide a quicker
response to vessel damage, without higher risk of thrombus formation. Since
increase in fibrinogen seems to occur particularly after strenuous exercise, at
present the only safe recommendation for elderly people seems to be to
perform moderate exercise on a regular basis.
References
1. Ernst E. Fibrinogen as a cardiovascular risk factor: a meta-analysis and review of the
literature. Ann Int Med 1993;118:956 :963.
2. Eriksson P, Kallin B, van 't Hooft FM, Bavenholm P, Hamsten A. Allele-specific increase in
basal transcription of the plasminogen-activator inhibitor 1 gene is associated with
myocardial infarction. Proc Natl Acad Sei U S A 1995;92:1851-1855.
3. Qizilbash N, Jones L, Warlow CH, Mann J. Fibrinogen and lipid concentrations as risk
factors for transient ischaemic attacks and minor ischaemic strokes. Br Med J
1991;303:605-609.
4. Ishida T, Tanaka K. Effect of fibrin and fibrinogen-degradation products on the growth of
rabbit aortic smooth muscle cells in vitro. Atherosclerosis 1982;44:161-174.
5. Naito M, Hayashi T, Kuzuya M, Funaki C, Asai K, Kuzuya F. Effects of fibrinogen and fibrin
on the migration of vascular smooth muscle cells in vitro. Atherosclerosis 1990;83:9-14.
6. Peerschke EIB. The platelet fibrinogen receptor. Sem Haem 1985;23:241-259.
7. Leschke M, Blanke H, Styellwaag M, Motz W, Strauer BE. Hyperfibrinogenämie und
pathologische Plasmaviskosität. Dtsch Med Wsch 1988;113:1175-1181.
8. Krobot K, Hense HW, Cremer P, Eberle E, Keil U. Determinants of plasma fibrinogen:
relation to body weight, waist-to-hip rate, smoking, alcohol, age and sex. Arteriosclerosis
and Thrombosis 1992;12:786-788.
9. Folsom AR, Wu KK, Davis CE, Conlan MG, Sorlie PP, Szklo M. Population correlated of
plasma fibrinogen and factor VII, putative cardiovascular risk factors. Atherosclerosis
1991;91:191-205.
10. Cigolini M, Targher G, Seidell JC, Schiavon R, Manara F, Zenti MG, Mattioli C, De Sandre
G. Relationships of plasminogen activator inhibitor-1 to anthropometry, serum insulin,
triglycerides and adipose tissue fatty acids in healthy men. Atherosclerosis 1994; 106:139-
147.
11. Vague P, Raccah D, Scelles V. Hypofibrinolysis and the insulin resistance syndrome. Int J
Obesity 1995;19:911-915.
63
Chapter 3
12. Mehta J, Mehta P, Dawson D, Saldeen T. Plasma tissue plasminogen activator inhibitor
levels in coronary artery disease: correlation with age and serum triglyceride concentration.
J Am Coll Cardiol 1987;9:263-268.
13. Aillaud MF, Pignol F, Alessi MC, Harle JR, Esconde M, Mongin M, Juhan-Vague I. Increase
in plasma concentration of plasminogen activator inhibitor, fibrinogen, von Willenbrand
factor, factor VII:C and in erythrocyte sedimentation rate with age. Thrombosis and
Haemostasis 1986;55:330-332.
14. Lindoff C, Petersson F, Lecander I, Martinsson G, Astedt B. Passage of menopause is
followed by haemostatic changes. Maturitas 1993;17:17-22.
15. Rankinen T, Rauramaa R, Väisänen S, Penttilä IM, Uusitupa M. Relation of habitual diet and
cardiorespiratory fitness to blood coagulation and fibrinolytic factors. Thrombosis and
Haemostasis 1994;71:180-183.
16. Szymanski LM, Pate RR. Fibrinolytic responses to moderate intensity exercise, comparison
of physically active and inactive men. Arteriosclerosis and Thrombosis 1 994; 14:1746-
1750.
17. Lakka TA, Salonen JK. Moderate to high intensity conditioning leisure time physical activity
and high cardiorespiratory fitness are associated with reduced plasma fibrinogen in eastern
finnish men. J Clin Epidemiol 1993;46:1119-1127.
18. Stratton JR, Chandler WL, Schwartz RS, Cerquiera MD, Levy WC, Kahn SE, Larson VG,
Cain KC, Beard JC, Abrass IB. Effect of physical conditioning on fibrinolytic variables and
fibrinogen in young and old healthy adults. Circulation 1991;83:1692-1697.
19. Rankinen T, Rauramaa R, Väisänen S, Halonen P, Penttilä. Blood coagulation and fibrinolytic
factors are unchanged by aerobic exercise or fat modified diet. Randomized clinical trial in
middle aged men. Fibrinolysis 1994;8:48-53.
20. De Geus EJC, Kluft C, de Bart ACW, van Doornen LJP. Effects of exercise training on
plasminogen activator inhibitor activity. Med Sei Sports Exerc 1992;24:1210-1219.
2 1 . Anderssen SA, Haaland A, Hjermann I, Urdal P, Gjesdal K, Holme I. Oslo diet and exercise
study: a one-year randomized intervention trial. Effects on hemostatic variables and other
coronary risk factors. Nutr Metab Cardiovasc Dis 1995;5:189-200.
22. Ponjee GAE, Janssen EME, Hermans J, Vanwersch JWJ. Regular physical activity and
change in risk factors for coronary heart disease: A nine months prospective study. Eur J
Clin Chem Clin Biochem 1996;34:477-483.
23. El-Sayed MS, Davies B. A physical conditioning program does not alter fibrinogen
concentration in young healthy subjects. Med Sei Sports Exerc 1995;27:485-489.
24. Kluft C, Meijer P. Update 1996: Blood collection and handling procedures for assessment of
plasminogen activators and inhibitors (Leiden Fibrinolysis Workshop). Fibrinolysis 1996; 10
(suppl 21:171-179.
25. Clauss Von A. Gerinnungsphysiologische Scnhellmethode zur Bestimmng des Fibrinogenes.
Acta Haematol 1957;17:237-246.
64

Fibrinogen and fibrinolysis
26. Meijer P, Pollet DE, Wauters J, Kluft C. Specificity of antigen assays of plasminogen
activator inhibitor in plasma: Innotest PAI-1 immuno assay evaluated. Clin Chem
1994;40:110-115.
27. Lopez-Virella MF, Stone P, Ellis S, Colwell JA. Cholesterol determination in high density
lipoproteins separated by three different methods. Clin Chem 1977;23:882-884.
28. Feunekes GIJ, Staveren van WA, De Vries JHM, Burema J, Hautvast JGA. Relative and
biomarker-based validity of a food frequency questionnaire estimating intake of fats and
cholesterol. Am J Clin Nutr 1993;58:489-496.
29. Meade TW, Brozovic M, Chakrabarti RR, Haines AP, Imeson JD, Mellows S, Milles GJ,
North WRS, Stirling Y, Thompson SG. Haemostatic function and ischaemic heart disease:
principal results of the Northwick Park Heart Study. Lancet 1986;2:533-537.
30. Kannel WB, Wolf PA, Castelli WP, D'Agostino RB. Fibrinogen and risk factors of
cardiovascular disease. JAMA 1987;258:1183-1186.
31 . Hamsten A, de Faire U, Walldius G, Dahlen G, Szamosi A, Landou C, Blomback M, Wiman
B. Plasminogen activator inhibitor in plasma: risk factor for recurrent myocardial infarction.
Lancet 1987;2:3-9.
32. Gram J, Jespersen J. A selective depression of tissue plasminogen activator (t-PA) activity
in plasma characterizes patients with unstable angina pectoris who develop myocardial
infarction. Eur Heart J 1987;11:525-528.
33. Wosornu D, Allardyce W, Ballantyne D, Tansey P. Influence of power and aerobic exercise
training on hemostatic factors after coronary artery surgery. Br Heart J 1992;68:181-186.
34. Montgomery HE, Clarkson P, Nwose OM, Mikailidis DP, Jagroop TA, Dollery C, Moult J ,
Benhizia F, Deanfield J, Jubb M, World M, McEwan JR, Winder A, Humphries S. The acute
rise in plasma fibrinogen with exercise is influenced by G.453.A polymorfism of the b-
fibrinogen gene. Arterioscl Thromb Vase Biol 1996;16:386-391.
35. Weight LM, Alexander D, Jacobs P. Strenuous exercise: analogous to the acute phase
response? Clin Sei Colch 1991;81:677-683.
36. Connely JB, Cooper JA, Meade TW. Strenuous exercise, plasma fibrinogen and factor VII
activity. Br Heart J 1992;67:351-354.
37. Mattiasson I, Lindgärde. The effect of psychosocial stress and risk factors for ischaemic
heart disease on the plasma fibrinogen concentration. J Int Med 1993;234:45-51.
38. Markowe HLJ, Marmot MG, Shipley MJ, Bulpitt CJ, Meade TW, Stirling Y, Vickers MV,
Semmence A. Fibrinogen a possible link between social class and coronary heart disease. Br
Med J 1985;291:1312-1314.
39. Sundell IB, Nilsson TK, Rânby M, Hallmans G, Hellsten G. Fibrinolytic variables are related
to age, sex, blood pressure and body build measurement: a cross sectional study in Norsjö
Sweden. Am J Epidemiol 1989;42:719-723.
40. Mykkänen L, Rönnemaa T, Marniemi J, Haffner SM, Bergman R, Laakso M. Insulin
sensitivity is not an independent determinant of plasma plasminogen activator inhibitor-1
activity. Arterioscler Thromb 1994;14:1264-1271.
65

Chapter 3
4 1 . Boman K, Hellsten G, Bruce A, Hallmans G, Nilsson T. Endurance physical activity, diet and
fibrinolysis. Atherosclerosis 1994;106:65-74.
66
CHAPTER 4
Physical training reduces QTC interval among elderly
people
AJ Schuit, JM Dekker, F de Vegt, TC Verheij, RD Rijneke, EG Schouten.
submitted for publication
67
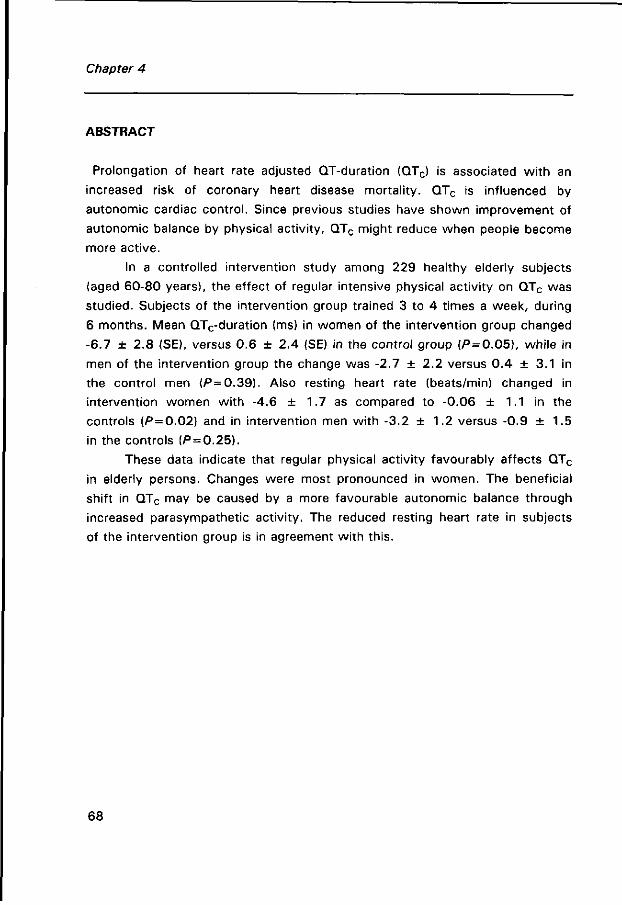
Chapter 4
ABSTRACT
Prolongation of heart rate adjusted QT-duration (QTC) is associated wi th an
increased risk of coronary heart disease mortality. QTC is influenced by
autonomic cardiac control. Since previous studies have shown improvement of
autonomic balance by physical activity, QTC might reduce when people become
more active.
In a controlled intervention study among 229 healthy elderly subjects
(aged 60-80 years), the effect of regular intensive physical activity on QTC was
studied. Subjects of the intervention group trained 3 to 4 times a week, during
6 months. Mean QTc-duration (ms) in women of the intervention group changed
-6.7 ± 2.8 (SE), versus 0.6 ± 2.4 (SE) in the control group (P = 0.05), while in
men of the intervention group the change was -2.7 ± 2.2 versus 0.4 ± 3.1 in
the control men (P = 0.39). Also resting heart rate (beats/min) changed in
intervention women wi th -4.6 ± 1.7 as compared to -0.06 ± 1.1 in the
controls (P = 0.02) and in intervention men with -3.2 ± 1 . 2 versus -0.9 ± 1 . 5
in the controls (P = 0.25).
These data indicate that regular physical activity favourably affects QTC
in elderly persons. Changes were most pronounced in women. The beneficial
shift in QTC may be caused by a more favourable autonomic balance through
increased parasympathetic activity. The reduced resting heart rate in subjects
of the intervention group is in agreement with this.
68

QTr Interval
INTRODUCTION
A prolonged heart rate adjusted QT-duration (QTC) was found to be a risk factor
for sudden death in myocardial infarction patients1"3 and in patients who had
diagnostic 24-hour electrocardiography.4 There is increasing evidence that a
prolonged QTC is predictive for coronary heart disease mortality in healthy
populations as wel l .5 , 6 QTC prolongation may be a consequence of an
unfavourable balance between sympathetic and parasympathetic activity.
Sympathetic predominance accompanied by dispersion of repolarisation
reflected in QT prolongation may cause ventricular electrical instability and
increase risk of fatal myocardial infarction. '
It has been speculated that change in autonomic balance contributes to
the age-related prolongation of QTC. In this context a preventive role of physical
activity was hypothesized.6 Regular physical activity seems to improve cardiac
electrical stability and autonomic control.9 ,10 It stimulates parasympathetic
activity and hereby favours the balance between sympathetic and
parasympathetic activity.
Unpublished results of a cross sectional study, performed by our group,
among elderly (65 to 85 years of age), indeed indicated a significant inverse
association between habitual physical activity and QTC. However, the design of
that study precluded conclusions on the causality of the association. We
therefore investigated the relation between physical activity and QTc-duration in
a trial. In addition we looked at training effects on resting heart rate, since
changes in heart rate probably also reflect changes in parasympathetic tone. In
our study, changes in QTC and heart rate were compared between subjects
following a 6 months intensive training programme and control subjects, who
retained their habitual activity.
69
Chapter 4
SUBJECTS AND METHODS
Study population
The study population comprised Caucasian elderly people, aged between 60 and
80 years and living in Arnhem, the Netherlands. 829 Elderly persons, recruited
from a general practice, were invited to participate in an intervention study
investigating the effect of training on coronary risk factors. These apparently
healthy persons were without angina pectoris, heart failure, hypertension
(diastolic pressure>115 mm Hg), insulin-dependent diabetes mellitus and did
not use beta-blockers. None of these elderly had a myocardial infarction or a
stroke in the past 2 years. From these, 318 elderly were willing to participate.
Reasons for non-participation were mainly no time (46.6%) or no interest
(24.6%). Participating elderly were relatively active: 77% of the participants
considered themselves more active than their peers, versus 4 9 % of the
refusers.
To make sure subjects were fit to participate in a physical exercise
programme, a medical examination was performed, including resting and
exercise electrocardiography and a blood pressure measurement. The results
were reviewed by a general practitioner and a cardiologist. In total 39 men and
50 women were excluded from participation, of whom 29 women and 30 men
because of abnormalities in resting or exercise electrocardiogram.
The remaining 229 subjects (113 men and 116 women) were distributed
at random to one of three protocols; an exercise bicycle group (48 men and 48
women), an all-round activity group (25 men and 22 women) and a control
group (40 men and 46 women). Husbands and wives were randomised
together.
During the intervention 18 men and 24 women prematurely left one of
the training programmes while 2 men and 2 women dropped out of the control
group. In the intervention group drop out was mainly caused by motivation
problems (50%) and medical reasons (40%). In the control group drop out was
mainly caused by family circumstances. Because of missing values in pre-
intervention QTC measurement, 5 men and 3 women were excluded from all
analyses. Subjects with a missing on post intervention QTC measurement (2
70
QTr Interval
men and 1 woman of the intervention group) were excluded from the
prospective analyses only.
Training Protocols
The elderly allocated to the exercise bicycle group received an exercise bike at
home on which they exercised four times a week, for 30 minutes, during half a
year. In the first 5 weeks the level was gradually increased to a heart rate
corresponding to 7 0 % of their maximal exercise capacity (Wmax), which was
individually determined in an exercise bicycle test at baseline.
Subjects in the all-round activity group exercised 3 times a week for 45
minutes during half a year. The training was given by an experienced sports
instructor and comprised aerobic exercise, callisthenics, and flexibility
exercises. In the present study, elderly of the two intervention groups were
combined, since both training protocols were similar wi th respect to intensity
and duration. Elderly of the control group were asked to retain their habitual
activities during the intervention period.
Adherence to the programme was stimulated by regular telephone calls
(3 times in 6 months), a personal visit and some social happenings. Adherence
in the bicycle group was checked with a cycling record. Men and women of the
bicycle group who completed the programme, on average performed 8 6 % and
8 1 % respectively of the prescribed training, while in the all-round activity group
men and women on average performed 7 2 % and 8 1 % of the training
respectively. The protocol for the intervention was approved by the Medical
Ethical Committee of the Wageningen Agricultural University and was fully
explained to the subjects. All subjects gave their written informed consent.
Data collection
All subjects underwent an examination at the beginning and end of the
intervention period, which comprised electrocardiography, anthropometry,
blood pressure measurements, blood sampling and an exercise tolerance test.
71
Chapter 4
Weight and height were measured (wearing underclothes, without shoes)
and used to calculate the Body Mass Index (kg/m2). Blood pressure was
measured three times after a resting period of 30 minutes, while subjects were
sitting. Mean values of the last two measurements were used in the analysis.
Maximal exercise testing was performed on a bicycle ergometer. Initial
ergometer workload, 30 Watt for women and 60 Watt for men, was increased
by 30 Watt every 3 minutes. This protocol was used in order to approach a
steady state at each level and to perform cardiovascular screening
simultaneously. The test was stopped when the subjects were exhausted or
when there was a medical indication for premature halt. Maximal exercise
capacity (Wmax) was determined through interpolation by summing up 10 Watt
for every extra full minute of cycling on a certain work load.
Standard resting 12-lead electrocardiograms were made using a
Marquette electrocardiographic recorder. QT-intervals were measured using a
digitising tablet (Calcomp) and a personal computer. The resolution of this
tablet is 100 lines/mm and the reproducibility is 0.25 mm (corresponding to 10
msec). QT-intervals were read from three leads: V2, V6 and of I, II or III the
lead with the longest QT. In each lead, QT-intervals and the preceding RR-
intervals were measured in three consecutive normal complexes. The beginning
of the QT-interval was defined as the first deflection of the QRS complex, the
end as the point of maximal change in the slope as the T-wave merges wi th the
baseline.11 One person measured all the intervals, blinded for intervention or
control status. QT-intervals were adjusted for heart rate according to Bazett's
method.12 Means of 3 heart-rate adjusted QT-intervals from each lead were
calculated. The longest mean QTc-interval was used for the analysis.
Venous blood samples were taken after an overnight fast. High density
lipoprotein (HDL) cholesterol was measured in serum supernatant wi th the
enzymatic "CHOD-PAP-Monotest"-method of Boehringer.13 Total triglycerides
content was determined in serum by the enzymatic "GPO-PAP"-method of
Boehringer.14 Insulin has been measured by radioimmunoassay using a
commercially available insulin kit of Pharmacia, Uppsala, Sweden.
Habitual physical activity was assessed with the questionnaire previously
described by Caspersen et al.^s Medical history, socio-demographic
72
QTr Interval
characteristics and information on smoking habits and use of medication were
assessed in a personal interview.
Data analysis
Because women in general have longer QTC than men, analyses were performed
separately. Mean values of baseline characteristics were calculated for men and
women and compared between elderly of the intervention group (bicycle and all
round group combined) and control group. In addition, mean QTC intervals were
compared for subjects active in sport and subjects refraining from sport; crude
means with Students t-test and age adjusted means with an analysis of
covariance (least square means). The effect of the training programme was
investigated by comparing changes in QTC interval and resting heart rate
between subjects of the intervention group and control group, using Students t-
test. Data were analysed using SAS software.16
RESULTS
Table 4.1 shows the baseline characteristics of the study population of men
and women of the intervention and control group, who stayed in the study until
the end. The intervention and control group differed with respect to age
(women), sport activity (men) and physical fitness (men). Other characteristics
were not different between intervention and control group. Mean QTC was 418
ms in men and 427 ms in women. Mean (unadjusted) QT was 389 ms in both
sexes.
Table 4.2 shows mean QTC, resting heart rate, age and fitness of elderly in
categories of sport engagement. Mean QTC of elderly men who (mainly)
exercised strenuously at baseline was somewhat lower than men who did not
exercise at all. Women, but not men, who performed (mainly) light and
moderate sport, also had a lower mean QTC interval, but this group was rather
73
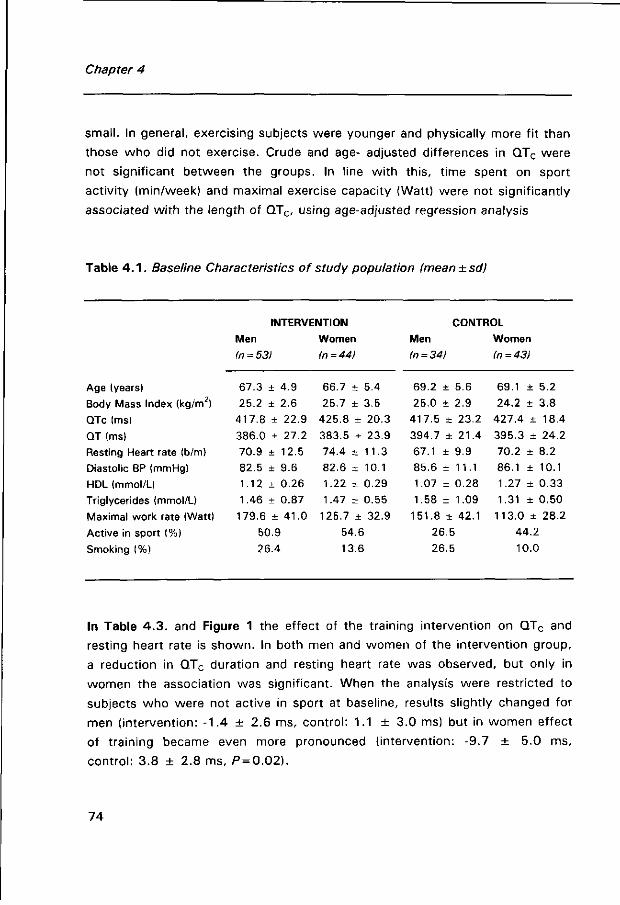
Chapter 4
small. In general, exercising subjects were younger and physically more fit than
those who did not exercise. Crude and age- adjusted differences in QTC were
not significant between the groups. In line with this, time spent on sport
activity (min/week) and maximal exercise capacity (Watt) were not significantly
associated wi th the length of QTC, using age-adjusted regression analysis
Table 4 . 1 . Baseline Characteristics of study population (mean±sdj
INTERVENTION CONTROL
Men Women Men Women
In = 53) In =44) In = 34) In =43)
Age (years) 67.3 ± 4.9 66.7 ± 5.4 69.2 ± 5.6 69.1 ± 5.2
Body Mass Index (kg/m2) 25.2 ± 2.6 25.7 ± 3.5 25.0 ± 2.9 24.2 ± 3.8
QTc (ms) 417.8 ± 22.9 425.8 ± 20.3 417.5 + 23.2 427.4 ± 1 8 . 4
QT (ms) 386.0 ± 27.2 383.5 ± 23.9 394.7 ± 2 1 . 4 395.3 ± 24.2
Resting Heart rate (b/m) 70.9 ± 12.5 74.4 ± 11.3 67.1 ± 9.9 70.2 ± 8.2
Diastolic BP (mmHg) 82.5 ± 9.6 82.6 + 10.1 85.6 ± 1 1 . 1 86.1 ± 10.1
HDL (mmol/U 1.12 ± 0 . 2 6 1.22 ± 0 . 2 9 1.07 + 0.28 1.27 ± 0 . 3 3
Triglycerides (mmol/L) 1.46 ± 0.87 1.47 ± 0 . 5 5 1.58 ± 1 . 0 9 1.31 ± 0 . 5 0
Maximal work rate (Watt) 179.6 ± 4 1 . 0 125.7 ± 3 2 . 9 151.8 ± 4 2 . 1 113.0 ± 2 8 . 2
Active in sport (%) 50.9 54.6 26.5 44.2
Smoking (%) 26.4 13.6 26.5 10.0
In Table 4 .3. and Figure 1 the effect of the training intervention on QTC and
resting heart rate is shown. In both men and women of the intervention group,
a reduction in QTC duration and resting heart rate was observed, but only in
women the association was significant. When the analysis were restricted to
subjects who were not active in sport at baseline, results slightly changed for
men (intervention: -1.4 ± 2.6 ms, control: 1.1 ± 3.0 ms) but in women effect
of training became even more pronounced (intervention: -9.7 ± 5.0 ms,
control: 3.8 ± 2.8 ms, P = 0.02).
74
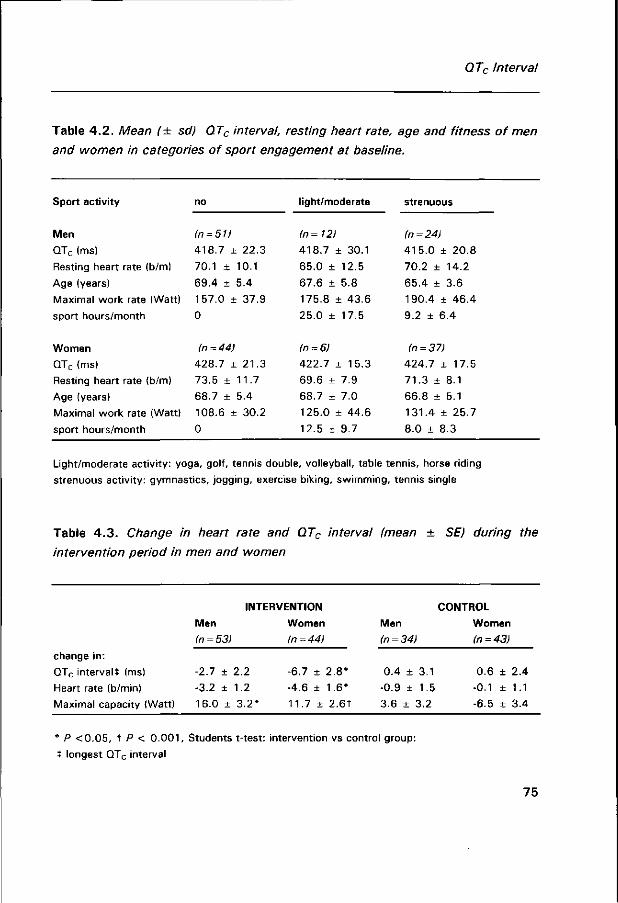
QTc Interval
Table 4 .2. Mean (± sd) QTC interval, resting heart rate, age and fitness of men
and women in categories of sport engagement at baseline.
Sport activity no light/moderate strenuous
Men (n = 51) (n = 12) (n = 24)
QTC (ms) 418.7 ± 22.3 418.7 ± 3 0 . 1 415.0 + 20.8
Resting heart rate (b/m) 70.1 ± 10.1 65.0 ± 12.5 70.2 ± 14.2
Age (years) 69.4 ± 5.4 67.6 ± 5.8 65.4 ± 3.6
Maximal work rate (Watt) 157.0 ± 3 7 . 9 175.8 ± 4 3 . 6 1 90.4 ± 46.4
sport hours/month 0 25.0 ± 1 7 . 5 9.2 ± 6.4
Women in =44) In = 6) in = 37)
QTC (ms) 428.7 ± 21.3 422.7 ± 1 5 . 3 424.7 ± 1 7 . 5
Resting heart rate (b/m) 73.5 ± 1 1 . 7 69.6 ± 7.9 71.3 ± 8 . 1
Age (years) 68.7 ± 5.4 68.7 ± 7.0 66.8 + 5.1
Maximal work rate (Watt) 108.6 ± 30.2 125.0 ± 44.6 131.4 ± 25.7
sport hours/month 0 12.5 ± 9 . 7 8.0 ± 8.3
Light/moderate activity: yoga, golf, tennis double, volleyball, table tennis, horse riding
strenuous activity: gymnastics, jogging, exercise biking, swimming, tennis single
Table 4 .3. Change in heart rate and QTC interval (mean ± SE) during the
intervention period in men and women
change in:
QTC interval* (ms)
Heart rate (b/min)
Maximal capacity (Watt)
INTERVENTION
Men
(n = 53)
-2.7 ± 2.2
-3.2 ± 1.2
16.0 ± 3.2*
Women
(n=44)
-6.7 ± 2.8*
-4.6 ± 1.6*
11.7 ± 2.6t
Men
(n = 34)
0.4 ± 3.1
-0.9 ± 1.5
3.6 ± 3.2
CONTROL
Women
(n=43)
0.6 ± 2.4
-0.1 ± 1.1
-6.5 ± 3.4
* P <0 .05, t P < 0 .001, Students t-test: intervention vs control group:
t longest QTC interval
75
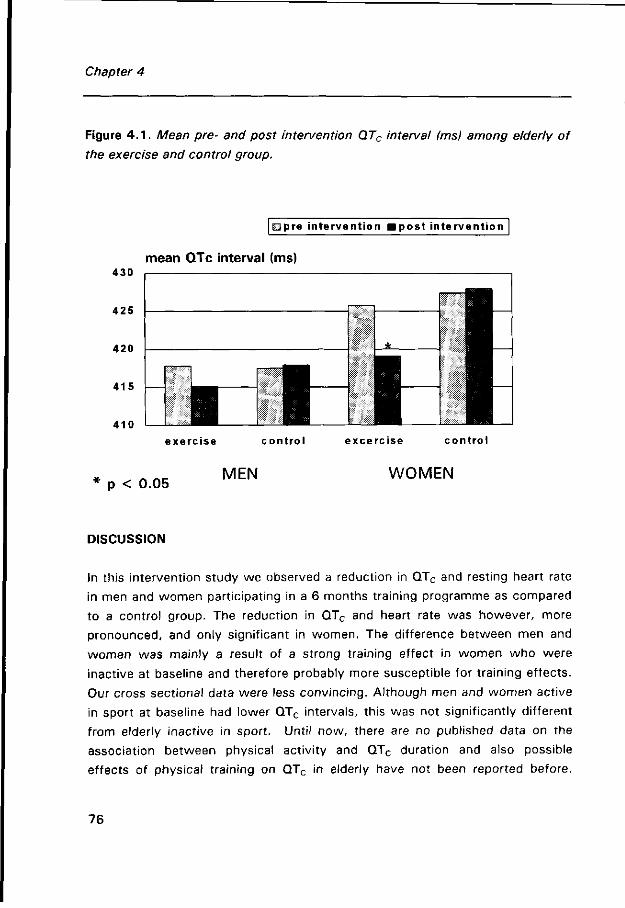
Chapter 4
Figure 4 . 1 . Mean pre- and post intervention QTC interval fmsj among elderly of
the exercise and control group.
430
425
420
415
410
mpre intervention fflpost intervention
mean QTc interval (ms)
exercise control excercise control
p < 0.05 MEN WOMEN
DISCUSSION
In this intervention study we observed a reduction in QTC and resting heart rate
in men and women participating in a 6 months training programme as compared
to a control group. The reduction in QTC and heart rate was however, more
pronounced, and only significant in women. The difference between men and
women was mainly a result of a strong training effect in women who were
inactive at baseline and therefore probably more susceptible for training effects.
Our cross sectional data were less convincing. Although men and women active
in sport at baseline had lower QTC intervals, this was not significantly different
from elderly inactive in sport. Until now, there are no published data on the
association between physical activity and QTC duration and also possible
effects of physical training on QTC in elderly have not been reported before.
76
QTC Interval
The results of our study may therefore add some new information on the
beneficial impact of exercise on cardiovascular risk.
It has been postulated that QTC is prolonged among subjects with an
unfavourable balance between sympathetic and parasympathetic activity.
Previous studies using pharmacological interventions confirmed effects of
change of parasympathetic tone on QTC interval. Anilla et a/.17 have described
QTC prolongation as a result of administering atropine, a parasympathetic
blocking agent. After adrenergic blockade the QT-interval was shortened again.
Therefore, we suggest that the observed reduction in QTC in men and women
of our training group may result from an increase in parasympathetic activity.
Also, the observed decrease in resting heart rate and the strong correlation
between change in QTC and change in mean resting heart rate (r = 0.47,
P<0 .001) , may suggest that both changes have a similar background, namely
a change in cardiac autonomic control. Our results are in line with earlier
studies which have shown that people active in sport have (cross-sectional
studies) or obtain (longitudinal studies) higher parasympathetic activity and a
better balance between sympathetic and parasympathetic activity.10,18 Also
training studies in dogs9,13 have shown a shift in autonomic balance
characterised by increased cardiac vagal activity, accompanied by lower risk of
ventricular fibrillation.
The observed reduction in QTC may also have resulted from changes in
characteristics of the insulin resistance syndrome. Previous observations
suggest excessive activation of the sympathetic nervous system in subjects 20
with the insulin resistance syndrome . A reduction in body fat, induced by
training, may cause a reduction in free fatty acids and consequently result in
lower plasma insulin levels. This may then further indirectly lead to a reduction
in sympathetic activity. Baseline data indeed showed a cross sectional
association between QTC and some features of the insulin resistance syndrome;
body mass index (r = 0.20, P = 0.01), triglyceride concentration (r = 0.16,
p = 0.04), HDL (r = -0.17, P = 0.03) and fasting insulin (r = 0.17, P = 0.09) in
subjects of our study. However, we did not observe any significant association
between change in these parameters during the intervention with change in QTC
77
Chapter 4
(change in weight r = 0 . 1 1 , P = 0.14, triglycerides r = 0 . 01 , P = 0.89, or fasting
insulin r = -0.03, P = 0.77), providing no indication that change in QTC might be
a consequence of change in insulin resistance.
The study results might have been subject to some potential errors.
Misclassification in measurement and coding of the QT-interval may have
occurred. To assure the closest approximation to the maximum QT interval, we
measured QT-intervals in 3 leads (I, II or III, V2 and V6) in which axes are
nearly orthogonal, and selected the longest QT interval. QT-intervals were
measured by one person, blinded with respect to the status of a subject, to
avoid bias due to interobserver differences and differential error. The measured
QT-interval was adjusted for heart rate according to the Bazett formula12, which
has the purpose of standardising the QT-interval to a heart rate of 60 beats per
minute. Although questioned, this correction formula is generally used.
Moreover, Bazetts' correction functions fairly well in the heart rate range of 55
to 85 beats/min21, which applied for 90 % of the men and 87 % of the women
of our study.
A bias in the results, because of pharmacological intervention influencing
QTC is not very likely. Subjects who were using beta-blockers were excluded
from the study and other medications which can influence the heart or the
central nervous system were well-balanced among the intervention and the
control group. This medication was not altered during the intervention period.
Our study population consisted of a large group of elderly, who were
relatively active and healthy as compared to the general Dutch population. Not
only were these elderly subjects screened, those participants who were
physically or mentally unable to continue with the intervention programme
prematurely left the study. Since drop out during intervention was more
frequent in the intervention group, it could have biased the results. However, in
general, subjects who dropped out were less physically fit and less active at
baseline than the elderly who completed the protocols (compare baseline
activity and fitness). Since greater effects are expected in less fit elderly,
selection might probably have led to an underestimation of the effect.
78
QTr Interval
In conclusion, elderly subjects who followed a six months training programme
showed a decline in QTc-duration and heart rate as compared to a control
group. The reduction in QTC and heart rate probably reflects an improvement in
parasympathetic activity. However, whether the extent of the QTC change,
observed in our study would lead to a reduction in coronary heart disease risk
cannot be decided from these results. From our earlier studies on the prognostic
values of QTC for coronary heart disease death, such a protective effect might
be inferred.
REFERENCES
1. Peters RW, Byington RP, Barker A, Yusuf S. Prognostic value of prolonged ventricular
repolarization following myocardial infarction: The BHAT experience. J Clin Epidemiol
1990;43:167-172.
2. Ahnve S, Gilpin E, Madsen EB, Froelicher V, Henning H, Ross J. Prognostic importance of
QTc interval at discharge after acute myocardial infarction: a multicenter study of 865
patients. American Heart Journal 1984;108:395-400.
3. Ahnve S, Helmers C, Lundman T, Rehnqvist N, Sjörgen A. QTc intervals in acute myocardial
infarction: first-year prognostic implications. Clin Cardiol 1980;3:303-308.
4. Algra A, Tijssen JGP, Roelandt JRTC, Pool J, Lubsen J. QTc prolongation measured by
standard 12-lead electrocardiography is an independent risk factor for sudden death due to
cardiac arrest. Circulation 1991;83:1888-1894.
5. Schouten EG, Dekker JM : Meppelink P, Kok FJ, Vandenbroucke JP, Pool JP. QT Interval
prolongation predicts cardiovascular mortality in an apparently healthy population. Circulation
1991;84:1516-1523.
6. Dekker JM, Schouten EG, Klootwijk P, Pool J, Kromhout D. Association between QT interval
and coronary heart disease in middle-aged and elderly men. The Zutphen Study. Circulation
1994;90:779-784.
7. Yanowitz R, Preston JB, Abildshov JA, Functional distribution of right and left stellate
innervation to the ventricles: production of neurogenic electrocardiographic changes by
unilateral alterations of sympathetic tone. Circ Res 1966;18:416-428.
8. Schwartz PJ, Snebold NG, Brown AM, Effects of unilateral denervation on the ventricular
fibrillation threshold. Am J Cardiol 1976;37:1034-40.
9. Hull SS, Vanoli E, Adamson PB, Verrier RL, Foreman RD, Schwartz PJ. Exercise training
confers anticipatory protection from sudden death during acute myocardial ischemia.
Circulation 1994;89:548-552.
79
Chapter 4
10. Dixon EM, Kamath MV, McCartney N, Fallen EL. Neural regulation of heart rate variability in
endurance athletes and sedentary controls. Cardiovascular Res 1992;26:713-719.
11 . Vincent GM, Timothy KW, Leppert M, Keating M. The spectrum of symptoms and QT
intervals in carriers of the gene for the long-QT syndrome. N Engl J Med. 1 992;327:846-852.
12. Bazett HC. An analysis of the time relations of electrocardiograms. Heart 1920;7:353-370.
13. Van Gent CM, vd Voort HA, de Bruijn AM, Klein F. Cholesterol determinations. A
comparative study of methods with a special reference to enzymatic procedures. Clin Chem
Acta 1977;75:243.
14. Bucolo G, David H. Quantitative determination of serum triglycerides by the use of enzymes.
Clin Chem 1973;19:476-482.
15. Caspersen CJ, Bloemberg BPM, Saris WHM, Merritt RK, Kromhout D. The prevalence of
selected physical activities and their relation with coronary heart disease risk factors in elderly
men: the Zutphen Study, 1985. Am J Epidemiol 1991;133:1078-1092.
16. SAS Institute Inc. SAS/STAT user's guide 6. Cary (NC): Sas Institute Inc., 1989.
17. Anilla P, Yli-Hankala A, Lindgren L. Effect of atropine on the QT interval and T-wave
amplitude in healthy volunteers. Br J Anaesth. 1993;71:736-737.
18. Meersman RE de. Respiratory sinus arrhythmia alterations following training in endurance
athletes. Eur J Appl Physiol 1992;64:434-436.
19. Billman GE, Schwartz PJ, Stone HL. The effect of daily exercise on susceptibility to sudden
cardiac death. Circulation 1984;6:1182-1189.
20. Rosen SD, Dritsas A, Bourdillon PJ, Camici PG. Analysis of the electrocardiographic QT
interval in patients with syndrome X. Am J Cardiol 1994;73:971-972.
2 1 . Rautaharju PM, Zhou SH, Wong S, Prineas R, Berenson GS. Functional characteristics of QT
prediction formulas. The concepts of Qtmax and QT rate sensitivity. Computers and
Biomedical Research 1993;26:188-204.
80
CHAPTER 5
Increased heart rate variability by exercise training in
elderly men and women
A J Schuit, LGPM van Amelsvoort, TC Verheij, RD Rijneke, AC. Maan, CA
Swenne, EG Schouten.
submitted for publication
81
Chapter 5
ABSTRACT
Heart rate variability (HRV), a characteristic that is potentially increased by
physical activity, was recently reported to be inversely associated with
incidence of cardiac events and total mortality in a community-based
population. Since the incidence of cardiac events among elderly is high and
their physical activity levels and HRV are generally low, it is important to
investigate the question whether regular physical activity can modify HRV in
this age group.
In a randomised controlled trial, the effect of 6 months training on HRV
was investigated in a group of 74 elderly. The training group gathered 3 times
per week for a 45 minute supervised training session which consisted of
aerobic, strength and flexibility exercises. At the end of the intervention period
HRV was higher, primarily during the day. During daytime, the standard
deviation of all normal intervals ( + 6%) as well as the low frequency component
( + 15%, LF) and the very low frequency component ( + 10%, VLF) of HRV were
significantly increased (/3<0.05) in subjects of the intervention group as
compared with the control group. Effects of training were most pronounced in
subjects inactive in sport at baseline.
This study demonstrates that regular physical activity increases HRV
(specifically in the very low and low frequency components) in elderly subjects.
Hence, in elderly subjects, physical training is an effective means to positively
modify a factor that is associated with increased incidence of cardiac events.
82

Heart rate variability
INTRODUCTION
Heart rate variability (HRV), the spontaneous fluctuations around the mean
heart rate, is a simple non-invasive measure that reflects the autonomic
balance. A reduced HRV is associated with increased incidence of total
mortality and cardiac events in both post infarction patients,1 3 and apparently
healthy middle aged and elderly subjects.4"6 It is assumed that a reduced HRV is
a reflection of elevated sympathetic activity, a condition that may decrease the
fibrillation threshold and thus predispose to ventricular fibrillation.7 With
increasing age the respiratory variation in heart rate decreases8 and
baroreceptor reflexes attenuate9,10 and HRV is reported to be lower in elderly.11
It is widely presumed that regular physical activity induces adaptations in
the autonomic nervous system. One of the possible adaptations is an increase
in parasympathetic activity and HRV.12"15 Until now, most intervention studies
have been performed in chronic heart failure or myocardial infarction patients. 20 The majority of these studies report a considerable and significant increase in
HRV after a period of physical training. ' Only 2 studies have been
performed in healthy middle aged and elderly subjects, using relatively short
recordings. These show inconsistent results. Seals et al. observed a 15%
significant increase in HRV (standard deviation of RR-intervals of a 5 minute
recording) at rest in healthy middle aged and elderly sedentary men, who
followed a strenuous and prolonged endurance training programme. In contrast,
Boutcher et al. 21 recently failed to show an increase in HRV in healthy middle
aged men after a training period. However, this training protocol was shorter
and of moderate intensity.
Since elderly have both increased incidence of cardiac events and a
reduced HRV, it is important to learn more about the effects of regular physical
activity on HRV in this age group. Therefore we have studied change in HRV,
both in the time and frequency domain in elderly men and women who were
randomly allocated to a 6 months' training programme or a control group, using
24 hour ECG recordings.
83
Chapter 5
SUBJECTS AND METHODS
Subjects
The study population comprised Caucasian people, 60 to 80 years old, living in
a middle sized city in the Netherlands. Participants took part in an intervention
study which investigated the effect of a 6 months' training programme on
various cardiovascular risk factors. The response rate of the intervention study
was 38%. Participants were younger and were more active, in comparison wi th
the refusers. In total, 74 elderly men and women, randomly recruited from
intervention and control group, participated in the present study. These
subjects complied with the following inclusion criteria: normal resting and
exercise electrocardiogram, no myocardial infarction or stroke in the past 2
years, no insulin dependent diabetes mellitus, no heart failure, no unstable
angina pectoris, and no use of beta blockers. Fourteen pre-intervention
ambulatory electrocardiogram (ECG) recordings could not be used, due to bad
quality tapes (n = 12), pacemaker (n = 1) and atrial fibrillation (n = 1). From the
remaining 60 elderly subjects, 3 provided unsuitable post intervention HRV
measurements, due to bad tape quality (n = 2) and atrial fibrillation (n = 1). One
subject dropped out during the intervention period and 5 subjects were not able
to do the post intervention ECG measurement, due to illness (n = 3) and holiday
(n = 2). Therefore, we were left with a group of 51 elderly with an adequate
pre- and post- intervention ECG measurement. All participants provided
informed consent according to the guidelines of the Medical Ethical Committee
of the Wageningen Agricultural University.
Ambulatory ecg recording
At the beginning and end of the intervention period, subjects were visited at
home by the research assistant who attached the ECG electrodes, started the
3-lead Marquette 8500 Holter recorder (Marquette Electronics Inc. Milwaukee,
Wisconsin) and instructed the participants how to disconnect the Holter
recorder after 24 hours. The recorder was collected the next day.
84
Heart rate variability
Assessment of HRV
Signal processing. The electrocardiogram was analysed with a Marquette Series
8000 Holter Analyzer. Accurate determination of the onsets of the QRS-
complexes was accomplished by an extensive review and edit procedure and a
computer programme from the Marquette 8000 Holter research software
modules. The resulting inter-beat interval series were further analysed on a
personal computer22.
Power Spectral Analysis. Frequency domain analysis was performed by
calculating the power density spectrum, using the fast Fourier algorithm. We
computed high frequency, (HF, 0.15-0.40 Hz), low frequency, (LF, 0.05-0.15
Hz) and very low frequency power, (VLF, 0.01-0.05 Hz) for every 5 minute
interval22.
Time domain analysis. The standard deviation of all normal RR intervals (SD-RR)
and the percentage of differences between adjacent normal RR intervals
exceeding 50 ms (pNN50) were calculated for every 5 minute interval (SD-RR).
Other characteristics
Maximal oxygen consumption (V02max) and maximal exercise capacity (Wmax)
were determined in a maximal exercise test on an ergocycle before and after
the intervention period. The protocol started with a load of 30 Watt for women
and 60 Watt for men and every three minutes work load was increased with 30
Watt. We used this protocol in order to approach a steady state at each level,
to be able to evaluate intercurrent ischemia. Body mass index was calculated as
body weight (kg) divided by height squared (m2). Smoking status was assessed
during an interview.
Exercise protocol
The 74 elderly subjects who participated in this study were allocated to a
training (n = 36) and a control group (n = 38). During half a year, subjects of the
85

Chapter 5
training group gathered 3 times per week in a sports facility for a 45 minutes
supervised training session. This training consisted of various activities, such as
aerobic exercise (ball games, jogging, exercise to music), callisthenics and
flexibility exercises. The instructor saw to it that the intensity of the training
was adapted to the individuals capacity. The attendance in the all-round group
was 7 2 % for men and 8 1 % for women. Subjects in the control group were
asked to maintain their habitual activities during the 6 months' period, but were
not restrained from undertaking (more) physical activity.
Data analysis
Means of SD-RR and pNN50 and arithmetic and geometric mean of HF, LF and
VLF (all from 5 minute averages) were calculated for the complete 24 hour
recording, during the active period of the day (between 6 am and 6 PM) and
during sleep (between 2 and 5 am). General characteristics at baseline were
calculated for all subjects with an acceptable Holter pre-intervention measurement.
Mean change in physical fitness (V02max, Wmax) and the various HRV
measures in the intervention and control group were compared using Students t-
test. To investigate the effect of the training programme in sedentary subjects, we
repeated the analysis, including only subjects who were inactive in sport at
baseline. In order to evaluate if changes in HRV parameters were affected by
changes in physical fitness and mean heart rate, a regression analysis was
performed, in which HRV parameters were dependent variâtes and assignment
(intervention, control) and change in physical fitness and mean heart rate were
independent variâtes.
The association between physical fitness (V02max and Wmax) and HRV,
both baseline levels as well as change during the intervention period, were
evaluated using regression analysis. In the baseline analysis, adjustment was made
for sex, smoking and age.
86
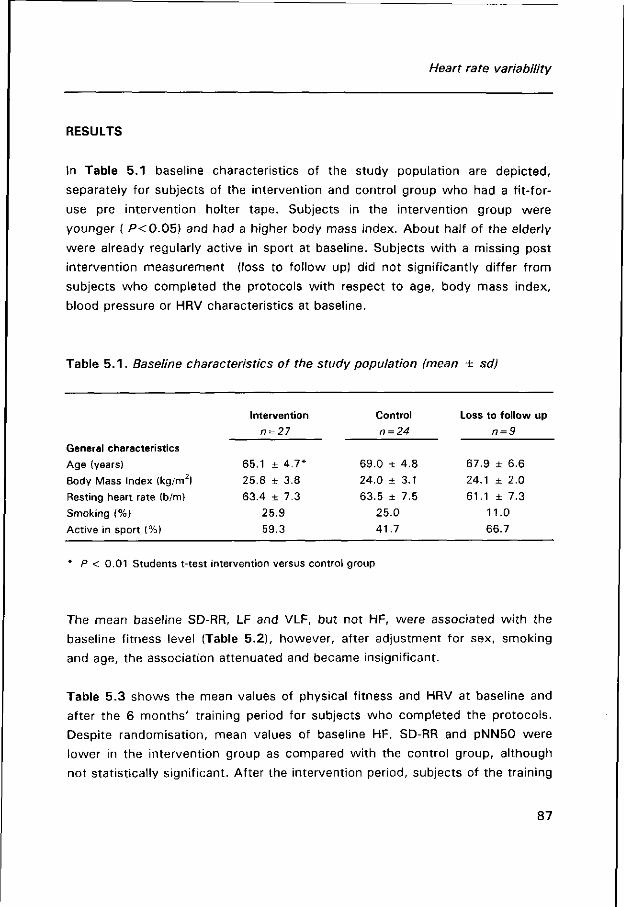
Heart rate variability
RESULTS
In Table 5.1 baseline characteristics of the study population are depicted,
separately for subjects of the intervention and control group who had a fit-for-
use pre intervention holter tape. Subjects in the intervention group were
younger ( P<0 .05) and had a higher body mass index. About half of the elderly
were already regularly active in sport at baseline. Subjects with a missing post
intervention measurement (loss to follow up) did not significantly differ from
subjects who completed the protocols with respect to age, body mass index,
blood pressure or HRV characteristics at baseline.
Table 5 . 1 . Baseline characteristics of the study population (mean ± sd)
Intervention Control Loss to follow up
n = 27 n = 24 n = 9
General characteristics
Age (years) 65.1 ± 4.7* 69.0 ± 4.8 67.9 ± 6.6
Body Mass Index (kg/m2) 25.8 ± 3.8 24.0 + 3.1 24.1 ± 2.0
Resting heart rate (b/m) 63.4 ± 7.3 63.5 ± 7.5 6 1 . 1 + 7 . 3
Smoking (%) 25.9 25.0 11.0
Active in sport (%) 59.3 41.7 66.7
P < 0.01 Students t-test intervention versus control group
The mean baseline SD-RR, LF and VLF, but not HF, were associated with the
baseline fitness level (Table 5.2), however, after adjustment for sex, smoking
and age, the association attenuated and became insignificant.
Table 5.3 shows the mean values of physical fitness and HRV at baseline and
after the 6 months' training period for subjects who completed the protocols.
Despite randomisation, mean values of baseline HF, SD-RR and pNN50 were
lower in the intervention group as compared with the control group, although
not statistically significant. After the intervention period, subjects of the training
87
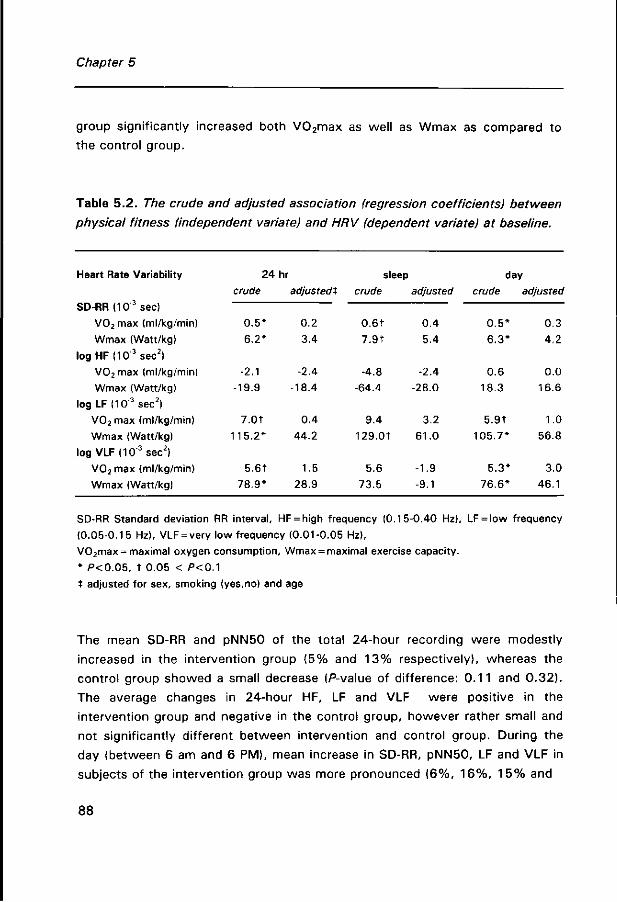
Chapter 5
group significantly increased both V02max as well as Wmax as compared to
the control group.
Table 5.2. The crude and adjusted association (regression coefficients) between
physical fitness (independent variate) and HRV (dependent variate) at baseline.
Heart Rate Variability 24 hr sleep day
crude adjustedt crude adjusted crude adjusted
SD-RR (103 sec)
V0 2 max (ml/kg/min)
Wmax (Watt/kg)
log HF (10"3sec2)
V02 max (ml/kg/min)
Wmax (Watt/kg)
log LF (10"3sec2)
V02 max (ml/kg/min)
Wmax (Watt/kg)
log VLF <103sec2)
V02max (ml/kg/min)
Wmax (Watt/kg)
SD-RR Standard deviation RR interval, HF = high frequency (0.15-0.40 Hz), LF = low frequency
(0.05-0.1 5 Hz), VLF = very low frequency (0.01-0.05 Hz),
V02max = maximal oxygen consumption, Wmax = maximal exercise capacity.
* P<0.05, t 0.05 < P<0A
t adjusted for sex, smoking (yes.no) and age
The mean SD-RR and pNN50 of the total 24-hour recording were modestly
increased in the intervention group (5% and 13% respectively), whereas the
control group showed a small decrease (P-value of difference: 0.11 and 0.32).
The average changes in 24-hour HF, LF and VLF were positive in the
intervention group and negative in the control group, however rather small and
not significantly different between intervention and control group. During the
day (between 6 am and 6 PM), mean increase in SD-RR, pNN50, LF and VLF in
subjects of the intervention group was more pronounced (6%, 16%, 15% and
88
0.5*
6.2*
-2.1
-19.9
7.0t
115.2*
5.6Î
78.9*
0.2
3.4
-2.4
-18.4
0.4
44.2
1.5
28.9
0.6t
7.9t
-4.8
-64.4
9.4
129.0t
5.6
73.5
0.4
5.4
-2.4
-28.0
3.2
61.0
-1.9
-9.1
0.5*
6.3*
0.6
18.3
5.9t
105.7*
5.3*
76.6*
0.3
4.2
0.0
16.6
1.0
56.8
3.0
46.1
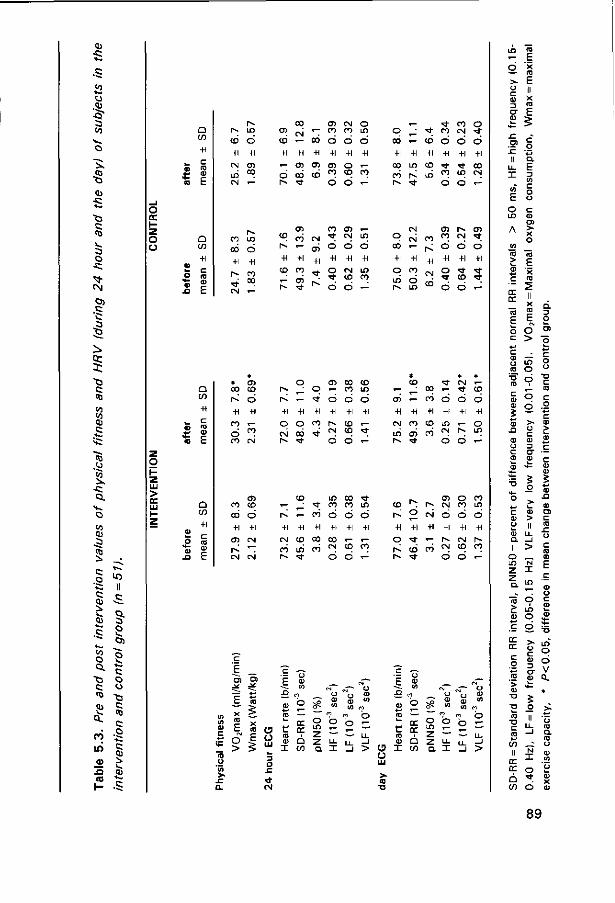
eu
ü .OJ •5" to
iv CO t ) <U
-c 4~.
•C3
c CO
V
a o •c
^ <N O}
.c C; 3 Jj
^ et a; ts c CO
10 to tu c i —
fe ^ CO .o 55 ^ •c Q.
H ^
O to 0) .g "co i .
•S 0) ï> >̂ CU
^ to
o Q. "G c co tu ,s O.
en ui <u
X I
il ,c Q. S S c» S o o •G C CO
C
tü
^ ^ eu
Q
Q
j _ c
CD
+1 CM CT) , o 00
* CT) ra co o
+i +i
oo i -ó <*> co CM
05 co co oo
+i
CN CM
ra CN
CT) CN o o co m
oo
+i
r - CT) CT) CT) O »—
O ra to m to o ó 6
co ra +i
CM
LO
o +l co 00
CD
h«
+l CD
co "-+l co oS * t
CSI
CT) +1
t
O
+1 o ' t o
CN
O
+1 CN CD
Ó
LO
O
+1 LO co
o >
+i o
O ü LU
3 O
. E
CN
CN 0 0
CT) 0 0 CD < - 0 0 LO
+i +i +i
CN CO 00
00 LO oó r~ < t
or er Q co
r* CD CN CD
LO ra ^f 00 00 LO
O O +1 +1
O O
a l
o ra +i
i - r *
<t oo oo CN
o co
+i
o LO Ö
T- r^ LO
-H
oo
CT) +1
O CN
+1 +1
* T CD oó ' t
E !3
CN
CN 0 0
-H
OM
CD
00
00
+1
CC CC
Û CO
CT) P~ 0 0 CN
CM 0 0 CO LO
LO o) co CN
ó
* * B) 00 LO CM
o o LO ,— 2 —
o o
CN ^ •
6 +1
r* 6
CT) O 0 0 CN 0 0 LO
r>» CN r -CN CD 00
</) co
m O
o r-.
a I _i >
LO Ç5
5 E
JZ O)
II
o LO
c o Q. E ü> C O o c <D O)
CC cc
E o o j *—
o a
> ö S LO g ro O u
'S Ö C 10 U- cl £ 9 g • o .9 B c
S > • CD o U >
•te - S
O) c
o _ LO N
Z I
> LO
ro o E ç a> o c
t ; .-: «£
DC er
> >fc
co II
cc cc
>-r co CT CU f-
i o
LO O
o V a
* >•
89
Chapter 5
10%) and, except for pNN50, significantly different from the control group
(P = 0.02, P = 0.32, P = 0.05 and P = 0.02, respectively). Mean change in HRV
characteristics between 7 am to 7 PM or between 8 am to 8 PM showed similar
results.
When the analysis was restricted to subjects who were inactive in sport
at baseline (n = 25), a larger increase in HRV in the intervention group was
observed. Mean increase in 24-hour SD-RR, LF, VLF were 11 %, 4 2 % and 20%,
with P-values for the difference with the control group of 0.08, 0.03 and 0.04
respectively. Again, among the elderly of the intervention group, increase in
HRV was most pronounced during the day (SDRR: + 1 7 % , P < 0 . 0 1 , pNN50:
+ 104%, P = 0.08, H F : + 4 0 % , P = 0.09, LF: + 54%, P < 0 . 0 1 , VLF: + 3 1 % ,
P<0 .01 ) .
Change in SD-RR and HF were significantly associated with a change in
heart rate (crude: -0.98 and -0.015 (10~3 sec2) per 1 beat/min respectively),
but not wi th change in V02max, or Wmax. However, the difference in change
of the HRV parameters between intervention and control group was not
attenuated after adjustment for changes in heart rate.
DISCUSSION
In a randomised intervention study, we studied the effect of a 6 months'
training programme on heart rate variability, a characteristic of autonomic
nervous function, from 24 hour ambulatory ECG recordings of an elderly
population. Subjects in the intervention group showed a small increase in total
24-hour HRV (SD-RR) and in the very low and low frequency component (VLF,
LF), but a moderate and significant increase in daytime-HRV, compared with the
control group, in which a small decrease was observed. The differences were
most pronounced and significant among subjects who were sedentary at
baseline and independent of change in mean heart rate.
Increasing HRV may be important, since low HRV, particularly common in
elderly, was recently observed to be associated with increased incidence of
cardiac events and total mortality in a healthy population.46 All HRV measures
in the time and frequency domain were associated with increased risk of
90
Heart rate variability
cardiac events (angina pectoris, myocardial infarction, coronary heart disease
death or congestive heart failure). One standard deviation decrement in log SD-
RR was associated with a relative risk of 1.5 (95% confidence interval 1.2 to
1.9). One standard deviation decrement in log LF was associated with a 1.7
times greater hazard of total mortality.
The observed small reduction in HRV among subjects in the control group
may be caused by a reduction in physical activity during the intervention period.
The study was conducted during the winter months, in order to have a lower
level of background physical activity and to minimise absence at the training
sessions due to holidays. Also our control subjects had spent less time on
walking (-65 minutes per week), and gardening (-3.5 hour per week), but not
on sports or bicycling, than during the summer.
Methodological issues
Since baseline levels of some HRV measures (SD-RR, HF and especially pNN50)
were somewhat different between intervention and control group, regression
towards the mean in these parameters can not be ruled out. It remains unclear
to what extent this phenomenon may have affected the results of the study.
The ambulatory ECG measurement may have been subject to possible
errors. As has been mentioned before, a large proportion of the tapes were of
insufficient quality (11%). We believe that these missings were random, since it
was caused by bad signal conduction and (except for 2) not by abnormalities in
the ECG.
Unlike the short term standardised recording performed in a laboratory,
the 24 hour Holter recording enables studying of HRV under natural conditions,
and during wake and sleep. Differences in physical activity pattern during Holter
recording might hamper comparability between intervention and control group.
However, participants were instructed not to have exercise during the
measurement, and since the Holter recorder discouraged undertaking other
strenuous activities, it is not likely that the activity pattern was materially
different between intervention and control group, nor within the groups during
91
Chapter 5
pre- and post-intervention measurements. Still, differences can not be
completely ruled out.
Other intervention studies
The majority of intervention studies investigating the effect of physical training
on HRV has been performed in heart patients16"20 and most of these studies
have observed significant and considerable increases in HRV. However, to our
knowledge, only 5 studies have reported the effect of regular exercise during
longer periods on HRV in healthy subjects. Three of these were carried out in
young and 2 in middle aged and elderly subjects. The studies performed in
young subjects show an increase in SD-RR23 and LF23 '24 of about 26%. The
change reported in HF was inconsistent, 2 studies reported an unexpected
decrease in HF in the range of 12-60%,2 3 , 2 4 whereas 1 observed a significant
increase in HF in 9 of the 11 individuals who followed a 6 week intensive
training programme.25
The studies performed in middle aged and elderly show inconsistent
results. Seals et al. observed a moderate increase of 15% in SD-RR after 30
weeks of training, while Boutcher et al. did not find any effect after a moderate
training programme of only three months. The training effect we observed in
our study is similar to the results of Seals et al.15 The results so far, may
suggest that training modulates HRV beneficially, only when it is performed
vigorously enough.
Until now, most training intervention studies in healthy subjects and
patients have used short term ECG recordings. Those who have reported an
effect, obviously found it during the day. Only one study has performed a 20
hour recording in congestive heart patients (16), but also in this study increase
in HRV (in the high frequency domain) was observed only during the day. Our
results are in line wi th these studies. We do, however, not have an explanation
for this, other than a greater challenge to circulatory homeostasis during the
day.
92

Heart rate variability
Interpretation
It is generally assumed that HRV is a measure of parasympathetic activity.
Therefore, increase in HRV in subjects of our intervention group may reflect
increase in parasympathetic activity. Such a training induced parasympathetic
increase may counteract the increased sympathetic activity with advancing age
and, thus, reduce the risk of myocardial ischemia and fatal arrhythmias.1 Still
the interpretation of training adaptations in the various frequency domain
components remains unsolved. However, if the association between physical
activity and HRV on the one hand, and the association between HRV and
incidence of cardiac events, on the other, is confirmed by other studies,
physical activity may have preventive implications.
In conclusion, a 6 months' intensive training programme resulted in a moderate
increase in heart rate variability, primarily during the day, among a group of
elderly in both time domain (SD-RR) as well as frequency domain (VLF, LF).
Hence, in elderly subjects, physical training is an effective means to positively
modify a factor that is associated with increased risk of cardiac events.
References:
1. Kleiger RE, Miller JP, Bigger JT Jr, Moss AJ, The Multicenter Post-infarction Research
Group. Decreased heart rate variability and its association with increased mortality after
acute myocardial infarction. Am J Cardiol 1987;59:256-262.
2. Bigger JT Jr, Fleiss JL, Rolnitzky LM, Steinman RC. Frequency domain measures of heart
period variability to assess risk late after myocardial infarction. Circulation 1992;85:164-
171.
3. Farrell TG, Bashir Y, Cripps T, Malik M, Poloniecki J , Bennett ED, Ward DE, Camm AJ. Risk
stratification for arrhythmic events in postinfarction patients based on heart rate variability,
ambulatory electrocardiographic variables and the signal-averaged electrocardiogram. J Am
Coll Cardiol 1991;18:687-697.
4. Tsuji H, Venditti FJ, Manders ES, Evans JC, Larson MG, Feldman CL, Levy D. Reduced
heart rate variability and mortality risk in an elderly cohort. The Framingham heart study.
Circulation 1994;90:878-883.
93

Chapter 5
5. Tsuji H, Larson MG, Venditti FJ, Manders ES, Evans JC, Feldman CL, Levy D. Impact of
reduced heart rate variability on risk for cardiac events. The Framingham heart study.
Circulation 1996;94:2850-2855.
6. Dekker JM, Schouten EG, Klootwijk P, Pool J, Swenne CA, Kromhout D. Heart rate
variability from short ecg recordings predicts mortality from all cause in middle-aged and
elderly men: The Zutphen Study. Am J Epidemiol 1997 in press.
7. Schwartz PJ, Priori SG. Sympathetic nervous system and cardiac arrhythmias. In: Zipes DP,
Jalife (eds). Cardiac electrophysiology. From cell to bedside. Philadelphia: WB Saunders
company,1990:330-334.
8. Pfeiffer MA, Weinberg CR, Cook D, Best JD, Reenan A, Halter JB. Differential changes of
autonomic nervous system function with age in man. Am J Med 1983;75:249-258.
9. Duke, PC, Wade JG, Hickey RF, Larson CP. The effect of of age on baroreceptor reflex
function in man. Can Anaest J 1976;23:111-124.
10. Shimada K, Tadao K, Ogura H, Sadakane N, Ozawa T. Differences in age-independent
effects on blood pressure on baroreflex sensitivity between normal and hypertensive
subjects. Clin Sei 1986;70:489-494.
11. Schwartz JB, Gibb WJ, Tran T. Aging effects on heart rate variation. J Geront
1991;46:M99-106.
12. De Meersman RE. Heart rate variability and aerobic fitness. Am Heart J 1993;125:726-731.
13. Dixon EM, Kamath MV, Mc Cartney N, Fallen EL. Neural regulation of heart rate variability
in endurance athletes and sedentary controls. Cardiovasc Res 1992;26:713-719.
14. Goldsmith R, Bigger JT, Steinman R, Fleiss J. Comparison of 24 hour parasympathetic
activity in endurance-trained and untrained young men. J Am Coll Cardiol 1992;20:552-
558.
1 5. Seals DR, Chase PB. Influence of physical training on heart rate variability and baroreflex
circulatory control. J Appl Physiol 1989;66:1886-1895.
16. Kiilavuori K, Toivonen L, Näveri H, Leinonen. Reversal of autonomic derangements by
physical training in chronic heart failure assessed by heart rate variability. Eur Heart J
1995;16:490-495.
17. La Rovere MT, Mortara A, Sandrone G, Lombardi F. Autonomic nervous system adaptations
to short term exercise training. Chest;5:1 992:299S-303S.
18. Malfatto G, Facchini M, Bragato R, Branzi G, Sala L, Leonetti G. Short and long term effects
of exercise training on the tonic autonomic modulation of heart rate variability after
myocardial infarction. Eur heart J 1996;17:532-538.
19. Coats AJ, Adamopoulos S, Radaelli A, McCance A, Meyer TE, Bernardi L, Solda PL, Davey
P, Ormerod 0, Forfar C. et al. Controlled trial of physical training in chronic heart failure.
Exercise performance, hemodynamics, ventilation and autonomic function. Circulation
1992;85:2119-2131.
20. Adamopoulos S, Ponikowski P, Cerquetani E, Piepoli M, Rosano G, Sleight P, Coats AJ.
Circadian pattern of heart rate variability in chronic heart failure patients. Effects of physical
training. Eur Heart J 1995;16:1380-1386.
94
Heart rate variability
21 . Boutcher SH, Stein P. Association between heart rate variability and training response in
sedentary middle-aged men. Eur J Appl Physiol 1995;70:75-80.
22. Bootsma M, Swenne CA, Van Bolhuis HH, Chang PC, Manger Cats V, Bruschke AVG. Heart
rate and heart rate variability as indexes of the sympathovagal balance. Am J Physiol (Heart
Circ Physiol) 1994;266:H1565-H1 571.
23. Sacknoff DM, Gleim GW, Stachenfeld N, Coplan NL. Effect of athletic training on heart rate
variability. Am Heart J 1994;127:1275-1278.
24. Furlan R, Piazza S, Dell'Orto S, Gentile E, Cerutti S, Pagani M, Malliani. Early and late
effects of exercise and athletic training on neural mechanisms controlling heart rate. Cardiov
Research 1993;27:482-488.
25. Alani M, Munir SM, White M, Townend J, Coote JH. Changes in RR variability before and
after endurance training measured by power spectral analysis and by the effect of isometric
muscle contraction. Eur J Appl Physiol Occup Physiol 1996;74:397-403.
95

Chapter 5
96
CHAPTER 6
The effect of regular activity on symptoms of
depression and physical self-efficacy in elderly:
Comparison between two exercise protocols
AJ Schuit, A den Buitelaar, EG Schouten
submitted for publication
97

Chapter 6
ABSTRACT
The effects of regularly performed exercise during 6 months on symptoms of
depression and physical self-efficacy were assessed in elderly men and
women. The subjects were randomly allocated to (a) a supervised group
exercise programme, comprising various activities (b) an individually performed
exercise-bicycle programme at home and (c) a control group. Symptoms of
depression were assessed using the Centre for Epidemiologic Studies
Depression Scale (CES-D), physical self-efficacy was assessed using a sub-scale
of the Self-Efficacy Scale, so-called Dutch LIVAS-scale.
After 6 months, symptoms of depression were reduced in men and
women of the intervention group, but this reduction was not significantly
different from the control group and could therefore not be attributed to the
intervention programme. However, the CES-D item 'experiencing depressive
mood in the past week' was significantly less common in elderly people of the
group exercise programme (P<0.05) . In addition, after the intervention,
physical self-efficacy was increased in both intervention groups as compared to
the controls, but particularly in the all-round group exercise programme. Change
in CES-D was significantly associated with change in LIVAS (beta -0.27 unit
increase LIVAS per 1 unit increase of CES-D, SE 0.11).
In conclusion, these data indicate that regular physical activity may
positively affect physical self-efficacy, in particular among elderly following an
all-round activity programme. It may be speculated that increase in physical
self-efficacy, in combination with the social aspects of group exercise may
(ultimately) lead to a reduction in occurrence of depressive symptoms in elderly.
98
Depression and self-efficacy
INTRODUCTION
Cross-sectional and longitudinal studies have shown an inverse relationship
between regular physical activity and symptoms of depression in elderly,
independent from health and socio-economic status.1"4 It was suggested that
physical self-efficacy (defined as self-efficacy related to physical status and
functioning) may act as a potential mediator in this relationship.5 However, the
design of these studies did not allow conclusions about the temporality of this
association. Physical activity may affect physical and psychological well-being,
or it may be the other way around, well being may influence the amount of
physical activity.
Intervention studies, investigating the effect of training on physical self-
efficacy, although only few in number, seem to report consistent beneficial
effects.6,7 The effects of training on symptoms of depression, however, remain
inconclusive.814 Some studies report beneficial effects,12"14 whereas others do
not f ind any effect8"11 of physical training. It also remains unclear, whether it
is the exercise itself or the social component causing changes in depressive
symptoms.
Insight into the effects of exercise training on depressive
symptomatology and physical self-efficacy may be important, since advancing
age is associated with functional losses and dependency, which may have a
great impact on both physical and psychological well-being.15 Prevalence of
depressive symptoms in the Dutch elderly population is estimated to be 9% in
men and 16% in women.1 6
We studied the effects of regularly performed exercise on depressive
symptomatology and physical self-efficacy in a group of Dutch elderly men and
women randomly assigned to either (a) group exercise programme, the so-
called all-round activity group (b) an individually performed exercise bicycle
programme and (c) a control group. This way we were able to compare the
effects of individual and groupwise exercise.
99
Chapter 6
SUBJECTS AND METHODS
Subjects
The study population consisted of apparently healthy elderly people, aged 60 to
80. Subjects were asked, via their general practitioner, to participate in an
intervention study investigating the effects of 6 months exercise training on
cardiovascular risk factors. 152 men and 166 women volunteered. Compared
wi th refusers, these volunteers were slightly younger (men: 68,5 ± 5,5 vs
71,5 ± 5,6, women 67,8 ± 5,4 vs 70,5 ± 5,4), and less often considered
themselves inactive as compared to peers (men 4 9 % vs 77%, women 4 8 % vs
77%). All volunteers provided informed consent and the study was approved
by the Medical Ethical Commitee of the Agricultural University Wageningen.
Volunteers were screened to make sure they were fit to participate in a
physical exercise programme. Subjects with hypertension or abnormalities in
resting or exercise electrocardiogram were excluded from the study (39 men
and 50 women). This left us with a study population of 113 men and 116
women.
Participants were randomly assigned to an exercise bicycle group (48
men and 48 women), an all-round activity group (25 men and 22 women) or a
control group (40 men and 46 women). During the intervention 12 men and 19
women prematurely stopped with the bicycling programme, 5 men and 5
women withdrew from the all-round activity group and 2 men and 2 women
withdrew from the control group. Main reason for withdrawal from the exercise
bicycle group were medical problems (50%) and lack of motivation (40%),
while subjects in the all-round activity group withdrew primarily because of time
restraints (70%). Primary reason for withdrawal from the control group were
family circumstances.
100
Depression and self-efficacy
Training
Elderly in the exercise bicycle group trained on an exercise bike, four times a
week during half a year. Exercise sessions consisted of 30 minutes of
continuous bicycle ergometry at an equivalent to 70% of their maximal exercise
capacity (Wmax), which was individually determined in the baseline maximal
exercise test. Adherence to the bicycle protocol was on average 8 6 % for men
and 8 1 % for women of the prescribed training sessions. Subjects of the all-
round activity group gathered 3 times a week for a 45 minutes training session,
led by an experienced sports instructor, during half a year. The training
consisted of aerobic exercise, callisthenics and flexibility exercises. The
attendance in the all-round activity group was 7 2 % for men and 8 1 % for
women. Subjects in the control group received no intervention and were asked
to maintain their habitual activities during the intervention period, but
undertaking more physical activity, if desired, was not discouraged
During the intervention period, subjects from both intervention and
control groups were bimonthly contacted by telephone for an interview and
twice invited for information evenings and social meetings.
Depressive symptoms
Depressive symptomatology was assessed using a Dutch translation of the
Centre for Epidemiologic Studies Depression Scale (CES-D),17 which proved to
be a valid instrument in older adults.16 The scale consists of 20 items, which
inquire about the frequency of experiencing a given symptom during the
previous week on a scale ranging from 0 (rarely or none) to 3 (most or all of the
time). Items emphasise lack of energy, loneliness and negative self image. The
summation of the component scores provides a total score, ranging from 0 to
60, wi th high scores suggesting greater severity and number of symptoms. A
cut-off score of 16 was used to identify respondents with levels of depression
which are clinically relevant.
101
Chapter 6
Physical self-efficacy
Physical self-efficacy was measured using the so-called 'LIVAS'-scale, a Dutch
translation of the Perceived Physical Activity Scale, which is a sub-scale of
the Self-Efficacy Scale19. It was adapted for the use with elderly persons by
replacing the category 'running' by 'going up and down the stairs'. Before the
intervention, physical self-efficacy was determined by 10 questions asking
subjects to evaluate their physical capacities compared to other people of their
own age on a 5 point scale. After the intervention, physical self-efficacy was
determined by the same questions, but this time subjects had to evaluate their
physical capacities as compared to these at the beginning of the intervention.
The total score is a summation of the individual items. Higher scores indicate
higher physical self-efficacy. The score ranges from -20 to 20. The LIVAS-scale 20
has been shown to be a valid tool to assess physical self-efficacy at old age.
Data analysis
Change in CES-D and LIVAS was compared between intervention groups and
control group using Dunnetts t-test or Students t-test. The association between
change in CES-D score and LIVAS score was investigated using univariate
regression analysis. All data-analyses were performed with SAS 6.09
(Statistical Analysis System; SAS Institute Inc. Cary, USA).
RESULTS
Baseline characteristics and associations
Table 6.1 shows the baseline characteristics of the subjects who completed the
protocols. Subjects in the all-round activity group were younger than the
controls, but no significant differences were observed in CES-D and LIVAS
score between the groups. The prevalence of depressive symptoms as assessed
by a CES-D score of 16 or higher was 3.5% in men and 7 .8% in women, which
102
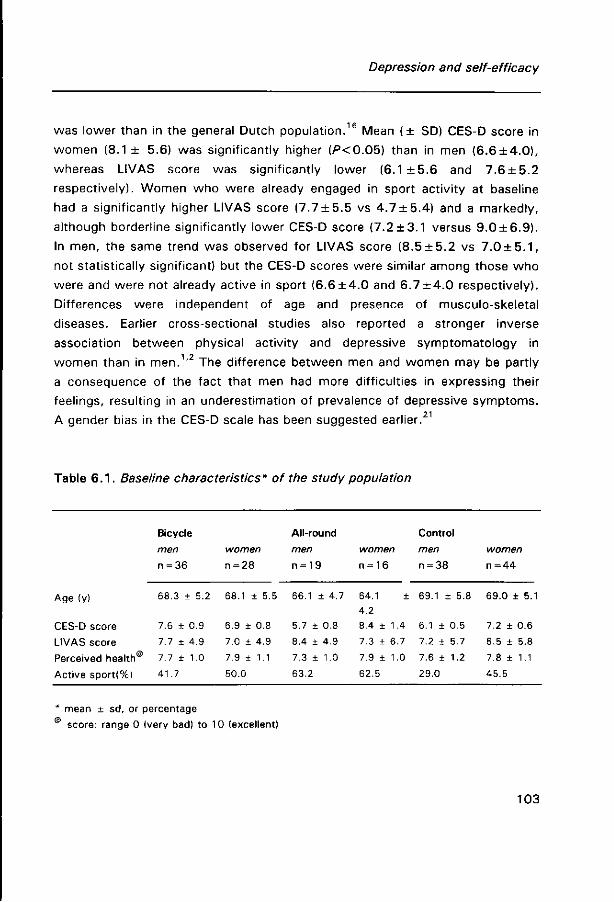
Depression and self-efficacy
was lower than in the general Dutch population.16 Mean ( ± SD) CES-D score in
women (8.1 ± 5.6) was significantly higher (P<0.05) than in men (6 .6±4 .0 ) ,
whereas LIVAS score was significantly lower (6.1 ± 5 . 6 and 7.6 + 5.2
respectively). Women who were already engaged in sport activity at baseline
had a significantly higher LIVAS score ( 7 .7±5 .5 vs 4 .7±5 .4 ) and a markedly,
although borderline significantly lower CES-D score ( 7 .2±3 .1 versus 9 .0±6 .9 ) .
In men, the same trend was observed for LIVAS score ( 8 .5±5 .2 vs 7 . 0 ± 5 . 1 ,
not statistically significant) but the CES-D scores were similar among those who
were and were not already active in sport ( 6 .6±4 .0 and 6 . 7 ± 4 . 0 respectively).
Differences were independent of age and presence of musculo-skeletal
diseases. Earlier cross-sectional studies also reported a stronger inverse
association between physical activity and depressive symptomatology in
women than in men.1 ,2 The difference between men and women may be partly
a consequence of the fact that men had more difficulties in expressing their
feelings, resulting in an underestimation of prevalence of depressive symptoms.
A gender bias in the CES-D scale has been suggested earlier.21
Table 6 . 1 . Baseline characteristics* of the study population
Age (y)
CES-D score
LIVAS score
Perceived health
Act ive sport ! %)
Bicycle
men
n = 36
68.3 ± 5.2
7.6 ± 0.9
7.7 ± 4.9
7.7 ± 1.0
41.7
women
n = 28
68.1 ± 5.5
6.9 ± 0.8
7.0 ± 4.9
7.9 ± 1.1
50.0
All-round
men
n = 19
66.1 ± 4.7
5.7 ± 0.8
8.4 ± 4.9
7.3 ± 1.0
63.2
women
n = 16
64.1 ±
4.2
8.4 ± 1.4
7.3 ± 6.7
7.9 ± 1.0
62.5
Control
men
n = 38
69.1 ± 5.8
6.1 ± 0.5
7.2 ± 5.7
7.6 ± 1.2
29.0
women
n = 44
69.0 ± 5.1
7.2 ± 0.6
6.5 ± 5.8
7.8 ± 1.1
45.5
* mean ± sd, or percentage
score: range 0 (very bad) to 10 (excellent)
103

Chapter 6
Intervention effects
Table 6.2 shows the observed changes in CES-D scores and post intervention
LIVAS scores, separately for men and women of the intervention and control
group. Symptoms of depression according to the CES-D score were reduced in
men and women of the intervention groups, but this decline was not
significantly different from the change in the control group, and could therefore
not be attributed to the programme. The expected greater improvement in CES-
D score among subjects in the all-round activity group, based on its social
component, did not occur. However, the CES-D item 'have you experienced a
depressive mood in the past week' was, significantly lower after the
intervention period in men and women of the all-round group as compared with
the controls (P<0.05, Students t-test).
Other intervention studies investigating the effect of training on
symptoms of depression have shown inconsistent results. Some studies
reported improvement of symptoms of depression in elderly,12"14 whereas other
studies fail to show any changes.8"11 In general, beneficial effects of training
were particularly observed in subjects who initially had depressive symptoms.
Our study population was healthier and had less depressive symptoms than a
general elderly population and training effects may have therefore been smaller.
Table 6.2. Change* in CES-D score and LIVAS score after 6 months intervention
Bicycle men
n = 36
women
n = 28
All-round men
n = 18
women
n = 16
Control
men
n = 37
women
n = 43
CES-D -2.2 ± 1.3 -2.5 ± 1.2 -2.4 ± 0.8 -1.6 ± 1.1 -2.8 ± 0.9 0.2 + 1.0
LIVAS 2.6 ± 0.7* 2.5 ± 0.8* 4.9 ± 0.8* 6.9 ± 1.3* -0.1 ± 0.3 -0.1 ± 0.3
* mean ± standard error
* P < 0.05 Dunnett t-test intervention groups versus control group
104
Depression and self-efficacy
Physical self-efficacy was markedly increased among subjects of the
intervention groups, and particularly elderly of the all-round activity group, as
compared to the controls (P<O.Ob). Elderly people of the intervention groups
perceived an increase in strength, flexibility, speed of response and fitness
(P<0.05, component-items of the LIVAS questionnaire). Our results hereby
confirm previous reports.6,7
As suggested by others, change in depressive symptoms was
significantly associated wi th change in physical self-efficacy. Increase in 1 unit
of LIVAS was associated with a reduction of -0.27, (SE 0.11) units in CES-D
within the total group. For women this association was stronger than in men
(beta: -0.39 ± 0.15 and -0.11 ± 0.17 (not significant) respectively). Again,
the gender difference might be explained by the CES-D questionnaire being a
less valid instrument in men than women.
CONCLUSIONS
These data show that regular physical activity enhanced physical self-efficacy
of the older individual, particularly among elderly who followed group training
sessions consisting of an all-round exercise programme. Elevated physical self-
efficacy may lead to a reduction in depressive symptoms, by facilitating
independence and a higher quality of life. Although our study could not
demonstrate significant changes in CES-D score, 'experiencing a depressive
mood during the past week' was significantly lower in the subjects who
followed group training sessions. This study suggests that exercise training in
general, but group training consisting of an all-round exercise programme in
particular, should be recommended to elderly people.
105
Chapter 6
References
1. Farmer ME, Locke BZ, Moscicki EK, Dannenberg AL, Larson DB, Radioff LS. Physical
activity and depressive symptoms: the NHANES I epidemiologic follow-up study. Am J
Epidemiol. 1988;128:1340-1351.
2. Ruuskanen JM, Ruopppila I. Physical activity and psychological well-being among people
aged 65-84 years. Age and Ageing. 1995;24:292-296.
3. O'Conner PJ, Aenchbacher III LE, Dishman RK. Physical activity and depression in the
elderly. J Aging Physl Activity. 1993;1:34-58.
4. Camacho TC, Roberts RE, Lazarus NB, Kaplan GA, Cohen RD. Physical activity and
depression: Evidence from the Alameda County Study. Am J Epidemiol: 1 991; 1 34:220-
231.
5. Davis-Berman J. Physical self-efficacy, perceived physical status and depressive
symptomatology in older adults. The Journal of Psychology. 1989;124:207-21 5.
6. Bosscher RJ, AA van der H, Dasler van der M. Physical performance and physical self-
efficacy in the elderly: a pilot study. J Aging and Health, In Press
7. McAuley E, Rox C, Duncan TE. Long term maintenance of exercise, self-efficacy and
physiological change in older adults. J Geront: Psychological Sciences. 1993;48:218-224.
8. Gitlin L, Powel-Lawton M, Windsor-Landsberg RA, Kleban MH, Sands LP, Posner J. In
search of psychological benefits, exercise in healthy older adults. J Aging and Health.
1992;4:174-192.
9. Blumenthal JA, Emery CF, Madden DJ, Schniebolk S, Walsh-Riddle M, George LK, McKee
DC, Higginbotham MB, Cobb FR, Coleman RF. Long-term effects of exercise on psycholo
gical functioning in older men and women. J Geront: Psychological Sciences 1991;46:
352-361.
10. Blumenthal JA, Shocken DD, Needles TL, Hindle P. Psychological and physiological effects
of physical conditioning on the elderly. J Psychosomatic Research. 1982;26:505-510.
11. McMurdo MET, Burnett L. Randomized controlled trial of exercise in the elderly.
Gerontology. 1992;38:292-298.
12. McNeil JK, leBlanc EM, Joyner M. The effect of exercise on depressive symptoms in the
moderately depressed elderly. Psychology and Aging 1991:6:487-488.
13. Blumenthal JA, Emery CF, Madden DJ, George LK, Coleman RE, Riddle MW, McKee DC,
Reasoner J, Williams RS. Cardiovascular and behavioral effects of aerobic exercise training
in healthy alder men and women. J Geront 1989;44:m147-m1 57.
14. Valliant PM, Asu ME. Exercise and its effects on cognition and physiology in older adults.
Perceptual and Motor Skills. 1985;61:1031-1038.
15. Wagner EH, laCroix AZ, Büchner DM, Larson EB. Effects of physical activity on health
status in older adults I: observational studies. Ann Rev Public Health. 1992;13:451-468.
16. Beekman ATF, Limbeek J van, Deeg DJH, Wouters L, Tilburg W van. Screening for
depression in the elderly in the community: using the Center for Epidemiologic Depression
106

Depression and self-efficacy
Scale (CES-D) in the Netherlands. Tijdschrift voor Gerontologie en Geriatrie. 1994;25:95-
103.
17. Radioff LS. The CES-D scale: a self report depression scale for research in the general
population. Appl Psych Measurement. 1977;1:385-401.
18. Bosscher R, Krommert M, Pennings J, Rebel J, Steggink D, Veldhuizen T van, Vroon R.
Gepercipieerde lichamelijke competentie: gemeten en gewogen. Bewegen en
Hulpverlening. 1987;4:291-310.
19. Ryckman RM, Robbins MA, Thornton B, Cantrell P. Development and validation of a
physical self-efficacy scale. J Personality Social Psychology. 1982;42:891-900.
20. Bosscher RJ, Laurijssen L, Boer E de. Measuring physical self-efficacy in old age.
Perceptual and Motor Skills. 1993;77:470.
21 . Stommel M, Given BA, Given CW, Kalaian HA, Schultz R, McCorkle R. Gender bias in the
measurement properties of the Center for Epidemiologic Studies Depression Scale (CES-D).
Psych Research 1993;49:239-20.
107

Chapter 6
108
CHAPTER 7
Validity of the Physical Activity Scale for the Elderly
(PASE) according to energy expenditure assessed by
the doubly labelled water method
A J Schuit, EG Schouten, KR Westerterp, WHM Saris
Journal of Clinical Epidemiology: in press
109

Chapter 7
ABSTRACT
The study investigates the validity of the Physical Activity Scale for the Elderly
(PASE) in 21 Dutch elderly men and women. The PASE is an easily scored,
brief questionnaire for elderly, suitable for large epidemiological studies. The
PASE-score was compared with physical activity measured wi th the doubly
labelled water method.
The correlation coefficient of the PASE-score with the residuals from the
regression analysis using total energy expenditure as dependent and resting
metabolic rate as independent variate was 0.58 (95% CI: 0.50-0.81). Women
had greater engagement in extremely high scoring activities as housework and
taking care of others, resulting in higher PASE-scores than men (97.9 and
71.9). The higher scores in women were not linked to higher activity levels,
which suggests that the mentioned activities may be overvalued. Sex specific
correlation coefficients were 0.79 (CI: 0.32-0.95) and 0.68 (CI: 0.15-0.90) for
men and women respectively.
In conclusion, the PASE proved to be a reasonable valid method to
classify healthy elderly men and women into categories of physical activity.
Some possible refinements were suggested, which may improve accuracy of
the PASE questionnaire.
110
Validity PASE-questionnaire
INTRODUCTION
Epidemiological studies, investigating the effect of physical activity on health,
often use questionnaires to assess physical activity. Questionnaires are cheap,
not labour consuming and if valid are a very useful tool to assess physical
activity in a general population. Validity of questionnaires is usually examined
with pulse records,1 motion sensors or accelerometers.2"4 Food intake1,2,5 or
cardiorespiratory fitness and body composition3 are used as proxies as well.
The doubly labelled water (DLW) method, is considered as the golden standard
in measuring energy expenditure in free-living subjects.6,7 However, costs of
this method are considerable and it is used only in small scale studies.
We assessed the validity of the Physical Activity Scale for the Elderly
(PASE) developed by The New England Research Institute,8 using the doubly
labelled water method. The PASE was used to monitor changes in physical
activity among elderly participating in an controlled intervention study, which
investigated the cardiovascular response to regular physical activity. The PASE
is designed to assess activities commonly engaged in by elderly persons. It
assesses the activity of the past week, enabling detection of changes in activity
over a relatively short period of time. The questionnaire does not estimate
energy expenditure, like most questionnaires do, but produces a score with
which subjects can be compared.
However, the questionnaire was designed for American elderly, who
have a slightly different life style compared to Dutch elderly. We therefore
adjusted the PASE questionnaire and we tested its validity among 21 elderly
men and women with the doubly labelled water method.
SUBJECTS AND METHODS
Subjects
The subjects of this study were recruited from the participants of an
intervention study, which was four months underway. The participants were
residents of Arnhem, a middle sized city in the Netherlands. All elderly, age
range 60 to 80 years, met the inclusion criteria for the intervention study: no
111
Chapter 7
heart failure, no angina pectoris, no insulin dependent diabetes mellitus, no use
of beta-blockers, and no myocardial infarction or stroke in the past 2 years.
Subjects taking diuretic drugs, that could influence hydration, were excluded
from the study, as this might influence the DLW measurement. At the entrance
of the intervention study, the PASE questionnaire was administered among all
participants. Based on tertiles of the PASE-score, the total population was
stratified in low, middle and high activity groups, men and women separately.
From each of these groups, subjects were selected, in equal numbers from
intervention and control group, 22 in total. Thus a broad range of activities
could be expected. Three subjects refused participation because of time
restraints, therefore a peer from the same group was approached. One man
dropped out a few days before the study started, leaving us with 10 men and
11 women. Subjects of the intervention group gathered 3 times a week for 45
minutes for performing aerobic exercise, callisthenics and flexibility exercises.
Measurements
The validity of the PASE was assessed by comparing the PASE-score with two
measures of physical activity, namely (1) the physical activity ratio (PAR) which
is the ratio of total energy expenditure (TEE) and resting metabolic rate (RMR)
and traditionally and widely used and (2) the residual of the regression wi th TEE
as dependent and RMR as independent parameter, as was recently
recommended.9 TEE was measured with the doubly labelled water method over
a two week period and RMR was measured with a ventilated hood. Since
change in body weight may affect the TEE measurement, body weight was
measured before and after the measurement period. The PASE questionnaire
was administered in the second week of the energy expenditure measurement
with the doubly labelled water method.
The PASE questionnaire
The PASE questionnaire is a brief, easy tool for the assessment of short term
physical activity in epidemiological studies of elderly. It comprises activities
commonly engaged in by elderly persons, and does not emphasise sport and
112
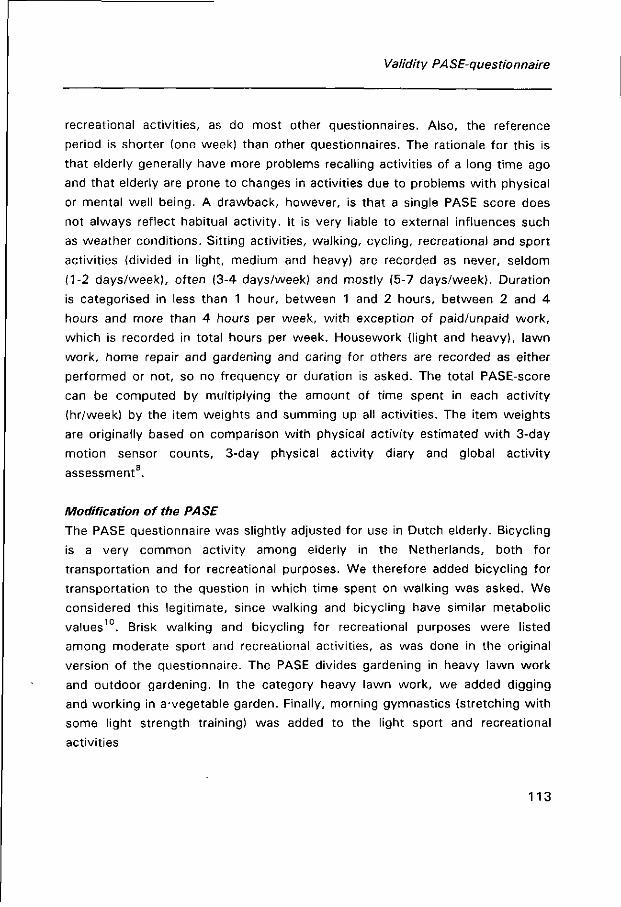
Validity PASE-questionnaire
recreational activities, as do most other questionnaires. Also, the reference
period is shorter (one week) than other questionnaires. The rationale for this is
that elderly generally have more problems recalling activities of a long time ago
and that elderly are prone to changes in activities due to problems with physical
or mental well being. A drawback, however, is that a single PASE score does
not always reflect habitual activity. It is very liable to external influences such
as weather conditions. Sitting activities, walking, cycling, recreational and sport
activities (divided in light, medium and heavy) are recorded as never, seldom
(1-2 days/week), often (3-4 days/week) and mostly (5-7 days/week). Duration
is categorised in less than 1 hour, between 1 and 2 hours, between 2 and 4
hours and more than 4 hours per week, with exception of paid/unpaid work,
which is recorded in total hours per week. Housework (light and heavy), lawn
work, home repair and gardening and caring for others are recorded as either
performed or not, so no frequency or duration is asked. The total PASE-score
can be computed by multiplying the amount of time spent in each activity
(hr/week) by the item weights and summing up all activities. The item weights
are originally based on comparison with physical activity estimated wi th 3-day
motion sensor counts, 3-day physical activity diary and global activity
assessment .
Modification of the PASE
The PASE questionnaire was slightly adjusted for use in Dutch elderly. Bicycling
is a very common activity among elderly in the Netherlands, both for
transportation and for recreational purposes. We therefore added bicycling for
transportation to the question in which time spent on walking was asked. We
considered this legitimate, since walking and bicycling have similar metabolic
values10. Brisk walking and bicycling for recreational purposes were listed
among moderate sport and recreational activities, as was done in the original
version of the questionnaire. The PASE divides gardening in heavy lawn work
and outdoor gardening. In the category heavy lawn work, we added digging
and working in a-vegetable garden. Finally, morning gymnastics (stretching with
some light strength training) was added to the light sport and recreational
activities
113
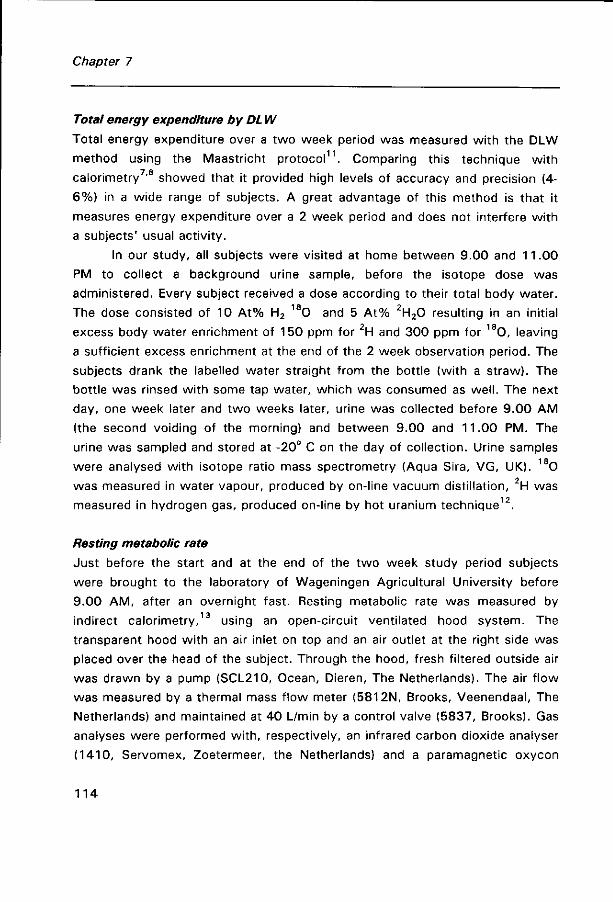
Chapter 7
Total energy expenditure by DL W
Total energy expenditure over a two week period was measured with the DLW
method using the Maastricht protocol11. Comparing this technique with
calorimetry ' showed that it provided high levels of accuracy and precision (4-
6%) in a wide range of subjects. A great advantage of this method is that it
measures energy expenditure over a 2 week period and does not interfere with
a subjects' usual activity.
In our study, all subjects were visited at home between 9.00 and 11.00
PM to collect a background urine sample, before the isotope dose was
administered. Every subject received a dose according to their total body water.
The dose consisted of 10 A t% H2 1 80 and 5 A t% 2H20 resulting in an initial
excess body water enrichment of 150 ppm for 2H and 300 ppm for 1 8 0 , leaving
a sufficient excess enrichment at the end of the 2 week observation period. The
subjects drank the labelled water straight from the bottle (with a straw). The
bottle was rinsed with some tap water, which was consumed as well. The next
day, one week later and two weeks later, urine was collected before 9.00 AM
(the second voiding of the morning) and between 9.00 and 11.00 PM. The
urine was sampled and stored at -20° C on the day of collection. Urine samples
were analysed with isotope ratio mass spectrometry (Aqua Sira, VG, UK). 1 80
was measured in water vapour, produced by on-line vacuum distillation, 2H was
measured in hydrogen gas, produced on-line by hot uranium technique12.
Resting metabolic rate
Just before the start and at the end of the two week study period subjects
were brought to the laboratory of Wageningen Agricultural University before
9.00 AM , after an overnight fast. Resting metabolic rate was measured by
indirect calorimetry,13 using an open-circuit ventilated hood system. The
transparent hood with an air inlet on top and an air outlet at the right side was
placed over the head of the subject. Through the hood, fresh filtered outside air
was drawn by a pump (SCL210, Ocean, Dieren, The Netherlands). The air f low
was measured by a thermal mass f low meter (5812N, Brooks, Veenendaal, The
Netherlands) and maintained at 40 L/min by a control valve (5837, Brooks). Gas
analyses were performed wi th, respectively, an infrared carbon dioxide analyser
(1410, Servomex, Zoetermeer, the Netherlands) and a paramagnetic oxycon
114
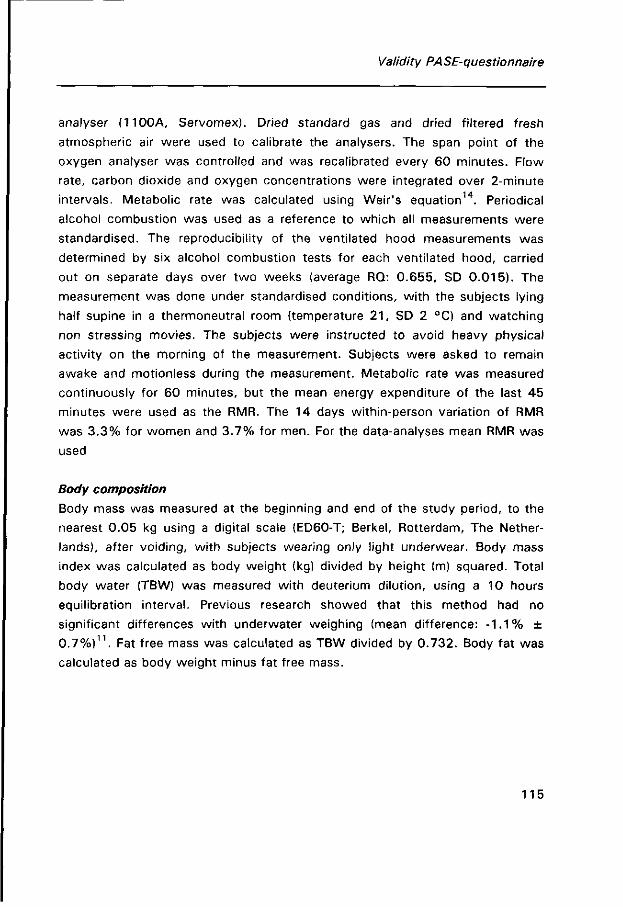
Validity PASE-questionnaire
analyser (1100A, Servomex). Dried standard gas and dried filtered fresh
atmospheric air were used to calibrate the analysers. The span point of the
oxygen analyser was controlled and was recalibrated every 60 minutes. Flow
rate, carbon dioxide and oxygen concentrations were integrated over 2-minute
intervals. Metabolic rate was calculated using Weir's equation14. Periodical
alcohol combustion was used as a reference to which all measurements were
standardised. The reproducibility of the ventilated hood measurements was
determined by six alcohol combustion tests for each ventilated hood, carried
out on separate days over two weeks (average RQ: 0.655, SD 0.015). The
measurement was done under standardised conditions, wi th the subjects lying
half supine in a thermoneutral room (temperature 2 1 , SD 2 °C) and watching
non stressing movies. The subjects were instructed to avoid heavy physical
activity on the morning of the measurement. Subjects were asked to remain
awake and motionless during the measurement. Metabolic rate was measured
continuously for 60 minutes, but the mean energy expenditure of the last 45
minutes were used as the RMR. The 14 days within-person variation of RMR
was 3 .3% for women and 3.7% for men. For the data-analyses mean RMR was
used
Body composition
Body mass was measured at the beginning and end of the study period, to the
nearest 0.05 kg using a digital scale (ED60-T; Berkel, Rotterdam, The Nether
lands), after voiding, wi th subjects wearing only light underwear. Body mass
index was calculated as body weight (kg) divided by height (m) squared. Total
body water (TBW) was measured with deuterium dilution, using a 10 hours
equilibration interval. Previous research showed that this method had no
significant differences with underwater weighing (mean difference: - 1 . 1 % ±
0.7%)1 1 . Fat free mass was calculated as TBW divided by 0.732. Body fat was
calculated as body weight minus fat free mass.
115

Chapter 7
DATA ANALYSIS
Mean values of age, body mass index and percentage body fat derived from the
deuterium dilution technique, were calculated for men and women separately.
For each subject, the PASE score was calculated and mean values for men and
women were computed. To assess the contribution of each activity-item, we
calculated the mean time expenditure per activity in the total group and
multiplied the mean with the item weight. A regression analysis was performed
in men and women combined, with energy expenditure as dependent and
resting metabolic rate as independent variate, to calculate the residuals. The
residuals represent the difference of the actual value with the predicted value of
energy expenditure, according to RMR. A negative residual indicates that a
subjects' energy expenditure was lower than would be expected by the
regression model, which is based on the total group. The correlation of PAR
and residual with the PASE score were calculated. Because of non-normality of
the PASE-score, Spearman correlation coefficients were used.
RESULTS
Table 7.1 shows the baseline characteristics of the study population. Men were
slightly older and had a lower PASE-score than women. The higher PASE-score
of women was mainly due to a more frequent participation in heavy housework
(8 vs 1) and taking care of others (3 vs 0) (for relative contribution of activities
to the PASE score see Table 7.2). Although PAR was similar for men (1.78 ±
0.22) and women (1.85 ± 0.23), women had lower residuals in the regression
analysis with TEE (MJ/day) as dependent and RMR (MJ/day) as independent
variate (Figure 7.1). The regression line had an intercept of 4.08 (SE = 1.4), and
a beta for RMR of 1.11 (SE =0.23) .
Table 7.2 gives an overview of the various activities included in the PASE-
questionnaire. For each activity, average time expenditure or proportion of
participants involved, item weight and contribution to the mean PASE score are
presented, for men and women combined. In our population, walking, cycling
and light housework were the major components of the PASE-score.
116
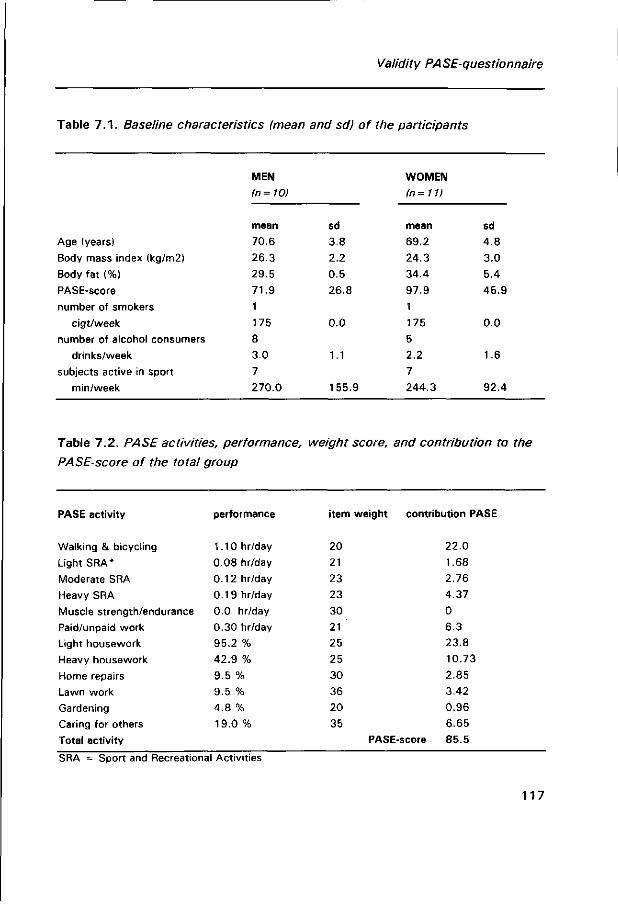
Validity PASE-questionnaire
Table 7 .1 . Baseline characteristics (mean and sd) of the participants
Age (years)
Body mass index (kg/m2)
Body fat (%)
PASE-score
number of smokers
cigt/week
number of alcohol consumers
drinks/week
subjects active in sport
min/week
MEN
In = 10)
mean
70.6
26.3
29.5
71.9
1
175
8
3.0
7
270.0
sd
3.8
2.2
0.5
26.8
0.0
1.1
155.9
WOMEN
(n=11)
mean
69.2
24.3
34.4
97.9
1
175
5
2.2
7
244.3
sd
4.8
3.0
5.4
45.9
0.0
1.6
92.4
Table 7.2. PA SE activities, performance, weight score, and contribution to the
PASE-score of the total group
PASE activity
Walking & bicycling
Light SRA*
Moderate SRA
Heavy SRA
Muscle strength/endurance
Paid/unpaid work
Light housework
Heavy housework
Home repairs
Lawn work
Gardening
Caring for others
Total activity
performance
1.10 hr/day
0.08 hr/day
0.12 hr/day
0.19 hr/day
0.0 hr/day
0.30 hr/day
95.2 %
42.9 %
9.5 %
9.5 %
4.8 %
19.0 %
item weight
20
21
23
23
30
21
25
25
30
36
20
35
PASE
contribution PASE
22.0
1.68
2.76
4.37
0
6.3
23.8
10.73
2.85
3.42
0.96
6.65
score 85.5
SRA = Sport and Recreational Activities
117
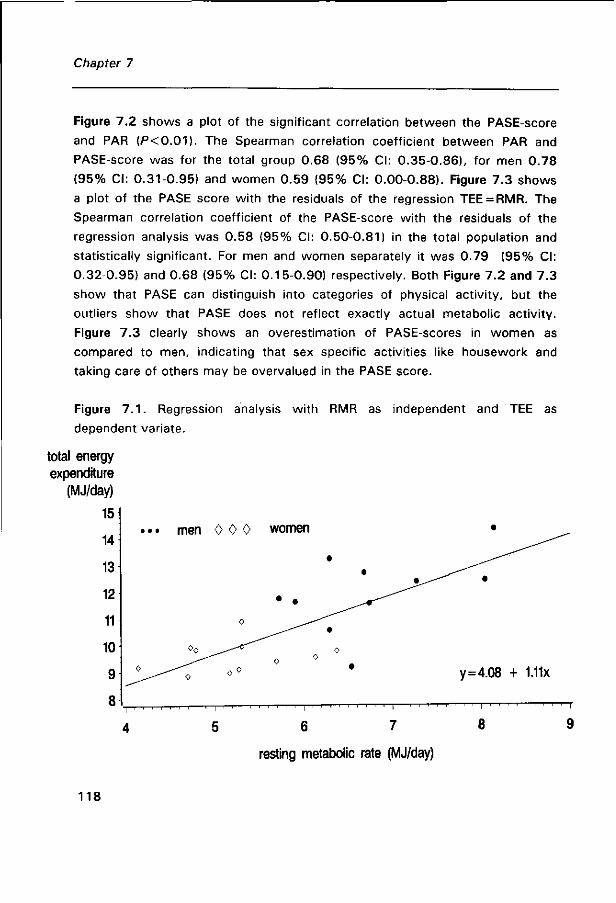
Chapter 7
Figure 7.2 shows a plot of the significant correlation between the PASE-score
and PAR (P<0.01) . The Spearman correlation coefficient between PAR and
PASE-score was for the total group 0.68 (95% CI: 0.35-0.86), for men 0.78
(95% CI: 0.31-0.95) and women 0.59 (95% CI: 0.00-0.88). Figure 7.3 shows
a plot of the PASE score with the residuals of the regression TEE = RMR. The
Spearman correlation coefficient of the PASE-score with the residuals of the
regression analysis was 0.58 (95% CI: 0.50-0.81) in the total population and
statistically significant. For men and women separately it was 0.79 (95% CI:
0.32-0.95) and 0.68 (95% CI: 0.15-0.90) respectively. Both Figure 7.2 and 7.3
show that PASE can distinguish into categories of physical activity, but the
outliers show that PASE does not reflect exactly actual metabolic activity.
Figure 7.3 clearly shows an overestimation of PASE-scores in women as
compared to men, indicating that sex specific activities like housework and
taking care of others may be overvalued in the PASE score.
Figure 7 . 1 . Regression analysis with RMR as independent and TEE as
dependent variate.
total energy expenditure
(MJ/day)
15
14
13
12
11
10
9
8
• • •
0
men
<>0
0
0 0 0 w
0
0<> y = 4.08 + 1.11x
6 7
resting metabolic rate (MJ/day)
- r
9
118
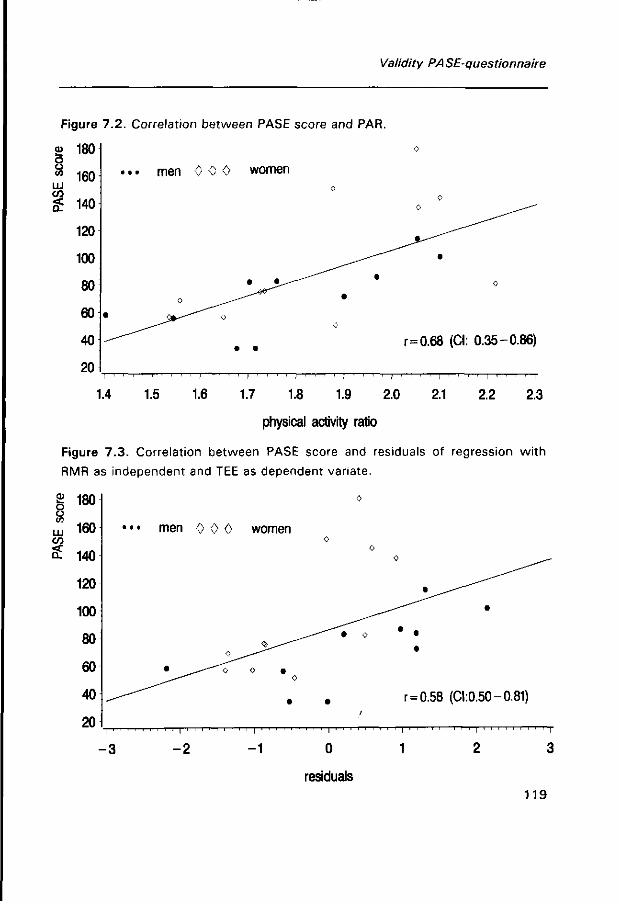
Validity PASE-questionnaire
Figure 7.2. Correlation between PASE score and PAR.
£ 180 o 8 160 LU CO
£ 140
120
100
80
60
40
20
•. • men 0 0 0 women
• •
r = 0.68 (CI: 0.35-0.86)
i ' ' ' ' i ' ' ' ' i ' ' ' ' i ' ' ' ' i ' ' ' ' i ' ' ' ' i ' ' ' ' i ' ' ' ' I ' ' ' ' i
1.4 1.5 1.6 1.7 1.8 1.9 2.0 2.1 2.2 2.3
physical activity ratio
Figure 7.3. Correlation between PASE score and residuals of regression with
RMR as independent and TEE as dependent variate.
CD
o o
LU CO
180
160
140
120
100
80
60
40
20 i
• • • men 0 0 0
0
• ^ - " " ^ o
I ' ' ! ' ' ' ' ' ' I
women
J^^~^ 0 •
0
•
' I
0
0 0
- — " " t 0
• ;
' I
0 ^ ^ ~
• • •
r = 0.58 (0:0.50-0.81)
- 3 - 2 - 1 0 1
residuals
119
Chapter 7
DISCUSSION
The PASE questionnaire is an easily scored, quick tool to assess physical
activity in an elderly population. PAR (TEE/RMR) as well as the residuals from
the regression analysis with TEE as dependent and RMR as independent were
used as measures of physical activity. Both measures were significantly
correlated with the PASE score (r = 0.68 and r = 0.58 respectively), indicating
that PASE discriminates categories of physical activity reasonably well and
therefore is suitable for epidemiological studies. However, PASE does not
accurately measure individual metabolic activity.
Energy expenditure
Lately, there has been some discussion on what would be the best way to
correct TEE by RMR in order to estimate physical activity15,16. Carpenter has
suggested the use of residuals of the regression TEE = RMR, rather than the
ratio TEE/RMR for comparison of physical activity between subjects, because
the regression line of TEE and RMR generally does not pass through the origin.
Cole and colleages15 on the other hand showed that the ratio truly is a valid
index of TEE corrected for RMR, using data from a group of 574 adults and
children. In our study the intercept was significantly different from zero in both
the linear and the log-log model. Consequently, PAR may overestimate physical
activity in subjects of our group with a low RMR (women) as compared to
subjects wi th a high RMR (men). We therefore believe that use of the residual
method is more appropriate for comparison of physical activity in our study
than use of PAR. We still present PAR in this article because it is widely used.
PASE-score
Women of our study population had higher PASE scores than men. The mean
difference in PASE-score between men and women was mainly due to a greater
engagement of women in heavy housework and taking care of others, which
120

Validity PA SE-questionnaire
added respectively 25 and 35 points to the score. However, the RMR-adjusted
energy expenditure levels of women, were not higher than men. This may
indicate that the PASE questionnaire overestimates womens' physical activity
as compared to men, due to an incorrect weighing of heavy housework and
caring for others. We therefore conducted an additional analysis in which we
assigned successively one half and one quarter of the original item weight to
these activities. As expected, the correlation coefficients improved with both
measures to 0.68 and 0.71 respectively for one half the item weight and 0.71
and 0 .74 for one quarter of the item weight, men and women combined. The
difference in mean PASE-score between men and women resulted in a weaker
correlation between PASE score and the residuals in the total group as
compared to the gender specific correlations.
The stronger correlation between PASE-score and PAR, as compared to the
residuals, in the total group can be explained by a concomitant higher PASE-
score and higher PAR in women.
Washburn et al report higher PASE-scores for men than women in both
younger and older elderly8. The difference with our study group may be
explained by a more equal division of heavy housework and taking care of
others among American men and women, or by a greater engagement of Ameri
can men in gardening, which is designated to a score comparable to heavy
housework. The paper reports a higher engagement of American elderly in lawn
work (45.6% vs 9.5%) and outdoor gardening (26.8% vs 4.8%) as compared
to our population and although no gender specific data are presented, it is likely
that men more frequently perform gardening activities than women. Our study
was carried out in the winter period during which hardly any garden work is
performed.
Compared to the American elderly, the elderly in our population spent
more time on walking (and bicycling) per day (1.10 hr vs 0.65 hr) and on
strenuous sport activity (0.19 hr vs 0.07 hr), the latter partly due to the
intervention programme. Strenuous activity does not highly contribute to the
PASE-score (an hour of heavy sport activity per week for example results only
in 3.3 extra points), but this seems justified, because in our study group it also
did not significantly affect total energy expenditure. Taking item weights two or
three times higher for heavy sport activity did not produce higher correlation
121

Chapter 7
coefficients. It might be argued that the physical activity of the intervention
was not sufficiently represented in the PASE score of the intervention subjects.
However, total energy expenditure on physical activity was not different
between intervention and control subjects (PAR: both groups 1.82, residuals
intervention 0.14, control -0.15). Thus, it seems that the intervention
programme did not disturb the performance of the PASE.
Conclusion
The PASE questionnaire proved to be a reasonably valid method to classify
healthy elderly people into levels of physical activity. We do believe however,
that if time spent on gardening, housework and taking care of others, were
taken into account in calculation of the score (similar to calculation of sport and
recreational activities) or if the item weights of these activities would be
reduced, classification would be even better. This might also prevent
overvaluation of gender specific tasks, such as housework and gardening.
Although the PASE score does not reflect actual metabolic activity, it may be
very useful for characterising physical activity level in large epidemiological
studies. However, because some highly contributing activities may be different
between populations (i.e. outdoor activities can only be performed under good
weather conditions, or distribution of household tasks), one should also be
cautious in comparing PASE scores among populations with different back
ground.
References
1. Sallis JF, Buno MJ, Roby JJ, Micale FG, Nelson JA. Seven-day recall and other physical
activity self-reports in children and adolescents. Med Sei Sports Exerc 1993;25:99-108.
2. LaPorte RE, Black-Sandier R, Cauley JA, Link M, Bayles C, Marks B. The assessment of
physical activity in older women: analysis of the interrelationship and reliability of activity
monitoring, activity surveys, and caloric intake. J Geront 1983;38:394-397.
3. Ainsworth BE, Jacobs DR, Leon AS. Validity and reliability of self-reported physical activity
status; the Lipid Research Clinics questionnaire. Med Sei Sports Exerc 1993;25:92-98.
122
Validity PASE-questionnaire
4. Haskell WL, Yee MC, Evans A, Irby PJ. Simultaneous measurement of heart rate and body
motion to quantitate physical activity. Med Sei Sports Exerc 1993;25:109-115.
5. Arroll B, Jackson R, Beaglehole R. Validation of a three-month physical activity recall
questionnaire with a seven-day food intake and physical activity diary. Epidemiology
1991;2:296-299.
6. Westerterp KR, Brouns F, Saris WHM, Hoor F ten. Comparison of doubly labeled water with
respirometry at low- and high-activity levels. J Appl Physiol 1988;65:53-56.
7. Schoeller DA, Ravussin E, Schultz Y, Acheson KJ, Baertschi P, Jéquier E. Energy
expenditure by doubly labeled water: validation in humans and proposed calculation. Am J
Appl Physiol 1986;250:R823-R830.
8. Washburn RA, Smith KW, Jette AM, Janney CA. The physical activity scale for the elderly
(PASE): Development and evaluation. J Clin Epidemiol 1993;46:153-162.
9. Carpenter WH, Poehlman ET, O'Connell M, Goran Ml. Influence of body composition and
resting metabolic rate on variation in total energy expenditure: a meta-analysis. Am J Clin
Nutr 1995;61:4-10.
10. Ainsworth BE, Haskell WL, Leon AS, Jacons DR, Montoye HJ, Sallis JF, Paffenbarger RS.
Compendium of physical activity: classification of energy costs of human physical activities.
Med Sei Sports Exerc 1993;25:71-80.
11. Westerterp KR, Wouters I, Marken Lichtenbelt van WD. The Maastricht protocol for the
measurement of body composition and energy expenditure with labeled water. Obesity
Research 1995;3:49-57.
12. Wong WW, Klein PD. A review of techniques for the preparation of biological samples for
mass-spectrometric measurements of hydrogen-2/hydrogen-1 and oxygen-18/oxygen-16
isotope ratios. Mass Spec Rev 1986;5:313-342.
13. Weststrate JA. Resting metabolic rate and diet-induced thermogenesis: a methodological
reappraisal. Am J Clin Nutr 1993;58:592-601.
14. Weir JBV. New methods for calculating metabolic rate with special reference to protein
metabolism. J Physiol 1949;109:1-9.
15. Cole TJ, Black AE, Coward WA, Prentice AM. Total energy expenditure and basal metabolic
rate. Am J Clin Nutr 1996;63:281.
123

Chapter 7
124
CHAPTER 8
Short note on (long-term) adherence to physical
training; Comparison between two exercise protocols
125

Chapter 8
126
(Long-term) adherence to exercise programme
Introduction
Until now most studies investigating the relation between exercise and health in
elderly have focussed on physiological effects. Information about the feasibility
and continuity of regular exercise in this age group is sparse. For example, little
is known about motives of elderly to exercise and how exercise training is
experienced. 'Do they enjoy it; are they motivated?' and even more important,
'Do they continue with physical activity, once the intervention programme is
over?' Therefore, all subjects of the intervention group were followed up for 6
additional months, in order to monitor their physical activities. In this chapter
we will briefly discuss the two different intervention programmes in terms of
adherence and continuation of regular exercise.
Adherence to the intervention protocols
Bicycle group: Adherence to the bicycle programme was determined as a
proportion of 3 targets: (a) intensity, (b) days per week and (c) duration per
training session. The adherence among subjects who stayed in the programme
until the end was impressive; 98%, 84% and 89% respectively, considering the
intensity and duration of the cycling programme. Main reasons for non-
adherence were illness and vacation.
Still, not everyone was able to complete the 6 months' bicycling
programme. In fact, drop out was 32%, half of which was due to lack of
motivation. Moreover, although we can not quantify it, some of the participants
continued with the programme, because they were determined to 'finish what
they started', and not because they still enjoyed it. Thus, regular intensive
training on an exercise bike at home is not feasible for all elderly people.
All-round activity group: Attendance to the programme in the all-round activity
group was monitored by the instructor. For men and women this was 72% and
8 1 % respectively. Considering the fact that the hours were f ixed, we believe
that this adherence was again very good. Non-adherence to the programme in
the all-round activity group was, like in the bicycle group, also mainly due to
127

Chapter 8
illness and vacation. Lack of motivation played a minor role. Drop out (23%)
was mainly due to an overbooked agenda.
The training programme was evaluated after the intervention period. 3 6 %
of the elderly answered that 3 times per week training was too often, while
6 4 % thought it was good. The intensity of the training was good for 7 9 % of
the elderly, 9% considered it too high and 12% too low. Ball games were
preferred by 6 4 % of the elderly group, physical conditioning by 2 1 % and
jogging by 6%. All participants were convinced that the training session
enriched their lives, both physically as well as mentally. Especially the social
interaction w i th men and women of their age was greatly appreciated. This also
became apparent when, after the intervention period, almost 9 0 % of the
subjects continued with the training sessions on their own initiative and
expense.
Longterm adherence of regular physical activity
In order to evaluate post-intervention exercise, men and women of the
intervention group were invited for a personal interview about their habitual
activities, 6 months after they left the programme. In total 46 men and 34
women participated, 8 4 % and 76% of the invited subjects.
Bicycle group: Six months after the intervention programme, elderly men and
women of the bicycle group reduced time spent on sport activity1 (with 4 0 %
and 8 0 % respectively). Women became even less active in sport than before
the intervention period (now only about 2 hours per months). However,
remarkably, mean hours of outdoor bicycling were doubled in women (from 95
to 185 minutes per week) and also slightly increased in men (from 130 to 145
minutes per week). Hours spent on walking did not materially change.
All-round activity group: Subjects in the all-round activity group also reduced
time spent on sport activity. Instead of 20 hours per month, men spent about
11 hours per month on sport activity. In women these numbers were 15 and 8
hours respectively. Most elderly subjects continued with the all-round training
sessions, but only once per week for 1.5 hour (instead of 3 times an hour).
Mean hours spent on walking per week did not markedly change, but mean
128
(Long-term) adherence to exercise programme
hours spent on outdoor bicycling was reduced with about 4 5 % (from 130 to 90
minutes per week).
Summary and conclusions
In summary, participants of the intervention groups who completed the protocol
adhered very well to the programme. It may, however, overestimate adherence
to exercise programmes in the general elderly population, because our
participants were not only relatively healthy and active, but also very
motivated. The high drop out in the bicycle group, due to lack of motivation,
suggests that individual activity is less stimulating than groupwise physical
activity. Six months after the intervention, subjects had about halved the time
spent on exercise. Therefore, a training programme, such as the one described
in this thesis does not seem feasible in the long term. Since group training has
more chances of success in elderly people, it should preferably be
recommended to all elderly individuals.
Sport activity comprised tennis, swimming, bal-games, horse-back-riding, gymnastics
and exercise biking.
129

Chapter 8
130

CHAPTER 9
General Discussion
131
Chapter 9
The main objective of the study presented in this thesis was to investigate the
effect of regular physical activity for 6 months, either individually on an
exercise bicycle or group-wise in a supervised all-round exercise programme, on
classical and on some more recently emerged CHD risk factors ('new risk
factors') in a healthy elderly population. The classical risk factors have been
addressed in Chapter 2, and the new risk factors, such as fibrinogen, factors
involved in the fibrinolysis and autonomic regulation of the heart have been
reported in Chapter 3 to 5. The focus of the thesis is on the effects of training
on the new risk factors, because firstly, there is a great paucity of information
on this association and secondly, these new risk factors may be particularly
important in elderly. In general, advanced atherosclerosis is prevalent in elderly
people, and coagulation factors like fibrinogen, and fibrinolytic factors are
specifically associated with the progression of atherosclerosis and manifestation
of thrombosis. Unfavourable autonomic control may add to the risk of
myocardial infarction and may trigger cardiac arrhythmia. In addition to risk
factors for CHD, we also investigated the effect of regular activity on physical
and psychological well-being.
In this chapter we will start with briefly summarising the most important
results of the study and compare them with those of other studies. Blood
pressure, a risk factor that has not been described in this thesis, will be
addressed as well. Then, the biological inference of our results will be
discussed. Furthermore, we discuss some problems which are specifically
encountered in intervention studies in the elderly population and address the
internal and external validity and power of the study. The chapter closes with
the possible health impact of the training effects observed in our study, a
general conclusion and suggestions for future research.
Main findings
Physical Fitness. After 6 months of training, elderly subjects of both
intervention groups had significantly improved physical fitness and strength.
Both maximal oxygen consumption and maximal exercise capacity gained about
132
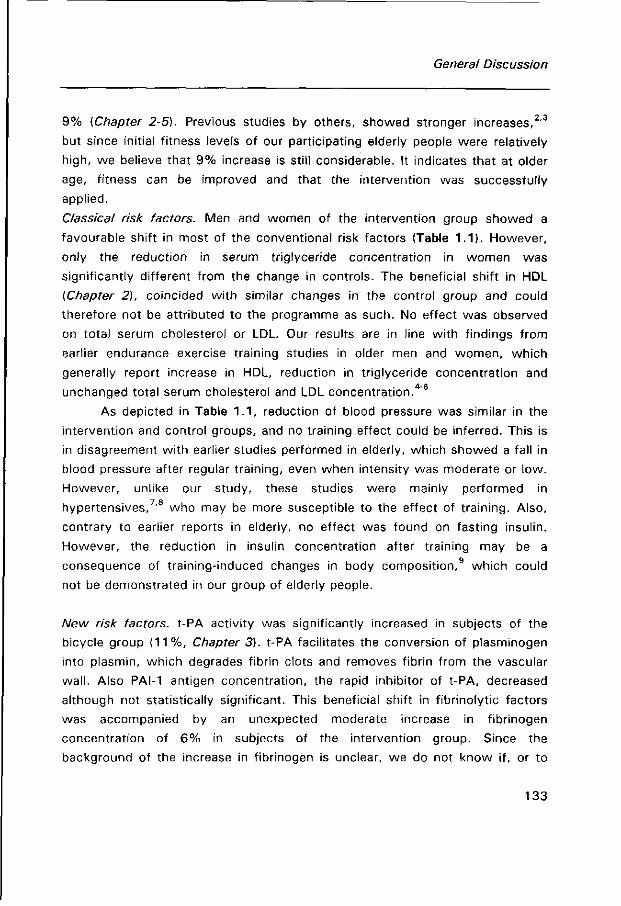
General Discussion
9% (Chapter 2-5). Previous studies by others, showed stronger increases,2,3
but since initial fitness levels of our participating elderly people were relatively
high, we believe that 9% increase is still considerable. It indicates that at older
age, fitness can be improved and that the intervention was successfully
applied.
Classical risk factors. Men and women of the intervention group showed a
favourable shift in most of the conventional risk factors (Table 1.1). However,
only the reduction in serum triglyceride concentration in women was
significantly different from the change in controls. The beneficial shift in HDL
(Chapter 2), coincided with similar changes in the control group and could
therefore not be attributed to the programme as such. No effect was observed
on total serum cholesterol or LDL. Our results are in line with findings from
earlier endurance exercise training studies in older men and women, which
generally report increase in HDL, reduction in triglyceride concentration and
unchanged total serum cholesterol and LDL concentration.4"6
As depicted in Table 1.1, reduction of blood pressure was similar in the
intervention and control groups, and no training effect could be inferred. This is
in disagreement with earlier studies performed in elderly, which showed a fall in
blood pressure after regular training, even when intensity was moderate or low.
However, unlike our study, these studies were mainly performed in
hypertensives,7,8 who may be more susceptible to the effect of training. Also,
contrary to earlier reports in elderly, no effect was found on fasting insulin.
However, the reduction in insulin concentration after training may be a
consequence of training-induced changes in body
not be demonstrated in our group of elderly people.
consequence of training-induced changes in body composition,9 which could
New risk factors. t-PA activity was significantly increased in subjects of the
bicycle group ( 1 1 % , Chapter 3). t-PA facilitates the conversion of plasminogen
into plasmin, which degrades fibrin clots and removes fibrin from the vascular
wall. Also PAI-1 antigen concentration, the rapid inhibitor of t-PA, decreased
although not statistically significant. This beneficial shift in fibrinolytic factors
was accompanied by an unexpected moderate increase in fibrinogen
concentration of 6% in subjects of the intervention group. Since the
background of the increase in fibrinogen is unclear, we do not know if, or to
133
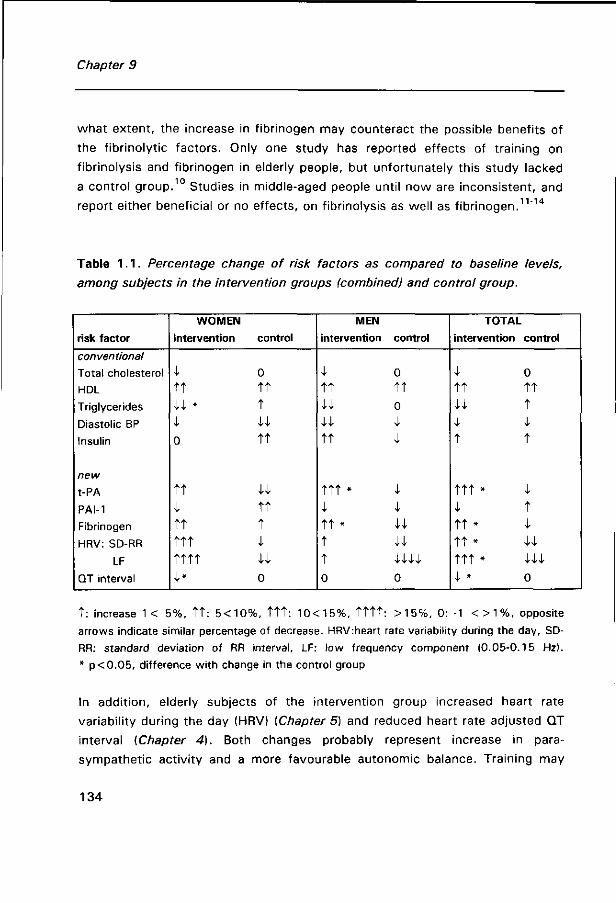
Chapter 9
what extent, the increase in fibrinogen may counteract the possible benefits of
the fibrinolytic factors. Only one study has reported effects of training on
fibrinolysis and fibrinogen in elderly people, but unfortunately this study lacked 10
a control group. Studies in middle-aged people until now are inconsistent, and
report either beneficial or no effects, on fibrinolysis as well as fibrinogen.11"14
Table 1.1. Percentage change of risk factors as compared to baseline levels,
among subjects in the intervention groups (combined) and control group.
risk factor
conventional
Total cholesterol
HDL
Triglycerides
Diastolic BP
Insulin
new
t-PA
PAI-1
Fibrinogen
HRV: SD-RR
LF
QT interval
WOMEN
Intervention
I t t w * i 0
TT 1 t t t t t t t t t 1*
control
0 t t t
u t t
u t t t i
u 0
MEN
intervention
I t t
u u t t
't"t"t' *
I 1"t' #
t t 0
control
0
t t 0
I I
I i 44 44 v/4/4/4/
0
TOTAL
intervention control
i 0 t t t t 44 t ; i t t
t t t * i i t t t * i t t * U ttt * m l * 0
t : increase 1< 5%, t t : 5<10%, t t t : 10<15%, t t t t : >15%, 0: -1 < > 1 % , opposite arrows indicate similar percentage of decrease. HRV:heart rate variability during the day, SD-RR: standard deviation of RR interval, LF: low frequency component (0.05-0.15 Hz). * p<0.05, difference with change in the control group
In addition, elderly subjects of the intervention group increased heart rate
variability during the day (HRV) {Chapter 5) and reduced heart rate adjusted QT
interval [Chapter 4). Both changes probably represent increase in para
sympathetic activity and a more favourable autonomic balance. Training may
134

General Discussion
counteract the unfavourable shift towards sympathetic activity with advancing
age, and may improve the autonomic control of the heart. This may prevent
arrhythmia and sudden death. To our knowledge only one study has
investigated the effect of training on HRV in elderly people,15 and also observed
a beneficial change. No reports on training effects on QT interval have been
found in the literature.
Physical and psychological well being. Physical self-efficacy, in general, and
perceived fitness, walking pace, flexibility, speed of response and strength, in
specific, were improved in the subjects of the intervention groups, as compared
to the controls. Our results are in line with previous studies reporting the effect
of training on physical self-efficacy.16,17 Symptoms of depression were slightly
reduced in subjects of the intervention groups, but not statistically significant
as compared to the change in the controls (Chapter 6). A reduction in
depressive symptoms has been reported before,18"20 however, other studies did
not find any training effect.2 '22
(Long-term) adherence: Adherence to the bicycle and all-round exercise
protocols was satisfactory among the subjects who completed the study until
the end. Non-adherence in this group was mainly due to illness and vacation.
However, a considerable proportion of the elderly could not comply with the
programmes and dropped out during the intervention (32% bicycle group, 2 3 %
all-round activity group, lack of motivation and lack of time being the main
reasons respectively). These data suggest that group-wise training consisting of
an all-round exercise programme is more stimulating for elderly and therefore
preferably recommended over individual training. Six months after the
intervention, subjects had about halved the time spent on exercise. Therefore, a
training programme, such as the one described in this thesis does not seem
feasible (without additional effort) in the long term (Chapter 8).
Validity of physical activity questionnaire. The modified 'Physical Activity Scale
for Elderly' (PASE) proved to be a reasonably valid method to classify the
healthy elderly people participating in our study in categories of physical
activity. Validity was assessed using energy expenditure assessed with the
135

Chapter 9
doubly labelled water method as the standard. The PASE proved to be a very
useful tool to monitor physical activity regularly over a period of time. It may be
especially useful in large epidemiological studies, since it is easily and quickly
administered (Chapter 7).
Biological inference
Atherosclerosis is caused by multiple interacting factors, such as high blood
pressure, disturbed lipid metabolism, endothelial cell damage leading to platelet
aggregation, and disorders of the fibrin balance leading to persisting fibrin
deposition. A disturbed fibrin balance at the vessel wall may be due to either
increased fibrin formation or impaired fibrinolysis. Plasma fibrinogen affects the
formation of fibrin thrombi23 and is an important determinant of platelet
aggregation.24 Impaired fibrinolysis may predispose to fibrin deposits and
contribute to (a) the pathogenesis of atherosclerosis and to (b) occlusive
thrombus formation on plaques provoking atherothrombosis. The latter is the
most common precipitating event causing of acute myocardial infarction.
Epidemiological data strongly suggest that insulin resistance, associated
with abdominal adiposity, is involved in the pathogenesis of atherothrombosis.26
It has been suggested that hyperinsulinemia promotes atherosclerosis by a
direct effect of insulin on the vascular wall (although likely to be modest2 ), or
(more important) by an effect on cardiovascular risk factors, such as
dyslipidemia (increased VLDL, decreased HDL)28 '29 and hypertension. Recently,
it was suggested that PAI-1 is also related to insulin resistance. In vitro studies
showed that insulin stimulates PAI-1 secretion by cultured human
hepatocytes.30 Finally, insulin resistance has been linked to excessive activation
of the sympathetic nervous system.
It may be speculated that training has a beneficial influence on insulin
resistance by favourably changing body composition. Reduction of body fat,
may result in reduced insulin resistance and insulin concentration. Reduction in
insulin concentration may subsequently lead to beneficial changes in
136
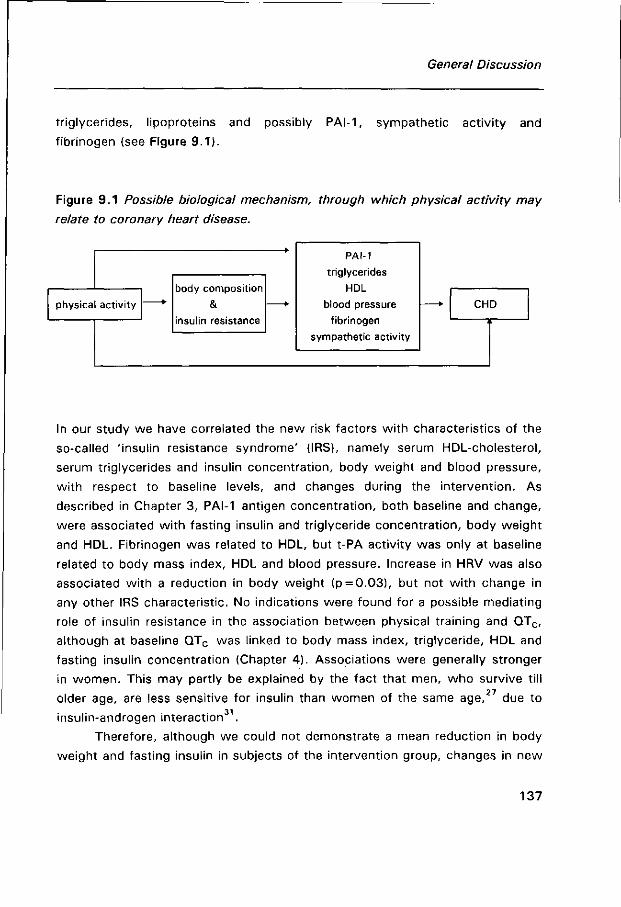
General Discussion
triglycerides, lipoproteins and possibly PAI-1, sympathetic activity and
fibrinogen (see Figure 9.1).
Figure 9.1 Possible biological mechanism, through which physical activity may
relate to coronary heart disease.
physical activity
body composition
& insulin resistance
PAI-1
triglycerides
HDL
blood pressure
fibrinogen
sympathetic activity
CHD
In our study we have correlated the new risk factors with characteristics of the
so-called 'insulin resistance syndrome' (1RS), namely serum HDL-cholesterol,
serum triglycerides and insulin concentration, body weight and blood pressure,
with respect to baseline levels, and changes during the intervention. As
described in Chapter 3, PAI-1 antigen concentration, both baseline and change,
were associated with fasting insulin and triglyceride concentration, body weight
and HDL. Fibrinogen was related to HDL, but t-PA activity was only at baseline
related to body mass index, HDL and blood pressure. Increase in HRV was also
associated with a reduction in body weight (p = 0.03), but not wi th change in
any other 1RS characteristic. No indications were found for a possible mediating
role of insulin resistance in the association between physical training and QTC,
although at baseline QTC was linked to body mass index, triglyceride, HDL and
fasting insulin concentration (Chapter 4). Associations were generally stronger
in women. This may partly be explained by the fact that men, who survive till
older age, are less sensitive for insulin than women of the same age,27 due to
insulin-androgen interaction .
Therefore, although we could not demonstrate a mean reduction in body
weight and fasting insulin in subjects of the intervention group, changes in new
137
Chapter 9
risk factors were often related to changes in weight and fasting insulin. Notice
that the absence of body weight reduction does not exclude the possibility that
subjects changed their body composition, by losing fat mass and gaining
muscle mass. Moreover, we did not measure insulin resistance itself, but used
fasting insulin as a proxy. Therefore, we can not rule out the possibility that
change in insulin resistance among subjects of the intervention groups has
occurred.
In conclusion, our data can not provide evidence that exercise induced
change in the new risk factors is mediated by change in insulin resistance, but
do give an indication that PAI-1 reduction may be affected by this.
Methodological considerations
A major advantage of a randomised controlled intervention study is that, on
average, the intervention and control group are expected to be comparable with
respect to study parameters and confounders, even unknown confounders.
Potential confounding, caused by differences in baseline characteristics that
affect the change over the intervention period, is hereby reduced. Since, also
the probability of possible differential errors is smaller than in observational
studies, experimental studies provide the strongest evidence for causality.
Still, physical activity intervention has some drawbacks, compared with
many clinical or pharmacological trials, since it cannot be properly placebo-
controlled, nor blinded. This may affect the internal validity of such a study. On
top of that, studies in the elderly are beset by many difficulties, that are less a
problem in studies of younger people. For example, willingness to participate
and adherence are lower in elderly than in younger groups, due to physical
incapacity, or family circumstances1. This may affect both external and internal
validity of the study. In the following the internal and external validity as well
as the power of the study will be addressed.
138
General Discussion
Internal validity
Success of randomisation: Despite randomisation, men and women of the all-
round activity group were somewhat younger and had a higher body mass
index than the elderly subjects of the bicycle and control group. This may
suggest that randomisation was not completely successful in achieving the
desired comparability of the groups. However, it is not conceivable that these
differences will have had a strong modifying effect on the changes in risk
factors as a consequence of training, and will have biased the results to a great
extent.
Selection bias: As referred to in the previous chapters, premature withdrawal
from the intervention study was highest in the intervention groups (32% in the
bicycle group and 23% in the all-round activity group versus 5% in the control
group). Drop out, as observed in our study, is inevitable and an inherent
problem in an intervention study wi th physical activity, especially when elderly
people are involved. However, if reasons for drop out during the intervention
were related to the change in the study parameters, selection bias may have
been introduced. Indeed, in our study reasons for premature withdrawal were
different between the intervention and control group. In the all-round activity
group it was mainly due to time constraints, and in the bicycle group it was
mainly due to motivation problems and physical restraints, whereas in the
control group it was mainly due to family circumstances (Chapter 2). Because
we did not perform a post intervention measurement among subjects who
withdrew prematurely, we could not investigate the effects of training in these
subjects. However, since in general, drop outs were less f it than compilers, and
the greatest changes in risk factors may be expected in the least f it, we believe
that a possible selective drop out may have rather led to an underestimation
than an overestimation of the training effect.
Observation bias: Because our study was not completely blinded, we can not
rule out the possibility of observation bias in our study. However, observation
bias is likely to be limited to only a few study parameters in the post
intervention measurement; All baseline measurements were done before the
139
Chapter 9
randomisation and except for the interview, Anthropometry and blood pressure
measurement, post-intervention data collection was blinded for the subjects'
assignment. Anthropometry and blood pressure measurement were performed
according to strict protocols and the interview consisted of mainly
prestructured answer categories. Therefore, risk of interviewer bias was
minimised. Nevertheless, the subjects in the intervention and control group may
have reported events differently.
In addition, inaccuracies in laboratory measurements of the blood
parameters may have occurred. However, since such inaccuracy is expected to
be similar in intervention and control group and therefore non-differential, it will
most probably have led to an underestimation of the true differences in effect
between intervention and control group.
Change in the control group: As reported in Chapter 2 to 5, CHD risk factors
were also changed in subjects in the control group, in either a beneficial
direction, (e.g. HDL and blood pressure), or an unfavourable direction (e.g.
HRV, t-PA and PAI-1). Theoretically, improvement in risk factors might be
explained by an increase in physical activity similar to that in the intervention
group. However, if this were the case, one would expect to find an
improvement in all parameters. The reduction in blood pressure at the post
intervention measurements in both groups may be explained by the fact that
subjects were then more at ease, than at the pre-intervention measurement.
In addition, seasonal variation in the parameters may explain the change
in the control group (and intervention group). However, information on seasonal
variation in the new risk factors is sparse, and precludes speculations on its
potential impact.
Confounding: During the intervention, change in unmeasured parameters,
independently associated with both physical activity and the CHD risk factor,
may have confounded the observed associations. It remains unclear to what
extent this confounding may have biased our results. However we believe that
this bias is probably minor compared with bias introduced by a selective drop
out.
140
General Discussion
External validity
The participants of our study were not a representative sample of a general
elderly population in the Netherlands. Not only did we select the elderly on
basis of good health (see inclusion criteria introduction, Figure 1.3), those
willing to participate were more active and considered themselves more healthy
in comparison with those who did not. The selective nature of our study
population limits the generalizability of our study results to the general elderly
population. We do however expect, that were the same intervention performed
in the general population with similar adherence, the effect of training would
have been similar, if not greater, since health benefits are expected to be
highest in the least active groups.32
In the 'main findings' and in the discussion sections of the separate chapters
we have already addressed the comparability of our findings wi th those of other
studies.
Power of the study
The purpose of the study was to recruit 100 subjects in both bicycle and
control group and 50 subjects in the all-round activity group. Unfortunately,
these numbers were not met. Not only were more elderly people excluded
during the screening phase (30%), also drop out was higher than initially
expected. Originally, the numbers per group were based on a power calculation
for the classical risk factors (serum lipids and blood pressure), because
information on inter- and intra-individual variation for the new risk factors was
lacking. Despite smaller numbers we were, fortunately, able to demonstrate
significant changes in most of the new risk factors in the intervention as
compared to the controls, except for PAI-1. Owing to the large variation in PAI-
1 change (standard deviation of change was 35% of initial value), the power of
this study was insufficient (only 20%) to observe a difference of 5 ng/mL (10%
of baseline) between intervention and control group, with a significance level of
0.05. Training effects on blood pressure, HDL, insulin and total serum
141
Chapter 9
cholesterol were either absent or too small ( < 5%) to be demonstrated in this
study, at this level of significance.
Public health implications
In industrialised societies the proportion of individuals reaching old age has
been increasing and will probably continue to increase in the future. Among the
elderly population, vulnerability to most diseases is increased. Diseases of the
cardiovascular system cause more than 4 0 % of the deaths in the elderly
population, of which CHD is the most common disease. In 1995, more than
8 0 % of the total CHD deaths in the Netherlands were among subjects of 65 33
years and older.
The aetiology of CHD is multifactorial. Although elderly people are
survivors and may therefore be less susceptible to CHD, classical CHD risk
factors are still important in people over 65 years of age.34,35 Also the new risk
factors, described in this thesis, are likely to be important predictors of CHD in
elderly. The atheroma related morbidity and mortality is mostly due to plaque
ulceration followed by thrombosis. An impaired fibrinolysis may contribute to
the thrombotic events whereas autonomic balance may predict the outcome of
the event.
Considering this, we have solid reason to assume that the observed
beneficial effects of training on fibrinolytic activity and autonomic balance,
observed in our study, may affect CHD risk. Moreover, the increase in physical
fitness, observed in our study, may affect CHD and total mortality risk. Blair et
al. have reported a four-fold risk of total mortality in men and women of the
lowest fitness quintile as compared to the highest, independent from CHD risk
factors. The association was even stronger for CHD (eight-fold risk), but the
reported relative risk was solely adjusted for age and not for the risk factors of
CHD. The increase in fibrinogen, especially observed after strenuous exercise,
may warrant safety and may suggest preference of moderate activity.
Altogether, it is very likely that training will beneficially influence CHD
risk in elderly subjects. However, the magnitude of the impact remains difficult
142
General Discussion
to determine. Unfortunately, until now very few studies have addressed the
predictive value of fibrinolytic factors, such as PAI-1 and t-PA, or measures of
autonomic balance, such as QTC interval and HRV, on CHD risk in elderly.
Therefore we are unable to quantify the public health impact wi th respect to
CHD of our activity programme. However, since elderly people tend to have
more atherosclerosis and a more unfavourable autonomic balance than middle
aged, the impact in absolute terms may be even greater than in middle-aged
subjects.
Finally, but very important, apart from an effect on morbidity and
mortality, regular physical activity may also slow down the age-associated loss
in functionality and independence. In our study, physical self-efficacy was
markedly increased among subjects of the intervention groups. Thus, regular
physical activity may facilitate increased self-confidence and competence in
dealing with daily activities, like dressing, shopping and washing, and
consequently with the quality of life.
Future research
Our study was performed in a rather healthy and active population. There still
lies a great challenge in exploring the effects of regular exercise in less active
and less healthy elderly, e.g. frail elderly. Intervention among frail or primarily
inactive elderly will particularly be difficult in terms of willingness to participate
and adherence. Still, insight into training effects in these groups is needed, not
only wi th respect to CHD risk factors, but also to determine training effects on
physical functioning and well-being. With this information available,
recommendation for training in elderly people in general and specific subgroups
can be developed.
In addition, physiological and biochemical research is needed to
investigate the mechanisms underlying the observed responses to exercise in
elderly, especially wi th respect to the new risk factors, described in this thesis.
Evidence from these type of studies may support inference on the causality of
the associations.
143

Chapter 9
Finally, research is warranted to investigate the predictive value of the
new risk factors in elderly people. As previously stated in this thesis, we
speculate that the new risk factors may be particularly important in elderly.
However there is insufficient data to support this hypothesis.
Conclusion
Although definitive evidence documenting the beneficial effects of exercise
training on mortality and disability in the elderly is still lacking, it becomes more
evident that CHD risk factors and physical fitness and self-efficacy, which are
important determinants of the quality and quantity of life for older individuals
are beneficially affected by exercise training. We think that regular physical
exercise may be recommended to all elderly individuals, provided that it is
performed safely. Safety precautions should include (a) a prior medical
examination, (b) a balanced training program, in which intensity and frequency
are slowly and gradually increased, and, if possible, (c) supervision by an
experienced instructor. Exercise in group setting would be preferred, in order to
assure long-term adherence.
References
1. Kelsey JL, O'Brian LA, Grisso JA, Hofman S. Issues in carrying out epidemiologic research
in the elderly. Am J Epidemiol 1989;130:857-66.
2. Hagberg JM, Graves JE, Limacher M, Woods DR, Legge« SH, Cononie C, Gruber JJ,
Pollock ML. Cardiovascular responses of 70-79 yr old men and women to exercise
training. J Appl Physiol 1989;66:2589-2594.
3. Kohrt WM, Malley M, Coggan A, Spina R, Ogawa T, Ehsani AA, Bourey RE, Martin WH,
Holloszy JO. Effects of gender, age, and fitness level on response of V02max to training in
60-71 yr olds. J Appl Physiol. 1991 ;71:2004-2011.
4. Seals DR, Hagberg JM, Hurley BF, Ehsani AA, Hollsozy JO. Effects of endurance training
on glucose tolerance and plasma lipid levels in older men and women. JAMA
1984;252:645-649.
144
General Discussion
5. Blumenthal JA, Emery CF, Madden DJ, Coleman RE, Riddle MW, Cobb FR, Sullivan MJ,
Higginbotham MB. Effects of exercise training on cardiorespiratory function in men and
women over 60 years of age. Am J Cardiol 1991;67:633-639.
6. King AC, Haskell WL, Young DR, Oka RK, Stefanick ML. Long term effects of varying
intensities and formats of physical activity on participation rates, fitness and lipoproteins
in men and women aged 50-65 years. Circulation 1995;91:2596-2604.
7. Hagberg JM, Montain SJ, Martin WH, Ehsani AA. Effect of exercise training on 60-69 yr
old persons with essential hypertension. Am J Cardiol 1989;64:348-353.
8. Cononie CC, Graves JE, Pollock ML, Philips Ml, Sumners C, Hagberg JM. Effect of
exercise training on blood pressure in 70-79 yr old men and women. Med Sei Sports Exerc
1991;23:505-511.
9. Hagberg JM. Physical activity, fitness, health and aging. In: Physical activity, fitness and
health. International proceedings and consensus statement, eds. Bouchard, Shepard RJ,
Stephens T.p 993-1005.
10. Stratton JR, Chandler WL, Schwartz RS, Cerquiera MD, Levy WC, Kahn SE, Larson VG,
Cain KC, Beard JC, Abrass IB. Effect of physical conditioning on fibrinolytic variables and
fibrinogen in young and old healthy adults. Circulation 1991;83:1692-1697.
11. Rankinen T, Rauramaa R, Väisänen S, Halonen P, Penttilä. Blood coagulation and
fibrinolytic factors are unchanged by aerobic exercise or fat modified diet. Randomized
clinical trial in middle aged men. Fibrinolysis 1994;8:48-53.
12. De Geus EJC, Kluft C, de Bart ACW, van Doornen LJP. Effects of exercise training on
plasminogen activator inhibitor activity. Med Sei Sports Exerc 1992;24:1210-1219.
13. Anderssen SA, Haaland A, Hjermann I, Urdal P, Gjesdal K, Holme I. Oslo diet and exercise
study: a one-year randomized intervention trial. Effects on hemostatic variables and other
coronary risk factors. Nutr Metab Cardiovasc Dis 1995;5:189-200.
14. Ponjee GAE, Janssen EME, Hermans J, Vanwersch JWJ. Regular physical acitivity and
change in risk factors for coronary heart disease: A nine months prospective study. Eur J
Clin Chem Clin Biochem 1996;34:477-483
15. Seals DR, Chase PB. Influence of physical training on heart rate variability and baroreflex
circulatory control. J Appl Physiol 1989;66:1886-1895.
16. Bosscher, R.J., H. van der Aa, M. van der Dasler. Physical performance and physical self-
efficacy in the elderly: a pilot study. J Health Aging, In Press.
17. McAuley, E., C. Rox, T.E. Duncan. Long term maintenance of exercise, self-efficacy and
physiological change in older adults. Journal of Gerontology: Psychological Sciences.
1993;48:218-224.
18. McNeil, J.K., E.M. leBlanc, M. Joyner. The effect of exercise on depressive symptoms in
the moderately depressed elderly. Psychology and Aging 1991:6:487-488.
19. Blumenthal, J.A., CF. Emery, D.J. Madden, L.K. George, R.E. Coleman, M.W. Riddle,
D.C. McKee, J. Reasoner, R.S. Williams. Cardiovascular and behavioral effects of aerobic
exercise training in healthy alder men and women. J Geront 1989;44:m147-m1 57.
145
Chapter 9
20. Sidney, K.H., R.J. Shephard. Attitudes towards health and physical activity in the elderly:
Effects of a physical training program. Medical Sciences and Sports. 1976;8:246-252.
2 1 . Gitlin L, Powel-Lawton M, Windsor-Landsberg RA, Kleban MH, Sands LP, Posner J. In
search of psychological benefits, exercise in healthy older adults. J Aging Health.
1992;4:174-192.
22. Bennet J, Carmack MA, Gardner VJ. The effect of a program of physical exercise on
depression in older adults. Phys Educator 1982;39:21-24.
23. Lowe GDO, Wood DA, Douglas JT et al.Relationships of plasma viscosity, coagulation and
fibrinolysis to coronary risk factors and angina. Thromb Haemostasis 1991;65:339-343.
24. Meade TW, Vickers MV, Thompson SG et al. Epidemiological characteristics of platelet
aggregability. Br Med J 1985;290:428-432.
25. Dewood MA, Spores J, Notske R et al. Prevalence of total coronary occlusion during the
early hours of transmural myocardial infarction. N Engl J Med 1980;303:879-902.
26. Sowers JR, Standley PR, Ram JL, Jacober S, Simpson L, Rose K. Hyperinsulinemia, insulin
resistance, and hyperglycemia: Contributing factors in the pathogenesis of hypertension
and atherosclerosis. Am J Hypertension 1993;6(Suppl 2):260S-270S.
27. Stolk RP, Bots ML, Pols HAP, Hofman A, Lamberts SWJ, Grobbee DE. Insullin,
atherosclerosis and cardiovascular disease in an elderly population. The Rotterdam Study.
Thesis Erasmus University Rotterdam, the Netherlands.
28. Chait A, Bierman EL, Albers JJ. Low density lipoprotein receptor activity in cultured
human skin fibroblasts: Mechanism of insulin induced stimulation. J Clin Invest
1979;64:1309-1319.
29. Olefsky JM, Farquhar JW, Reaven GM. Reappraisal of the role of insulin in
hypertriglyceridemia. A J Med 1974;57:551-560.
30. Kooistra T, Bosma PJ, Tons HA, Van den Berg AP, Meyer P, Princen HM. Plasminogen
activator inhibitor 1 : Biosynthesis and mRNA levels are increased by insulin in cultured
human hepatocytes. Thromb Haemost 1989;62:723-728.
31 . Barret-Connor EL, Cohn BA, Wingard DL, Edelstein SL. Why is diabetes mellitus a stronger
risk factor for fatal ischemic heart disease in women than in men? JAMA 1991 ;265:627-
631.
32. Blair SN. Physical activity, fitness and coronary heart disease. In: Physical activity, fitness
and health, eds Bouchard C, Shepard RJ, Stephens T. 579-591. Human Kinetics
Publishers 1994
33. Statistisch jaarboek Centraal Bureau voor de Statistiek, 1997. Voorburg/Heerlen
34. Weijenberg M. Prospective studies on coronary heart disease in the elderly, the role of
classical and new risk factors. Thesis Agricultural University Wageningen. 1996.
35. Castelli WP, Wilson PWF, Levy D, Anderson K. Cardiovascular risk factors in the elderly.
Am J Cardiol 1 989;63:1 2H-19H.
146

General Discussion
36. Blair SN, Kohl HW, Paffenbarger RS, Clark DG, Cooper KH, Gibbons LW. Physical fitness
and all-cause mortality. A prospective study of healthy men and women. JAMA
1989;262:2395-2401.
37. Tsuji H, Venditti FJ, Manders ES, Evans JC, Larson MG, Feldman CL, Levy D. Reduced
heart rate variability and mortality risk in an elderly cohort. The Framingham heart study.
Circulation 1996;94:2850-2855.
147

Chapter 9
148

Summary
Evidence of an important role of physical activity in the primary prevention of
coronary heart disease (CHD) has grown in recent years. Regular physical
activity may have a favourable impact on 'classical' risk factors, such as
overweight, low serum high density lipoprotein cholesterol (HDL) and high
serum low density lipoprotein cholesterol (LDL), high serum total cholesterol,
high serum triglyceride concentration and high blood pressure. Lately, also
beneficial effects on newly established risk factors, such as fibrinolytic factors
(tissue-type plasminogen activator (t-PA) and plasminogen activator 1 (PAI-1)),
plasma fibrinogen, and factors reflecting the autonomic regulation of the heart
(heart rate variability and QTC interval), have been suggested.
Until now, most studies investigating the effect of regular physical
activity on CHD risk have been performed in middle-aged subjects. Information
about training effects on CHD risk factors in elderly is sparse, especially wi th
regard to the 'new' risk factors. Insight into the effect of regular physical
activity in elderly people is particularly important, (1) the proportion of inactive
people is higher at older age, (2) CHD risk factors become more unfavourable
with advancing age and remain important in predicting CHD. Therefore,
managing of these risk factors may have an important impact on public health.
We have carried out a randomised controlled intervention study, which
addressed the effects of a 6 months training programme on the 'classical' and
'new' risk factors, described above, in a healthy elderly population (60-80 years
old). Furthermore, effects on physical and psychological well-being were
studied. These elderly (n = 229) were randomly allocated to 3 groups: (1) an
exercise bicycle group, in which subjects trained 4 times per week, for 30
minutes, at about 7 0 % of their maximal capacity (Wmax), individually at home,
(2) an all-round activity group, in which subjects trained 3 times per week for
45 minutes, performing various activities, such as ball games, callisthenics and
exercise to music, and (3) a control group, in which subjects were asked to
maintain their habitual activity pattern.
149

Summary
After 6 months training, physical fitness (maximal oxygen consumption
(V02max) and maximal capacity (Wmax)) was significantly increased in subjects
of both training groups with about 9%. This increase was significantly different
from the controls (P<0.01) .
No significant changes were observed in body weight or body fatness,
measured with the sum of skinfolds, in subjects of the training groups. Serum
HDL-cholesterol, total serum cholesterol and serum triglycerides changed in a
favourable direction, but only triglyceride concentration in women of the
training groups was significantly reduced (-0.11± 0.06 mmol/L) as compared
to the controls (P<0.05) , and could be attributed to the intervention
programmes (Chapter 2). In addition, we did not observe a significant effect of
training on blood pressure or fasting insulin concentration.
In general, elderly people have advanced atherosclerosis and higher risk
of thrombosis. Therefore, factors involved in the progression of atherosclerosis
and onset of thrombosis (t-PA, PAI-1 and fibrinogen) may be of particular
importance in this age-group. After 6 months training (exercise bike), t-PA
activity, a measure of fibrinolytic activity, the process that counteracts
atherosclerosis and thrombosis, was significantly higher ( + 1 1 % , P<0 .05)
compared to the control group. Mean PAI-1 antigen, the inhibitor of t-PA was
lower, although not significantly, also suggesting an elevation of fibrinolytic
activity. Unexpectedly, we observed a moderate increase in plasma fibrinogen
( + 6%, P<0 .05 ) , a presumed risk factor for CHD. This increase is difficult to
interpret. It may reflect an unfavourable inflammatory reaction of the vessel
wall to strenuous exercise, or a shift in the balance between coagulation and
fibrinolysis. This shift may provide a quicker response to vessel damage, with
lower risk of thrombus formation (Chapter 3).
Prolongation of heart rate adjusted QT interval (QTC), a characteristic of
the electrocardiogram, is associated with an increased incidence of CHD
mortality. Prolongation is caused by a heterogeneity in the repolarisation of the
heart, which may be caused by sympathetic imbalance, particularly in the
presence of high sympathetic activity. Mean QTC and mean resting heart rate
changed favourably in men and women of both training groups. However, only
in women this change differed significantly from the controls. The beneficial
150
Summary
shift in QTC may be caused by a more favourable autonomic balance through
increased parasympathetic activity (Chapter 4).
Heart rate variability (HRV), a measure of the spontaneous fluctuations
around the mean heart rate, is also a tool to investigate the sympathetic and
parasympathetic function of the autonomic nervous system. Reduced HRV,
possibly reflecting reduced parasympathetic activity, was reported to be
associated with a two-to-three-fold risk of total mortality and cardiac events, in
apparently healthy subjects. After 6 months training, HRV was significantly
increased during the day ( + 6%, P<0.05) , especially among those inactive in
sport at the start of the study ( + 17%, P<0 .05) . The effects of training on
HRV confirm the hypothesis, that, in elderly subjects, physical training can
increase parasympathetic activity and can positively modify factors associated
with an increased incidence of CHD (Chapter 5).
Apart from CHD risk factors, we also studied the effect of training on
physical and psychological well-being. Physical well-being, or self-efficacy, was
measured with the LIVAS-scale ('Lichamelijke Vaardigheden Schaal'), a Dutch
translation of a sub-scale of the 'Perceived Physical Activity Scale', and
psychological well-being with the Center for Epidemiologic Studies Depression-
Scale (CES-D). After 6 months, physical self-efficacy was increased in both
training groups, as compared to the controls, but particularly in subjects of the
all-round activity group (P<0.05) . Symptoms of depression were markedly
reduced in men and women of the training groups, but not significantly
different from the controls. Elevation of physical self-efficacy (LIVAS-score)
was significantly associated with a reduction in symptoms of depression (CES-D
score). Therefore, we may speculate that increase in physical self-efficacy by
physical activity, may ultimately lead to a reduction in occurrence of depressive
symptoms in elderly people (Chapter 6).
Adherence to the protocols was satisfactory among the subjects who
stayed in the study until the end. In the bicycle group, the rate of adherence to
the training frequency was more than 80%. In the all-round activity group,
mean attendance was about 75%. The largest drop out took place in the
intervention groups (bicycle group 32%, all-round activity group 23%, control
group 5%). Most important reason for drop put in the bicycle group and all-
151
Summary
round activity group were lack of motivation, and lack of time respectively.
These results suggest that individual activity is less stimulating than group-wise
physical activity. Six months after the intervention, subjects had about halved
the time spent on exercise. However, most subjects of the all-round activity
group had continued with the training programme, but wi th a lower frequency.
Therefore, a training programme, such as the one described in this thesis does
not seem feasible in the long term, if not additionally supported. Group training
is preferred above individual training, because long-term adherence is likely to
be better (Chapter 8).
In addition to studying the effects of regular physical activity, we have also
reported on the validity of a physical activity questionnaire, the so-called
'Physical Activity Scale for the Elderly'-questionnaire (PASE). The score derived
from the questionnaire was compared with energy expenditure, measured with
the doubly labelled water method. The PASE proved to be a reasonably valid
method to classify healthy elderly people in categories of physical activity. The
PASE is an easily scored and quickly administered questionnaire and may
therefore be particularly useful in large epidemiological studies (Chapter 7).
In conclusion, regular physical activity beneficially affects CHD risk factors
(particularly newly emerged risk factors), physical fitness and well-being. The
positive changes in CHD risk factors and fitness very likely reduce the risk of
CHD in elderly people. The magnitude of the benefits remains unclear, since
there is little information on the predictive value of the new risk factors in
elderly. However, since elderly in general have advanced atherosclerosis, it is
conceivable that physical training may be even more important in elderly than in
younger age-groups. The positive change in physical self-efficacy may, in
addition, contribute to a higher quality of life. Group exercise is preferred above
individual exercise, in terms of long-term adherence. Therefore, regular exercise
(and particularly group exercise consisting of a varied programme) should be
recommended to elderly people, provided that it is performed safely.
152

Samenvatting
Het belang van regelmatige lichamelijke aktiviteit in de primaire preventie van
hart- en vaatziekten wordt de laatste jaren steeds vaker gesuggereerd.
Regelmatige lichamelijke inspanning heeft mogelijk een gunstig effect op de
zogenaamde 'klassieke' risicofactoren voor coronaire hartziekten (CHZ), zoals
overgewicht, serum 'high density l ipoprotein' (HDL), serum ' low density
l ipoprotein' (LDL), serum totaal cholesterolgehalte, triglyceridegehalte en
bloeddruk. Onlangs is ook gesuggereerd dat lichamelijke aktiviteit gunstige
effecten heeft op de recent ontdekte risicofactoren, zoals fibrinolytische
factoren (weefsel plasminogeen activator (t-PA) en plasminogeen activator
remmer (PAI-1), plasma fibrinogeen, en factoren die de autonome regulatie van
het hart weerspiegelen (zoals variabiliteit van hartfrequentie en QTC interval).
Tot op heden zijn de meeste studies naar het effect van regelmatige
lichamelijke aktiviteit op risicofactoren voor CHZ uitgevoerd bij mensen van
middelbare leeftijd. Er is weinig bekend over de effecten van regelmatig
bewegen op risicofactoren voor CHZ bij ouderen. Toch is het belangrijk om hier
meer inzicht in te krijgen, omdat (1) het percentage inaktieven toeneemt met de
leeftijd en (2) de risicofactoren voor CHZ met het ouder worden in ongunstige
richting veranderen, terwijl deze grotendeels hun voorspellende waarde
behouden. Het positief beïnvloeden van deze risicofactoren, zal daarom een
belangrijke bijdrage kunnen leveren aan de volksgezondheid.
In een gerandomiseerde interventiestudie is het effect van een 6 maanden
durend bewegingsprogramma, bij ouderen in de leeftijd van 60 tot 80 jaar,
onderzocht op zowel de 'klassieke' als de 'nieuwe' risicofactoren voor CHZ.
Daarnaast is het effect van bewegen op het fysiek en psychisch welbevinden
bestudeerd. De ouderen (n = 229) werden random verdeeld in 3 groepen: (1) een
hometrainergroep, waarin de deelnemers thuis, 4 keer per week, gedurende 30
minuten fietsten met een intensiteit die ongeveer gelijk was aan 7 0 % van hun
maximaal inspanningsvermogen, (2) een gevarieerd bewegingsprogramma
(MBVO), waarin de deelnemers 3 keer per week, gedurende 45 minuten diverse
sportaktiviteiten beoefenden, zoals balsport, 'bewegen op muziek' en kracht- en
153
Samenvatting
flexibiliteitsoefeningen, en tot slot (3) een controle groep, waarin de deelnemers
werd gevraagd om hun gebruikelijke aktiviteitenpatroon te handhaven.
Na 6 maanden interventie was de fysieke conditie (maximaal zuurstof-
opnamevermogen en maximale inspanningscapaciteit) van de deelnemers in de
interventiegroepen, significant verbeterd ( + 9%, P<0.05) ten opzichte van de
controlegroep. Het lichaamsgewicht en percentage lichaamsvet (gemeten met
som van de huidplooien) bleef onveranderd in alle groepen. Serum HDL, totaal
cholesterol en triglyceriden waren in een gunstige richting veranderd bij de
deelnemers in de interventiegroepen, echter alleen de daling in triglyceriden bij
vrouwen (-0.1 ± 0 . 0 6 mmol/L) was significant ten opzichte van de controlegroep
(P<0.05) . Er is geen effect van regelmatige lichamelijke aktiviteit op de
bloeddruk en op het nuchter insuline gehalte waargenomen (Hoofdstuk 2).
Over het algemeen hebben oudere mensen meer athérosclérose
(aderverkalking) en een hoger risico op trombose (bloedstolselvorming in het
bloedvat). Daarom zijn factoren die betrokken zijn bij de progressie van
athérosclérose en het ontstaan van trombose (t-PA, PAI-1 en fibrinogeen) bij
ouderen mogelijk extra belangrijk. Na 6 maanden training was t-PA aktiviteit,
een factor die de fibrinolyse stimuleert, significant gestegen ( + 1 1 % , P<0 .05 ) .
Deze verandering was significant in vergelijking met de controlegroep. Ook PAI-
1 antigen, de remmer van t-PA was lager, maar dit verschil was niet significant
ten opzichte van de verandering in de controlegroep. Onverwacht was de
stijging in plasma fibrinogeen, een mogelijke risicofactor voor HVZ, bij de
deelnemers in de interventiegroep ( + 6%, P<0 .05) . Mogelijk weerspiegelt deze
stijging een ontstekingsreaktie van de vaatwand als gevolg van zware
inspanning. Ook is het mogelijk dat er een verschuiving is opgetreden in de
balans tussen stolling en fibrinolyse, welke een snellere respons op
vaatwandbeschadiging mogelijk maakt (Hoofdstuk 3).
Een verlengd (voor hartfrequentie gecorrigeerd) QT interval (QTC) in het
electrocardiogram is geassocieerd met een verhoogde incidentie van CHZ. De
verlenging is het gevolg van heterogeniteit in de repolarisatie van het hart, wat
mogelijk veroorzaakt wordt door een autonome dysbalans, met name wanneer
de sympathische aktiviteit hoog is. Na 6 maanden training was het QTC interval
verkort en de rusthartfrequentie gedaald. Echter alleen bij de vrouwen was dit
154
Samenvatting
verschil significant ten opzichte van de controle groep. Deze gunstige
verandering werd mogelijk veroorzaakt door een gunstigere autonome balans,
als gevolg van een verhoogde parasympathische aktiviteit (Hoofdstuk 4).
Hartrimevariabiliteit (HRV), is een maat voor de spontane schommelingen
rondom de gemiddelde hartfrequentie. Deze maat wordt gebruikt om de
sympathische en parasympatische funktie van het autonome zenuwstelsel te
bestuderen. Uit eerder onderzoek is gebleken dat een verlaagd HRV, bij
ogenschijnlijk gezonde mensen samenhangt met een 2 to 3 keer zo hoog risico
op totale sterfte en het krijgen van hartziekten. Uit onze interventiestudie bleek
dat, na 6 maanden training, HRV gedurende de dag, significant was gestegen
( + 6%, P<0 .05 ) . Het effect van de training was het meest uitgesproken bij de
ouderen die voorheen niet aan sport deden ( + 17%, P<0 .05 ) . Deze verandering
in HRV bevestigt de hypothese dat regelmatige lichamelijke aktiviteit de
parasympathische aktiviteit kan verhogen en het risico op CHZ bij ouderen
gunstig kan beïnvloeden (Hoofdstuk 5).
Naast het effect op de risicofactoren voor CHZ, is in deze studie ook het
effect van bewegen op het fysieke en psychisch welbevinden onderzocht. De
lichamelijke vaardigheden werden geschat met behulp van de 'Lichamelijke
Vaardigheden Schaal' (LIVAS) , en het psychisch welbevinden met de vertaalde
versie van de 'Center for Epidemiologie Studies Depression Scale' (CES-D). Na 6
maanden training waren de lichamelijke vaardigheden bij de deelnemers in de
interventiegroepen significant verbeterd (P<0.05), met name bij het gevarieerde
bewegingsprogramma. Symptomen van depressie waren duidelijk lager na de
interventie, bij de deelnemers in de interventiegroepen, maar dit was niet
significant verschillend van de controlegroep. Aangezien een vermindering in
depressieve symptomen significant gerelateerd was aan een verbetering van
lichamelijke vaardigheden, kan worden verondersteld dat een verbetering van
lichamelijke vaardigheden uiteindelijk zal leiden tot een vermindering in
depressieve symptomen (Hoofdstuk 6).
De deelnemers die de 6 maanden durende interventie hebben volbracht,
hielden zich goed aan het trainingsprogramma. In de hometrainergroep werd
meer dan 8 0 % van de trainingsessies gevolgd, terwijl de gemiddelde deelname
aan het gevarieerde bewegingsprogramma ongeveer 75% was. Echter, het
155
Samenvatting
aantal personen dat voortijdig met de deelname aan het onderzoek was gestopt,
was het hoogst in de interventiegroepen (hometrainer- groep 32%, gevarieerd
bewegings-programma 23%, controlegroep 5%). De voornaamste redenen van
voortijdig stoppen waren motivatiegebrek (in de hometrainergroep) en tijdgebrek
(gevarieerd bewegingsprogramma), uit deze resultaten zou geconcludeerd
kunnen worden dat individuele sportbeoefening minder stimulerend is voor
ouderen dan sporten in groepsverband. Zes maanden na afloop van de
interventie was het aantal uren sport per week ongeveer gehalveerd bij de
mensen uit de trainingsgroepen. Wel waren bijna alle deelnemers aan het
gevarieerde bewegingsprogramma doorgegaan met de trainingen, echter maar 1
keer per week. Blijkbaar is het bewegingsprogramma zoals beschreven in deze
studie niet haalbaar op de lange termijn. Groepstraining lijkt, in ieder geval bij
ouderen, de voorkeur te hebben boven individuele sportbeoefening (Hoofdstuk
8).
In deze studie hebben we ook een lichamelijke aktiviteiten-vragenlijst, de
zogenaamde 'Physical Activity Scale for the Elderly (PASE)' gevalideerd. De
score die berekend werd uit de verschillende vragen van deze lijst werd
vergeleken met het energiegebruik dat gemeten werd met de tweevoudig
gemerkt water methode. De PASE bleek een voldoende valide vragenlijst te zijn
voor het indelen van gezonde ouderen in categorieën van lichamelijke aktiviteit.
Aangezien de PASE snel en makkelijk is in het gebruik, biedt het een uitstekende
mogelijkheid om, met name in grote epidemiologische studies bij ouderen,
lichamelijke aktiviteit te meten (Hoofdstuk 7).
Concluderend: Regelmatige lichamelijke aktiviteit heeft een gunstige invloed op
een aantal risicofactoren voor CHZ (met name de recent ontdekte
risicofactoren), de lichamelijke conditie en het welbevinden van ouderen. De
gunstige effecten op de CHZ risicofactoren en de fysieke conditie zullen
waarschijnlijk het risico op CHZ verlagen. Echter, de mate waarin blijft nog
onduidelijk, aangezien de voorspellende waarde van veel van de besproken
risicofactoren bij ouderen, nog verder onderzocht moet worden. Echter,
aangezien ouderen in het algemeen meer athérosclérose hebben dan jongeren, is
156

Samenvatting
regelmatige lichamelijke aktiviteit bij ouderen minstens even belangrijk als bij
mensen van middelbare leeftijd. Bovendien zal de verbetering in lichamelijke
vaardigheden bij hen bijdragen aan een verhoogde kwaliteit van leven. Bewegen
in groepsverband heeft bij ouderen de voorkeur boven individuele
sportbeoefening. Regelmatige lichamelijke aktiviteit zou daarom meer
gestimuleerd moeten worden bij ouderen (vooral groepssport bestaande uit een
gevarieerd programma).
157

Samenvatting
158

Dankwoord/Acknowledgements
Veel mensen hebben bijgedragen aan de totstandkoming van dit proefschrift.
Een aantal van hen wil ik in het bijzonder bedanken.
Om te beginnen wil ik de Arnhemse ouderen die hebben deelgenomen aan de
studie van harte bedanken. Ik heb veel bewondering voor jullie inzet en
doorzettingsvermogen. Ik weet dat voor sommigen de inspanningen ten
behoeve van mijn onderzoek soms erg groot waren. Gelukkig waren er ook veel
enthousiaste deelnemers. Ik heb veel geleerd in mijn gesprekken met jullie en
denk er nog vaak aan terug. Aan jullie draag ik dit proefschrift op.
Ook wil ik graag mijn co-promoter Dr Evert Schouten en promotor
professor Frans Kok bedanken. Evert, jou wil ik van harte bedanken voor de
dagelijkse begeleiding. Ik kon altijd bij je aankloppen, ondanks je overvolle
agenda. Jouw ontspannen uitstraling, en je relativeringsvermogen gaven mij,
met name tijdens het veldwerk, een geruststellend gevoel. Frans, je
enthousiasme en ideeën waren de basis voor de totstandkoming van dit project.
In de afgelopen jaren wist jij me altijd te stimuleren en gaf me het vertrouwen
dat ik nodig had bij dit veelomvattende project. Bedankt voor je waardevolle
adviezen en inspiratie.
Uiteraard waren mijn 2 onderzoekassistenten, Louise Mennen en Hélène
Gillisen, van onschatbare waarde. Louise, samen hebben we het veldwerk
voorbereid en samen zijn we in het onbekende diepe gedoken. Ik had me echter
bij deze nieuwe ervaring geen betere partner kunnen voorstellen. Ik ben blij dat
onze samenwerking is uitgegroeid tot een warme vriendschap. Hélène, voor jou
was het doen van veldwerk ook nieuw. Door je enthousiaste inzet en prettige
karakter was je voor mij en de deelnemers een fijn persoon om mee samen te
werken.
Tijdens de uitvoering van dit onderzoek ben ik ondersteund door een
aantal mensen, die ik ook graag wil bedanken. Als eerste de huisartsen die me
geholpen hebben bij de recrutering van de deelnemers: Dr Ton Verheij en Dr
Fenna van de Wall-Onnes. Niet alleen ben ik dankbaar dat ik jullie praktijkruimte
kon gebruiken voor mijn onderzoek, ook wil ik jullie danken voor alle
inspanningen en de prettige samenwerking. Ton Verheij wil ik tevens danken
159
voor zijn inzet en enthousiasme bij de opzet van de studie. Ik dank Dr. Rob
Rijneke, cardioloog in het Rijnstate Ziekenhuis in Arnhem, voor zijn essentiële
bijdrage aan de studie, waaronder het beoordelen van de stapels ECG's.
Professor Wim Saris wil ik bedanken voor de zeer prettige samenwerking, zijn
bijdrage aan de studie, en de gelegenheid die hij voor mij creëerde om een aantal
maanden bij een gerenommeerd inspanningsfysiologisch laboratorium in Amerika
te werken. Professor Kees Kluft ben ik dankbaar voor zijn kritische commentaar
op mijn stukken en meedenken over mogelijke verklaringen van gevonden
verbanden. Joke Seinen, jij bent verantwoordelijk geweest voor het slagen van
de 'sportgroep'. Jouw inzet en enthousiasme waren essentieel.
I also would like to thank Dr Wiliam Evans and Dr Toni Miles of the Pennsylvania
State University. Bill, it was a great pleasure and honour to stay at the Noll
Physiological Research Center for a few months. This gave me the opportunity
to experience the 'ins and outs' of an exercise laboratory, which is valuable for
an epidemiologic researcher in the field of physical activity. Toni, it was a
pleasure working with you, you are an inspiring and accomodating person. I
hope we can continue our collaboration in the future.
Ook wil ik mijn dank uitspreken aan alle mensen die geholpen hebben bij
de dataverzameling van dit project. De medewerkers van het Sport Medisch
Adviescentrum in Arnhem, en met name coördinator Willemien van Teefelen, wil
ik danken voor het verrichten van de inspanningstesten. Dick van Rumpt en
collega's van het klinisch laboratorium van het Ziekenhuis Velp bedank ik voor
de coördinatie van de bloedafname en -verwerking en de prettige
samenwerking. De trombosedienst Arnhem, met name Mevrouw Geven Boere
wil ik danken voor het verzorgen van de bloedafname tijdens het eerste periode
van de dataverzameling. Piet Meyer en Rien Buytenhek van het TNO-PG,
Gaubius wil ik bedanken voor het analyseren voor de fibrinolyse- en
stollingsfactoren en lipiden. Verder ben ik Moniek de Maat erkentelijk voor haar
kritisch meedenken. Dr Paul Menheere van het klinisch chemisch laboratorium in
het Academisch Ziekenhuis Maastricht dank ik voor de insulinebepalingen. Frans
Schouten van de vakgroep Humane Voeding dank ik voor zijn bijdrage aan de
tweevoudig-gemerkt-waterproef.
160
Ook hebben een aantal studenten een belangrijke bijdrage geleverd aan de
studie door te assisteren bij het veldwerk. Mijn dank gaat uit naar Femmie de
Vegt, Marleen Essenberg, Evelien Krijger, Dinny Laan en Debbie Smit.
De afgelopen 6 jaar heb ik met veel plezier gewerkt op de Vakgroep
Humane Epidemiologie en Gezondheidsleer. Ik wil alle medewerkers via deze
weg heel erg bedanken voor de prettige werksfeer. Een aantal mensen wil ik
met name bedanken. Dat zijn mijn kamergenoten Petra Verhoef en Esther
Pallast. Petra, we zijn ongeveer tegelijkertijd begonnen bij de vakgroep en het
klikte meteen. Ik ben blij dat we zo lang dezelfde kamer hebben gedeeld. We
hebben veel lol gehad, samen veel gedeeld en ik wil je bedanken dat je er altijd
voor me was in goede en slechte tijden. Je bent een waardevolle vriendin
geworden. Esther, het laatste jaar heb ik bij jou op de kamer gezeten; je bent
een fantastische kamergenoot en vriendin. Bedankt voor je waardevolle
adviezen. Jouw nuchtere kijk op dingen heeft mij ook geleerd meer te
relativeren. Verder wil ik Dirk, Jan, Jos en Jessica ontzettend bedanken voor
hun ondersteuning.
Naast het werk hebben veel vrienden, vriendinnen en familie
belangstelling getoond voor het onderzoek en me gesteund in drukke tijden.
Hiervoor wil ik hen allen hartelijk danken. Vera, jij bent altijd een belangrijke
baken in de storm geweest, jouw vriendschap betekent veel voor mij. Daarom
ben ik blij dat jij mijn paranimf wil zijn. Liset, jij begreep wat het is om
promotieonderzoek te doen; bedankt dat je er altijd voor me was. Mijn ouders
dank ik voor hun liefde, steun en vertrouwen. Tot slot wil ik jou, Reggy,
bedanken dat je bij me was en de mooie en stressvolle momenten van mijn
onderzoek hebt gedeeld. Jouw aanwezigheid (en deskundigheid) maakte het
werk voor mij een stuk gemakkelijker.
161

162

Curriculum Vitae
Albertine Jeannette (Jantine) Schuit was born in Nijkerk, The Netherlands, on
November 26th, 1964. In 1982 she completed secondary school (Farel College,
Amersfoort). From 1983 to 1987 she studied Consumer Affairs at Hogeschool
Diedenoort in Wageningen. After graduating she continued her studies in
Household and Consumers Science at Wageningen Agricultural University. Her
majors were in Epidemiology and Public Health Care. Furthermore, she
investigated the use of primary health care, and the health consequences of
garbage disposal in a slum area of Manila, The Philippines. She graduated in
September 1990.
From February 1991 until June 1992 she was appointed as a teaching
and research associate at the Department of Epidemiology and Public Health,
Wageningen Agricultural University. At the same department, in July 1992, she
started the Ph.D.-project described in this thesis. In the summer of 1992, she
attended the Annual New England Epidemiology Summer Program at Tufts
University in Boston, U.S.A. She was registered as Master of Science in
Epidemiology in 1993 by the Netherlands Epidemiological Society. In 1994, she
visited The Robert Koch Institute, Federal Institute for infectious and non-
communicable diseases, Berlin, Germany, for several weeks. In 1995, she
worked for several months as a research fellow at the Pennsylvania State
University, at the Noll Physiological Research Center and the Center for Special
Population and Health, University Park, U.S.A. She was a member of the
Education Committee of the graduate school Food Technology, Agro-
biotechnology, Nutrition and Health Science (VLAG).
In June 1997, she will start working at the Department of Chronic
Diseases and Environmental Epidemiology of the National Institute of Public
Health and the Environment, Bilthoven, The Netherlands, as a researcher in the
field of physical activity and health.
163