Regional Workshop on Monitoring and Assessing Progress on ...
54
ILO Regional Office for Asia and the Pacific (ILO-ROAP) ILO/EC Project “Monitoring and Assessing Progress on Decent Work” (MAP) Regional Workshop on Monitoring and Assessing Progress on Decent Work in Asia Workshop Report Bangkok, 28–30 June 2010 This document has been produced with the financial assistance of the European Union. The views expressed herein can in no way be taken to reflect the official opinion of the European Union.
-
Upload
khangminh22 -
Category
Documents
-
view
4 -
download
0
Transcript of Regional Workshop on Monitoring and Assessing Progress on ...

ILO Regional Offi ce for Asia and the Pacifi c (ILO-ROAP)
ILO/EC Project “Monitoring and Assessing Progress on Decent Work” (MAP)
Regional Workshop on Monitoring and AssessingProgress on Decent Work in Asia Workshop Report
Bangkok, 28–30 June 2010
This document has been produced with the fi nancial
assistance of the European Union. The views expressed
herein can in no way be taken to refl ect the offi cial
opinion of the European Union.
ISBN 978-92-2-123939-0
9 789221 239390
ILO/EC Project “Monitoring and Assessing Progress on Decent Work” (MAP)
Monitoring and assessing progress towards decent work is a long-
standing concern for the ILO and its constituents. Implemented by the
ILO with funding from the European Union, the project “Monitoring
and Assessing Progress on Decent Work” (MAP) helps to address this
need. Over a period of four years (2009 to 2013), the project works
with Ministries of Labour, National Statistical Offi ces, other government
agencies, workers’ and employers’ organizations and research institutions
to strengthen the capacity of developing and transition countries to
self-monitor and self-assess progress towards decent work. The project
facilitates the identifi cation of Decent Work Indicators in line with
national priorities; supports data collection; and assists in the analysis
of data on decent work in order to make them relevant for policy-makers.
The MAP publication series disseminates project outputs to a broad
audience in the ten countries covered by the project and beyond.
For more information on the ILO/EC Project “Monitoring and Assessing Progress on Decent Work” (MAP), see http://www.ilo.org/map

ILO REGIONAL OFFICE FOR ASIA AND THE PACIFIC (ILO-ROAP)
ILO/EC PROJECT “MONITORING AND ASSESSING PROGRESS ON DECENT WORK” (MAP)
Workshop Report
Regional Workshop on Monitoring and Assessing Progress on Decent Work in Asia
28-30 June 2010
Bangkok, Thailand
This document has been prepared by the International Labour Office
with funding from the European Union under the ILO/EC Project
“Monitoring and Assessing Progress on Decent Work” (MAP).
International Labour Office
Bangkok and Geneva
August 2010

Copyright © International Labour Organization 2010 Publications of the International Labour Office enjoy copyright under Protocol 2 of the Universal CopyrightConvention. Nevertheless, short excerpts from them may be reproduced without authorization, on condition that the source is indicated. For rights of reproduction or translation, application should be made to the PublicationsBureau (Rights and Permissions), International Labour Office, CH-1211 Geneva 22, Switzerland. The International Labour Office welcomes such applications. Libraries, institutions and other users registered in the United Kingdom with the Copyright Licensing Agency, 90Tottenham Court Road, London W1T 4LP [Fax: (+44) (0)20 7631 5500; email: [email protected]], in the United States with the Copyright Clearance Center, 222 Rosewood Drive, Danvers, MA 01923 [Fax: (+1) (978) 750 4470; email:[email protected]] or in other countries with associated Reproduction Rights Organizations, may makephotocopies in accordance with the licences issued to them for this purpose. ILO Cataloguing in Publication Data Workshop report : regional workshop on monitoring and assessing progress on decent work in Asia : 28-30 June 2010, Bangkok, Thailand / International Labour Office, ILO Regional Office for Asia and the Pacific (ILO-ROAP), ILO/EC Project "Monitoring and Assessing Progress on Decent Work" (MAP).- Bangkok: ILO, 2010 1 v. ISBN: 978-92-2-123939-0; 978-92-2-123940-6 (web pdf) International Labour Office and ILO Regional Office for Asia and the Pacific; Regional Workshop on Monitoringand Assessing Progress on Decent Work in Asia (2010, Bangkok, Thailand). conference report / decent work / measurement / Asia 13.01.1
The designations employed in ILO publications, which are in conformity with United Nations practice, and thepresentation of material therein do not imply the expression of any opinion whatsoever on the part of theInternational Labour Office concerning the legal status of any country, area or territory or of its authorities, or concerning the delimitation of its frontiers. The responsibility for opinions expressed in signed articles, studies and other contributions rests solely with their
authors, and publication does not constitute an endorsement by the International Labour Office of the opinions
expressed in them.
Reference to names of firms and commercial products and processes does not imply their endorsement by theInternational Labour Office, and any failure to mention a particular firm, commercial product or process is not a sign of disapproval. This document has been produced with the financial assistance of the European Union. The views expressed hereincan in no way be taken to reflect the official opinion of the European Union. ILO publications can be obtained through major booksellers or ILO local offices in many countries, or direct fromILO Publications, International Labour Office, CH-1211 Geneva 22, Switzerland. Catalogues or lists of new publications are available free of charge from the above address, or by email: [email protected] Visit our website: www.ilo.org/publns and www.ilo.org/map.
Printed by the International Labour Office, Geneva, Switzerland
ii
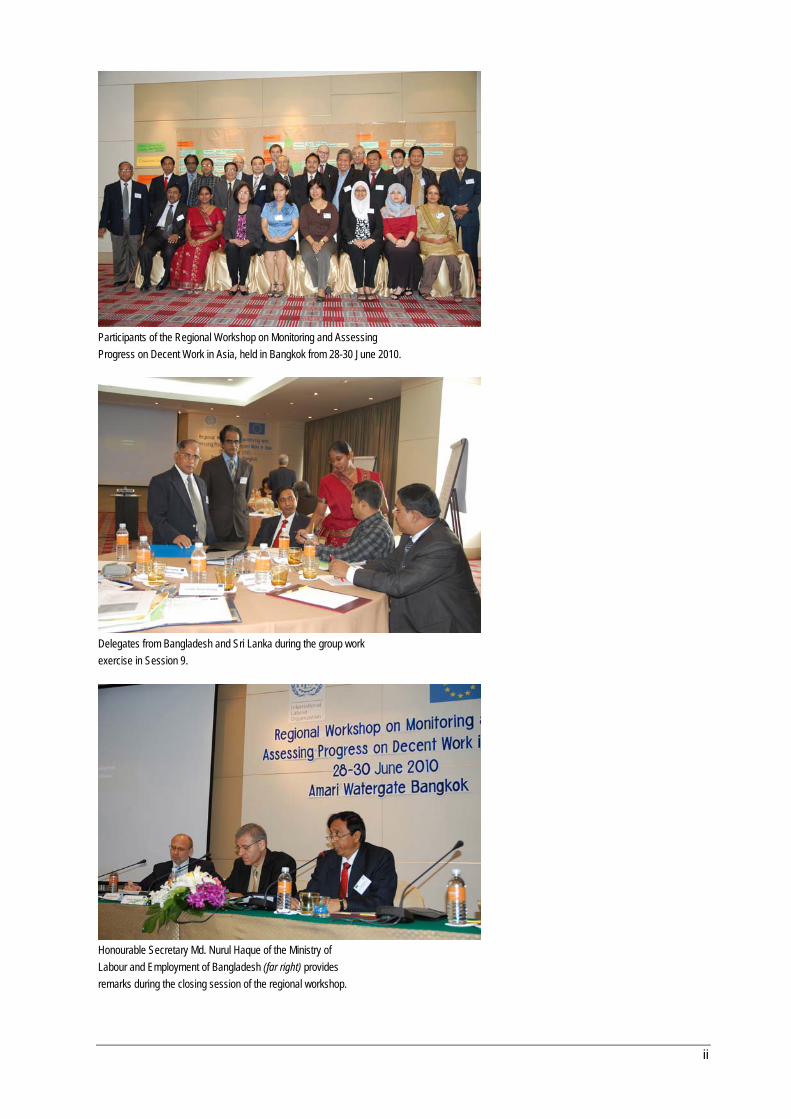
Participants of the Regional Workshop on Monitoring and Assessing Progress on Decent Work in Asia, held in Bangkok from 28-30 June 2010.
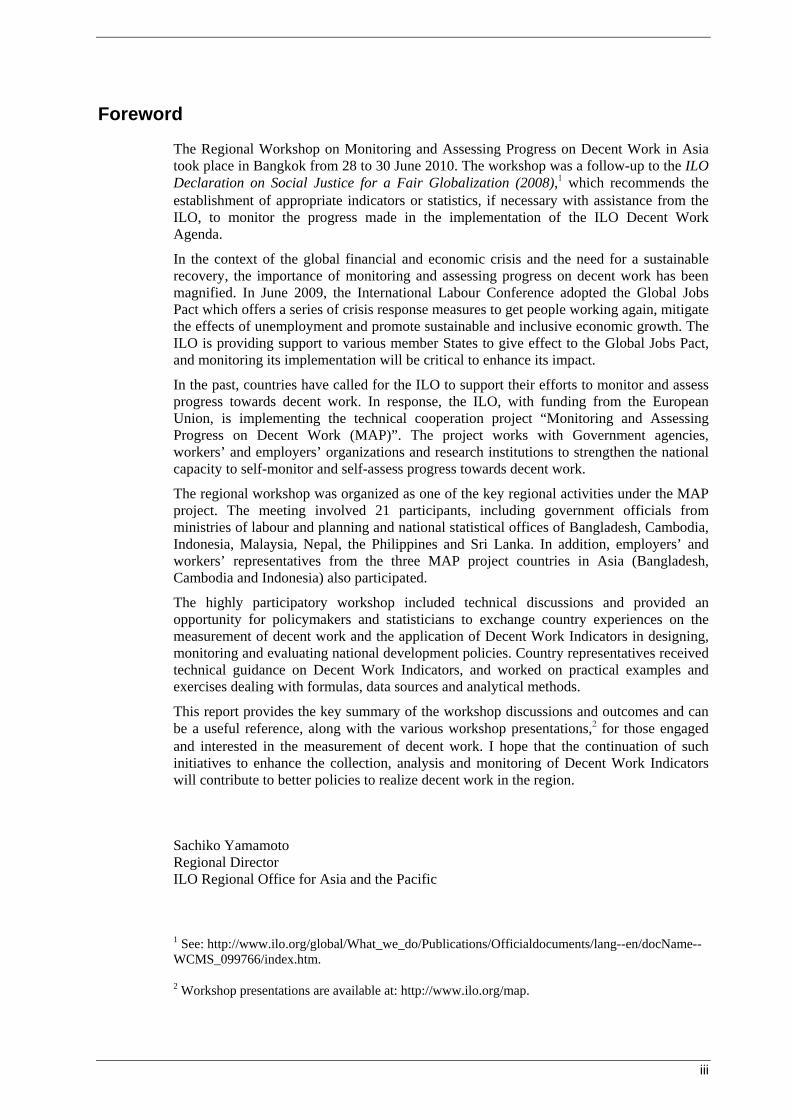
Delegates from Bangladesh and Sri Lanka during the group work exercise in Session 9.
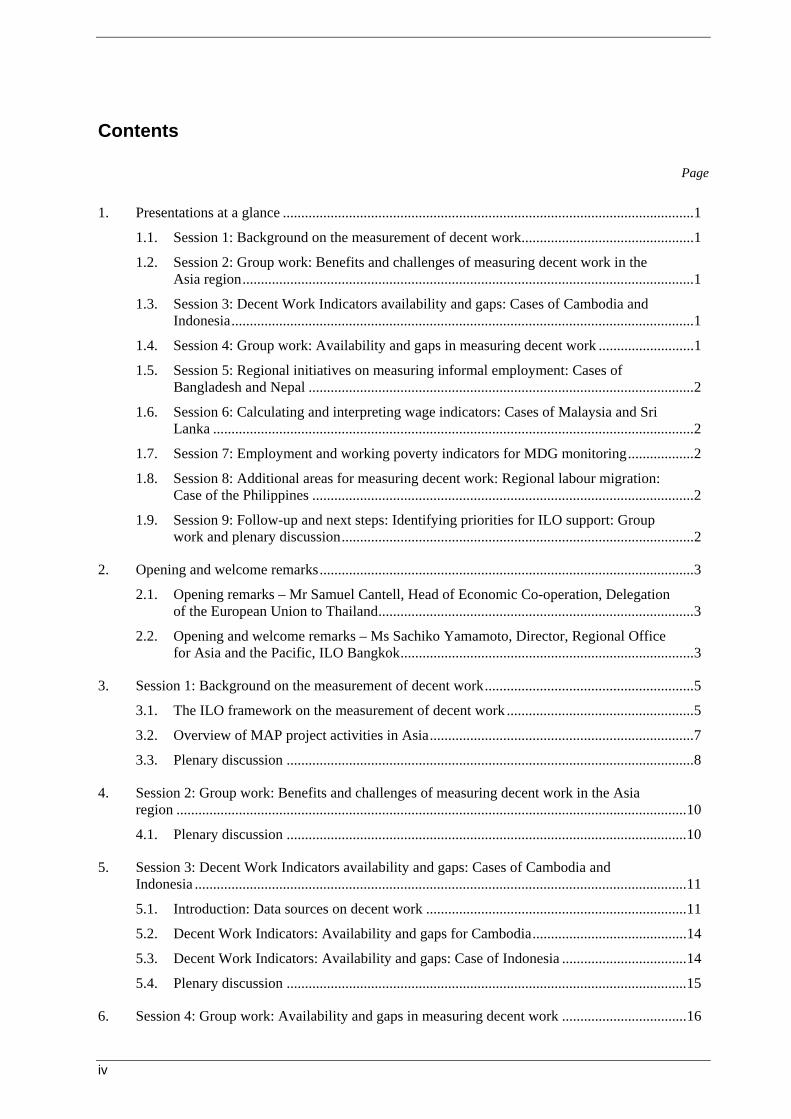
Honourable Secretary Md. Nurul Haque of the Ministry of Labour and Employment of Bangladesh (far right) provides remarks during the closing session of the regional workshop.
iii
Foreword
The Regional Workshop on Monitoring and Assessing Progress on Decent Work in Asia took place in Bangkok from 28 to 30 June 2010. The workshop was a follow-up to the ILO Declaration on Social Justice for a Fair Globalization (2008),1 which recommends the establishment of appropriate indicators or statistics, if necessary with assistance from the ILO, to monitor the progress made in the implementation of the ILO Decent Work Agenda.
In the context of the global financial and economic crisis and the need for a sustainable recovery, the importance of monitoring and assessing progress on decent work has been magnified. In June 2009, the International Labour Conference adopted the Global Jobs Pact which offers a series of crisis response measures to get people working again, mitigate the effects of unemployment and promote sustainable and inclusive economic growth. The ILO is providing support to various member States to give effect to the Global Jobs Pact, and monitoring its implementation will be critical to enhance its impact.
In the past, countries have called for the ILO to support their efforts to monitor and assess progress towards decent work. In response, the ILO, with funding from the European Union, is implementing the technical cooperation project “Monitoring and Assessing Progress on Decent Work (MAP)”. The project works with Government agencies, workers’ and employers’ organizations and research institutions to strengthen the national capacity to self-monitor and self-assess progress towards decent work.
The regional workshop was organized as one of the key regional activities under the MAP project. The meeting involved 21 participants, including government officials from ministries of labour and planning and national statistical offices of Bangladesh, Cambodia, Indonesia, Malaysia, Nepal, the Philippines and Sri Lanka. In addition, employers’ and workers’ representatives from the three MAP project countries in Asia (Bangladesh, Cambodia and Indonesia) also participated.
The highly participatory workshop included technical discussions and provided an opportunity for policymakers and statisticians to exchange country experiences on the measurement of decent work and the application of Decent Work Indicators in designing, monitoring and evaluating national development policies. Country representatives received technical guidance on Decent Work Indicators, and worked on practical examples and exercises dealing with formulas, data sources and analytical methods.
This report provides the key summary of the workshop discussions and outcomes and can be a useful reference, along with the various workshop presentations,2 for those engaged and interested in the measurement of decent work. I hope that the continuation of such initiatives to enhance the collection, analysis and monitoring of Decent Work Indicators will contribute to better policies to realize decent work in the region.
Sachiko Yamamoto Regional Director ILO Regional Office for Asia and the Pacific
1 See: http://www.ilo.org/global/What_we_do/Publications/Officialdocuments/lang--en/docName--WCMS_099766/index.htm.
2 Workshop presentations are available at: http://www.ilo.org/map.
iv
Contents
Page
1. Presentations at a glance ................................................................................................................ 1
1.1. Session 1: Background on the measurement of decent work ............................................... 1
1.2. Session 2: Group work: Benefits and challenges of measuring decent work in the Asia region ........................................................................................................................... 1
1.3. Session 3: Decent Work Indicators availability and gaps: Cases of Cambodia and Indonesia .............................................................................................................................. 1
1.4. Session 4: Group work: Availability and gaps in measuring decent work .......................... 1
1.5. Session 5: Regional initiatives on measuring informal employment: Cases of Bangladesh and Nepal ......................................................................................................... 2
1.6. Session 6: Calculating and interpreting wage indicators: Cases of Malaysia and Sri Lanka ................................................................................................................................... 2
1.7. Session 7: Employment and working poverty indicators for MDG monitoring .................. 2
1.8. Session 8: Additional areas for measuring decent work: Regional labour migration: Case of the Philippines ........................................................................................................ 2
1.9. Session 9: Follow-up and next steps: Identifying priorities for ILO support: Group work and plenary discussion ................................................................................................ 2
2. Opening and welcome remarks ...................................................................................................... 3
2.1. Opening remarks – Mr Samuel Cantell, Head of Economic Co-operation, Delegation of the European Union to Thailand ...................................................................................... 3
2.2. Opening and welcome remarks – Ms Sachiko Yamamoto, Director, Regional Office for Asia and the Pacific, ILO Bangkok ................................................................................ 3
3. Session 1: Background on the measurement of decent work ......................................................... 5
3.1. The ILO framework on the measurement of decent work ................................................... 5
3.2. Overview of MAP project activities in Asia ........................................................................ 7
3.3. Plenary discussion ............................................................................................................... 8
4. Session 2: Group work: Benefits and challenges of measuring decent work in the Asia region ........................................................................................................................................... 10
4.1. Plenary discussion ............................................................................................................. 10
5. Session 3: Decent Work Indicators availability and gaps: Cases of Cambodia and Indonesia ...................................................................................................................................... 11
5.1. Introduction: Data sources on decent work ....................................................................... 11
5.2. Decent Work Indicators: Availability and gaps for Cambodia .......................................... 14
5.3. Decent Work Indicators: Availability and gaps: Case of Indonesia .................................. 14
5.4. Plenary discussion ............................................................................................................. 15
6. Session 4: Group work: Availability and gaps in measuring decent work .................................. 16

v
6.1. Country reports .................................................................................................................. 16
7. Session 5: Regional initiatives on measuring informal employment: Cases of Bangladesh and Nepal ..................................................................................................................................... 17
7.1. Statistics on informal employment: Regional initiatives ................................................... 18
7.2. Measuring the informal employment in Bangladesh ......................................................... 19
7.3. Measuring informal employment through labour force survey: Nepal case ...................... 20
8. Session 6: Calculating and interpreting wage indicators: Cases of Malaysia and Sri Lanka ....... 21
8.1. Calculating and interpreting wage indicators .................................................................... 21
8.2. Decent work and wage setting in Malaysia ....................................................................... 24
8.3. Plenary discussion ............................................................................................................. 25
8.4. Sri Lanka: Decent Work Indicators: Adequate earnings and productive work ................. 26
8.5. Plenary discussion ............................................................................................................. 27
9. Session 7: Employment and working poverty indicators for MDG monitoring .......................... 27
9.1. Employment and working poverty indicators for MDG monitoring ................................. 27
9.2. Compiling country-level working poverty indicators: Group exercise ............................. 30
9.3. Group work: Compiling country-level working poverty indicators .................................. 31
9.4. Presentations ...................................................................................................................... 31
10. Session 8: Additional areas for measuring decent work: Regional labour migration: Case of the Philippines .............................................................................................................................. 32
10.1. Philippine migration management system: Indicators for measuring decent work ........... 32
10.2. Plenary discussion ............................................................................................................. 33
11. Session 9: Follow-up and next steps: Identifying priorities for ILO support ............................... 34
11.1. Presentations from the groups ............................................................................................ 34
11.2. Final remarks ..................................................................................................................... 38
Annex 1. List of participants .................................................................................................................. 40
Annex 2.Workshop programme ............................................................................................................. 43
vi
List of figures
Page
Figure 1: Overview of the “1-2” Survey ................................................................................................ 18
Figure 2: Global working poverty trends, 1999-2009 (US$ 1.25 per day) ............................................ 22
Figure 3: Increase in average real wages, 2001-2007 ............................................................................ 23
Figure 4: Real GDP, labour productivity and employment growth in Asia, 2000-2008 (%) ................. 23
Figure 5: Change in the labour share in GDP, 1995-2007 ..................................................................... 24
Figure 6: Employment-to-population ratio by sex, South Asia, 1991-2009 (%) .................................... 28
Figure 7: Vulnerable employment, 1999-2009 ...................................................................................... 29
List of tables
Table 1: Indicator groupings under the international framework for measuring decent work ................. 7
Table 2: Linkages between the substantive elements and strategic objectives of the Decent Work Agenda ............................................................................................................................. 7
Table 3: Opportunities and challenges of monitoring and assessing progress towards decent work .......................................................................................................................................... 10
Table 4: Data sources and availability of Decent Work Indicators ........................................................ 12
Table 5: Status in employment by sex in Thailand, annual change from second quarter ..................... 29

vii
List of acronyms and abbreviations ADB Asian Development Bank BBS Bangladesh Bureau of Statistics CLS Child Labour Survey CSR Corporate Social Responsibility DCS Department of Census and Statistics Sri Lanka DWI Decent Work Indicator DWCP Decent Work Country Programme EC European Commission EPR Employment-to-population ratio EU European Union GDP Gross Domestic Product HIES Household Income and Expenditure Survey HUEM Household Unincorporated Enterprise with Market Production ICLS International Conference of Labour Statisticians ILO International Labour Organization ISS Informal Sector Survey KILM Key Indicators of the Labour Market LFS Labour Force Survey LSMS Living Standards Measurement Survey MAP Monitoring and Assessing Progress on Decent Work MDG Millennium Development Goals MICS Multiple Indicators Cluster Survey OFW Overseas Filipino Worker POEA Philippine Overseas Employment Administration PLWS Productivity-Linked Wage System in Malaysia PPP Purchasing Power Parity SES Socio-economic Survey SIDA Swedish International Development Cooperation Agency TME Tripartite Meeting of Experts US$ United States Dollar

1
1. Presentations at a glance
This part of the report contains short outlines of the sessions that made up the regional workshop. More information can be found in the body of the report and in the copies of the presentations that are available on a CD-ROM and on the ILO website.3
1.1. Session 1: Background on the measurement of decent work
The session provided an overview of the international framework for measuring decent work adopted and promoted by the ILO. It discussed how Decent Work Indicators (DWIs) can contribute to the monitoring of national policy frameworks and progress towards decent work and how the ILO/EC MAP project can support national priorities and action.
1.2. Session 2: Group work: Benefits and challenges of measuring decent work in the Asia region
The session involved a group work activity in which participants reflected on and discussed the benefits and challenges of measuring decent work in the Asia region as well as the issues related to its monitoring and assessment.
1.3. Session 3: Decent Work Indicators availability and gaps: Cases of Cambodia and Indonesia
The session provided an overview of the major sources of statistical information on decent work. It discussed the importance of decent work information systems and also highlighted some considerations for their integration into national statistical systems. Country presentations from Cambodia and Indonesia provided brief overviews on the availability and information gaps in DWIs in the national statistical systems, including the data sources that could be used for each indicator.
1.4. Session 4: Group work: Availability and gaps in measuring decent work
In this group work exercise, participating countries discussed the various national data sources, including household and establishment surveys and administrative records to produce DWIs. Participants identified the existing availability and gaps at the national level which will help to prioritize areas for further action.
3 Available at: http://www.ilo.org/map.
2
1.5. Session 5: Regional initiatives on measuring informal employment: Cases of Bangladesh and Nepal
This session started with an introduction to regional initiatives and cooperation on the measurement of informal employment in the Asian region. Concepts and methods of measuring informal employment were further discussed and two case studies in data collection on informal employment were highlighted, namely in Bangladesh and Nepal.
1.6. Session 6: Calculating and interpreting wage indicators: Cases of Malaysia and Sri Lanka
The session provided an overview of global and regional trends in wages. The concepts and definitions of DWIs used for monitoring “Adequate earnings and productive employment” at the national level were presented and good practices related to setting wage policies were highlighted. The session further provided an opportunity for participants to share country experiences in the collection and analysis of wage data for designing national wage policies and highlighted the cases of Malaysia and Sri Lanka.
1.7. Session 7: Employment and working poverty indicators for MDG monitoring
The session presented an overview of concepts and definitions of key employment and poverty indicators under the ILO framework of DWIs. It highlighted some global and regional trends of these indicators for monitoring progress towards MDG target 1b (Achieve full and productive employment and decent work for all, including women and young people).4 This session included a small group work exercise where participants examined existing national household surveys from Cambodia and Sri Lanka to assess the feasibility of compiling working poverty indicators.
1.8. Session 8: Additional areas for measuring decent work: Regional labour migration: Case of the Philippines
The session provided a brief overview on the key issues and challenges in the region in the management of labour migration and discussed various indicators that can be considered in the monitoring of migration trends for policy making and planning.
1.9. Session 9: Follow-up and next steps: Identifying priorities for ILO support: Group work and plenary discussion
In this session the group work exercise provided an opportunity for the participants to discuss and highlight priorities in strengthening the compilation and analysis of DWIs at the national and regional level, the concrete and practical next steps envisaged and the type of ILO support needed.
4 For further discussion on the targets under MDG 1, see http://www.undp.org/mdg/goal1.shtml.
3
2. Opening and welcome remarks
Chairperson: Mr Gyorgy Sziraczki, Senior Economist, Regional Office for Asia and the Pacific, ILO Bangkok
2.1. Opening remarks – Mr Samuel Cantell, Head of Economic Co-operation, Delegation of the European Union to Thailand
Mr Cantell expressed his gratitude to the ILO for organizing the regional workshop and thanked the participants for their attendance.
First, he noted the importance of Corporate Social Responsibility (CSR) and a recent study that demonstrates that companies that do well in regard to CSR have generally better production than companies that do not take this into consideration. This illustrates the importance of CSR and decent work and emphasizes the relevance of the issues that would be discussed at the workshop.
Globalization has its benefits, but there are still major challenges as the benefits still have not reached all people. This is where decent work is important, and the European Union (EU) supports the concept of decent work for all. Fundamental principles and rights at work, social protection, social dialogue and employment that provide a fair income all combine to make up the decent work concept.
According to the EU, growth and decent work should be encouraged as a means to fighting poverty and social injustice around the world, as outlined in the Lisbon strategy for growth and jobs.5
The aim of the “Monitoring and Assessing Progress on Decent Work” (MAP) project is to strengthen the capacity at the national level to self-monitor and self-assess progress towards decent work. This can be achieved through better statistics, promotion of the tripartite structure of the ILO and further efforts to promote decent work.
Finally, Mr Cantell acknowledged the work of the ILO and noted that the workshop provides a good opportunity for countries to share experiences, network and present good practices which can hopefully be used to provide guidance on how to continue successful implementation of the project.
2.2. Opening and welcome remarks – Ms Sachiko Yamamoto, Director, Regional Office for Asia and the Pacific, ILO Bangkok
Ms Yamamoto welcomed all participants to Bangkok and to the workshop and thanked Mr Samuel Cantell for his remarks.
First, Ms Yamamoto acknowledged and thanked the European Commission for their generous support and collaboration for the project “Monitoring and Assessing Progress on Decent Work”, or the MAP project, under which the meeting was organized.
5 See: http://ec.europa.eu/archives/growthandjobs_2009/index_en.htm.

4
The workshop participants consisted of a high-level group of statisticians, policymakers and experts from across Asia and some ILO specialists from Bangkok and Geneva who would discuss and share experiences on monitoring and assessing decent work in the region.
Decent work brings together four multiple goals – the goals of rights at work, productive employment, social protection and social dialogue. Decent work is central to efforts to reduce poverty and is a means for achieving equitable, inclusive and sustainable growth. Decent work is the main objective of the ILO and describes opportunities for women and men to obtain work in conditions of freedom, equity, security and human dignity.
In 2006, constituents in Asia and the Pacific committed themselves to the Asian Decent Work Decade from 2006 to 2015. During this period, concerted efforts would be made to realize decent work in the region. However, to promote and achieve the goals of decent work, countries need to be able to identify decent work challenges and deficits. They need to set targets to measure progress made in the different dimensions of decent work. At the country level, measuring decent work can also support the design and monitoring of national development policies and plans and the implementation of the Decent Work Country Programmes (DWCP).
In addition, countries in the region have made important gains in realizing decent work, but it is clear that deficits remain. There are some 90 million unemployed women and men in the region. The grim unemployment picture is further darkened by the large numbers in poor quality and low paid jobs based in the informal economy. A majority of Asia’s workers are estimated to be in vulnerable employment. Nearly 900 million workers live with their families on less than US$ 2 per day.
The global economic crisis has magnified the importance of monitoring trends in decent work. In June 2009, the International Labour Conference adopted the Global Jobs Pact which offers a series of crisis response measures to get people working again, mitigate the effects of unemployment and promote sustainable and inclusive economic growth. The ILO is now supporting countries to give effect to the Global Jobs Pact, and monitoring its implementation will be critical to enhance its impact.
Furthermore, in order to measure decent work, reliable and up-to-date statistical information is vital. Oftentimes, the focus of data collection has been on indicators such as employment and unemployment. Meanwhile, information on working conditions, social protection and representation has been more limited. Another common challenge in the region is the limited analysis of data and information for sound policymaking.
In response to requests from constituents to address these challenges, the ILO in 2009 launched the project “Monitoring and Assessing Progress on Decent Work” (MAP). The project works with Government agencies, employers’ and workers’ organizations, and research institutions to strengthen the national capacity to self-monitor and self-assess progress towards decent work.
The regional workshop would be an important opportunity to discuss the measurement of decent work at the country level and to help develop stronger technical expertise through sharing of experiences.
The various goals of the workshop were presented as follows:
• Identify the existing availability and gaps at the national level for DWIs, based on the international framework adopted by the ILO;
• Explore concepts and definitions of DWIs on informal employment, wages and working poverty, among others;
5
• Share experiences to-date on the implementation of the MAP project in the Asia region, while strengthening the regional knowledge network on the measurement of decent work; and
• Prioritize areas for follow-up action at the country level and identify needed ILO support.
After the opening and welcome remarks, the participants6 were introduced, and Mr Sziraczki presented the agenda and expectations for the 2.5-day workshop.
3. Session 1: Background on the measurement of decent work
Introduction and moderator: Mr Malte Luebker, Conditions of Work and Employment Programme, ILO Geneva
In this session, the background on the measurement of decent work was presented and discussed. Historically, labour statistics had focused on measuring labour demand and supply, and on indicators such as the labour force participation rate and the unemployment rate. By contrast, measuring decent work also had to take the quality of employment into account and thus presented a greater challenge. The session provided an overview of the international framework for measuring decent work adopted and promoted by the ILO. It discussed how DWIs could contribute to the monitoring of national policy frameworks and progress towards decent work, and how the ILO/EC Project “Monitoring and Assessing Progress on Decent Work” (MAP) could support national priorities and action in this regard. Asia has been in the forefront in developing DWIs, and past initiatives in the region have contributed significantly to the current understanding and practice of measuring decent work.
3.1. The ILO framework on the measurement of decent work
Mr Igor Chernyshev, Head, Yearly Indicators, Decent Work Data Production Unit, Department of Statistics, ILO Geneva
Mr Chernyshev commenced by noting that in 1999, the ILO Director-General Juan Somavia introduced a forward-looking concept – decent work. The concept has been defined by the ILO and supported by the international community as “opportunities for women and men to obtain decent and productive work in conditions of freedom, equity, security and human dignity.”
Concurrently the EU introduced the concept of Quality of Work.7 While a number of dimensions of the two concepts overlap, the concept of decent work and its measurement
6 The 21 participants included government officials from ministries of labour and planning and national statistical offices of Bangladesh, Cambodia, Indonesia, Malaysia, Nepal, the Philippines and Sri Lanka. In addition, employers’ and workers’ representatives from the three MAP project countries in Asia (Bangladesh, Cambodia and Indonesia) also participated. See Annex 1 for the full list of participants.

6
combines statistical Decent Work Indicators with information on the legal framework. In other words, the ILO framework covers all elements of its four strategic objectives – rights at work; employment and income opportunities; social security and social protection; and social dialogue and tripartism.
Decent work is central to efforts to reduce poverty and is a means for achieving equitable, inclusive and sustainable development. It involves opportunities for work that is productive and delivers a fair income, provides security in the workplace and social protection for workers and their families, and gives people the freedom to express their concerns, to organize and to participate in decisions that affect their lives.
The negative impacts of the global financial crisis have been pervasive and have underlined the importance of decent work in efforts towards recovery. In addition, globalization has had significant positive and negative effects on societies across the world, and these impacts further call for the need to achieve decent work.
The ILO headquarters as well as the field offices have been working since 2000 to measure decent work. The ILO Declaration on Social Justice for a Fair Globalization (2008) endorses the Decent Work Agenda as the main objective of the ILO’s work. And it recommends member States to consider: “the establishment of appropriate indicators or statistics, if necessary with the assistance of the ILO, to monitor and evaluate the progress made…” In September 2008, governments, workers, and employers came together at the Tripartite Meeting of Experts (TME) on the Measurement of Decent Work to recommend a framework of indicators to measure decent work.8 Statistical indicators were reviewed and the importance of systematic information on rights at work and the legal framework for decent work consistent with the ILO supervisory system were stressed. Subsequently, the 18th International Conference of Labour Statisticians (ICLS) in November-December 2008 called for the ILO to pilot the framework in a number of countries and report on progress made at the 19th ICLS.9
Importantly, gender should be treated as a cross-cutting concern of the Decent Work Agenda and the measurement of decent work. It should not be treated in isolation but measurements should provide information about women’s and men’s access to decent work across all substantive elements. Therefore, wherever possible, indicators should be reported separately for men and women in addition to the total. Also, indicators for vertical and horizontal segregation are included under “Equal opportunity and treatment in employment”.
The measurement of decent work should cover all elements of the Decent Work Agenda (beyond employment), all working people, the most vulnerable groups of working people;
7 This issue is high on the EU social policy agenda and is emphasized in the European employment strategy (EES). For further discussion, see: http://ec.europa.eu/social/main.jsp?catId=101&langId=en.
8 The TME was held in September 2008 with participation of 20 experts, plus advisors, observers and ILO staff. For further information, see: http://www.ilo.org/global/What_we_do/Statistics/events/MeetingsOfExperts/lang--en/docName--WCMS_099978/index.htm.
9 The 18th ICLS Resolution concerning further work on the measurement of decent work is available at: http://www.ilo.org/global/What_we_do/Statistics/events/icls/lang--en/WCMS_092024/index.htm.
7
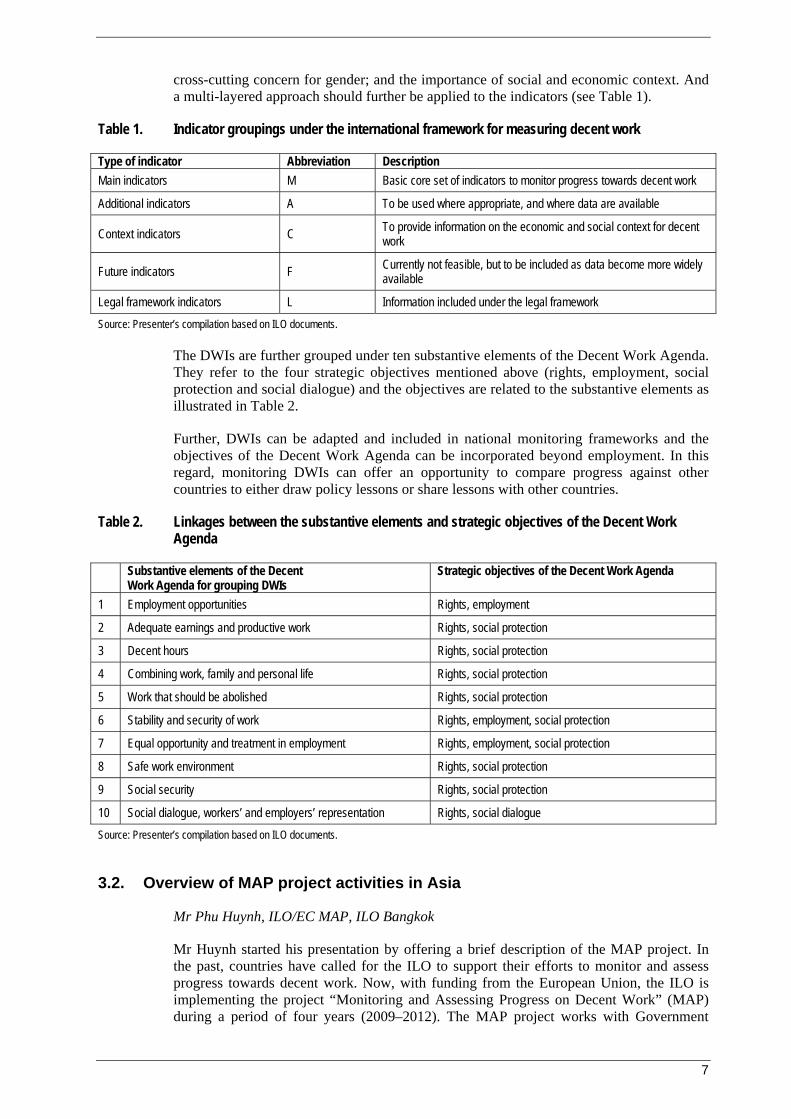
cross-cutting concern for gender; and the importance of social and economic context. And a multi-layered approach should further be applied to the indicators (see Table 1).
Table 1. Indicator groupings under the international framework for measuring decent work
Type of indicator Abbreviation Description Main indicators M Basic core set of indicators to monitor progress towards decent work
Additional indicators A To be used where appropriate, and where data are available
Context indicators C To provide information on the economic and social context for decent work
Future indicators F Currently not feasible, but to be included as data become more widely available
Legal framework indicators L Information included under the legal framework Source: Presenter’s compilation based on ILO documents.
The DWIs are further grouped under ten substantive elements of the Decent Work Agenda. They refer to the four strategic objectives mentioned above (rights, employment, social protection and social dialogue) and the objectives are related to the substantive elements as illustrated in Table 2.
Further, DWIs can be adapted and included in national monitoring frameworks and the objectives of the Decent Work Agenda can be incorporated beyond employment. In this regard, monitoring DWIs can offer an opportunity to compare progress against other countries to either draw policy lessons or share lessons with other countries.
Table 2. Linkages between the substantive elements and strategic objectives of the Decent Work Agenda
Substantive elements of the Decent Work Agenda for grouping DWIs
Strategic objectives of the Decent Work Agenda
1 Employment opportunities Rights, employment
2 Adequate earnings and productive work Rights, social protection
3 Decent hours Rights, social protection
4 Combining work, family and personal life Rights, social protection
5 Work that should be abolished Rights, social protection
6 Stability and security of work Rights, employment, social protection
7 Equal opportunity and treatment in employment Rights, employment, social protection
8 Safe work environment Rights, social protection
9 Social security Rights, social protection
10 Social dialogue, workers’ and employers’ representation Rights, social dialogue Source: Presenter’s compilation based on ILO documents.
3.2. Overview of MAP project activities in Asia
Mr Phu Huynh, ILO/EC MAP, ILO Bangkok
Mr Huynh started his presentation by offering a brief description of the MAP project. In the past, countries have called for the ILO to support their efforts to monitor and assess progress towards decent work. Now, with funding from the European Union, the ILO is implementing the project “Monitoring and Assessing Progress on Decent Work” (MAP) during a period of four years (2009–2012). The MAP project works with Government

8
agencies, workers’ and employers’ organizations and research institutions to strengthen the capacity to self-monitor and self-assess progress towards decent work.
The project covers 10 countries globally:
• Asia: Bangladesh, Cambodia, Indonesia
• Africa: Niger, Zambia
• Europe: Ukraine
• Latin America: Brazil and Peru
• Two additional countries (one in Asia)
The project facilitates the identification of DWIs relevant at the national level; supports data collection and uses the collected data for an integrated policy analysis of decent work to make them relevant for policy making.
The project activities in Asia so far have included preparation of background country studies where gaps have been identified and recommendations aim to strengthen the national DWI system. Background studies in Indonesia and Bangladesh have been completed by the second quarter of 2010, and a draft background study has been prepared for Cambodia. Other activities included national tripartite consultation workshops in Indonesia (March 2010) and Bangladesh (April 2010) where priority DWIs for national monitoring were identified to support national policy frameworks and the DWCPs. In addition, monitoring of crisis impact and recovery has also created the need to prioritize areas for further data collection and analysis.
The project is engaged in enhancing statistical instruments and collection of data to measure decent work. In Cambodia, a labour force survey (LFS) is planned for 2010/11 (pending donor funding), and the ILO has provided assistance through ILO/STATISTICS, ILO/EC MAP, ILO/IPEC and ILO/Bangkok to pilot the Cambodia LFS in December 2009. The survey was designed to cover broad aspects of decent work, including child labour, wages, occupational safety and health, disability and unionization.
In Bangladesh, capacity building and support for analysis of the Informal Sector Survey (ISS) 2010 and the LFS 2010 is being discussed as well as support to strengthen administrative records. In Indonesia the project is discussing the inclusion of decent work questions in the bi-annual LFS and existing establishment surveys and to strengthen administrative records.
Looking ahead, key future activities of the MAP project include the preparation of Decent Work Country Profiles in the project countries. These profiles are in-depth country studies on progress made towards decent work, with policy-oriented analysis of trends and the existing legal and policy frameworks. In addition, a regional training and knowledge-sharing workshop and the development of a global database of DWIs are other activities that are planned for the project.
3.3. Plenary discussion
After the presentations, Mr Luebker opened the floor for discussion, questions and answers.
9
3.3.1. Decent Work Indicators
A Cambodian delegate raised an issue about priority and stability of DWIs in relation to the global financial crisis. The priorities that were emphasized a couple of years ago may not be as relevant in the wake of the crisis and the concern is the effectiveness of monitoring and assessment if the situation is changing.
Mr Sziraczki from ILO Bangkok responded that decent work is an abstract concept, and it should be monitored with a long-term view. In terms of measuring the effects of the crisis, some macro-economic indicators could be more satisfactory in measuring change over the short-term. The DWIs should be assessed over a longer term. It would not be a stable and reliable system if the indicators kept changing.
A participant from Bangladesh raised the issue of standardized terms of reference for assessment and monitoring of DWIs, still based on the country specific situation. Mr Luebker responded that there has to be flexibility in the assessment and monitoring framework and that ILO will not impose any system on countries. But standard modules are being developed. There are many differences between countries, and some standards are similar across all countries. A general template would thus include some indicators that can be agreed by all countries, and then be adapted to the national context.
3.3.2. Coordination
In addition, the Bangladesh participant highlighted the need for the different actors to coordinate their efforts around measuring decent work, on a national as well as regional and international level. Ministries in countries have different roles and collect different data, without necessarily coordinating the data. There are a lot of data and the national workshops can coordinate and bring together different national actors.
There is also a need to coordinate efforts among international agencies such as the World Bank, the Asian Development Bank (ADB) and the ILO. A Malaysian delegate drew attention to the World Bank’s Doing Business Index that appeared to penalize the country’s labour regulations as too ‘rigid’, and emphasized the need to make sure that the organizations are coherent in their efforts. Mr Sziraczki stated that decent work is complex and hard to measure in the form of an index. It is impossible to weigh indicators against each other, such as freedom of association against decent wages. The criticism of the ‘Employing workers’-component of the Doing Business Index had been shared by many constituents, and the World Bank and ILO have been collaborating in this regard to enhance the coherence of indicators and their interpretation.
3.3.3. Lack of data
The delegates from Cambodia and Bangladesh noted the lack of data on the informal sector in comparison to the availability of data on formal work. At the moment, a national LFS is planned in Cambodia as the last one took place in 2001. The ILO is currently working with the Cambodian partners to include more decent work-related questions in the survey. A Bangladeshi participant also mentioned the need to add questions to the national LFS to capture additional elements of decent work.

10
4. Session 2: Group work: Benefits and challenges of measuring decent work in the Asia region
Facilitators: Mr Steven Kapsos, ILO Geneva; and Mr Malte Luebker, ILO Geneva
The session involved a group work activity in which participants reflected on and discussed the benefits and challenges of measuring decent work in the Asian regional context as well as the issues related to its monitoring and assessment. The participants were asked to discuss the relevance of monitoring and assessing progress on decent work by focusing on the following questions:
1. Why should countries monitor and assess progress towards decent work? What are the benefits and potential uses?
2. What are the challenges and potential pitfalls?
4.1. Plenary discussion
The discussion and presentations revealed that there were similar concerns among the groups. The participants were also asked to rate the opportunities and challenges according to importance and the final results are highlighted in Table 3.
Table 3. Opportunities and challenges of monitoring and assessing progress towards decent work
Opportunities
17 votes To know the situation of decent work in the country and to have a benchmark to help plan the future
15 votes Strengthen data collection for policy formulation and programme intervention
15 votes International comparability of decent work
14 votes Promote productive employment, industrial relations, poverty reduction and other substantive elements of decent work
7 votes Prioritize certain indicators to maximize limited resources
Challenges
34 votes Constraints in terms of data availability and reliability
28 votes Concepts and definitions of decent work in relation to informal employment
5 votes Incorporating decent work into national development plans
3 votes Limitations in job opportunities and the labour market
0 votes Shifting economic and social context can change the indicators used to measure decent work Source: Compilation based on participants’ inputs at the Regional Workshop on Monitoring and Assessing Progress on Decent Work in Asia.
11
5. Session 3: Decent Work Indicators availability and gaps: Cases of Cambodia and Indonesia
Moderator: Mr Kee Kim, Labour Economist, ILO Bangkok
This session provided an overview of the major sources of statistical information on decent work. It also discussed the importance of decent work information systems and highlighted some considerations for their integration into national statistical systems. Country presentations from Cambodia and Indonesia provided overviews of the availability and information gaps in DWIs in the national statistical systems, including the data sources that could be used for each indicator.
5.1. Introduction: Data sources on decent work
Mr Igor Chernyshev, Head, Yearly Indicators, Decent Work Data Production Unit, Department of Statistics, ILO Geneva
Mr Chernyshev started his presentation by reviewing the main sources of data to measure decent work. The three major groups of sources are establishment surveys (e.g. employment and wage surveys, occupational wage and vacancy surveys) to measure labour demand; population censuses and household surveys (e.g. labour force surveys and income and expenditure surveys) to measure labour supply; and administrative records (e.g. employment office registers, employment insurance records, tax records, social security files and labour inspection records).
Establishment surveys are designed to provide industrial information on non-farm wages and salaried employment, as well as information on earnings and hours of work and on the distribution of employees by level of earnings and hours.
The population and housing census represents one of the pillars for data collection on the number and characteristics of the population of a country. It collects information on geographical characteristics, internal and international migration characteristics, household and family characteristics, demographic and social characteristics, fertility and mortality, and economic characteristics, among others.
The LFS is the main instrument of data collection on employment, underemployment and unemployment in countries with market economies. It permits the collection of consistent and comprehensive information both for employees and the self-employed population.
The LFS is the most reliable method yet devised for covering the whole population, in which each person can be assigned a definite status of being employed, unemployed or not in the labour force. The LFS, as a household survey, counts each person as an individual only once and thus avoids overcounting, irrespective of the number of jobs he/she may be holding or enterprises he/she may be working for. Often the concepts and definitions of the LFS are based on the ILO international recommendations, and they can thus be used as a yardstick for international comparisons.
Administrative data are produced as a by-product of the administrative functions of a government agency. This data are gathered primarily for administrative rather than for statistical purposes and can therefore be thought of as an indirect method of gathering data. However, it can provide rich data if properly set up to produce relevant statistics.

12
Household and establishment surveys are complementary; each provides significant types of information that the other cannot suitably supply. Population characteristics, for example, are obtained only from the household survey, whereas detailed industrial classifications are much more reliably derived from establishment reports.
After the introductory presentation, the participants reviewed a wall chart containing a subset of the DWIs and identified possible data sources for each indicator. The different possible sources were:
(1) Population census, labour force surveys, income and expenditure surveys and other household surveys;
(2) Establishment surveys; and
(3) Administrative data.
Table 4 summarizes the wall chart, including possible data sources for each indicator and the availability of each indicator for the participating countries (from Session 4).
Table 4: Data sources and availability of Decent Work Indicators
Decent Work Indicator Data source Availability of Decent Work Indicator
Indicator is available and officially published
Indicator is not published but underlying data are available
Indicator and underlying data are not available
Employment opportunities EMPL-1 Employment-to-population ratio
1 Bangladesh, Indonesia, Malaysia, Nepal, Philippines, Sri Lanka
Cambodia -
EMPL-2 Unemployment rate 1 Bangladesh, Cambodia, Indonesia, Malaysia, Nepal, Philippines, Sri Lanka
- -
EMPL-3 Youth not in education and not in employment
1 Bangladesh, Indonesia, Nepal, Philippines, Sri Lanka
Cambodia, Malaysia
EMPL-4 Informal employment 1 Indonesia, Nepal, Philippines
Bangladesh, Malaysia, Sri Lanka
Cambodia
EMPL-9 Proportion of own-account and contr. family workers in total employment
1 Bangladesh, Indonesia, Malaysia, Nepal, Philippines, Sri Lanka
Cambodia
Adequate earnings and productive work EARN-1 Working poor 1 (SES,
HIES, LFS) Malaysia, Philippines
Bangladesh, Cambodia, Indonesia, Nepal, Sri Lanka
EARN-2 Low pay rate (below 2/3 of median hourly earnings)
1 (LFS, LSMS), 2
- Bangladesh, Cambodia, Indonesia, Nepal, Philippines, Sri Lanka
Malaysia
EARN-4 Average real wages 1, 2 Bangladesh, Indonesia, Malaysia, Philippines, Sri Lanka
Cambodia, Nepal

13
Decent Work Indicator Data source Availability of Decent Work Indicator
Indicator is available and officially published
Indicator is not published but underlying data are available
Indicator and underlying data are not available
EARN-5 Minimum wage as % of median wage
1, 2, 3 (minimum wage data)
Malaysia, Sri Lanka, Philippines
Bangladesh, Cambodia, Indonesia, Nepal
Decent hours HOUR-1 Excessive hours (more than 48 hours per week)
1 (LFS, LSMS)
Bangladesh, Indonesia, Malaysia, Nepal, Philippines, Sri Lanka
Cambodia
Combining work, family and personal life Work to be abolished ABOL-1 Child labour (as defined by ICLS resolution)
1 (LFS, CLS, MICS)
Bangladesh, Indonesia, Nepal, Philippines, Sri Lanka
Cambodia Malaysia
Stability and security of work STAB-1 Precarious work / informal employment
1 (LFS, ISS) Philippines Bangladesh, Indonesia, Nepal, Sri Lanka
Cambodia, Malaysia
Employment opportunity and treatment in employment EQUA-1 Occupational segregation by sex
1, 2 Bangladesh, Cambodia, Indonesia, Malaysia, Nepal, Philippines, Sri Lanka
- -
EQUA-2 Female share of employment in ISCO-88 (groups 11 and 12)
1 Nepal, Philippines, Sri Lanka
Bangladesh, Cambodia, Indonesia, Malaysia
Safe work environment SAFE-1 Occupational injury rate, fatal
3 Malaysia, Philippines, Sri Lanka
Bangladesh, Cambodia, Indonesia, Nepal
-
Social Security SECU-1 Share of population aged 65 and above benefitting from a pension
3 Philippines Bangladesh, Cambodia, Indonesia, Malaysia, Nepal, Sri Lanka
SECU-2 Public social security expenditure (% of GDP)
3 Bangladesh, Nepal, Sri Lanka, Philippines
Cambodia, Indonesia, Malaysia
Social dialogue, workers and employers representation DIAL-1 Union density rate 1, 3 Malaysia, Philippines Bangladesh,
Cambodia, Indonesia, Nepal, Sri Lanka
DIAL-2 Enterprises belonging to employer organization
2, 3 Bangladesh, Philippines
Cambodia, Indonesia, Malaysia, Nepal, Sri Lanka
DIAL-3 Collective bargaining coverage rate
1 (LFS), 2, 3 Indonesia, Philippines Bangladesh, Cambodia, Malaysia, Nepal, Sri Lanka
14
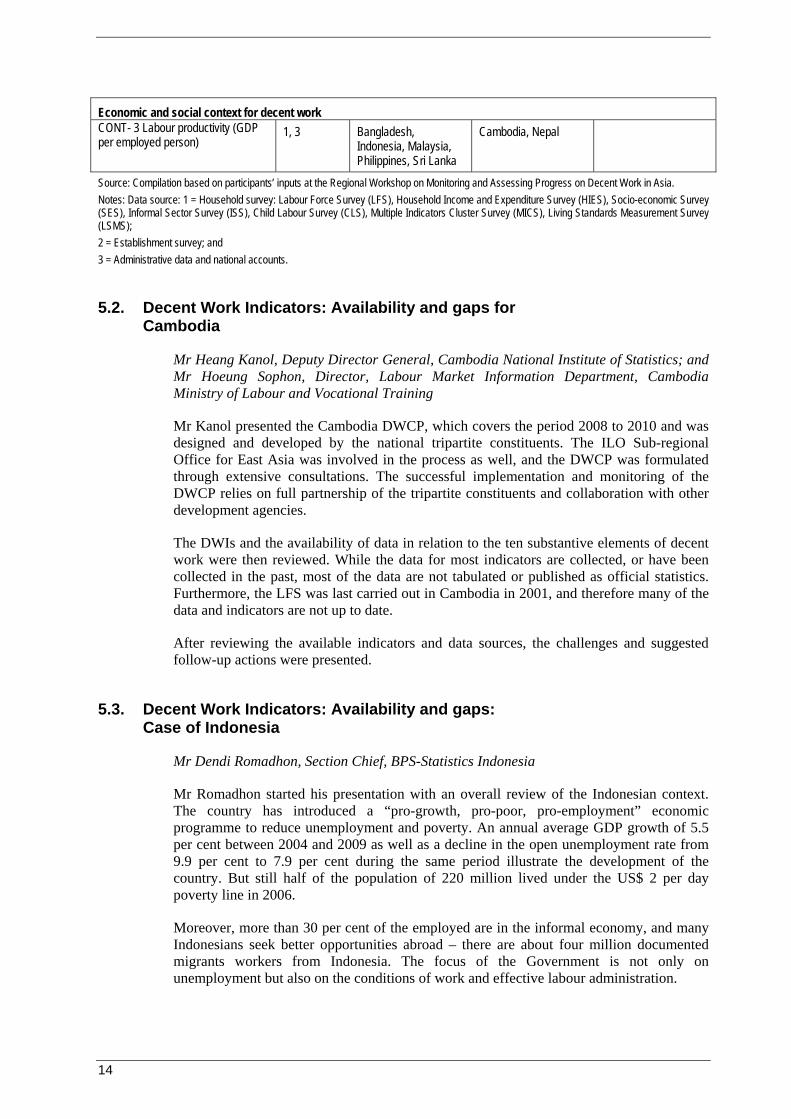
Economic and social context for decent work CONT- 3 Labour productivity (GDP per employed person)
1, 3 Bangladesh, Indonesia, Malaysia, Philippines, Sri Lanka
Cambodia, Nepal
Source: Compilation based on participants’ inputs at the Regional Workshop on Monitoring and Assessing Progress on Decent Work in Asia. Notes: Data source: 1 = Household survey: Labour Force Survey (LFS), Household Income and Expenditure Survey (HIES), Socio-economic Survey (SES), Informal Sector Survey (ISS), Child Labour Survey (CLS), Multiple Indicators Cluster Survey (MICS), Living Standards Measurement Survey (LSMS); 2 = Establishment survey; and 3 = Administrative data and national accounts.
5.2. Decent Work Indicators: Availability and gaps for Cambodia
Mr Heang Kanol, Deputy Director General, Cambodia National Institute of Statistics; and Mr Hoeung Sophon, Director, Labour Market Information Department, Cambodia Ministry of Labour and Vocational Training
Mr Kanol presented the Cambodia DWCP, which covers the period 2008 to 2010 and was designed and developed by the national tripartite constituents. The ILO Sub-regional Office for East Asia was involved in the process as well, and the DWCP was formulated through extensive consultations. The successful implementation and monitoring of the DWCP relies on full partnership of the tripartite constituents and collaboration with other development agencies.
The DWIs and the availability of data in relation to the ten substantive elements of decent work were then reviewed. While the data for most indicators are collected, or have been collected in the past, most of the data are not tabulated or published as official statistics. Furthermore, the LFS was last carried out in Cambodia in 2001, and therefore many of the data and indicators are not up to date.
After reviewing the available indicators and data sources, the challenges and suggested follow-up actions were presented.
5.3. Decent Work Indicators: Availability and gaps: Case of Indonesia
Mr Dendi Romadhon, Section Chief, BPS-Statistics Indonesia
Mr Romadhon started his presentation with an overall review of the Indonesian context. The country has introduced a “pro-growth, pro-poor, pro-employment” economic programme to reduce unemployment and poverty. An annual average GDP growth of 5.5 per cent between 2004 and 2009 as well as a decline in the open unemployment rate from 9.9 per cent to 7.9 per cent during the same period illustrate the development of the country. But still half of the population of 220 million lived under the US$ 2 per day poverty line in 2006.
Moreover, more than 30 per cent of the employed are in the informal economy, and many Indonesians seek better opportunities abroad – there are about four million documented migrants workers from Indonesia. The focus of the Government is not only on unemployment but also on the conditions of work and effective labour administration.
15
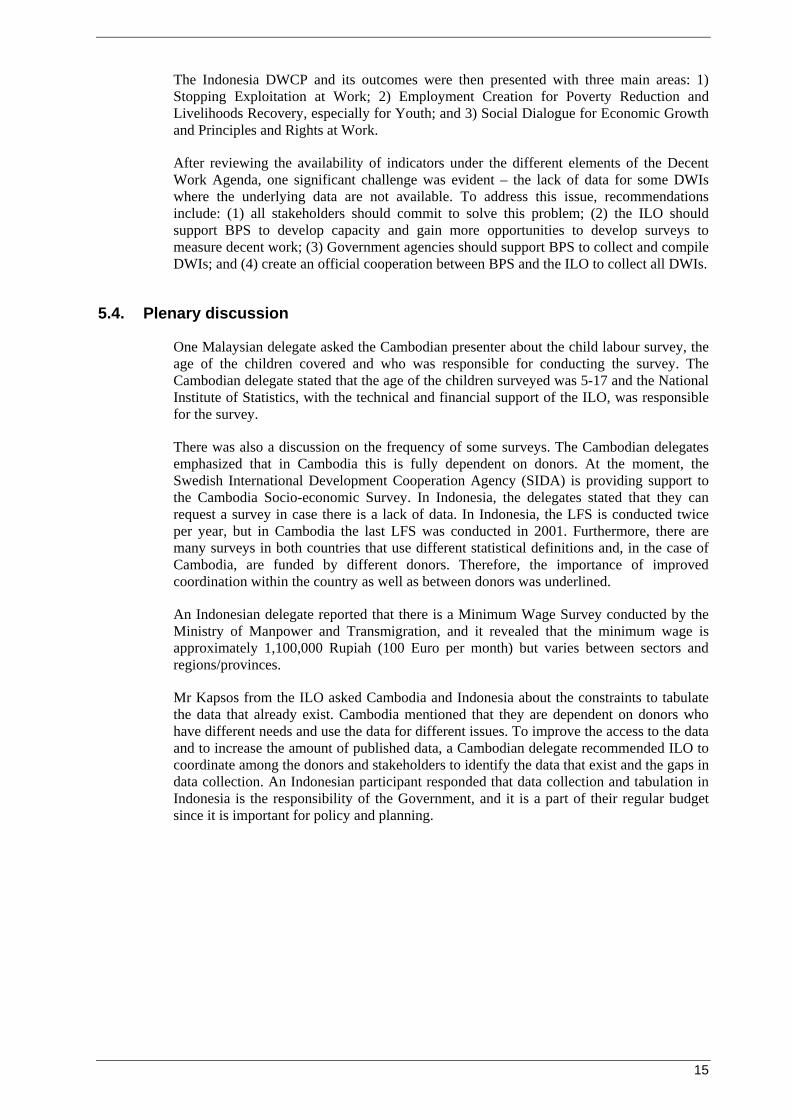
The Indonesia DWCP and its outcomes were then presented with three main areas: 1) Stopping Exploitation at Work; 2) Employment Creation for Poverty Reduction and Livelihoods Recovery, especially for Youth; and 3) Social Dialogue for Economic Growth and Principles and Rights at Work.
After reviewing the availability of indicators under the different elements of the Decent Work Agenda, one significant challenge was evident – the lack of data for some DWIs where the underlying data are not available. To address this issue, recommendations include: (1) all stakeholders should commit to solve this problem; (2) the ILO should support BPS to develop capacity and gain more opportunities to develop surveys to measure decent work; (3) Government agencies should support BPS to collect and compile DWIs; and (4) create an official cooperation between BPS and the ILO to collect all DWIs.
5.4. Plenary discussion
One Malaysian delegate asked the Cambodian presenter about the child labour survey, the age of the children covered and who was responsible for conducting the survey. The Cambodian delegate stated that the age of the children surveyed was 5-17 and the National Institute of Statistics, with the technical and financial support of the ILO, was responsible for the survey.
There was also a discussion on the frequency of some surveys. The Cambodian delegates emphasized that in Cambodia this is fully dependent on donors. At the moment, the Swedish International Development Cooperation Agency (SIDA) is providing support to the Cambodia Socio-economic Survey. In Indonesia, the delegates stated that they can request a survey in case there is a lack of data. In Indonesia, the LFS is conducted twice per year, but in Cambodia the last LFS was conducted in 2001. Furthermore, there are many surveys in both countries that use different statistical definitions and, in the case of Cambodia, are funded by different donors. Therefore, the importance of improved coordination within the country as well as between donors was underlined.
An Indonesian delegate reported that there is a Minimum Wage Survey conducted by the Ministry of Manpower and Transmigration, and it revealed that the minimum wage is approximately 1,100,000 Rupiah (100 Euro per month) but varies between sectors and regions/provinces.
Mr Kapsos from the ILO asked Cambodia and Indonesia about the constraints to tabulate the data that already exist. Cambodia mentioned that they are dependent on donors who have different needs and use the data for different issues. To improve the access to the data and to increase the amount of published data, a Cambodian delegate recommended ILO to coordinate among the donors and stakeholders to identify the data that exist and the gaps in data collection. An Indonesian participant responded that data collection and tabulation in Indonesia is the responsibility of the Government, and it is a part of their regular budget since it is important for policy and planning.
16
6. Session 4: Group work: Availability and gaps in measuring decent work
Introduction: Mr Malte Luebker, ILO Geneva
Facilitators: Mr Gyorgy Sziraczki, ILO Bangkok; Mr Igor Chernyshev, ILO Geneva; and Mr Phu Huynh, ILO Bangkok
Mr Luebker introduced the exercise, and the participants divided into groups based on country delegations. Through the group work, the countries discussed the various national data sources, including household and establishment surveys and administrative records, to produce DWIs and identified the existing availability and gaps in DWIs at the national level.
The groups were asked to fill out a table focusing on the following two questions:
1. Which indicators are currently available and which indicators are not available? Available indicators include those that are either (1) officially published or (2) not published but the underlying data for the indicator are already collected.
2. For the indicators that are available, what is the data source for that information (household survey such as labour force survey, household income and expenditure survey; establishment survey; or administrative records, etc.)?
Participants then used labels with the name of their country to denote indicator availability on the wall chart.
6.1. Country reports10
Nepal was the first group to present the availability of DWIs in their country. First, the participants mentioned that there are limitations in defining the informal sector and the need to work on identification of precarious work. Furthermore, there are data to measure GDP in relation to employment (labour productivity), but this has not been done yet.
The Philippines mentioned that there are data for most of the indicators. In 2009, a survey on the informal sector had been conducted, and the LFS is based on a household sample that is also used by the Family Income and Expenditure Survey which allows for linking household income and expenditure statistics to employment characteristics in order to measure working poor. However, one indicator that is not tabulated and published officially is “Low pay rate (below 2/3 of median hourly earnings)”.
In Malaysia there are no data available on informal employment, but a survey was conducted in 2009 and the data are still being processed. In addition, the underlying data are available for a number of indicators but the indicators have not been tabulated or published, including indicators related to social security, enterprises belonging to employers’ organizations and collective bargaining coverage. Currently, there are no statistical instruments in place to measure the extent of child labour in Malaysia.
10 For full details of the availability of indicators for each country, please see Table 4 under Session 3.

17
Sri Lanka made a presentation on the availability of DWIs in the national statistical system. The main data source is the Sri Lanka LFS that is designed to measure the level and trends of employment, unemployment and the labour force. The survey has been done on a quarterly basis since 1990. To fulfil requirements of data users and to provide further information for planning purposes, improvements were made to the LFS in 2006 to cover informal employment. Moreover, many indicators are already available; however, the underlying data concerning social dialogue indicators are collected but not tabulated and published.
Mr Luebker summarized some of the findings from the session and concluded that the traditional labour market concepts such as employment, unemployment and underemployment were best covered by existing LFS and other household surveys. In terms of adequate earnings and data on child labour, he concluded that many countries have collected the data but it is often not tabulated or processed. Data gaps were also evident for subjects such as social security and social dialogue.
In regard to forced labour, there was a lack of reliable data in this area. But it is acknowledged as an important area to measure. This is similar to the situation on measuring child labour, where concerted efforts began some 15 to 20 years ago. In terms of stability and security at work, this is difficult to determine since there are many different definitions of the concept.
There were some questions from the participants about definitions on informal sector, informal work and precarious work and the definitions and differences between the concepts. Mr Luebker mentioned that these issues would be discussed more in-depth in an upcoming session on the 2nd day of the workshop.
7. Session 5: Regional initiatives on measuring informal employment: Cases of Bangladesh and Nepal
Introduction and moderator: Mr Igor Chernyshev, ILO Geneva
Mr Chernyshev introduced the session by explaining that employment in the informal economy refers to two concepts: employment in the informal sector and informal employment. These related concepts complement each other and refer to different aspects of the informalization of employment. It is important to keep them separate for the purpose of analysis, measurement and policymaking.
The major difference between the concepts is that employment in the informal sector is an enterprise-based concept, while informal employment is a jobs-based concept. Employment in the informal sector refers to all jobs in informal sector enterprises, or all persons who, during a given reference period, were employed in at least one informal sector enterprise, irrespective of their status in employment and whether it was their main or secondary job. Furthermore, informal employment refers to the total number of informal jobs, whether carried out in formal sector enterprises, informal sector enterprises, or households (paid domestic workers, production for own-consumption) during a given reference period.
Three indicators can be used to measure informal sector employment and informal employment: (1) Informal employment as a percentage of total employment; (2) Informal sector employment as a percentage of total employment; and (3) Informal employment outside the informal sector as a percentage of total employment. These indicators can be calculated separately for all branches of economic activity and excluding agriculture.
18
7.1. Statistics on informal employment: Regional initiatives
Ms Margarita Guerrero, Senior Statistician, Statistics Division, UNESCAP
Ms Guerrero started her presentation by explaining why it is important to collect data on informality. First, it is important to understand and manage issues on informal employment and the informal sector. Second, there is a need for re-orientation towards worker-centred economic policies that is only possible with intensive analysis of the informal sector and those engaged in informal employment. Finally, visibility of the informal sector and informal workers will be raised if statistics about them are included in the government’s labour and employment statistics.
There are two major regional initiatives on measuring informal employment: one ADB project11 and one UN initiative.12 What is common between the two projects is that they use the same survey methodology and the same definitions for informal employment.
There is growing importance in the global initiative to improve the collection, analysis and dissemination of internationally comparable data on the informal sector and informal employment in national statistical systems. The application of standards, methodologies and best practices should be promoted and the data should be integrated into compilation of national accounts through a direct estimation of the GDP of informal sector enterprises. The resulting data could then be used for analysis, advocacy and policy formulation.
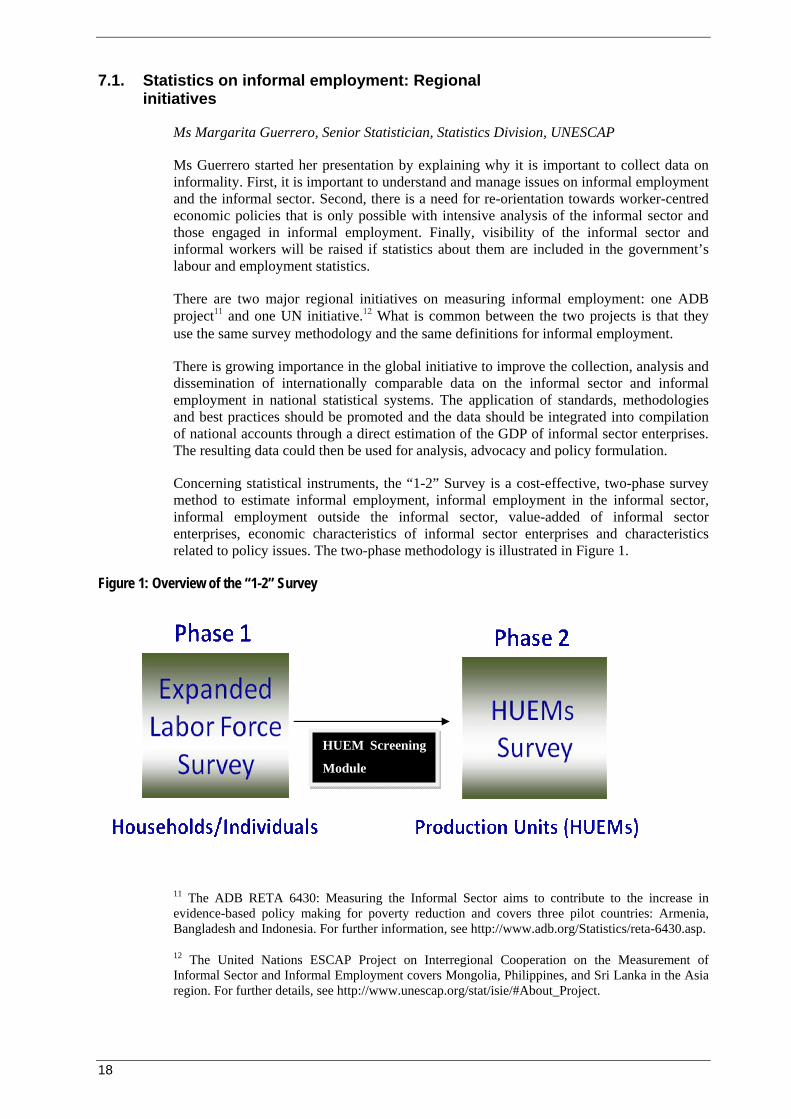
Concerning statistical instruments, the “1-2” Survey is a cost-effective, two-phase survey method to estimate informal employment, informal employment in the informal sector, informal employment outside the informal sector, value-added of informal sector enterprises, economic characteristics of informal sector enterprises and characteristics related to policy issues. The two-phase methodology is illustrated in Figure 1.
Figure 1: Overview of the “1-2” Survey
11 The ADB RETA 6430: Measuring the Informal Sector aims to contribute to the increase in evidence-based policy making for poverty reduction and covers three pilot countries: Armenia, Bangladesh and Indonesia. For further information, see http://www.adb.org/Statistics/reta-6430.asp.
12 The United Nations ESCAP Project on Interregional Cooperation on the Measurement of Informal Sector and Informal Employment covers Mongolia, Philippines, and Sri Lanka in the Asia region. For further details, see http://www.unescap.org/stat/isie/#About_Project.
HUEM Screening
Module

19
To implement the “1-2” Survey, the LFS is examined first to see if the questionnaire can be expanded, and a Household Unincorporated Enterprise with Market Production (HUEM) screening module is then analyzed for any additional modifications. Then the expanded LFS is carried out before conducting the HUEM survey in the second phase among production units.
Regarding statistical definitions of HUEMs and informal sector enterprises, the challenge lies in how to define the informal sector within the household sector and how to separate these entities. Oftentimes, the policy focus in a country guides how the informal sector is defined at the country level.
Finally, an example from 2009 in the Philippines was highlighted to illustrate gender-disaggregated data collected on informal jobs in agriculture and non-agriculture.
7.2. Measuring the informal employment in Bangladesh
Mr Kabir Uddin Ahmed, Deputy Director, Bangladesh Bureau of Statistics
Mr Ahmed started with a brief introduction of the national context with comprehensive information on the statistical system in Bangladesh. The Bangladesh Bureau of Statistics (BBS) was established in 1974 under the Ministry of Planning. Based on the latest published data in the LFS 2005/06 by BBS, the labour force was nearly 49.5 million, with 47.4 million employed and 2.1 million unemployed. In addition, 87.7 per cent of the workers in the country are engaged in informal employment. Moreover, wage data in all industries reveal significant disparities between earnings in formal versus informal employment. Gender wage gaps were also presented and discussed.
Bangladesh is a part of the ADB regional technical assistance project “Measuring the Informal Sector” that aims to contribute to the increase in evidence-based policy making for poverty reduction by helping national statistical offices to acquire a sound strategy for collecting data on the informal sector, by exploring the processes to integrate informal sector data into national accounts and by studying the links between poverty and the informal sector. The goal of the project is to develop a unifying definition of the informal sector and formulate an integrated data collection methodology to design an implementation strategy and tools for data collection, processing and analysis.
In Bangladesh, implementing the Informal Sector Survey in 2009/10 was critical given the limited availability of data in this area despite the high economic participation in the informal sector. The Bangladesh Informal Sector Survey 2009/10 uses the same mixed-survey approach previously presented by Ms Guerrero.
The informal sector in Bangladesh includes household unincorporated enterprises with less than 10 persons engaged in the activity/establishment and without a complete set of accounts. Furthermore, informal workers were defined as: all those who identify themselves to be unpaid family workers, irregular paid workers, day labourers in agriculture/non-agriculture, domestic workers, and paid/unpaid apprentices; all workers employed in the personal household sector; paid employees working in the formal sector but not paid weekly or monthly; paid employees working in personal establishments and “other” sectors; and employers, self employed workers, and “other” workers employed in businesses with no written accounts and/or are not registered with the proper authorities.
20
Concerning challenges for identifying and surveying informal employment, the concepts and definitions are new, as is the mixed-survey approach (“1-2” Survey). In addition, it requires an excessive work load for the enumerators as two modules are added to the LFS; and finally there are issues concerning the reliability and completeness of data.
7.3. Measuring informal employment through labour force survey: Nepal case
Mr Uttam Narayan Malla, Director General, Nepal Central Bureau of Statistics
Mr Malla presented the activities related to measuring the informal sector and sources of data in Nepal. The Nepalese economy is heavily reliant on informal activities; over 50 per cent of the GDP comes from the informal sector. Most of the agricultural activities are informal and a majority of the products are also consumed by the producer household.
The data sources used to gather information on informal employment and the informal sector in Nepal are household surveys and administrative records. The Central Bureau of Statistics (CBS) conducts periodically the Nepal LFS. The first Nepal LFS took place in 1998/99 and the second LFS in 2008.
In terms of the survey methodology, design and scope of the Nepal LFS in 2008, questions were added to measure informal employment in accordance with the recommendations of the ICLS held in 2003. The informal sector for the survey purpose has been defined only in respect of the non-agriculture sector because of the difficulty in defining informal sector activities in the agriculture sector. The concept of informal employment in Nepal is defined as:
a) All own account workers without employees;
b) All employers in the informal sector;
c) All contributing family workers; and
d) All employees in informal jobs (where an informal job is defined as not having paid annual leave or where the employer does not pay social security contributions for the worker).
The summary results of the survey in 2008 were presented, and one of the important findings is that 96.2 percent of the currently employed (aged 15 years and above) were informally employed across all industries.
Mr Chernyshev summarized the session by concluding that informal employment and the informal economy are very prominent in the economies of Bangladesh and Nepal, and it is therefore important to measure and assess. The different survey instruments used for statistical measurement in both countries have successfully yielded results to measure the informal sector and informal employment.
21
8. Session 6: Calculating and interpreting wage indicators: Cases of Malaysia and Sri Lanka
Introduction and moderator: Mr John Ritchotte, Specialist, Labour Administration and Labour Relations, ILO Bangkok
The session provided an overview of global and regional trends in wages. It reviewed the concepts and definitions of DWIs used for monitoring “Adequate earnings and productive employment” at the national level and highlighted good practices related to setting wage policies. The session gave an opportunity for participants to share country experiences in the collection of wage data and its analysis for designing national wage policies, while highlighting the cases of Sri Lanka and Malaysia.
8.1. Calculating and interpreting wage indicators
Mr Malte Luebker, Conditions of Work and Employment Programme, ILO Geneva
Mr Luebker started the presentation by providing the context for indicators on wages and the ILO’s mandate on wage issues. The ILO Declaration of Philadelphia (1944) recognizes the ILO’s obligation to promote “policies in regard to wages and earnings […] to ensure a just share of the fruits of progress to all, and a minimum living wage to all employed […].”13 The Declaration on Social Justice for a Fair Globalization (2008), which expresses the ILO’s contemporary vision for achieving social justice, calls on member States to implement the Decent Work Agenda, including through “policies in regard to wages and earnings […] to ensure a just share of the fruits of progress to all, and a minimum living wage to all employed […]”, thereby renewing the previous commitment.14
The DWIs for “Adequate earnings and productive work” can be used to monitor national trends as a basis for an informed and evidence-based wage policy. At the global level, the ILO uses wage indicators to monitor and evaluate global and regional trends in the ILO’s Global Wage Report.15 The DWIs draw on existing ICLS definitions and overlap with the MDG indicators for Goal 1 (target 1B) in terms of the working poverty rate and labour productivity.16
Working poverty is defined at the household level, and any employed person who lives in a poor household is considered to be ‘working poor’. For purposes of international monitoring, the international poverty line of PPP-adjusted US$ 1.25 and US$ 2 is
13 The Declaration of Philadelphia was adopted at the 26th Conference of the International Labour Organization in 1944. See: http://www.ilo.org/ilolex/english/iloconst.htm.
14 See: http://www.ilo.org/global/What_we_do/Publications/Officialdocuments/lang--en/docName--WCMS_099766/index.htm.
15 See: http://www.ilo.org/public/english/protection/condtrav/wages/index.htm.
16 MDG 1: Eradicate extreme poverty and hunger, Target 1b: Achieve full and productive employment and decent work for all, including women and young people. See: http://www.undp.org/mdg/goal1.shtml.
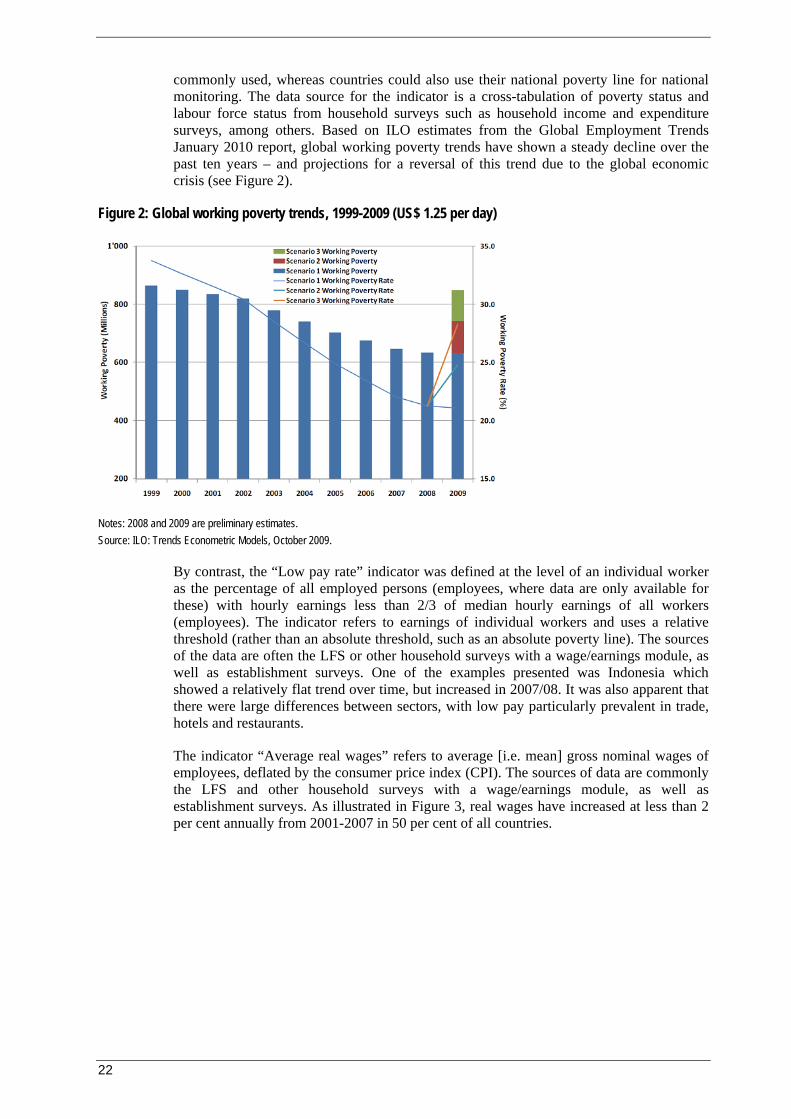
22
commonly used, whereas countries could also use their national poverty line for national monitoring. The data source for the indicator is a cross-tabulation of poverty status and labour force status from household surveys such as household income and expenditure surveys, among others. Based on ILO estimates from the Global Employment Trends January 2010 report, global working poverty trends have shown a steady decline over the past ten years – and projections for a reversal of this trend due to the global economic crisis (see Figure 2).
Figure 2: Global working poverty trends, 1999-2009 (US$ 1.25 per day)
Notes: 2008 and 2009 are preliminary estimates. Source: ILO: Trends Econometric Models, October 2009.
By contrast, the “Low pay rate” indicator was defined at the level of an individual worker as the percentage of all employed persons (employees, where data are only available for these) with hourly earnings less than 2/3 of median hourly earnings of all workers (employees). The indicator refers to earnings of individual workers and uses a relative threshold (rather than an absolute threshold, such as an absolute poverty line). The sources of the data are often the LFS or other household surveys with a wage/earnings module, as well as establishment surveys. One of the examples presented was Indonesia which showed a relatively flat trend over time, but increased in 2007/08. It was also apparent that there were large differences between sectors, with low pay particularly prevalent in trade, hotels and restaurants.
The indicator “Average real wages” refers to average [i.e. mean] gross nominal wages of employees, deflated by the consumer price index (CPI). The sources of data are commonly the LFS and other household surveys with a wage/earnings module, as well as establishment surveys. As illustrated in Figure 3, real wages have increased at less than 2 per cent annually from 2001-2007 in 50 per cent of all countries.

23
Figure 3: Increase in average real wages, 2001-2007
Source: ILO: Global Wage Report 2008/09 (Geneva).
In terms of “Labour productivity (GDP per employed person, level and growth rate)” the definition is in line with the MDG indicator, annual change in [real] GDP at market prices per person employed. Some countries calculate it as ‘per hour worked’. An increase in labour productivity does not itself signal progress towards decent work, but provides a context for a sustainable increase in wages. Figure 4 indicates that real GDP growth in Asia has been driven primarily by increases in productivity, while employment growth has remained relatively steady.
Figure 4: Real GDP, labour productivity and employment growth in Asia, 2000-2008 (%)
Sources: World Bank: World Development Indicators, 2010; and ILO: Key Indicators of the Labour Market (KILM), 6th edition.
The “Labour share in GDP” is defined as the total compensation of employees as a percentage of gross domestic product, and grouped under the context indicators (like labour productivity). It was also mentioned that some countries calculate adjusted labour share (to adjust for change in share of employees), and produce sectoral disaggregation based on value added in each sector. National accounts are the source for this indicator.

24
Figure 5 shows that in 70 per cent of all countries the wage share has declined. This indicates that wages have fallen behind GDP growth, and that workers have hence benefited less from it than under a scenario with a stable or rising labour share.
Figure 5: Change in the labour share in GDP, 1995-2007
Source: ILO: Global Wage Report 2008/09 (Geneva).
Finally, the second edition of the Global Wage Report 2010/11 will be published in late 2010 and will analyze trends in wages during the global crisis and the linkage to labour productivity trends. The Global Wage Report 2010/11 builds on an updated and expanded Global Wage Database, which currently covers some 57 per cent of all countries that account for approximately 92 per cent of the world’s employees and 97 per cent of global wages. The database is still being updated, but the wage data from participating countries that are already included in the database were presented. The participants were invited to provide comments and suggestions to the data that were presented during the session.
8.2. Decent work and wage setting in Malaysia
Mr Sh. Yahya bin Sh. Mohamad, Director General of Labour for Peninsular Malaysia, Ministry of Human Resources
Mr Mohamad started by noting that the Decent Work Agenda had been articulated by the Ministry of Human Resources under its mandate within the national developmental policies. In 2008 there was a national workshop on the Decent Work Agenda in Malaysia. Some strategic objectives for Malaysia’s Decent Work Agenda have been identified as:
1. To create employment opportunities and ensure workers’ rights
2. To provide social safety networks
3. To develop nationwide competitive manpower
4. To implement dynamic occupational safety and health practices
5. To resolve industrial disputes fairly and equitably
6. To maintain harmonious industrial relationships
Then, an overview of the availability of DWIs in Malaysia for monitoring progress on decent work in line with the Decent Work Agenda was presented along with the potential national data sources.
25
Based on trends and projections of employment by sector and occupation group for the period 2006 to 2015, there is a projected manpower shortage in the manufacturing sector, and this trend is expected to increase since national workers are less likely to be employed in manufacturing in the future. The trend would therefore likely coincide with an increasing demand for migrant workers to fill labour shortages in this sector.
With regard to the wage system in Malaysia, the legal framework for salary and wage payment is governed by the Employment Act 1955, the Labour Ordinance (Sabah, Chapter 67), and the Labour Ordinance (Sarawak, Chapter 76). This legislation defines wages as basic pay and all other cash payments made to employees for their contract of service. Contracts, payment of wages and other issues related to wages in Malaysia were also reviewed. In this regard, the Productivity-Linked Wage System (PLWS) is another concept that was discussed. PLWS is a strategic tool for enhancing business efficiency as it links the payment of wages to productivity, enables a closer link between wages and productivity to enhance competitiveness, promotes employment stability and ensures companies adopt a systematic approach in linking wages to productivity to sustain labour cost competitiveness.
The primary sources for wage data include the Establishment Survey carried out by the Department of Statistics Malaysia; the National Employment Return carried out by the Ministry of Human Resources; the Salary and Fringe Benefit Survey of Executives and Non-executives implemented by the Malaysian Employers Federation; and the Salaries and Wages Survey which is a household survey carried out by the Department of Statistics Malaysia. In addition, information on wages is available from the Department of Labour, the Employees Provident Fund and the Social Security Organization.
Finally, the measures to promote the payment of decent wages for workers in Malaysia include: (1) using dialogue and adopting collective agreements between employers and employees, (2) establishing wage councils, (3) adopting the PLWS, and (4) other measures including commitment from top management and providing employees with necessary information and knowledge.
8.3. Plenary discussion
8.3.1. Productivity-Linked Wage System
One of the key issues of interest for the participants was the PLWS, its implementation in Malaysia and the incentives for the employers. The Malaysian delegate responded that the number of workers under the system has increased in the last two years, which has lead to benefits for nearly one million workers. The main incentive for employers to participate was an advantageous tax treatment.
8.3.2. Wage council
One of the Cambodian delegates asked about the effectiveness of the wage council. The Malaysian delegate responded that it is based on sub-sectors and that the focus is the establishment of a minimum wage. The issue is discussed among social partners, a survey is conducted, a minimum wage is proposed, then comments are received from workers and employers, and finally the Government sets the minimum wage. In this regard, the National Labour Advisory Council is the highest tripartite body in Malaysia, and a committee of workers’ and employers’ representatives reviews the labour laws before implementation.

26
8.3.3. Migrant workers
A Bangladeshi delegate asked the Malaysian presenter how decent work can be ensured if migrant workers face unfair treatment, and if it was possible to disaggregate wage data on foreign versus national workers. The response was that decent work is applied to local and foreign workers under the law. If workers are not treated well they can go to their embassy or the Ministry of Human Resources. There should not be discrimination of foreign workers in Malaysia. In regard to disaggregation of wage data, the Ministry has already compiled them for internal use but the data are not publically available.
8.3.4. Wages, productivity and decent work
With respect to the nexus between productivity and wages, Mr Luebker noted that that the increase in labour productivity observed in many countries does not necessarily mean progress towards decent work, though it provided good pre-conditions for improvements in working conditions. On the other hand, better working conditions, skills and stability can also be a crucial factor to support gains in productivity. This could become a virtuous cycle of increased productivity which can lead to better working conditions, which in turn can lead to better labour productivity, supporting further increases in wages.
8.4. Sri Lanka: Decent Work Indicators: Adequate earnings and productive work
Ms Janaki Amaratunge, Assistant Secretary, Sri Lanka Ministry of Labour Relations and Productivity Promotion; and Mr Subawickrama Pannala Appuhamilage, Sri Lanka Department of Census and Statistics
Ms Amaratunge started her presentation by examining wage policies in Sri Lanka and highlighted that minimum wages are fixed in the public sector. Civil servants will receive a salary increase in the fiscal budget of 2010; this has been done every year since 2005. After discussions with relevant trade unions, the monthly cost of living allowance was also increased.
A survey has been conducted on wages, and the key policy issues identified were: 1) the informal sector is large and many policy reforms, including those pertaining to wages, still focus on formal sector employment; 2) in Sri Lanka wages are generally low and there is a large gap between public and private sector wages; 3) there is low collective bargaining coverage; and 4) the linkages between productivity and wages are weak in Sri Lanka.
The reforms that were identified for further improvement are: 1) to develop a national wage fixing mechanism and to develop a wage council to act as wage fixing body; 2) strengthen tripartite discussions and consultations on wage fixing; 3) develop capacity to set wage increases; and 4) strengthen the National Labour Advisory Council.
A review of the DWIs and the main sources of data were then presented. With regard to data sources, Mr Appuhamilage mentioned that the Department of Census and Statistics (DCS) of Sri Lanka started the HIES series in 1985 to fulfil data and information requirements related to measuring household living standards. The HIES 2006/2007 is the seventh survey in the series. Generally, the HIES is a yearlong national sample survey which was conducted once every five years prior to 2006/2007. However, following the HIES 2006/2007, DCS is aiming to carry out the survey annually due to high demand.
The official poverty line in Sri Lanka is determined by the following:
27
• First, the per capita expenditure required for a person to maintain his/her minimum calorie requirement is computed to derive the food poverty line;
• Then the food poverty line is adjusted, taking the minimum non-food requirement of a person into consideration, to arrive at the poverty line.
The poverty incidence among the employed population (working poverty) shows a decline since 1995/96 from 24.6 per cent to 13.7 per cent in 2006/07. Moreover, no gender disparity is shown in the working poverty incidence. On the other hand, poverty and deprivation are higher among private sector employees.
8.5. Plenary discussion
Regarding the wage data for Indonesia that were presented, there were diverging trends for the years 2005-2007 based on two different data sources, the LFS and the establishment survey. The participants discussed which data source would be more reliable, and one Indonesian delegate responded that the more reliable survey for Indonesia in this case is the establishment survey.
9. Session 7: Employment and working poverty indicators for MDG monitoring
Introduction: Mr Kee Kim, ILO Bangkok
Mr Kim introduced the session and its objectives, noting that it would provide an overview of concepts and definitions of key employment and poverty indicators under the ILO framework of DWIs. The session would also highlight global and regional trends of these indicators for monitoring progress towards MDG target 1b. In addition, it would include a group work exercise where participants examine existing national household surveys to assess the feasibility of compiling working poverty indicators.
9.1. Employment and working poverty indicators for MDG monitoring
Mr Steven Kapsos, Economist, Employment Trends, ILO Geneva
Mr Kapsos began the presentation by providing an overview to the MDG employment indicators. There are five indicators on employment under MDG 1 and MDG 3.17 Initially, the MDGs did not have a strong focus on employment, but the ILO has advocated strongly for its inclusion. In 2008, target 1B was included in MDG 1: Achieve full and productive employment and decent work for all, including women and young people.
Regarding the various employment indicators and their definitions, the “Employment-to-population ratio” (EPR) measures the proportion of a country’s working-age population that is employed. EPR is defined as total employment as a share of the total working-age population (or EPR = total employment ÷ working-age population), and the sources of data
17 For further details, see ILO: Guide to the new Millennium Development Goals Employment Indicators: Including the full set of Decent Work Indicators (Geneva, 2009), http://www.ilo.org/wcmsp5/groups/public/---ed_emp/documents/publication/wcms_110511.pdf.
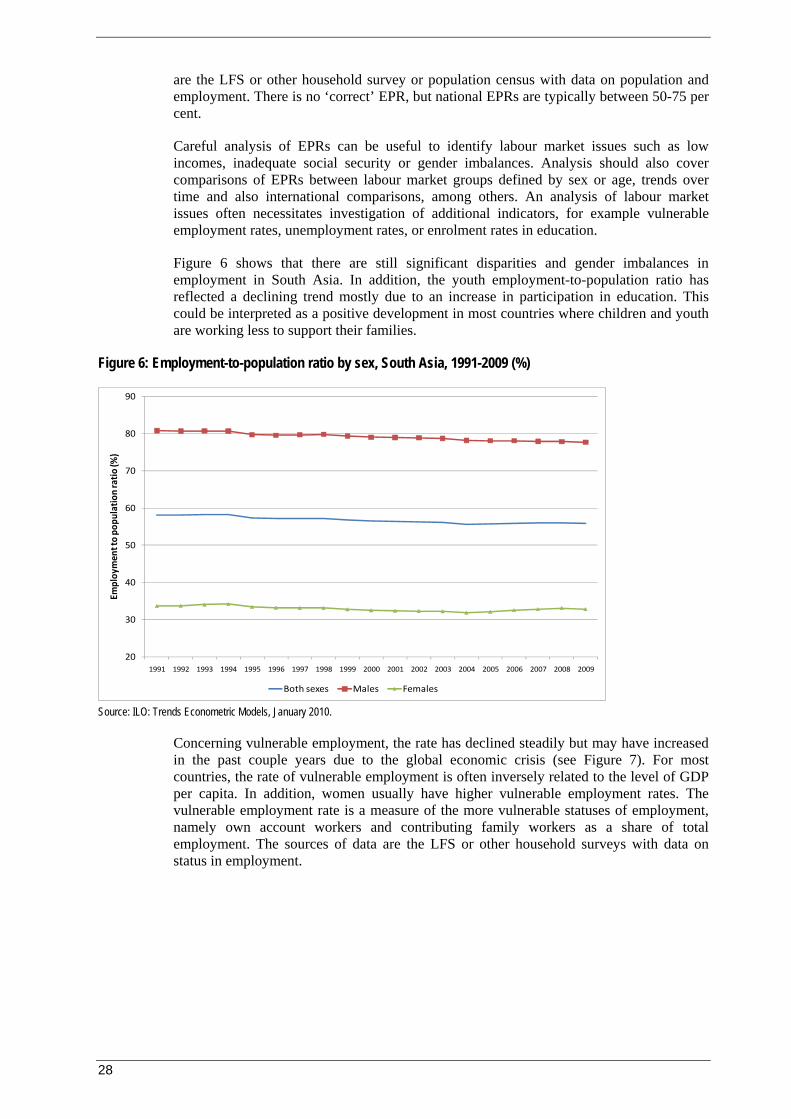
28
are the LFS or other household survey or population census with data on population and employment. There is no ‘correct’ EPR, but national EPRs are typically between 50-75 per cent.
Careful analysis of EPRs can be useful to identify labour market issues such as low incomes, inadequate social security or gender imbalances. Analysis should also cover comparisons of EPRs between labour market groups defined by sex or age, trends over time and also international comparisons, among others. An analysis of labour market issues often necessitates investigation of additional indicators, for example vulnerable employment rates, unemployment rates, or enrolment rates in education.
Figure 6 shows that there are still significant disparities and gender imbalances in employment in South Asia. In addition, the youth employment-to-population ratio has reflected a declining trend mostly due to an increase in participation in education. This could be interpreted as a positive development in most countries where children and youth are working less to support their families.
Figure 6: Employment-to-population ratio by sex, South Asia, 1991-2009 (%)
20
30
40
50
60
70
80
90
1991 1992 1993 1994 1995 1996 1997 1998 1999 2000 2001 2002 2003 2004 2005 2006 2007 2008 2009
Employ
men
t to po
pulatio
n ratio
(%)
Both sexes Males Females
Source: ILO: Trends Econometric Models, January 2010.
Concerning vulnerable employment, the rate has declined steadily but may have increased in the past couple years due to the global economic crisis (see Figure 7). For most countries, the rate of vulnerable employment is often inversely related to the level of GDP per capita. In addition, women usually have higher vulnerable employment rates. The vulnerable employment rate is a measure of the more vulnerable statuses of employment, namely own account workers and contributing family workers as a share of total employment. The sources of data are the LFS or other household surveys with data on status in employment.
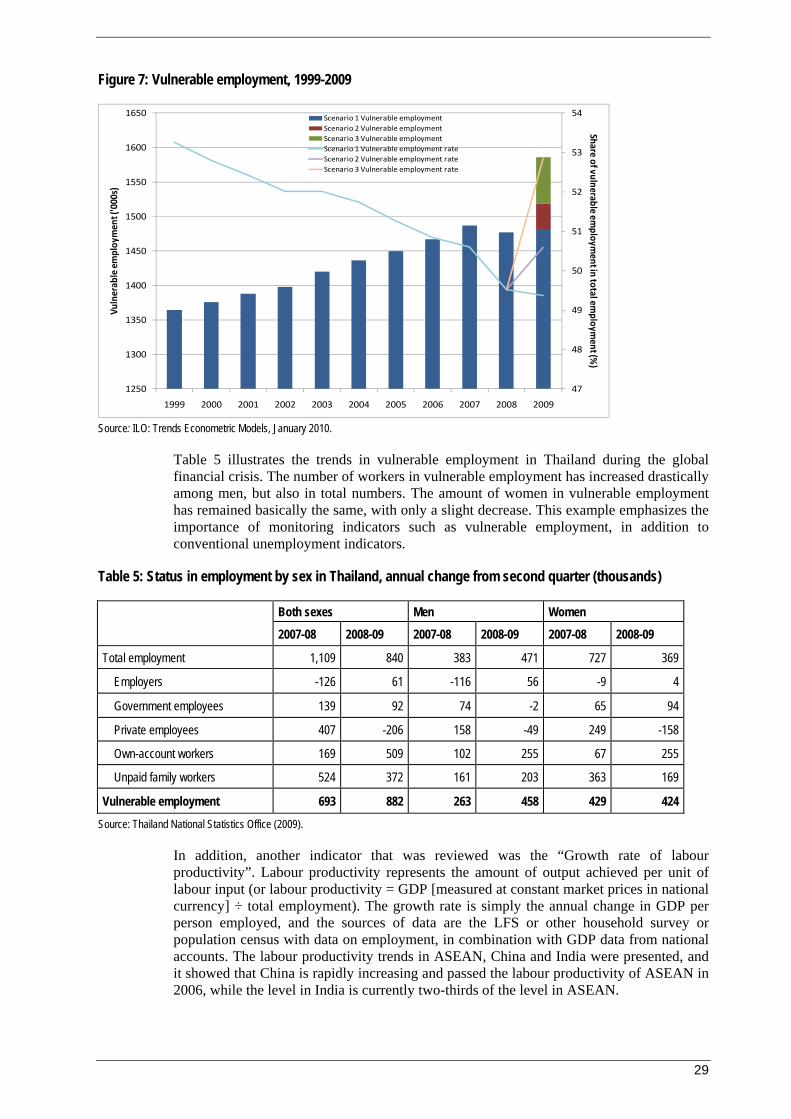
29
Figure 7: Vulnerable employment, 1999-2009
47
48
49
50
51
52
53
54
1250
1300
1350
1400
1450
1500
1550
1600
1650
1999 2000 2001 2002 2003 2004 2005 2006 2007 2008 2009
Share of vulnerable employm
ent in total employm
ent (%)
Vulnerab
le employ
men
t ('000s)
Scenario 1 Vulnerable employmentScenario 2 Vulnerable employmentScenario 3 Vulnerable employmentScenario 1 Vulnerable employment rateScenario 2 Vulnerable employment rateScenario 3 Vulnerable employment rate
Source: ILO: Trends Econometric Models, January 2010.
Table 5 illustrates the trends in vulnerable employment in Thailand during the global financial crisis. The number of workers in vulnerable employment has increased drastically among men, but also in total numbers. The amount of women in vulnerable employment has remained basically the same, with only a slight decrease. This example emphasizes the importance of monitoring indicators such as vulnerable employment, in addition to conventional unemployment indicators.
Table 5: Status in employment by sex in Thailand, annual change from second quarter (thousands)
Both sexes Men Women
2007-08 2008-09 2007-08 2008-09 2007-08 2008-09
Total employment 1,109 840 383 471 727 369
Employers -126 61 -116 56 -9 4
Government employees 139 92 74 -2 65 94
Private employees 407 -206 158 -49 249 -158
Own-account workers 169 509 102 255 67 255
Unpaid family workers 524 372 161 203 363 169
Vulnerable employment 693 882 263 458 429 424
Source: Thailand National Statistics Office (2009).
In addition, another indicator that was reviewed was the “Growth rate of labour productivity”. Labour productivity represents the amount of output achieved per unit of labour input (or labour productivity = GDP [measured at constant market prices in national currency] ÷ total employment). The growth rate is simply the annual change in GDP per person employed, and the sources of data are the LFS or other household survey or population census with data on employment, in combination with GDP data from national accounts. The labour productivity trends in ASEAN, China and India were presented, and it showed that China is rapidly increasing and passed the labour productivity of ASEAN in 2006, while the level in India is currently two-thirds of the level in ASEAN.
30
Concerning the indicator “working poverty rate”, working poor are defined as employed persons living in a household whose members are living below the poverty line. Furthermore, the working poverty rate is the working poor as a share of the total employment (or working poverty rate = working poor ÷ total employment). The data are based on household surveys with both employment and income and expenditure data; if data on employment and poverty come from different sources, an approximation may be used to arrive at the working poverty rate.
In addition, more detailed analysis of the various employment indicators is provided in the ILO’s Global Employment Trends reports. It is important to monitor national labour markets. As a resource in this regard, the Key Indicators of the Labour Market (KILM) has been published every two years since 1999 and contains a broader set of employment indicators, with an analysis of recent trends for each indicator. The KILM, 6th edition (2010) Chapter 1c contains country examples of analysis of the MDG employment indicators and their linkages with other indicators for Pakistan, Botswana and Ukraine.18 The ILO DWIs and MDG indicators should be used together for a more comprehensive understanding of the labour market. Countries should deepen their analysis on working poverty and vulnerable employment, including further disaggregation for example by sector, hours of work, and age, among others.
9.2. Compiling country-level working poverty indicators: Group exercise
Mr Kapsos continued to make a detailed presentation on working poverty and its measurement to provide an introductory overview for the group work exercise.
The definition of working poor is described as the employed population living in households in which per capita income/expenditure is below the poverty line. Employment status is determined for each individual but the poverty status is determined at the household level. In the absence of a direct measurement, working poverty can be measured by a macro-based estimate:
- WPL = total poverty rate * employed
- WPu = total poverty rate * labour force
The key assumptions are:
- Poverty rate 0+ = poverty rate 15+
- LFPR poor = LFPR non-poor
- Unemployment rate of poor is negligible
Using the macro-based estimation allows for regional and global monitoring, but lacks the ability to analyze national trends and sub-national trends of different groups in the society and, in short, the policy relevance at the national level. For estimates at the national level, it is important to have household income/expenditure data as well as employment status to determine the number of working poor. The advantages are that these are direct measurements and not reliant on assumptions and allow for a much richer and more detailed analysis at national and sub-national levels. In terms of disadvantages, this type of
18 Available at: http://www.ilo.org/empelm/what/pubs/lang--en/WCMS_114060/index.htm.
31
direct measurement has not been conventionally done before, and household income/expenditure surveys are often not designed to capture employment variables.
The ILO is currently working with the World Bank to produce country level working poverty estimates at the US$ 1.25 and US$ 2 levels. The ILO is also providing support to countries in producing national estimates. Surveys in Sri Lanka and Mongolia are currently being conducted and the results will be published shortly.
9.3. Group work: Compiling country-level working poverty indicators
Each working group was given a copy of the household income/expenditure survey from either Cambodia or Sri Lanka. These surveys are used to measure national poverty levels and rates. The groups were then tasked to examine the questionnaires to determine if employment, and thus working poverty, can also be calculated, using the following guiding questions:
1. Is it possible to calculate the employed persons from the survey? If the answer is affirmative, provide coding instructions.
2. Are there any potential shortcomings of the definition of employment in the survey versus the standard international definition (see the handout on the ICLS definition of employment)?
3. Provide three suggested cross-tabulations for the working poor indicator that would be relevant for analyzing the incidence of working poverty across different subsets of the population.
9.4. Presentations
The groups presented their findings and found that in the case of Cambodia as well as Sri Lanka it is possible to calculate the employed persons. However, in terms of the definition of employment, it was reported that the Cambodian definition has some shortcomings, for example some groups are not included in the definition. For Sri Lanka, it was found that the definition did not capture many forms of employment, which particularly undercounted employment among women.
Finally suggestions on possible cross-tabulations for the working poor indicator based on the two sample household surveys were discussed such as gender, age and occupation, among others.

32
10. Session 8: Additional areas for measuring decent work: Regional labour migration: Case of the Philippines
Introduction and Moderator: Ms Thetis Mangahas, Senior Regional Migration Specialist, ILO Bangkok
Ms Mangahas introduced the session by highlighting the importance of migration management for most of the countries present at the workshop. Monitoring indicators on labour migration is a new and interesting issue that is important to discuss. The concept of decent work is relevant across borders not only within a national context. There is also a normative framework that is being used by the ILO, the Multilateral Framework on Labour Migration19 that was endorsed in 2004. It includes a set of principles and guidelines on the management of labour migration.
The inclusion of migrants in decent work priorities in critical but the challenge is to translate guidelines into feasible and measurable indicators in all nations. In 2009 there were an estimated 214 million migrant workers globally, 27 per cent being migrants from Asia and about 80 per cent are moving for purposes of work. Measurement is difficult so one should always be cautious with statistics on migration. Much of the movement is irregular and in addition there are many different forms of migration: temporary, government-to-government arrangements, seasonal migration and company transfers, among others, which make it hard to measure all the flows.
As a final point, the decency of the work of migrants is very hard to measure. Social security, workplace safety and other issues in regard to migrants need to be discussed. Undocumented migrants are another concern in terms of vulnerabilities, human trafficking, smuggling and labour exploitation. The issue of migration and decent work needs to be approached aggressively and goals need to be set up. In Asia, some statistics and information on migration are available, and one country that collects data on migration for policy planning is the Philippines.
10.1. Philippine migration management system: Indicators for measuring decent work
Ms Maybelle Gorospe, OIC-Director for Planning, Philippines Overseas Employment Administration
Ms Gorospe introduced the Philippines Overseas Employment Administration (POEA) as an attached agency of the Department of Labour and Employment tasked to manage the country’s labour migration programme. The objective of the management of migration in the Philippines is to maximize benefits and minimize costs. Some statistics on migration in the Philippines were presented; there are 8.7 million Overseas Filipino Workers (OFWs), whereby 3.6 million are permanent, 4.1 million are temporary and an estimated 900 thousand are classified as irregular status.
One of the key challenges is irregular migration which can lead to human trafficking. There is an anti-illegal recruitment campaign aimed to prevent excessive collection of recruitment fees, unethical recruitment practices and labour exploitation and trafficking.
19 Available at: http://www.ilo.org/public/libdoc/ilo/2006/106B09_343_engl.pdf.
33
One of the key issues is the difficulty in addressing contract substitution, which is committed in the destination country and is therefore hard to deal with. The migrants have to rely on labour attachés for assistance at the destination. POEA can however provide assistance upon return. Maltreatment is another challenge that POEA addresses through policies for OFW to acquire skills and information, language and cultural introductions before their departure.
There are several agencies involved in migration data management including the Commission of Filipinos Overseas, the Philippine Overseas Employment Administration, the Overseas Workers Welfare Administration (all OFWs through POEA are part of this programme), the National Statistics Office and the Central Bank of the Philippines (remittances). The sources of data include administrative records; stock estimates; the Census of Population and Housing; the Family Income and Expenditure Survey; and the LFS.
The statistical indicators for policy and planning are derived from deployed OFWs; the Contracts Processed database; accredited employers; job orders; agency data; administrative cases filed; and worker assistance services. There are however gaps in data collection in the Philippines which include arrival data of OFWs; OFWs returning for good; industrial classification of employers; specialization of professional and skilled workers; and the actual home addresses of the OFWs.
In conclusion, there are many challenges in strengthening data on migration. This includes the difficulty in data collection; limited resources; veracity of data collected; accuracy, completeness and timeliness of data generated; data sharing and harmonization of data; and finally the appreciation of managers/executives of improving migration data for better policy formulation.
10.2. Plenary discussion
10.2.1. Migration management
The other delegates requested further information about the management of remittances and the role of the Government in assistance services for returning migrants. In this regard, an Indonesian delegate wanted to know how the Philippine case can be used as a good practice for other countries.
Ms Gorospe explained that there are public centres for returning OFWs where they can learn how to manage their savings and finances, training of skills and how to invest their earnings. Moreover, in the Philippines, the assistance services come from the Government.
One of the challenges is to provide support to migrants who are maltreated at the destination; there are labour attachés on site that can provide assistance as well as other support mechanisms connected to the embassies abroad. Unpaid salaries are also encountered in the Philippines and in this regard there is a system of adjudication in addition to the support that can be provided by the labour attachés. Upon return, the migrants can file a claim for unpaid salaries to the deploying Philippine agency, who takes responsibility for unpaid salaries of the employers.
10.2.2. Recruitment
The participants were also interested in the recruitment of OFWs, the presence of illegal recruitment agencies, the ability for employers to make direct recruitment, and the differences between government-to-government recruitment and recruitment through recruitment agencies.
34
Ms Gorospe explained that the POEA has an in-house recruitment facility where they are engaged in recruitment of workers. Illegal recruiters exist but at the moment there is an anti-illegal recruitment campaign so that the OFWs will know the modus operandi and schemes of the illegal recruiters and report if they encounter one. There is also legal support provided to workers who want to press charges against illegal recruiters.
11. Session 9: Follow-up and next steps: Identifying priorities for ILO support
Facilitators: Mr Igor Chernyshev, ILO Geneva; and Mr Gyorgy Sziraczki, ILO Bangkok
The final session of the workshop consisted of a group work exercise where the participants were asked to discuss areas for follow-up action to strengthen the monitoring and assessment of decent work.
The participants discussed and answered the following questions:
1. What should be the priority areas or indicators that should be strengthened in terms of data collection on decent work at the national level (Please note specific country where relevant)?
2. In relation to enhanced data collection, what specific instruments (e.g. household surveys, establishment surveys, administrative records, etc.) should be improved (Please note specific country where relevant)?
3. What should be the priority areas to improve the data monitoring and analysis of decent work for policy making and planning at the national level (Please note specific country where relevant)?
4. From an Asian regional perspective, what areas of support are needed at the regional level to enhance the monitoring and assessment of decent work?
5. What are some concrete initiatives and ways in which the ILO can support national and regional efforts to strengthen the monitoring and assessment of decent work (Please note specific country where relevant)?
11.1. Presentations from the groups
11.1.1. Group 1 – Cambodia
Question 1:
The group identified two indicators (EMPL 4 – Informal Employment and STAB 1 – Precarious work (informal employment)) that need technical assistance on the collection, processing and analysis of data for the two indicators. In addition, there are 17 key indicators identified during the workshop where there are raw data that have not been published yet (Table 4).
Question 2:
The statistical instruments identified as needing improvement were the LFS and administrative records. There is also a need for assistance from the ILO/EC MAP project for conducting surveys and collecting administrative data to meet the requirements and concerns of data users and policymakers from different agencies.

35
Question 3:
Labour productivity, social security and minimum wages are the priority areas to improve the data monitoring and analysis of decent work for policy making and planning. This is also the focus of the DWCP in Cambodia.
Question 4:
The areas of support needed at the regional level to enhance the monitoring and assessment of decent work include more regional meetings and/or workshops for knowledge sharing and study tours to countries that have successfully collected and monitored certain indicators and areas of decent work (for example the Philippines on migrant workers and Malaysia on the PLWS).
Question 5:
The concrete initiatives that the ILO can support Cambodia are the preparation of very clear definitions for each indicator, including the methodology for calculation and interpretation. For example, the manual of indicator definitions that accompany the ILO KILM database is a great resource tool for both producers and users of labour market information. In addition, technical support on capacity building for staff involved in the collection of data on decent work is required, in addition to assistance on compilation and analysis of a monitoring report of decent work trends.
11.1.2. Group 2 – Philippines and Malaysia
Question 1:
The delegates from both Malaysia and the Philippines identified two areas that should be strengthened, wages and international migration. In terms of data on migration, sending and receiving countries need to cooperate to enhance the information base. Malaysia also identified informal sector employment as a priority area where the data gap was highlighted during the workshop.
Question 2:
In regard to the strengthening of statistical instruments, enhanced surveys were needed on international migration and wages and the administrative records of social security organizations should be improved.
Moreover, the Malaysian delegates highlighted the importance of capturing workers’ skills, experience and training. This could be done through the LFS to determine the policy priorities and needs for new investment in workers and human resources development. Collection and dissemination of this data should be done electronically to facilitate analysis.
Question 3:
The priority areas are to improve decent work for policy planning, and compliance to decent work and decent living should be better integrated (i.e. decent living, wages and work, among others). Also, employment services need to be strengthened. Through sharing and learning of country experiences and good practices, these various areas can be improved.
Question 4:
36
Data sharing on international migration within the region and standardization of statistical terms and concepts are the areas of support needed at the regional level. In addition, there are good initiatives in the region on wages, employment opportunities, informal sector, labour movement and skills (such as the IMT-GT: Indonesia Malaysia Thailand Growth Triangle20), and the experience of these initiatives should be better shared throughout the region in order to expand and replicate their success.
Question 5:
The concrete initiatives for follow-up support are regular seminars and workshops for sharing ideas and experiences; financial and technical support; and sharing regular progress updates and challenges with other countries.
11.1.3. Group 3 – Bangladesh and Sri Lanka
Question 1:
The areas that Bangladesh identified as priorities are data on key labour force indicators and decent work. There is a demand to have more regular (quarterly) data at the sub-national level and technical capacity building in the collection, tabulation and analysis of data on decent work.
For Sri Lanka, the indicators that need to be developed are:
• EMPL 4: indicators need to be tabulated and developed
• EARN 1, 2, 5, 6: indicators need to be tabulated and developed
• STAB 2: statistical instruments are needed
• EQUA 3, 4, 5: statistical instruments are needed
• SECU 1: statistical instruments are needed
• DIAL 1, 2, 3, 4, 5: statistical instruments are needed
Question 2:
The institutional framework for data collection system on decent work should be strengthened and the coordination between different data producers and users should be improved. The Sri Lankan delegates also noted that some data collection instruments need to be enhanced to better measure decent work.
20 The Indonesia-Malaysia-Thailand Growth Triangle (IMT-GT) is a sub-regional cooperation initiative formed in 1993 by the Governments of Indonesia, Malaysia, and Thailand to accelerate economic transformation in less developed provinces. More information is available at: http://www.imtgt.org/.

37
Question 3:
Strengthening coordination is essential between agencies on a national level in Bangladesh. For Sri Lanka, the specific priorities are social dialogue; equal opportunities; stability and security of work policy; as well as adequate earnings; questionnaire design and sampling.
Question 4:
Regional cooperation for sharing of ideas and best practices is necessary. The Sri Lankan delegates further identified the need to connect the targets and indicators of the DWCP with DWIs to better measure outcomes and to enhance census and statistical instruments to fit the local context and requirements of the DWCP. In 2006, Sri Lanka adopted a national policy on decent work and the road map was finalized in 2008. According to the framework, the country will develop a biennial DWCP. While the basic framework exists, the challenge is linking the DWCP with clear indicators to measure progress on decent work outcomes.
Question 5:
There is a need for technical and financial support from the ILO and donor agencies to enhance the LFS and other key statistical instruments and to update national DWIs on a regular basis for better monitoring of progress and trends.
11.1.4. Group 4 – Indonesia and Nepal
Question 1:
The priority areas identified are working poor (low pay rate & minimum wages); informal employment; workplace safety; migrant workers; labour productivity; and social protection.
Question 2:
In relation to enhanced data collection, the following improvements are recommended: regularize small-scale, household surveys on an annual basis; more analysis of already available data; conduct an integrated survey of decent work; increased integration between different sources of information and coordination between different data producers; and finally better use of existing administrative records.
Question 3:
One of the priority areas to improve data monitoring and analysis for policy making and planning at the national level is to develop coordination between agencies (national statistics office and line ministries) particularly on information systems. Then monitoring and assessment systems can be further developed to track trends in decent work.
Question 4:
Support is needed at the regional level for the development of international guidelines and manuals on DWIs and to conduct in-depth country studies on decent work. In addition, concerning migrant workers, assistance would be instrumental in organizing regional and sub-regional workshops to partner sending countries with receiving countries to facilitate the exchange of information and improve management of labour migration.

38
Question 5:
The ILO can support the countries through technical assistance regarding training on data collection and monitoring and sharing knowledge. In addition, it was proposed that the ILO could help facilitate institutional development in the country regarding decent work and to provide assistance to develop decent work information systems.
11.2. Final remarks
Honourable Secretary Md. Nurul Haque, Ministry of Labour and Employment of Bangladesh, was invited to share his views on the issues discussed during the workshop. He thanked the ILO for arranging the workshop given the importance and relevance of its theme. Moreover, he expressed his appreciation for the workshop and the MAP project and for being able to share experiences on decent work with the other countries.
Decent work is a contemporary and important, but at the same time, diverse concept. In fact to define the concept is a difficult task. To this end, defining indecent work was also important and could even help contribute to understanding decent work.
The labour force has been an important factor in the creation of a civilized society. From the beginning, slave labour has existed and has still not been eliminated. Instead it exists in different forms. To achieve the MDGs, it is critical to eliminate slave and forced labour and to work together to create decent work.
The interactions that took place at the workshop are very important. Participants from different countries focus on different issues regarding employment opportunities, social security, job safety and other issues. By sharing experiences, participants have been able to learn from each other.
Finally, indicators to measure decent work have limitations. There are different challenges and gaps in different countries and all countries have a specific situation that needs to be considered. But in general, common gaps can be identified and then the challenges can be overcome together. From the presentations, discussions and interactions, it is clear that coordination will help countries to further efforts to realize decent work.
Following the remarks by the Bangladesh Secretary of Labour and Employment, Mr Sziraczki concluded the session and the workshop by thanking the participants for their active engagement in the workshop. Following a summary of the country presentations during the workshop, it is clear that some common features exist among the countries, and wages and international migration are two of the issues that have been extensively discussed. Further, socio-economic trends are changing as the policy dialogue throughout the region has shifted from the global economic recession to the economic recovery. In this regard, last year the priority was to preserve jobs but now the emphasis is moving more towards skills development and productivity. This is evident from policy changes in several countries in the region.
Many groups have called for better linking of data and policymaking. Definitions and guidelines were mentioned to improve and strengthen data gathering and assessment. There is not just a need for technical support but also a need for sharing of experiences through meetings, workshops and study tours.
Finally, Mr Sziraczki thanked all the participants for attending the meeting. It was a useful forum to find out where the countries are in their development of DWIs and also to learn from each other. The ILO would like to continue to work with the countries on a national as well as a regional level to improve the collection, analysis and monitoring of data to measure progress towards decent work.
39
Mr Luebker joined the vote of thanks and expressed that the workshop had been very productive from the viewpoint of ILO headquarters, as well as for the MAP project. In conclusion, he highlighted three main messages that had emerged from the workshop. Firstly, participants had expressed the need for a clear practical definition of DWIs. This need had already been identified in other regions and was a priority for the MAP project; a draft definition and guidebook is being developed for publication.
Secondly, while decent work was a concept applied globally, the framework for monitoring and assessing progress on decent work needed to be adapted at the country level. For instance, specific indicators reflecting national priorities could be added. This was the approach that had been taken by the ILO and constituents in the pilot countries for the Decent Work Country Profiles that analyze trends in the various indicators. The framework for monitoring and assessing progress on decent work had proved to be useful, and the ILO was planning to do more work in this regard. Under the MAP project in Asia, activities are planned in Indonesia, Cambodia and Bangladesh, including development of Decent Work Country Profiles. The ILO’s constituents were the key resources in developing the reports. They should review the draft reports and make improvements to reflect the national reality and perspective of decent work.
Thirdly, linking DWIs to policy making is very important, as had been stressed by participants in Session 2. National governments could use the DWIs as a tool box independently of the ILO to identify key challenges and adapt policy planning accordingly. The ambition is for indicators to go beyond the ILO and the international framework and into development plans and strategies at the national level.
40
Annex 1. List of participants BANGLADESH Mr Md. Nurul Haque Secretary Ministry of Labour and Employment Mr Kabir Uddin Ahmed Deputy Director Bangladesh Bureau of Statistics Mr Santosh Kumar Dutta Joint Secretary Bangladesh Employers’ Federation (BEF) Mr Mohammad Humayun Kabir Secretary in charge of Office Education Jatio Sramik League (JSL) CAMBODIA Mr Sophon Hoeung Director of Labour Market Information Department Ministry of Labour and Vocational Training Mr Kanol Heang Deputy Director General National Institute of Statistics Ministry of Planning Mr Teh Sing Secretary General Cambodian Federation of Employers and Business Associations (CAMFEBA) Mr Sovann Vong President Cambodian Confederation of Trade Unions (CCTU) INDONESIA Mr Lucky Firnandy Majanto Deputy Director for Employment Creation Directorate of Manpower and Employment Creation National Development Planning Agency (BAPPENAS) Mr Dendi Romadhon Section Chief of Evaluation and Publication of the Labour Force Statistics Division BPS Statistics Indonesia Mr Muhammad Yusuf Bin Kohar Head of Provincial Management Board of APINDO Lampung The Employers’ Association of Indonesia (APINDO) Ms Elly Rosita Silaban President of Garteks Federation K-SBSI: Confederation of Indonesian Prosperity Trade Union

41
MALAYSIA Mr Sh. Yahya bin Sh. Mohamed Director General of Labour for Peninsular Malaysia Ministry of Human Resources Ms Rafliza Ramli Deputy Director, Manpower and Social Statistics Division Department of Statistics NEPAL Ms Radhika Aryal Section Officer Ministry of Labor and Transport Management Mr Uttam Narayan Malla Director General Central Bureau of Statistics PHILIPPINES Ms Maybelle Gorospe OIC – Director for Planning Philippine Overseas Employment Administration (POEA) Department of Labor and Employment Ms Rosita A. Lagunda Statistician II National Statistics Office SRI LANKA Ms Janaki Amaratunge Assistant Secretary (Foreign Relations) Ministry of Labour Relations and Productivity Promotion Mr Subawickrama Pannala Appuhamilage Statistician Department of Census and Statistics
Resource persons
Ms Margarita Guerrero Senior Statistician UN Economic and Social Commission for Asia and the Pacific (UNESCAP)
Observer
Ms Maimunah A. Rahman Assistant Director, Manpower and Social Statistics Division Department of Statistics Malaysia
ILO participation
Mr Igor Chernyshev Head, Yearly Indicators, Decent Work Data Production Unit, Department of Statistics International Labour Office GENEVA

42
Mr Malte Luebker Conditions of Work and Employment Programme International Labour Office GENEVA Mr Steven Kapsos Economist, Employment Trends Unit International Labour Office GENEVA Mr Gyorgy Sziraczki Senior Economist, Regional Economic and Social Analysis Unit ILO Regional Office for Asia and the Pacific BANGKOK Mr Phu Huynh ILO/EC MAP Project ILO Regional Office for Asia and the Pacific BANGKOK Mr Kee Beom Kim Labour Economist, Regional Economic and Social Analysis Unit ILO Regional Office for Asia and the Pacific BANGKOK Ms Thetis Mangahas Senior Regional Migration Specialist ILO Regional Office for Asia and the Pacific BANGKOK Mr John Ritchotte Specialist, Labour Administration and Labour Relations Decent Work Team, East and South-East Asia and the Pacific BANGKOK Ms Titika Luewiphan Programme Assistant Decent Work Team, East and South-East Asia and the Pacific BANGKOK
43
Annex 2. Workshop programme
June 28
08.30-09.00 Registration09.00-09.45 Welcome and opening remarks
Chairperson: Mr Gyorgy Sziraczki, Senior Economist, ILO Bangkok Mr Samuel Cantell, Head of Economic Co-operation, Delegation of the European Union to
Thailand Ms Sachiko Yamamoto, Director, ILO Regional Office for Asia and the Pacific
Introduction and expectations
09.45-10.45 Session 1: Background on the measurement of decent workIntroduction and moderator: Mr Malte Luebker, Conditions of Work and Employment Programme, ILO Geneva Panellists: The ILO Framework on the Measurement of Decent Work (Mr Igor Chernyshev, Head, Yearly
Indicators, Decent Work Data Production Unit, Department of Statistics, ILO Geneva) Overview of MAP Project Activities in Asia (Mr Phu Huynh, ILO/EC MAP, ILO Bangkok)
10.45-11.00 Coffee/tea break 11.00-12.15 Session 2: Group work: Benefits and challenges of measuring decent work in the Asia region
Introduction and facilitators: Mr Steven Kapsos, ILO Geneva; and Mr Malte Luebker, ILO Geneva Plenary discussion
12.15-13.30 Lunch 13.30-15.15 Session 3: Decent Work Indicators availability and gaps: Cases of Cambodia and Indonesia
Moderator: Mr Kee Kim, Labour Economist, ILO Bangkok Introduction: Data Sources on Decent Work (Mr Igor Chernyshev, ILO Geneva) Panellists: Decent Work Indicators: Availability and Gaps for Cambodia (Mr Heang Kanol, Deputy Director
General, Cambodia National Institute of Statistics; and Mr Hoeung Sophon, Director of Labour Market Information Department, Cambodia Ministry of Labour and Vocational Training)
Decent Work Indicators: Availability and Gaps: Case of Indonesia (Mr Dendi Romadhon, Section Chief, BPS-Statistics Indonesia)
15.15-15.30 Coffee/tea break 15.30-17.00 Session 4: Group work: Availability and gaps in measuring decent work
Introduction: Mr Malte Luebker, ILO Geneva Facilitators: Mr Gyorgy Sziraczki, ILO Bangkok; Mr Igor Chernyshev, ILO Geneva; and Mr Phu Huynh, ILO Bangkok
17.00-17.15 Closing and summary of the first day
Evening Welcome reception
June 29
09.00-09.15 Welcome and opening of the second day
09.15-10.30 Session 5: Regional initiatives on measuring informal employment: Cases of Bangladesh and Nepal Introduction and moderator: Mr Igor Chernyshev, ILO Geneva Panellists: Statistics on Informal Employment: Regional Initiatives (Ms Margarita Guerrero, Senior Statistician,
Statistics Division, UNESCAP) Measuring Informal Employment in Bangladesh (Mr Kabir Uddin Ahmed, Deputy Director,
Bangladesh Bureau of Statistics) Measuring Informal Employment through Labour Force Survey: Nepal’s Case (Mr Uttam Narayan Malla,
Director General, Nepal Central Bureau of Statistics) 10.30-10.45 Coffee/tea break 10.45-12.15 Session 6: Calculating and interpreting wage indicators: Case of Malaysia and Sri Lanka
44
Introduction and moderator: Mr John Ritchotte, Labour Administration and Labour Relations Specialist, ILO Bangkok Panellists: Calculating and Interpreting Wage Indicators (Mr Malte Luebker, ILO Geneva) Decent Work in Malaysia (Mr Sh. Yahya bin Sh. Mohamed, Director General of Labour for
Peninsular Malaysia, Ministry of Human Resources) Decent Work Indicators: Adequate Earning and Productive Work (Ms Janaki Amaratunge, Assistant
Secretary, Sri Lanka Ministry of Labour Relations and Productivity Promotion; and Mr Subawickrama Pannala Appuhamilage, Sri Lanka Department of Census and Statistics)
12.15-13.30 Lunch 13.30-15.15 Session 7: Employment and working poverty indicators for MDG monitoring
Introduction: Mr Kee Kim, ILO Bangkok Presenter and facilitator: Mr Steven Kapsos, Economist, Employment Trends, ILO Geneva Group work: Compiling country-level working poverty indicators
15.15-15.30 Coffee/tea break 15.30-16.45 Session 8: Additional areas for measuring decent work: Regional labour migration: Case of
the Philippines Introduction and moderator: Ms Thetis Mangahas, Senior Regional Migration Specialist, ILO Bangkok Philippines Migration Management System: Indicators for Measuring Decent Work (Ms Maybelle Gorospe, OIC-Director for Planning, Philippines Overseas Employment Administration)
16.45-17.00 Closing and summary of the second day
June 30 09.00-09.15 Welcome and opening of the third day
09.15-10.30 Session 9: Follow-up and next steps: Identifying priorities for ILO support: Group workFacilitators: Mr Igor Chernyshev, ILO Geneva; and Mr Gyorgy Sziraczki, ILO Bangkok
10.30-10.45 Coffee/tea break 10.45-12.00 Session 9: Follow-up and next steps: Plenary discussion
Workshop evaluations
12.00-12.15 Closing remarks
12.15-13.30 Lunch Afternoon Departure
The Regional Workshop on Monitoring and Assessing Progress on Decent Work in Asia was carried out with funding from the European Union under the ILO/EC Project “Monitoring and Assessing Progress on Decent Work” (MAP).

ILO Regional Offi ce for Asia and the Pacifi c (ILO-ROAP)
ILO/EC Project “Monitoring and Assessing Progress on Decent Work” (MAP)
Regional Workshop on Monitoring and AssessingProgress on Decent Work in Asia Workshop Report
Bangkok, 28–30 June 2010
This document has been produced with the fi nancial
assistance of the European Union. The views expressed
herein can in no way be taken to refl ect the offi cial
opinion of the European Union.
ISBN 978-92-2-123939-0
9 789221 239390
ILO/EC Project “Monitoring and Assessing Progress on Decent Work” (MAP)
Monitoring and assessing progress towards decent work is a long-
standing concern for the ILO and its constituents. Implemented by the
ILO with funding from the European Union, the project “Monitoring
and Assessing Progress on Decent Work” (MAP) helps to address this
need. Over a period of four years (2009 to 2013), the project works
with Ministries of Labour, National Statistical Offi ces, other government
agencies, workers’ and employers’ organizations and research institutions
to strengthen the capacity of developing and transition countries to
self-monitor and self-assess progress towards decent work. The project
facilitates the identifi cation of Decent Work Indicators in line with
national priorities; supports data collection; and assists in the analysis
of data on decent work in order to make them relevant for policy-makers.
The MAP publication series disseminates project outputs to a broad
audience in the ten countries covered by the project and beyond.
For more information on the ILO/EC Project “Monitoring and Assessing Progress on Decent Work” (MAP), see http://www.ilo.org/map