Chief Executive's Progress Report on Key Performance ...
20
For information AOM-P1590 via circulation Hospital Authority Report on Key Performance Indicators (KPI Report No. 47, up to June 2020) Advice Sought Members are invited to note and comment on the quarterly report on Key Performance Indicators (KPI) of the Hospital Authority (HA) covering KPIs of clinical services, human resources (HR) and financial performance for the period ended June 2020 1 . Detailed reports for clinical services, HR and finance performance were submitted to the Medical Services Development Committee (MSDC), Human Resources Committee (HRC) and Finance Committee (FC) respectively 2 via circulation in August 2020. Background 2. In this report, the reporting period is mainly from July 2019 to June 2020, unless otherwise specified. The key observations on KPI performance are highlighted in the ensuing paragraphs, while the detailed statistical reports are available electronically at the Members’ Corner for reference. 3. To combat the Coronavirus Disease 2019 (COVID-19), HA has significantly adjusted non-emergency and non-essential medical services since February 2020. With the gradual stabilisation of the epidemic situation in May and June 2020, after reviewing factors such as overall manpower, stock of personal protective equipment and infection control measures, etc., HA gradually resumed its services by phases starting from May 2020. During the reporting period from July 2019 to June 2020, there was a mix of service adjustments and service resumption. 4. Nevertheless, given the recent third wave of outbreak of the COVID-19 pandemic since early July 2020, some of the non-emergency and non-essential services had been adjusted again. The challenges might be wax and wane in the coming months, and the impact on different clinical services could hardly be projected at this time-point. HA will continue to closely monitor the development of the epidemic situation, support the Government’s overall infectious disease prevention strategy and suitably adjust the scale of service provision. Impact of the third wave of outbreak on clinical services to be reflected in KPI performance is expected in coming rounds of reporting. More updates would be reported in due course. 1 The last quarterly progress report on KPIs (up to March 2020) was submitted to the Board on 18 June 2020 via Administrative and Operational Meeting Paper No. 1575. 2 Via HRC Paper No. P635; MSDC Paper No. P609 and FC Paper No. 857.
-
Upload
khangminh22 -
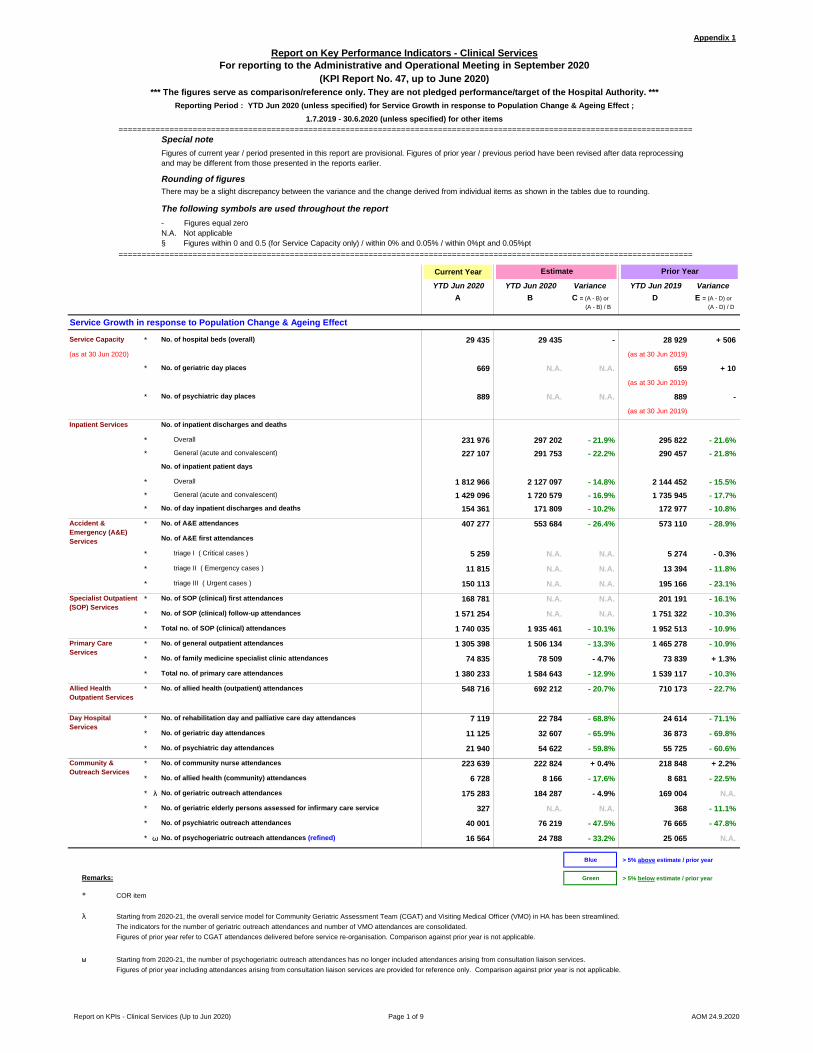
Category
Documents
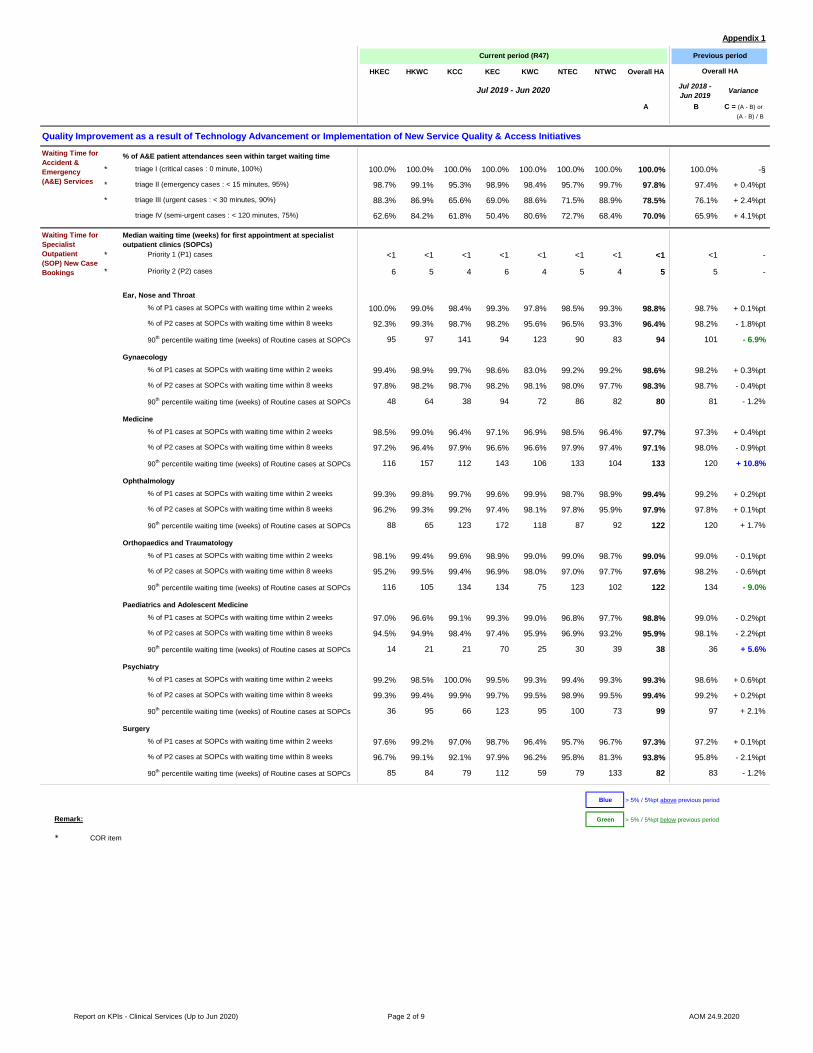
-
view
4 -
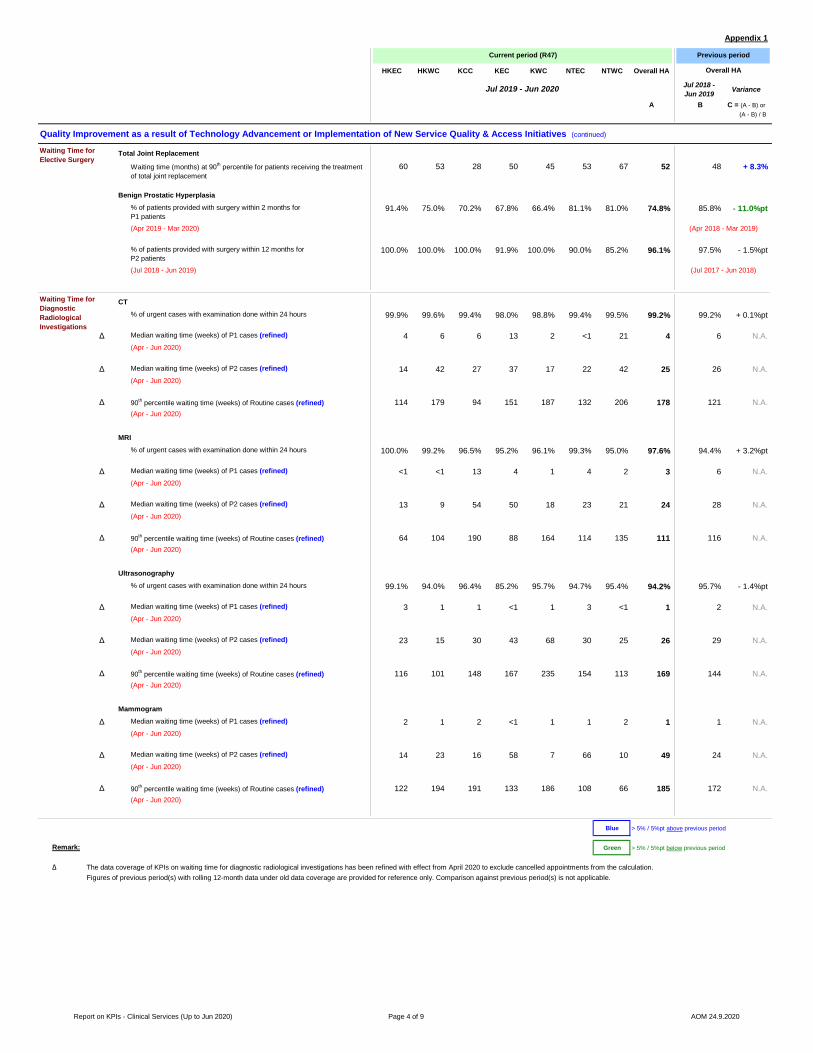
download
0
Transcript of Chief Executive's Progress Report on Key Performance ...
For information AOM-P1590 via circulation
Hospital Authority
Report on Key Performance Indicators (KPI Report No. 47, up to June 2020)
Advice Sought Members are invited to note and comment on the quarterly report on Key Performance Indicators (KPI) of the Hospital Authority (HA) covering KPIs of clinical services, human resources (HR) and financial performance for the period ended June 20201. Detailed reports for clinical services, HR and finance performance were submitted to the Medical Services Development Committee (MSDC), Human Resources Committee (HRC) and Finance Committee (FC) respectively2 via circulation in August 2020. Background 2. In this report, the reporting period is mainly from July 2019 to June 2020, unless otherwise specified. The key observations on KPI performance are highlighted in the ensuing paragraphs, while the detailed statistical reports are available electronically at the Members’ Corner for reference. 3. To combat the Coronavirus Disease 2019 (COVID-19), HA has significantly adjusted non-emergency and non-essential medical services since February 2020. With the gradual stabilisation of the epidemic situation in May and June 2020, after reviewing factors such as overall manpower, stock of personal protective equipment and infection control measures, etc., HA gradually resumed its services by phases starting from May 2020. During the reporting period from July 2019 to June 2020, there was a mix of service adjustments and service resumption. 4. Nevertheless, given the recent third wave of outbreak of the COVID-19 pandemic since early July 2020, some of the non-emergency and non-essential services had been adjusted again. The challenges might be wax and wane in the coming months, and the impact on different clinical services could hardly be projected at this time-point. HA will continue to closely monitor the development of the epidemic situation, support the Government’s overall infectious disease prevention strategy and suitably adjust the scale of service provision. Impact of the third wave of outbreak on clinical services to be reflected in KPI performance is expected in coming rounds of reporting. More updates would be reported in due course.
1 The last quarterly progress report on KPIs (up to March 2020) was submitted to the Board on 18 June 2020 via
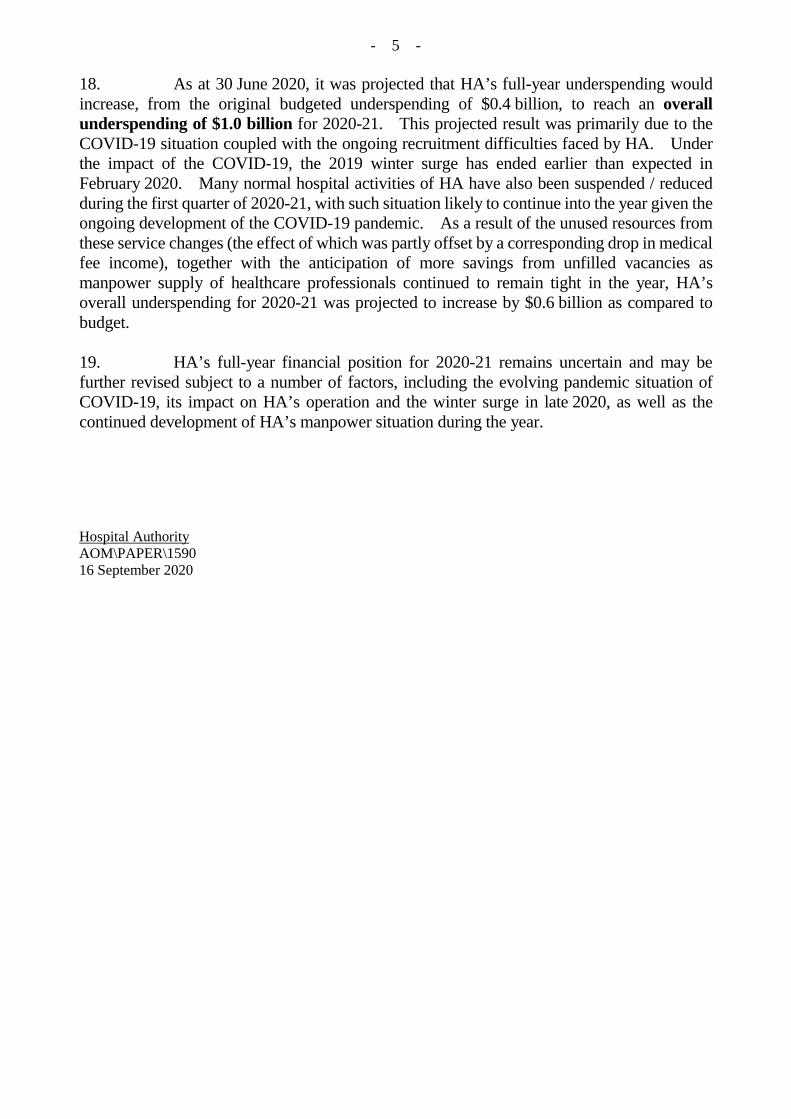
Administrative and Operational Meeting Paper No. 1575. 2 Via HRC Paper No. P635; MSDC Paper No. P609 and FC Paper No. 857.
- 2 -
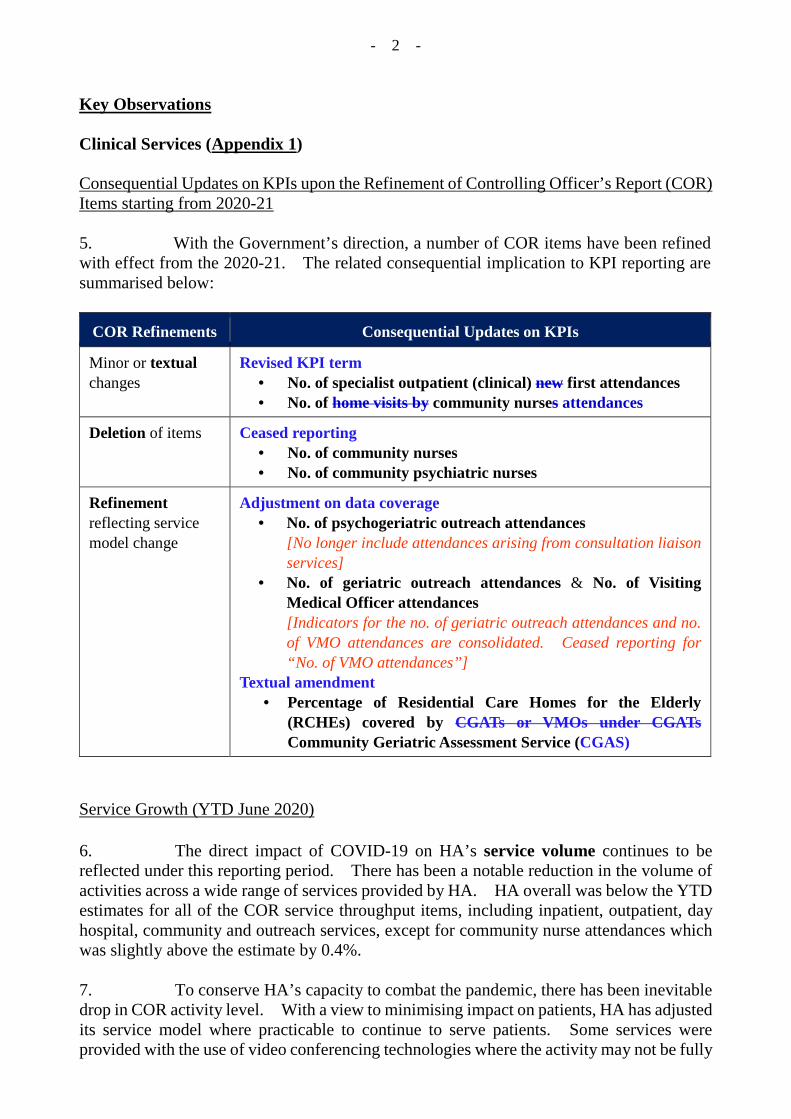
Key Observations Clinical Services (Appendix 1) Consequential Updates on KPIs upon the Refinement of Controlling Officer’s Report (COR) Items starting from 2020-21 5. With the Government’s direction, a number of COR items have been refined with effect from the 2020-21. The related consequential implication to KPI reporting are summarised below:
COR Refinements Consequential Updates on KPIs
Minor or textual changes
Revised KPI term • No. of specialist outpatient (clinical) new first attendances • No. of home visits by community nurses attendances
Deletion of items Ceased reporting • No. of community nurses • No. of community psychiatric nurses
Refinement reflecting service model change
Adjustment on data coverage • No. of psychogeriatric outreach attendances
[No longer include attendances arising from consultation liaison services]
• No. of geriatric outreach attendances & No. of Visiting Medical Officer attendances [Indicators for the no. of geriatric outreach attendances and no. of VMO attendances are consolidated. Ceased reporting for “No. of VMO attendances”]
Textual amendment • Percentage of Residential Care Homes for the Elderly
(RCHEs) covered by CGATs or VMOs under CGATs Community Geriatric Assessment Service (CGAS)
Service Growth (YTD June 2020) 6. The direct impact of COVID-19 on HA’s service volume continues to be reflected under this reporting period. There has been a notable reduction in the volume of activities across a wide range of services provided by HA. HA overall was below the YTD estimates for all of the COR service throughput items, including inpatient, outpatient, day hospital, community and outreach services, except for community nurse attendances which was slightly above the estimate by 0.4%. 7. To conserve HA’s capacity to combat the pandemic, there has been inevitable drop in COR activity level. With a view to minimising impact on patients, HA has adjusted its service model where practicable to continue to serve patients. Some services were provided with the use of video conferencing technologies where the activity may not be fully

- 3 -
captured under COR / KPI reporting. For example, psychiatric consultation services were provided through telemedicine consultations. Allied health staff have been following up on patients’ progress via phone or video calls, or providing videos of rehabilitation exercises to patients through HA’s rehabilitation mobile application under “HA Go”, so as to allow patients to continue with their scheduled home training programmes. Specialist outpatient clinic follow-up appointments for patients with stable conditions were rescheduled and drug refills were arranged according to their needs. On the other hand, to support the service adjustments, HA has expanded the service scope of some of the existing Public-Private Partnership Programmes and has been liaising with private healthcare providers to launch new public-private collaboration initiatives so as to divert suitable patients from public hospitals to receive treatment in the private sector. Quality Improvement (July 2019 – June 2020, unless specified)
Waiting time for Accident & Emergency (A&E) services 8. HA’s overall percentage of A&E patient attendances seen within target waiting time for Triage I (critical) and II (emergency) met the targets. For Triage III (urgent) and IV (semi-urgent), HA overall fell short of the targets by 11.5% points (78.5% vs. target 90%) and 5.0% points (70.0% vs. target 75%) respectively. Compared with prior year, there were 2.4% points and 4.1% points increase for Triage III and Triage IV respectively in meeting the target waiting time. Waiting time for specialist outpatient (SOP) new case bookings 9. All clusters met the target overall median waiting time for first appointment for Priority 1 (P1) and Priority 2 (P2) cases within two weeks and eight weeks respectively. 10. On the 90th percentile waiting time for Routine cases, amongst the eight specialties being monitored, Medicine (MED) had the greatest lengthening in waiting time by 13 weeks while Orthopaedics & Traumatology (ORT) had improved with a drop of 12 weeks when compared with prior year. HA overall’s waiting time for MED, Ophthalmology and ORT was above 100 weeks, at 133 weeks, 122 weeks and 122 weeks respectively. With regard to the development of the COVID-19 pandemic, both the number of new case bookings and number of SOP first attendances decreased when compared with prior year. Waiting time for diagnostic radiological investigations
11. The data coverage of KPIs on waiting time for diagnostic radiological investigation (P1, P2 and Routine cases) has been refined to exclude cancelled appointments with effect from this report (i.e. data covering report period from April 2020). As the time slots released from the cancelled appointments would be subsequently filled up by another case, the refined KPIs could better reflect the waiting time for the appointments booked. With the refined data coverage, comparison against previous period is not applicable until accumulation of 12-month data from April 2020.

- 4 -
Disease specific quality indicators
12. The diseases specific quality indicators are on stroke, hip fracture, cancer, diabetes mellitus, hypertension and cardiac services, etc. While HA has adjusted non-emergency and non-essential medical services during the COVID-19 pandemic, emergency and essential treatment to patients have been maintained for effective and timely intervention. In general, variance in KPI performance of disease specific quality indicators against prior year were within 5% range of normal fluctuation.
Way Forward 13. In view of the recent emergence of local cases of COVID-19, HA continues to closely monitor the development of the pandemic situation and support the Government’s overall infectious disease prevention strategy and suitably adjust the scale of service provision. The impact on clinical services, such as change in the volume of activities in the majority of services, would be reflected in coming rounds of KPI reporting. Human Resources (Appendix 2) 14. As at 30 June 2020, HA had a staffing position of 84 896, which represented a growth of 6.4% when compared with the same period in prior year. The workforce in all staff groups had increased and the greatest increase was “Others” staff group (+8.4%). As for the attrition (wastage) rate of full-time staff, the HA overall rate (July 2019 – June 2020) was 8.3%, in which the Supporting (Care-related) staff group had the highest rate (11.9%). 15. During the reporting period, the HA overall average sick leave days taken per staff was 7.2 days, which represented a 7.7% reduction when compared with same period of prior year. The average sick leave days taken per staff had decreased by 12.1% in Supporting (Care-related) staff group. The proportion of staff taken long sick leave (≥ 50 days) in HA had slightly decreased (2.3%). 16. During the reporting period, the HA overall number of injury on duty (IOD) cases per 100 full time equivalent (FTE) staff had slightly decreased from 4.6 cases to 4.3 cases when compared with the same period in prior year. Allied Health staff group had the lowest rate (1.7 cases), whereas Supporting (Care-related) staff group had the highest rate (6.8 cases). As for the number of IOD leave days per 100 FTE staff, HA overall was 65.2 days, representing a decrease of 12.0 days. All staff groups had a reduction of IOD leave days per 100 FTE staff when compared with the same period of prior year and “Supporting (Care-related)” staff group had the most significant improvement (-22.0 days). Finance 17. Every year, HA receives Government subvention in 12 monthly instalments while most of its spending is incurred towards latter part of the year given its business / operation cycle. Thus, a YTD underspending position is often reported by HA during earlier months of the financial year. For the quarter ended 30 June 2020, HA recorded an overall underspending of $1,694 million in its recurrent operating results.
- 5 -
18. As at 30 June 2020, it was projected that HA’s full-year underspending would increase, from the original budgeted underspending of $0.4 billion, to reach an overall underspending of $1.0 billion for 2020-21. This projected result was primarily due to the COVID-19 situation coupled with the ongoing recruitment difficulties faced by HA. Under the impact of the COVID-19, the 2019 winter surge has ended earlier than expected in February 2020. Many normal hospital activities of HA have also been suspended / reduced during the first quarter of 2020-21, with such situation likely to continue into the year given the ongoing development of the COVID-19 pandemic. As a result of the unused resources from these service changes (the effect of which was partly offset by a corresponding drop in medical fee income), together with the anticipation of more savings from unfilled vacancies as manpower supply of healthcare professionals continued to remain tight in the year, HA’s overall underspending for 2020-21 was projected to increase by $0.6 billion as compared to budget. 19. HA’s full-year financial position for 2020-21 remains uncertain and may be further revised subject to a number of factors, including the evolving pandemic situation of COVID-19, its impact on HA’s operation and the winter surge in late 2020, as well as the continued development of HA’s manpower situation during the year. Hospital Authority AOM\PAPER\1590 16 September 2020
Report on KPIs - Clinical Services (Up to Jun 2020) Page 1 of 9 AOM 24.9.2020
Appendix 1
Current Year YTD Jun 2020 YTD Jun 2020 Variance YTD Jun 2019 Variance
A B C = (A - B) or (A - B) / B
D E = (A - D) or (A - D) / D
Service Growth in response to Population Change & Ageing Effect
Service Capacity * No. of hospital beds (overall) 29 435 29 435 - 28 929 + 506(as at 30 Jun 2020) (as at 30 Jun 2019)
* No. of geriatric day places 669 N.A. N.A. 659 + 10(as at 30 Jun 2019)
* No. of psychiatric day places 889 N.A. N.A. 889 -(as at 30 Jun 2019)
No. of inpatient discharges and deaths
* Overall 231 976 297 202 - 21.9% 295 822 - 21.6%* General (acute and convalescent) 227 107 291 753 - 22.2% 290 457 - 21.8%
No. of inpatient patient days
* Overall 1 812 966 2 127 097 - 14.8% 2 144 452 - 15.5%* General (acute and convalescent) 1 429 096 1 720 579 - 16.9% 1 735 945 - 17.7%* No. of day inpatient discharges and deaths 154 361 171 809 - 10.2% 172 977 - 10.8%
* No. of A&E attendances 407 277 553 684 - 26.4% 573 110 - 28.9%
No. of A&E first attendances
* triage I ( Critical cases ) 5 259 N.A. N.A. 5 274 - 0.3%
* triage II ( Emergency cases ) 11 815 N.A. N.A. 13 394 - 11.8%
* triage III ( Urgent cases ) 150 113 N.A. N.A. 195 166 - 23.1%
* No. of SOP (clinical) first attendances 168 781 N.A. N.A. 201 191 - 16.1%
* No. of SOP (clinical) follow-up attendances 1 571 254 N.A. N.A. 1 751 322 - 10.3%
* Total no. of SOP (clinical) attendances 1 740 035 1 935 461 - 10.1% 1 952 513 - 10.9%
* No. of general outpatient attendances 1 305 398 1 506 134 - 13.3% 1 465 278 - 10.9%
* No. of family medicine specialist clinic attendances 74 835 78 509 - 4.7% 73 839 + 1.3%
* Total no. of primary care attendances 1 380 233 1 584 643 - 12.9% 1 539 117 - 10.3%
* No. of allied health (outpatient) attendances 548 716 692 212 - 20.7% 710 173 - 22.7%
* No. of rehabilitation day and palliative care day attendances 7 119 22 784 - 68.8% 24 614 - 71.1%
* No. of geriatric day attendances 11 125 32 607 - 65.9% 36 873 - 69.8%
* No. of psychiatric day attendances 21 940 54 622 - 59.8% 55 725 - 60.6%
* No. of community nurse attendances 223 639 222 824 + 0.4% 218 848 + 2.2%
* No. of allied health (community) attendances 6 728 8 166 - 17.6% 8 681 - 22.5%
* λ No. of geriatric outreach attendances 175 283 184 287 - 4.9% 169 004 N.A.
* No. of geriatric elderly persons assessed for infirmary care service 327 N.A. N.A. 368 - 11.1%
* No. of psychiatric outreach attendances 40 001 76 219 - 47.5% 76 665 - 47.8%
* ω No. of psychogeriatric outreach attendances (refined) 16 564 24 788 - 33.2% 25 065 N.A.
Blue > 5% above estimate / prior year
Green > 5% below estimate / prior year
ω Starting from 2020-21, the number of psychogeriatric outreach attendances has no longer included attendances arising from consultation liaison services. Figures of prior year including attendances arising from consultation liaison services are provided for reference only. Comparison against prior year is not applicable.
Remarks:
* COR item
λ Starting from 2020-21, the overall service model for Community Geriatric Assessment Team (CGAT) and Visiting Medical Officer (VMO) in HA has been streamlined. The indicators for the number of geriatric outreach attendances and number of VMO attendances are consolidated. Figures of prior year refer to CGAT attendances delivered before service re-organisation. Comparison against prior year is not applicable.
1.7.2019 - 30.6.2020 (unless specified) for other items============================================================================================================================
Figures of current year / period presented in this report are provisional. Figures of prior year / previous period have been revised after data reprocessingand may be different from those presented in the reports earlier.
Special note
- Figures equal zeroN.A. Not applicable§ Figures within 0 and 0.5 (for Service Capacity only) / within 0% and 0.05% / within 0%pt and 0.05%pt
============================================================================================================================
Estimate Prior Year
The following symbols are used throughout the report
There may be a slight discrepancy between the variance and the change derived from individual items as shown in the tables due to rounding.Rounding of figures
Report on Key Performance Indicators - Clinical ServicesFor reporting to the Administrative and Operational Meeting in September 2020
(KPI Report No. 47, up to June 2020)*** The figures serve as comparison/reference only. They are not pledged performance/target of the Hospital Authority. ***
Reporting Period : YTD Jun 2020 (unless specified) for Service Growth in response to Population Change & Ageing Effect ;
Day HospitalServices
Community &Outreach Services
Inpatient Services
Accident &Emergency (A&E)Services
Specialist Outpatient(SOP) Services
Primary CareServices
Allied HealthOutpatient Services
Report on KPIs - Clinical Services (Up to Jun 2020) Page 2 of 9 AOM 24.9.2020
Appendix 1
HKEC HKWC KCC KEC KWC NTEC NTWC Overall HA
Jul 2018 -Jun 2019 Variance
A B C = (A - B) orC = (A - B) / B
Quality Improvement as a result of Technology Advancement or Implementation of New Service Quality & Access Initiatives
% of A&E patient attendances seen within target waiting time
* triage I (critical cases : 0 minute, 100%) 100.0% 100.0% 100.0% 100.0% 100.0% 100.0% 100.0% 100.0% 100.0% -§
* triage II (emergency cases : < 15 minutes, 95%) 98.7% 99.1% 95.3% 98.9% 98.4% 95.7% 99.7% 97.8% 97.4% + 0.4%pt
* triage III (urgent cases : < 30 minutes, 90%) 88.3% 86.9% 65.6% 69.0% 88.6% 71.5% 88.9% 78.5% 76.1% + 2.4%pt
triage IV (semi-urgent cases : < 120 minutes, 75%) 62.6% 84.2% 61.8% 50.4% 80.6% 72.7% 68.4% 70.0% 65.9% + 4.1%pt
Median waiting time (weeks) for first appointment at specialistoutpatient clinics (SOPCs)
* Priority 1 (P1) cases <1 <1 <1 <1 <1 <1 <1 <1 <1 -
* Priority 2 (P2) cases 6 5 4 6 4 5 4 5 5 -
Ear, Nose and Throat% of P1 cases at SOPCs with waiting time within 2 weeks 100.0% 99.0% 98.4% 99.3% 97.8% 98.5% 99.3% 98.8% 98.7% + 0.1%pt
% of P2 cases at SOPCs with waiting time within 8 weeks 92.3% 99.3% 98.7% 98.2% 95.6% 96.5% 93.3% 96.4% 98.2% - 1.8%pt
90th percentile waiting time (weeks) of Routine cases at SOPCs 95 97 141 94 123 90 83 94 101 - 6.9%
Gynaecology% of P1 cases at SOPCs with waiting time within 2 weeks 99.4% 98.9% 99.7% 98.6% 83.0% 99.2% 99.2% 98.6% 98.2% + 0.3%pt
% of P2 cases at SOPCs with waiting time within 8 weeks 97.8% 98.2% 98.7% 98.2% 98.1% 98.0% 97.7% 98.3% 98.7% - 0.4%pt
90th percentile waiting time (weeks) of Routine cases at SOPCs 48 64 38 94 72 86 82 80 81 - 1.2%
Medicine% of P1 cases at SOPCs with waiting time within 2 weeks 98.5% 99.0% 96.4% 97.1% 96.9% 98.5% 96.4% 97.7% 97.3% + 0.4%pt
% of P2 cases at SOPCs with waiting time within 8 weeks 97.2% 96.4% 97.9% 96.6% 96.6% 97.9% 97.4% 97.1% 98.0% - 0.9%pt
90th percentile waiting time (weeks) of Routine cases at SOPCs 116 157 112 143 106 133 104 133 120 + 10.8%
Ophthalmology% of P1 cases at SOPCs with waiting time within 2 weeks 99.3% 99.8% 99.7% 99.6% 99.9% 98.7% 98.9% 99.4% 99.2% + 0.2%pt
% of P2 cases at SOPCs with waiting time within 8 weeks 96.2% 99.3% 99.2% 97.4% 98.1% 97.8% 95.9% 97.9% 97.8% + 0.1%pt
90th percentile waiting time (weeks) of Routine cases at SOPCs 88 65 123 172 118 87 92 122 120 + 1.7%
Orthopaedics and Traumatology% of P1 cases at SOPCs with waiting time within 2 weeks 98.1% 99.4% 99.6% 98.9% 99.0% 99.0% 98.7% 99.0% 99.0% - 0.1%pt
% of P2 cases at SOPCs with waiting time within 8 weeks 95.2% 99.5% 99.4% 96.9% 98.0% 97.0% 97.7% 97.6% 98.2% - 0.6%pt
90th percentile waiting time (weeks) of Routine cases at SOPCs 116 105 134 134 75 123 102 122 134 - 9.0%
Paediatrics and Adolescent Medicine% of P1 cases at SOPCs with waiting time within 2 weeks 97.0% 96.6% 99.1% 99.3% 99.0% 96.8% 97.7% 98.8% 99.0% - 0.2%pt
% of P2 cases at SOPCs with waiting time within 8 weeks 94.5% 94.9% 98.4% 97.4% 95.9% 96.9% 93.2% 95.9% 98.1% - 2.2%pt
90th percentile waiting time (weeks) of Routine cases at SOPCs 14 21 21 70 25 30 39 38 36 + 5.6%
Psychiatry% of P1 cases at SOPCs with waiting time within 2 weeks 99.2% 98.5% 100.0% 99.5% 99.3% 99.4% 99.3% 99.3% 98.6% + 0.6%pt
% of P2 cases at SOPCs with waiting time within 8 weeks 99.3% 99.4% 99.9% 99.7% 99.5% 98.9% 99.5% 99.4% 99.2% + 0.2%pt
90th percentile waiting time (weeks) of Routine cases at SOPCs 36 95 66 123 95 100 73 99 97 + 2.1%
Surgery% of P1 cases at SOPCs with waiting time within 2 weeks 97.6% 99.2% 97.0% 98.7% 96.4% 95.7% 96.7% 97.3% 97.2% + 0.1%pt
% of P2 cases at SOPCs with waiting time within 8 weeks 96.7% 99.1% 92.1% 97.9% 96.2% 95.8% 81.3% 93.8% 95.8% - 2.1%pt
90th percentile waiting time (weeks) of Routine cases at SOPCs 85 84 79 112 59 79 133 82 83 - 1.2%
Blue > 5% / 5%pt above previous period
Green > 5% / 5%pt below previous periodRemark:
* COR item
Waiting Time forSpecialistOutpatient(SOP) New CaseBookings
Current period (R47) Previous period
Overall HA
Jul 2019 - Jun 2020
Waiting Time forAccident &Emergency(A&E) Services

Report on KPIs - Clinical Services (Up to Jun 2020) Page 3 of 9 AOM 24.9.2020
Appendix 1
HKEC HKWC KCC KEC KWC NTEC NTWC Overall HA
Jul 2018 -Jun 2019 Variance
A B C = (A - B) orC = (A - B) / B
Quality Improvement as a result of Technology Advancement or Implementation of New Service Quality & Access Initiatives (continued)
Occupational Therapy% of P1 cases at AHOP clinics with waiting time within 2 weeks 98.0% 98.1% 96.2% 97.6% 99.2% 97.7% 99.5% 97.9% 98.0% - 0.1%pt
% of P2 cases at AHOP clinics with waiting time within 8 weeks 97.3% 95.0% 93.4% 97.1% 90.1% 95.8% 98.4% 94.9% 95.8% - 0.9%pt
90th percentile waiting time (weeks) of Routine cases at AHOPclinics
18 41 21 38 25 23 14 25 26 - 3.8%
Physiotherapy% of P1 cases at AHOP clinics with waiting time within 2 weeks 99.0% 98.6% 97.6% 98.1% 98.0% 97.7% 98.2% 98.0% 98.1% - 0.1%pt
% of P2 cases at AHOP clinics with waiting time within 8 weeks 97.5% 96.7% 95.0% 97.2% 95.8% 95.8% 96.6% 96.2% 96.5% - 0.3%pt
90th percentile waiting time (weeks) of Routine cases at AHOPclinics
40 23 30 35 41 39 32 38 39 - 2.6%
Blue > 5% / 5%pt above previous period
Green > 5% / 5%pt below previous period
Waiting Time forAllied HealthOutpatient(AHOP) NewCase Bookings
Current period (R47) Previous period
Overall HA
Jul 2019 - Jun 2020
Report on KPIs - Clinical Services (Up to Jun 2020) Page 4 of 9 AOM 24.9.2020
Appendix 1
HKEC HKWC KCC KEC KWC NTEC NTWC Overall HA
Jul 2018 -Jun 2019 Variance
A B C = (A - B) orC = (A - B) / B
Quality Improvement as a result of Technology Advancement or Implementation of New Service Quality & Access Initiatives (continued)
Total Joint Replacement
Waiting time (months) at 90th percentile for patients receiving the treatmentof total joint replacement
60 53 28 50 45 53 67 52 48 + 8.3%
Benign Prostatic Hyperplasia% of patients provided with surgery within 2 months forP1 patients
91.4% 75.0% 70.2% 67.8% 66.4% 81.1% 81.0% 74.8% 85.8% - 11.0%pt
(Apr 2019 - Mar 2020)
% of patients provided with surgery within 12 months forP2 patients
100.0% 100.0% 100.0% 91.9% 100.0% 90.0% 85.2% 96.1% 97.5% - 1.5%pt
(Jul 2018 - Jun 2019)
CT% of urgent cases with examination done within 24 hours 99.9% 99.6% 99.4% 98.0% 98.8% 99.4% 99.5% 99.2% 99.2% + 0.1%pt
Δ Median waiting time (weeks) of P1 cases (refined) 4 6 6 13 2 <1 21 4 6 N.A.(Apr - Jun 2020)
Δ Median waiting time (weeks) of P2 cases (refined) 14 42 27 37 17 22 42 25 26 N.A.(Apr - Jun 2020)
Δ 90th percentile waiting time (weeks) of Routine cases (refined) 114 179 94 151 187 132 206 178 121 N.A.(Apr - Jun 2020)
MRI% of urgent cases with examination done within 24 hours 100.0% 99.2% 96.5% 95.2% 96.1% 99.3% 95.0% 97.6% 94.4% + 3.2%pt
Δ Median waiting time (weeks) of P1 cases (refined) <1 <1 13 4 1 4 2 3 6 N.A.(Apr - Jun 2020)
Δ Median waiting time (weeks) of P2 cases (refined) 13 9 54 50 18 23 21 24 28 N.A.(Apr - Jun 2020)
Δ 90th percentile waiting time (weeks) of Routine cases (refined) 64 104 190 88 164 114 135 111 116 N.A.(Apr - Jun 2020)
Ultrasonography% of urgent cases with examination done within 24 hours 99.1% 94.0% 96.4% 85.2% 95.7% 94.7% 95.4% 94.2% 95.7% - 1.4%pt
Δ Median waiting time (weeks) of P1 cases (refined) 3 1 1 <1 1 3 <1 1 2 N.A.(Apr - Jun 2020)
Δ Median waiting time (weeks) of P2 cases (refined) 23 15 30 43 68 30 25 26 29 N.A.(Apr - Jun 2020)
Δ 90th percentile waiting time (weeks) of Routine cases (refined) 116 101 148 167 235 154 113 169 144 N.A.(Apr - Jun 2020)
Mammogram
Δ Median waiting time (weeks) of P1 cases (refined) 2 1 2 <1 1 1 2 1 1 N.A.(Apr - Jun 2020)
Δ Median waiting time (weeks) of P2 cases (refined) 14 23 16 58 7 66 10 49 24 N.A.(Apr - Jun 2020)
Δ 90th percentile waiting time (weeks) of Routine cases (refined) 122 194 191 133 186 108 66 185 172 N.A.(Apr - Jun 2020)
Blue > 5% / 5%pt above previous period
Green > 5% / 5%pt below previous periodRemark:
Δ The data coverage of KPIs on waiting time for diagnostic radiological investigations has been refined with effect from April 2020 to exclude cancelled appointments from the calculation. Figures of previous period(s) with rolling 12-month data under old data coverage are provided for reference only. Comparison against previous period(s) is not applicable.
Waiting Time forElective Surgery
Waiting Time forDiagnosticRadiologicalInvestigations
(Apr 2018 - Mar 2019)
(Jul 2017 - Jun 2018)
Current period (R47) Previous period
Overall HA
Jul 2019 - Jun 2020
Report on KPIs - Clinical Services (Up to Jun 2020) Page 5 of 9 AOM 24.9.2020
Appendix 1
Exception Reporting
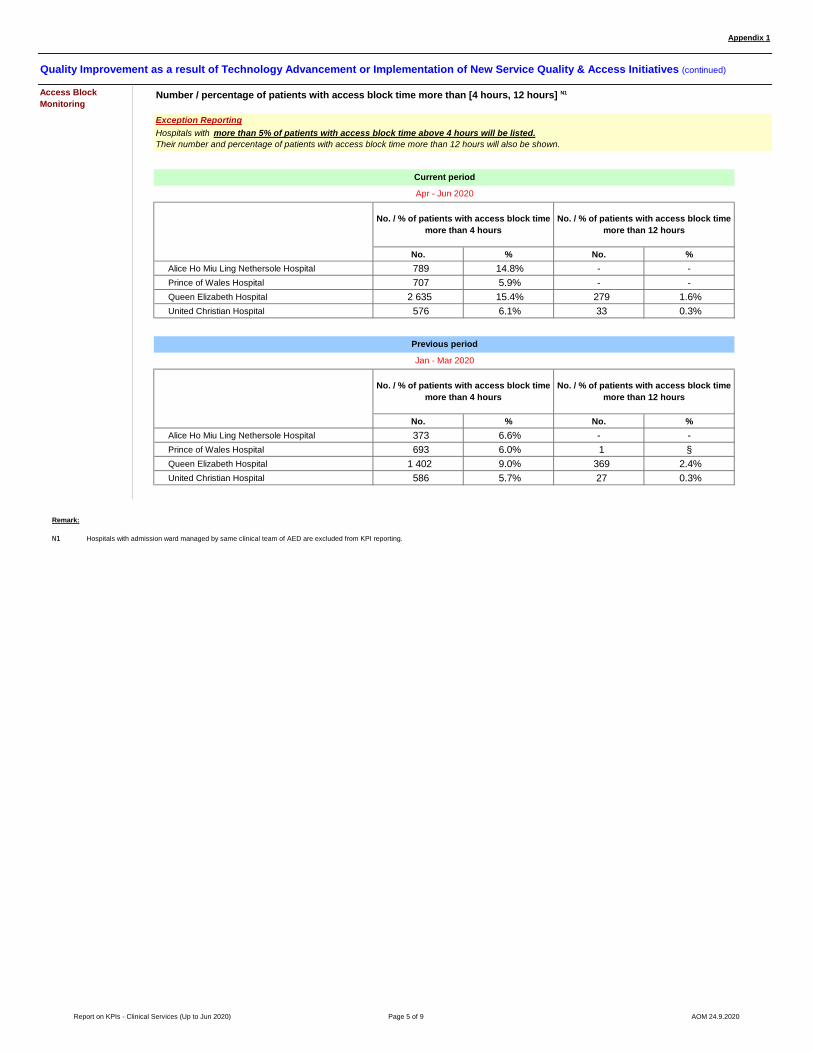
No. % No. %Alice Ho Miu Ling Nethersole Hospital 789 14.8% - -Prince of Wales Hospital 707 5.9% - -Queen Elizabeth Hospital 2 635 15.4% 279 1.6%United Christian Hospital 576 6.1% 33 0.3%
No. % No. %Alice Ho Miu Ling Nethersole Hospital 373 6.6% - -Prince of Wales Hospital 693 6.0% 1 §Queen Elizabeth Hospital 1 402 9.0% 369 2.4%United Christian Hospital 586 5.7% 27 0.3%
Remark:
N1 Hospitals with admission ward managed by same clinical team of AED are excluded from KPI reporting.
Previous period
Jan - Mar 2020
No. / % of patients with access block timemore than 4 hours
No. / % of patients with access block timemore than 12 hours
No. / % of patients with access block timemore than 4 hours
No. / % of patients with access block timemore than 12 hours
Quality Improvement as a result of Technology Advancement or Implementation of New Service Quality & Access Initiatives (continued)
Access BlockMonitoring
Number / percentage of patients with access block time more than [4 hours, 12 hours] N1
Hospitals with more than 5% of patients with access block time above 4 hours will be listed.Their number and percentage of patients with access block time more than 12 hours will also be shown.
Current period
Apr - Jun 2020

Report on KPIs - Clinical Services (Up to Jun 2020) Page 6 of 9 AOM 24.9.2020
Appendix 1
HKEC HKWC KCC KEC KWC NTEC NTWC Overall HA
Jul 2018 -Jun 2019 Variance
A B C = (A - B) orC = (A - B) / B
Quality Improvement as a result of Technology Advancement or Implementation of New Service Quality & Access Initiatives (continued)
GOPC quota availability (for elders) (%) 100.0% 99.6% 98.3% 98.6% 94.6% 94.0% 97.9% 97.1% 92.7% + 4.4%pt
Standardised admission rate for A&E patients (%) 43.2% 42.0% 36.2% 33.7% 37.4% 36.5% 30.7% 36.3% 34.6% + 1.7%pt
* Unplanned readmission rate within 28 days for generalinpatients (%)
10.3% 8.8% 10.1% 10.9% 12.6% 9.7% 11.5% 10.7% 10.6% + 0.1%pt
(Jun 2019 - May 2020)
Breastfeeding rate on discharge (%) 90.6% 90.5% 85.2% 79.1% 77.7% 87.4% 72.4% 83.1% 84.4% - 1.3%pt(Jun 2019 - May 2020)
MRSA bacteraemia in acute beds per 1 000 acute patient days 0.1483 0.1207 0.1537 0.1734 0.1968 0.1269 0.1843 0.1594 0.1484 + 7.4%
% of residential care home for the elderly covered byCommunity Geriatric Assessment Service (CGAS)
89.3% 96.9% 93.9% 87.5% 89.5% 96.7% 93.8% 92.6% 93.7% - 1.1%pt
(as at 31 Mar 2020)
Blue > 5% / 5%pt above previous period
Green > 5% / 5%pt below previous periodRemark:
* COR item
(Jun 2018 - May 2019)
(as at 31 Mar 2019)
Appropriatenessof Care
BreastfeedingRate
Access toOutreach Service
Access toGeneralOutpatient Clinic(GOPC) EpisodicIllness Service
Infection Rate
Current period (R47) Previous period
Overall HA
Jul 2019 - Jun 2020
(Jun 2018 - May 2019)

Report on KPIs - Clinical Services (Up to Jun 2020) Page 7 of 9 AOM 24.9.2020
Appendix 1
HKEC HKWC KCC KEC KWC NTEC NTWC Overall HA
Jul 2018 -Jun 2019 Variance
A B C = (A - B) orC = (A - B) / B
Quality Improvement as a result of Technology Advancement or Implementation of New Service Quality & Access Initiatives (continued)
Stroke% of acute ischaemic stroke patients received IV tPA treatment 7.4% 7.4% 5.6% 12.5% 13.8% 8.9% 10.8% 9.7% 9.5% + 0.2%pt
Hip Fracture% of patients indicated for surgery on hip fracture with surgeryperformed ≤ 2 days after admission through A&E
76.9% 85.8% 35.8% 56.9% 55.4% 57.6% 68.4% 59.0% 63.8% - 4.8%pt
Cancer
Waiting time (days) at 90th percentile from decision to treat to startof radiotherapy (RT) for cancer patients requiring radical RT
28 29 29 N.A. 28 38 29 30 29 + 3.4%
Waiting time (days) at 90th percentile for patients with colorectalcancer receiving first treatment after diagnosis
61 77 69 65 90 78 70 75 74 + 1.4%
(Jan - Dec 2019)Waiting time (days) at 90th percentile for patients with breast cancerreceiving first treatment after diagnosis
52 54 75 56 71 106 70 78 71 + 9.9%
(Jan - Dec 2019)Waiting time (days) at 90th percentile for patients with nasopharynxcancer receiving first treatment after diagnosis
48 43 63 N.A. 62 61 59 60 58 + 3.4%
Diabetes Mellitus% of diabetes mellitus patients with HbA1c < 7% 50.9% 59.4% 57.6% 54.0% 50.9% 52.5% 53.4% 53.7% 49.6% + 4.1%pt
Hypertension% of hypertension patients treated in GOPCs with blood pressure< 140/90 mmHg
77.4% 80.7% 85.6% 75.7% 75.3% 73.2% 76.7% 77.7% 79.0% - 1.3%pt
Mental Health ServicesAverage length of stay (LOS) (days) of acute inpatient care (withLOS ≤ 90 days)
29.2 31.4 30.3 37.1 29.4 30.3 31.1 30.2 30.5 - 0.7%
% of compulsory psychiatric admissions under the Mental HealthOrdinance via AED for patients receiving active Personalised CareProgramme care
1.4% 1.6% 1.0% 2.0% 1.8% 1.8% 2.0% 1.7% 2.0% - 0.3%pt
Cardiac Services% of acute myocardial infarction patients prescribed with Statin atdischarge
91.1% 88.6% 85.7% 91.5% 89.0% 85.2% 86.8% 87.9% 87.3% + 0.7%pt
% of ST-elevation myocardial infarction patients received primarypercutaneous coronary intervention
27.5% 63.7% 72.3% 34.6% 19.5% 22.5% 27.4% 37.6% 33.2% + 4.4%pt
% of medical equipment with age beyond the expected life 23.2% 30.1% 23.6% 22.2% 24.3% 28.3% 23.8% 25.0% 20.3% + 4.7%pt
(as at 31 Mar 2020)
Blue > 5% / 5%pt above previous period
Green > 5% / 5%pt below previous period
Technology
Disease SpecificQualityIndicators
(as at 31 Mar 2019)
(Jan - Dec 2018)
(Jan - Dec 2018)
Current period (R47) Previous period
Overall HA
Jul 2019 - Jun 2020
Report on KPIs - Clinical Services (Up to Jun 2020) Page 8 of 9 AOM 24.9.2020
Appendix 1
HKEC HKWC KCC KEC KWC NTEC NTWC Overall HA
Jul 2018 -Jun 2019 Variance
A B C = (A - B) orC = (A - B) / B
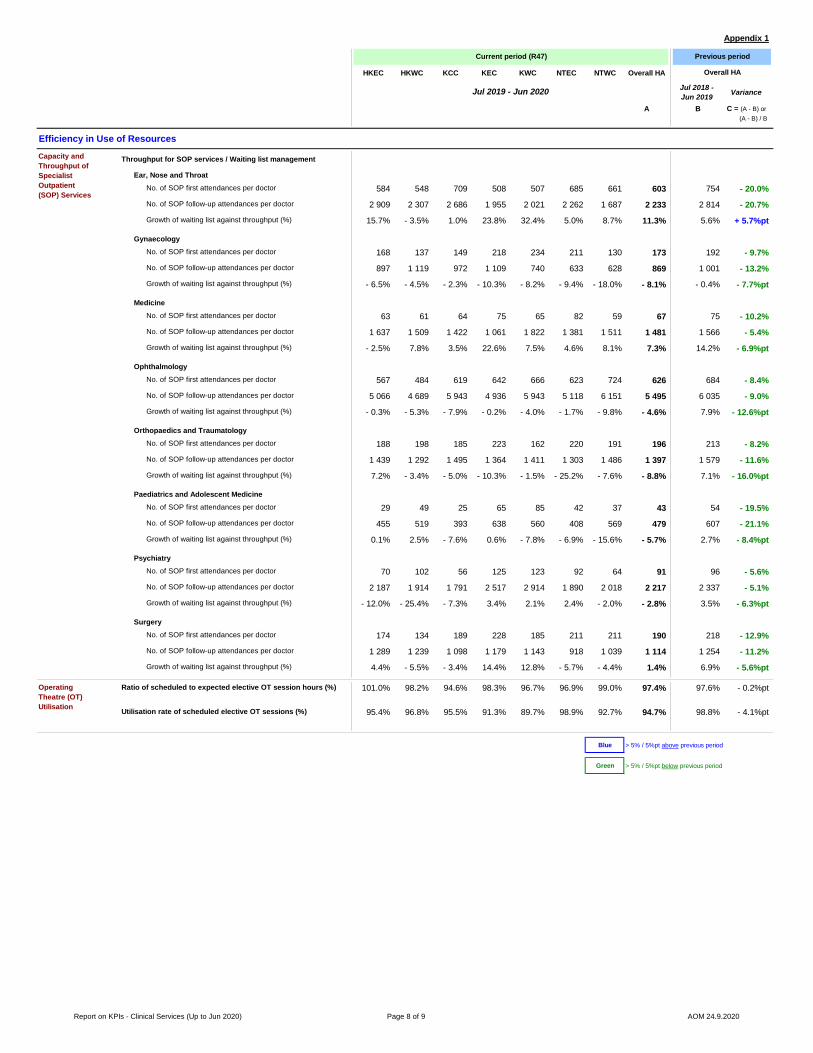
Efficiency in Use of Resources
Throughput for SOP services / Waiting list management
Ear, Nose and ThroatNo. of SOP first attendances per doctor 584 548 709 508 507 685 661 603 754 - 20.0%No. of SOP follow-up attendances per doctor 2 909 2 307 2 686 1 955 2 021 2 262 1 687 2 233 2 814 - 20.7%Growth of waiting list against throughput (%) 15.7% - 3.5% 1.0% 23.8% 32.4% 5.0% 8.7% 11.3% 5.6% + 5.7%pt
GynaecologyNo. of SOP first attendances per doctor 168 137 149 218 234 211 130 173 192 - 9.7%No. of SOP follow-up attendances per doctor 897 1 119 972 1 109 740 633 628 869 1 001 - 13.2%Growth of waiting list against throughput (%) - 6.5% - 4.5% - 2.3% - 10.3% - 8.2% - 9.4% - 18.0% - 8.1% - 0.4% - 7.7%pt
MedicineNo. of SOP first attendances per doctor 63 61 64 75 65 82 59 67 75 - 10.2%No. of SOP follow-up attendances per doctor 1 637 1 509 1 422 1 061 1 822 1 381 1 511 1 481 1 566 - 5.4%Growth of waiting list against throughput (%) - 2.5% 7.8% 3.5% 22.6% 7.5% 4.6% 8.1% 7.3% 14.2% - 6.9%pt
OphthalmologyNo. of SOP first attendances per doctor 567 484 619 642 666 623 724 626 684 - 8.4%No. of SOP follow-up attendances per doctor 5 066 4 689 5 943 4 936 5 943 5 118 6 151 5 495 6 035 - 9.0%Growth of waiting list against throughput (%) - 0.3% - 5.3% - 7.9% - 0.2% - 4.0% - 1.7% - 9.8% - 4.6% 7.9% - 12.6%pt
Orthopaedics and TraumatologyNo. of SOP first attendances per doctor 188 198 185 223 162 220 191 196 213 - 8.2%No. of SOP follow-up attendances per doctor 1 439 1 292 1 495 1 364 1 411 1 303 1 486 1 397 1 579 - 11.6%Growth of waiting list against throughput (%) 7.2% - 3.4% - 5.0% - 10.3% - 1.5% - 25.2% - 7.6% - 8.8% 7.1% - 16.0%pt
Paediatrics and Adolescent MedicineNo. of SOP first attendances per doctor 29 49 25 65 85 42 37 43 54 - 19.5%No. of SOP follow-up attendances per doctor 455 519 393 638 560 408 569 479 607 - 21.1%Growth of waiting list against throughput (%) 0.1% 2.5% - 7.6% 0.6% - 7.8% - 6.9% - 15.6% - 5.7% 2.7% - 8.4%pt
PsychiatryNo. of SOP first attendances per doctor 70 102 56 125 123 92 64 91 96 - 5.6%No. of SOP follow-up attendances per doctor 2 187 1 914 1 791 2 517 2 914 1 890 2 018 2 217 2 337 - 5.1%Growth of waiting list against throughput (%) - 12.0% - 25.4% - 7.3% 3.4% 2.1% 2.4% - 2.0% - 2.8% 3.5% - 6.3%pt
SurgeryNo. of SOP first attendances per doctor 174 134 189 228 185 211 211 190 218 - 12.9%No. of SOP follow-up attendances per doctor 1 289 1 239 1 098 1 179 1 143 918 1 039 1 114 1 254 - 11.2%Growth of waiting list against throughput (%) 4.4% - 5.5% - 3.4% 14.4% 12.8% - 5.7% - 4.4% 1.4% 6.9% - 5.6%pt
Ratio of scheduled to expected elective OT session hours (%) 101.0% 98.2% 94.6% 98.3% 96.7% 96.9% 99.0% 97.4% 97.6% - 0.2%pt
Utilisation rate of scheduled elective OT sessions (%) 95.4% 96.8% 95.5% 91.3% 89.7% 98.9% 92.7% 94.7% 98.8% - 4.1%pt
Blue > 5% / 5%pt above previous period
Green > 5% / 5%pt below previous period
OperatingTheatre (OT)Utilisation
Current period (R47) Previous period
Overall HA
Jul 2019 - Jun 2020
Capacity andThroughput ofSpecialistOutpatient(SOP) Services
Report on KPIs - Clinical Services (Up to Jun 2020) Page 9 of 9 AOM 24.9.2020
Appendix 1
HKEC HKWC KCC KEC KWC NTEC NTWC Overall HA
Jul 2018 -Jun 2019 Variance
A B C = (A - B) orC = (A - B) / B
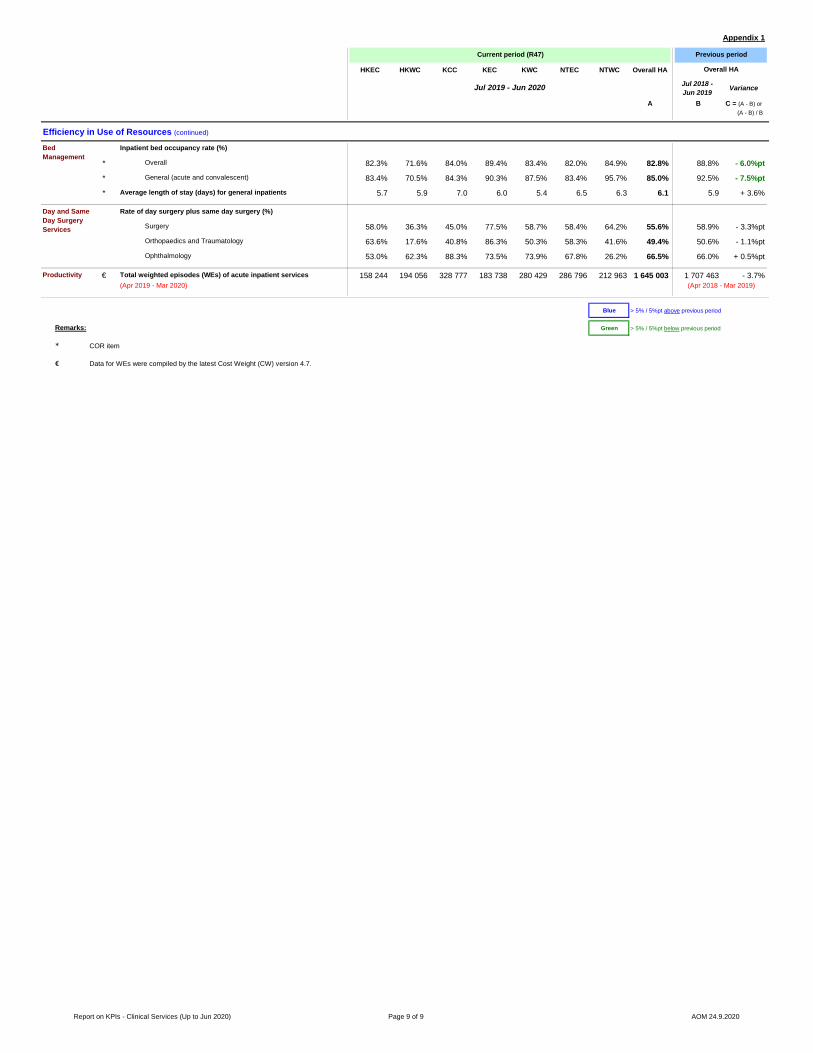
Efficiency in Use of Resources (continued)
Inpatient bed occupancy rate (%)
* Overall 82.3% 71.6% 84.0% 89.4% 83.4% 82.0% 84.9% 82.8% 88.8% - 6.0%pt
* General (acute and convalescent) 83.4% 70.5% 84.3% 90.3% 87.5% 83.4% 95.7% 85.0% 92.5% - 7.5%pt
* Average length of stay (days) for general inpatients 5.7 5.9 7.0 6.0 5.4 6.5 6.3 6.1 5.9 + 3.6%
Rate of day surgery plus same day surgery (%)
Surgery 58.0% 36.3% 45.0% 77.5% 58.7% 58.4% 64.2% 55.6% 58.9% - 3.3%pt
Orthopaedics and Traumatology 63.6% 17.6% 40.8% 86.3% 50.3% 58.3% 41.6% 49.4% 50.6% - 1.1%pt
Ophthalmology 53.0% 62.3% 88.3% 73.5% 73.9% 67.8% 26.2% 66.5% 66.0% + 0.5%pt
€ Total weighted episodes (WEs) of acute inpatient services 158 244 194 056 328 777 183 738 280 429 286 796 212 963 1 645 003 1 707 463 - 3.7%(Apr 2019 - Mar 2020)
Blue > 5% / 5%pt above previous period
Green > 5% / 5%pt below previous periodRemarks:
* COR item
€ Data for WEs were compiled by the latest Cost Weight (CW) version 4.7.
Previous period
Overall HA
Jul 2019 - Jun 2020
BedManagement
(Apr 2018 - Mar 2019)
Day and SameDay SurgeryServices
Productivity
Current period (R47)
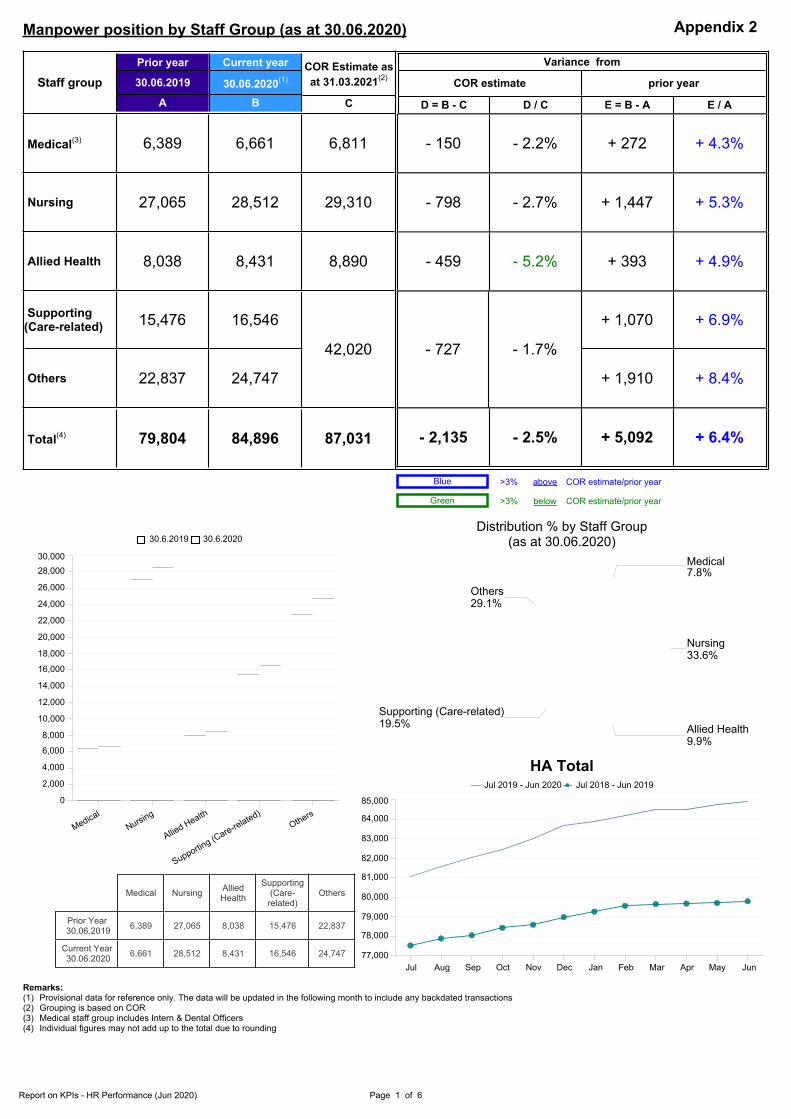
Manpower position by Staff Group (as at 30.06.2020)
Staff groupPrior year
30.06.2019
A
Current year
30.06.2020(1)
B
COR Estimate as at 31.03.2021(2)
C
Variance from
COR estimate prior year
D = B - C D / C E = B - A E / A
Medical(3) 6,389 6,661 6,811 - 150 - 2.2% + 272 + 4.3%
Nursing 27,065 28,512 29,310 - 798 - 2.7% + 1,447 + 5.3%
Allied Health 8,038 8,431 8,890 - 459 - 5.2% + 393 + 4.9%
Supporting (Care-related) 15,476 16,546
Others 22,837 24,747
42,020 - 727 - 1.7%
+ 1,070 + 6.9%
+ 1,910 + 8.4%
Total(4) 79,804 84,896 87,031 - 2,135 - 2.5% + 5,092 + 6.4%
Blue >3% above COR estimate/prior year
Green >3% below COR estimate/prior year
0
2,000
4,000
6,000
8,000
10,000
12,000
14,000
16,000
18,000
20,000
22,000
24,000
26,000
28,00030,000
MedicalNursing
Allied Health
Supporting (Care-related)
Others
30.6.2019 30.6.2020
Medical Nursing Allied Health
Supporting (Care-
related)Others
201906 Prior Year 30.06.2019 6,389 27,065 8,038 15,476 22,837
202006 Current Year 30.06.2020 6,661 28,512 8,431 16,546 24,747
Distribution % by Staff Group(as at 30.06.2020)
Others29.1%
Supporting (Care-related)19.5% Allied Health
9.9%
Nursing33.6%
Medical7.8%
HA Total
77,000
78,000
79,000
80,000
81,000
82,000
83,000
84,000
85,000
Jul Aug Sep Oct Nov Dec Jan Feb Mar Apr May Jun
Jul 2019 - Jun 2020 Jul 2018 - Jun 2019
Remarks:(1) Provisional data for reference only. The data will be updated in the following month to include any backdated transactions(2) Grouping is based on COR(3) Medical staff group includes Intern & Dental Officers(4) Individual figures may not add up to the total due to rounding
Report on KPIs - HR Performance (Jun 2020) Page 1 of 6
Appendix 2
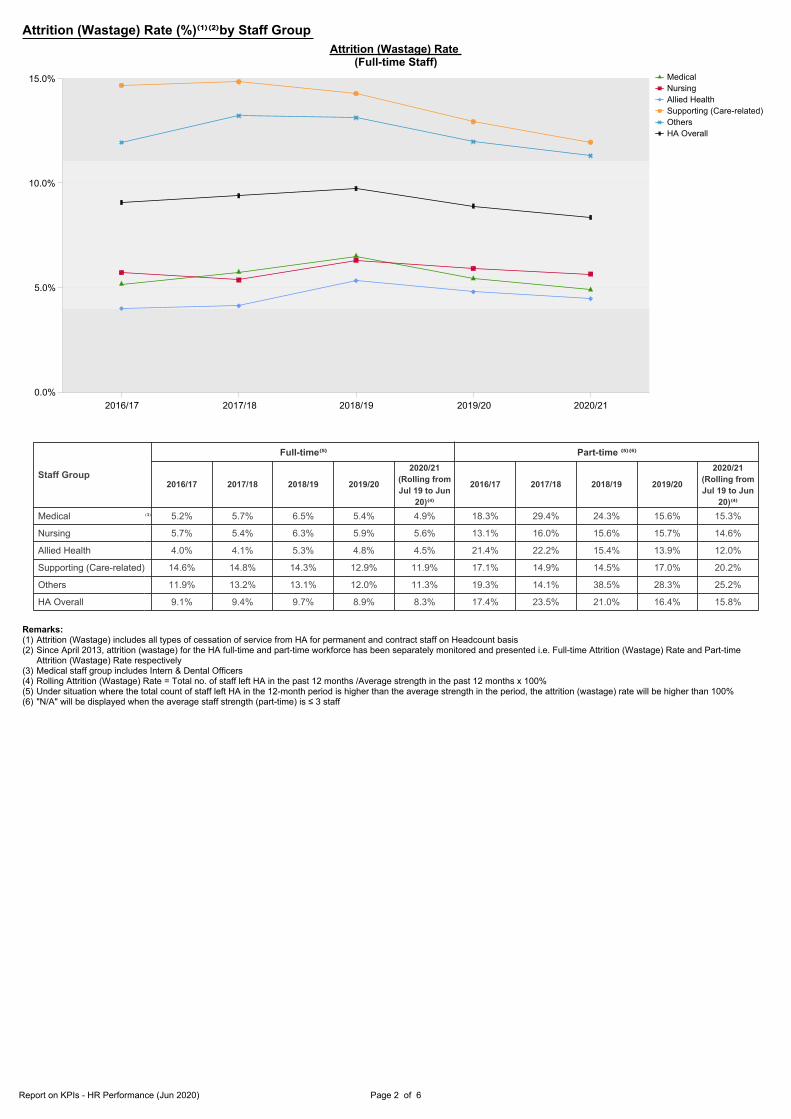
Attrition (Wastage) Rate (%)⁽¹⁾⁽²⁾by Staff GroupAttrition (Wastage) Rate
(Full-time Staff)
0.0%
5.0%
10.0%
15.0%
2016/17 2017/18 2018/19 2019/20 2020/21
MedicalNursingAllied HealthSupporting (Care-related)OthersHA Overall
Staff Group
Full-time⁽⁵⁾ Part-time ⁽⁵⁾⁽⁶⁾
2016/17 2017/18 2018/19 2019/20
2020/21(Rolling from Jul 19 to Jun
20)⁽⁴⁾
2016/17 2017/18 2018/19 2019/20
2020/21(Rolling from Jul 19 to Jun
20)⁽⁴⁾Medical ⁽³⁾ 5.2% 5.7% 6.5% 5.4% 4.9% 18.3% 29.4% 24.3% 15.6% 15.3%
Nursing 5.7% 5.4% 6.3% 5.9% 5.6% 13.1% 16.0% 15.6% 15.7% 14.6%
Allied Health 4.0% 4.1% 5.3% 4.8% 4.5% 21.4% 22.2% 15.4% 13.9% 12.0%
Supporting (Care-related) 14.6% 14.8% 14.3% 12.9% 11.9% 17.1% 14.9% 14.5% 17.0% 20.2%
Others 11.9% 13.2% 13.1% 12.0% 11.3% 19.3% 14.1% 38.5% 28.3% 25.2%
HA Overall 9.1% 9.4% 9.7% 8.9% 8.3% 17.4% 23.5% 21.0% 16.4% 15.8%
Remarks:(1) Attrition (Wastage) includes all types of cessation of service from HA for permanent and contract staff on Headcount basis(2) Since April 2013, attrition (wastage) for the HA full-time and part-time workforce has been separately monitored and presented i.e. Full-time Attrition (Wastage) Rate and Part-time
Attrition (Wastage) Rate respectively(3) Medical staff group includes Intern & Dental Officers(4) Rolling Attrition (Wastage) Rate = Total no. of staff left HA in the past 12 months /Average strength in the past 12 months x 100%(5) Under situation where the total count of staff left HA in the 12-month period is higher than the average strength in the period, the attrition (wastage) rate will be higher than 100%(6) "N/A" will be displayed when the average staff strength (part-time) is ≤ 3 staff
Report on KPIs - HR Performance (Jun 2020) Page 2 of 6
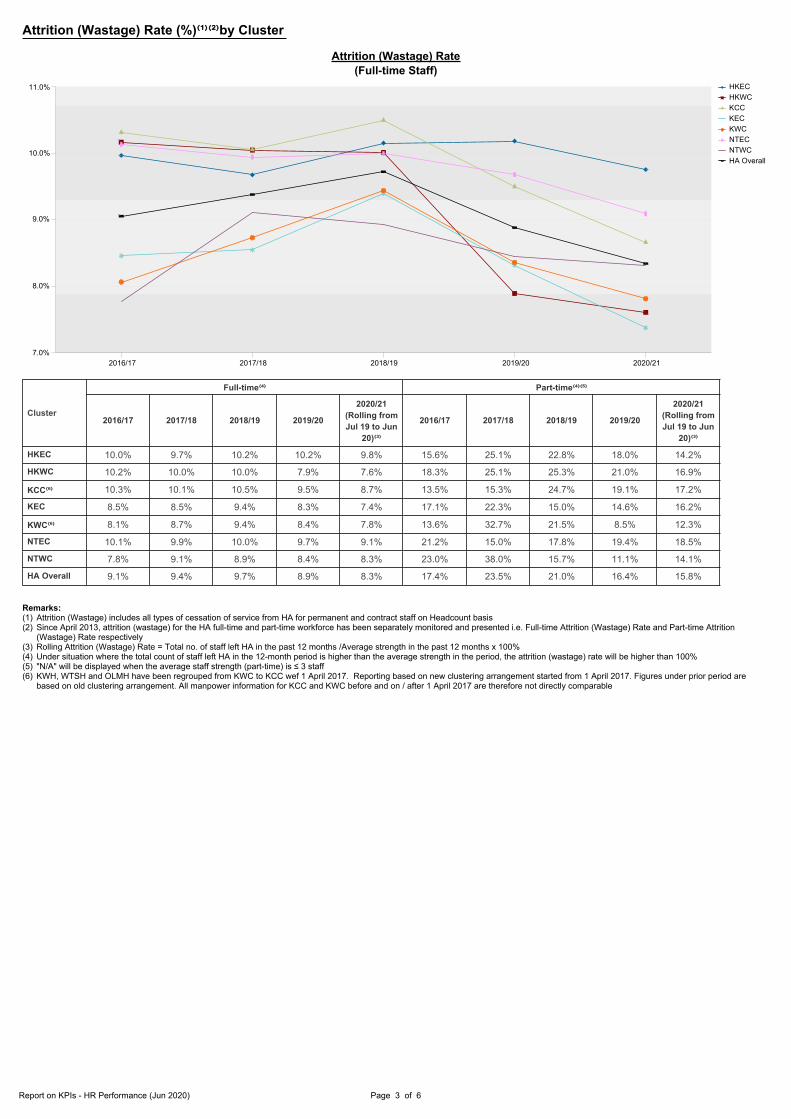
Attrition (Wastage) Rate (%)⁽¹⁾⁽²⁾by Cluster
Attrition (Wastage) Rate(Full-time Staff)
7.0%
8.0%
9.0%
10.0%
11.0%
2016/17 2017/18 2018/19 2019/20 2020/21
HKECHKWCKCCKECKWCNTECNTWCHA Overall
Cluster
Full-time⁽⁴⁾ Part-time⁽⁴⁾⁽⁵⁾
2016/17 2017/18 2018/19 2019/20
2020/21(Rolling from Jul 19 to Jun
20)⁽³⁾
2016/17 2017/18 2018/19 2019/20
2020/21(Rolling from Jul 19 to Jun
20)⁽³⁾
HKEC 10.0% 9.7% 10.2% 10.2% 9.8% 15.6% 25.1% 22.8% 18.0% 14.2%
HKWC 10.2% 10.0% 10.0% 7.9% 7.6% 18.3% 25.1% 25.3% 21.0% 16.9%
KCC⁽⁶⁾ 10.3% 10.1% 10.5% 9.5% 8.7% 13.5% 15.3% 24.7% 19.1% 17.2%
KEC 8.5% 8.5% 9.4% 8.3% 7.4% 17.1% 22.3% 15.0% 14.6% 16.2%
KWC⁽⁶⁾ 8.1% 8.7% 9.4% 8.4% 7.8% 13.6% 32.7% 21.5% 8.5% 12.3%
NTEC 10.1% 9.9% 10.0% 9.7% 9.1% 21.2% 15.0% 17.8% 19.4% 18.5%
NTWC 7.8% 9.1% 8.9% 8.4% 8.3% 23.0% 38.0% 15.7% 11.1% 14.1%
HA Overall 9.1% 9.4% 9.7% 8.9% 8.3% 17.4% 23.5% 21.0% 16.4% 15.8%
Remarks:(1) Attrition (Wastage) includes all types of cessation of service from HA for permanent and contract staff on Headcount basis(2) Since April 2013, attrition (wastage) for the HA full-time and part-time workforce has been separately monitored and presented i.e. Full-time Attrition (Wastage) Rate and Part-time Attrition
(Wastage) Rate respectively(3) Rolling Attrition (Wastage) Rate = Total no. of staff left HA in the past 12 months /Average strength in the past 12 months x 100%(4) Under situation where the total count of staff left HA in the 12-month period is higher than the average strength in the period, the attrition (wastage) rate will be higher than 100%(5) "N/A" will be displayed when the average staff strength (part-time) is ≤ 3 staff(6) KWH, WTSH and OLMH have been regrouped from KWC to KCC wef 1 April 2017. Reporting based on new clustering arrangement started from 1 April 2017. Figures under prior period are
based on old clustering arrangement. All manpower information for KCC and KWC before and on / after 1 April 2017 are therefore not directly comparable
Report on KPIs - HR Performance (Jun 2020) Page 3 of 6

Resignation Number and Rate
Staff Group
No. of resignations Resignation rate
2019 2020 Previous period
Current period
Previous period
Current period Variance
from
3Q 4Q 1Q 2Q (Jul18-Jun19)
(Jul19-Jun20)
(Jul18 - Jun19)
%
(Jul19 - Jun20)
%
previous period% pt
Doctor Senior Staff ⁽¹⁾ 39 36 32 19 161 126 5.9% 4.5% - 1.4
Junior Staff ⁽²⁾ 47 21 21 9 101 98 3.2% 3.1% - 0.1
Overall 86 57 53 28 262 224 4.5% 3.7% - 0.8
Nursing Senior Staff ⁽³⁾ 12 11 20 13 64 56 1.1% 0.9% - 0.2
Junior Staff ⁽⁴⁾ 240 237 291 213 1,043 981 5.3% 4.8% - 0.5
Overall 252 248 311 226 1,107 1,037 4.4% 3.9% - 0.5
Allied Health ⁽⁵⁾ Overall 63 52 52 33 191 200 2.4% 2.4% + 0.0
Supporting (Care-related) Overall 374 290 329 218 1,407 1,211 9.4% 7.7% - 1.7
Remarks:(1) Doctor Senior Staff include permanent and contract full time staff in the rank group of Consultant, Associate Consultant and Senior Medical Officer(2) Doctor Junior Staff include permanent and contract full time staff in the rank group of Medical Officer/Resident and Medical Officer (Specialist)/Resident (Specialist)(3) Nursing Senior Staff include permanent and contract full time staff in the rank group of Chief Nursing Officer, Nursing Consultant, Department Operations Manager, Senior Nursing Officer,
Ward Manager, Nursing Officer and Advanced Practice Nurses(4) Nursing Junior Staff include permanent and contract full time staff in the rank group of Registered Nurse, Enrolled Nurse, Midwife, Student Nurse(5) Allied Health includes radiographers, medical technologists/ medical laboratory technicians, occupational therapists, physiotherapists, pharmacists, medical social workers, etc
Report on KPIs - HR Performance (Jun 2020) Page 4 of 6

Report on KPIs - HR Performance (Jun 2020) Page 5 of 6
Sick Leave (1)(2)
(A) Average sick leave days taken per staff
Previous period Current periodJul 18 - Jun 19 Jul 19 - Jun 20
A B C = ( B - A ) / AMedical 3.4 3.0 - 11.8%Nursing 8.3 7.9 - 4.8%Allied Health 5.2 5.0 - 3.8%Supporting (Care-related) 9.9 8.7 - 12.1%Others 7.8 7.2 - 7.7%HA Overall 7.8 7.2 - 7.7%
(B) % of staff with sick leave taken ≥ 50 days
Previous period Current periodJul 18 - Jun 19 Jul 19 - Jun 20
A B C = B - A% % % pt
Medical 1.1 0.8 - 0.3Nursing 2.7 2.7 0Allied Health 1.4 1.3 - 0.1Supporting (Care-related) 3.1 2.8 - 0.3Others 2.3 2.3 0HA Overall 2.4 2.3 - 0.1
Blue > 5%pt above previous period
Green > 5%pt below previous periodRemarks:
(2) Exclude EC (employee compensation) sick leave.
Staff GroupVariance from previous
period
Staff Group
Variance from previousperiod
Exclude sick leave for temporary & part-time staff.(1) Include sick leave for full time HA staff on permanent & contract terms of employment, Civil Servants & subvented staff.

Report on KPIs - HR Performance (Jun 2020) Page 6 of 6
Injury on Duty
(A) No. of IOD cases per 100 FTE staff
Previous period Current periodJul 18 - Jun 19 Jul 19 - Jun 20
A B C = B - A Medical 4.5 4.8 + 0.3Nursing 4.8 4.4 - 0.4Allied Health 1.5 1.7 + 0.2Supporting (Care-related) 7.7 6.8 - 0.9Others 3.2 3.2 0HA Overall 4.6 4.3 - 0.3
(B) No. of IOD leave days per 100 FTE staff (1)
Previous period Current periodJul 18 - Jun 19 Jul 19 - Jun 20
A B C = B - A Medical 10.5 7.3 - 3.2Nursing 59.6 54.8 - 4.8Allied Health 24.8 12.3 - 12.5Supporting (Care-related) 154.4 132.4 - 22.0Others 82.7 66.2 - 16.5HA Overall 77.2 65.2 - 12.0
Remarks:
Staff GroupVariance from
previous period
Staff GroupVariance from
previous period
(1) As per audit recommendation, with effect from June 2011 report, all leave days taken in the reporting period will be counted,regardless of the year in which the IOD took place.