Progress towards unlocking the secrets of oestrogen receptor beta in breast cancer
Upload
khangminh22Category
view
0download
0
Progress towards WISArD
Beam line simulations and detector studies for theWeak Interaction Studies with 32Ar Decay
(WISArD) experiment
CERN Summer Student Report 2018
byLukas Nies
University of Giessen
under supervision ofDr. Dinko Atanasov
MSc. Victoria Araujo-EscalonaKU Leuven
Geneva, September 21, 2018
Updated version, Giessen, October 5, 2018

CONTENTS 0
Contents
1 Introduction 11.1 Fermi theory of beta decay . . . . . . . . . . . . . . . . . . . . . . . . 11.2 Angular momentum and parity selection rules . . . . . . . . . . . . . 31.3 Beta-delayed nucleon emission . . . . . . . . . . . . . . . . . . . . . . 51.4 Exotic currents . . . . . . . . . . . . . . . . . . . . . . . . . . . . . . 5
2 The WISArD experiment 72.1 Measurement principle . . . . . . . . . . . . . . . . . . . . . . . . . . 82.2 Experimental setup . . . . . . . . . . . . . . . . . . . . . . . . . . . . 10
3 Summer Student Project 103.1 SIMION beam line optics simulations . . . . . . . . . . . . . . . . . . . 103.2 Detector characterization studies . . . . . . . . . . . . . . . . . . . . 16
4 Summary and Outlook 19
A Supplemental information 22
1 INTRODUCTION 1
1 Introduction
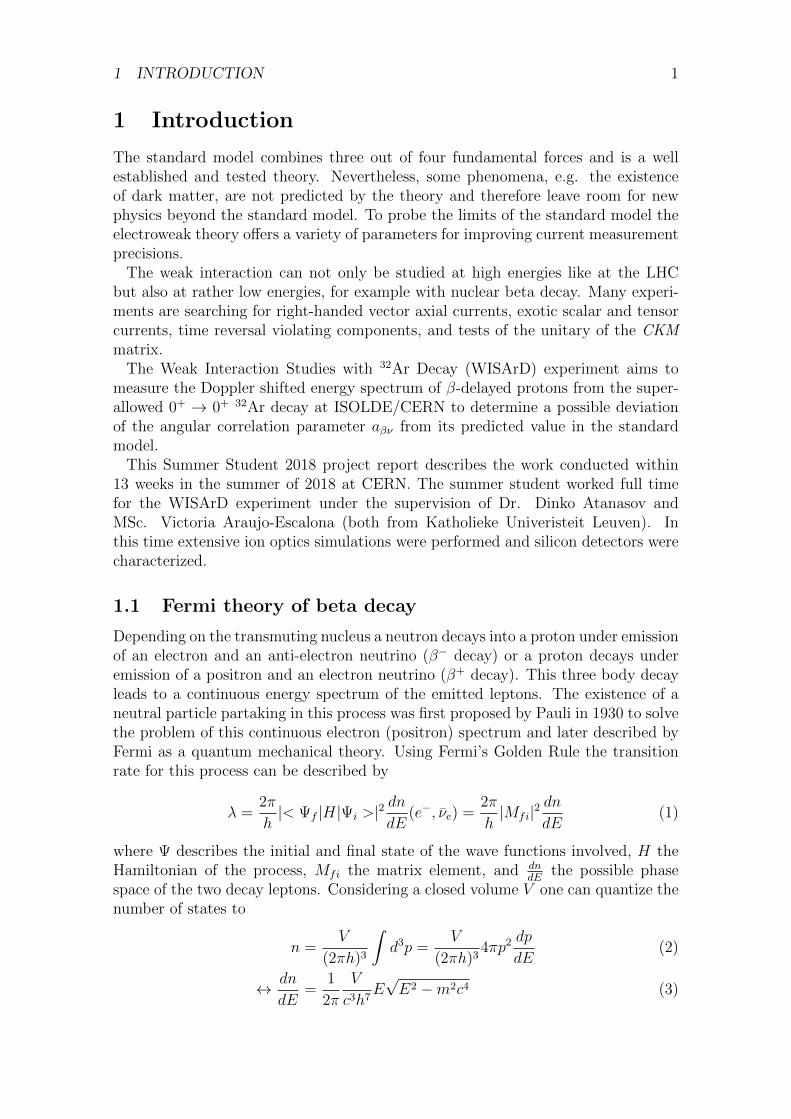
The standard model combines three out of four fundamental forces and is a wellestablished and tested theory. Nevertheless, some phenomena, e.g. the existenceof dark matter, are not predicted by the theory and therefore leave room for newphysics beyond the standard model. To probe the limits of the standard model theelectroweak theory offers a variety of parameters for improving current measurementprecisions.
The weak interaction can not only be studied at high energies like at the LHCbut also at rather low energies, for example with nuclear beta decay. Many experi-ments are searching for right-handed vector axial currents, exotic scalar and tensorcurrents, time reversal violating components, and tests of the unitary of the CKMmatrix.
The Weak Interaction Studies with 32Ar Decay (WISArD) experiment aims tomeasure the Doppler shifted energy spectrum of β-delayed protons from the super-allowed 0+ → 0+ 32Ar decay at ISOLDE/CERN to determine a possible deviationof the angular correlation parameter aβν from its predicted value in the standardmodel.
This Summer Student 2018 project report describes the work conducted within13 weeks in the summer of 2018 at CERN. The summer student worked full timefor the WISArD experiment under the supervision of Dr. Dinko Atanasov andMSc. Victoria Araujo-Escalona (both from Katholieke Univeristeit Leuven). Inthis time extensive ion optics simulations were performed and silicon detectors werecharacterized.
1.1 Fermi theory of beta decay
Depending on the transmuting nucleus a neutron decays into a proton under emissionof an electron and an anti-electron neutrino (β− decay) or a proton decays underemission of a positron and an electron neutrino (β+ decay). This three body decayleads to a continuous energy spectrum of the emitted leptons. The existence of aneutral particle partaking in this process was first proposed by Pauli in 1930 to solvethe problem of this continuous electron (positron) spectrum and later described byFermi as a quantum mechanical theory. Using Fermi’s Golden Rule the transitionrate for this process can be described by
λ =2π
h|< Ψf |H|Ψi >|2
dn
dE(e−, νe) =
2π
h|Mfi|2
dn
dE(1)
where Ψ describes the initial and final state of the wave functions involved, H theHamiltonian of the process, Mfi the matrix element, and dn
dEthe possible phase
space of the two decay leptons. Considering a closed volume V one can quantize thenumber of states to
n =V
(2πh)3
∫d3p =
V
(2πh)34πp2
dp
dE(2)
↔ dn
dE=
1
2π
V
c3h7E√E2 −m2c4 (3)
1 INTRODUCTION 2
where the relativistic energy-mass relation E2 = p2c2 + m2c4 was used. Taking theattractive (repulsive) Coulomb potential of the nucleus into account the electron(positron) wave function has to be modified by the Fermi-function
|Ψ∗e(0, Z)|2 ∝ 1
VF (Z, pe) ∝
1
V
2πη
1− exp−2πηη = ± Ze2
4πε0~ve(4)
where the positive (negative) sign is used for β− (β+) decay and ve is the finalvelocity of the electron (positron). This leads to F → 1 if the proton numberZ decreases and the electron (positron) momentum pe increases. Plugging in theresults leads to the partial decay probability (detailed steps can be founds in [1]):
Λ(pe)dpe =|M ′
fi|2π3~7c3
F (ZD, pe)p2e(E − Ee)2
√1− m2
νc4
(E − Ee)dpe. (5)
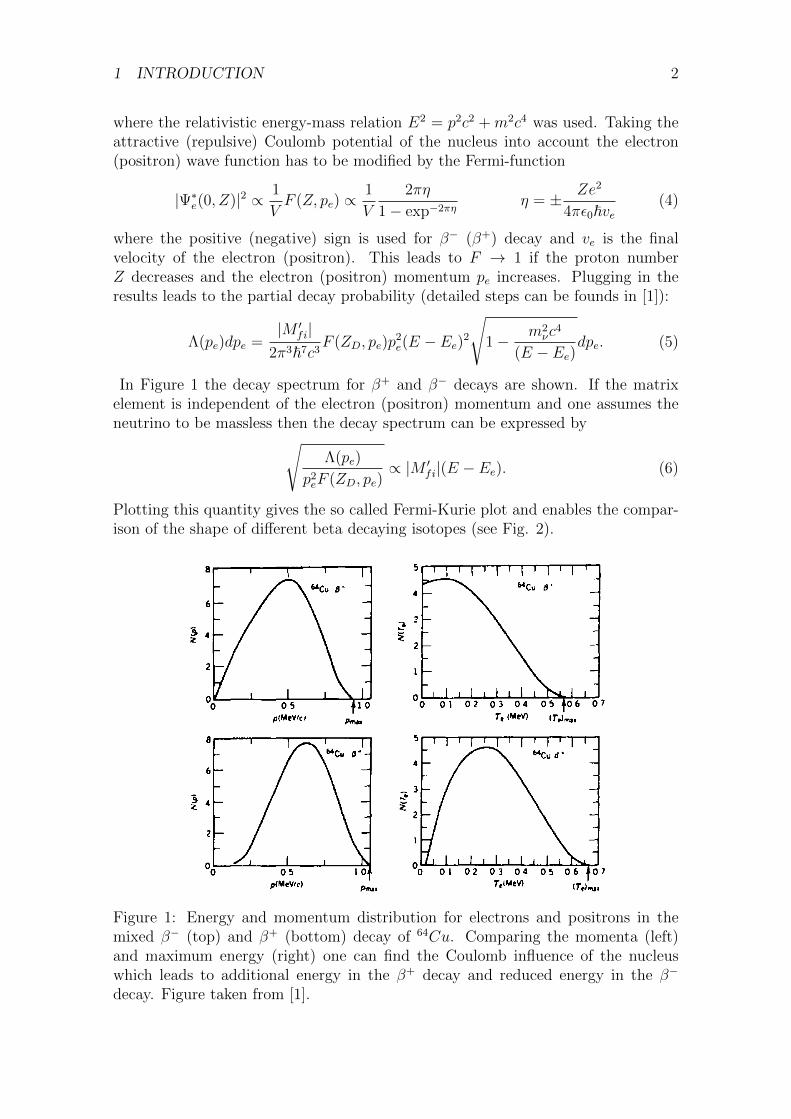
In Figure 1 the decay spectrum for β+ and β− decays are shown. If the matrixelement is independent of the electron (positron) momentum and one assumes theneutrino to be massless then the decay spectrum can be expressed by√
Λ(pe)
p2eF (ZD, pe)∝ |M ′
fi|(E − Ee). (6)
Plotting this quantity gives the so called Fermi-Kurie plot and enables the compar-ison of the shape of different beta decaying isotopes (see Fig. 2).
Figure 1: Energy and momentum distribution for electrons and positrons in themixed β− (top) and β+ (bottom) decay of 64Cu. Comparing the momenta (left)and maximum energy (right) one can find the Coulomb influence of the nucleuswhich leads to additional energy in the β+ decay and reduced energy in the β−
decay. Figure taken from [1].

1 INTRODUCTION 3
Figure 2: Fermi-Kurie plot for the 66Ga β+ decay [2]. The horizontal axis showsthe relativistic total energy in units of mec
2. The deviation from the straight lineresults from scattering of positrons in the radioactive source.
Integrating the partial decay probability gives the total half-life
λβ =
∫ pe(max)
0
|M ′fi|
2π3~7c3F (ZD, pe)p
2e(E − Ee)2dpe = |M ′
fi|m0c
4
2π3~7f(ZD, E0) (7)
where f(ZD, E0) is the Fermi-integral or statistical rate function which has to beevaluated numerically. By re-ordering this result one can obtain the so called com-parative half-life
ft1/2 = fλ−1β = 0.6932π3~7
g2|M ′fi|2m2
0c4≈ 6000
|M ′fi|2
(8)
where M ′fi is the reduced matrix element and g the coupling strength in this par-
ticular process. Since this quantity is only dependent on the matrix element it is agood measure to compare β-decays of different isotopes.
1.2 Angular momentum and parity selection rules
The matrix element can be expressed as
M ′fi = g
∫ϕ∗D(~r)pΨ
∗e(~r)Ψ
∗ν(~r)O(n→ p)ϕp(~r)nd~r (9)

1 INTRODUCTION 4
where the operator O denotes the transformation from a neutron to a proton, ϕD isthe wave function of the daughter nucleus, and ϕP is the wave function for the parentnucleus. Using plane waves for expressing the outgoing particles and expanding themas a power series one gets
M ′fi = g
[∫ϕ∗D(~r)pO(n→ p)ϕP (~r)nd~r
+i(~ke + ~kν)
∫ϕ∗D(~r)pO(n→ p)ϕP (~r)nd~r + . . .
]. (10)
The first term gives the overlap of initial and final state, the second term shows thatthe wave functions must have opposite parities. This leads to parity and angularmomentum selection rules where the latter has to be conserved in any case.
One can define
~JP = ~JD + ~Jβ ~Jβ = ~Lβ + ~Sβ πP = πD(−1)Lβ (11)
where ~JP is the total angular momentum of the parent nucleus, ~JD of the daughter,and ~Jβ of the beta particle carrying away angular momentum ~Lβ and intrinsic spin
Figure 3: Summary of decision rules and classification for beta decays [1]. In thetop right one can find corresponding ft-values.

1 INTRODUCTION 5
Sβ. Parity is given by the parity of the parent nucleus, πP , the daughter nucleus,πD and the angular momentum carried away by the beta particle. For allowed tran-sitions it is assumed that the decay happens at ~r = 0, hence no angular momentumcan be carried away and πP = πD. In the nth-forbidden decay, n angular momentumis carried away and parity changes accordingly:
~Lβ = n πD(−1)n. (12)
Despite the name, forbidden decays occur but with much lower probability. Further,two classes of decays can be defined considering the intrinsic spin carried by theelectron and neutrino. In Fermi-like decays, the intrinsic spin sums to zero:
Sβ = 0 ∆J = 0 (allowed) 0+ → 0+ (super-allowed). (13)
In Gamow-Teller type decays the intrinsic spin sums to one and one gets:
Sβ = 1 |∆J = 0, 1| (allowed) no 0+ → 0+, but 0+ → 1+ (unique Gamow-Teller).(14)
The selection rules for forbidden decays get a little more complicated and can befound in Fig. 3.
1.3 Beta-delayed nucleon emission
Nuclei far off the valley of stability unstable against beta decay have a high chancenot only to emit an electron or positron but also to de-excite by rapidly emittingone or more nucleons (p,n,4He) if the β-decay energy is larger than the separationenergy:
Precursorβ±−→ Emitter
n,p,4He−→ Daughter (15)
This process competes with γ-de-excitation. Due to the involved two body processthe emitted nucleons have distinct energies. The favored decay branch of the pre-cursor towards the emitter is to its isobaric analog state (IAS). Those states are twovery similar states between neighboring isobars who have a large branching ratioand a Fermi type matrix element. A transition to an IAS only changes the isospincomponent Tz. Therefore, if T = T0 is the isospin ground state of a nucleus (N+1,Z)then the IAS in nucleus (N ,Z + 1) will be the lowest state with T = T0. In Figure17 the decay of 32Ar is shown. The strongest branching ratio is the decay towardsits IAS of 32Cl with T = 2.
1.4 Exotic currents
To integrate beta-decay into the weak interaction of the standard model an adequateformulation has to be written down. A short overview is given here, for furtherreading see [3] and [4].
The general Hamiltonian for beta decay is given by the product of Fermi’s couplingconstant, GF , and the hadronic and leptonic currents, JH and JL:
H = GFJHJL = GF
(ΨpOΨn
) (ΨeOΨνe
)+ h.c., (16)
1 INTRODUCTION 6
where O is a quantum mechanical operator which can be expressed by combiningDirac γ-matrices. Overall 16 linear independent combinations can be grouped intofive classes: scalar (S), vector (V), tensor (T), axial vector (V), and pseudoscalar(P).
In nature all five interactions occur as a linear combination:
H =∑
i=S,V,T,A,P
gFCi(ψpOiψn
) (ψeOiψν
)+ h.c. (17)
where Ci modifies the coupling constant for each case. The possibility of havingodd and even terms under the parity operation and the discovery of parity violationleads to the generalized Hamiltonian:∑
i
(Heveni +Hodd
i
)+ h.c. = gF
∑i=S,V,T,A,P
(ψpOiψn
) (ψeOi (Ci + C ′iγ5) ψν
)+ h.c.
(18)
where γ5 is the fifth Dirac matrix and prime denotes the odd terms. According tothis Hamiltonian 10 coupling constants exist. At low energies, in non-relativistictreatment the pseudoscalar currents vanish. In Fermi type decays only scalar andvector type currents partake and in Gamow-Teller type decays only vector-axial andtensor currents. Parity is violated if both C ′i 6= 0 and Ci 6= 0, and maximally violatedif |C ′i| = |Ci|. The standard model predicts C ′V = CV = 1 and CA = C ′A, all othercoupling constants being zero. Hence, scalar, tensor, and pseudoscalar currents donot take part in the standard model.
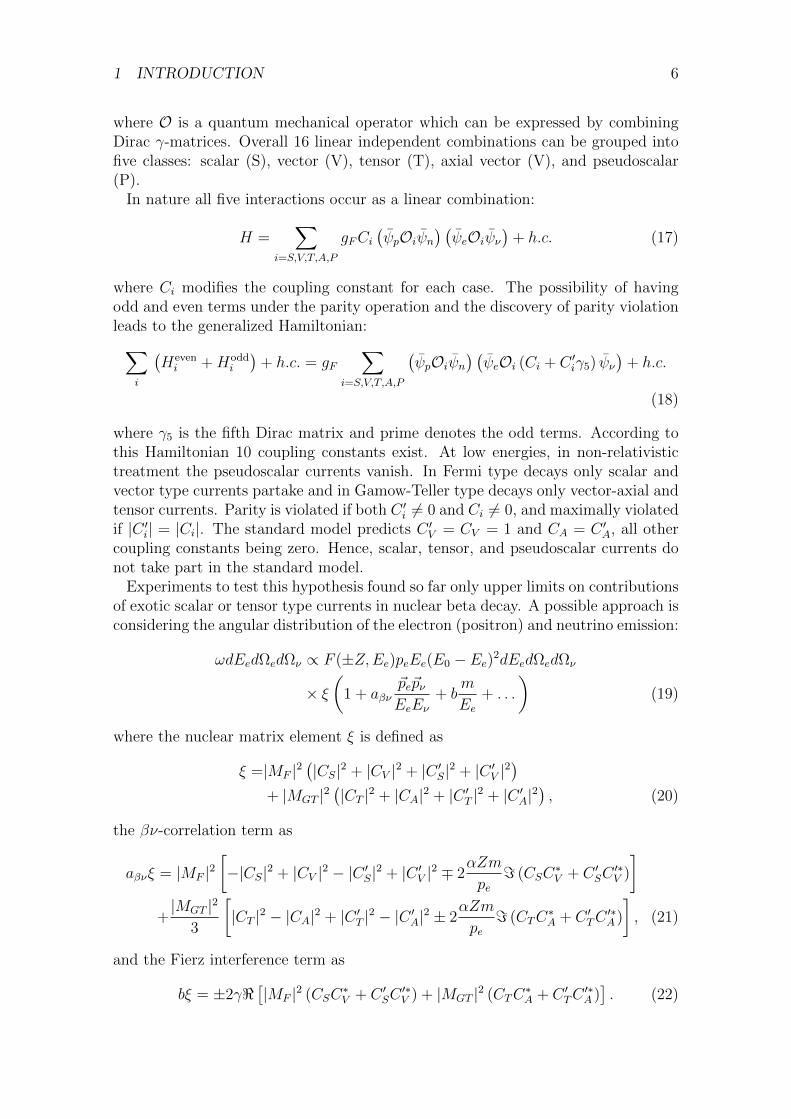
Experiments to test this hypothesis found so far only upper limits on contributionsof exotic scalar or tensor type currents in nuclear beta decay. A possible approach isconsidering the angular distribution of the electron (positron) and neutrino emission:
ωdEedΩedΩν ∝ F (±Z,Ee)peEe(E0 − Ee)2dEedΩedΩν
× ξ(
1 + aβν~pe~pνEeEν
+ bm
Ee+ . . .
)(19)
where the nuclear matrix element ξ is defined as
ξ =|MF |2(|CS|2 + |CV |2 + |C ′S|2 + |C ′V |2
)+ |MGT |2
(|CT |2 + |CA|2 + |C ′T |2 + |C ′A|2
), (20)
the βν-correlation term as
aβνξ = |MF |2[−|CS|2 + |CV |2 − |C ′S|2 + |C ′V |2 ∓ 2
αZm
pe= (CSC
∗V + C ′SC
′∗V )
]+|MGT |2
3
[|CT |2 − |CA|2 + |C ′T |2 − |C ′A|2 ± 2
αZm
pe= (CTC
∗A + C ′TC
′∗A )
], (21)
and the Fierz interference term as
bξ = ±2γ<[|MF |2 (CSC
∗V + C ′SC
′∗V ) + |MGT |2 (CTC
∗A + C ′TC
′∗A )]. (22)

2 THE WISARD EXPERIMENT 7
Figure 4: Energy spectrum of the 0+ → 0+ proton group from 32Ar decay. Theshaded curve corresponds to aβν = −1, the other curve to aβν = +1. Figure credits[5]
.
In the terms above MF , MGT are the Fermi and Gamow-Teller matrix elements,γ =
√1− (αZ)2, α the fine structure constant and Z the atomic number of the
daughter nucleus.If only Fermi type decays are taken into account, maximal parity violation and
time reversal invariance is assumed then the terms mentioned above simplify signif-icantly:
|MGT | = 0 C ′V = CV C ′A = CA CV ∧ CA ∈ R
ξ = 2|MF |2C2V (23)
aβν ' 1− |CS|2 + |C ′S|2
C2V
∓ αZm
pe=(CS + C ′SCV
)(24)
b ' ±γ<(CS + C ′SCV
). (25)
It is easy to see that for a small hypothetical contribution of exotic scalar currentsthe βν-correlation factor will deviate from aβν = 1. The WISArD experiment atISOLDE is searching for such a deviation by precisely measuring the energy of thedecay products in the super-allowed 0+ → 0+ Fermi decay of 32Ar.
2 The WISArD experiment
The Weak Interaction Studies with 32Ar Decay (WISArD) experiment is located atthe Isotope Separator On Line DEvice (ISOLDE) at CERN and will use an 32Ar-ionbeam delivered after mass separation by one of the two available mass separators.
2 THE WISARD EXPERIMENT 8
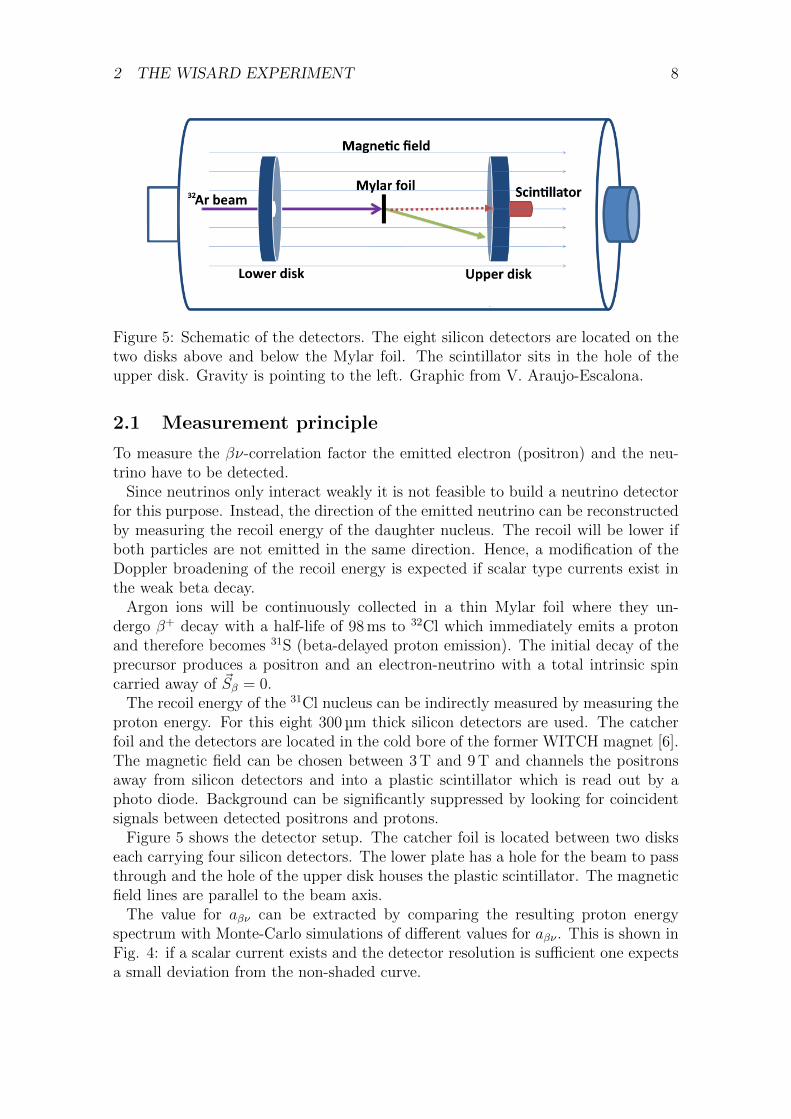
Figure 5: Schematic of the detectors. The eight silicon detectors are located on thetwo disks above and below the Mylar foil. The scintillator sits in the hole of theupper disk. Gravity is pointing to the left. Graphic from V. Araujo-Escalona.
2.1 Measurement principle
To measure the βν-correlation factor the emitted electron (positron) and the neu-trino have to be detected.
Since neutrinos only interact weakly it is not feasible to build a neutrino detectorfor this purpose. Instead, the direction of the emitted neutrino can be reconstructedby measuring the recoil energy of the daughter nucleus. The recoil will be lower ifboth particles are not emitted in the same direction. Hence, a modification of theDoppler broadening of the recoil energy is expected if scalar type currents exist inthe weak beta decay.
Argon ions will be continuously collected in a thin Mylar foil where they un-dergo β+ decay with a half-life of 98 ms to 32Cl which immediately emits a protonand therefore becomes 31S (beta-delayed proton emission). The initial decay of theprecursor produces a positron and an electron-neutrino with a total intrinsic spincarried away of ~Sβ = 0.
The recoil energy of the 31Cl nucleus can be indirectly measured by measuring theproton energy. For this eight 300 µm thick silicon detectors are used. The catcherfoil and the detectors are located in the cold bore of the former WITCH magnet [6].The magnetic field can be chosen between 3 T and 9 T and channels the positronsaway from silicon detectors and into a plastic scintillator which is read out by aphoto diode. Background can be significantly suppressed by looking for coincidentsignals between detected positrons and protons.
Figure 5 shows the detector setup. The catcher foil is located between two diskseach carrying four silicon detectors. The lower plate has a hole for the beam to passthrough and the hole of the upper disk houses the plastic scintillator. The magneticfield lines are parallel to the beam axis.
The value for aβν can be extracted by comparing the resulting proton energyspectrum with Monte-Carlo simulations of different values for aβν . This is shown inFig. 4: if a scalar current exists and the detector resolution is sufficient one expectsa small deviation from the non-shaded curve.

2 THE WISARD EXPERIMENT 9
Figure 6: Schematic for the WISArD experiment. The beam line is divided in ahorizontal and a vertical part.
.

3 SUMMER STUDENT PROJECT 10
2.2 Experimental setup
Due to the location of the setup in the ISOLDE facility the beam has to be trans-ported from REXTRAP through a roughly 6 m long beam line consisting a 29 bendto the catcher foil. Since the magnetic field lines are aligned with the gravitationalfield lines the beam has to be bend by 90 upwards. The beam line is thereforesplit into a horizontal and a vertical part. For off-line beam tuning a potassiumion source is connected by a movable 90 bender to the horizontal beam line. Thebeam line includes several electrostatic kickers, steerers, benders, drift tubes, andeinzellenses to transport the beam. Multiple Faraday cups are available to measurethe beam intensity at certain positions.
The former WITCH magnet is located in a roughly 7 m high support structurewhich also carries parts of the vertical beam line, vacuum pumps, data acquisition,control elements, and work stations. The detector system is mounted on a 2.4 mlong tower which can be lowered from the top of the magnet inside the cold bore.A graphic with descriptions is provided in Figure 6.
From the detector tower the signal cables for the silicon and scintillator detectorsare fed through the top flange and are connected to preamplifiers. Additional ca-bles for temperature sensors reading the temperature of two silicon detectors arefed through a different flange and connected to a PICO PT-104 data logger. Thedata acquisition system reads the data from the preamplifiers and fills an energyspectrum.
3 Summer Student Project
The summer student project was split by workload into a programming part wherethe student performed ion optic simulations with SIMION (60%) and worked handson with detector characterizations (20%) and other lab related work (20%).
3.1 SIMION beam line optics simulations
The SIMION ion and electron optics simulation workbench is a comprehensive toolkitfor simulating beam line infrastructure. It is especially capable of designing electro-static ion optics and therefore used in many research facilities.
In this part of the project the full beam line including the WISArD offline ionsource was simulated. Since the computational efficiency for carrying out the sim-ulations depend on many factors, manly the size of the simulated parts and thesymmetries, the beam line was separated into four different parts: the REXTRAPpart, the ion source, the horizontal beamline, and the vertical beamline includingparts of the magnet and the detector tower. Available steerers were not included inthe simulations
The goal of this simulation was to optimize the beam transport quality and thebeam current received on the catcher foil in preparation for the experiment beamtime. To find valid electrode voltages two consecutive searches were performed:an initial ”Monte-Carlo”-like parameter search to find good values for starting a
3 SUMMER STUDENT PROJECT 11
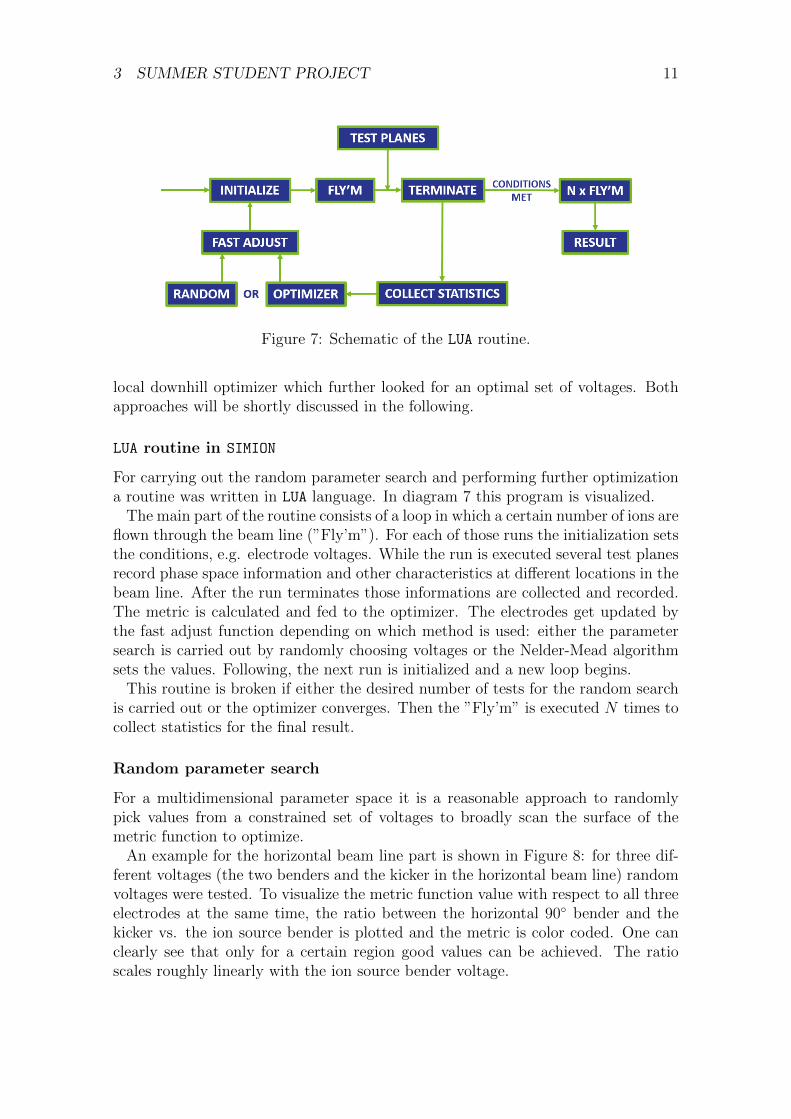
Figure 7: Schematic of the LUA routine.
local downhill optimizer which further looked for an optimal set of voltages. Bothapproaches will be shortly discussed in the following.
LUA routine in SIMION
For carrying out the random parameter search and performing further optimizationa routine was written in LUA language. In diagram 7 this program is visualized.
The main part of the routine consists of a loop in which a certain number of ions areflown through the beam line (”Fly’m”). For each of those runs the initialization setsthe conditions, e.g. electrode voltages. While the run is executed several test planesrecord phase space information and other characteristics at different locations in thebeam line. After the run terminates those informations are collected and recorded.The metric is calculated and fed to the optimizer. The electrodes get updated bythe fast adjust function depending on which method is used: either the parametersearch is carried out by randomly choosing voltages or the Nelder-Mead algorithmsets the values. Following, the next run is initialized and a new loop begins.
This routine is broken if either the desired number of tests for the random searchis carried out or the optimizer converges. Then the ”Fly’m” is executed N times tocollect statistics for the final result.
Random parameter search
For a multidimensional parameter space it is a reasonable approach to randomlypick values from a constrained set of voltages to broadly scan the surface of themetric function to optimize.
An example for the horizontal beam line part is shown in Figure 8: for three dif-ferent voltages (the two benders and the kicker in the horizontal beam line) randomvoltages were tested. To visualize the metric function value with respect to all threeelectrodes at the same time, the ratio between the horizontal 90 bender and thekicker vs. the ion source bender is plotted and the metric is color coded. One canclearly see that only for a certain region good values can be achieved. The ratioscales roughly linearly with the ion source bender voltage.

3 SUMMER STUDENT PROJECT 12
(a) Rough search (b) Constrained search
Figure 8: Example for the rough search (left) and the constrained search (right) forthe two benders and the kicker in the horizontal beam line between ion source andvertical beam line. The two red lines show the boundaries set after the rough searchwas carried out. The metric is color coded where red-ish colors denote small andtherefore good values.
This parameter search was performed for all four beam line parts in the samemanner. For the search with the downhill algorithm the starting point was set intothe center of the constrained space and the step size was given by the boundaries ofthe constrained area.
Nelder-Mead Algorithm
Once the starting point for the optimizer search was chosen by the random parametersearch the Nelder-Mead algorithm was used to perform the optimization.
Here a rough sketch of the procedure [7]: consider a function f : Rn → R with nbeing the dimension of the parameter space and X ⊆ Rn being a possible solutionin the solution space. The algorithm then constructs n + 1 dimensional regularsimplexes, if n = 2 this equals a regular triangle with three vertices.
The function f is evaluated at each of the n+ 1 points. The vertex with the worstfunction value is excluded and replaced by it’s mirror vertex (a n = 2 visualizationis shown in Figure 9) where the ”mirror plane” is given by connection between theremaining vertices.
Depending on the function value of this mirror vertex a new vertex point is calcu-lated to generate a new simplex for the next iteration. One of five possible actions isperformed to generate the new point: an expansion, a reflection, an inside or outsidecontraction, or a shrink.
For the next iteration the function is evaluated at each vertex and the algorithmgenerates a new mirror vertex or terminates if the stopping conditions are met.
As described before, to generate a set of starting points a random search wasperformed. After the parameter space was constrained sufficiently the Nelder-Meadalgorithm was used to find a local optimum. Usually the routine converged after a

3 SUMMER STUDENT PROJECT 13
Figure 9: Two dimensional visualization for the different iteration actions of theNelder-Mead algorithm.
couple of hundred iterations. All following results were generated by using a set ofsolutions given by the Nelder-Mead optimization.
Ion-source simulation
The offline ion-source of WISArD consists of a carbon cone filled with potassiumpowder which is heated by a current of 30 A. The source itself is floated with a highvoltage to generate the necessary 30 keV beam energy. The ions are extracted byan extraction electrode and focused into a movable 90 bender. Pictures from thesimulations can be found in Fig. 18.
The ions were generated with an Maxwell-Boltzmann like energy distribution be-tween 0 eV and 7 eV where the mass of the distribution was roughly 1.5 eV. Theparticles were emitted in a randomly distributed cone with an solid angle between0 of 15. The origin of the particles was a randomly filled circle with a radius of2 mm perpendicular to the beam axis.
In Figure 10 (top row) the results for the optimization process for the ion source isdepicted. The beam profile is symmetric and shows a Gaussian profile with a stan-dard deviation of roughly σ = 1.2 mm. The emittance is about ε = 2.3 mm×mrad.Due to the positive inclination of the phase space plot the beam is diverging whenleaving the ion source. This can not be compensated by the einzellens which iscurrently limited by the power supply.
Horizontal beam line
Recording the beam characteristics from the previous section and creating new par-ticles in this section of the SIMION simulation the beam was transported throughthe movable ion source bender, the kicker, and eventually bend back towards thevertical axis by the fixed bender.
In Figure 10 (bottom row) the result for the second part of the simulation showsthat, due to a lack of focusing elements, the beam is still diverging. The horizontalaxis (z-axis) is not affected by the bending and kicking and therefore diverges freelyup to a beam size of σz = 7.1 mm. The y-axis on the other side is affected by the

3 SUMMER STUDENT PROJECT 14
(a) Beam profile after ion source (b) Emittance after ion source
(c) Beam profile after second bender (d) Emittance after second bender
Figure 10: Result of the optimizer for the beam leaving the ion source (top row) andafter the second bender (bottom row). The beam is symmetric after the ion sourcebut diverging, with given voltage restrictions the einzellens is not able to focus itsufficiently. After being bend twice the beam is asymmetric and more narrow in thedimension of the bender and kicker. Axis declaration: x-axis (beam axis), y-axis(bender and kicker), z-axis (horizontal axis).
electrode optics and it seems that the bending has some focusing effect, the size isσy = 5.3 mm.
Vertical beam line
After the last bender the ions have to cover roughly three to four meters beforereaching the catcher foil. In this part of the simulation the optimizer and therandom search only looked for maximizing the current received on the target itselfsince there will not be any further transport.
In total seven different drift tubes, two retardation electrode and one einzellenselectrode was available for transporting the beam.
Since the parameter space was too large (ten electrodes) the beam transport re-

3 SUMMER STUDENT PROJECT 15
(a) Beam without electrodes (b) Beam with einzellens
(c) Beam with alternation electrodes (d) Beam with stronger electrodes
Figure 11: Result for the vertical beam line: a test was carried out with electrodesturned off, only the einzellens turned on, alternating electrodes, and stronger alter-nation electrodes. The particle distribution is shown at the location of the lowerdetector disk. The blue circle denotes the hole for the beam, the gray dots stand forthe particles stopped by the disk, and the red dots for the particles actually receivedon the target foil.
sult was tested with four scenarios: no electrodes turned on, only the einzellensturned on, alternating electrodes, and alternating electrodes with higher voltagesthan available. This approach was chosen to contrast each case and to show whatis needed to get a good transport in the last beam line part.
In figure 11 the results are shown. The top left panel shows the beam profile onthe bottom side of the lower detector disk: since the beam has to pass through a
3 SUMMER STUDENT PROJECT 16
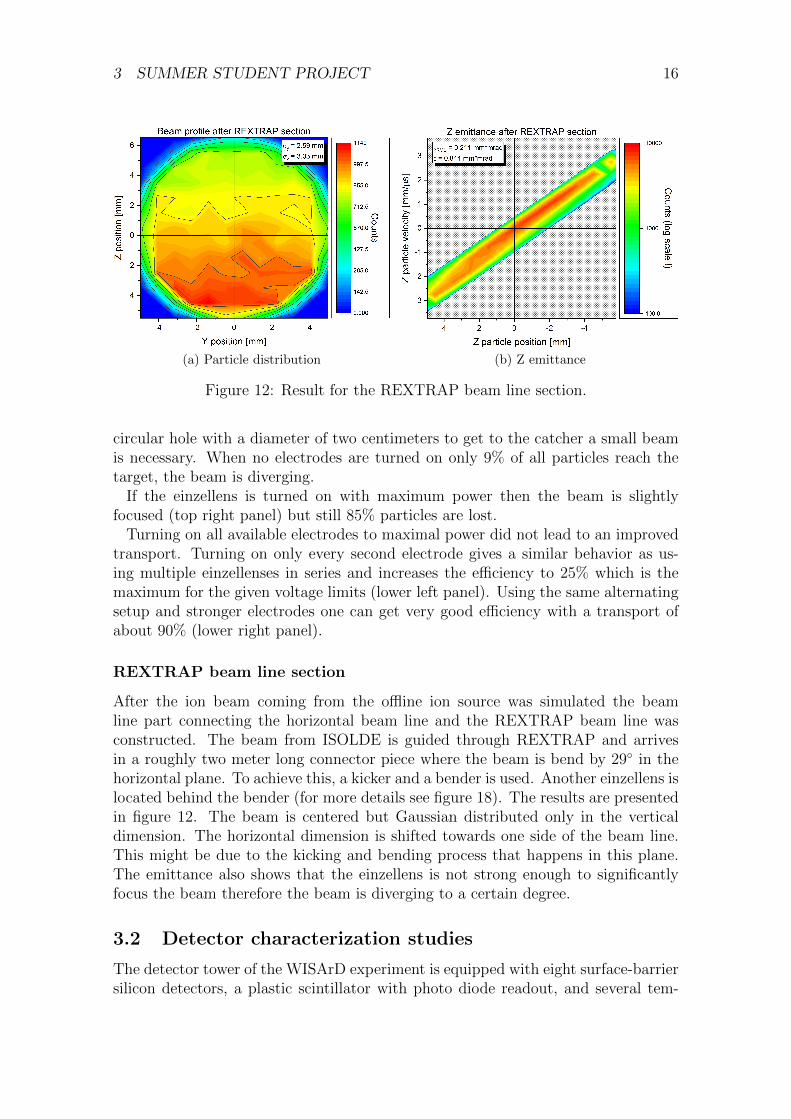
(a) Particle distribution (b) Z emittance
Figure 12: Result for the REXTRAP beam line section.
circular hole with a diameter of two centimeters to get to the catcher a small beamis necessary. When no electrodes are turned on only 9% of all particles reach thetarget, the beam is diverging.
If the einzellens is turned on with maximum power then the beam is slightlyfocused (top right panel) but still 85% particles are lost.
Turning on all available electrodes to maximal power did not lead to an improvedtransport. Turning on only every second electrode gives a similar behavior as us-ing multiple einzellenses in series and increases the efficiency to 25% which is themaximum for the given voltage limits (lower left panel). Using the same alternatingsetup and stronger electrodes one can get very good efficiency with a transport ofabout 90% (lower right panel).
REXTRAP beam line section
After the ion beam coming from the offline ion source was simulated the beamline part connecting the horizontal beam line and the REXTRAP beam line wasconstructed. The beam from ISOLDE is guided through REXTRAP and arrivesin a roughly two meter long connector piece where the beam is bend by 29 in thehorizontal plane. To achieve this, a kicker and a bender is used. Another einzellens islocated behind the bender (for more details see figure 18). The results are presentedin figure 12. The beam is centered but Gaussian distributed only in the verticaldimension. The horizontal dimension is shifted towards one side of the beam line.This might be due to the kicking and bending process that happens in this plane.The emittance also shows that the einzellens is not strong enough to significantlyfocus the beam therefore the beam is diverging to a certain degree.
3.2 Detector characterization studies
The detector tower of the WISArD experiment is equipped with eight surface-barriersilicon detectors, a plastic scintillator with photo diode readout, and several tem-
3 SUMMER STUDENT PROJECT 17
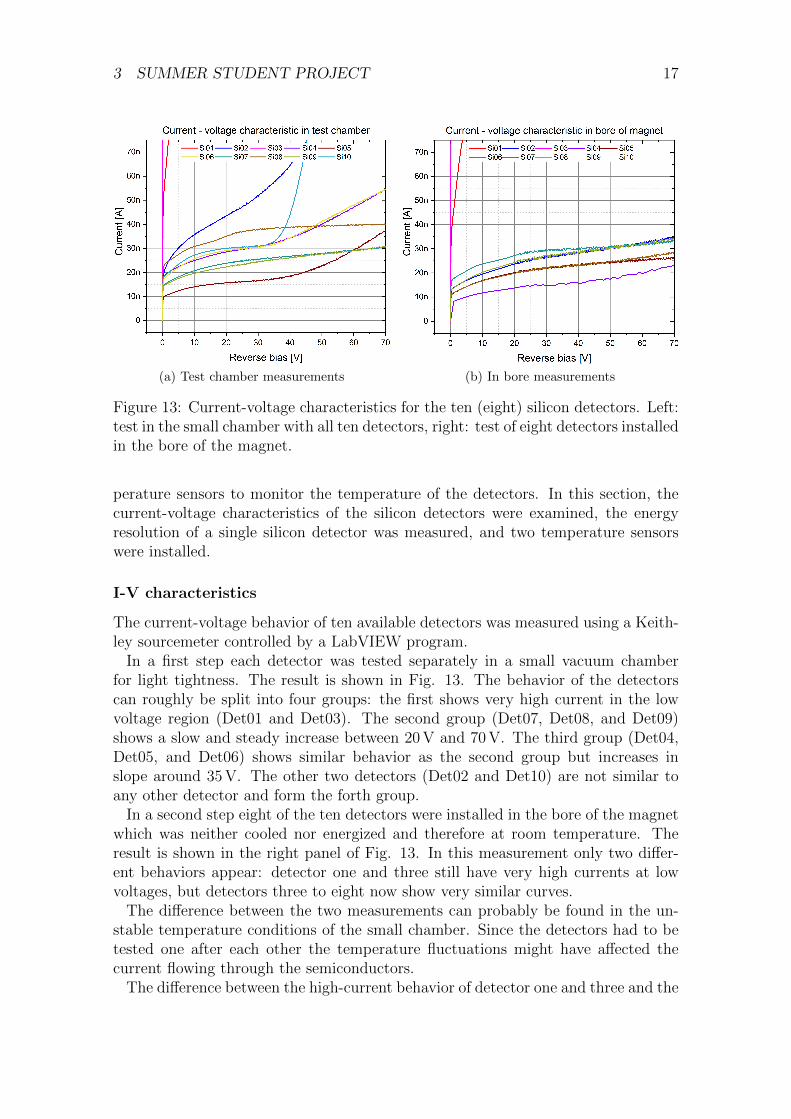
(a) Test chamber measurements (b) In bore measurements
Figure 13: Current-voltage characteristics for the ten (eight) silicon detectors. Left:test in the small chamber with all ten detectors, right: test of eight detectors installedin the bore of the magnet.
perature sensors to monitor the temperature of the detectors. In this section, thecurrent-voltage characteristics of the silicon detectors were examined, the energyresolution of a single silicon detector was measured, and two temperature sensorswere installed.
I-V characteristics
The current-voltage behavior of ten available detectors was measured using a Keith-ley sourcemeter controlled by a LabVIEW program.
In a first step each detector was tested separately in a small vacuum chamberfor light tightness. The result is shown in Fig. 13. The behavior of the detectorscan roughly be split into four groups: the first shows very high current in the lowvoltage region (Det01 and Det03). The second group (Det07, Det08, and Det09)shows a slow and steady increase between 20 V and 70 V. The third group (Det04,Det05, and Det06) shows similar behavior as the second group but increases inslope around 35 V. The other two detectors (Det02 and Det10) are not similar toany other detector and form the forth group.
In a second step eight of the ten detectors were installed in the bore of the magnetwhich was neither cooled nor energized and therefore at room temperature. Theresult is shown in the right panel of Fig. 13. In this measurement only two differ-ent behaviors appear: detector one and three still have very high currents at lowvoltages, but detectors three to eight now show very similar curves.
The difference between the two measurements can probably be found in the un-stable temperature conditions of the small chamber. Since the detectors had to betested one after each other the temperature fluctuations might have affected thecurrent flowing through the semiconductors.
The difference between the high-current behavior of detector one and three and the

3 SUMMER STUDENT PROJECT 18
Figure 14: Energy spectrum of a mixed alpha source measured with one of thesilicon detectors. The vertical axis shows counts in arb. units, the horizontal axisthe not yet calibrated ADC channels. Plot from V. Araujo-Escalona.
other detector could be the result of a different layer thickness of the detectors wherea smaller layer size would result in an overall higher current. Further, a differentbonding between silicon substrate and copper contact could also lead to varyingcurrents. Nevertheless it is assumed that all detectors have the same layer thicknesstherefore the reason for the different characteristics is not understood besides thegiven possible explanation.
After measuring detector nine and ten in the magnet with more stable conditionsit was decided that eventually detector one and three will be excluded from the setof detectors used in the final experiment.
Energy characteristics
The energy resolution was tested exemplary with one of the silicon detectors ina small test chamber. The detector was mounted and placed above a mixed alphasource (148Gd, 239Pu, 241Am, 244Cm) within the chamber and a primary vacuum waspumped allowing the alpha particle to reach the silicon detector. The raw signal ofthe detector was fed through a flange and amplified by an pre-amplifier and finallydigitalized with the FASTER DAQ [8].
The resulting energy spectrum is shown in Fig. 14. One can clearly see the fouralpha-peaks of the mixed source and furthermore the first fine structure peak isresolved for americium, curium, and polonium. The energy resolution in this setupis roughly 50 keV. This can be improved in further measurements by optimizing thedetector biasing, temperature, and data acquisition settings.

4 SUMMARY AND OUTLOOK 19
(a) Test chamber measurements (b) In bore measurements
Figure 15: Temperature measurements with PT100 temperature sensors glued totwo silicon detectors outside the magnet (left) and inside the magnet (right).
Temperature sensors
In order to get information about the temperature in the cold bore of the magnetPT100 platinum elements were installed. Two detectors were equipped with onesensor each, one on the lower and one on the upper disk by gluing them with vacuumfriendly glue. The readout was done by a PICO 104 data logger. The results fora short measuring period inside the magnet and outside the magnet is shown inFigure 15.
In both cases the blue curve shows the ambient temperature of the experimentalhall measured by a sensor only exposed to air. One can clearly see the day-nightnight cycle. The green and pink curves show the temperature of the two sensors inthermal contact to the detector PCB’s. Outside the magnet the day-night cycle isvisible as well but putting the detector tower with the sensors in the magnet andpumping vacuum this can not be found anymore. Instead it seems that the detectorsslowly heat up by roughly one degree. This might be due to lack of heat exchangewith rest gases and the cooling system not turned on yet.
4 Summary and Outlook
The simulations performed for getting good values for the ion optics yielded diverseresults. The ion source seems to work properly but the given maximal voltages forthe ion source appear not to be strong enough to focus the beam properly for thefollowing beam transport. The beam transport after the ion source bender throughthe horizontal beam line is sufficient with given electrodes but without focusingelements the beam keeps on diverging. After the second bend into the verticalbeam axis most ions are lost if the transport electrodes are not turned on. Withgiven voltage constraints only 25% of the beam is received on the catcher foil whenthe electrodes are turned on with maximal voltage in alternating configuration. The

4 SUMMARY AND OUTLOOK 20
overall beam transport and collection efficiency might be increased by using strongerpower supplies for the einzellenses.
After finishing the optimization for the off-line ion source beam also the REX-TRAP beam line part was simulated. It was found that the beam profile is asym-metric in the horizontal plane and that the einzellens is not strong enough to focusthe beam to avoid further divergence.
Further, studies for the silicon detectors were carried out. A voltage sweep tomeasure the current-voltage behavior showed typical temperature dependencies ofthe silicon detectors and after measuring under more stable temperature conditionsinside the magnet it was found that two detectors show much higher currents forlower voltages than the other tested detectors. Out of ten available detectors tested,only the eight detectors with most similar current-voltage characteristics will beused in the final setup.
An exemplary energy spectrum of a mixed alpha source was taken with one silicondetector in a small test chamber. The detector was able to nicely resolve all fourpeaks of the mixed source and was able to show the first peak of the fine structuresplitting. The energy resolution without cooling and further signal optimization inthe acquisition system yielded about 50 keV.
Temperature sensors were installed to monitor the temperature of the silicon de-tectors in the cold bore of the magnet. A test outside the magnet showed thatthe sensors, even though not yet calibrated, show the same temperature for bothdetectors on air. Inside the magnet they showed that, when vacuum is pumped, thetemperature slowly increases and eventually saturates.
The simulations will be used to compare manual beam tuning settings with sim-ulated and decide for a final set of parameters to choose from. The current-voltagecharacteristic test led to the decision to exclude two detectors and only use theeight most similar in the final experiment. The temperature sensors will be used tomonitor the temperature of detectors and preamplifiers in the magnet.
Acknowledgments
In this section I first want to thank my supervisors Dinko and Victoria for theiramazing efforts and multiple hours spent explaining various theoretical and technicalaspects of the experiment and in the lab. They not only taught me as a summerstudent but also embraced me as a fully responsible team member in the group. Alsooutside of CERN they always supported me in various situations which a summerstudent can encounter. Again, many many thanks.
I also want to thank all my colleagues at ISOLDE I worked with, especially FrankWienholtz and Maxime Mougeot who helped me when I encountered problems inthe LUA programming part. Also much appreciation for allowing working in theISOLTRAP office which made life and programming much easier.
Lastly, I want to thank CERN’s summer student team who have organized manyvisits of CERN’s facilities and other workshops which was a great opportunity topartake in. Further, my gratitude goes out to all my fellow summer students whichmade this summer in an international community one of the most awesome andstimulating summers a young physicist could hope for.

REFERENCES 21
References
[1] K. Heyde. Basic Ideas and Concepts in Nuclear Physics. Institute of PhysicsPublishing, Second edition, 1999.
[2] K. S. Krane. Introductory Nuclear Physics. John Wiley & Sons, Corvallis,Oregon, 1988.
[3] N. Severijns, M. Beck, and O. Naviliat-Cuncic. Tests of the standard elec-troweak model in nuclear beta decay. Reviews of modern physics, volume 78,July-September 2006.
[4] Nathal Severijns. Weak Interaction Studies by Precision Experiments in NuclearBeta Decay. Springer-Verlag Berlin Heidelberg, 2004.
[5] Adelberger et al. Positron-neutrino correlation in the 0+ 0+ decay of 32Ar.Physics Review Letters, Volume 83, Number 7, August 1999.
[6] M. Beck et al. Witch: a recoil spectrometer for weak interaction and nuclearphysics studies. Nuclear Instruments and Methods in Physics Research A 503(2003) 567-579.
[7] E. Piselli and A. Akroh. New CERN Proton Synchrotron Beam OptimizationTool. 16th Int. Conf. on Accelerator and Large Experimental Control Systems2017, Barcelona, Spain, JACoW Publishing.
[8] LPC Caen. FASTER Data Acquisition. Retrieved online: http://faster.
in2p3.fr/, September, 2018.
[9] R. Dominguez-Reyes, N. Adimi, M. Alcorta, A. Bey, and M.J.G. Borge et al. De-tailed beta-decay study of 32Ar. Submitted to J. Phys. G: Nucl. Phys; ExperienceGANIL-SPIRAL., 2011, in2p3-00617510.
A SUPPLEMENTAL INFORMATION 22
A Supplemental information
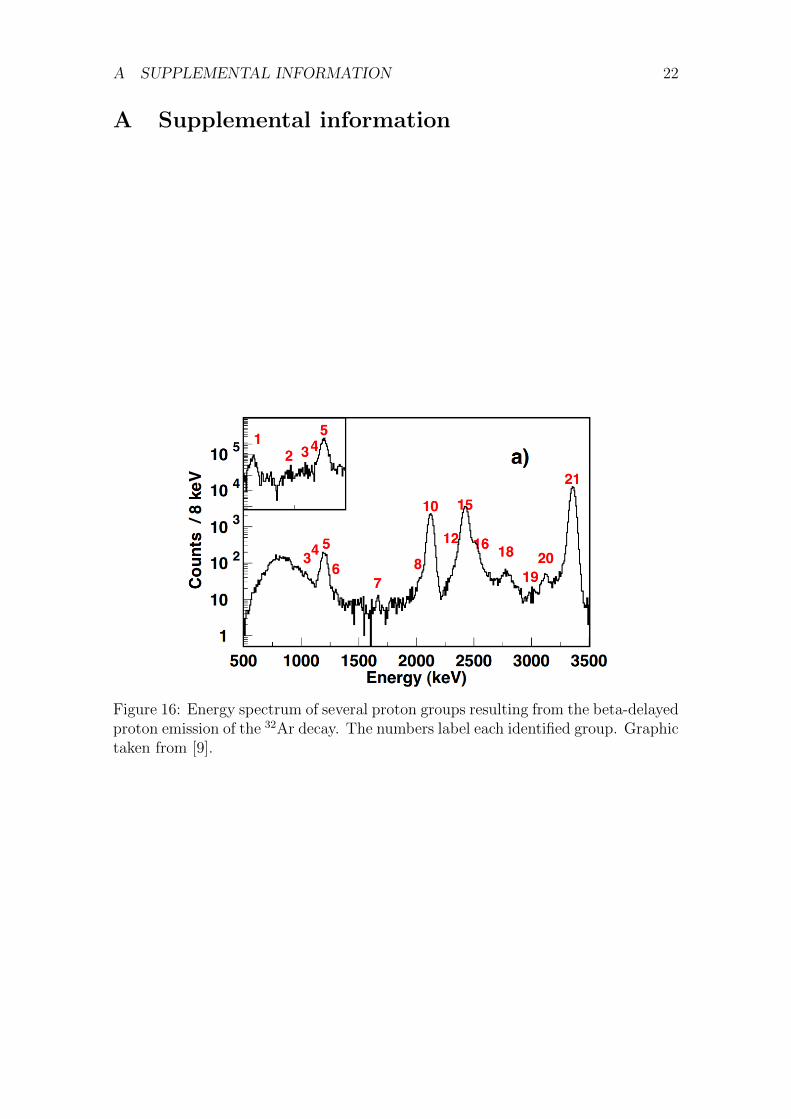
Figure 16: Energy spectrum of several proton groups resulting from the beta-delayedproton emission of the 32Ar decay. The numbers label each identified group. Graphictaken from [9].

A SUPPLEMENTAL INFORMATION 23
Figure 17: Energy scheme of the beta-delayed proton emission from 32Ar decay to32Cl and 31S. The transition with the largest branching ratio (≈ 22.65%) is thesuper-allowed decay with T = 2. Graphic taken from [9]
.

A SUPPLEMENTAL INFORMATION 24
Figure 18: Visualization of the beam line simulation with SIMION. The four partsare the vertical beam line, the horizontal beam line, the connector beam line toREXTRAP, and the ion source.
.
Copyright © 2022 FDOKUMEN