Adolescent and Adult Student Attitudes Towards Progress ...
13
https://helda.helsinki.fi Adolescent and Adult Student Attitudes Towards Progress Visualizations Aarne, Onni Springer 2017-11-19 Aarne , O , Peltola , P , Leinonen , A , Leinonen , J & Hellas , A 2017 , Adolescent and Adult Student Attitudes Towards Progress Visualizations . in V Dagiene & A Hellas (eds) , Informatics in Schools: Focus on Learning Programming : 10th International Conference on Informatics in Schools: Situation, Evolution, and Perspectives, ISSEP 2017, Helsinki, Finland, November 13-15, 2017, Proceedings . Lecture Notes in Computer Science , vol. 10696 , Springer , Cham , pp. 15-26 , International Conference on Informatics in Schools , Helsinki , Finland , 13/11/2017 . https://doi.org/10.1007/978-3-319-71483-7_2 http://hdl.handle.net/10138/315999 https://doi.org/10.1007/978-3-319-71483-7_2 acceptedVersion Downloaded from Helda, University of Helsinki institutional repository. This is an electronic reprint of the original article. This reprint may differ from the original in pagination and typographic detail. Please cite the original version.
-
Upload
khangminh22 -
Category
Documents
-
view
3 -
download
0
Transcript of Adolescent and Adult Student Attitudes Towards Progress ...
https://helda.helsinki.fi
Adolescent and Adult Student Attitudes Towards Progress Visualizations
Aarne, Onni
Springer
2017-11-19
Aarne , O , Peltola , P , Leinonen , A , Leinonen , J & Hellas , A 2017 , Adolescent and Adult
Student Attitudes Towards Progress Visualizations . in V Dagiene & A Hellas (eds) ,
Informatics in Schools: Focus on Learning Programming : 10th International Conference on
Informatics in Schools: Situation, Evolution, and Perspectives, ISSEP 2017, Helsinki,
Finland, November 13-15, 2017, Proceedings . Lecture Notes in Computer Science , vol.
10696 , Springer , Cham , pp. 15-26 , International Conference on Informatics in Schools ,
Helsinki , Finland , 13/11/2017 . https://doi.org/10.1007/978-3-319-71483-7_2
http://hdl.handle.net/10138/315999
https://doi.org/10.1007/978-3-319-71483-7_2
acceptedVersion
Downloaded from Helda, University of Helsinki institutional repository.
This is an electronic reprint of the original article.
This reprint may differ from the original in pagination and typographic detail.
Please cite the original version.
Adolescent and Adult Student AttitudesTowards Progress Visualizations
Onni Aarne?, Petrus Peltola?, Antti Leinonen, Juho Leinonen, and Arto Hellas
University of [email protected]
Abstract. Keeping students motivated for the duration of a courseis easier said than done. Contextualizing student efforts with learningprogress visualizations can help maintain engagement. However, progresscan be visualized in many different ways. So far very little research hasbeen done into which types of visualizations are most effective, and howdifferent contexts affect the effectiveness of visualizations. We comparethe effects of two different progress visualizations in an introductory pro-gramming course. Preliminary results show that older students prefer avisualization that emphasizes long-term progress, whereas younger stu-dents prefer a visualization that highlights progress within a single week.Additionally, students perform better and are more motivated when theirvisualization matches their age group’s preferred visualization. Possibleexplanations and implications are discussed.
Keywords: progress visualization, student engagement, growth mind-set, motivation
1 Introduction
The effort that we expect from our students can be overwhelming to the extentthat students temporarily lose track of their long-term goals and original moti-vations – seeing the forest from the trees can be hard. Progress visualizationscan be a valuable tool for showing students the metaphorical forest, and helpingthem focus on the work that they are doing. Certain visualizations can improvestudents’ performance in a measured task; for example, a progress bar that mea-sures a specific activity can increase students’ engagement with that activity [8].These types of motivational tools can be important in labour-intensive courses,such as introductory programming courses, and can provide additional incentivesfor the students to complete the tasks they are given.
Learning progress visualization tools intended for students themselves havemostly been researched as part of broader attempts at gamifying education.However, this research rarely looks at specific elements of gamification with anyrigor. In this work, we compare two types of progress visualizations that em-phasize progress at different course granularities, and study whether specificvisualizations are more suitable for specific course sub-populations. More specif-ically, we explore how adult and adolescent students respond to visualizationsthat highlight weekly progress and course-long progress.
? These authors contributed equally to this work.
This article is structured as follows. First, in Section 2 we provide an overviewof students’ orientations and mindsets as well as discuss point and progressvisualizations. Then, in Sections 3 and 4 we explain the details of the study andits results, respectively. In Section 5 we discuss the results and lastly, in Section6 we conclude this work and outline possible future research.
2 Related work
In this section, we visit two relevant streams of research. First, we briefly discussself-regulation in adults and adolescents. Then, we discuss previous work onmotivational visualizations.
2.1 Students’ Mindsets as Factors of Success
This stream of research aligns with human self-regulatory processes, which broadlyencompasses the ability of an individual to control and evaluate their behaviorduring learning. Caprara et al. [3] studied how changes in self-regulatory efficacyaffects students’ grades. They found that as the efficacy declined, the students’grades lowered. This in turn led to a higher chance of dropping out from stud-ies. Their dataset consisted of 412 students, and the study was conducted as alongitudinal study over a period of ten years – the participants were followedbetween the ages of 12 and 22.
In her research, Carol Dweck observed that individuals who believe thatintelligence is fixed, or that success is based on innate ability, are more likelyto stop working during setbacks or when struggling than those who believe thatintelligence can grow through effort [4]. Dweck popularized this belief using theterm “mindset”. Later, different types of interventions that emphasize growthof knowledge over fixed knowledge have been developed.
For example, Rourke et al. [12] developed two versions of a math video gamecalled “Fractions” to study the effects of growth mindset. Their experimentalversion of the game promoted students’ learning with commentary that praisedtheir intelligence, whereas the control group got more neutral feedback praisingtheir mathematical skills. They found that the experimental group were morepersistent as they played for a longer period of time and completed more levelsthan the control group. They also started to display behavior coherent with agrowth mindset by using strategies they learned from the game. Another resultof the study was that lower performing students were more encouraged to keepplaying in the experimental version than in the control version.
The goal is to provide the students visualizations that best support self-regulation. This in turn would lead the students to the correct mindset whichprevents quitting.
Steinberg et al. [15] found that young adults’ future orientations and delaydiscounting continued to develop from childhood all the way into their mid-twenties. The research compared 10 to 30 year old individuals and indicated,when compared to their counterparts, that younger individuals are more likelyto choose a smaller reward sooner than a larger reward later. This supports ourstudy design.
2

2.2 Point and Progress VisualizationsOverall, point and progress visualizations fall under multiple umbrellas. Theyare an integral part of gamification research that seeks to bring game-like ele-ments into educational contexts as well as more generic educational principlesof transparency where students’ progress should be made visible.
Leppanen et al. [8] studied the effect of progress visualization on studentengagement. They found that, at least initially, a simple progress bar significantlyincreased the quantity of completed exercises. Their system displayed the bar atthe bottom of the screen, and the bar became full when the user had answeredthree consecutive multiple choice questions correctly. However, the arbitrarynature of this goal meant that their bar simply created an illusion of progress– which was sufficient for increasing students’ effort – rather than depictinganything more meaningful.
Loboda et al. [9] developed and studied a form of open learner modellingwhich is comparable to our progress visualizations, though more clearly split upby subject. However, in their study, the use of the system was entirely optionalso any apparent effect might simply be due to better students being more likelyto use the system.
Another study of open learner modelling was conducted by Bull et al. [2].They used multiple visualization types for the same student, and the studentscould choose which visualizations were visible to them. The available visualiza-tions included skillometers, tables, stars, smileys, gauges, histograms, networks,radar plots, word clouds and treemaps. These visualizations had informationabout students’ knowledge and skills on the subject. They found that studentsprefer simpler visualizations such as skillometers and stars over complex visual-izations such as treemaps and word clouds.
Santos et al. [14] studied similar use of visualizations. Their research had a fewdifferences from ours. Their study was iterative. In the first phase they collectedfeedback from teachers. The teachers valued simplicity and intuitivity, whichis in line with Bull et al.’s results [2]. After modifications between evaluations,they provided the visualizations to students. They found that their demographic,which consisted of 18 to 20 year old students, valued the visualizations. Anotherdifference to our research was that they showed the students their peers’ progress,which the students found positive.
Visualizations have also been used in education to present students’ progressto teachers [5,7]. Park and Yo [13] studied different usages of learning analyticsdashboards for students, teachers or both. Based on the information they col-lected from previous studies of dashboards, they developed their own dashboardfor both students and teachers, with the focus on students’ self-regulation in thevariables shown in the dashboard. They developed their dashboard iterativelysimilarly to Santos et al. [14] by interviewing students and improving the dash-board based on the feedback. Their dashboard also allowed students to see eachother’s progress.
Gamification in education [6,10,11] utilizes visualization of students’ progress.For example Holman et al.’s [6] learning management system GradeCraft showsstudents their course scores as a progress bar. Additionally, they can get badges
3

as they learn new concepts which are also shown in the progress bar. Grade-Craft shows useful visualizations for teachers as well. They can see which badgeshave been completed, and which are in progress. They also see how the studentspredicted their success during the course and if their progress corresponds theprediction.
3 Methodology
In this section, we first explain the context of our study in Section 3.1. Then,we describe the survey the students were given and the students’ answers, i.e.the data for our study in Sections 3.2 and 3.3. Lastly, our research questions areoutlined in Section 3.4.
3.1 Context
The data for this study comes from a CS1 course series split into two seven-weekcourses conducted in the spring of 2016 at the University of Helsinki. The courseseries is an introduction to object oriented programming with Java with contentsimilar to most CS1 courses globally. Since most CS majors take these coursesin the fall, our sample mostly consists of non-CS majors.
The course uses a blended online material with interspersed theory sectionsand assignment sections. For the purposes of this study, a visualization compo-nent was added to the online material.
In the study, the students were randomly divided into two groups, which wereshown separate visualizations of their progress. One group was shown a series ofbars that corresponded to the percentage of completed exercises for each weekof the course, and the other group was shown a line plot that emphasized thegrowth of students’ skills throughout the course. The visualization aggregatedstudents’ scores over the course, showing a steady growth as students’ progressedthroughout the course.
From this point onward, we refer to the visualization with the weekly barsas the Weekly visualization, and the visualization with an emphasis on course-long growth and effort as the Growth visualization. Two examples of the Weeklyvisualization are shown in Figure 1, while Figure 2 shows two examples of theGrowth visualization.
The visualization was implemented as a floating element that was constantlyavailable in the lower right corner of the course material. As the students workedon the course, they were able to hide the visualization temporarily. Regardlessof whether the student had previously hidden the visualization, the visualizationwas visible to the student when the material page was opened again.
3.2 Survey
At the start of the final exam of the course, the students were asked to fill out asurvey about the course. As an incentive, they were offered an extra point towardthe exam score. All of the survey questions relevant to our study were Likertitems scaled from 1–7, where a low number indicated agreement and vice versa.A zero option was also included if the students felt the item was not applicable to
4
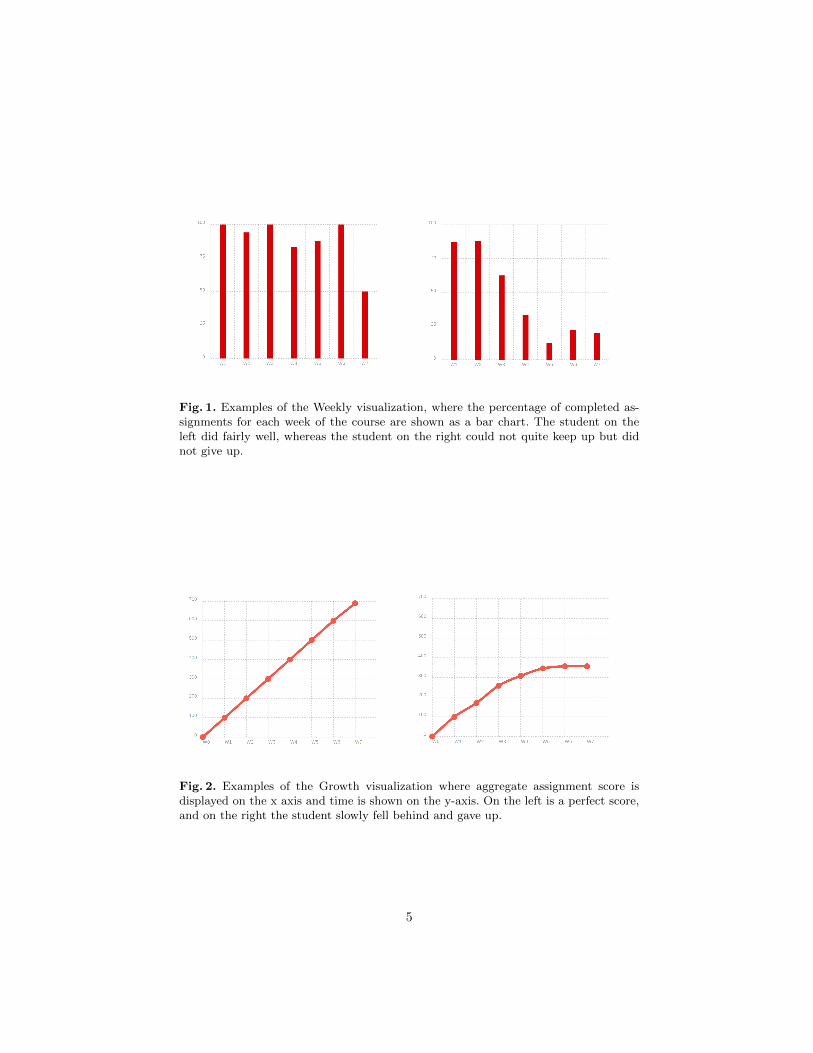
Fig. 1. Examples of the Weekly visualization, where the percentage of completed as-signments for each week of the course are shown as a bar chart. The student on theleft did fairly well, whereas the student on the right could not quite keep up but didnot give up.
Fig. 2. Examples of the Growth visualization where aggregate assignment score isdisplayed on the x axis and time is shown on the y-axis. On the left is a perfect score,and on the right the student slowly fell behind and gave up.
5
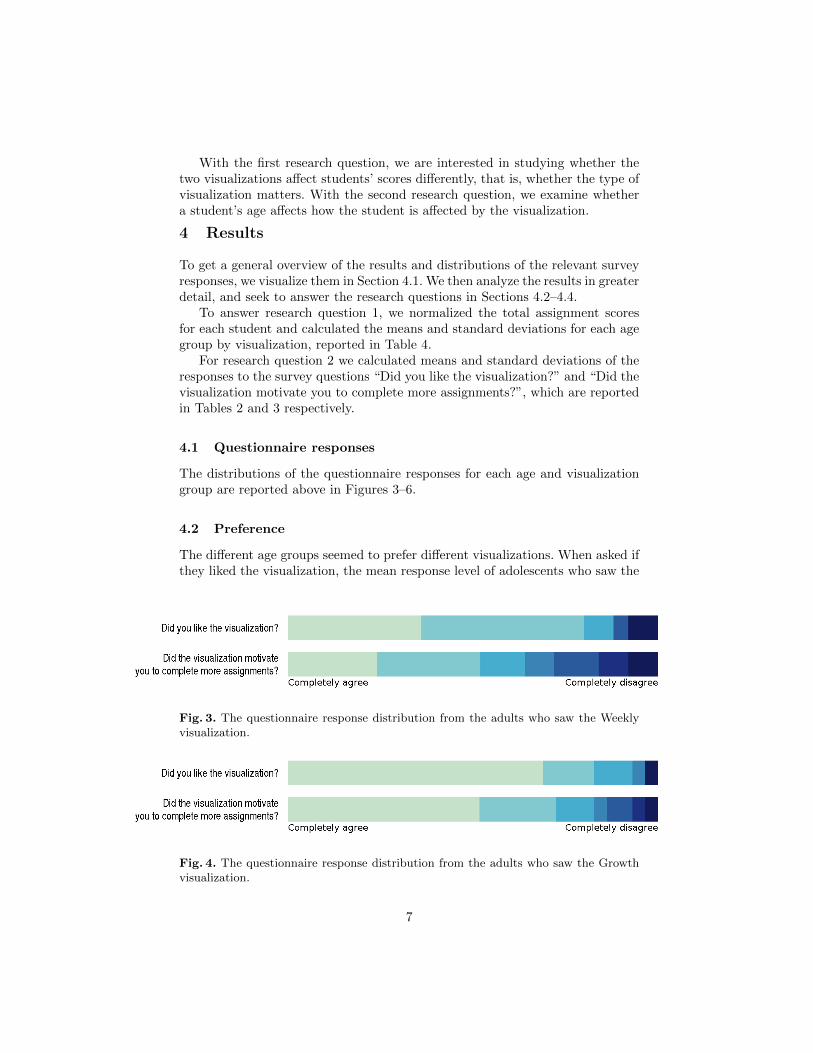
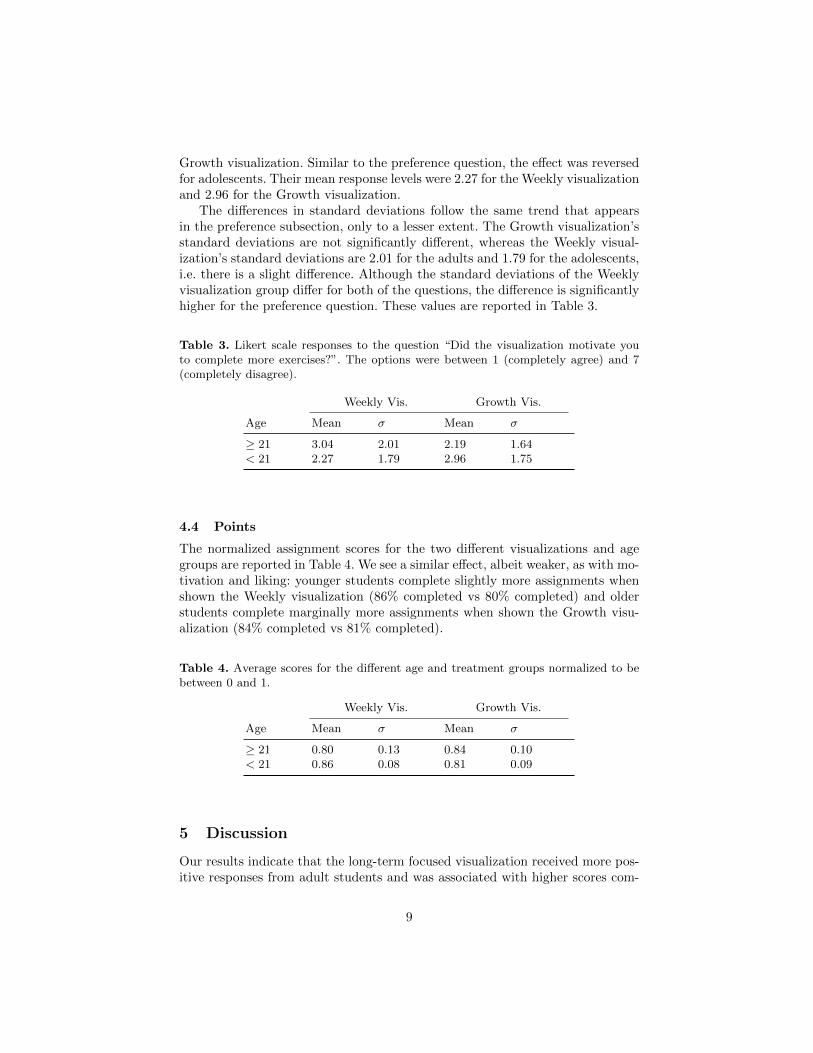
them. The items for this study included statements about whether the studentssaw the progress visualization, whether they liked the visualization they sawand whether they felt motivated by it. The distributions of the responses to thequestions are shown in Figures 3–6.
3.3 Data
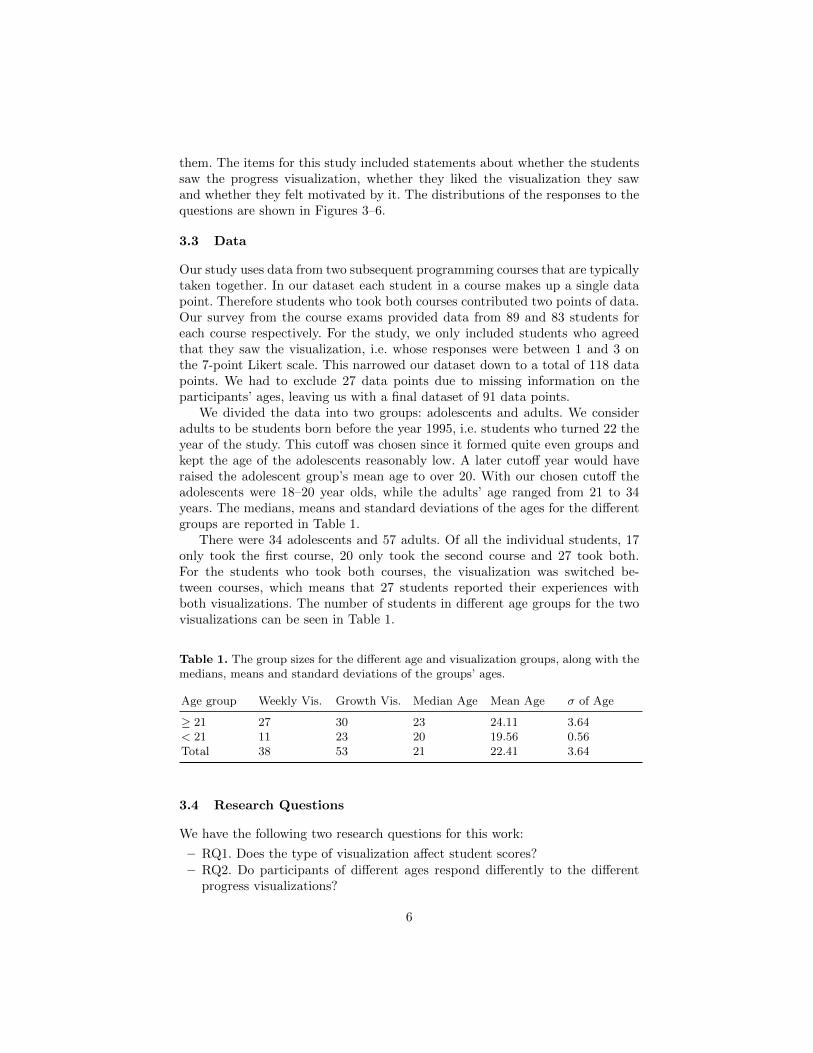
Our study uses data from two subsequent programming courses that are typicallytaken together. In our dataset each student in a course makes up a single datapoint. Therefore students who took both courses contributed two points of data.Our survey from the course exams provided data from 89 and 83 students foreach course respectively. For the study, we only included students who agreedthat they saw the visualization, i.e. whose responses were between 1 and 3 onthe 7-point Likert scale. This narrowed our dataset down to a total of 118 datapoints. We had to exclude 27 data points due to missing information on theparticipants’ ages, leaving us with a final dataset of 91 data points.
We divided the data into two groups: adolescents and adults. We consideradults to be students born before the year 1995, i.e. students who turned 22 theyear of the study. This cutoff was chosen since it formed quite even groups andkept the age of the adolescents reasonably low. A later cutoff year would haveraised the adolescent group’s mean age to over 20. With our chosen cutoff theadolescents were 18–20 year olds, while the adults’ age ranged from 21 to 34years. The medians, means and standard deviations of the ages for the differentgroups are reported in Table 1.
There were 34 adolescents and 57 adults. Of all the individual students, 17only took the first course, 20 only took the second course and 27 took both.For the students who took both courses, the visualization was switched be-tween courses, which means that 27 students reported their experiences withboth visualizations. The number of students in different age groups for the twovisualizations can be seen in Table 1.
Table 1. The group sizes for the different age and visualization groups, along with themedians, means and standard deviations of the groups’ ages.
Age group Weekly Vis. Growth Vis. Median Age Mean Age σ of Age
≥ 21 27 30 23 24.11 3.64< 21 11 23 20 19.56 0.56Total 38 53 21 22.41 3.64
3.4 Research Questions
We have the following two research questions for this work:
– RQ1. Does the type of visualization affect student scores?– RQ2. Do participants of different ages respond differently to the different
progress visualizations?
6
With the first research question, we are interested in studying whether thetwo visualizations affect students’ scores differently, that is, whether the type ofvisualization matters. With the second research question, we examine whethera student’s age affects how the student is affected by the visualization.
4 Results
To get a general overview of the results and distributions of the relevant surveyresponses, we visualize them in Section 4.1. We then analyze the results in greaterdetail, and seek to answer the research questions in Sections 4.2–4.4.
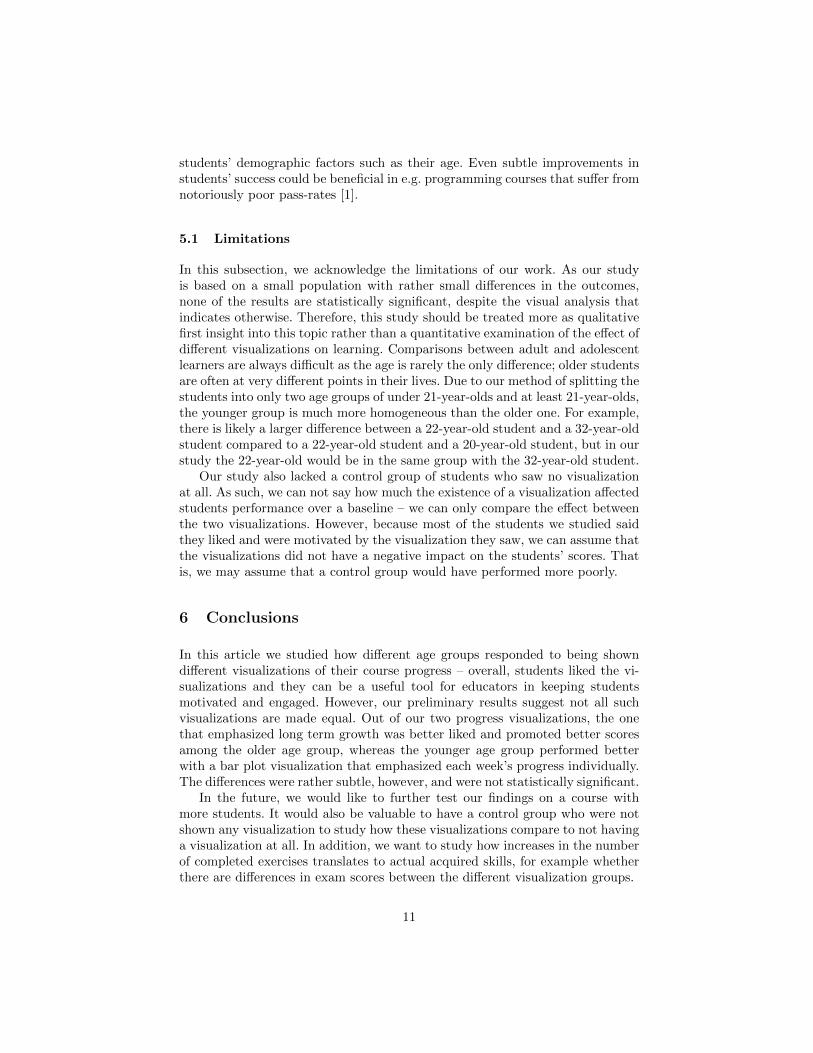
To answer research question 1, we normalized the total assignment scoresfor each student and calculated the means and standard deviations for each agegroup by visualization, reported in Table 4.
For research question 2 we calculated means and standard deviations of theresponses to the survey questions “Did you like the visualization?” and “Did thevisualization motivate you to complete more assignments?”, which are reportedin Tables 2 and 3 respectively.
4.1 Questionnaire responses
The distributions of the questionnaire responses for each age and visualizationgroup are reported above in Figures 3–6.
4.2 Preference
The different age groups seemed to prefer different visualizations. When asked ifthey liked the visualization, the mean response level of adolescents who saw the
Fig. 3. The questionnaire response distribution from the adults who saw the Weeklyvisualization.
Fig. 4. The questionnaire response distribution from the adults who saw the Growthvisualization.
7

Fig. 5. The questionnaire response distribution from the adolescents who saw theWeekly visualization.
Fig. 6. The questionnaire response distribution from the adolescents who saw theGrowth visualization.
Weekly visualization was 1.55, whereas the adolescents’ opinion on the Growthvisualization was only 2.00. This indicates that the adolescents collectively pre-ferred the Weekly visualization to the Growth visualization. Conversely, themean response levels of adults were 2.22 and 1.65 for the Weekly and Growthvisualizations respectively, i.e. the adults liked the Growth visualization morethan the Weekly visualization.
There is very little difference between the standard deviations for the Growthvisualization. For the Weekly visualization the standard deviations are signifi-cantly different between the two age groups: 0.69 for the adolescents and 1.72for the adults. These values are reported in Table 2.
4.3 Motivating
The age groups were also more motivated by their preferred visualization. Adultsreported being more motivated by the Growth visualization. When asked toreport if the visualization affected their motivation to complete assignments, themean response levels were 3.04 for the Weekly visualization and 2.19 for the
Table 2. Likert scale responses to the question “Did you like the visualization?”. Theresponses were between 1 (completely agree) and 7 (completely disagree).
Weekly Vis. Growth Vis.
Age Mean σ Mean σ
≥ 21 2.22 1.72 1.65 1.28< 21 1.55 0.69 2.00 1.38
8
Growth visualization. Similar to the preference question, the effect was reversedfor adolescents. Their mean response levels were 2.27 for the Weekly visualizationand 2.96 for the Growth visualization.
The differences in standard deviations follow the same trend that appearsin the preference subsection, only to a lesser extent. The Growth visualization’sstandard deviations are not significantly different, whereas the Weekly visual-ization’s standard deviations are 2.01 for the adults and 1.79 for the adolescents,i.e. there is a slight difference. Although the standard deviations of the Weeklyvisualization group differ for both of the questions, the difference is significantlyhigher for the preference question. These values are reported in Table 3.
Table 3. Likert scale responses to the question “Did the visualization motivate youto complete more exercises?”. The options were between 1 (completely agree) and 7(completely disagree).
Weekly Vis. Growth Vis.
Age Mean σ Mean σ
≥ 21 3.04 2.01 2.19 1.64< 21 2.27 1.79 2.96 1.75
4.4 Points
The normalized assignment scores for the two different visualizations and agegroups are reported in Table 4. We see a similar effect, albeit weaker, as with mo-tivation and liking: younger students complete slightly more assignments whenshown the Weekly visualization (86% completed vs 80% completed) and olderstudents complete marginally more assignments when shown the Growth visu-alization (84% completed vs 81% completed).
Table 4. Average scores for the different age and treatment groups normalized to bebetween 0 and 1.
Weekly Vis. Growth Vis.
Age Mean σ Mean σ
≥ 21 0.80 0.13 0.84 0.10< 21 0.86 0.08 0.81 0.09
5 Discussion
Our results indicate that the long-term focused visualization received more pos-itive responses from adult students and was associated with higher scores com-
9

pared to the alternative. Similarly, the visualization which emphasizes weeklyprogress received more positive responses and resulted in higher scores in theyounger group, compared to the alternative.
Therefore, the answer to our first research question, “Does the type of visu-alization affect student scores?”, is affirmative. Moreover, as younger and olderstudents preferred different visualizations, a more specific answer that also an-swers our second research question, “Do participants of different ages responddifferently to the different progress visualizations?”, is the following: “Dependingon the age of the student, different progress visualizations affect students’ scoresdifferently”. However, the differences between the visualizations were subtle.This is especially the case when comparing our results to Leppanen et al. [8],who found a much more intense effect. A number of relevant differences mayexplain this. Their study used simple multiple choice questions, and kept theprogress bar always visible – the progress bar also indicated when the studenthad “completed” a specific task, even though in reality their completion wasarbitrary. In our study, the progress was slower as the assignments were morecomplex, and the visualization was only visible in the web-based course materialand not in programming environment where students worked on most of thecourse tasks.
It is possible that a greater effect could be achieved if the visualization wasshown after every completed assignment, also within the programming environ-ment in which the students completed their course work.
We found that older students like the Growth visualization that emphasizeslong-term gains more than the Weekly visualization that highlights short-termprogress. These results are in line with those reported by Steinberg et al. [15]who found that students’ future orientation continues to develop until their mid-twenties. This suggests that there might be a benefit to adjusting motivationaltools according to the students’ ages, even among legal adults.
Generally, students both liked and were motivated by the two visualizations.For all groups, the mean response level was under 4 on a scale from 1 (completelyagree) to 7 (completely disagree). Thus, our results indicate that students likeboth visualizations, and the differences in our results are only in the magnitudeof the liking. This is in line with previous work by Bull et al. [2], who found thatstudents enjoy simple visualizations, as both of the visualizations in this studycan be considered simple. On the other hand, it is possible that students whodid not like the visualization turned the visualization off, and therefore answeredthat they did not see the visualization – such students were excluded from thisstudy.
Another reason for the younger students thinking more favourably of theWeekly visualization might be that it is more familiar to them. Progress barsare commonly used for depicting various elements such as skill proficiency andenemy health in video games, and presumably younger students spend more timeon them on average compared to older students.
In a broader context, our results indicate that in order to increase students’learning, it might be more effective to personalize visualizations depending on
10
students’ demographic factors such as their age. Even subtle improvements instudents’ success could be beneficial in e.g. programming courses that suffer fromnotoriously poor pass-rates [1].
5.1 Limitations
In this subsection, we acknowledge the limitations of our work. As our studyis based on a small population with rather small differences in the outcomes,none of the results are statistically significant, despite the visual analysis thatindicates otherwise. Therefore, this study should be treated more as qualitativefirst insight into this topic rather than a quantitative examination of the effect ofdifferent visualizations on learning. Comparisons between adult and adolescentlearners are always difficult as the age is rarely the only difference; older studentsare often at very different points in their lives. Due to our method of splitting thestudents into only two age groups of under 21-year-olds and at least 21-year-olds,the younger group is much more homogeneous than the older one. For example,there is likely a larger difference between a 22-year-old student and a 32-year-oldstudent compared to a 22-year-old student and a 20-year-old student, but in ourstudy the 22-year-old would be in the same group with the 32-year-old student.
Our study also lacked a control group of students who saw no visualizationat all. As such, we can not say how much the existence of a visualization affectedstudents performance over a baseline – we can only compare the effect betweenthe two visualizations. However, because most of the students we studied saidthey liked and were motivated by the visualization they saw, we can assume thatthe visualizations did not have a negative impact on the students’ scores. Thatis, we may assume that a control group would have performed more poorly.
6 Conclusions
In this article we studied how different age groups responded to being showndifferent visualizations of their course progress – overall, students liked the vi-sualizations and they can be a useful tool for educators in keeping studentsmotivated and engaged. However, our preliminary results suggest not all suchvisualizations are made equal. Out of our two progress visualizations, the onethat emphasized long term growth was better liked and promoted better scoresamong the older age group, whereas the younger age group performed betterwith a bar plot visualization that emphasized each week’s progress individually.The differences were rather subtle, however, and were not statistically significant.
In the future, we would like to further test our findings on a course withmore students. It would also be valuable to have a control group who were notshown any visualization to study how these visualizations compare to not havinga visualization at all. In addition, we want to study how increases in the numberof completed exercises translates to actual acquired skills, for example whetherthere are differences in exam scores between the different visualization groups.
11

References
1. J. Bennedsen and M. E. Caspersen. Failure rates in introductory programming.ACM SIGCSE Bulletin, 39(2):32–36, 2007.
2. S. Bull, B. Ginon, C. Boscolo, and M. Johnson. Introduction of learning visualisa-tions and metacognitive support in a persuadable open learner model. In Proceed-ings of the sixth international conference on learning analytics & knowledge, pages30–39. ACM, 2016.
3. G. V. Caprara, R. Fida, M. Vecchione, G. Del Bove, G. M. Vecchio, C. Barbaranelli,and A. Bandura. Longitudinal analysis of the role of perceived self-efficacy forself-regulated learning in academic continuance and achievement. Journal of edu-cational psychology, 100(3):525, 2008.
4. C. S. Dweck. Mindset: The new psychology of success. Random House Incorporated,2006.
5. A. L. Dyckhoff, D. Zielke, M. Bultmann, M. A. Chatti, and U. Schroeder. De-sign and implementation of a learning analytics toolkit for teachers. Journal ofEducational Technology & Society, 15(3):58, 2012.
6. C. Holman, S. Aguilar, and B. Fishman. Gradecraft: What can we learn froma game-inspired learning management system? In Proceedings of the third inter-national conference on learning analytics and knowledge, pages 260–264. ACM,2013.
7. M. E. Jacovina, E. L. Snow, L. K. Allen, R. D. Roscoe, J. L. Weston, J. Dai, andD. S. McNamara. How to visualize success: Presenting complex data in a writingstrategy tutor. In EDM, pages 594–595, 2015.
8. L. Leppanen, L. Vapaakallio, and A. Vihavainen. Illusion of progress is moaraddictive than cat pictures. In Proceedings of the Third (2016) ACM Conferenceon Learning @ Scale, L@S ’16, pages 133–136, New York, NY, USA, 2016. ACM.
9. T. D. Loboda, J. Guerra, R. Hosseini, and P. Brusilovsky. Mastery grids: An open-source social educational progress visualization. In Proceedings of the 2014 Con-ference on Innovation & Technology in Computer Science Education, ITiCSE’14, pages 357–357, New York, NY, USA, 2014. ACM.
10. B. B. Morrison and B. DiSalvo. Khan academy gamifies computer science. InProceedings of the 45th ACM technical symposium on Computer science education,pages 39–44. ACM, 2014.
11. S. O’Donovan, J. Gain, and P. Marais. A case study in the gamification of auniversity-level games development course. In Proceedings of the South AfricanInstitute for Computer Scientists and Information Technologists Conference, pages242–251. ACM, 2013.
12. E. O’Rourke, K. Haimovitz, C. Ballweber, C. Dweck, and Z. Popovic. Brain points:a growth mindset incentive structure boosts persistence in an educational game.In Proceedings of the SIGCHI conference on human factors in computing systems,pages 3339–3348. ACM, 2014.
13. Y. Park and I.-H. Jo. Development of the learning analytics dashboard to supportstudents’ learning performance. J. UCS, 21(1):110–133, 2015.
14. J. L. Santos, S. Govaerts, K. Verbert, and E. Duval. Goal-oriented visualizationsof activity tracking: a case study with engineering students. In Proceedings of the2nd international conference on learning analytics and knowledge, pages 143–152.ACM, 2012.
15. L. Steinberg, S. Graham, L. O’Brien, J. Woolard, E. Cauffman, and M. Banich.Age differences in future orientation and delay discounting. Child Development,80(1):28–44, 2009.
12