
National Workshop on Pumped Storage Hydropower Projects
411
National Workshop on Pumped Storage Hydropower Projects 8 th & 9 th February 2018 Energy Management Centre Thiruvananthapuram Compendium of Presentations Day 2
-
Upload
khangminh22 -
Category
Documents
-
view
0 -
download
0
Transcript of National Workshop on Pumped Storage Hydropower Projects

National Workshop on Pumped Storage
Hydropower Projects
8th & 9th February 2018
Energy Management Centre
Thiruvananthapuram
Compendium of Presentations
Day 2

INDEX
Session - IV Knowledge sharing from Europe/elsewhere Chair – Peter Matt
1
Economic Evaluation / Financial viability of Pumped
Storage Power Plants Case studies – Experiences around the
world from a Consultants view point
Dr. Dieter Mueller,
Executive Vice President - Hydro
Power AF-Consult, Switzerland
2 Self Scheduling of Pumped Storage in Electric Power
Market
Dr. P Kanakasabapathy,
Amrita Vishwa Vidyapeetham
Session - V Planning Aspects Chair – Er. M K Parameswaran Nair
3
Experience sharing on Investigation, Planning & Design,
Implementation, statutory clearances for Pumped Storage
Hydro power plants in India
Er. Amitabh Tripathi,
General Manager (D&R), WAPCOS
4 Investigation, Planning & Design, Implementation for new
pumped of Pumped Storage Project
Mr. Peter Matt.
Head of Engineering Services -
Vorarlberger Illwerke AG, Austria
5 Regulatory Issues Mr. Sivaprasad, KSERC
Session - V Load Scheduling and other technical Aspects Chair – Dr. PS Chandramohan
6 Pumped Storage Power Project Research – Kerala Case
Study Dr. P G Latha, CUSAT
7 Proposed Pumped Storage Scheme of Damodar Valley
Corporation
Er. Sathyabrata Banerjee,
Dy. Chief Engg, DVC
8 Overview of Pump Storage Plants - Hydro-Mechanical &
Electrical aspects
Er. Sanjai Dhar Dwivedi,
Asst. Vice President &
Head – Engg Turbine & Valves
VOITH HYDRO, India

ÅF in
Hydro Power
Dieter Müller
29-01-2016
ÅF in
Hydro Power
Dieter Müller
29-01-2016
Son La HPP, Vietnam
1
National Workshop on Pumped Storage Hydropower Projects
8-9 February, 2018/Thiruvananthapuram/India
ÅF’s Experience in Pumped Storage Hydro Power
Dr. Dieter Mueller
Vice President, Head of Hydro Power
ÅF – Energy Division
Son La HPP, Vietnam

ÅF Group
Facts at a glance
The business sectors
ÅF in Energy
Our services
ÅF in the market
ÅF in Hydro Power
Competences and services
A selection of recent projects
ÅF in Pumped Storage Hydro Power
Why PSPP?
Examples for Potential Studies – Concept/Feasibility
Studies - Design and Construction
AGENDA
2

Facts at a glance
• Headquarter Stockholm, Sweden
• Stock Listed at Nasdaq OMX
• Active in over 100 Countries: On four continents; Europe, Asia, South America and Africa
• Number of assignments: ÅF performs over 30,000 assignments for more than 10,000 clients
Key figures and profile in 2016
0
200
400
600
800
1000
1200
1400
2014 2015 2016
Turnover
1,25 US$ Bn. (1,16 € Bn.)
19%
35%
46%
Energy
Infrastructure
Industry
Our business Contribution to Group sales
Our employees
9,133 employees in 2016
0
2000
4000
6000
8000
10000
2013 2014 2015 2016

4
Other main offices with engineering
resources:
Brazil
Estonia
Germany
India
Indonesia
Iran
Italy
Kenya
Kingdom of Saudi Arabia
Lithuania
ÅF's presence worldwide Global expertise backed by local knowledge
Domestic Markets:
Sweden Czech Republic
Norway Switzerland
Denmark Spain
Finland
Macedonia
Myanmar
Nepal
Nigeria
Russia
Serbia
Tanzania
Thailand
The Netherlands
Turkey
United Kingdom
Vietnam ÅF has offices and projects
ÅF has carried out projects

Our offer
Infrastructure
One business – three business sectors
Energy Industry
5

ÅF Group
Facts at a glance
The business sectors
ÅF in Energy
Our services
ÅF in the market
ÅF in Hydro Power
Competences and services
A selection of recent projects
ÅF in Pump Storage Power Plants
Examples for Potential Studies – Concept/Feasibility
Studies - Design and Construction
AGENDA
6

ÅF is one of the world’s engineering and consulting companies within energy
OUR CLIENTS ARE FOUND IN:
• Hydropower
• Nuclear energy
• Renewable energy
• Thermal energy
• Transmission and distribution
WE ARE EXPERTS IN:
Consultancy and engineering services in energy markets, covering the full lifecycle of an investment project in the fields of power generation, transmission and distribution
Energy
7

8
Our offering
Offering
Clients
Transmission/Distribution companies International funding institutions Construction companies Industrial companies
Power utilities Energy related industry Government/municipalities Local authorities
Basic design, Design review
Detail engineering
Consulting studies Expert services Project management, Contractor supervision
Engineering management,
Supervision and Design review
Feasibility Studies Project Development Implementation Operation
& Maintenance
Full scale of technical and financial advisory services:
Hydro Power Thermal Energy Nuclear Energy
Further fields of activities:
Renewable Energy Power Distribution Market Modeling Studies Energy Policy Issues
Com
pete
nces

9
ÅF in the market
We rank #1 pure engineering company in the world
Ministry of Power Myanmar
Some top clients around the world
• 10th largest international design firm in power
• The largest international independent power engineering company

ÅF Group
Facts at a glance
The business sectors
ÅF in Energy
Our services
ÅF in the market
ÅF in Hydro Power
Competences and services
A selection of recent projects
ÅF in Pumped Storage Hydro Power
Why PSPP?
Examples for Potential Studies – Concept/Feasibility
Studies - Design and Construction
AGENDA
10

Hydro Power
Competences and services
11
Hydropower Plants
Dams / Reservoirs
Geotechnics /
Underground Structures
Mechanical & Electrical
Equipment
Hydraulic Steel
Structures
Environment/Social Impact
Assessment

Market studies
Site selection / Environmental impact studies
Conceptual studies
Project design / Tender design / Detail design
Project management
Construction supervision
Commissioning
Operation and maintenance
• Expertise and
experience, gained
over more than
100 years
• Planning, design and
construction
management of
hydro-electric power
and multipurpose
projects, including
studies to enhance
optimum
compatibility with the
environment and the
fulfilment of
increasing safety
requirements.
Hydro Power
Our service portfolio
15

A selection of recent projects – Feasibility / Tender Stage
Hydro Power
Underground PSPP 250 MW
Kruonis PSPP 1150 MW
Vianden PSPP 200 MW
Atdorf PSPP 1400 MW
Grimsel PSPP 600 MW
F-PSPP 1100 MW
Nant de Drance PSPP 900 MW
Cozmita PSPP 500 MW
Rehab of Six HPP
Khudoni HEPP 700 MW
Shweli 3 1050 MW
Nam Ngum III 440 MW
Lai Chau 1000 MW
Xe Pian – Xe Namnoy 410 MW
Xayabury 1260 MW
Maris HPP 8 MW
Dasu 4000 MW
Iowa Hill PSPP 400 MW
Seitevare 225 MW Letsi 456 MW Ligga 324 MW
Skallböle 46 MW Långbjörn 110 MW Statsforsen 139 MW
Långed 6 MW
Kainji & Jebba 1300 MW
Koralm PSPP 360 MW
SEC PSPP 2x1000 MW
Teesta VI 500 MW Pala Maneri 480 MW Devsari 252 MW Ratle 850 MW Dugar 449 MW Seli 400 MW Miyar 120 MW Papu 90 MW Badao 70 MW Rangit II 66 MW Panchung 45 MW
Total PSPP: ~ 12‘000 MW
29
Tulila 10 MW
Rwaza-I 3 MW
Nikachhu 120 MW
Middle Modi 15.1 MW
Attaqa PSPP 2400 MW
PSPP Myanmar
SW Virginia PSPP 300 MW

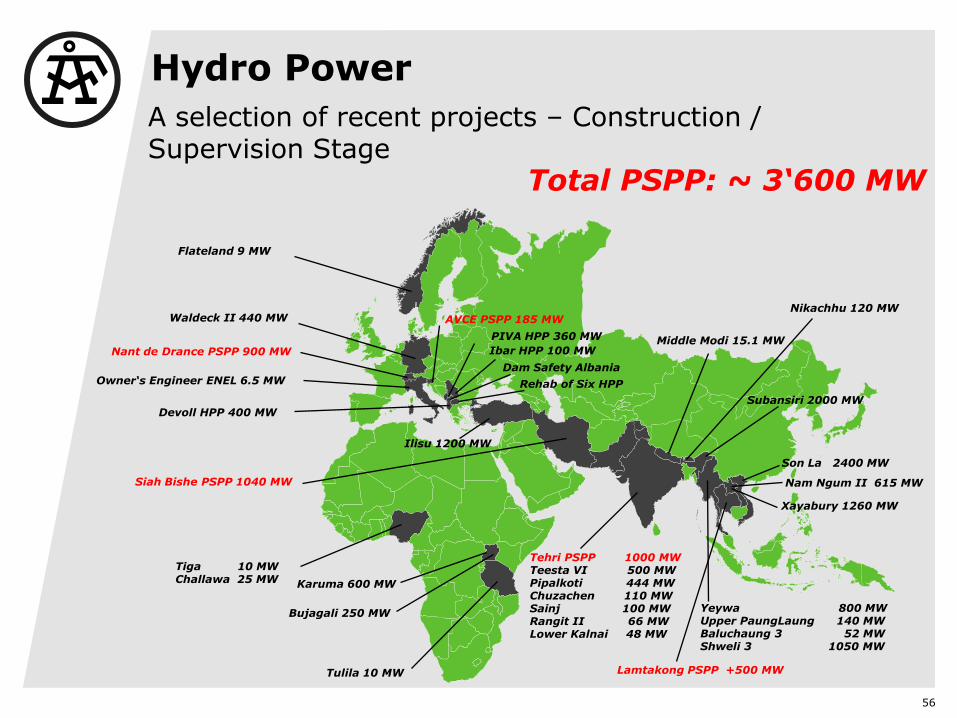
Hydro Power
A selection of recent projects – Construction / Supervision Stage
Total PSPP: ~ 3‘600 MW
Waldeck II 440 MW
Nant de Drance PSPP 900 MW
Owner‘s Engineer ENEL 6.5 MW
Tiga 10 MW Challawa 25 MW
Bujagali 250 MW
Tehri PSPP 1000 MW Teesta VI 500 MW Pipalkoti 444 MW Chuzachen 110 MW Sainj 100 MW Rangit II 66 MW Lower Kalnai 48 MW
Yeywa 800 MW Upper PaungLaung 140 MW Baluchaung 3 52 MW Shweli 3 1050 MW
Subansiri 2000 MW
Son La 2400 MW
Nam Ngum II 615 MW
Xayabury 1260 MW
Ilisu 1200 MW
AVCE PSPP 185 MW
Devoll HPP 400 MW
PIVA HPP 360 MW
Ibar HPP 100 MW
Dam Safety Albania
Rehab of Six HPP
17
Karuma 600 MW
Tulila 10 MW
Flateland 9 MW
Nikachhu 120 MW
Middle Modi 15.1 MW
Lamtakong PSPP +500 MW
Siah Bishe PSPP 1040 MW

ÅF Group
Facts at a glance
The business sectors
ÅF in Energy
Our services
ÅF in the market
ÅF in Hydro Power
Competences and services
A selection of recent projects
ÅF in Pumped Storage Hydro Power
Why PSPP?
Examples for Potential Studies – Concept/Feasibility
Studies - Design and Construction
AGENDA
18

History of pump storage operation
medium and
peak load
Base load
Medium load
Time
Po
we
r
medium and
peak load
Base load
0
500
1'000
1'500
2'000
2'500
3'000
Jan Feb Mrz Apr Mai Jun Jul Aug Sep Okt Nov Dez
dis
ch
as
rge
in
m³/
s
discharge RADAG
Q Radag
Mittel Annual energy storage at a local level
Economic optimization of nuclear power Storage of renewable energy, security of supply
Hydro Power
Pumped Storage Power Plants (PSPP)

Hydro Power
Pumped Storage Power Plants (PSPP)
20
Key Reasons/Benefits for Pumped Storage Power Plants
Flexibility to storage electricity of renewable/nuclear energy
Compensation of volatility of renewable energy and improvement of operation of thermal power production (optimization of conventional must-run capacities); Reduction of part of fossil dependence.
The volatility of prices and the average price of electricity will be stabilized.
The electricity system is stabilized overall.
Security of supply and quality of supply for industrial and private customers are ensured even with a high expansion of renewable energies
Grid services: load balancing, Black start and isolated grid operation, Regulation energy, Ancillary services
PSPP: mature technology, very flexible, fast acting, high performance, limited impact on environment, long operation life

Hydro Power
Our services and experience in Pumped Storage Power Plants (PSPP)
21
Potential Studies
Example of Myanmar PSPP
Concept/Feasibility Studies
Recent projects
Magna and Baysh PSPP, Saudi-Arabia
Design and Construction
Recent Projects
Specific solutions for civil and EM
PSPP, Myanmar
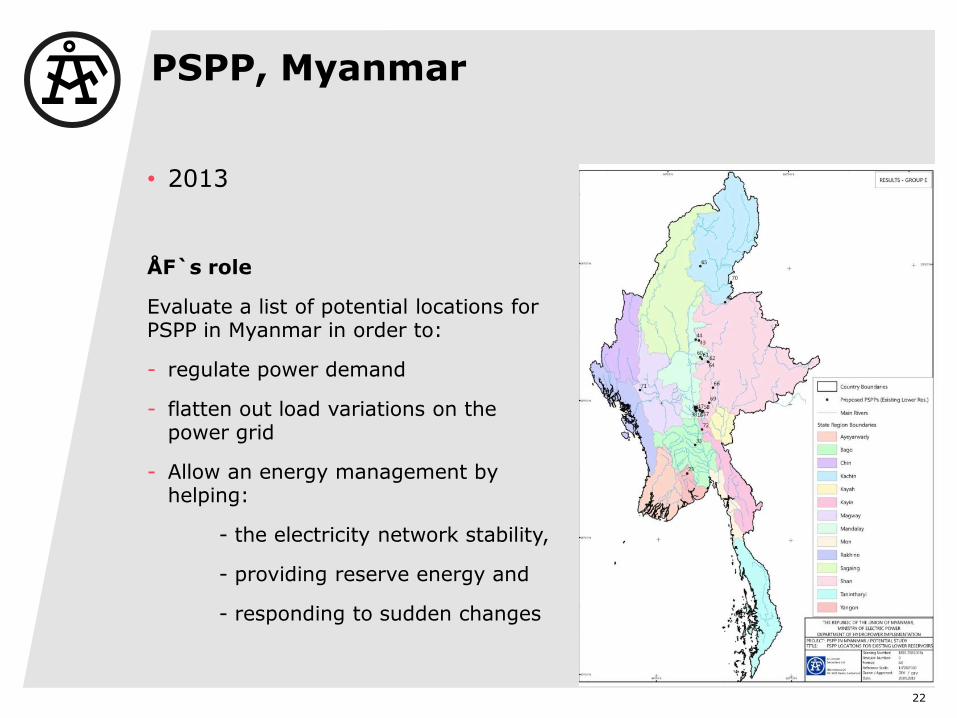
• 2013
ÅF`s role
Evaluate a list of potential locations for PSPP in Myanmar in order to:
- regulate power demand
- flatten out load variations on the power grid
- Allow an energy management by helping:
- the electricity network stability,
- providing reserve energy and
- responding to sudden changes
22

PSPP, Myanmar
23

PSPP, Myanmar
24

PSPP, Myanmar
25

PSPP, Myanmar
26

PSPP, Myanmar
27

PSPP, Myanmar
28

Hydro Power
Our services and experience in Pumped Storage Power Plants (PSPP)
29
Potential Studies
Example of Myanmar PSPP
Concept/Feasibility Studies
Key services
Example: Magna and Baysh PSPP, Saudi-Arabia
Design and Construction
References
Specific solutions for Civil and EM

A selection of recent projects – Feasibility / Tender Stage
Hydro Power
Underground PSPP 250 MW
Kruonis PSPP 1150 MW
Vianden PSPP 200 MW
Atdorf PSPP 1400 MW
Grimsel PSPP 600 MW
F-PSPP 1100 MW
Nant de Drance PSPP 900 MW
Cozmita PSPP 500 MW
Rehab of Six HPP
Khudoni HEPP 700 MW
Shweli 3 1050 MW
Nam Ngum III 440 MW
Lai Chau 1000 MW
Xe Pian – Xe Namnoy 410 MW
Xayabury 1260 MW
Maris HPP 8 MW
Dasu 4000 MW
Iowa Hill PSPP 400 MW
Seitevare 225 MW Letsi 456 MW Ligga 324 MW
Skallböle 46 MW Långbjörn 110 MW Statsforsen 139 MW
Långed 6 MW
Kainji & Jebba 1300 MW
Koralm PSPP 360 MW
SEC PSPP 2x1000 MW
Teesta VI 500 MW Pala Maneri 480 MW Devsari 252 MW Ratle 850 MW Dugar 449 MW Seli 400 MW Miyar 120 MW Papu 90 MW Badao 70 MW Rangit II 66 MW Panchung 45 MW
Total PSPP: ~ 12‘000 MW
29
Tulila 10 MW
Rwaza-I 3 MW
Nikachhu 120 MW
Middle Modi 15.1 MW
Attaqa PSPP 2400 MW
PSPP Myanmar
SW Virginia PSPP 300 MW

• 2016 – 2018
• 2 x 1000 MW
ÅF`s role
• Concept Design/Feasibility Study, Tender
Documents and Financial Feasibility for two
PSPP’s
• Alternative Studies
• Environmental & Social Impact Assessment
• TOR for Site Investigation Works
• Support during EPC Bidding
31
Magna and Baysh PSPP, Saudi Arabia

Key Characteristics:
• Two 1000 MW schemes, located in the South close to Yemen (Baysh PSPP) and in the North at the Red Sea (Gulf of Aqaba, Magna PSPP)
• Magna PSPP in combination with a Desalination Plant to be fed via Red Sea
• Baysh PSPP in combination with an existing flood-regulation reservoir (Baysh Reservoir)
• Design Heads: 520 - 720 m • Rated Unit Capacity 250 MW • Number of Unit: 4 with total Capacity of
1000 MW • Type of Machine: Reversible Pump
Turbines, multi-stage Pump
32
Magna and Baysh PSPP, Saudi Arabia

33
Magna and Baysh PSPP, Saudi Arabia

Hydro Power
Our services and experience in pump storage power plants (PSPP) for FS Phase
34
(1) Civil design aspects
- Underground versus surface layout
- Project Optimization
(2) Electromechancial design aspects
- Grid Requirements
- Black Start Ability/Auxilliary Power Supply
- Electromechanical Equipment
- Transient Study

Civil Design – Underground vs. Surface Layout
Magna and Baysh PSPP, Saudi Arabia
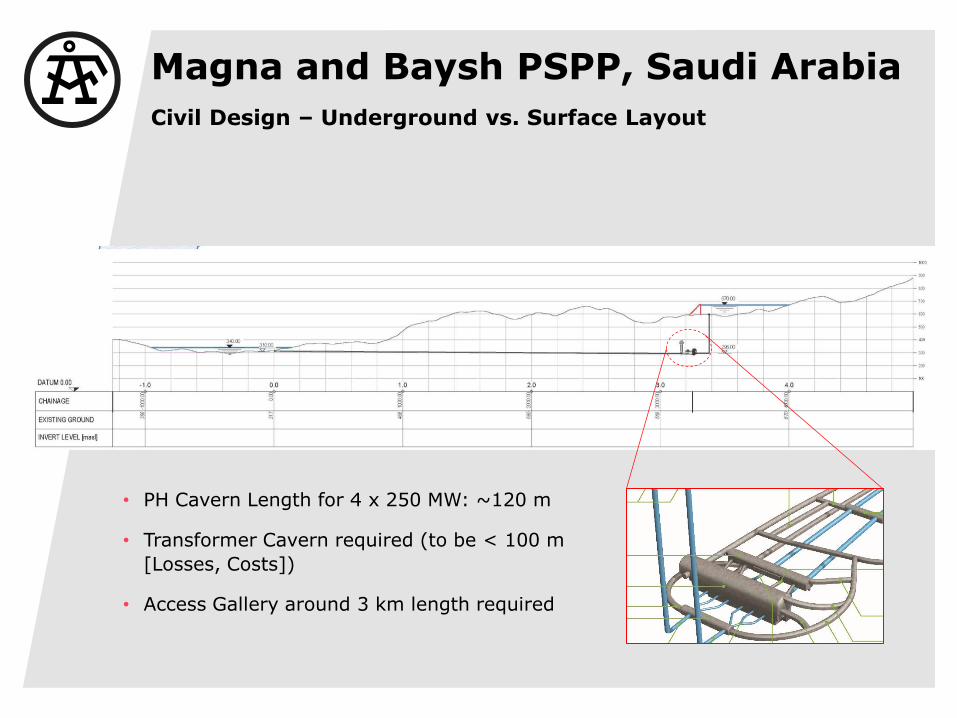
Civil Design – Underground vs. Surface Layout
• PH Cavern Length for 4 x 250 MW: ~120 m
• Transformer Cavern required (to be < 100 m
[Losses, Costs])
• Access Gallery around 3 km length required
Magna and Baysh PSPP, Saudi Arabia

Civil Design – Underground vs. Surface Layout
Magna and Baysh PSPP, Saudi Arabia

Civil Design – Underground vs. Surface Layout
• Two Powerhouse Shafts housing each 2 x 250 MW
• PH Shaft Depth: ~70 m
• 1 PH Superstructure operating for the 2 Shafts
• Transformer located on the surface adjacent to
superstructure
• Two surface, steel lined penstocks, dia ~ 6m
Magna and Baysh PSPP, Saudi Arabia

Avce PSPP, Slovenia
• 2003 – 2011
• 180 MW
ÅF`s role
• Review of the basic design
• Scheme optimization
• Final design, technical
specifications
• Detailed design of the civil
works
• Technical support during the
civil construction
• Assistance during
commissioning
39

Avce PSPP, Slovenia
Key Characteristics:
• In operation in 2010
• Upper reservoir: 634 masl
• Upstream reservoir capacity:
2.2 Mio. m3
• Net Head: 630
• Number of Unit: 1 with Capacity
of 180 MW
• Type of Machine: Asynchronous
• Rated flow per unit: ~ 35 m3/s
40

Civil Design – Underground vs. Surface Layout
Magna and Baysh PSPP, Saudi Arabia

42
Civil Design – Underground vs. Surface Layout
Underground Layout Surface Layout
+ Shorter High Pressure Tunnel + Access
+ Less Steel lining required + Constructability
+ Less critical to earthquakes
+ Power Evacuation
+ Conventional, downstream surge tank required
- Upstream, pressurized surge tank required
- Complexity (and Risk/Costs) of Underground Construction
- Safety against earthquakes
- Access to Underground Works
- Length of High Pressure Waterways, Steel Lining
- Power Evacuation
- Maintenance, Operation Costs (Surgetank, Penstock)
Magna and Baysh PSPP, Saudi Arabia

43
Civil Design – Considerations on Project Optimizations
Magna and Baysh PSPP, Saudi Arabia
Key Characteristics
Design charge
Required life storage

• Grid frequency xx Hz ?
• Power capacity factor (cos phi)?
• Black start and isolated grid operation?
• Regulation energy?
• Active and reactive power requirements?
• Ancillary services?
Unit type (ternary machine, single stage pump turbine, etc.)
44
Grid requirements
Electromechanical Aspects
Magna and Baysh PSPP, Saudi Arabia

45
Electromechanical Equipment
Horizontal Ternary Layout
Turbine
WandlerGenerator
Kupplung
Pumpe
TUKS PUKS PUKS
Turbine
WandlerGenerator
Kupplung
Pumpe
TUKS PUKS PUKS
Electromechanical Aspects
Magna and Baysh PSPP, Saudi Arabia

46
Ternary Machine Set: Basics
Source: Andritz Workshop Vienna, 2012
Electromechanical Aspects
Magna and Baysh PSPP, Saudi Arabia

Goldisthal/Germany: reversible pump turbine
48
(synchron) (asynchron)
Number of units [-] 2 2
runner diameter [m] 4.59 4.59
nominal speed [rpm] 333 300-346
max. turbine output [MW] 325 300
max. pump power [MW] 262 291
max pump head [m] 338 339
variation of pump power > 100MW
Source: Vattenfall, Voith Hydro
Electromechanical Aspects
Magna and Baysh PSPP, Saudi Arabia

Advantages of Vario Speed machines
• Performance regulation in
pump mode
• Improved turbine efficiency
at part load operation
• Bigger operating ranges in
pump and turbine mode
• Ancillary services (better
active and reactive power
regulation)
49
Electromechanical Aspects
Magna and Baysh PSPP, Saudi Arabia

Comparison of Vario Speed machines
50
Synchronous machine
with full size converter Double-fed
asynchronous machine
Relatively new converter technology
Two suppliers for converters
Smaller machine dimensions / bigger
converter dimensions
Smaller operating costs
More cooling needed
Approx. > 1% losses (based on
converter power i.e. generator power)
No phase reversal switches needed
Known technology
Few suppliers
Bigger machine dimensions / smaller converter
dimensions
Higher maintenance costs (Slip rings)
Need less cooling
3% losses (based on converter power i.e.
converter power approx. 24 MVA)
Electromechanical Aspects
Magna and Baysh PSPP, Saudi Arabia

Comparison of machine dimensions
51
Electromechanical Aspects
Magna and Baysh PSPP, Saudi Arabia
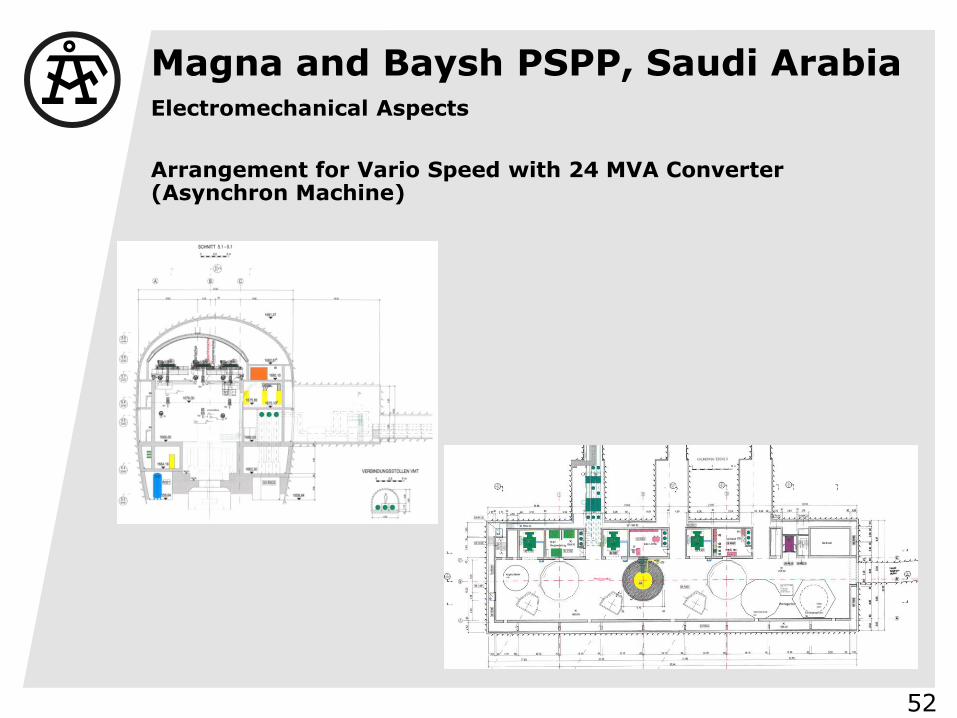
52
Arrangement for Vario Speed with 24 MVA Converter (Asynchron Machine)
Electromechanical Aspects
Magna and Baysh PSPP, Saudi Arabia

53
Arrangement with Full Size Converter (Synchron Machine) for 230 MVA Units
Electromechanical Aspects
Magna and Baysh PSPP, Saudi Arabia

Pump-Turbine
Inertia moment of Motor- Generator
Upper reservoir
Upstream surge tank
54
Lower reservoir
Modeling of Layout (Transient Study with Simsen-Hydro-Software):
- Spiral case pressure
- Need/Dimension of Surge tank/Surge tank water oscillation
- Draft tube cone pressure/level of units (submergence)
Electromechanical Aspects
Magna and Baysh PSPP, Saudi Arabia

Hydro Power
Our services and experience in Pumped Storage Power Plants (PSPP)
55
Potential Studies
Example of Myanmar PSPP
Concept/Feasibility Studies
Recent Projects
Example: Magna and Baysh PSPP, Saudi-Arabia
Design and Construction
Recent Projects
Specific solutions for PH (BIM), intakes
Hydro Power
A selection of recent projects – Construction / Supervision Stage
Total PSPP: ~ 3‘600 MW
Waldeck II 440 MW
Nant de Drance PSPP 900 MW
Owner‘s Engineer ENEL 6.5 MW
Tiga 10 MW Challawa 25 MW
Bujagali 250 MW
Tehri PSPP 1000 MW Teesta VI 500 MW Pipalkoti 444 MW Chuzachen 110 MW Sainj 100 MW Rangit II 66 MW Lower Kalnai 48 MW
Yeywa 800 MW Upper PaungLaung 140 MW Baluchaung 3 52 MW Shweli 3 1050 MW
Subansiri 2000 MW
Son La 2400 MW
Nam Ngum II 615 MW
Xayabury 1260 MW
Ilisu 1200 MW
AVCE PSPP 185 MW
Devoll HPP 400 MW
PIVA HPP 360 MW
Ibar HPP 100 MW
Dam Safety Albania
Rehab of Six HPP
56
Karuma 600 MW
Tulila 10 MW
Flateland 9 MW
Nikachhu 120 MW
Middle Modi 15.1 MW
Lamtakong PSPP +500 MW
Siah Bishe PSPP 1040 MW

Siah-Bishe PSPP, Iran
• 2003 – 2009
• 1’040 MW
ÅF`s role
• Tendering and Contracting
Services
• Project Management/Design
Review
• Management Control
• Design Review/Approval
• Transfer of Technology
• Construction Management
Support
57

Siah-Bishe PSPP, Iran
Key Characteristics:
• Upper Dam
• CFRD
• Height 85 m
• Crest El. 2’410 m a s l
• Dam volume 1.4 Mio. m3
• Reservoir volume 3.5 Mio. m3
• Lower Dam
• CFRD
• Height 106.5 m
• Crest El. 1’911.5 m a s l
• Dam volume 4.93 Mio. m3
• Reservoir volume 3.6 Mio. m3
58

Siah-Bishe PSPP, Iran
Key Characteristics:
• Headrace tunnel: 2 x Ø 5.7 m;
2’015 m and 1’973 m
• Pressure shaft: 2 x Ø 5.0 m;
760 m
• Max. Gross Head: 520 m
• Number of Unit: 4 with total
Capacity of 1’040 MW in
underground powerhouse
• Type of Machine: 4 vertical
Francis pump-turbine
• Rated flow turbine operation:
260 m3/s
• Rated flow pump operation:
200 m3/s
59

Tehri PSPP, India
• 2016 – ongoing • 1000 MW
ÅF`s role
• Detailed Design Review and Design Updates for the EPC Contractor
• Preparation Design Updates for
• Powerhouse & busduct Tunnels
• BVC and PAC Caverns
• U/S & D/S Surge Shaft Chambers
• U/S & D/S Surge Shafts
• Bus bar Cavern
• TRT Outfall Structures
• Lower PAC
• Ventilation Tunnels
• Upper and Lower Penstock Tunnel/Shaft
• Preparation of TOR Model Studies • Update of Geological & Geotechnical
Reports & Mappings
60

Tehri PSPP, India
Key Characteristics:
• Entire Scheme Underground, connecting
two existing reservoirs
• Transformer Cavern shared with the
associated 1000 MW conventional
Hydropower Scheme
• Design Head: 188 m
• Rated Unit Capacity 250 MW
• Number of Unit: 4 with total Capacity of
1000 MW
• Type of Machine: Variable Speed, vertical
• Size of Power Cavern (LxWxH): 201 m x
25.4 m x 57.3 m
61

• 2017 – ongoing
• 2’400 MW
ÅF`s role
• Owners Engineer
• Project management including project
control of legal and finance of related
technical aspects;
• Engineering review of EPC concept and
detail design deliverables;
• Quality control, assurance services and
supplier surveillance;
• Construction monitoring, supervision and
management;
• Commissioning and start-up supervision.
62
Attaqa PSPP, Egypt

63
Attaqa PSPP, Egypt
Key Characteristics:
- 6 x 400 MW reversible pump/turbine units
for a total capacity of 2,400 MW;
- 600 m of gross head;
- Upper and Lower freshwater reservoirs with
dams), each with a live storage volume of 7.3
Mio m³;
- 6 large diameter high pressure penstocks;
- Underground powerhouse;
- Underground surge chamber(s);
- A high voltage transmission line and
substation;
- Upper and Lower intakes/outlet structures
- All associated mechanical equipment
including gates, trash racks and valves.

Atdorf PSPP, Germany
• 2011 – 2018
• 1’400 MW
ÅF`s role
• Review of Feasibility and Basic
Design
• Basic-, tender- and construction
design
• Design review for main
equipment
• Site engineering and
management
• Site inspection and monitoring
• Shop inspection
• Tests & commissioning
64

Atdorf PSPP, Germany
Key Characteristics:
• Dams: RCC Main Dam / 2
Retention Dams
• New Cavern
• New artificial Upper Reservoir
with
9 Mio m3 Volume
• New artificial Lower Reservoir
with
9 Mio m3 Volume
• Net Head: 620 m
• Number of Units: 6 with total
Capacity of 1’400 MW
• Type of Machine: Variable
Speed Asynchronous
65

Koralm PSPP, Austria
• 2015 – 2022
• 940 MW (4 x 235 MW)
ÅF`s role
• Concept review
• Feasibility study
• Overall project management
• Basic, tender and construction
design
• Design review for main
equipment
• Site engineering and
management
• Site inspection and monitoring
• Tests & commissioning
66

Koralm PSPP, Austria
Key Characteristics:
• Upper reservoir • Capacity: 4.6 Mio. m³ • Earth fill dam 87 m • Crest length 640 m
• Upper tunnel • Length 1’100 m, diameter 8.8 m
• Vertical shaft • Length 650 m, diameter 5.4 m
• Cavern powerhouse
• Type of Machine: 4 Ternary machine sets à 235 MW
• Lower tunnel
• Length 3’900 m, diameter 7.0 m
• Lower reservoir • Capacity: 4.6 Mio. m³
• Max. Head: 653 m • Rated flow per unit: 38.7 m3/s
67
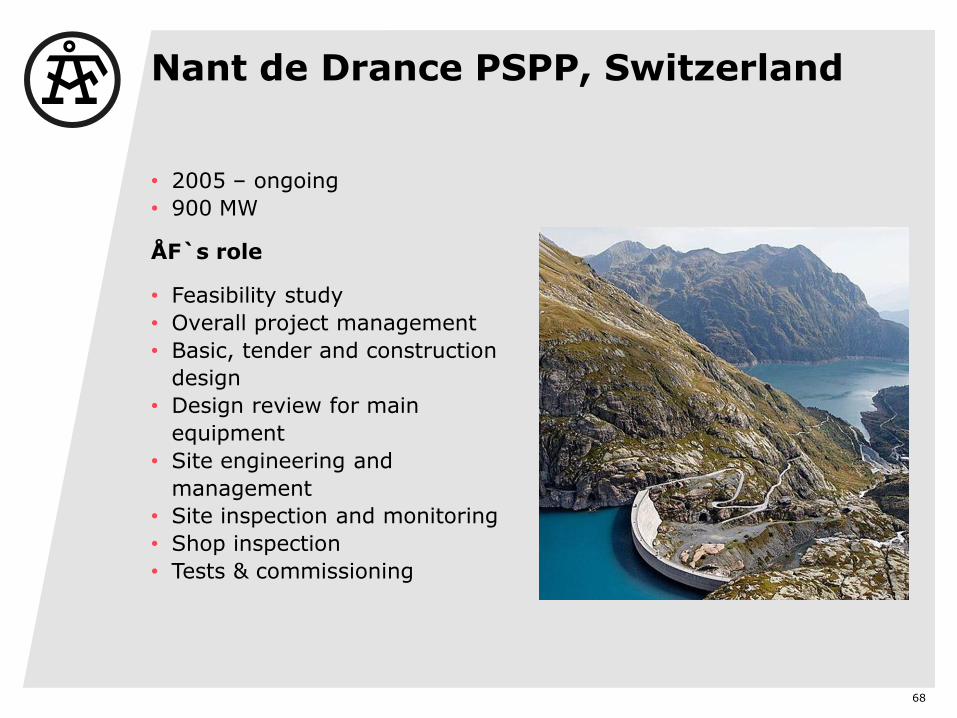
Nant de Drance PSPP, Switzerland
• 2005 – ongoing
• 900 MW
ÅF`s role
• Feasibility study
• Overall project management
• Basic, tender and construction
design
• Design review for main
equipment
• Site engineering and
management
• Site inspection and monitoring
• Shop inspection
• Tests & commissioning
68

Nant de Drance PSPP, Switzerland
Key Characteristics:
• Construction stage
• Dam: Arch Dams (existing)
• Dam height • Upstream: 20 m to be increased (64 m)
• Downstream: 185 m (existing)
• Upstream reservoir capacity: 22
Mio. m3
• Max. Head: 390 m
• Number of Unit: 6 with total
Capacity of 900 MW
• Type of Machine: Variable
Speed Asynchronous
• Rated flow per unit: 60 m3/s
69

Nant de Drance PSPP, Switzerland
70

Nant de Drance PSPP, Switzerland
71

Nant de Drance PSPP, Switzerland
Main Structures – Upper Valve Chamber
Inspection-/ Revisions shaft
Butterfly valve DN 6’000 255 t
Longitudinal section upper valve chamber
Vertical shaft
58 m
18 m
Gantry crane Cap. = 125 t
Upper bend

Nant de Drance PSPP, Switzerland
Upper Valve Chamber
Upper valve chamber:
L x B x H: 70 m x 16 x 18 m, V: ~ 20’000
m3
Hosts butterfly valves
Design factor: Size of steel components

Nant de Drance PSPP, Switzerland
74
Vertical Shaft
• Height [m]: 444
• Inner diameter [m]: 7.0
• Average flow velocity [m/s]: 4.7
Section Widening of shaft

Nant de Drance PSPP, Switzerland
75
Vertical Shaft – Excavation method
Process description (Zmölnig, M. (2014): Vertical Shafts of Nant de Drance)
3. Drill & blast to 8 m
2. Raise-drill 2.4 m
1. Pilot drilling

Nant de Drance PSPP, Switzerland
76
Vertical Shaft
Raise-boring-equipment (Stakne, P. et al. (2014): Alpine Experience of Shaft Construction and Shaft Grouting)

Nant de Drance PSPP, Switzerland
Excavation method:
1. Pilot drilling
2. Raise-drill 2.4 m
3. Drill & blast to 8 m
Vertical Shaft – Pilot drilling

Nant de Drance PSPP, Switzerland
Vertical Shaft – Raise-drill 2.4 m
Excavation method:
1. Pilot drilling
2. Raise-drill 2.4 m
3. Drill & blast to 8 m

Nant de Drance PSPP, Switzerland
79
Powerhouse Cavern Design with BIM (Building Information Modelling)
• Length [m]: 194
• Width [m]: 30.5
• Height [m]: 53
• Excavation volume [m3]: 272’000
Powerhouse main floor (2016) Concreting phase (2015)

Nant de Drance PSPP, Switzerland
Powerhouse Cavern
Powerhouse cavern: 6 vario-speed
pump turbines 150 MW each
L x B x H: 194 x 30.5 x 53 m

Nant de Drance PSPP, Switzerland
81
Powerhouse Cavern – 3D Modelling & Clash Detection (BIM)
Turbine pit Oil separator
Powerhouse & transformer caverns Piping and ducting systems
Pump sump

105 m
Reservoir operation at Emosson (1997 - 2011)
Construction Platform
Final Position of Intakes
Construction of the Lower Intakes
Nant de Drance PSPP, Switzerland

Nant de Drance PSPP, Switzerland
83
Construction of the Lower Intakes
Several Construction Methods were
studied:
• In situ with fresh concrete or
prefabricated concrete elements
• Construction on a platform and
transport of the final intakes to
their final position
Lower intakes – construction phase Lower intake floated into its final position

Nant de Drance PSPP, Switzerland
84
Construction of the Lower Intakes

Nant de Drance PSPP, Switzerland
85
Placing the Lower Intakes

Hydro Power Thank you and welcome to ÅF
Visiting Address: AF-Consult India Pvt. Ltd. | Office No. 19, (GF) Tower-1, Stellar IT Park, Sector-62 | Noida | India www.afconsult.com
ÅF, Hydro Power Visiting Address: AF-Consult Switzerland Ltd.| Täfernstrasse 26 | CH-5405 Baden | Switzerland www.afconsult.com

Self-Scheduling of Pumped-StorageHydro Power Generation in Electric Power Markets
P. KanakasabapathyAssociate Professor
Department of Electrical Engineering
February 9, 2018

Outline of Presentation
1 IntroductionPumped-Storage Power Plant & Competitive Electricity MarketRegulatory Price Regime Vs Electricity Market RegimeObjective and Scope of Pumped Storage Self-Scheduling
2 Self-Scheduling in Pool-Based Electricity MarketMathematical Model of Plant OperationCase Study-I: Optimization using Sequential SchedulingCase Study-II: Optimization using ETPSO
3 Self-Scheduling in Combined Pool-Bilateral Market
4 Market Uncertainty and Risk
5 Impact of Pumped-Storage on Market Social Welfare
6 Conclusions
Amrita Vishwa Vidyapeetham 1/ 38

Introduction
Pumped Storage Power Plant
Figure: 1. Schematic Diagram of Pumped Storage Plant
Large-scale energy storage technology
Still in active operation because of its operational flexibility
Provide rapid response to changes in system loading or spot price
Take part in energy markets and ancillary services markets
Amrita Vishwa Vidyapeetham 2/ 38

Introduction
Pumped Storage Power Plant
Figure: 1. Schematic Diagram of Pumped Storage Plant
Large-scale energy storage technology
Still in active operation because of its operational flexibility
Provide rapid response to changes in system loading or spot price
Take part in energy markets and ancillary services marketsAmrita Vishwa Vidyapeetham 2/ 38

Introduction
Reforms in Energy Sector
Figure: 2. Classical Power Systems
Market based environment
Competitive energy trading
Figure: 3. Restructured Power Systems
Open access of infrastructure and improved reliability of service
Distinct energy and ancillary service products - Additional sources ofrevenue - Choice of market that returns the highest profit
Amrita Vishwa Vidyapeetham 3/ 38

Introduction
Electricity Market Models
Bilateral Contracts Model
Specific contracts betweensupplier and consumer
Appropriate access andtransmission pricing standards
Transfer the traded power overtransmission utility
PoolCo Model
Pool of producers and customersserved by transmission system
Competition among utilities totrade power
Centralized market place (Px)clears the market and define theMarket Clearing Price (MCP)
Hybrid Model
Combines the features ofprevious two market models
Choice of bilateral contracts andpower pool
Power pool serve all buyers andsellers who choose to compete
Types of Markets
Day-ahead, Hour-ahead and RealTime Energy Markets
Capacity based AncillaryServices Markets (TMSR,TMNSR, TMOR)
Voltage regulation and reactivepower support services
Amrita Vishwa Vidyapeetham 4/ 38

Introduction
Pumped-Storage in Competitive Market
Highly variable, cyclical grid demand as well as the energy price inelectricity markets
Growing reliance on intermittent renewable energy sources like wind andphoto-voltaic generation
Frequent situations of surplus power generation to cater the available load[Ontario - Sep. 2006]
Market opportunities for energy storage systems - better energymanagement in the fields of micro grids and distributed generation
Ability to purchase low cost power whenever it is available and sellwhenever there is high demand
Pumped-storage can provide efficiently the ancillary grid services, such asreserve generation and network frequency control
Amrita Vishwa Vidyapeetham 5/ 38

Regulatory Price Regime Vs Electricity Market Regime
Literature Review
Regulatory Price Regime
All the units including pumped-storage are owned by single entity
Pumped storage is scheduled to replace high cost (thermal/gas/diesel)energy during peak loads - Hydro-thermal coordination
Cost of the energy replaced - Performance measure
Marginal cost method & peak-shaving algorithm
Electricity Market Regime
Optimal strategy towards maximizing the personal benefit foroperating in a competitive environment
Determination of the optimal bids for generation (MW ) andcorresponding price ($/MW )
Suitable time slot for storage plant to operate as generator and pump
Profit maximization from energy and ancillary services markets
Amrita Vishwa Vidyapeetham 6/ 38

Regulatory Price Regime Vs Electricity Market Regime
Literature Review
Strategic Bidding
Based on forecasted MCP in thesubsequent trading periods
Based on estimations of biddingbehaviour of rival participants
Based on the game theory
Figure: 4. Distributions of Day-aheadHourly Market Clearing Price (MCP)
Motivation
Distribution of MCP - Exploitation of cyclic patterns of market pricedynamics
In a typical market, real time energy trading < 5%, and the remainingis traded in the bilateral contracts and the day-ahead energy market
Strong incentives for pumped-storage to develop bidding strategy andoptimize self-schedule for energy and ancillary services trades
Amrita Vishwa Vidyapeetham 7/ 38

Regulatory Price Regime Vs Electricity Market Regime
Literature Review
Strategic Bidding
Based on forecasted MCP in thesubsequent trading periods
Based on estimations of biddingbehaviour of rival participants
Based on the game theory Figure: 4. Distributions of Day-aheadHourly Market Clearing Price (MCP)
Motivation
Distribution of MCP - Exploitation of cyclic patterns of market pricedynamics
In a typical market, real time energy trading < 5%, and the remainingis traded in the bilateral contracts and the day-ahead energy market
Strong incentives for pumped-storage to develop bidding strategy andoptimize self-schedule for energy and ancillary services trades
Amrita Vishwa Vidyapeetham 7/ 38

Pumped Storage Self-Scheduling
Objectives1 Development of optimal bidding strategy - day-ahead pool based
and hybrid electricity markets
2 Formulation of mathematical model and suitable algorithm toimplement the strategy and maximize the profit
3 Management of uncertainties and investigation of the impact ofoperating pumped-storage plants in the market social welfare
Scope
Limited to independent pumped storage power plant, which is aprice taker and do not possess any market power
Study relies on forecasted MCP
Only the reserve markets which are attractive for pumped-storage are considered (TMSR, TMNSR and RFRR)
Data representing specific plants & specific market - Conceptsand techniques developed could have general application
Amrita Vishwa Vidyapeetham 8/ 38

Self-Scheduling in Pool-Based Electricity Market
Concept of Marginal Cost
It is economical to make an offer of ηp MWh generation during tg hours, ifthere exists a time duration of tp hours to bid for buying 1 MWh, suchthat the ratio of the MCPs during pumping and generating is less than theplant cycle efficiency ηp
Figure: 5. Market Clearing Price curve.(a) Daily MCP, (b) Composite MCP
Economic Constraint
Bg ≥ Bpηp
∼= Bg ≥ 1.5 Bp (1)
Operating Time Constraint
tpmax =T − (Ein/Pg)
1 + ηp (Pp/Pg)(2)
Making energy balance, tg for any giventp can be estimated
Amrita Vishwa Vidyapeetham 9/ 38

Self-Scheduling in Pool-Based Electricity Market
Mathematical Model
Figure: 8. Bidding space diagramfor energy and ancillary services
P =
tg∑i=1
Pg(i)Bg(i)
+
tp∑j=1
Prs(j)Brs(j)
+
(T−tp−tg)∑k=1
Pg(k)Brn(k)
−tp∑m=1
Pp(m)Bp(m)
−(tg+tp)∑n=1
Co(n)
−Cm
(3)
Energy Market
Revenue from energytrading during thegenerating mode
Syn-Reserve Market
Revenue by reducingpumping power duringthe pumping mode
Non-syn Res. Market
Revenue from non-synreserve bids when theunit is off-line
Energy Market
Payment for energyprocurement during thepumping mode
Operating Cost
Running expenditureduring pumping andgenerating (tp + tg)
Fixed Cost
Fixed expendituresincluding maintenancefor the total period T
Amrita Vishwa Vidyapeetham 10/ 38

Self-Scheduling in Pool-Based Electricity Market
Mathematical Model
Figure: 8. Bidding space diagramfor energy and ancillary services
P =
tg∑i=1
Pg(i)Bg(i) +
tp∑j=1
Prs(j)Brs(j)
+
(T−tp−tg)∑k=1
Pg(k)Brn(k)
−tp∑m=1
Pp(m)Bp(m) −(tg+tp)∑n=1
Co(n) −Cm
(3)
Energy Market
Revenue from energytrading during thegenerating mode
Syn-Reserve Market
Revenue by reducingpumping power duringthe pumping mode
Non-syn Res. Market
Revenue from non-synreserve bids when theunit is off-line
Energy Market
Payment for energyprocurement during thepumping mode
Operating Cost
Running expenditureduring pumping andgenerating (tp + tg)
Fixed Cost
Fixed expendituresincluding maintenancefor the total period T
Amrita Vishwa Vidyapeetham 10/ 38

Case Study: Optimization using Sequential Scheduling
Lewiston-NiagaraPumped Storage PlantNew York Power Authority
Plant Data
Capacity = 200 − 300 MW ,
Pp = 250 MW , ηp = 0.6667
Reservoir Data
Head = 20 − 30 m, Emin = 100 MWh,
Emax = 1500 MWh, E0 = 100 MWh
Market Data
Price Forecasts: NYISOMCP of New York Central region,Reserve Market Prices:
Brs = 6 $/MWh and
Brn = 0.5 $/MWh
Daily operating strategy
Figure: 9. Expected energy storage
Figure: 10. Variation of expected profit
Amrita Vishwa Vidyapeetham 11/ 38

Case Study: Optimization using Sequential Scheduling
Lewiston-NiagaraPumped Storage PlantNew York Power Authority
Plant Data
Capacity = 200 − 300 MW ,
Pp = 250 MW , ηp = 0.6667
Reservoir Data
Head = 20 − 30 m, Emin = 100 MWh,
Emax = 1500 MWh, E0 = 100 MWh
Market Data
Price Forecasts: NYISOMCP of New York Central region,Reserve Market Prices:
Brs = 6 $/MWh and
Brn = 0.5 $/MWh
Daily operating strategy
Figure: 9. Expected energy storage
Figure: 10. Variation of expected profitAmrita Vishwa Vidyapeetham 11/ 38

Case Study: Optimization using Sequential Scheduling
Daily Operating Strategy
Table: I. Optimal bidding strategy and bidsin MW (4-10 May 2008)
‘-’ sign indicates pumping
‘+’ sign indicates generating
Table: II. Result summary: 4-10 May 2008
Daytp tg Profit Emax
s(h) (h) ($) (MWh)
Sun 6 4 45615 1100Mon 6 4 31261 1100Tues 4 3 20299 770Wed 4 3 30063 770Thu 4 3 19607 770Fri 4 3 21109 770Sat 4 3 28159 770Total 32 23 196113 -
Plant generates more during peakMCP period and pumps more whenMCP is low
Energy balance is maintained at theend of each day
Energy storage capacity limit is notviolated
Amrita Vishwa Vidyapeetham 12/ 38

Case Study: Optimization using Sequential Scheduling
Weekly Operating Strategy
Figure: 11. Expected energy storage
Figure: 12. Variation of expected profit
Plant generates more on thelater part of week and pumpsmore on early part of the week
Energy balance is maintainedonly at the end of the week
Amrita Vishwa Vidyapeetham 13/ 38

Case Study: Optimization using Sequential Scheduling
Weekly Operating Strategy
Table: III. Optimal bidding strategy andbids in MW (4-10 May 2008)
‘-’ sign indicates pumping
‘+’ sign indicates generating
Table: IV. Summary of results: Daily andWeekly operating strategies (4-10 May 2008)
Pumping power Pp kept constant at 250 MW
Strgy.tp tg Pav
g Profit(h) (h) (MW ) ($)
Daily 32 23 223.48 196113Weekly 34 23 237.83 224036
Emaxs : − Daily:1100 Weekly:1500 MWh
Pmaxg : − Daily: 250 Weekly: 270 MW
Table: V. Comparison of bidding strategies
Strategytp tg Profit(h) (h) ($)
Trad. operation 42 28 177805Fixed schedule 42 28 211143Const. power bid 34 23 215140Proposed strgy. 34 23 224036
Amrita Vishwa Vidyapeetham 14/ 38
Case Study: Optimization using Sequential Scheduling
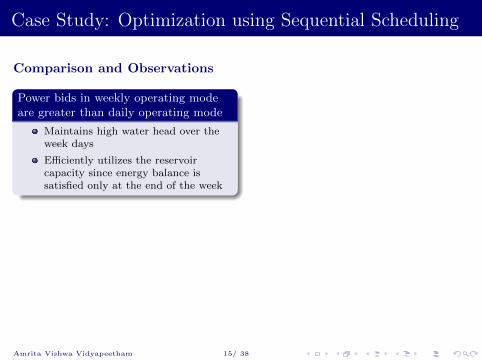
Comparison and Observations
Power bids in weekly operating modeare greater than daily operating mode
Maintains high water head over theweek days
Efficiently utilizes the reservoircapacity since energy balance issatisfied only at the end of the week
Maximum energy stored in upperreservoir in respect of daily operatingmode is comparatively less
Reservoir energy balance ismaintained every day
Whatever energy stored is evacuatedin the same day
The pumping and generating time ofdaily operating mode are less
Margin between the MCP of energybids during pumping and generatingmodes should be economicallymaintained
In weekly operating mode the MCPvariations and the price margin arehigh when compared to the dailyoperating mode
More profit in weekly operating mode
Energy prices in the beginning of theweek are lower than the later part
Water stored during the beginning ofthe week is retained and used later
Amrita Vishwa Vidyapeetham 15/ 38

Case Study: Optimization using Sequential Scheduling
Comparison and Observations
Power bids in weekly operating modeare greater than daily operating mode
Maintains high water head over theweek days
Efficiently utilizes the reservoircapacity since energy balance issatisfied only at the end of the week
Maximum energy stored in upperreservoir in respect of daily operatingmode is comparatively less
Reservoir energy balance ismaintained every day
Whatever energy stored is evacuatedin the same day
The pumping and generating time ofdaily operating mode are less
Margin between the MCP of energybids during pumping and generatingmodes should be economicallymaintained
In weekly operating mode the MCPvariations and the price margin arehigh when compared to the dailyoperating mode
More profit in weekly operating mode
Energy prices in the beginning of theweek are lower than the later part
Water stored during the beginning ofthe week is retained and used later
Amrita Vishwa Vidyapeetham 15/ 38

Case Study: Optimization using ETPSO
Blenheim-GilboaPumped Storage ProjectNew York Power Authority
Plant Data
Capacity = 4 ∗ 260 MW ,
Pp = 250 MW , ηp = 0.6667
Reservoir Data
Head = 300 − 330 m,
Emin = 1000 MWh,
Emax = 8000 MWh, E0 = 1000 MWh
Market Data
Price Forecasts: NYISOMCP of New York Central region,Reserve Market Prices:
Brs = 6 $/MWh Brn = 0.5 $/MWh
ETPSO-Convergence characteristics
Figure: 16. Daily operating Mode
Figure: 17. Weekly operating mode
Amrita Vishwa Vidyapeetham 16/ 38

Case Study: Optimization using ETPSO
Results and Discussion
Figure: 18. Energy storage with respect totime
Table: VI. Optimal bidding schedule (22-28June 2008)
‘-’ sign indicates pumping
‘+’ sign indicates generating
Amrita Vishwa Vidyapeetham 17/ 38

Case Study: Optimization using ETPSO
Results and Discussion
Figure: 18. Energy storage with respect totime
Table: VI. Optimal bidding schedule (22-28June 2008)
‘-’ sign indicates pumping
‘+’ sign indicates generating
Amrita Vishwa Vidyapeetham 17/ 38

Case Study: Optimization using ETPSO
Results and Discussion
Figure: 19. Optimal power bids (22-28 June 2008) (a) Daily operating strategy, (b) Weeklyoperating strategy
Amrita Vishwa Vidyapeetham 18/ 38

Case Study: Optimization using ETPSO
Comparison of Results
Two operating schedules:Daily and weekly
Effective reservoir utilizationin weekly scheduling
ETPSO: Stochastic method -statistical evaluation
Performance of ETPSO iscompared with otherevolutionary techniques
Explores optimal time slotsfor self-scheduling
With increased problemdimensionality, ETPSO givescomparatively faster solution
Table: VII. Performance of sequential and ETPSOmethodologies
S - Schedule; D - Daily; W - Weekly
Pumping power Pp kept constant at 250 MW
Stp tg Pavg Expec. Exe.(h) (h) (MW ) Profit($) time(s)
PSO
D 42 35 202.46 565254 9.78W 44 29 237.92 575299 709.45
Genetic Algorithm (GA)
D 42 35 200.38 565260 7.12W 43 29 236.37 575311 517.34
Sequential Methodology (SM)
D 42 35 203.93 565246 1.08W 45 30 239.67 575276 533.94
Proposed ETPSO
D 41 35 199.14 565268 4.44W 42 28 235.71 575376 350.86
Amrita Vishwa Vidyapeetham 19/ 38

Self-Scheduling in Combined Pool-Bilateral Market
Hybrid Market Model
Combines the features of pool-based market and the bilateral contracts
End-users have flexibility to purchase from either the pool or directlyfrom the suppliers by exercising bilateral contracts
Energy Market Sub-problem
Includes trading of power, both in bilateral contract and competitive market∑t∈T
B(t) P (t) =
tbg∑i=1
P bg (i) Bb
g(i)−tbp∑j=1
P bp (j) Bb
p(j)+
tpg∑m=1
Pg(m) Bg(m)−tpp∑
n=1
Pp(n)Bp(n) (4)
Where,
Contract power during generating mode = P bg (t) ∀ t ∈ T
Contract power during pumping mode = P bp (t) ∀ t ∈ T
Amrita Vishwa Vidyapeetham 20/ 38

Self-Scheduling in Combined Pool-Bilateral Market
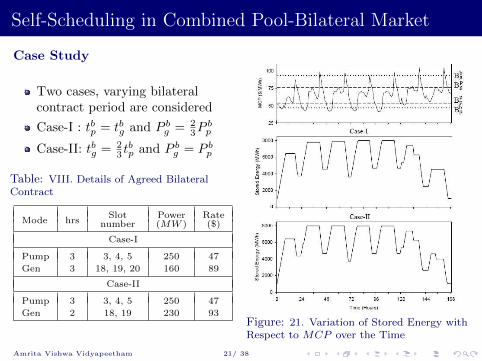
Case Study
Two cases, varying bilateralcontract period are considered
Case-I : tbp = tbg and P bg = 2
3Pbp
Case-II: tbg = 23 t
bp and P b
g = P bp
Table: VIII. Details of Agreed BilateralContract
Mode hrsSlot Power Rate
number (MW ) ($)
Case-I
Pump 3 3, 4, 5 250 47
Gen 3 18, 19, 20 160 89
Case-II
Pump 3 3, 4, 5 250 47
Gen 2 18, 19 230 93Figure: 21. Variation of Stored Energy withRespect to MCP over the Time
Amrita Vishwa Vidyapeetham 21/ 38

Self-Scheduling in Combined Pool-Bilateral Market
Case Study
Two cases, varying bilateralcontract period are considered
Case-I : tbp = tbg and P bg = 2
3Pbp
Case-II: tbg = 23 t
bp and P b
g = P bp
Table: VIII. Details of Agreed BilateralContract
Mode hrsSlot Power Rate
number (MW ) ($)
Case-I
Pump 3 3, 4, 5 250 47
Gen 3 18, 19, 20 160 89
Case-II
Pump 3 3, 4, 5 250 47
Gen 2 18, 19 230 93
Figure: 21. Variation of Stored Energy withRespect to MCP over the Time
Amrita Vishwa Vidyapeetham 21/ 38
Self-Scheduling in Combined Pool-Bilateral Market
Case Study
Two cases, varying bilateralcontract period are considered
Case-I : tbp = tbg and P bg = 2
3Pbp
Case-II: tbg = 23 t
bp and P b
g = P bp
Table: VIII. Details of Agreed BilateralContract
Mode hrsSlot Power Rate
number (MW ) ($)
Case-I
Pump 3 3, 4, 5 250 47
Gen 3 18, 19, 20 160 89
Case-II
Pump 3 3, 4, 5 250 47
Gen 2 18, 19 230 93Figure: 21. Variation of Stored Energy withRespect to MCP over the Time
Amrita Vishwa Vidyapeetham 21/ 38
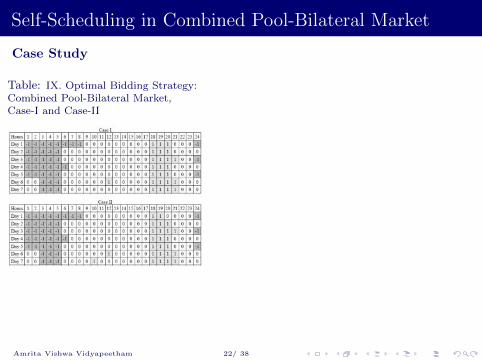
Self-Scheduling in Combined Pool-Bilateral Market
Case Study
Table: IX. Optimal Bidding Strategy:Combined Pool-Bilateral Market,Case-I and Case-II
Figure: 22. Optimal Power Bids andOffers for Case-I and Case-II
Amrita Vishwa Vidyapeetham 22/ 38

Self-Scheduling in Combined Pool-Bilateral Market
Case Study
Table: IX. Optimal Bidding Strategy:Combined Pool-Bilateral Market,Case-I and Case-II
Figure: 22. Optimal Power Bids andOffers for Case-I and Case-IIAmrita Vishwa Vidyapeetham 22/ 38

Self-Scheduling in Combined Pool-Bilateral Market
Comparison and Observations
Table: X. Result Summary: Plant OperatingTime
Pumping Time (hrs) Gen Time (hrs)
tbp tpp tp∗p tp tbg tpg tp∗g tg
Pool Market Trading [Ning Lu]
- 35 - 35 - 22 - 22
Combined Pool-Bilateral Market: Case-I
21 17 0 38 21 24 4 25
Combined Pool-Bilateral Market: Case-II
21 17 0 38 14 23 11 25
tp∗p and tp∗g indicate respective time periodsexcluding the time period overlapped withbilateral contracts
Case-II provides more flexibility for theoperator to trade in the pool market
Table: XI. Economic Comparison ofCombined Pool-bilateral Market
Revenues in $
Category PoolHybrid Market
Market Case-I Case-II
Bilateral - 209160 210840
Pool 443473 243611 285024
Syn Res 210000 224100 218400
Non-syn 59940 55965 56790
Total 713413 732836 771054
Profits from various energy and ancillaryservice market sources
Case-II has proven profitable due to highdegree of liberty
Amrita Vishwa Vidyapeetham 23/ 38

Market Uncertainty and Risk
Major uncertainties affecting pumped-storage self-scheduling
1 Uncertainty of energy market price forecast
2 Uncertainty of power delivery request from ancillary services markets
Uncertainty of MCP forecast
Characterized by the variances ofMCP of Energy and reserve markets.
Self-scheduling problem is formulatedby recognizing a measure of risk byintroducing a rick tolerance factor β
Impact of risk penalty factors onexpected profit is investigated
Figure: 23. Expected profit on variable riskfactors
Amrita Vishwa Vidyapeetham 24/ 38

Market Uncertainty and Risk
Uncertainty of ancillary services power delivery request
Successive self-scheduling using thesliding window technique to adjustthe operation schedule of pumped-storage plant
Dynamic updation of self-schedulingproblem
Considering the modified upperreservoir storage due to the deliveredancillary services in the previous dayand the forecast of the day-aheadmarkets
Updated before the beginning of anew day for next consecutive days ofthe scheduling period, i.e. for next168 h
Figure: 24. Self-scheduling with uncertainpower delivery request
Amrita Vishwa Vidyapeetham 25/ 38

Impact of Pumped-Storage on Market Social Welfare
Concept of social welfare
Figure: 25. Consumer and producersurplus
Producers able to supply at lowercost than the MCP Pm
Consumers willing to pay morethan the actual MCP
Amount of trade above themarginal cost
Residual Demand / Supply
Figure: 26. Residual Demand / Supply Curve
Residual demand facing the generator
DRi(pi) =
n∑j=1,j 6=i
(Dj(pj) − Sj(pj)) (5)
Residual supply facing the pump load
SRi(pi) =
n∑j=1,j 6=i
(Sj(pj) −Dj(pj)) (6)
Amrita Vishwa Vidyapeetham 26/ 38
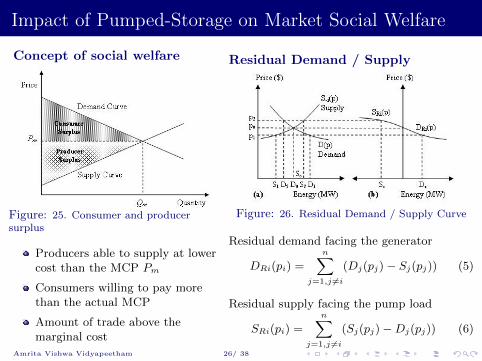
Impact of Pumped-Storage on Market Social Welfare
Concept of social welfare
Figure: 25. Consumer and producersurplus
Producers able to supply at lowercost than the MCP Pm
Consumers willing to pay morethan the actual MCP
Amount of trade above themarginal cost
Residual Demand / Supply
Figure: 26. Residual Demand / Supply Curve
Residual demand facing the generator
DRi(pi) =n∑
j=1,j 6=i
(Dj(pj) − Sj(pj)) (5)
Residual supply facing the pump load
SRi(pi) =n∑
j=1,j 6=i
(Sj(pj) −Dj(pj)) (6)
Amrita Vishwa Vidyapeetham 26/ 38

Impact of Pumped-Storage on Market Social Welfare
Plant Operating as Pump Load
Figure: 27. Social Welfare Analysis: PlantOperating as Pump Load
Loss of consumer surplus =δPp2
(q−i + q′−i)
Gain of producer surplus =δPp2
(q0 + q−i)
Increase in social welfare =δPp2
(q0 − q′−i)
where δPp = (p0 − p−i) $.
Plant Operating as Generator
Figure: 28. Social Welfare Analysis: PlantOperating as Generator
Loss of producer surplus =δGp2
(q−i + q′−i)
Gain of consumer surplus =δGp2
(q0 + q−i)
Increase in social welfare =δGp2
(q0 − q′−i)
where δGp = (p−i − p0) $.
Amrita Vishwa Vidyapeetham 27/ 38
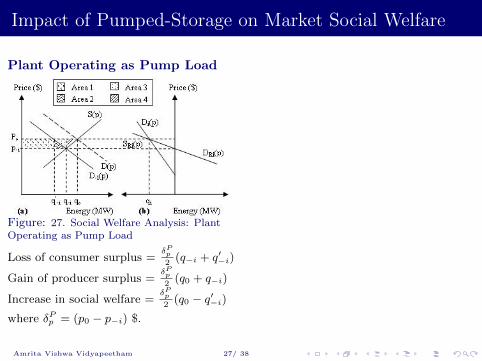

Impact of Pumped-Storage on Market Social Welfare
Impact on Social Welfare of Market
Pumping mode: Increase in producer surplus, decrease in consumersurplus, i.e. Benefits producers at the expense of consumers
Generating mode: Increase in consumer surplus, decrease in producersurplus, i.e. benefits consumers at the expense of producers
Pumping and generating mode: Increase net industry welfare
Introduces more competition in the market, increase market social welfareby redistributing the resources across time
Stabilize the energy prices and reduce the MCP swing over the time
Amrita Vishwa Vidyapeetham 28/ 38

Impact of Pumped-Storage on Market Social Welfare
Case Study
Figure: 29. Electricity Market withPumped Storage Hydro-Power Plant
System Data
IEEE 118 Bus Test System
No. of dispatchable generators : 53
No. of dispatchable loads : 32
No. of non-dispatchable loads : 66
No. of pumped storage plants : 01
On-line generation capacity : 9470 MW
Fixed Load (Non-dispatchable) : 3051 MW
Pumped storage plant capacity : 1000 MW
Market auction clearing mechanism take set of offers and bids in blocks
These blocks converted into corresponding generator capacities and costs
OPF solution - for clearing the market and find generator allocations,loads to be dispatched along with nodal prices
Uniform pricing equal to LAO is followed for computation of nodal prices
Amrita Vishwa Vidyapeetham 29/ 38

Impact of Pumped-Storage on Market Social Welfare
Pumped Storage Plant Operating as Pump Load
Figure: 30. Variation in LMP
LMP increases as the pumpedstorage load increases
Bus-66 LMP move towardsmaximum and reaches maximumwhen the pump load = 850 MW
Figure: 31. Variation in Market Dispatch
Rate of increase in market dispatchis less than that of pump load
Consumers have negative impactthat a fraction of thier dispatch istaken by pumped storage now
Amrita Vishwa Vidyapeetham 30/ 38
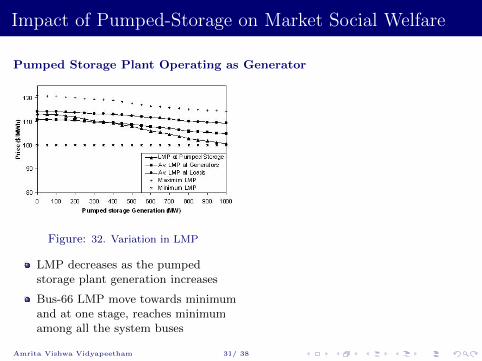
Impact of Pumped-Storage on Market Social Welfare
Pumped Storage Plant Operating as Generator
Figure: 32. Variation in LMP
LMP decreases as the pumpedstorage plant generation increases
Bus-66 LMP move towards minimumand at one stage, reaches minimumamong all the system buses
Figure: 33. Variation in Market Dispatch
Rate of increase in market dispatchis less than pumped storage supply
Consumers have positive impact dueto the transfer of surplus fromproducers to consumers
Amrita Vishwa Vidyapeetham 31/ 38

Impact of Pumped-Storage on Market Social Welfare
Net Increase in Social Welfare
Figure: 34. Variation in producers andconsumers surplus along with net increase insocial welfare during pumping mode
Transfer of surplus from consumersto producers
Producers will have a positive impact
Other consumers will have negativeimpact
Figure: 35. Variation in producers andconsumers surplus along with net increase insocial welfare during generating mode
Transfer of surplus from producersto consumers
Consumers will have a positiveimpact
Other suppliers will have negativeimpact
Amrita Vishwa Vidyapeetham 32/ 38
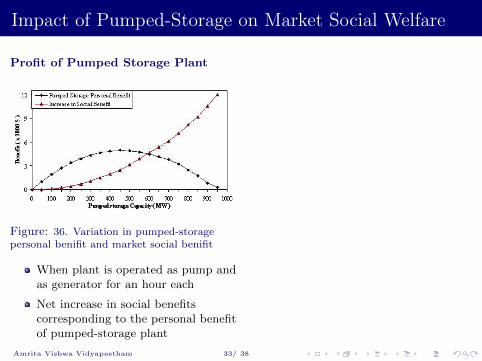
Impact of Pumped-Storage on Market Social Welfare
Profit of Pumped Storage Plant
Figure: 36. Variation in pumped-storagepersonal benifit and market social benifit
When plant is operated as pump andas generator for an hour each
Net increase in social benefitscorresponding to the personal benefitof pumped-storage plant
Market Price Stabilization
Figure: 37. Variation of difference in MCPbetween pumping and generating mode
MCP swing ∆p = δPp + δf + δGp
Pumped storage energy tradestabilizes the price swing in themarket over the time
Amrita Vishwa Vidyapeetham 33/ 38

Conclusions
1 Bidding strategy for pumped-storage plant to determine it’s optimalself-schedule and trade in an electricity market is developed
2 ETPSO based optimization algorithm which is adaptive for the variationin water head on generation level is developed
3 Validation of the proposed strategy on realistic pumped-storage powerplants has proven attractive
4 Uncertainty management - The probabilistic MCP forecast is handledwith trade-off between expected profit and risk, and uncertain ancillaryservices delivery request is addressed using the dynamic self-schedulingapproach
5 Inference on energy market shows that pumped-storage energy tradeincreases the net social welfare and stabilizes the market price dynamics
Amrita Vishwa Vidyapeetham 34/ 38

References
Ontario Power Generation Reports: Third Quarter Financial Results - 2006. News from
Ontario Power Generation Inc, Toronto, Nov. 2006. (Available online - www.opg.com)
G. H. McDaniel, A. F. Gabrielle, “Dispatching Pumped-Storage Generation”, IEEE Trans.
Power App. & Sys., May 1966, vol. PAS-85, no. 5, pp. 465-471.
A. K. David and F. S. Wen, Strategic bidding in competitive electricity markets: A
literature survey. In Proc. IEEE Power Engineering Society Summer Meeting, Apr. 2000,vol. 4, pp. 2168-2173.
R. Deb, “Operating Hydroelectric Plants and Pumped-Storage Units in a Competitive
Environment”, The Electricity Journal, vol. 13, no. 3, pp. 24-32.
N. Lu, J. H. Chow, and A. A. Desrochers, “Pumped-Storage Hydro-Turbine Bidding
Strategies in a Competitive Electricity Market”, IEEE Transactions on Power Systems,May 2004, vol. 19, no. 2, pp. 834-841.
A. I. Cohen, and S. H. Wan, “An Algorithm for Scheduling a Large Pumped-Storage Plant”,
IEEE Trans. Power App. & Sys., Aug. 1985, vol. PAS-104, no. 8, pp. 2099-2104.
R. W. de Mello, “Locational marginal pricing in practice, The New York experience”, IEEE
Power Engineering Society General Meeting-2006, pp. 1-4.
New York Independent System Operator Website. Available online: http://www.
nyiso.com/public/market data/pricing data.jsp.
J. Kennedy and R. Eberhart, “Particle swarm optimization”, Proc. IEEE Int. Conf. Neural
Networks, Dec. 1995, vol. 4, pp. 1942-1948.
Amrita Vishwa Vidyapeetham 35/ 38

Publications
Journals
1 P. Kanakasabapathy and K. Shanti Swarup, “Evolutionary Tri-state PSO for StrategicBidding of Pumped-Storage Hydro Electric Plant”, IEEE Transactions on Systems, Manand Cybernetics, Part C: Applications and Reviews, July. 2010, vol. 40, no. 4, pp.460-471.
2 P. Kanakasabapathy and K. Shanti Swarup, “Bidding Strategies for Pumped-Storage Plantin Pool-Based Electricity Market”, Energy Conversion and Management, Elsevier, Mar.2010, vol. 51, no. 3, pp. 572-579.
3 P. Kanakasabapathy and K. Shanti Swarup, “Three-Tier Market Model for RestructuringIndian Power Sector”, Journal of Institution of Engineers (India) - EL, Mar. 2009, vol.89, pp. 36-39.
4 P. Kanakasabapathy and K. Shanti Swarup, “Market Operations in Future IndianRestructured Power System Scenario”, International Journal of Energy Technology andPolicy, Feb. 2009, vol.7, No.1, pp.78-94.
Amrita Vishwa Vidyapeetham 36/ 38

Publications
Conferences
1 P. Kanakasabapathy and K. Shanti Swarup, “Pumped-Storage Bidding and its Impacts inCombined Pool-Bilateral Market”, International Conference on Power Systems(ICPS-2009), IIT Kharagpur, India, 27-29, Dec. 2009.
2 P. Kanakasabapathy and K. Shanti Swarup, “Impact of Pumped Storage in AncillaryServices Market of Restructured Power Systems”, National Conference on Advances inEnergy Conversion Technologies (AECT 2009), MIT Manipal, India, 2-4, Apr. 2009.
3 P. Kanakasabapathy and K. Shanti Swarup, “Impact of Pumped Storage on Spot Pricing ofReal and Reactive Power in Restructured Power Market”, National Conference onTechnological Advances and Computational techniques in Electrical Engineering (TACT2009) NIT Hamirpur, India, 14-17, Mar. 2009.
4 P. Kanakasabapathy and K. Shanti Swarup, “Optimal Bidding Strategies for PumpedStorage Plant in Pool-Based Electricity Market”, National Power System Conference(NPSC 2008) IIT Bombay, India, 16-18, Dec. 2008.
5 P. Kanakasabapathy and K. Shanti Swarup, “Optimal Bidding Strategies for Multi-unitPumped Storage Plant in Pool-Based Electricity Market Using Evolutionary Tristate PSO”,IEEE International Conference on Sustainable Energy Technologies (IEEE ICSET 2008)Singapore, 24-27, Nov. 2008.
6 P. Kanakasabapathy and K. Shanti Swarup, “Three-Tier Electricity Market Model forRestructuring Indian Power Sector”, International Conference on Power System Analysis,Control and Optimisation (PSACO-2008), Visakhapatnam, India, 13-15, Mar. 2008.
Amrita Vishwa Vidyapeetham 37/ 38

Amrita Vishwa Vidyapeetham 38/ 38

About WAPCOS
WAPCOS Experience in
Hydroelectric Projects
Pumped Storage Projects
Power Scenario- An Overview
Pumped Storage Technology- Description
What it Offers
Case Studies
Preparation of DPR- Latest Guidelines
Conclusion and Wayforward

WAPCOS Profile
Established under the aegis of
Ministry of Water Resources in June 1969 under
Companies Act, 1956
To share India’s experience and expertise
Facilitate Diplomatic Initiatives
To augment endeavors of State and Central agencies

Wate
r R
eso
urc
es
• Irrigation, Drainage and Water
Management • Ground Water Exploration and
Minor Irrigation • Flood Control and River
Morphology • Dam and Reservoir
Engineering • Water Bodies and Lakes
Conservation • Agriculture Including Dry
Lands Farming • Rainfed and Irrigated
Agriculture • Watershed Management • Natural Resources
Management
Po
we
r
• Hydro Power • Thermal Power • Pumped Storage
Projects • Transmission &
Distribution • Rural
Electrification • Non-
conventional Sources of Energy
Infr
astr
uctu
re
• Water Supply, Sanitation and Drainage
• Environment • Ports & Harbours
and Inland Waterways
• Urban and Rural Areas Development
• Roads and Highway Engineering
Major Fields of Specialization
Introduction
(Contd.)
4

Introduction
(Contd.)
Preliminary Investigations/ Reconnaissance
Feasibility Studies/Planning/Project Formulation
Baseline and Socio-Economic Surveys Field Surveys & Investigations and Testing
Institutional/Human Resource Development
Ghat Development
Engineering Designs, Drawings and Tendering Process
Project Management and Construction Supervision
Operations and Maintenance
Range of Consultancy Services
5
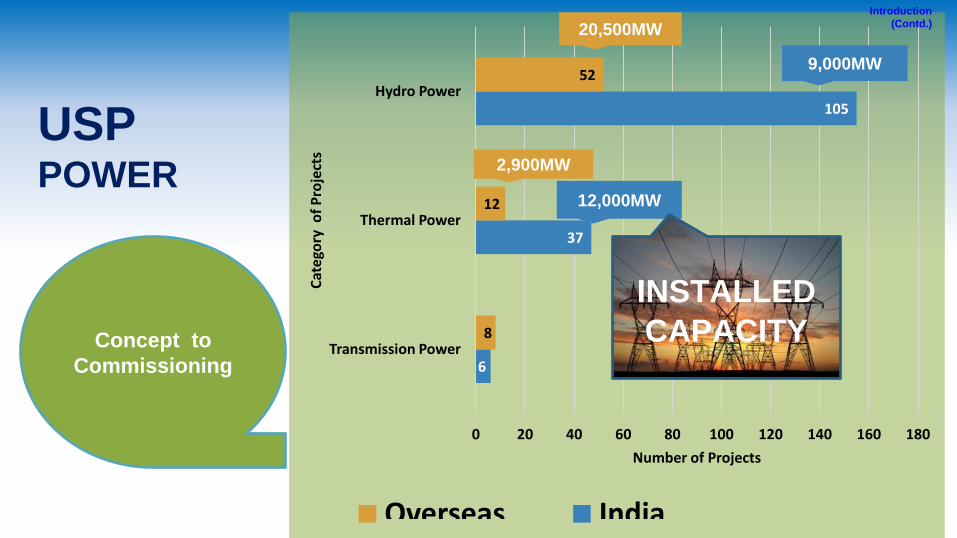
USP POWER
Concept to
Commissioning 6
37
105
8
12
52
0 20 40 60 80 100 120 140 160 180
Transmission Power
Thermal Power
Hydro Power
Number of Projects
Cat
ego
ry o
f P
roje
cts
Overseas India
2,900MW
12,000MW
20,500MW
9,000MW
INSTALLED CAPACITY
Introduction
(Contd.)

USP WATER
RESOURCES
In Irrigation, Water Resources, Flood Control, Ground Water, Agricultural etc.
Environmental Impact Assessment Studies
In India & Abroad in the
fields of Irrigation, Hydro
Power, Thermal Power,
Ports & Harbor
Contributed in
Development of
Irrigation
Potential of
Over
15 Million Ha.
Over 550
Projects
Over 250
Projects
Introduction
(Contd.)
7

USP INFRASTRUCTURE
In Water Supply & Sanitation, IEC, Rural & Urban Development, Roads and Highways Engineering, etc.
Surveys & Investigations/Modeling/ Detailed Engineering
Ports and Inland
Navigation Projects
WILLINGNESS
TO GO
‘EXTRA MILE’
Over 500
Projects
Over 200
Projects
Introduction
(Contd.)
8

World Bank
Asian Development Bank
African Development Bank
Japan Bank for International Cooperation
United Nations Office for Project Services
Introduction (Contd.)
9

Introduction
(Contd.)
CENTRAL WATER
COMMISSION
CENTRAL WATER AND POWER
RESEARCH STATION
CENTRAL SOIL & MATERIALS
RESEARCH STATION
GEOLOGICAL SURVEY OF INDIA
CENTRAL GROUND WATER
BOARD
SURVEY OF INDIA
CENTRAL ELECTRICITY
AUTHORITY
10

• WAPCOS is accredited by NABET for conducting EIA Studies for Projects in the areas of River
Valley, Thermal Power, Mines, Ports & Harbours and Building Construction
Introduction
(Contd.)
Quality Management System
conform to ISO 9001:2008 for
Consultancy Services in
Water Resources, Power and
Infrastructure Development
Projects
Valid upto October, 2017
Consultancy Services
11

• Africa 27
• Middle-East 1
• South America 1
• Asia 11
Operations Abroad
12
Introduction
(Contd.)

REGIONAL/FIELD OFFICES
Operations in
India
13
Introduction (Contd.)

14
Amochhu HEP,(540 MW)
Bunakha HEP,(180 MW)
Punatsangchhu-1 HEP,(1200 MW)
Punatsangchhu-2 HEP,(1020 MW)
Wangchhu HEP,(600 MW)
Sankosh HEP,(2560 MW)
MAIN DAM HT.- 215 M
LIFT DAM- 60M
Kuri Gongri HEP,(2740 MW)
Mangdechhu HEP,(720 MW)
Chamkharchhu HEP,(770 MW)
Hydropower Development in Bhutan
T
Kholongchhu HEP,(600 MW)
Kurichhu HEP ( 60 MW) in Operation
Chukha HEP (336 MW) in
Operation
Tala HEP (1020 MW) in operation
Hydropower Potential of Bhutan is 30000 MW, Feasible is 23760 MW
UNDER OPERATION- 1416 MW UNDER
DEVELOPMENT- 10000MW

WAPCOS successfully completed 71 PFR’s of H.E. Projects in India in year 2003-2005 under PM’s 50000 MW Initiative for Hydro power Development
WAPCOS has recently been appointed consultants by Central Electricity Authority (CEA) for Basin-wise review of balance Hydroelectric Potential including Pumped Storage Projects & Preparation of Basin Reports for following basins:
Indus Basin
Ganga Basin
Brahmaputra Basin
West Flowing rivers of Southern India
East flowing rivers of Southern India
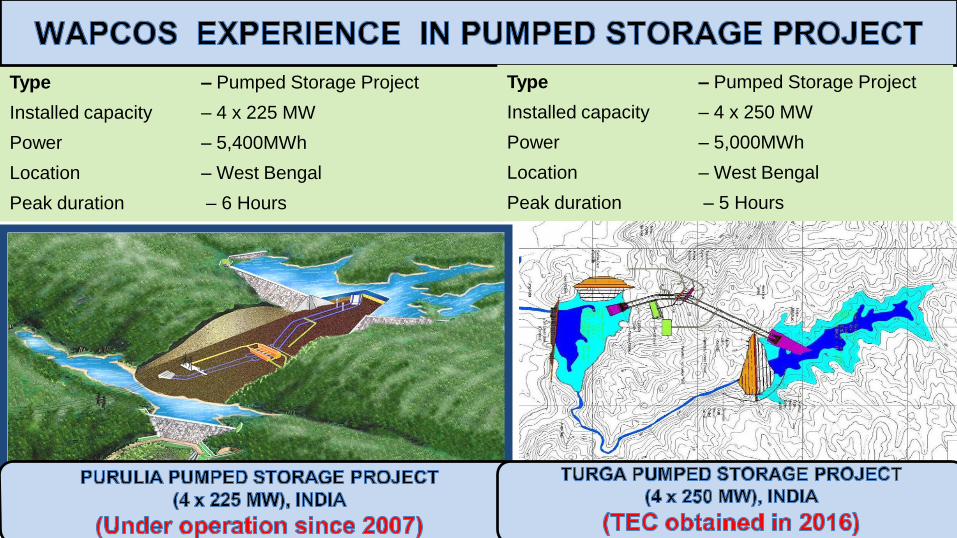
Type – Pumped Storage Project
Installed capacity – 4 x 225 MW
Power – 5,400MWh
Location – West Bengal
Peak duration – 6 Hours
16
Type – Pumped Storage Project
Installed capacity – 4 x 250 MW
Power – 5,000MWh
Location – West Bengal
Peak duration – 5 Hours

Client: OHPC, Government of Odisha Scope of Services: Preparation of DPR Surveys and Investigations
Client: TANGEDCO, Tamilnadu Scope of Services:
Review of DPR Tender Engineering & Detailed
Design Engineering Construction Supervision
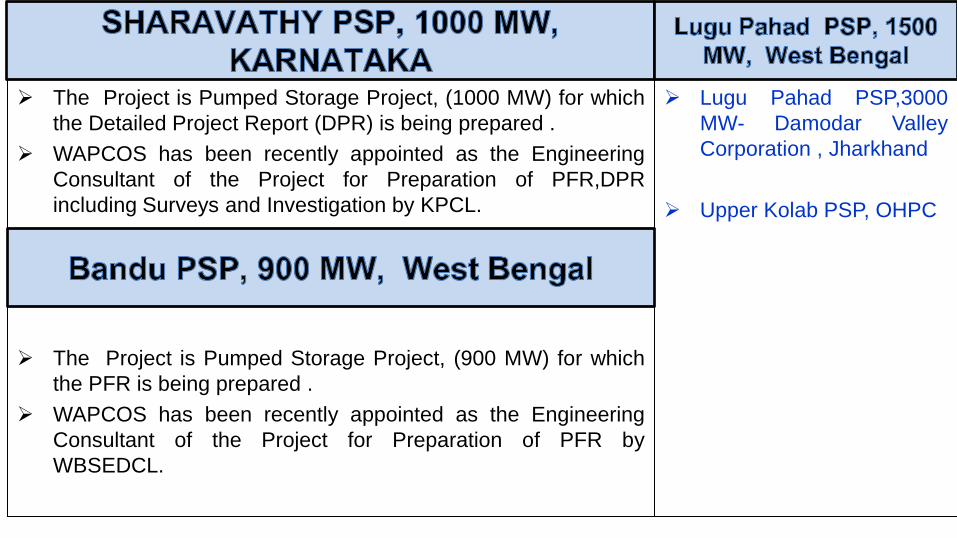
The Project is Pumped Storage Project, (1000 MW) for which
the Detailed Project Report (DPR) is being prepared .
WAPCOS has been recently appointed as the Engineering
Consultant of the Project for Preparation of PFR,DPR
including Surveys and Investigation by KPCL.
The Project is Pumped Storage Project, (900 MW) for which
the PFR is being prepared .
WAPCOS has been recently appointed as the Engineering
Consultant of the Project for Preparation of PFR by
WBSEDCL.
Lugu Pahad PSP,3000
MW- Damodar Valley
Corporation , Jharkhand
Upper Kolab PSP, OHPC

Source: Draft National Electricity Plan (December 2016) prepared by CEA
As on 31.3.2022 As on 31.3.2027
Thermal 278481 278481
Hydro 59828 71828
Nuclear 10080 14880
RES 175000 275000
Total 523389 640189
Hydro share (%) 11.4 11.2

2016-17 2021-22 2026-27 2031-32
All India 199540 283470 400705 541823
Forecast of Annual Peak Load (MW) for terminal years of 12th to 15th plan

2026-27 2021-22
Fuel Type Capacity (MW) % Capacity (MW) %
Hydro 71,828 59,828
Coal + Lignite 2,48,513* 2,48,513*
Gas 29,968 29,968
Nuclear 14,880 10,880
Total Conventional Capacity * 3,65,189 57% 348,389 67%
Total Renewable Capacity 2,75,000 43% 175,000 33%
Total Capacity by 2026-27 6,40,189 100% 523,389 100%
As per Draft NEP 2016 -All – India Installed Capacity of RES to 175 GW and 275 GW by
2021-22 and 2026-27 respectively
An average of 20% of Installed Capacity is expected to be Solar as per Government’s
Policy.
The projected installed capacity for 2021-22 and 2026-27 are given below:
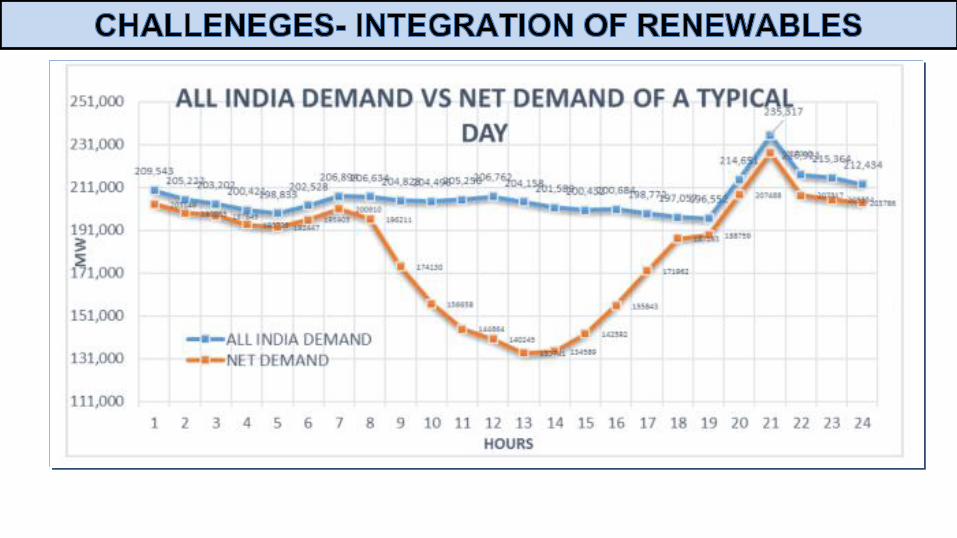


In order to address this problem the efforts were made to evolve various
ENERGY STORAGE means.
Technology Description: The basic arrangement - Involves two storage reservoirs upper and lower
separated at vertical difference with reversible turbine /pump between the two
reservoirs.
The technology is a Mechanical storage of the energy.
Water is lifted to the upper reservoir by pumping mechanism through extra
electricity during off-peak time.
The stored potential energy in the upper reservoir is used to generate electricity
by turbines when they are needed.
Pumping is similar to Charging the Batteries for future use.
This is a Natural Battery with associated inherent advantages .

Pumped Storage Project
FRL MDDL
FRL
MDDL
Upper Pond
Lower Pond
Generation Mode
Pumping Mode
Reversible Turbine
DAY TIME
NIGHT TIME
GRID
Max. head H max.
Min. head H min.
Length of WCS =L
H max/H min. < 1.5
L/H max. Ideally around 5 to 7

GRID LEVEL
• It utilizes grid power during off peak hour when frequency is high and supply power during
peak hour and whenever required.
• Regulates frequency to meet sudden load changes in the network.
• Improve grid controllability, Grid stability and Security
THERMAL STATIONS
• Increase capacity utilization of Thermal stations
• Reduce operational problem of thermal stations during Light load period
GENERAL
• Provides Black Start facility
• It addresses intermittence of renewable energy to a large extent
• It improves the tradability of power in the electricity market
• It helps improve hydro thermal mix ratio
• Availability of spinning reserve at almost no cost to the system
• Pumped Storage Schemes improve over all economy of power system operation

General
Essentially require two reservoirs - Results in
• Submergence Issues
• Land Requirement Issues
• R& R Issues
• More requirement of Construction material
Site Specific Requirements
• Two reservoir to be in close vicinity due to L/H ratio – Difficult to Find
• High Head Makes PSP attractive- Few sites in India
• Desired topography and river meandering to have short WCS
• Desired topography and Geology conducive to have straight WCS
• Steep River gradient to have maximum head in minimum distance
• Difficulties in siting two Intake structures for upper and Lower pond
• Large head variations between FRL and MDDL and associated slope stability issues
• Large head variation impacts Machine design

The viability of any Pumped Storage Project has always been an issue due to cycle efficiency
Besides many other factors , above issues often result in increased cost thereby affecting the viability of the
project.
Hence identification of suitable site, planning and design requires utmost care and judicious
decision making to develop Pumped storage projects.
Given the paucity of new sites, it is difficult to find new sites for installation of Pumped Storage Projects various innovative combinations must be considered for installing Pumped Storage Project.
Special efforts should be made to utilise existing H.E. projects with adequate reservoir storage.
The planning and design of each of the above three types are distinctly different from each other and require meticulous planning at each stage of development

New Pumped Storage Projects ( Both new reservoirs to be made)-
• Lugu Pahar Pumped Storage Project, 6X250MW, Jharkhand
Within the Existing Projects ( One Reservoir exists and One new reservoir is to be made)
• Turga Pumped Storage Project, 4X250 MW), West Bengal
Within the Existing projects ( Both reservoirs exists)
• Sharavathy Pumped Storage Project, 8X250 MW, Karnataka

New Pumped Storage Projects ( Both new reservoirs to be made)-
Lugu Pahar Pumped Storage Project, 6X250MW, Jharkhand
Lower Dam, ( 31.50m)
BL -240m
FRL- 269M
MDDL-262M
Gross Storage-21.3 MCM
Live Storage- 10.10 MCM
Upper Dam,( 104.50M)
BL -540m
FRL- 640
MDDL-630
Gross Storage-43.20 MCM
Live Storage- 10.10 MCM
HRT- 740M ( 2 NOS)
DIA- 8M
PRESSURE SHAFT- 7M
LENGTH 544M
TRT-
DIA 8M
LENGTH-950M
POWER HOUSE (UG)
L 240 x W23 m x H 51 m
TRANSFORMER Underground Cavern L 190 m x W 20 m x H 31 m

The Lugu pahar Pumped Storage project envisages construction of:
A 104.50 m high Rockfill New upper dam with central impervious clay core.
Live storage of 10.10 M cum with FRL at 640.0 m and MDDL at 630.00 m;
A 31.50 m high Rockfill New lower dam with central impervious clay core.
live storage of 10.10 M cum with FRL at 269.00 m and MDDL at 262.00 m;
2 (two) No. 740 m long, 8.0 m diameter headrace tunnel
2 (two) No. 544 m long, 7.0 m diameter pressure shaft
2 (two) No. 950 m long, 8.0 m diameter headrace tunnel
An underground power house having an installation of 6 Francis type reversible pump-
turbine driven generating units of 250MW capacity each
An installed capacity of 1500 MW has been adopted based on the simulation studies
carried out for different FRLs and installed capacities to provide peaking benefits for 6
hours.

New Pumped Storage Projects ( Both new reservoirs to be made)-
Bandu Pumped Storage Project, 900 MW, West Bengal

LOWER MAIN DAM
LOWER SADDLE DAM
UPPER DAM
TAILRACE OUTLET
SWITCHYARD
MAT
INTAKE
HEAD RACE
TUNNEL
POWER HOUSE
TRANSFORMER
CAVERN
Within the Existing Projects ( One Reservoir exists and One new reservoir is to be made)- Turga Pumped Storage Project, 4X250 MW), West Bengal
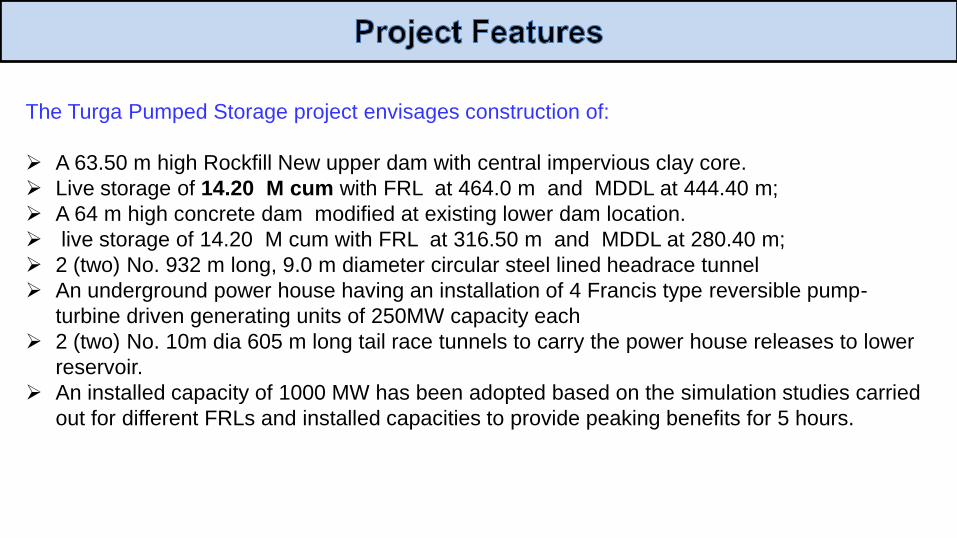
The Turga Pumped Storage project envisages construction of:
A 63.50 m high Rockfill New upper dam with central impervious clay core.
Live storage of 14.20 M cum with FRL at 464.0 m and MDDL at 444.40 m;
A 64 m high concrete dam modified at existing lower dam location.
live storage of 14.20 M cum with FRL at 316.50 m and MDDL at 280.40 m;
2 (two) No. 932 m long, 9.0 m diameter circular steel lined headrace tunnel
An underground power house having an installation of 4 Francis type reversible pump-
turbine driven generating units of 250MW capacity each
2 (two) No. 10m dia 605 m long tail race tunnels to carry the power house releases to lower
reservoir.
An installed capacity of 1000 MW has been adopted based on the simulation studies carried
out for different FRLs and installed capacities to provide peaking benefits for 5 hours.

Within the Existing projects ( Both reservoirs exists) Sharavathy Pumped Storage Project, 8X250 MW, Karnataka
Project with installed capacity of 2000 MW is planned between existing Talakalale and Gerusoppa reservoir The proposed pumped storage project is an additional installation utilising the existing Sharavathy system consisting of Liganamakhi, Talakalale Dam and Gerusoppa Dam.
Five (5) reservoirs regulate monsoon surplus waters of the Sharavathy and adjacent streams.
KPCL has three major hydroelectric stations in the basin with a total installed capacity of 1330 MW.

Storage Available at Two Reservoirs for Pumped Storage Project
Plant Planning & Installed Capacity

Sharavathy PSS- Storage Requirement (MCM) for Different Installed Capacity for 6 hours peaking operation
Installed Capacity (MW) Total Storage
Requirement (MCM)
Storage Required for
existing Sharavathy HEP
(MCM)*
Storage Required for
Sharavathy PSS (MCM)
1000 6.81 1.63 5.18
1250 8.11 1.63 6.48
1500 9.41 1.63 7.78
1750 10.7 1.63 9.07
2000 12.0 1.63 10.37
*During 6 hours of Peaking operation It would be seen from above that sufficient storage is available at upper reservoir for Sharavathy Pumped Storage scheme for installation of 2000 MW. The lower reservoir at Gerusoppa with live storage of 58.21 MCM would not pose any constrain in the selection of installed capacity.

Objective
Shortest Water Conductor
System
Straight WCS ( Minimum Bends)
for better Hydraulics
From Topographical & Geological
Considerations
Location of Intakes
Location of Surge Shafts
Location and Orientation of Power
house
No infringement with any Existing
structure

EXISTING GERUSOPPA LOWER DAM
EXISTING TALAKALALE UPPER DAM
PROPOSED SHARAVATHY PSP
Within the Existing projects ( Both reservoirs exists)-Sharavathy Pumped Storage Project, 8X250 MW, Karnataka

The Sharavathy Pumped Storage project envisages construction of:
2 (two) No. intake with trash racks having mechanical raking arrangement.
2 (two) No. 2.726 Km long, 9 m diameter circular concrete lined headrace tunnels including
cut & cover.
2 (two) No. 0.828 Km long, 5.25m diameter inclined circular steel lined (including horizontal)
pressure shafts
2(two) no. 16m dia circular Surge Shafts 52m high.
An underground power house having an installation of 8 Francis type reversible pump-
turbine driven generating units of 250MW capacity each
2 (two) no. 3.780 Km & 3.830 Km long concrete lined tail race tunnels to carry the power
house releases to lower reservoir.

The factors influencing the Installed Capacity of Pumped Storage
Scheme :
The requirement of daily peaking hours of Operation
Operating head
Live Storage available in the reservoirs and their area capacity
Characteristics
Operating Parameters of existing Sharavathy HEP Project (1035 MW)
Plant Planning & Installed Capacity

• The operation in either mode viz. generation or pumping,
results in continuous change in the levels of the two
reservoirs as also consequently change in the operating head
on the machines.
• The impact of such continuous variations in head is best
captured by simulation of operation of the scheme considering
shorter time intervals of 10 minutes.
• An efficient computer software developed helps in carrying out
various alternative simulation by changing key parameters
such as levels in both reservoir, component diameters, length
of WCS, efficiency etc. in order to optimize the parameters.
Computer Software for
Daily Operation Simulation

Operation Simulation

Preparation of DPR – Involves various inter connected
activities.
Interface within WAPCOS and KSEB required.
Interface with all the appraisal agencies like
CEA/CWC/GSI/CSMRS to achieve the objective within the
prescribed time limit.
WAPCOS shall deploy Interdisciplinary teams comprising of well
experienced experts, professional staff and other supporting
staff.

To review entire project in line with KPCL requirement and the works of different Expert Groups
Project hydrology
Project geology
Geological and geotechnical explorations at various project sites
Construction materials investigation
Project optimization
Civil designs & Hydro-mechanical works
Hydropower planning
Electro-mechanical Designs
Construction methodology and equipment planning
Project cost estimates
EIA study
Economic And Financial Analysis
Advisory Group
Experts Sub-
Groups

1 Mobilization of Resources and setting up of site office
2 Collection of additional data/ information
3 Preparation of PFR- Based on available information prepare PFR & submit it for ToR in MoEF
4 Preparation Detailed Project Report (DPR)- PRE- DPR Stage & EIA/EMP studies
5 Forest Area survey
6 Survey and Investigations
6.1 Construction materials Survey & testing for coarse and fine aggregates etc.
6.2 Hydrographic Survey at Intake Locations to Plan Both Intake Structure in the reservoirs
6.3 Geological mapping of Project area 6.4 Core Drilling
6.5 Exploratory Drifting
6.6 Laboartory Testing & Insitu testing
7.0 Hydrology- Review of Water Availability and Flood studies
8.0 Civil Design- Review of Designs for Talakalale dam and Gerusappa dam
9.0 Finalisation of project Layout and Obtaining of Pre DPR clearances
10.
0 Acceptance of DPR for Examination by CEA

Preparation of Complete DPR after Prior Clearances
7.0 Civil Designs - Power Intakes ,HRT, Power House Complex and appurtenant
works , TRT
8.0 EIA/EMP Studies
9.0 Transmission studies
10.0 Construction Programme & Equipment Planning
11.0 Preparation of detailed drawings for DPR stage
12.0 Preparation of BOQ, Rate analysis and cost estimate
13.0 Economic and financial analysis
14.0 Preparation of DPR
15.0 Submission of draft DPR in CEA
16.0 Compliance of Comments of different appraisal agencies on draft DPR
17.0 Submission of Final DPR for TEC
18.0 Environmental & Forest Clearance

Sl. No. Description of Item Remarks
1 Sub Surface Core Drilling
At Power House complex, HRT,Surge Shafts, pressure Shafts, TRT. Miscellaneous Location as
per requirement
2 Exploratory Drifting Exploratory Drift to power House Cavity Including
cross cuts
3 Geo-Physical Investigation At Power House complex
i) Seismic Profiling At Power House complex
4 Geotechnical Investigation
i) Field In situ Tests Deformation Modulus & Hydro-fracture Tests ii) Laboratory Tests Rock Mechanics tests iii) Construction Material Tests Coarse and fine aggregates etc 5 Conducting Field Permeability Test 6 Site Specific Seismic design parameters
7 Topographical Survey As per requirement

Months
DESCRIPTION1 Data Collection from KSEB and other agencies by
WAPCOS 0.5
2 Review of available data/records, peliminry site visit
0.5
3 Preapartion of PFR and ToR for MoEF
3
4 Topographical Survey6
5 Geotechnical Investigation , and Geological Mapping
18
6 Hydrological Studies
6
7 Power Potential Study based upon Hydrological Study
6
8 Construction Material Survey & Investigation and all
Testing 12
9 Preapartion & Submission of chapters for Pre DPR
clearance10
10 Design of main civil works like review of Dam Design,
Intake structure, Power House complex based upon
Topographical survey & Geological Inputs. 6
11 Design of H/M equipments4
12 Design of E/M equipment i.e. Switchyard etc.6
13 Preparation of DPR stage Drawings4
14 Construction Scheduling and Euipment Planning.3
15 Quantity Estimate, Analysis of Unit Rates, Preparation of
BOQ.5
16 Preparation of Draft DPR its submission4
17 Assistaance to KSEB during Appraisal & TEC6
Sl.No. ACTIVITY
1 10 12 13 14 15 162 3 4 115 6 30
ACTIVITY SCHEDULE FOR PALLIVASAL PUMPED STORAGE PROJECT, KERALA
ASSISTANCE TO KSEB IN APPRAISAL
&TEC
25 26 27 28 29
DPR PREPARATION AND SUBMISSION
7 8 9 17 18 24
DRIFT
19 20 21 22 23

Sl.
No. Aspect
Sl.
No. Aspect
1 Hydrological 6 Cons. Material & Geotechnical
Design Flood 7 Inter-State
2 Geological 8 International
3 Foundation Engg. and Seismic 9 ROR/Storage
4 Power Potential
5 Project General Layout and Planning

Sl.
No. Aspect Sl. No. Aspect Sl. No. Aspect
10
Dam/Barrage
Design 15 Power Evacuation 21 Civil Quantities
Embankment 16 Cost of E&M and
Misc Works 22 Civil Cost
11 Gates/HM
Design 17
Phasing of E&M and
Misc Works 23 Phasing of Civil Works
12 Instrumentatio
n 18 Legal (CEA) 24
Financial and Commercial
aspects (F&CA)
13 Hydel Civil
Design 19
Construction Power
aspects
14 E&M Design 20 Plant Planning

Does not change the River Hydrological Regime- Major obstacle for Hydro Power
No impact on u/s and d/s development - Major issue in HE development
Uniform Generation round the year- large variability Seasonwise
Peaking operation does not adversely affect d/s river reach- Major cause of concern in HEP
Most 1000 MW PSP on small Tertiary Streams – Minimum Infrastructure requirement
Installed capacity depends on Topography and operation hrs. and not Hydrology- More Flexible

In view of large scale induction of Renewables in near future
development of Pumped Storage projects needs focused attention and
support.
Pumped Storage project planning is distinctly different from conventional
Hydro Planning.
There are inherent complexities and site specific constraints in planning
and design of Pumped Storage Projects.
Hence, meticulous planning with judicious decision making is essential
while making trade offs between priorities which are at times competing
with each other.
There are only few good Pumped Storage sites , which meet the
requirement of a good pumped storage development in India.

Many identified sites have now become unavailable due to stringent
Environmental , and Social stipulations together with difficulties in land
acquisition.
Many sites may be unavailable due to proximities to the national Parks
etc.
In view of above , it is of utmost importance that all the possible new sites
are explored in totality.
Efforts should be made to study all the existing projects having one
reservoir or two reservoir in proximity and explore the possibility of
installation of Pumped Storage projects within the existing system.
This will minimize many adverse impacts and address developmental
challenges.
The PSP development within existing projects will greatly reduce the cost
and help making Pumped storage project economically viable.

Policy Issues Considering the necessity of the PSP, enabling policy framework is in
active consideration and need of the hour.
The PSP is destined to be a GRID Element with associated financial
support.
It will be a Must run Case and will be an important asset to the
system soon.
By the time Sharavathy project becomes operational , all these
mechanism are likely to be in place.
At present , Purulia PSP (900 MW) is being successfully operated by
WBSEDCL.

WAPCOS IS FULLY EQUPPED TO CARRY OUT ABOVE WORK IN
MOST PROFESSIONAL & TIME BOUND MANNER


Investigation, Planning, Design
new Hydro Pumped Storage Projects Peter Matt

Topics
EMC Kerala, Feb 2018 Seite 2
General basic design
Implementation of new pumped storage projects
Upgrading existing plants

Basic questions?
EMC Kerala, Feb 2018 Seite 3
• What is the business case? – Controll energy, balancing, generation, flexibility, storage ……
• Topography , geology, precipitation, environmental protection; environmental conservation, ecological mitigation measures, existing schemes, …..
• Accessibility to a high voltage transmission line • Transport connection of the site • Site procedure • Financing • ……………

Control Range of units
Seite 4
Source: Vorarlberger Illwerke AG
Ternary Units Pumpturbine
EMC Kerala, Feb 2018
Hydraulic Short Circuit - SC
Seite 5
Waterfall
M.C. Escher
1961
EMC Kerala, Feb 2018

Flexibility & Dynamic
between Turbine and Pump Mode
Seite 6 EMC Kerala, Feb 2018

Flexibility & Dynamic Turbine and Pump Mode
Seite 7
Mode changes: Flexibility and Dynamic
EMC Kerala, Feb 2018

8
Situation
Vorarlberger Illwerke AG
Installed capacity exisiting group OVW II group 2018
» turbine 1814 MW 360 MW 2174 MW » pump 1044 MW 360 MW 1404 MW
EMC Kerala, Feb 2018

New Projects: Kops II
Fitting into the existing scheme e.g. Illwerke
Seite 9 EMC Kerala, Feb 2018

Regelpumpenbetrieb Kopswerk II
-200
-150
-100
-50
0
50
100
150
200
29.10.2010 12:00 29.10.2010 14:00 29.10.2010 16:00 29.10.2010 18:00 29.10.2010 20:00 29.10.2010 22:00 30.10.2010 00:00
Zeit
MW
Ist-Leistung KOW II M2
Typical Day Diagram
one unit Kops II
- Actual load
80 MW/min
Seite 10
Working Range/Unit +/- 100% of Maximum Load
EMC Kerala, Feb 2018

Scheme Kops II
EMC Kerala, Feb 2018 Seite 11
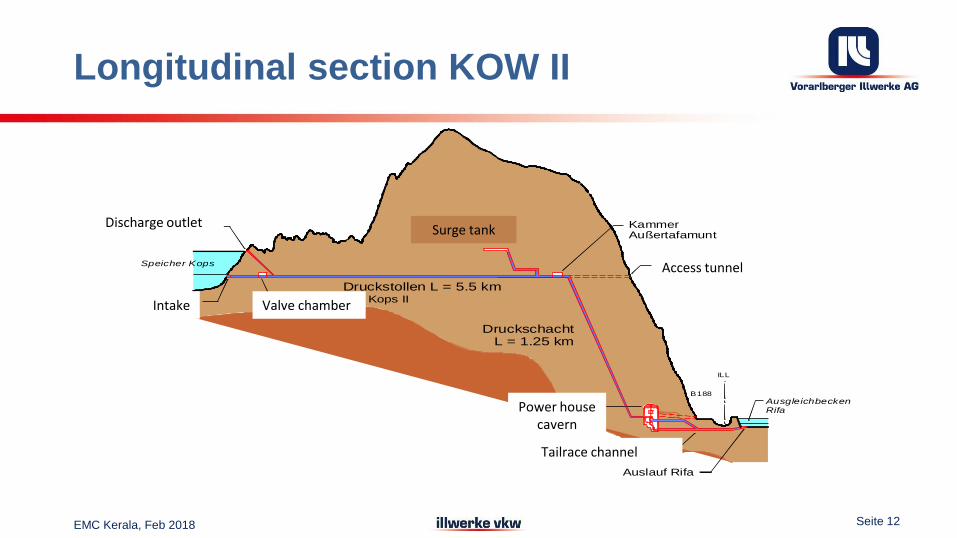
Longitudinal section KOW II
Speicher Kops
AusgleichbeckenRifa
EntlastungsbauwerkWasserschloss
B188
ILL
Einlaufbauwerk Sperrkammer Kops II
Druckstollen L = 5.5 km
FensterstollenAußertafamunt
DruckschachtL = 1.25 km
Kavernen-krafthaus
Unterwasser-,
Pumpwasserstollen
Auslauf Rifa
KammerAußertafamunt
Seite 12
Surge tank
Access tunnel
Power house cavern
Tailrace channel
Intake
Discharge outlet
Valve chamber
EMC Kerala, Feb 2018
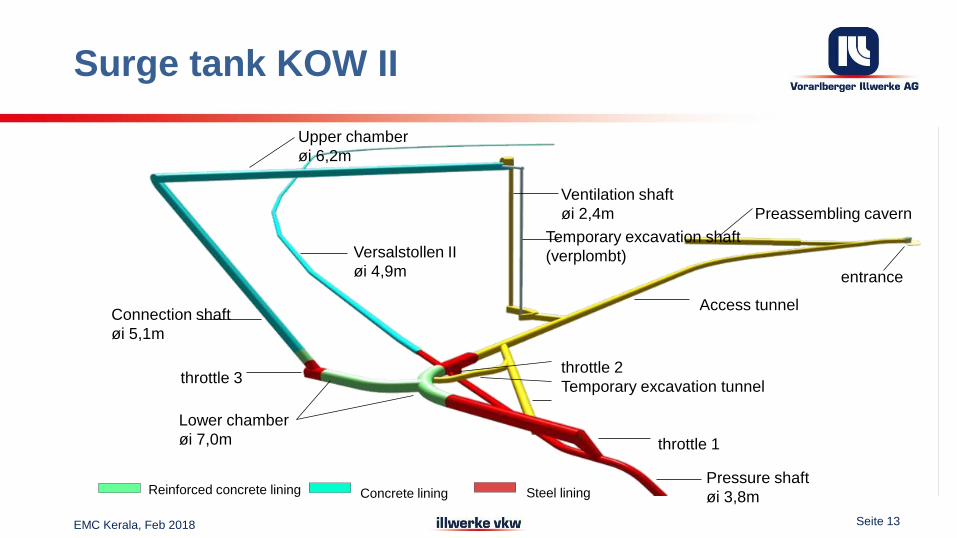
Pressure shaft
øi 3,8m
Access tunnel
Versalstollen II
øi 4,9m
Ventilation shaft
øi 2,4m
Upper chamber
øi 6,2m
throttle 1
throttle 2 throttle 3
Connection shaft
øi 5,1m
Lower chamber
øi 7,0m
Temporary excavation shaft
(verplombt)
Temporary excavation tunnel
Preassembling cavern
entrance
Concrete lining Steel lining Reinforced concrete lining
Seite 13
Surge tank KOW II
EMC Kerala, Feb 2018

Seite 14
Surge tank KOW II, throttle lower chamber
EMC Kerala, Feb 2018

Kops II, Power Station with 3 units
Seite 15
Druckschacht Schieberstollen
Pumpensteigleitung
horizontale
Pumpenleitung
Pumpwasserstollen
Verbindungsstollen
Druckluftkammer
Turbine
Motor
Wandler
Pumpe
Stauziel
Absenkziel
Rifabecken 30m
6 1 m
Balancing Reservoir
Rifa Top storage level
draw down level
Compressed air chambers
Generator
torque converter
storage Pump
Low head manifold, pumpwater tunnel
high head pump manifold
pipeline
valve chamber
Pressure shaft
high head manifold
EMC Kerala, Feb 2018
pelton turbine with 6 jets
and deflectors
vent pipes
3 stage pump with hydraulic converter
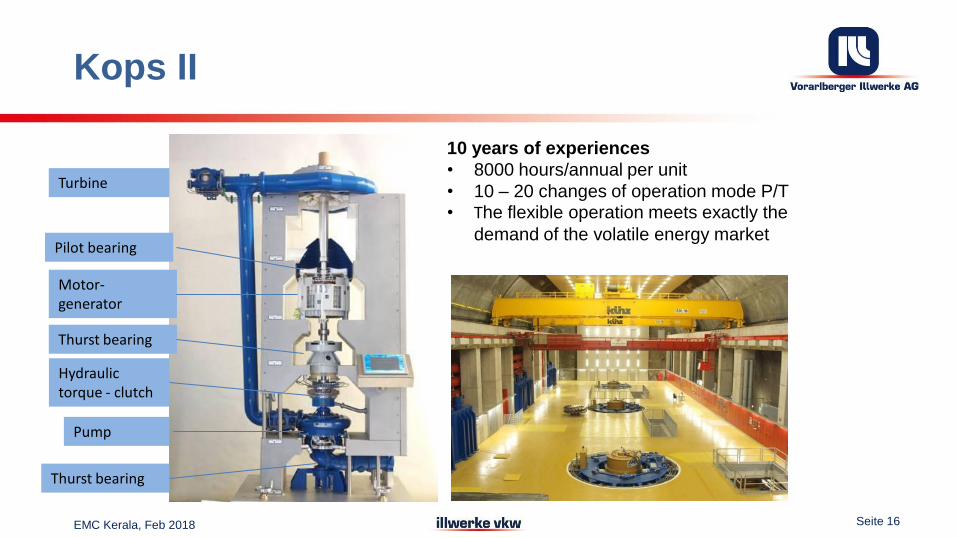
Kops II
10 years of experiences
• 8000 hours/annual per unit
• 10 – 20 changes of operation mode P/T • The flexible operation meets exactly the
demand of the volatile energy market
Seite 16 EMC Kerala, Feb 2018
Turbine
Motor-generator
Pump
Hydraulic torque - clutch
Thurst bearing
Pilot bearing
Thurst bearing

Projekt Obervermuntwerk II
Seite 17
New Projects: Obervermuntwerk II
Fitting into the existing scheme e.g. Illwerke
EMC Kerala, Feb 2018

3D-Schema
Underground powerhouse
Main access tunnel
Tail race system Obervermunt pressure tunnel
Silvretta head race tunnel
Access tunnel to surge tank
Intake structure
Obervermuntwerk II (2014- 2018)
Existing Obervermunt Plant I and Obervermunt Plant II in construction
HPP Obervermunt I
Surge tank Gate chamber
EMC Kerala, Feb 2018 Seite 18

Two horizontal units, each existing of Francis turbine, clutch, motor-generator,
torque converter and pump
The turbines are full adjustable from 100% to 0% without any part-load limit
Ternary Units:
Technical Concept
Length approx. 36 m
Seite 19 EMC Kerala, Feb 2018

Longitudinal Section
OVW II
EMC Kerala, Feb 2018 Seite 20

Seite 21
Surge tank “Krespa”
Upper chamber
Access and ventilation gallery
3 lower chambers
Obervermunt pressure tunnel
Pressure tunnel Silvretta
Surge Tank OVW II
Vertical shaft
EMC Kerala, Feb 2018
film

3D-view: Powerhouse with surroundings
Seite 22
Technical Concept Power House
EMC Kerala, Feb 2018

Cavern Power Station
Beam 25 m
High 33 m
Length 117 m
Excavation: 110 000 m³
Cross Section Power Station
Seite 23 EMC Kerala, Feb 2018

Two horizontal units, each existing of Francis turbine, clutch, motor-generator,
torque converter and pump
The turbines are full adjustable from 100% to 0% without any part-load limit
Ternary Units:
Technical Concept
Length approx. 36 m
Seite 24 EMC Kerala, Feb 2018

Obervermuntwerk II: machine cavern under construction
25 EMC Kerala, Feb 2018

Obervermuntwerk II
EMC Kerala, Feb 2018 Seite 26

Obervermuntwerk II
EMC Kerala, Feb 2018 Seite 27
Turbine mit adjustable Distributor Runner Pump
film

Data Confrontation
Kops II and Obervermuntwerk II
Seite 28
Technical Data KOPS II OBERVERMUNT II
Long term Storage 75 GWh 30 GWh
Short term Storage 3 GWh 4 GWh
520 MW 360 MW
3 Units à 173 MW 2 Units à 180 MW
450 MW 360 MW
3 Units à 150 MW 2 Units à 180 MW
Full load hours pump mode 6 hours 11 hours
Working Range -450 MW until + 520 MW -360 MW until +360 MW
round trip efficiency 0,8 0,8
life time 80 years 80 years
cycles 105-10
610
5-10
6
power costs 850 EUR/kW 1100 EUR/kW
Capacity Turbine Mode
Capacity Pump Mode
EMC Kerala, Feb 2018

Limberg II / Limberg III
EMC Kerala, Feb 2018 Seite 29
pumpturbine Limberg I 480 MW (2x240 MW)
Limberg II / Limberg III
project status in operation / EIA approved
turbine mode 353 MW / 833 MW
pump mode 130 MW / 610 MW

Benefits of HPP
Pumped storage is currently the most efficient and
economical method for the integration of RES
Hydropower contributes to a safe and affordable supply
Storage power plants supports the energy transition in a
renewable way
Austria has an excellent reputation internationally with
hydropower and corresponding know-how
Austria offers not only current but especially energy
services
Seite 30 EMC Kerala, Feb 2018

Benefits of the Usual Pumped Storage
Supplying power during peak demand
Improving the power factory of the system
Providing black start facility, voltage control, reactive
power, inertia load
„Smoothing“ the load demand curve
Task of a „fire brigade“ for quick hydroelectric
generation
Seite 31 EMC Kerala, Feb 2018

Seite 32
Rodund II
Technical Data:
• Load Capacity: 276 MW
• Discharge: 90 m³/s
• Gross head: 348 m
• First time operation: 1976
• Restart: Dec. 2011
295 MW
98 m³/s
Efficency Hydropower, Refurbihsment
EMC Kerala, Feb 2018

Seite 33
Restart: December 2011
R&D: Part load stabilization
between 0 and 110 MW
Rodund II Efficency Hydropower
EMC Kerala, Feb 2018

Seite 34
Technical data:
• constructed 1954 -1958
• first time of operation
1958
• 5 ternary units
• gross head 974 m
• turbine mode 232 MW
• pump mode 224 MW
• energy / a 371 GWh
• pump storage 201 GWh
280 MW
Efficency Hydropower, Refurbishment
Power Plant LÜNERSEEWERK
EMC Kerala, Feb 2018

Refurbishing
EMC Kerala, Feb 2018 Seite 35

Reservoir „Lünersee“: • Sea Level 1970 m • Storage Capacity 78 Mio m³ • Energy Storage 260 GWh • Max Daily Storage 5,4 GWh
Uprating - PHS Lünersee
EMC Kerala, Feb 2018 Seite 36

technical data:
• Construction 1962 - 1969
• Commissioning 1968
• 3 units (turbine, generator)
• Gross head 780 m
• Turbine mode 247 MW =>
• Energy/a 392 GWh
276
Uprating – HPP Kops I (new runners, jets, housings)
EMC Kerala, Feb 2018 Seite 37

Thank you
EMC Kerala, Feb 2018 Seite 38
Questions ? Don`t hesitate to contact me [email protected] www.illwerke.at
Reservoir Rodund 2,2 Mio m³
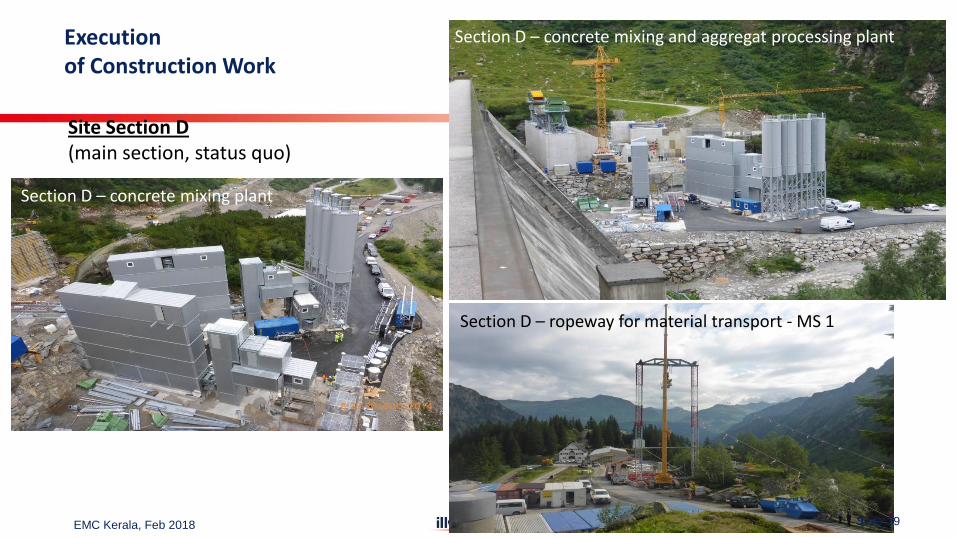
Site Section D (main section, status quo)
Section D – concrete mixing and aggregat processing plant
Section D – ropeway for material transport - MS 1
Execution of Construction Work
Section D – concrete mixing plant
EMC Kerala, Feb 2018 Seite 39

Main access tunnel to powerhouse cavern (excavation and support method: pipe roof support)
Execution of Construction Work
EMC Kerala, Feb 2018 Seite 40

Obervermunt pressure tunnel (preparing for blast operation)
Execution of Construction Work
EMC Kerala, Feb 2018 Seite 41

Site Section D (status quo)
Section D – ropeway for material transport - MS 1
Section D – ropeway for material transport
Execution of Construction Work
Section D – ropeway for material transport
EMC Kerala, Feb 2018 Seite 42
Pumped Storage Schemes & Role of Regulators
P. V. SIVAPRASAD
Director,
Kerala State Electricity Regulatory Commission
1
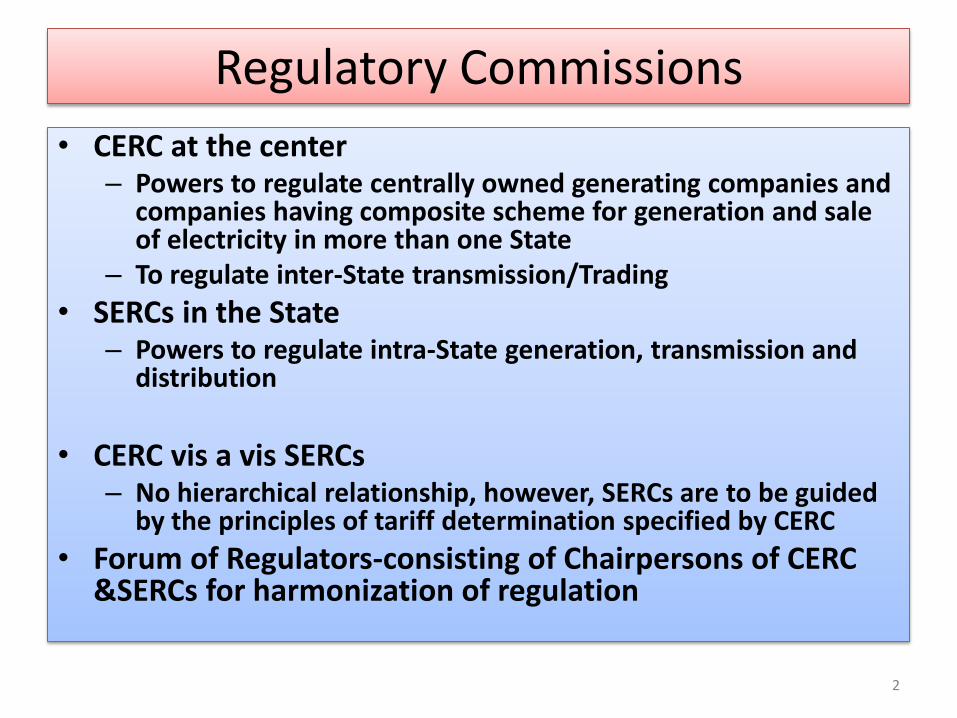
Regulatory Commissions
• CERC at the center – Powers to regulate centrally owned generating companies and
companies having composite scheme for generation and sale of electricity in more than one State
– To regulate inter-State transmission/Trading
• SERCs in the State – Powers to regulate intra-State generation, transmission and
distribution
• CERC vis a vis SERCs
– No hierarchical relationship, however, SERCs are to be guided by the principles of tariff determination specified by CERC
• Forum of Regulators-consisting of Chairpersons of CERC &SERCs for harmonization of regulation
2

Role of Regulators in Indian Power Sector
• Regulations – Tariff Regulations – Licensing Regulations -Transmission, Distribution, Trading – GRID Code – Standards of service regulations etc.
• Procedural regulations – Conduct of business regulations – Payment of fees etc.
• Regulatory Orders – Determination of tariff
• Generation, • Transmission and
• Real-time Operation related orders-UI, Grid security etc. • Adjudication of disputes • Open Access procedures • Advisory role to the Governments • Promoting RE
3

Provisions in the Tariff Policy 2016 regarding pumped storage schemes..
• One of the objective is to ‘ Promote Hydroelectric Power
generation including Pumped Storage Projects (PSP) to provide adequate peaking reserves, reliable grid operation and integration of variable renewable energy sources.
• Tariff for electricity sold to DISCOMs through long term PPAs shall be determined by the CERCs / SERCs as the case may be.
4

Role of the SERCs as the Regulator in promoting pumped storage schmes
• Determination of Tariff for the electricity generated from PSP and supplied to DISCOMs
• Approval of power purchchase agreement to be entered into between the generator and DISCOMs.
• Ensuring safety and security of the grid.., especially in the present context of large scale integration of RE, with adequate electricity storage schemes.
5

Tariff Determination
• Based on the technical and financial parameters specified by the Commission through Regulations, based on cost plus principles. (Section 61 & 62 of the EA-2003).
• Components of Tariff – Interest on Debt – Return on Equity – Operation and Maintenance expenses – Depreciation – Interest on working capital
• Annual FC shall be born by the beneficiaries, and ultimately pass on to the end electricity consumers.
• The PSP can operate the plant as a merchant power plant.
6

Power purchase agreement with
Distribution licensee
• Prior approval of the Commission is mandatory as per the provisions of the Electricity Act, 2003.(Section 86(1)(b) of the EA-2003.
• The Commission is duty bound to ensure that, quality electricity is supplied to the consumers at reasonable cost.
7

The Commission may consider the following while granting investment approval/ approval for PPA by the
KSEB Ltd for PSS..
• Present features of the Kerala power system, its constraints, the consumer mix etc.
• What is the future growth of the electricity demand?
• Supply options available to meet the future demand and its impact on retail tariff.
• Whether the system requires a PSS or not, if so what capacity. – Quantify the benefit to the Kerala power system and also
its impact on consumers.
– How it can be utilized.
8

Kerala Power System
• Consumer strength- about 120 lakhs
• Daily consumption- Average -70 Million Units (Annual about 25500 MU)
–Annual increase – about 6% - about 1200 MU
• Peak demand – about 4000 MW – Annual increase – about 250 MW
9

Daily Load Curve (Typical)
2500
2700
2900
3100
3300
3500
3700
3900
4100
4300
4500 0
0:3
0
01
:30
02
:30
03
:30
04
:30
05
:30
06
:30
07
:30
08
:30
09
:30
10
:30
11
:30
12
:30
13
:30
14
:30
15
:30
16
:30
17
:30
18
:30
19
:30
20
:30
21
:30
22
:30
23
:30
Load
(M
W)
10

Consumption pattern
Domestic 51%
Commercial (LT+HT)
10%
Industry (LT) 6%
Agriculture 1%
HT&EHT Inustry 16%
Govt offices, educational
institutions etc 11%
Small licensees (Technopark, etc)
3%
Others 2%

Monthly variation of Electricity Demand (MU/day)
74 73
63 64
67 67 68 69
67 68
71
76
50
55
60
65
70
75
80
Apr May Jun Jul Aug Sep Oct Nov Dec Jan Feb Mar
(MU
/day
12

Monthly variation of peak demand (MW)
4004 3939
3496
3373
3532 3513
3604 3599 3528
3597
3694
3805
3000
3100
3200
3300
3400
3500
3600
3700
3800
3900
4000
4100
Apr May Jun Jul Aug Sep Oct Nov Dec Jan Feb Mar
Pea
k d
em
and
(M
W)
13

How the electricity demand of the State is being met?
• Historically, till the early 80’s, the entire demand is being met by internal hydro.
• In 90’s, about 80% of the demand is being met by hydro and balance from thermal (Central Generating Stations).
• Now, about 75 % of the electricity requirement of the State is being met by procuring power from outside the State
Source 1990-91 2016-17
2017-18 (est)
(normal monsoon)
Hydro (internal) 80.4% 18.0% 25.6%
IPP & Wind (internal) 0.0% 0.6% 0.6%
CGS (Outside the State) 19.6% 45.7% 43.5%
Traders & short terrm (Out side the State 0.0% 35.7% 30.3%
14

Own generation and Power purchase by KSEB Ltd
Sl No Particulars
Installed Capacity
Capacity available Annual energy availability
(MW) (MW) (MU)
1 Hydro 2100 1650 to 1750 6500 to 7000
2 CGS (outside the State) 1700 1350 11000.00
3 IPPs (outside the State) 1415 1203 9905.98
4 Wind-IPPs 57 109.85
5 Solar KSEB own including 50 MW plat at Kasargod 57.25 95.29
5329.25 4203 27611.12
15

Renewable Addition Plan by the Central Government
Source
Capacity as on 31.07.2017
Capacity target for March-2022
(MW) (%) of total (MW) (%) of total
Solar 13652 23% 100000 57%
Wind 32562 55% 60000 34%
Small Hydro 4390 7% 5000 3%
Biomass & MSW 8296 14% 10000 6%
Total 58900 100% 175000 100%
16

Renewable Purchase Obligation
Non-solar RPO Solar RPO Total
(%) (%) (%) 2016-17 4.50 0.50 5.00
2017-18 6.00 1.50 7.50
2018-19 7.00 2.75 9.75
2019-20 8.00 4.00 12.00
2020-21 9.00 5.25 14.25
2021-22 10.25 6.75 17.00
Year
RPO PROPOSED as percentage of total
consumption excluding hydro
Addl solar capacity required- about 1000 MW to meet the Solar RPO, will results in generation by 5.0MU/day during sunny days 17

RE sources in the State.. Issues and challenges
• Potential RE sources of the State
– Small Hydro (capacity upto 25 MW)
– Wind
– Solar
• Infirm nature,
– SHP and Wind – Seasonal and generation limited to monsoon months.
– Solar- generation limited to day time- maximum upto 6 hrs per day
• Low Plant Load Factor
- Small Hydro- 30%
- Wind – 22%
- Solar-19
- KERLA SYSTEM LOAD FACTOR about 72%??
• Forecasting and scheduling threats, grid security & safety issues
• Very limited storage facility to absorb the variability of RE.
18

PSS is an effective energy storage solution..
• To cater the peak demand..
• To address the variability and infirm nature of RE..
– Enhance the reliability of power generated from RE
• Optimum utilisation of the available sources and the electricity market..
– Enhance the market value of electricity..
• Address the hydrology risk..
19

Commercial justification..
• Capital cost may be slightly higher..
• Additional electrical energy for pumping, which may increase the effective cost of the energy delivered..
• Overall per unit cost of electricity from PSS may be higher than conventional power..
• ToD pricing (energy charge during peak hours -6pm to 10pm is 50% higher). ToD mandatory for – All HT&EHT consumers
– LT- Industrial consumers having connected load above 20 kW
20

Recommendations of the Standing Committee on Energy (2015-16) Sixteenth Loksabha
Pumped Storage System 2.6 The Committee note that 96,524 MW capacity of pumped storage
scheme has been identified in the country. Out of this, capacity of 4,785.6 MW is under operation and 1,080 MW is under construction, whereas 1,000 MW projects DPR are prepared and submitted to CEA. The Committee find that development of pumped storage scheme in the country is at a rudimentary stage and its present utilization against the total potential is meager. Considering the vast network of electricity grid in the country and the quantum of electricity demand, it is not difficult to gauge the range of fluctuation in power demands. Pumped storage schemes are meant for storing energy and using at times when demands for electricity soars. Hence, pumped storage scheme will be quite beneficial for developing ancillary power market and in meeting sudden high demands of electricity. The Committee, therefore, recommend that due attention should also be given to develop identified pumped storage schemes in the country.
21

THANKS
22

IMPACT OF PUMPED STORAGE PLANT
onSTRESSED POWER SYSTEMS
-A case study on Kerala Power System

Introduction Stressed Power System Major Challenges in the Operation of Stressed Power Systems Energy Storage is beneficial Why Pumped storage ? Kerala power system at a glance Features of Kerala Power System Main problems faced by Kerala power System Cost of power purchase Importance of PSP in Kerala System Study of Commercial Impact of PS Optimal Generation scheduling problem Demand & supply of the system Mathematical Formulation Problem Simulation results Scope of mixed pumped storage operation Additional Capacity determination Conclusion

Economic operation of power system
Optimal utilization of natural resources
System wise study is necessary

Insufficient own resources Large variation in peak and off peak power
demand Substantial short term power purchase High impact of fluctuations in power market
on system operation Increasing addition of renewables

Economic operation of Power system is affected by Change in market structure in the deregulated environment
of power system operation Evolution towards more renewable energy sources like
solar, wind etc. Uncertainty in amount of power availability Uncertainty in time and duration of availability
Fluctuations in market price
Energy storage will have a strong impact on the operation of such systems

◦ Load factor of the system can be improved ensuring
better utilization of own resources
◦ Market price variations can be effectively utilized
◦ Integrated operation of renewables like wind and solar is
possible
◦ Overall economy of system operation can be improved
◦ Reliability of the system can be enhanced

Most economical large scale storage High cycle efficiency (0.75-0.85) Quick start and stop Operational simplicity Less maintenance Long life Better utilization of hydro potential

Impact of pumped storage on Kerala power system
- A case study

Installed Capacity: Hydel :70% Thermal :30%
Peak Deficit :12% Average energy availability from hydel :40%
The dominance of hydro is not reflected in the consumption

Relatively poor energy resources (absolutely no fossil fuel reserves)
Dependency on Monsoon (more than 70% hydro )Adverse consumer mix(nearly 80% are domestic consumers to
whom energy is sold at subsidized price Rs 1.9 as against Rs 4.6)
Low load factor (evening peak is almost double that of base load, lowest in Southern grid)
High cost of thermal power (the increase in demand is met by costly power purchase liquid fuel stations)
Adverse LT-HT ratio (6:1 against 1:1as per norm which has adverse effect on distribution installation & distribution loss)

Peak Power deficit The hydel source is monsoon dependant and
hence availability is limited for two thirds of an year
Geographical and environmental restrictions prevent construction of new stations
Substantial power purchase mainly due to peak power deficit

Highly variable in nature, beyond the control of the utility
Cost is high when demand is high and is less during off peak
A deciding role in economic operation of the system
Storage is the solutionPurchase and store when energy is cheaper (off-peak load) and release the same when peak demand appears

Abundance of hydro potential. Effective utilization of hydro resources
Load factor of the system can be improved ensuring better utilization of other resources
Increasing Renewable penetration cause significant fluctuation in market price. Need a quick responding storage option
Economy can be improved by energy arbitrage
Reliability of the system can be increased
Problem Formulation
The commercial impact of PSP is evaluated from the optimal generation schedule with and without a fictitious PSP
Annual saving is obtained by comparing both the schedules assuming an installation cost of 4 corers/MW for the PS plant
Optimal capacity of the PSP corresponding to maximum savings is found by assuming different capacities for the plant

Objective: Minimize the total operating cost for the day Constraints:
Demand-Supply balancePower& Energy availability from Hydro plants for
the dayPower & Energy availability from CGS Operational constraints on the LF plants eg.
Combined cycle operationPower purchase limit during peak hoursEnergy availability from purchase for the day.

System demand is met by hydel stationsallocation from central generating stations,liquid fuel stationspower purchase from Traders/power
exchanges
Scheduling is done by load dispatch centre on merit order basis. Merit order is prepared on the basis of energy cost/MWhr.

The optimal scheduling problem is formulated as an integer programming problem
Solved using a MILP/LP solver GLPK Optimal schedule is prepared for the existing
system and with PSP
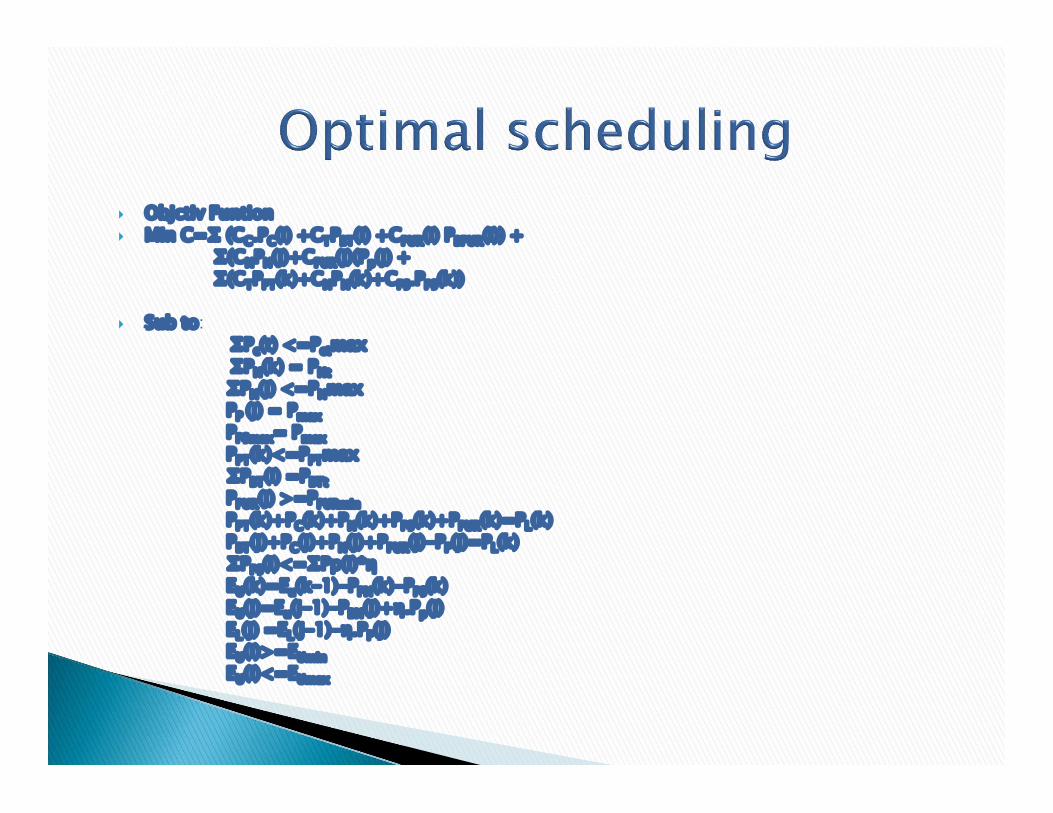
Objctiv Funtion Min C=∑ (CC.PC(i) +CTPBT(i) +CPUR(i) PBPUR(i)) +
∑(CHPH(j)+CPUR(j)(Pp(j) +∑(CTPPT(k)+CHPH(k)+CPS.PPS(k))
Sub to: ∑Pc(t) <=Pctmax∑PH(k) = PHt∑PH(j) <=PHmaxPP (j) = PmaxPPSmax= PmaxPPT(k)<=PPTmax∑PBT(i) =PBTtPPUR(j) >=PPURminPPT(k)+PC(k)+PH(k)+PPS(k)+PPUR(k)=PL(k)PBT(j)+PC(j)+PH(j)+PPUR(j)-PP(j)=PL(k)∑PPS(i)<=∑Pp(i)*ηEU(k)=Eu(k-1)-PPH(k)-PPS(k)EU(j)=Eu(j-1)-PBH(j)+η.Pp(j)EL(j) =EL(j-1)-η.PP(j)EU(i)>=EUminEU(i)<=EUmax
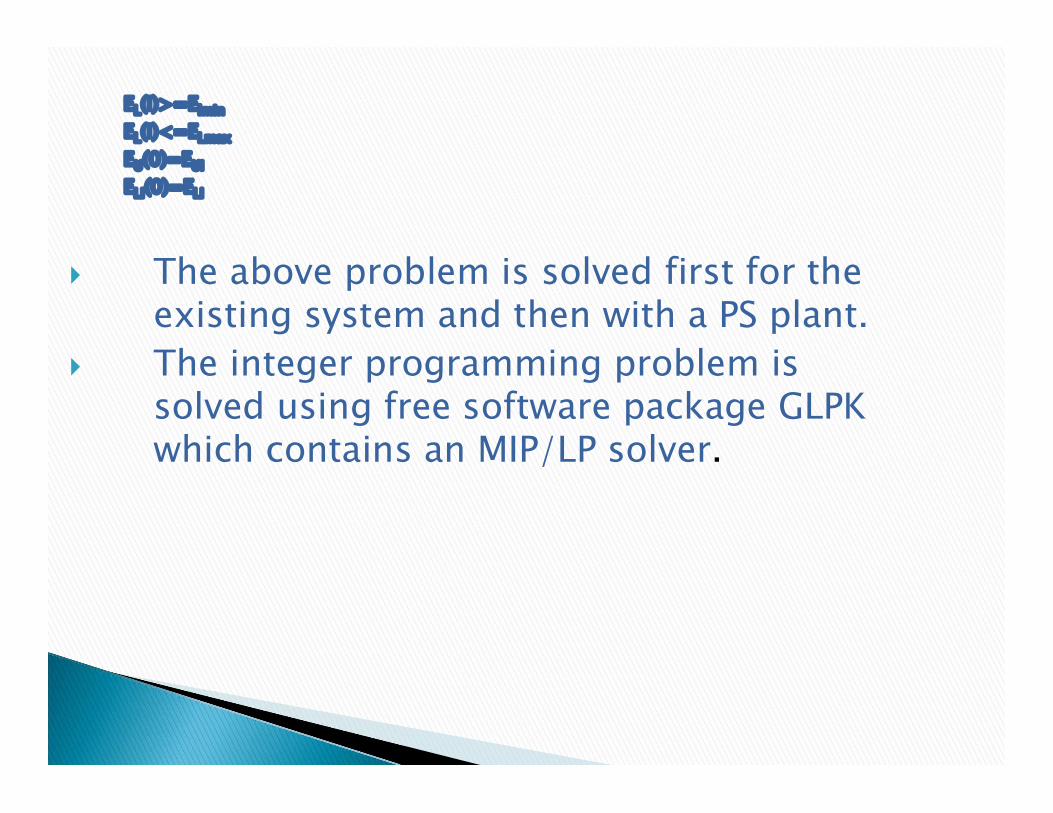
EL(i)>=Elmin
EL(i)<=ELmax
EU(0)=EUi
ELi(0)=ELi
The above problem is solved first for the existing system and then with a PS plant.
The integer programming problem is solved using free software package GLPK which contains an MIP/LP solver.

A costly liquid fuel station running as base load plant just because of non availability of sufficient power to meet the critical peak demand
Pushes the operating cost of the system to a high value

Revised schedule with a fixed capacity pumped storage plant
Costly LF plants are replaced by the PS plant A substantial saving of 1.14 Cr. in operating cost per day

Scope of mixed pumped storage operation
-An empirical study

Conventional Hydroplants retrofittedwith a PS unit in thepower house and asuitable sump in thetail race

Less capital investment
Minimum environmental impact

Feasible in existing hydro plants withsignificant spillage during monsoon seasonand extra storage capacity during summerseason
Proposal is to bring an additional capacitywhich is ensured year round

Step1: Classification of reservoir data* based on storage level
Category Storage (% of FRL)
Reservoir status
1 80-100 Chance of spillage
2 50-80 Safe level
3 <50 Limited storage
* Plant capacity is 48MW (4x8+16) and data analyzed for the period 2006-10

Step2: Additional capacity determinationCategory Capacity
1 Capacity (P1) determined fromaverage spill/day during theseason
2 Control the off peak generationso that extra peak capacity (P2)can be introduced based on theinflow rate of the season
3 Pumped storage operationwhose capacity (P3) is notcalculated in this study

P1in MW=S.1000 ,S is the av.spillage in million units
24
P2 in MW=I.1000 ,I is the total inflow for p number of hrs and p the no.of peak hrs
p
Determination of P3 requires a detailed study which is beyond the scope of this work

Category Additional capacity
Mode of operation during the season
% Duration of operation in an year
1 16 Round the clock generation 30
2 12 Peak hour generation 15
3 - PS operation 55

Unit size is selected as 8 MW considering
◦ the possibility of FL operation in all the 3 seasons
◦ the availability of the unit in case of a breakdown
Sump capacity is estimated as 0.185MCM which is necessary for 4 hrs of peak load (for the test system) generation

Preliminary study shows the viability of PS plantin Kerala Power System operation
Extra hydro potential is available in existingplants which can be easily tapped out for EnergyManagement
MPSS is very effective in improving demandresponse
The proposed method is extremely simplefor the system managers to adopt and implement

Thank You

DVC: Flood Control, Irrigation, Water Supply, Drainage and Power Generation
• Original Plan of DVC: For a Century-long effort of taming the highly destructive turbulent Damodar river during floods & utilizing its huge water resources, the Planners proposed a scheme of construction of 7 multipurpose Storage dams at Konar, Aiyar, Panchet, Bokaro, Tilaiya, Deolbari & Maithon with a Barrage & canal network system.

DAMODAR VALLEY CORPORATION CAME INTO EXISTENCE ON 7TH JULY 1948 BY AN ACT OF
PARLIAMENT ‘DVC ACT (XIV), 1948’, WITH PRIME CORPORATE OBJECTIVES TO FULFILL.
AN AUTONOMOUS BODY OF CENTRAL AND THE STATE
GOVERNMENTS OF WEST BENGAL AND BIHAR (Now JHARKHAND).
FIRST MULTIPURPOSE INTEGRATED RIVER VALLEY PROJECT OF INDEPENDENT INDIA.

DVC : PRIME CORPORATE OBJECTIVES
Promotion and operation of schemes for flood control in the Damodar River and its tributaries.
Promotion and operation of schemes for irrigation, water supply and drainage.
Promotion and operation of schemes for the Generation, Transmission and distribution of electrical energy, both hydro-electric and thermal.
Promotion and control of navigation in the Damodar river and its tributaries and channels if any.
Promotion of afforestation and control of soil erosion in the valley.
Promotion of public health and the agricultural, industrial, economic and general well being in the Damodar Valley and its area of operation.

DAMODAR BASIN
RTPS
KTPS
Durgapur Barrage
DSTPS

PERFORMANCE OF DVC in 58 YEARS of OPERATION ( From 1959 to 2017):
FLOOD MODERATION THROUGH DVC DAMS
Moderation of Some Major Floods • --------------------------------------------------------------------------------------------------------------------- Combined Peak Combined Peak Flood • Period Inflow Outflow Moderation • ( In cusec) ( In cusec) ( In cusec) • -------------------------------------------------------------------------------------------------------------------- • Oct. 1959 6,23,000 2,88,000 3,35,000 • Oct. 1961 5,16,000 1,60,000 3,56,000 • Oct. 1973 5,88,000 1,75,000 4,13.000 • Sept. 1978 7,74,000 1,63,000 6,11,000 • Sept. 1995 6,19,000 2,50,000 3,69,000 • --------------------------------------------------------------------------------------------------------------------- • Note: If the 1978 flood was allowed to pass without any moderation from DVC
dams, It would have generated a flood peak of 11,80,000 cusec at Durgapur Barrage, which is more than the total design flood of DVC system i.e. 10,00,000 cusec and a total devastation could not be avoided.

IRRIGATION BY DVC WATER 3 crops in a year- Kharif ( Monsoon), Rabi (Winter) & Boro
(Summer) from DVC water.
Supplying 1150 MCM of water on an average - for Kharif Irrigation- Area extended from 75000 Ha to 3,34,282 Ha.
Supplying 86 MCM of water - for Rabi Irrigation
Supplying 300 MCM of water on an average, - for non-committed Boro Irrigation
Value of the Crop produced by DVC water has been estimated to about Rs. 500 to 700 crores annually.

MUNICIPAL & INDUSTRIAL WATER SUPPLY BY DVC
Supplying water about 555 MCM water to 175 Municipal & Industrial agencies from Ranchi to Panagarh.
Main Industrial consumers- Steel plants, Thermal Plants,
Railways, Collieries & washeries, Fertiliser Plants etc.
Main Domestic Consumers – Jharia Water Board Dhanbad City, Asansol, Ranigunge & Durgapur Municipalities etc.

POWER GENERATION AND DVC Total Present Capacity of DVC is 9305.2 MW – Thermal & Hydel
both. Total Thermal Power Generation Capacity of DVC- 7770 MW Thermal Power capacities of JV companies of DVC- 1388 MW Total Hydel Power Generation Capacity- 147.2 MW Main consumers – Steel plants, Railways, Coal Industries, State
Electricity boards of West Bengal, Jharkhand, Delhi, MP, Karnataka, Kerala, Punjab, Haryana etc.
One of the major power generating units of Eastern India.

History of Pump Storage Projects in DVC
DVC identified some ‘’Hydel Pumped Storage Schemes’’ within the Valley area in 1970s.
In 1978, DVC started planning of a 600 MW Hydel Pumped storage scheme at Lugu Pahar area, near Gomia in the state of Jharkhand.
CEA advised DVC to proceed for a pumped storage scheme
upto 4200 MW at the same location, considering the topographical features & availability of water.
DVC prepared a preliminary report in 1981 for a pumped storage scheme of 3000 MW capacity at Lugu Pahar area.

Country
State
District
India
Jharkhand
Bokaro
River Bokaro river a tributary of
Damodar River
Dam site
(Upper)
Left Bank N-23046’30.32” ,
E-850 43’45.12”
Right Bank N- 23˚ 46’14.4”
, E- 85˚43’ 29.52”
Dam site
(Lower)
Left Bank N- 23˚48’
06.87” , E- 85˚ 44’ 39.47”
Right Bank N- 23˚47’
34.12” , E- 85˚44’ 25.9”
Access to
Project
Airport : Ranchi – 110 km
Rail Head : Gomia
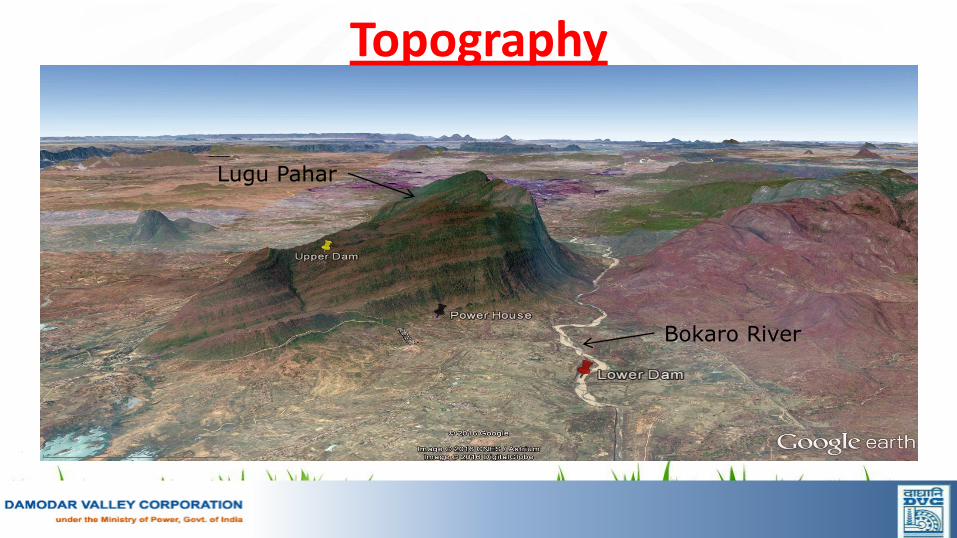
Topography
Bokaro River
Lugu Pahar


Joint site visit has been
conducted by DVC and WAPCOS
officials on 17th August 2017.


Lower Dam, ( 31.50m)
BL -240m
FRL- 269M
MDDL-262M
Gross Storage-21.3 MCM
Live Storage- 10.10 MCM
Upper Dam,( 104.50M)
BL -540m
FRL- 640
MDDL-630
Gross Storage-43.20 MCM
Live Storage- 10.10 MCM
HRT- 740M ( 2 NOS)
DIA- 8M
PRESSURE SHAFT- 7M
LENGTH 544M
TRT-
DIA 8M
LENGTH-950M
POWER HOUSE (UG)
L 240 x W23 m x H 51 m
TRANSFORMER Underground Cavern L 190 m x W 20 m x H 31 m


The Upper Pond with FRL at 640 m and MDDL 630.64 m has a live storage
capacity of 10.10 mcum.
The head during generating mode would vary from a minimum of 346 m to a
maximum of 364m. The discharge during generating cycle caries from 440
cumec to 480 cumecs.
The FRL of lower Pond is 269 m and MDDL 262 m
The head during pumping cycle varies from a minimum of 352m to a
maximum of 368m .
The ratio of Maximum to Minimum head is 1.05.
Pumping duration during off peak is 7.4hours.
The pumping energy requirement is 11000 Mwh.
The cycle efficiency is 81.82%.

Type Francis type, vertical shaft reversible pump-turbine
Number of unit Six (6) units
Rated Turbine Head 362 m
Turbine Output at Rated Head 253 MW
Rated Pump Head 378 m
Pump Input at Rated Head 285 MW
Rated Turbine Discharge 79.00 m3/s
Rated Pump Discharge 71 m3/s
Synchronous Speed 333.3 rpm

Generator-Motor
Type Three (3) phase, alternating current synchronous, generator-
motor, vertical shaft, rotating field, enclosed housing, rim-duct air-
cooled and suspended type
Number of unit Six (6) units
Rated Capacity Generator; 250 MW , Motor; 300 MW
Rated Voltage 18.0kV
Rated Frequency 50 Hz
Rated Speed 333.3 rpm
Over Load Capacity 110 % rated capacity

The project involves minimum civil works with availability of local construction material.
No geological surprise is envisaged. Geological setup is conducive for underground works.
No interference with hydrological regime of the river project being close loop Pumped storage project.
Minimum land requirement of 496 Ha.
The majority of land is forest and minimum private land is envisaged.
No R&R issues seems to be involved.

The per MW cost is 2.98 Cr. Only.
The generation per ha of forest land is 10.2 Mu /Ha which is much more than the required 2 Mu /Ha as per latest Guidelines. Hence eligible for preferential consideration.
DVC and state of West Bengal ,Jharkhand do not have realisable Hydro Potential of this Scale. Hence, Lugu Pahar Pumped Storage is the only feasible alternative available.
West Bengal has already constructed Purulia PSP(900 MW) and Turga PSP(1000 MW) is now under pre-construction. Other states are also going for PSP in an accelerated manner.
In view of mandatory large injection of Renewables , DVC needs advance planning to integrate it.
Considering the over all trend of generation planning and demand , DVC would be needing source to generate peak power to improve Hydro: Thermal Mix and provide much needed balance to renewable in year 2025-26 .
Lugu Pahar can address all above issues .
PFR Establishes that scheme has merits for detailed Investigation and preparation of DPR.


1Overview Pump Storage | India | 2018-02-09
Overview of Pump Storage Plants
India, 2018-02-09/08

2Overview Pump Storage | India | 2018-02-09
One of the Biggest Family-Owned Companies in Europe
Johann MatthäusVoith1803 – 1874
Friedrich Voith1840 – 1913
Walther, Hermannand Hanns Voith
All shares are owned by the Voith family.
Management and Supervisory Boards are staffed by external executives.
Hanns Voith
19711867

3
150 years experience in hydropower
Overview Pump Storage | India | 2018-02-09
Twin turbine Ontario,Niagara Falls, Canada
1873 First Voith Francis turbine1903 First Pelton turbine1912 Niagara Falls, Canada: Twin Francis
turbines with 12 MW output1934 Pedreira, Brazil: World’s first
reversible pump-turbine, 5.3 MW output
...

4Overview Pump Storage | India | 2018-02-09
Global Projects
1,100South America
130Africa
2,900Europe
940Asia-Pacific
Total Number of Powerhouses with Voith Hydro Participation: 6,730
Source: Go2Hydro (1900 – 2011-20-04)
1,660North America

5
Voith Hydro - Global Locations
Overview Pump Storage | India | 2018-02-09
ProductionSales/ Engineering/ Service-Shop
North America
York (PA) USA
Chattanooga (TN) USA
Springfield (OR) USA
Mississauga (ON) Canada
Montreal (Brossard, QC) Canada
Granby (QC) Canada
Ciudad de Mexiko Mexico
Latin America
São Paulo Brazil
Manaus Brazil
Lima Peru
Santiago Chile
Cuenca Ecuador
Medellín Columbia
Europe
Heidenheim Germany
St. Pölten Austria
St. Georgen Austria
Tolosa (Ibarra) Spain
Cinisello Balsamo (Milano) Italy
Oslo Norway
Trondheim Norway
Gamle Fredrikstad Norway
Västeras Sweden
Pilsen Czech
Ankara Turkey
Moscow Russia
Podgorica Montenegro
Bukarest Romania
Trebisov Slovakia
Asia
Shanghai China
Noida India
Vadodara India
Kawasaki Japan
Seoul Korea
Kuala Lumpur Malaysia

6
Voith Hydro Presence in India
Overview Pump Storage | India | 2018-02-09
VH Noida
VH Vadodara
- Design - Digital Solutions- Project Management - Finance- Supply Management- Automation Workbench- Small Hydro Product Development Centre
• Manufacturing facility in Vadodara • Head Office at Noida

7PSP Reisseck_II (Austria, Kärnten), 430 MW, under commissioning phaseOverview Pump Storage | India | 2018-02-09
Pump Storage Concept

8
Development of power outputs for Francis and Pump Turbines
Frades II(Portugal)
Chang Long Shan(China)
Obervermunt 2 (Pu)(Austria)
Wu Dong De(China)
Chan Long Shan, China:2 High Head Pumpturbines (690 –760m) with 600rpm and a ratedTurbine Output of 357 MW
2017
Overview Pump Storage | India | 2018-02-09

9
Pump Storage Plants – Development of Power Unit Arrangement
4 machine
solution
3 machine
solution
2 machine
solution
ternary
pump storage
reversible
pump turbine
“classical”
pump storage
Overview Pump Storage | India | 2018-02-09
variable speed technology

10
source: Voith Hydro – PSP Market Overview
Application areas of different solutions for the hydraulic machine with respect to head and power
Overview Pump Storage | India | 2018-02-09

11
application forhigh heads / fast modechanges
- -
fast modechanges - -
most commonapplication in
the past
mainly forgrid
stabilization(low power)
mainly for gridstabilization(high power)
Overview Pump Storage | India | 2018-02-09
up to 1500m or more
up to 600m
up to 800m
Power Unit Concepts

12
Ternary
Pump / Turbine
Reversible
Pump Turbine
Pump Storage Plants – Turbine Arrangement
Overview Pump Storage | India | 2018-02-09

13Overview Pump Storage | India | 2018-02-09
Ternary Units

14
1. Unit Arrangements
Possible configurations
MG Motorgenerator
GC Gear coupling
ST Starting turbine
HTC Hydr. torqueconverter
for horizontal and verticalarrangement
Overview Pump Storage | India | 2018-02-09

15
Main components of a vertical ternary unit with a Pelton turbine (Kops II, Austria)
Pelton turbine
(2 bar air-pressurized)
Motor Generator
Hydraulic torque converter
multistage pump (3-stage)head variation: 726m...836m
Overview Pump Storage | India | 2018-02-09
Presenter
Presentation Notes
+ Motor-generator remains at all switching over operations connected to the grid, which saves a lot of time.

16
Ternary unit arrangement with a horizontal shaftconfiguration(Wehr, Germany) 4 x 227 MW T/ 4 x 245 MW P
Overview Pump Storage | India | 2018-02-09

17Overview Pump Storage | India | 2018-02-09 PSW La Muela II (SP 80 km far away from Valencia) , 852 MW, under construction
Reversible Pump Turbines
Presenter
Presentation Notes
Kunde: Ibedrola
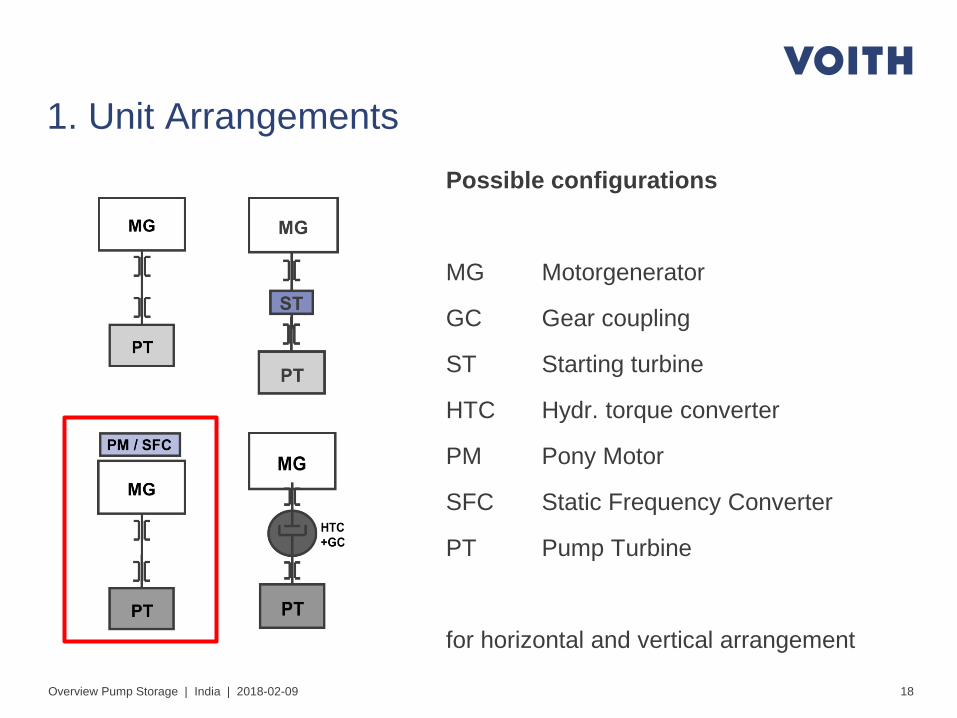
18
1. Unit ArrangementsPossible configurations
MG Motorgenerator
GC Gear coupling
ST Starting turbine
HTC Hydr. torque converter
PM Pony Motor
SFC Static Frequency Converter
PT Pump Turbine
for horizontal and vertical arrangement
Overview Pump Storage | India | 2018-02-09

19
Conventional Reversible Unit (PT + MG)
• Typical of existing fleet in world today
• Two rotating directions
• Power control in turbine mode only
• Load range for generation:50% - 100% power.
• Input cannot be controlled in pump mode
• Hydraulic circuit possible in case of 2 units (1 unit operates as pump 1 unit operats as turbine)

20
Arrangement of machines: comparisonP+T/PT
Type of machine
Investments
Space requirements
Efficiency
Setting
Transition time: P ⇒ T / T ⇒ P (with HTC)
Hydraulic short circuit
High heads
Operation costs
Technical risks
Maintenance efforts
MG
PTMG TP
Overview Pump Storage | India | 2018-02-09

21
Specific PSP Features
Specific Pump Features

22Overview Pump Storage | India | 2018-02-09
PSP Features• Hydraulic Torque Converter
• Start Up“ Pump Mode
• Black Start – Back to Back
• Servo Motor Control
• Runner Removal
• Variable Speed

23Overview Pump Storage | India | 2018-02-09
PSP Features• Hydraulic Torque Converter
• „Start Up“ Pump Mode
• Black Start – Back to Back
• Single Servo Motor Control
• Runner Removal
• Variable Speed

24
Hydraulic Torque Converter
KOPS II / VIW3 - Stage Pump + Torque Converter
MG
Overview Pump Storage | India | 2018-02-09

25
Hydraulic Torque Converter - References
Plant units head speed pump input converter year
[m] [1/min] [MW] [MW]
Lünersee 5 1000 750 43 33 1954Säckingen 4 410 600 70 40 1964
Roßhag 2 690 750 52 31 1967Hornbergstufe 4 640 600 248 150 1970
Malta 2 1100 500 144 87 1973Häusling 2 725 600 170 96 1982Kops 2 3 840 500 165 90 2007
HTC for Obervermunt II project is under construction
Overview Pump Storage | India | 2018-02-09
Presenter
Presentation Notes
!!!

26
Advantages of the hydraulic torque converter
• Very short startup time of the storage pump (soft start + no air in thewaterways especially in multi stage pumps)
• The consumption of electricity starts already with the filling stage of thehydraulic torque converter, in about 10 seconds 60% of the storage pump power are suitable.
• Minor no-load losses of the hydraulic torque converter (< 0,05 % of therated power) compared to a connected starting pump
• Self-control into synchronisation, no additional speed control is required.
• Lowest water consumption / water is taken from the tail water side, i.e. no storage water from the upper reservoir ( < = > startup turbine).
• Very good operational experience since 1954.
• Voith Hydro is the only company with references.
Overview Pump Storage | India | 2018-02-09
Presenter
Presentation Notes

27Overview Pump Storage | India | 2018-02-09
PSP Features• Hydraulic Torque Tonverter
• „Start Up“ Pump Mode
• Black Start – Back to Back
• Servo Motor Control
• Runner Removal
• Variable Speed

28
- Required power to rotate the runner in water at rated speed about 20% of rated pump input
- Required power to rotate the runner in air at rated speed about 3...5% of rated pump input (blow down equipment necessary)
Required Power to “start up” in Pump Mode
Overview Pump Storage | India | 2018-02-09

29
- Required power to rotate the runner in water at rated speed about 60% of rated pump input
- Start in air not technically feasible(large volume to be blow down at a high pressure level)
Required Power to “start up” in Pump Mode
Overview Pump Storage | India | 2018-02-09

30
pump„in water“
pump „in air“
singlestage
multistage
StartingTurbine yes yes yes yes
Pony Motor no yes yes no
SFC no yes yes noHTC yes yes yes yes
“Start Up” in Pump Mode - Devices
Common Practice:
Single stage pumps / reversible Pump turbines in air by SFCmulti stage pumps in water by HTC
Overview Pump Storage | India | 2018-02-09

31Overview Pump Storage | India | 2018-02-09
PSP Features• Hydraulic Torque Tonverter
• „Start Up“ Pump Mode
• Black Start – Back to Back
• SCO Mode
• Single Servo Motor Control
• Runner Removal
• Draft Tube Gates
• Variable Speed
T P1
P2G~
M1~
M2~

32
P1 and P2 can be started by the turbine T one by one using dedicated electrical connections between the motor-generators since the frequency during the start-up is different from the grid frequency.
Full-frequency starting: The motor of the pump to be started gets excited during the standstill and after starting of the runs synchronically with the generator.
Partial-frequency starting: At first the motor gets started asynchronically and after reaching the generator‘s speed it is excited and runs synchronically with the generator.4738e
Start Up in Pump Mode - Back to Back
T P1 P2
G~
M1~
M2~
additionally start-up switching line arrangements + circuit breakers + protection criteria
Overview Pump Storage | India | 2018-02-09

33Overview Pump Storage | India | 2018-02-09
PSP Features• Hydraulic Torque Tonverter
• „Start Up“ Pump Mode
• Black Start – Back to Back
• Servo Motor Control
• Runner Removal
• Variable Speed

34Overview Pump Storage | India | 2018-02-09
Project Details – Distributor Mechanism
Standard kinematics with operating ring Individual Servomotors

35Overview Pump Storage | India | 2018-02-09
Individual Servomotors offer several advantages compared to standard kinematics with operating ring, links and levers.
• Smooth machine start by individual opening of wicket gates
• Better control of transient machine behavior
• Easier maintenance (shorter period) and access to turbine components
Project Details – Distributor Mechanism

36Overview Pump Storage | India | 2018-02-09
PSP Features• Hydraulic Torque Tonverter
• „Start Up“ Pump Mode
• Black Start – Back to Back
• Single Servo Motor Control
• Runner Removal
• Variable Speed

37Overview Pump Storage | India | 2018-02-09
Power Unit Cross Section

38Overview Pump Storage | India | 2018-02-09
Project Details – Runner Removal
Anchor tie rods
The runner removal by the draft tube access is not possible due to the interferance with anchor tie rods.

39Overview Pump Storage | India | 2018-02-09
Project Details – Runner Removal
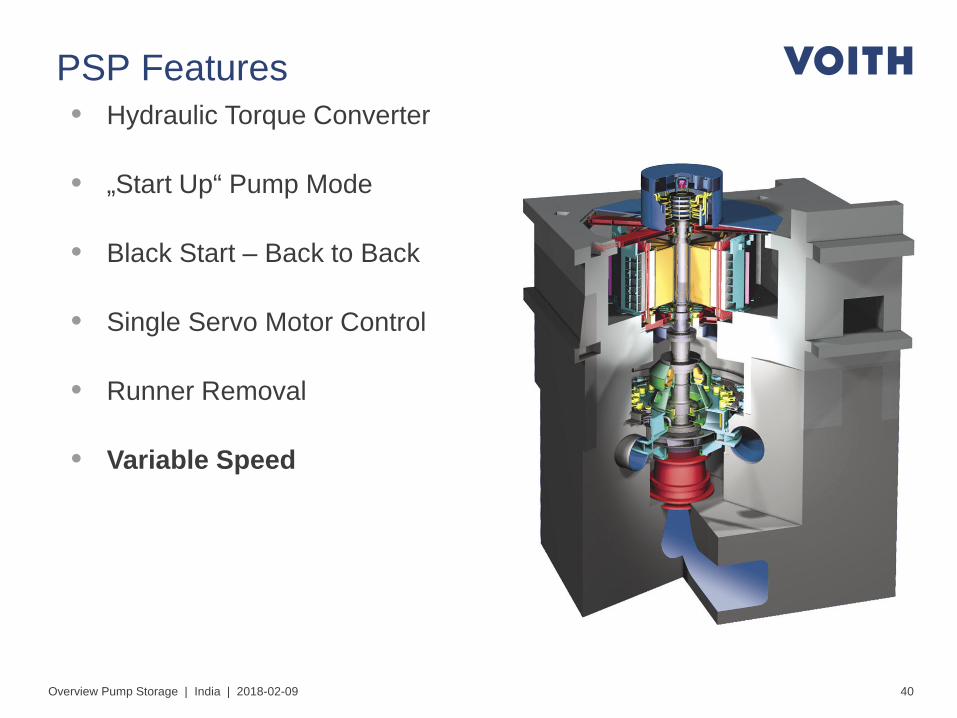
40Overview Pump Storage | India | 2018-02-09
PSP Features• Hydraulic Torque Converter
• „Start Up“ Pump Mode
• Black Start – Back to Back
• Single Servo Motor Control
• Runner Removal
• Variable Speed

41
Motivation for variable - speed Applications
• Power Control in Pump Mode
• Large Head Variation of the Reservoirs
• Performance Optimization
• Extended Turbine Operating Range
• Features for grid stability
Overview Pump Storage | India | 2018-02-09

42
70
80
90
100
110
120
80 85 90 95 100 105 110 115 120
Delivery Head [%]
Con
sum
ed p
ower
[%]
Motivation - Power Control in Pump Mode
pump input = f (runner diameter; hydr. geometry) fixed at the prototypepump input = f (head) can hardly be influenced at the prototypepump input = f (speed) can be changed by a nvar-M/G + BoP

43
Motivation – Large Head Variation of the Reservoirs
Overview Pump Storage | India | 2018-02-09

44
Motivation – Large Head Variation of the Reservoirs
-30m
-40m
-50m
-60m
-20m
Overview Pump Storage | India | 2018-02-09
-58m
-35m
-40m
hs

45Overview Pump Storage | India | 2018-02-09
Motivation – Performance Optimization (Tu Mode)
• Runner diameter and speed are selected to have a stable pump mode operation
• Turbine mode operation will have therefore some constrains

46Overview Pump Storage | India | 2018-02-09
Motivation – Extended Turbine Operating Range
Lower speed improves
• Pressure Pulsations• Noise• Vibration• Efficiency at low part load
This effect can be used to decreasethe lower operating limit.

47Overview Pump Storage | India | 2018-02-09
Motivation – Features for Grid Stability
• Faster load ramping in pump and in turbine mode utilizing the AC excitation system for active & reactive power control. This applies also for offering important ancillary services to the grid such asprimary and secondary frequency control reserves additionally in both modes.
• Potential to improve the grid stability in case of grid faults (e.g. LVRT – low voltage ride through, sustain longer in a 3 phase short circuit) by injecting fast active and reactive power in both modes (pump & turbine mode).

48
Line up of all Solutions
Overview Pump Storage | India | 2018-02-09
Fix speed SM DFIM - AC-Excitation CFSM
MG Power... 500 MVA (nearly nolimitations)
... 500 MVA (limited byspeed)
... 500 MVA (limited by speed)
Converter Power6 % to 12 % (depending on machine size)
up to 30 % (of MG Power, depending on slip) 100 % (of MG Power)
Speed Range Not applicable +/- 10 % (typical) +/- 20 % (typical)
Power Range MG Not applicable 70 ... 100 % (typical) 40 ... 100 % (typical)
Power Factor Stator 0,9 (typical) 0,9 (typical) 0,9 (controlled to unity)
Power Factor Grid 0,9 (typical) 0,9 (typical) 0,9 (typical)
Generator Efficiency synch. MG less than synch. MG synch. MG
Converter Efficiencynot applicable for normal operation
Approx. 96% - 98% ofconverter power incl.transformer (typical)
Approx. 96% - 98% of converter / MG power
Rotor Voltage / Currentacc. to best fit for MG / asneeded 3,3 or 6,6 kV / up to 7,5 kA
acc. to best fit for MG as needed
Phase reversal switch necessary necessary not necessary
Starting Time medium medium short
Head Variation no adaptation medium high
Costs MG lower (approx. 100 %) higher (approx. 130 %) lower (approx. 100 %)
Costs converter system low high (approx. 5 times SFC - system costs)
higher (approx. 10 times SFC -system costs)
Availabilitywith converter or in case of two units BtB possible
operation only withconverter
turb. operation w/o converter (bypass)
Blow Down necessary necessary not necessary

49Overview Pump Storage | India | 2018-02-09
VH References – Pump Storage
Year of Commissioning
Project Details
1937 Pedreira, Brazil First reversible pump turbine in the world with 5.3 MW unit output, 30 m, 212 rpm
1954 Luenersee, Austria First pump with head exceeding 1000 m
2001 Bath County, USA World’s highest output pump turbine of unit power 480MW
2010 Frades II, Portugal 372 MW pump turbine, Europe’s most powerful variable speed motor generator with speed range from 350 rpm to 381 rpm
2011 HongrinLeman,Switzerland
5 stage radial pumps, P :118 MW, H : 865 m
2017 Chan Long Shan, China 357 MW pump turbine, H : from 690 m to 760 m
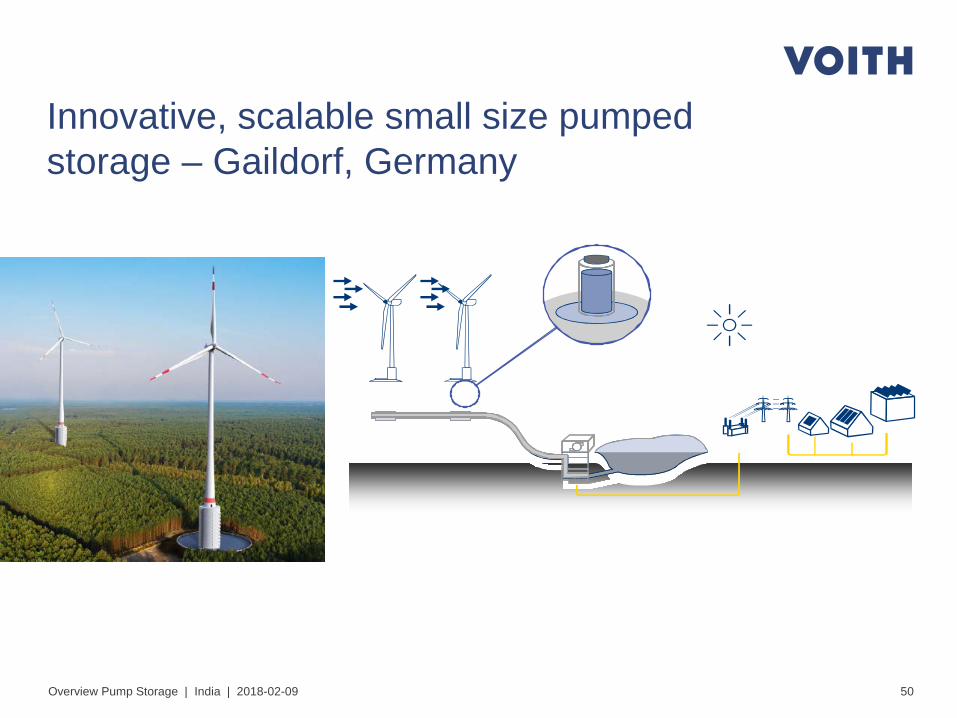
50
Innovative, scalable small size pumped storage – Gaildorf, Germany
Overview Pump Storage | India | 2018-02-09

51
Source: Brochure Naturstrom EN, Naturstromspeicher GmBH
Wind Turbine Capacity 4 x 3.4 MW Pump Storage Capacity(speed variable; hydrauliccircuit operation)
3 x 5.3 MW
Rotor Diameter 137m Runner Diameter 1.150m
Wind Power (~ 6.2 m/s) 42 GWh Storage Capacity 70 MWh
Installation Height (Hub) 155 – 157m Net Head 200m
Gaildorf – Combination of Wind and Water
Overview Pump Storage | India | 2018-02-09

52
• CO2 emissions are zero during operation since generation with wind & storage in pumped mode & generation in turbine mode are CO2-free
• Complete coverage of the electrical energy consumption of the city of Gaildorf with 12,000 inhabitants
• Savings of approximately 10,000 tons of black coal or25,000 tons of lignite coal & corresponding CO2 emissions
• Standardized pumped storage power plants (16/24/32 MW)
• Several project synergies PSP with a wind farm: substation, access roads, planning, land use, project & operation management, project volume, ...
Advantages for on-site integration of PSP with wind farm in Gaildorf (I)
Overview Pump Storage | India | 2018-02-09

53
• In Germany a fast & easy approval process for windfarms is in place, otherwise very massive public interventions due to the artificial upper reservoir
• Integration of the upper reservoir in the towers of the wind turbines reduces the interference in the natural areas significantly
• Short project implementation (3-5 years versus 10-15 years for large pumped storage power plants)
• Easily bankable power plant solution
• Smoothening effects of the wind volatility regarding over-all power output
Advantages for on-site integration of PSP with wind farm in Gaildorf (II)
Overview Pump Storage | India | 2018-02-09

54Overview Pump Storage | India | 2018-02-09
• Todays pump storage power plant concepts are reversible pump turbines or ternary units (Pu+Tu)
• Input regulation during pump mode requires speed variable units orthe possibitly to operate in hydraulic circuit
• Speed variable units are equipped with synchronous motor-generator with a full power convertor between grid and stator or double feed induction machine with AC-excitation for the rotor
• Operating scheme including grid services of a modern pump storage plant must be well known to consider the necessaryfeatures at the E/M equipment, BoP and civil works
Summary


Contact:
Sanjai Dhar DwivediAssistant Vice President – Turbine and Valve Engg
Tel. +91 120 30 74 242
Mobile +91 [email protected]
Overview Pump Storage | India | 2018-02-09