Progress report on bridging data gaps - NGFS
52
Network for Greening the Financial System Technical document Progress report on bridging data gaps May 2021
-
Upload
khangminh22 -
Category
Documents
-
view
3 -
download
0
Transcript of Progress report on bridging data gaps - NGFS
Network for Greening the Financial System Technical document
Progress report on bridging data gapsMay 2021
NGFS REPORT2
Climate change poses a fundamental threat to our prosperity and collective well-being. As extreme weather events increase sharply and biodiversity declines at an alarming rate around the globe, devising effective means to address climate-related and environmental risks becomes more urgent by the second.
The Network for Greening the Financial System (NGFS) aims to contribute to this effort. From our inception in 2017, we have worked to strengthen the global response required to meet the goals of the Paris Agreement. Policymakers need to act urgently to strengthen the role that the financial system can play in managing climate-related risks and mobilizing capital for green and low-carbon investments.
Over the years, the lack of good quality and readily accessible climate-related data has posed a challenge for central banks, supervisors and financial sector participants alike. Against this backdrop, in 2020 the NGFS set up a Workstream dedicated to more systematically mapping such data gaps and proposing ways to bridge them. This report lays the groundwork for a comprehensive stock-take of the data needs, objectives and activities of stakeholders across the financial sector, and identifies ways to further bridge gaps.
Better data does not simply mean more data. Both the public sector and the private sector need high-quality, granular, reliable and comparable climate-related data. The findings of this report suggest that we need to foster convergence towards more consistent and more easily accessible data, and ultimately build up a global climate information architecture in a series of steps. First, we must promote rapid convergence towards a common and consistent set of global sustainability disclosure standards. Second, we must support efforts towards a minimally accepted global taxonomy. Third, we must develop clear metrics and methodologies for climate-related and environmental risks that help decision-making by organizations and individuals in the financial sector.
Importantly, we – financial institutions, investors, supervisors and central banks – need to act urgently. As this report shows, there is significant scope to already start leveraging available data and approaches.
The NFGS will continue its work to identify and prioritize data needs, enhance the availability, reliability and comparability of climate-related data, and develop policy recommendations to bridge the data gaps identified. A final report will be published towards the end of the year.
We are grateful to all NGFS members and observers for their ongoing contributions to this work. Our special thanks go to the lead authors of this progress report and its contributors, as well as the NGFS Secretariat. Their tireless efforts continue to make it possible for us to carry forwards the mission of the NGFS and promote a more sustainable and climate-conscious financial system.
Patrick Amis
Co-Chair of the Workstream on bridging the data gaps
Fabio Natalucci
Co-Chair of the Workstream on bridging the data gaps
Frank Elderson
Chair of the NGFS
Joint foreword by Frank Elderson, Patrick Amis and Fabio Natalucci
NGFS REPORT 3
Table of Contents
Executive summary 4
1. Introduction 101.1. Climate change and the data challenge 10
1.2. Mandate and work programme of the NGFS Workstream on bridging the data gaps (WS BDG) 10
2. A repository of data needs 132.1. Taking stock of stakeholders’ needs 14
2.2. Identifying common metrics 15
2.3. Deriving the raw data items needed 18
3. Key issues related to data availability, reliability and comparability 213.1. Issues related to data availability 21
3.2. Issues related to data reliability and comparability 23
3.3. Key findings from the workshops 25
4. Building blocks to bridge the data gaps 274.1. Disclosure standards 28
4.2. Taxonomies 31
4.3. Metrics, labels and methodological standards 32
4.4. Existing sources and approaches 36
Acknowledgements 45
List of acronyms 46
List of boxes and figures 48
Annex: Glossary of use cases 49
NGFS REPORT4
Climate change and the data challenge
Reliable and comparable climate-related data are crucial for financial institutions (including central banks and supervisors), investors and policymakers to assess financial stability risks, properly price and manage climate-related risks, and take advantage of the opportunities arising from the transition to a low-carbon economy. Such climate-related data are key for microprudential and macroprudential supervision. They also enable financial institutions and investors to gauge the financial repercussions of climate change and increase their resilience to climate-related risks. Moreover, they enable financial institutions to ensure that
Executive summary
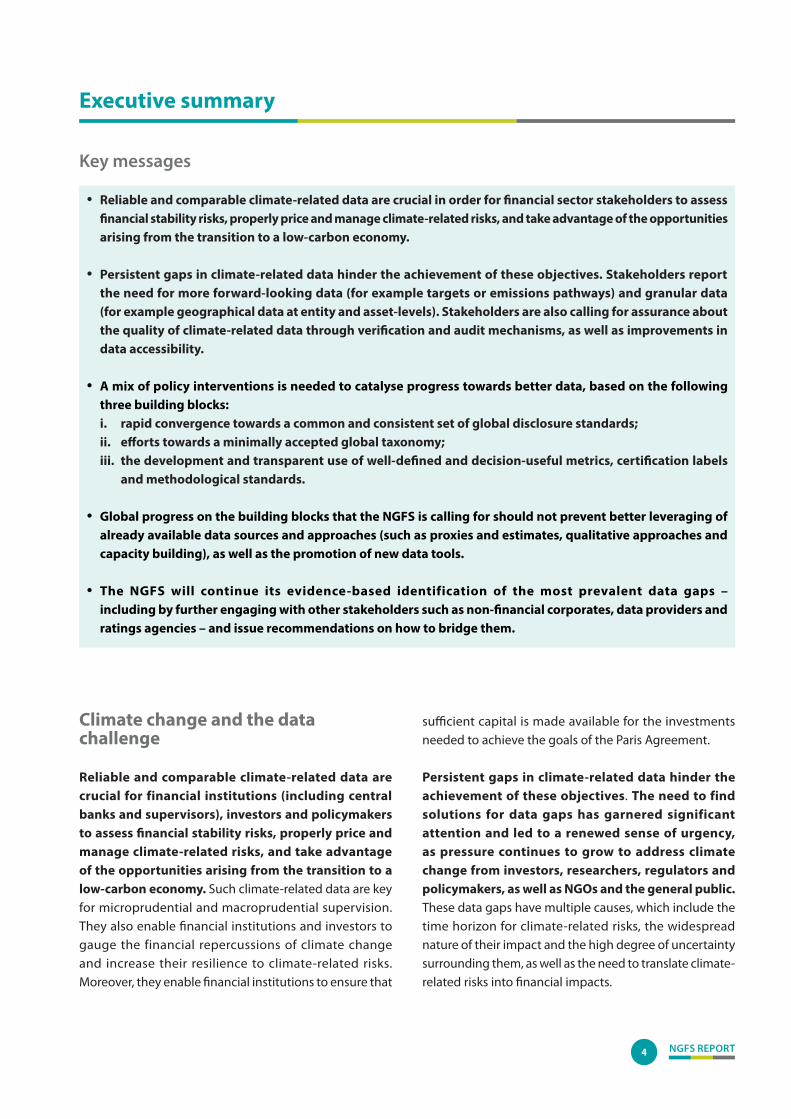
• Reliable and comparable climate-related data are crucial in order for financial sector stakeholders to assess financial stability risks, properly price and manage climate-related risks, and take advantage of the opportunities arising from the transition to a low-carbon economy.
• Persistent gaps in climate-related data hinder the achievement of these objectives. Stakeholders report the need for more forward-looking data (for example targets or emissions pathways) and granular data (for example geographical data at entity and asset-levels). Stakeholders are also calling for assurance about the quality of climate-related data through verification and audit mechanisms, as well as improvements in data accessibility.
• A mix of policy interventions is needed to catalyse progress towards better data, based on the following three building blocks: i. rapid convergence towards a common and consistent set of global disclosure standards;ii. efforts towards a minimally accepted global taxonomy;iii. the development and transparent use of well-defined and decision-useful metrics, certification labels
and methodological standards.
• Global progress on the building blocks that the NGFS is calling for should not prevent better leveraging of already available data sources and approaches (such as proxies and estimates, qualitative approaches and capacity building), as well as the promotion of new data tools.
• The NGFS will continue its evidence-based identification of the most prevalent data gaps – including by further engaging with other stakeholders such as non-financial corporates, data providers and ratings agencies – and issue recommendations on how to bridge them.
Key messages
sufficient capital is made available for the investments needed to achieve the goals of the Paris Agreement.
Persistent gaps in climate-related data hinder the achievement of these objectives. The need to find solutions for data gaps has garnered significant attention and led to a renewed sense of urgency, as pressure continues to grow to address climate change from investors, researchers, regulators and policymakers, as well as NGOs and the general public. These data gaps have multiple causes, which include the time horizon for climate-related risks, the widespread nature of their impact and the high degree of uncertainty surrounding them, as well as the need to translate climate-related risks into financial impacts.
NGFS REPORT 5
Mandate and work programme of the Workstream on bridging the data gaps (WS BDG)
The Network for Greening the Financial System (NGFS) set up the Workstream on bridging the data gaps (WS BDG) in July 2020 to identify climate-related data needs and data gaps and to propose policy recommendations to bridge such gaps. The WS BDG represents the implementation of Recommendation n° 3 “Bridging the data gaps” issued in April 2019 in the First comprehensive report by the NGFS. More specifically, in line with its mandate, the work of the WS BDG is structured according to the following three-phase approach:i Identify data items needed by the financial sector –
including central banks and supervisors – for the purpose of climate-related risk analysis and the scaling up of green finance.
ii Determine whether the data items are available, and if so, identify their data sources and limitations for accessing them.
iii Provide guidance and recommendations on how to bridge the data gaps identified.
This Progress report forms part of the first phase of the Workstream’s work programme and, in setting out the issues that need to be considered going forward, lays the groundwork for a comprehensive assessment of climate-related data needs and gaps. The Workstream completed a systematic literature review, undertook outreach to a variety of international organizations and other relevant stakeholders, and conducted a survey and two closed-door workshops with banks and buy-side firms. Given the breadth and magnitude of climate-related risks, and the urgent need for action, this report is narrowly focused on climate-related data issues, both at a granular
level (such as firm-level data and asset-level exposures) and at an aggregate level (such as data on the incidence of natural disasters at the regional or country level). Broader environmental data issues, for example those related to biodiversity, may be addressed in the future. It should be noted that climate change research, methodologies and metrics for application in the financial sector are evolving quickly and further data needs will continue to emerge over time.
A repository of data needs
The NGFS has adopted a user-centric approach informed by interactions with a vast number of stakeholders1 from a wide range of geographies and areas of expertise. As data gaps are cross-cutting issues that affect a large number of public and private sector stakeholders, a user-centric approach represents a transparent and open-ended starting point to jointly determine what data are needed across stakeholders. This report proposes a classification of a number of use cases that define the application of climate-related data for key stakeholder groups in the financial sector. Identifying these use cases, understanding what metrics and methodologies support them, and relating them to the raw data items that feed those metrics are key for systematically mapping the data needs, and subsequently, the data gaps. To this end, the Workstream has set up a three-layered repository of data needs in which detailed results for use cases, metrics, and raw data items are recorded. The repository will play an important role in phases 2 and 3 of the work programme and will allow the NGFS to draw conclusions about which data gaps to prioritize. A schematic overview of the data repository is presented in Figure 1.2
1 Note that, at this stage, the liability side of the insurance sector is not included in this assessment.
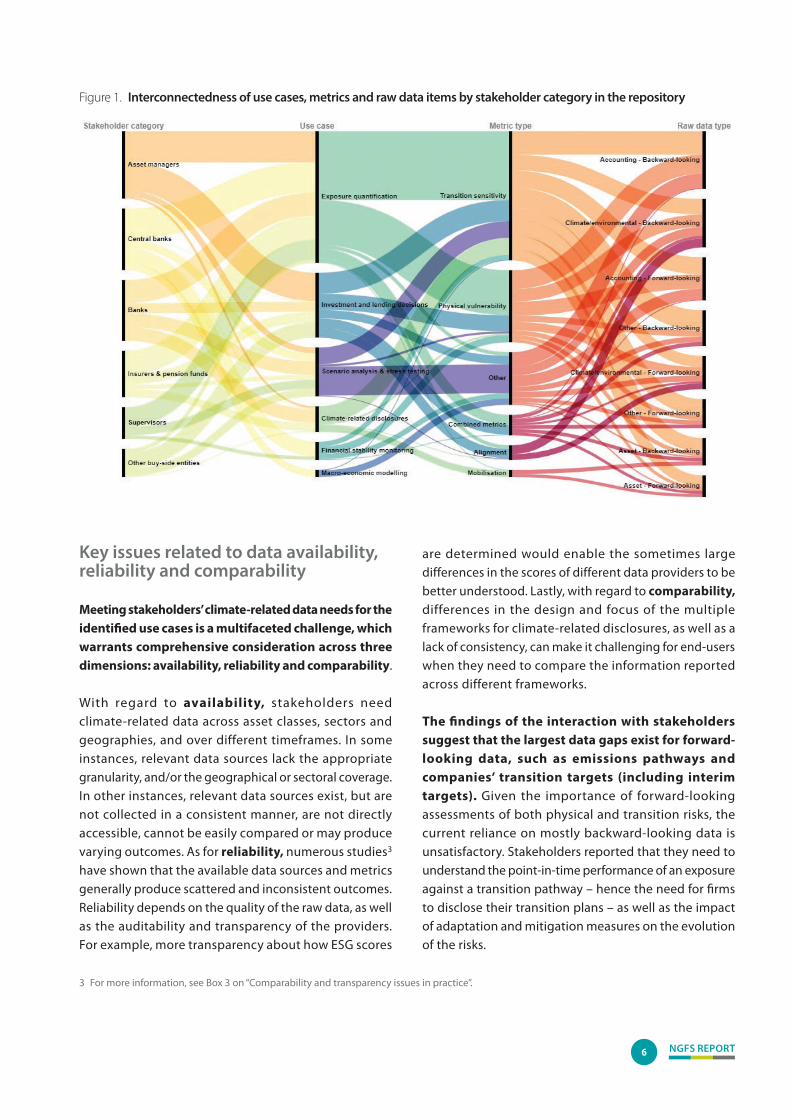
2 This figure gives a schematic overview of the data repository: from left to right, it shows the six stakeholder categories, their use cases for climate-related data, the metrics required to support the use cases, and the raw data items that feed the metrics.
NGFS REPORT6
Key issues related to data availability, reliability and comparability
Meeting stakeholders’ climate-related data needs for the identified use cases is a multifaceted challenge, which warrants comprehensive consideration across three dimensions: availability, reliability and comparability.
With regard to availability, stakeholders need climate-related data across asset classes, sectors and geographies, and over different timeframes. In some instances, relevant data sources lack the appropriate granularity, and/or the geographical or sectoral coverage. In other instances, relevant data sources exist, but are not collected in a consistent manner, are not directly accessible, cannot be easily compared or may produce varying outcomes. As for reliability, numerous studies3 have shown that the available data sources and metrics generally produce scattered and inconsistent outcomes. Reliability depends on the quality of the raw data, as well as the auditability and transparency of the providers. For example, more transparency about how ESG scores
are determined would enable the sometimes large differences in the scores of different data providers to be better understood. Lastly, with regard to comparability, differences in the design and focus of the multiple frameworks for climate-related disclosures, as well as a lack of consistency, can make it challenging for end-users when they need to compare the information reported across different frameworks.
The findings of the interaction with stakeholders suggest that the largest data gaps exist for forward-looking data, such as emissions pathways and companies’ transition targets (including interim targets). Given the importance of forward-looking assessments of both physical and transition risks, the current reliance on mostly backward-looking data is unsatisfactory. Stakeholders reported that they need to understand the point-in-time performance of an exposure against a transition pathway – hence the need for firms to disclose their transition plans – as well as the impact of adaptation and mitigation measures on the evolution of the risks.
3 For more information, see Box 3 on “Comparability and transparency issues in practice”.
Figure 1. Interconnectedness of use cases, metrics and raw data items by stakeholder category in the repository

NGFS REPORT 7
Stakeholders also highlighted the currently limited availability and granularity of “carbon” data (such as Scope 3 emissions, data on avoided emissions) and geographical data on asset locations, to assess both transition and physical risks. Since there are large geospatial differences in the manifestation and evolution of physical risks, it is critical to make asset location data available to determine the variety and severity of the physical threats of climate change.
Building blocks to bridge the data gaps
To ensure the availability of reliable and comparable climate-related data, a mix of policy interventions is needed to catalyse progress. Three building blocks are paramount: 1) rapid convergence towards a common and consistent
set of global disclosure standards, 2) efforts towards a minimally accepted global taxonomy,
and 3) the development and transparent use of well-defined
and decision-useful metrics, certification labels and methodological standards.
Many of the stakeholders with which the Workstream has interacted during the first phase of its work programme have made policy suggestions for bridging the data gaps: policymakers should take urgent steps to improve climate-related disclosures and strive to converge towards a set of consistent global standards and disclosure requirements. They should also aim to achieve a minimally accepted global taxonomy to enhance reliability, availability and comparability of reported data. Moreover, relevant and consistent metrics and methodological standards are important for the development of disclosure standards.
1. Disclosure frameworks
While some progress has been made in recent years, climate-related disclosures by financial and non-financial companies are still limited, fragmented and inconsistent across economic sectors. Financial institutions stress the degree to which they rely on disclosures from the wide range of corporates that they invest in, lend to or insure. It is essential
for them to have access to information regarding the climate risks and opportunities faced by the corporates they are exposed to. Meanwhile, corporates also face challenges in providing climate-related data to their stakeholders amid a fragmented landscape of still largely voluntary disclosure frameworks. The main issues identified relate to the voluntary nature of disclosure frameworks, the fragmentation in the landscape, the absence of technical guidance and independent verification, and the lack of a common approach to materiality. Moreover, different definitions and thresholds for materiality with respect to climate issues also affect the availability of climate-related data.
Convergence towards a global disclosure framework, alongside progress towards a globally consistent set of minimal climate disclosure standards and requirements is likely to improve the availability and comparability of climate-related data. A stronger push for consistency across sectors and regions, and an appropriate scope for disclosures is a prerequisite for an adequate disclosure framework for the financial sector. Notably, at the beginning of 2021 the IFRS Foundation announced a plan to establish a sustainability standards board with support from IOSCO and building on existing frameworks, such as the Task Force on Climate-related Financial Disclosures (TCFD) and the prototype developed by the “group of five”, namely the Carbon Disclosure Project (CDP), Climate Disclosure Standards Board (CDSB), Global Reporting Initiative (GRI), the International Integrated Reporting Council (IIRC) and the Sustainability Accounting Standards Board(SASB).4
This will pave the way for greater consistency and the convergence of sustainability-related financial reporting standards, with climate standards being prioritised.
Mechanisms for verifying and auditing climate-related financial disclosures are essential to make data reliable and comparable. The development of sufficiently granular methodological standards that prescribe how data items are defined and how metrics are to be computed is a precondition for assuring the quality of disclosures. In turn, external assurance of such information facilitates the appropriate application of standards and definitions. Some stakeholders have called for an assurance framework similar to the one for financial statements and its integration in mainstream financial reporting.
4 For information on the prototype developed by the “group of five“, see Reporting on enterprise value, Illustrated with a prototype climate-related financial disclosure standard, December 2020.
NGFS REPORT8
2. Taxonomies
Taxonomies are another building block in improving data reliability and comparability, and therefore providing financial institutions and investors with relevant information. Many stakeholders consider developing taxonomies as a prerequisite for consistent collection of data and comparable analysis based on these data. Currently, different jurisdictions are establishing different, separate taxonomies for green finance, including pathways and targets that are relevant in their regional context. Many stakeholders point to the need to recognize transition pathways in taxonomies, as a way of catering for differences in regional starting points and facilitating transition financing for companies and other economic players that aim to improve their environmental impact. Other stakeholders questioned the added complexity this would bring to the task of developing a minimally accepted harmonized taxonomy and suggested that disclosing the pathways and distance to targets would be an easier way forward. There is therefore a need for cross-regional discussion on taxonomies. Efforts towards developing a globally agreed upon taxonomy could help ensure worldwide comparability of raw data. The convergence of different taxonomies over time will be important in ensuring consistency in climate-related disclosures.
There is a need to intensify and coordinate the development of taxonomies across the globe, and to examine the possibility of harmonizing them over time. Such efforts need to be intensified and well-coordinated, especially in regions where taxonomies do not yet exist. These are important steps towards the development of a global taxonomy. Limiting the scope to that of a climate-related taxonomy first (as opposed to including issues such as biodiversity which could well be added as a next step) may be a pragmatic way forward. For example, the International Platform on Sustainable Finance has created a dedicated working group on taxonomies to comprehensively compare existing European and Chinese taxonomies for environmentally sustainable investments and identify commonalities and differences in their respective approaches, criteria and outcomes.
3. Certification labels, methodological standards and consistent metrics
Certification labels5 and harmonized methodological standards are key to improving data reliability and comparability. They can make it easier to identify climate-related data and construct datasets (for example, energy efficiency certificates). Certification labels should be harmonized across regions and the information they certify should be made comparable, homogeneous and easily available.
Data comparability is also enhanced when financial market participants harmonize their approaches. The methodologies and disclosure frameworks observed by the NGFS often rely on different computation methods, even for key metrics used across stakeholders and geographies. Such divergences can hinder the comparability of climate-related data, with a profound effect on the outcomes of analyses, especially as transparency regarding the methods adopted is limited. For example, De Nederlandsche Bank has recently shown that inflation and exchange rate effects can have a substantial impact on the outcomes of relative carbon footprint metrics.6 If financial market participants adopt harmonized approaches, this supports the comparability of data. It is worth noting that a number of initiatives have led to open source methodologies and voluntary methodological standards being produced which are then widely used. For example, one such methodological standard is the attribution methodology for the computation of financed emissions by the Partnership for Carbon Accounting Financials (PCAF), which has been embraced by the Greenhouse Gas (GHG) Protocol.
Leveraging existing data sources and approaches
The NGFS notes that there is substantial scope for financial institutions to better leverage already available data sources and approaches. Notwithstanding the need to make progress on the three aforementioned building blocks, financial institutions can also make better use of
5 A certification label is a label or symbol indicating that compliance with standards has been verified. Use of the label is usually controlled by the standard-setting body. Where certification bodies certify against their own specific standards, the label can be owned by the certification body. Examples are Energy Performance Certificates or ISO standards.
6 See Janssen, A., Dijk, J. and Duijm, P., “Misleading Footprints, Inflation and exchange rate effects in relative carbon disclosure metrics”, DNB Occasional Paper, Vol. 19(1), 28 January 2021.
NGFS REPORT 9
Identifying and prioritizing data needs: use cases, metrics that serve the use cases and the raw data items needed for those metrics
The NGFS will further expand its engagement with stakeholders and, using the data repository, aims to draw evidence-based conclusions about which data needs should be prioritized. To this end, the NGFS will: • engage with a broad set of stakeholders, including non-financial corporates (which constitute the first input in the
data chain), central banks and international financial institutions (whose statistical functions are key to help bridge the gaps), data providers and rating agencies, in order to determine whether the data needs identified can be addressed and, if not, how the gaps can be bridged;
• further assess the types of metrics that are most suited to support the different use cases identified in the first phase.
Meeting data needs across three main data dimensions: availability, reliability and comparability
Going forward, the NGFS will:• examine possible recommendations for increasing data availability, including initiatives that make data available
free of charge or at nominal cost to cover data processing; • consider the types of verification scheme that could enhance the quality of raw data items, and issue
recommendations for achieving greater transparency and comparability on methodologies.
Developing policy recommendations to help bridge data gaps
The NGFS will, in liaison with relevant stakeholders:• identify how the progressive harmonization of metrics and methodological standards, certification labels and
taxonomies can contribute to the reliability and comparability of data, together with a wider implementation of mandatory disclosures in financial statements. In doing so, the NGFS will engage with relevant stakeholders, including non-financial corporates and methodologies providers;
• examine how publicly accessible databases can improve data availability and comparability. In doing so, the NGFS will reach out to initiatives that pool climate-related raw data in a single point and to relevant stakeholders in the field of geospatial data, paying specific attention to the use of new technologies (such as artificial intelligence).
Next steps
proxies and estimates, as well as qualitative approaches, while they build up capacity to enhance their ability to process climate-related data. Moreover, many existing approaches might be usefully applied in any of these building blocks. For instance, voluntary standards developed in the markets might provide to be valuable building blocks for harmonized disclosure frameworks.
The promotion of new data tools and analytics, and more generally digitalization, as well as repositories to make data collection more transparent are also useful. The development of new data tools can provide technical solutions for accessing data, and repositories could be helpful in pointing to existing climate-related data. Indeed, many stakeholders emphasized that they often face technical obstacles when working with climate-related data.
Access to existing climate-related data is often difficult, because data are scattered across different sources and/or only available via private data providers. Publicly available repositories could be helpful as a way of pointing to existing climate-related data and informing users on how best to access relevant data sources. Solutions such as open source architecture for data collection and distribution and machine learning techniques may also play a role in making scattered information available in a more structured format. However, more work needs to be done to make existing data more broadly available to policymakers and investors. To date, several initiatives have been launched with a view to pooling climate-related raw data in a single point (see Box 10 for a case study in Mexico). It would be worth examining how these can improve data availability and comparability.
NGFS REPORT10
1.1. Climate change and the data challenge
Measures are being taken urgently, including by central banks and supervisors, to prepare the economy and the financial system for the anticipated consequences of climate change, both in terms the risks (i.e. physical and transition risks) and opportunities arising from the transition to a low-carbon economy. To address these unprecedented challenges, more than 80 central banks and supervisors have joined forces in the NGFS to pool their analytical and methodological capabilities and to build up a meaningful information base.
Reliable and comparable climate-related data are crucial for financial institutions, including central banks and supervisors, as well as for investors and policymakers to assess risks to financial stability, properly price and manage climate-related. Such climate-related data are key for microprudential and macroprudential supervision. They also enable financial institutions and investors to gauge the financial repercussions of climate change and thereby increase their resilience to climate-related risks. Moreover, climate-related data enable financial institutions to ensure that sufficient capital is made available for the investments needed to achieve the goals of the Paris Agreement.
Persistent gaps in climate-related data hinder the achievement of these objectives. These data gaps have multiple causes, which include the time horizon for climate-related risks, the widespread nature of their impact and the high degree of uncertainty surrounding them, as well as the need to translate climate-related risks into financial impacts. There is increasing demand for forward-looking data,
since past trends do not typically reflect the nature and extent of climate-related risks. A large amount of information at a very granular level is also required. In particular, there is a growing need for detailed geographical data on asset locations in order to assess physical risks, and for more details on the emissions along the value chains across countries and sectors. The need to find solutions for data gaps has garnered significant attention and led to a renewed sense of urgency as pressure to address climate change continues to grow from investors, researchers, regulators and policymakers as well as NGOs and the general public.
1.2. Mandate and work programme of the NGFS Workstream on bridging the data gaps (WS BDG)
The NGFS set up the Workstream on bridging the data gaps (WS BDG) in July 2020 to identify data needs and data gaps and to propose policy recommendations to bridge such gaps. The WS BDG represents the implementation of Recommendation n°3 “Bridging the data gaps” issued in the April 2019 First comprehensive report by the NGFS.7 In accordance with its mandate, the work of the WS BDG is structured according to the following three-phase approach:i. Identify data items needed by the financial sector –
including central banks and supervisors – for the purpose of climate-related risk analysis and the scaling up of green finance.
ii. Determine whether the data items are available, and if so, identify their data sources and limitations for accessing them.
iii. Provide guidance and recommendations on how to bridge the data gaps identified.
1. Introduction
7 NGFS, “A call for action: Climate change as a source of financial risk”, First comprehensive report, April 2019.
NGFS REPORT 11
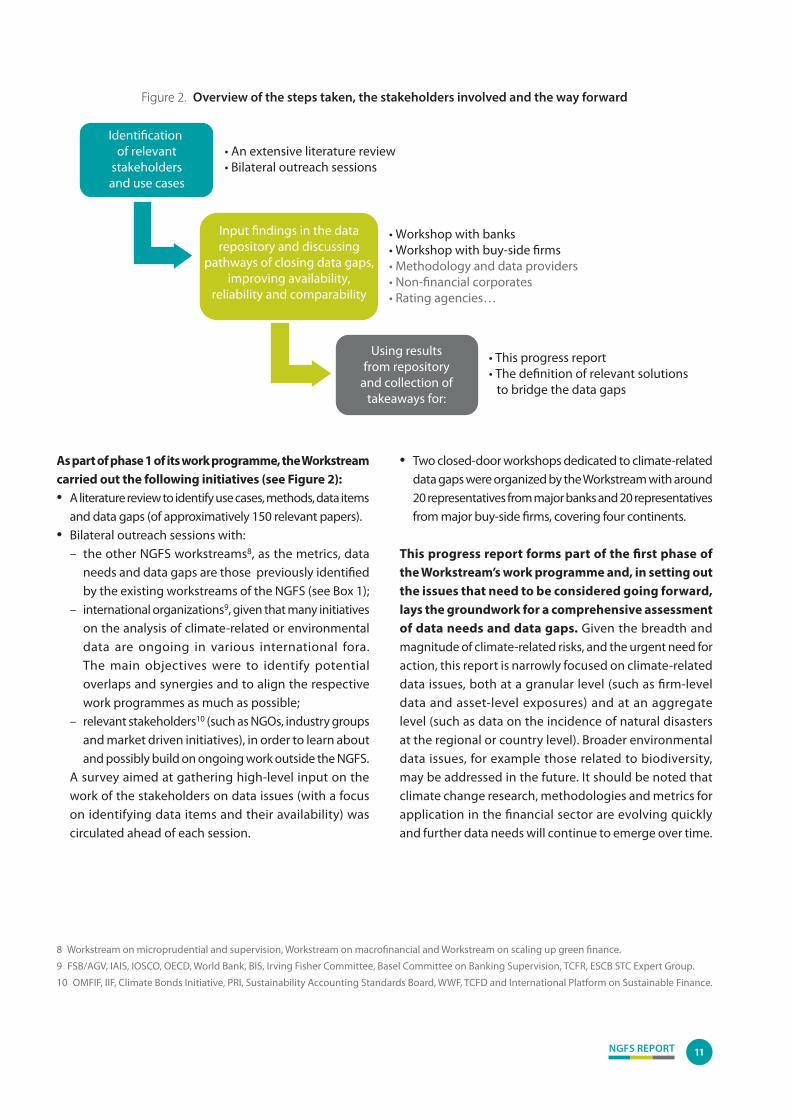
As part of phase 1 of its work programme, the Workstream carried out the following initiatives (see Figure 2):• A literature review to identify use cases, methods, data items
and data gaps (of approximatively 150 relevant papers). • Bilateral outreach sessions with:
– the other NGFS workstreams8, as the metrics, data needs and data gaps are those previously identified by the existing workstreams of the NGFS (see Box 1);
– international organizations9, given that many initiatives on the analysis of climate-related or environmental data are ongoing in various international fora. The main objectives were to identify potential overlaps and synergies and to align the respective work programmes as much as possible;
– relevant stakeholders10 (such as NGOs, industry groups and market driven initiatives), in order to learn about and possibly build on ongoing work outside the NGFS.
A survey aimed at gathering high-level input on the work of the stakeholders on data issues (with a focus on identifying data items and their availability) was circulated ahead of each session.
• Two closed-door workshops dedicated to climate-related data gaps were organized by the Workstream with around 20 representatives from major banks and 20 representatives from major buy-side firms, covering four continents.
This progress report forms part of the first phase of the Workstream’s work programme and, in setting out the issues that need to be considered going forward, lays the groundwork for a comprehensive assessment of data needs and data gaps. Given the breadth and magnitude of climate-related risks, and the urgent need for action, this report is narrowly focused on climate-related data issues, both at a granular level (such as firm-level data and asset-level exposures) and at an aggregate level (such as data on the incidence of natural disasters at the regional or country level). Broader environmental data issues, for example those related to biodiversity, may be addressed in the future. It should be noted that climate change research, methodologies and metrics for application in the financial sector are evolving quickly and further data needs will continue to emerge over time.
Figure 2. Overview of the steps taken, the stakeholders involved and the way forward
• An extensive literature review• Bilateral outreach sessions
• Workshop with banks• Workshop with buy-side firms• Methodology and data providers• Non-financial corporates• Rating agencies…
• This progress report• The definition of relevant solutions to bridge the data gaps
Identification of relevant
stakeholdersand use cases
Input findings in the data repository and discussing
pathways of closing data gaps, improving availability,
reliability and comparability
Using resultsfrom repository
and collection oftakeaways for:
8 Workstream on microprudential and supervision, Workstream on macrofinancial and Workstream on scaling up green finance.
9 FSB/AGV, IAIS, IOSCO, OECD, World Bank, BIS, Irving Fisher Committee, Basel Committee on Banking Supervision, TCFR, ESCB STC Expert Group.
10 OMFIF, IIF, Climate Bonds Initiative, PRI, Sustainability Accounting Standards Board, WWF, TCFD and International Platform on Sustainable Finance.
NGFS REPORT12
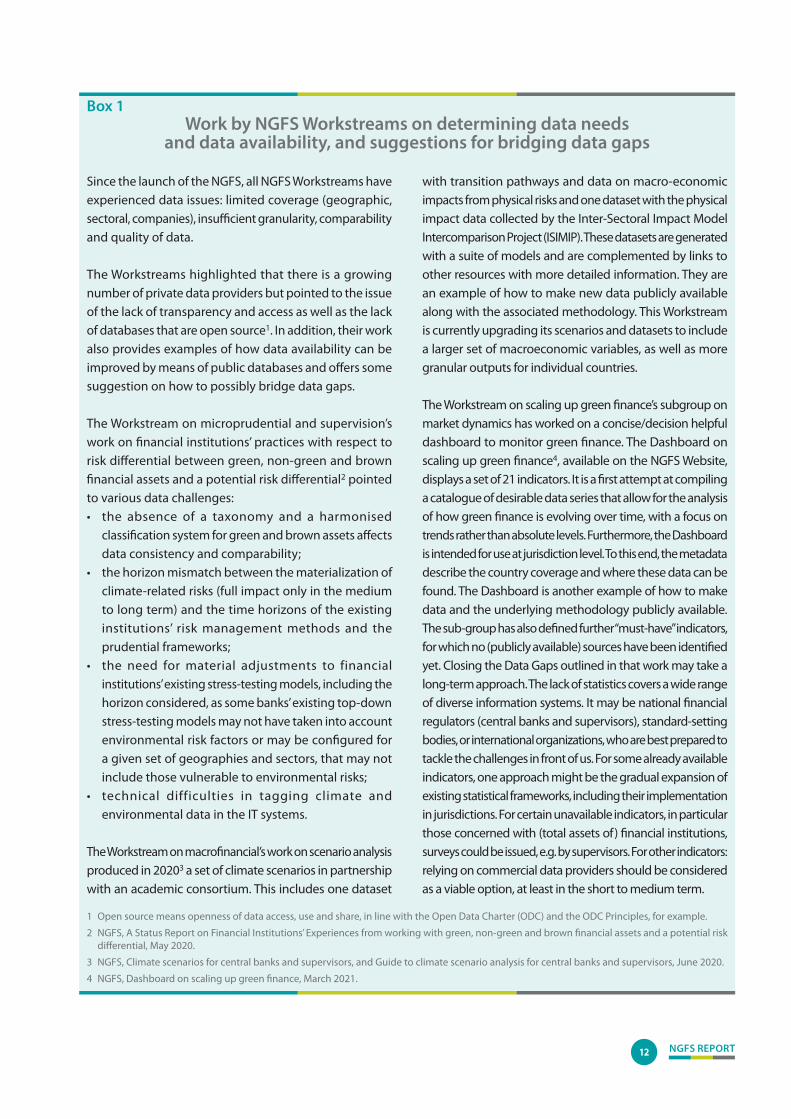
Box 1Work by NGFS Workstreams on determining data needs
and data availability, and suggestions for bridging data gaps
Since the launch of the NGFS, all NGFS Workstreams have experienced data issues: limited coverage (geographic, sectoral, companies), insufficient granularity, comparability and quality of data.
The Workstreams highlighted that there is a growing number of private data providers but pointed to the issue of the lack of transparency and access as well as the lack of databases that are open source1. In addition, their work also provides examples of how data availability can be improved by means of public databases and offers some suggestion on how to possibly bridge data gaps.
The Workstream on microprudential and supervision’s work on financial institutions’ practices with respect to risk differential between green, non-green and brown financial assets and a potential risk differential2 pointed to various data challenges: • the absence of a taxonomy and a harmonised
classification system for green and brown assets affects data consistency and comparability;
• the horizon mismatch between the materialization of climate-related risks (full impact only in the medium to long term) and the time horizons of the existing institutions’ risk management methods and the prudential frameworks;
• the need for material adjustments to financial institutions’ existing stress-testing models, including the horizon considered, as some banks’ existing top-down stress-testing models may not have taken into account environmental risk factors or may be configured for a given set of geographies and sectors, that may not include those vulnerable to environmental risks;
• technical difficulties in tagging climate and environmental data in the IT systems.
The Workstream on macrofinancial’s work on scenario analysis produced in 20203 a set of climate scenarios in partnership with an academic consortium. This includes one dataset
with transition pathways and data on macro-economic impacts from physical risks and one dataset with the physical impact data collected by the Inter-Sectoral Impact Model Intercomparison Project (ISIMIP). These datasets are generated with a suite of models and are complemented by links to other resources with more detailed information. They are an example of how to make new data publicly available along with the associated methodology. This Workstream is currently upgrading its scenarios and datasets to include a larger set of macroeconomic variables, as well as more granular outputs for individual countries.
The Workstream on scaling up green finance’s subgroup on market dynamics has worked on a concise/decision helpful dashboard to monitor green finance. The Dashboard on scaling up green finance4, available on the NGFS Website, displays a set of 21 indicators. It is a first attempt at compiling a catalogue of desirable data series that allow for the analysis of how green finance is evolving over time, with a focus on trends rather than absolute levels. Furthermore, the Dashboard is intended for use at jurisdiction level. To this end, the metadata describe the country coverage and where these data can be found. The Dashboard is another example of how to make data and the underlying methodology publicly available. The sub-group has also defined further “must-have” indicators, for which no (publicly available) sources have been identified yet. Closing the Data Gaps outlined in that work may take a long-term approach. The lack of statistics covers a wide range of diverse information systems. It may be national financial regulators (central banks and supervisors), standard-setting bodies, or international organizations, who are best prepared to tackle the challenges in front of us. For some already available indicators, one approach might be the gradual expansion of existing statistical frameworks, including their implementation in jurisdictions. For certain unavailable indicators, in particular those concerned with (total assets of) financial institutions, surveys could be issued, e.g. by supervisors. For other indicators: relying on commercial data providers should be considered as a viable option, at least in the short to medium term.
1 Open source means openness of data access, use and share, in line with the Open Data Charter (ODC) and the ODC Principles, for example.
2 NGFS, A Status Report on Financial Institutions’ Experiences from working with green, non-green and brown financial assets and a potential risk differential, May 2020.
3 NGFS, Climate scenarios for central banks and supervisors, and Guide to climate scenario analysis for central banks and supervisors, June 2020.
4 NGFS, Dashboard on scaling up green finance, March 2021.
NGFS REPORT 13
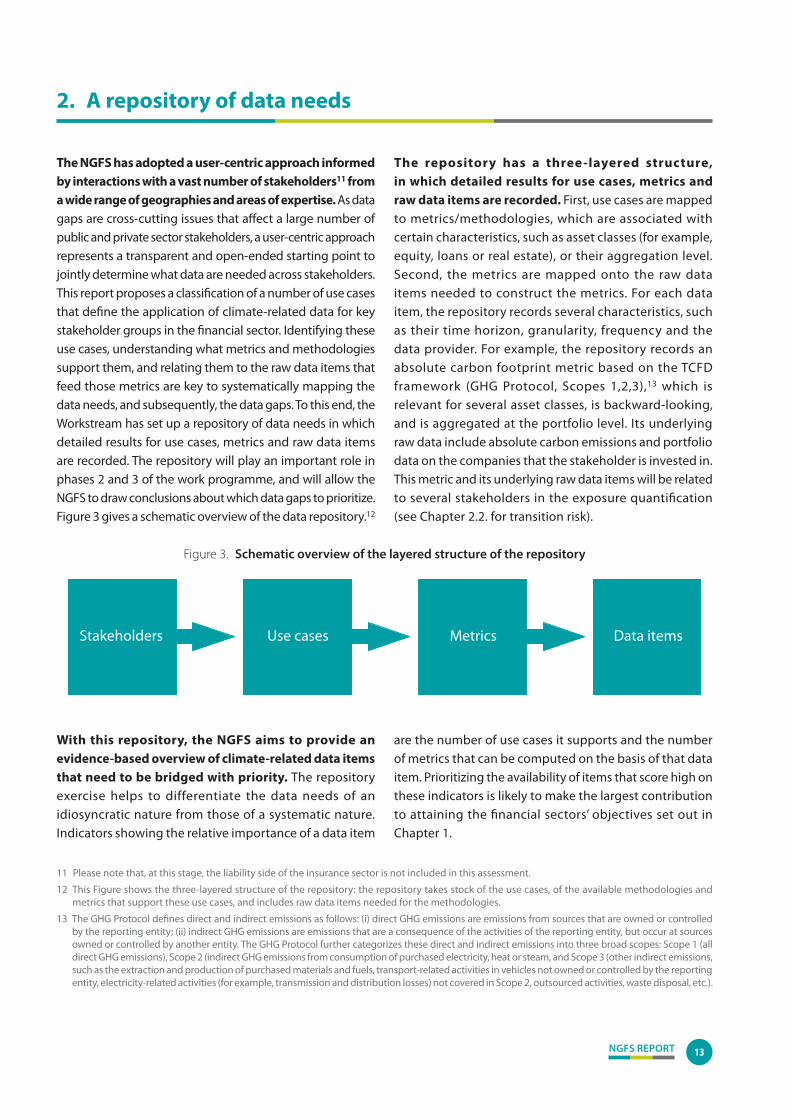
The NGFS has adopted a user-centric approach informed by interactions with a vast number of stakeholders11 from a wide range of geographies and areas of expertise. As data gaps are cross-cutting issues that affect a large number of public and private sector stakeholders, a user-centric approach represents a transparent and open-ended starting point to jointly determine what data are needed across stakeholders. This report proposes a classification of a number of use cases that define the application of climate-related data for key stakeholder groups in the financial sector. Identifying these use cases, understanding what metrics and methodologies support them, and relating them to the raw data items that feed those metrics are key to systematically mapping the data needs, and subsequently, the data gaps. To this end, the Workstream has set up a repository of data needs in which detailed results for use cases, metrics and raw data items are recorded. The repository will play an important role in phases 2 and 3 of the work programme, and will allow the NGFS to draw conclusions about which data gaps to prioritize. Figure 3 gives a schematic overview of the data repository.12
The repository has a three-layered structure, in which detailed results for use cases, metrics and raw data items are recorded. First, use cases are mapped to metrics/methodologies, which are associated with certain characteristics, such as asset classes (for example, equity, loans or real estate), or their aggregation level. Second, the metrics are mapped onto the raw data items needed to construct the metrics. For each data item, the repository records several characteristics, such as their time horizon, granularity, frequency and the data provider. For example, the repository records an absolute carbon footprint metric based on the TCFD framework (GHG Protocol, Scopes 1,2,3),13 which is relevant for several asset classes, is backward-looking, and is aggregated at the portfolio level. Its underlying raw data include absolute carbon emissions and portfolio data on the companies that the stakeholder is invested in. This metric and its underlying raw data items will be related to several stakeholders in the exposure quantification (see Chapter 2.2. for transition risk).
2. A repository of data needs
11 Please note that, at this stage, the liability side of the insurance sector is not included in this assessment.
12 This Figure shows the three-layered structure of the repository: the repository takes stock of the use cases, of the available methodologies and metrics that support these use cases, and includes raw data items needed for the methodologies.
13 The GHG Protocol defines direct and indirect emissions as follows: (i) direct GHG emissions are emissions from sources that are owned or controlled by the reporting entity; (ii) indirect GHG emissions are emissions that are a consequence of the activities of the reporting entity, but occur at sources owned or controlled by another entity. The GHG Protocol further categorizes these direct and indirect emissions into three broad scopes: Scope 1 (all direct GHG emissions), Scope 2 (indirect GHG emissions from consumption of purchased electricity, heat or steam, and Scope 3 (other indirect emissions, such as the extraction and production of purchased materials and fuels, transport-related activities in vehicles not owned or controlled by the reporting entity, electricity-related activities (for example, transmission and distribution losses) not covered in Scope 2, outsourced activities, waste disposal, etc.).
Figure 3. Schematic overview of the layered structure of the repository
Stakeholders Use cases Metrics Data items
With this repository, the NGFS aims to provide an evidence-based overview of climate-related data items that need to be bridged with priority. The repository exercise helps to differentiate the data needs of an idiosyncratic nature from those of a systematic nature. Indicators showing the relative importance of a data item
are the number of use cases it supports and the number of metrics that can be computed on the basis of that data item. Prioritizing the availability of items that score high on these indicators is likely to make the largest contribution to attaining the financial sectors’ objectives set out in Chapter 1.
NGFS REPORT14
2.1. Taking stock of stakeholders’ needs
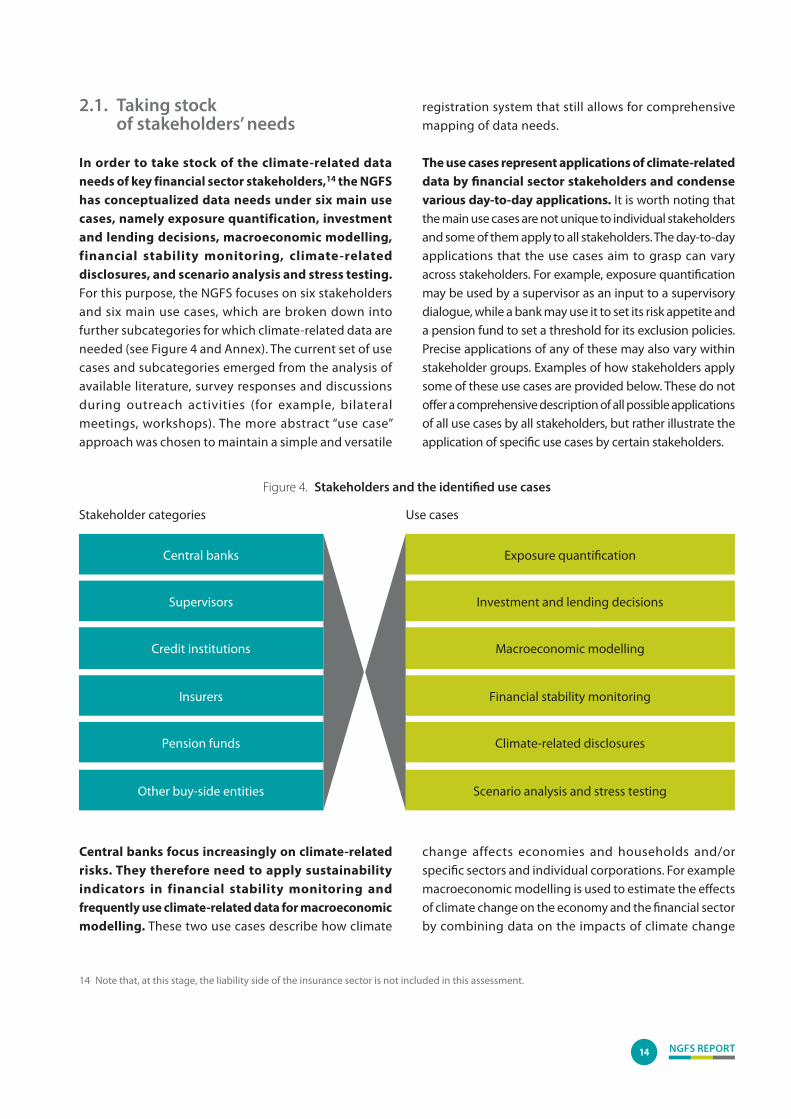
In order to take stock of the climate-related data needs of key financial sector stakeholders,14 the NGFS has conceptualized data needs under six main use cases, namely exposure quantification, investment and lending decisions, macroeconomic modelling, financial stability monitoring, climate-related disclosures, and scenario analysis and stress testing. For this purpose, the NGFS focuses on six stakeholders and six main use cases, which are broken down into further subcategories for which climate-related data are needed (see Figure 4 and Annex). The current set of use cases and subcategories emerged from the analysis of available literature, survey responses and discussions during outreach activities (for example, bilateral meetings, workshops). The more abstract “use case” approach was chosen to maintain a simple and versatile
14 Note that, at this stage, the liability side of the insurance sector is not included in this assessment.
Figure 4. Stakeholders and the identified use cases
Central banks
Supervisors
Credit institutions
Insurers
Pension funds
Other buy-side entities
Exposure quantification
Stakeholder categories Use cases
Investment and lending decisions
Macroeconomic modelling
Financial stability monitoring
Climate-related disclosures
Scenario analysis and stress testing
registration system that still allows for comprehensive mapping of data needs.
The use cases represent applications of climate-related data by financial sector stakeholders and condense various day-to-day applications. It is worth noting that the main use cases are not unique to individual stakeholders and some of them apply to all stakeholders. The day-to-day applications that the use cases aim to grasp can vary across stakeholders. For example, exposure quantification may be used by a supervisor as an input to a supervisory dialogue, while a bank may use it to set its risk appetite and a pension fund to set a threshold for its exclusion policies. Precise applications of any of these may also vary within stakeholder groups. Examples of how stakeholders apply some of these use cases are provided below. These do not offer a comprehensive description of all possible applications of all use cases by all stakeholders, but rather illustrate the application of specific use cases by certain stakeholders.
Central banks focus increasingly on climate-related risks. They therefore need to apply sustainability indicators in financial stability monitoring and frequently use climate-related data for macroeconomic modelling. These two use cases describe how climate
change affects economies and households and/or specific sectors and individual corporations. For example macroeconomic modelling is used to estimate the effects of climate change on the economy and the financial sector by combining data on the impacts of climate change
NGFS REPORT 15
15 NGFS, “Overview of Environmental Risk Analysis by Financial Institutions”, Technical document, 2020; UNEP FI reports.
16 NGFS, Dashboard on scaling up green finance, March 2021; IMF, Climate Change Indicators Dashboard.
17 See Nicol, M. and Cochran, I., “How should financial actors deal with climate-related issues in their portfolios today”, Institute for Climate Economics brief, N° 46, April 2017 for an analysis of families of climate-related indicators, their advantages and disadvantages, as well as the associated data availability issues.
with (financial) data related to a specific country, sector, portfolio or company. These models not only describe the effect of climate change, but sometimes also describe the effects of mitigating or adapting to the effects of climate change. Another example is the use of input-output models to model countries’ consumption productivity and pricing data together with emissions across the value chain of specific industries.
To gauge the potential impact of climate-related risks on financial institutions, supervisors use exposure quantification, as well as scenario analysis and stress testing. Scenario analysis and stress testing is applied to capture the size and scale of climate-related risks and assess resilience to climate-related risks, taking into account the forward-looking nature of the risks and inherent uncertainty associated with climate-related risks. The results could serve as a basis for supervisory policy development, i.e. macroprudential supervision, and for dialogues with financial institutions, i.e. microprudential supervision.
Banks, insurers (asset side), pension funds and other buy-side entities (e.g. asset managers, hedge funds) also apply scenario analyses and stress testing in order to analyse climate-related risks at both the portfolio level and at corporate level together with credit rating. Scenario analyses and stress testing can be applied once the vulnerable exposures to climate-related risks are identified (at sector, company, household and sovereign level) and the determinants of physical risks (for example, climate sensitivity of sectors, geographical location) and transition risks (for example, policy sensitivity) are assessed.
Finally, banks, insurers (asset side), pension funds and other buy-side entities (e.g. asset managers, hedge funds) also need climate-related data to make well-informed investment and lending decisions and to quantify risk exposures. For example, information on the
exposure to current and potential future climate-related risks is used in the risk management cycle of credit institutions, i.e. risk identification, risk assessment, risk mitigation and risk monitoring, and strategic decision-making. The outcome of such analyses could feed into credit models and affect pricing and investment/divestment decisions. In particular, for the use cases exposure quantification and investment and lending decisions, transition and physical risk metrics are often applied.
2.2. Identifying common metrics
Metrics are central to translating the complex impacts of climate change on the financial system into decision-useful, comparable measurements. They will ultimately enable governments, companies and individuals to better understand the risk that a changing climate poses to the financial system and how best to ensure the resilience of these systems. In recent years, a growing number of methodologies have emerged for assessing climate-related risks15 and measuring the greening of the financial system at large16. While these methodologies differ substantially in terms of modelling complexity, time horizons, scenario use, assumptions and attribution approaches, the NGFS postulates that they are ultimately based on a much smaller number of metrics. For that reason, the NGFS has endeavoured to classify the most commonly used metrics and register their use in the repository.
Establishing a system to classify metrics is key to systematically mapping climate-related data needs by different stakeholders in the financial sector (see Figure 5).17 Given the sheer number of metrics available for use in measuring climate risks, climate change impacts and the scaling up of green finance, establishing a method to classify metrics is central to understanding their features, advantages and disadvantages. It will allow the NGFS to offer more structured guidance on sets of metrics in the future and ways of improving related data availability.

NGFS REPORT16
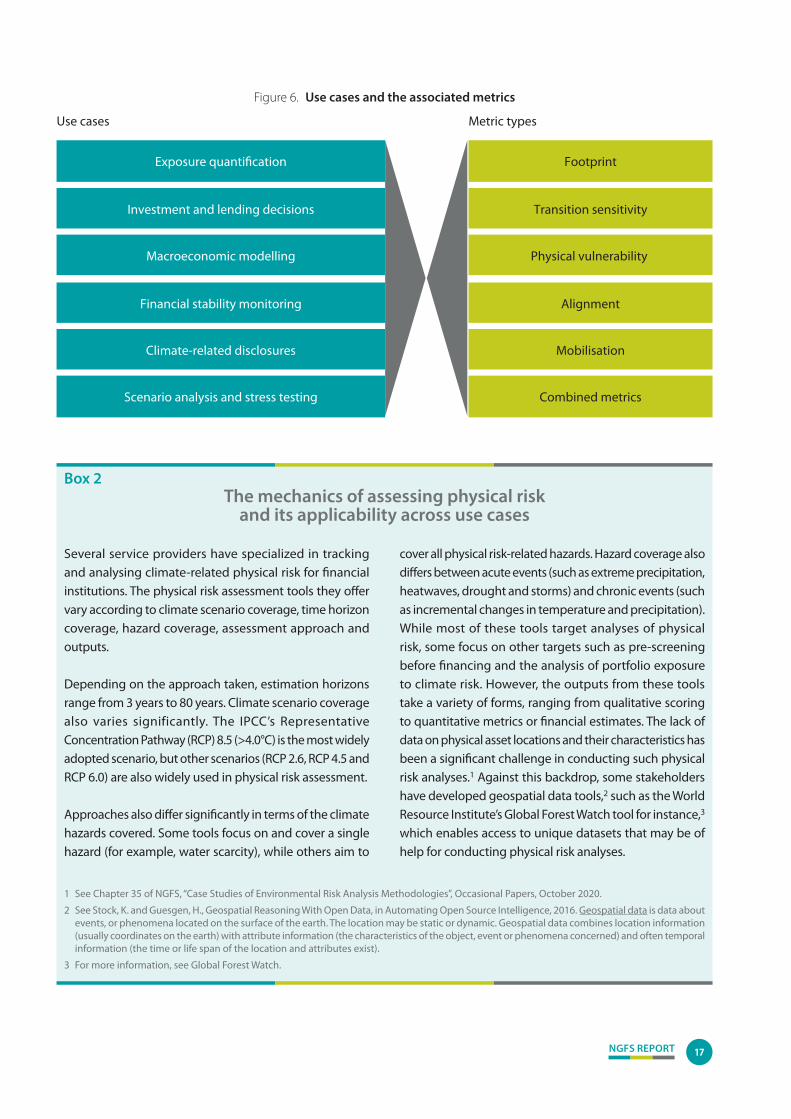
This Progress report offers a first classification into six categories of metrics, namely footprint, transition sensitivity, physical vulnerability, alignment, mobilisation (i.e. scaling up green finance) and combined metrics. Footprint metrics refer to GHG emissions caused directly or enabled by an individual, event, organisation, service or product. Transition risk refers to the disruption caused by adjusting to a low-carbon economy, which may be the result of policy changes, technological innovation or social adaptation. Physical risk refers to the direct damage to assets or property that may come about owing to a changing climate (for example rise in sea levels) or extreme weather events. Alignment metrics18 track progress towards a 2°C world, while mobilisation metrics capture growth in green financing.
For all registered use cases, the repository registers the associated metrics used, along with a classification into one of the metric types (see Figure 6). Some use cases, such as subcategories of exposure quantification, require information from a single metric type, such as physical or
transition risk, while other use cases, like stress testing or scenario analysis, require a combination of inputs across a number of different metrics. Metrics are important for understanding the implications of climate on all of the listed use cases, because it is through metrics that inputs can be changed and the impact of different conditions understood.
Looking at a case study on the impact of physical risk on a financial institution’s portfolios gives an understanding of the wide range of inputs that must be considered in order to produce metrics that are useful for a wide variety of applications (see Box 2). It is clear that, when many metrics are necessary to apply a particular (subcategory of a) use case, the metrics will also require more raw data items (across several asset classes) (see Chapter 2.3.). The layered structure of the repository can thus facilitate identification of data-heavy and less data-heavy use cases and offers an evidence-based approach to identify for which use cases and stakeholders the data needs are more prevalent.
Figure 5. Preliminary classification of available metrics
Type Subtype Example of metrics Footprints Carbon footprint indicators Financed emissions of a portfolio (PCAF)
Transition sensitivity Policy sensitivity indicators Exposures to economic activities according to the classification “Climate Policy Relevant Sectors” (CPRS, Battiston et al. 2017)1
Technology indicators Financed technology mix (e.g. percentage of coal-fired power plants in energy portfolio)
Physical vulnerability Vulnerability to chronic hazards indicators Geospatial vulnerability of business facilities to water stress
Vulnerability to acute hazards indicators Geospatial vulnerability of business facilities to flood risk
Alignment Technology pathway indicators Percentage deviation from the International Energy Agency Sustainable Development Scenario for the share of electric vehicles in car manufacturing portfolio
Temperature increase indicators Implied portfolio temperature increase or (mis)alignment with a sustainable policy scenario (e.g. Paris Agreement Capital Transition Assessment or PACTA)
Emissions intensity indicators Percentage deviation from the International Energy Agency Sustainable Development Scenario for the tailpipe emissions intensity of vehicles in car manufacturing portfolios
Mobilization (scaling up green finance)
Volumes of products indicators Share of green bonds as a percentage of total issuance
Reporting-based indicators Share of corporates that commit to Paris alignment
Standards-based indicators Share of the portfolio that is EU Taxonomy-aligned
Combined metrics ESG ratings A metric aggregating a combination of the above metrics to provide insight on the extent to which a firm manages environmental, social and governance issues
1 Battiston, S., Mandel, A., Monasterolo, I., Schütze, F., & Visentin, G. (2017). A Climate stress-test of the financial system. Nature Climate Change, 7(4), 283–288.
18 Temperature alignment is a forward-looking metric that attempts to convey the future trajectory of GHG emissions of a given entity or portfolio in terms of its estimated global temperature rise. It is designed to convey a simple story: whether the planned pathway is aligned with the goals of the Paris climate accord, for example below 2°C or a more damaging climate pathway such as 4°C. Temperature alignment is an emerging concept, and an industry-wide standard on the methodology is still evolving.
NGFS REPORT 17
Figure 6. Use cases and the associated metrics
Footprint
Transition sensitivity
Physical vulnerability
Alignment
Mobilisation
Combined metrics
Exposure quantification
Investment and lending decisions
Macroeconomic modelling
Financial stability monitoring
Climate-related disclosures
Scenario analysis and stress testing
Use cases Metric types
Box 2The mechanics of assessing physical risk
and its applicability across use cases
Several service providers have specialized in tracking and analysing climate-related physical risk for financial institutions. The physical risk assessment tools they offer vary according to climate scenario coverage, time horizon coverage, hazard coverage, assessment approach and outputs.
Depending on the approach taken, estimation horizons range from 3 years to 80 years. Climate scenario coverage also varies significantly. The IPCC’s Representative Concentration Pathway (RCP) 8.5 (>4.0°C) is the most widely adopted scenario, but other scenarios (RCP 2.6, RCP 4.5 and RCP 6.0) are also widely used in physical risk assessment.
Approaches also differ significantly in terms of the climate hazards covered. Some tools focus on and cover a single hazard (for example, water scarcity), while others aim to
cover all physical risk-related hazards. Hazard coverage also differs between acute events (such as extreme precipitation, heatwaves, drought and storms) and chronic events (such as incremental changes in temperature and precipitation). While most of these tools target analyses of physical risk, some focus on other targets such as pre-screening before financing and the analysis of portfolio exposure to climate risk. However, the outputs from these tools take a variety of forms, ranging from qualitative scoring to quantitative metrics or financial estimates. The lack of data on physical asset locations and their characteristics has been a significant challenge in conducting such physical risk analyses.1 Against this backdrop, some stakeholders have developed geospatial data tools,2 such as the World Resource Institute’s Global Forest Watch tool for instance,3 which enables access to unique datasets that may be of help for conducting physical risk analyses.
1 See Chapter 35 of NGFS, “Case Studies of Environmental Risk Analysis Methodologies”, Occasional Papers, October 2020.
2 See Stock, K. and Guesgen, H., Geospatial Reasoning With Open Data, in Automating Open Source Intelligence, 2016. Geospatial data is data about events, or phenomena located on the surface of the earth. The location may be static or dynamic. Geospatial data combines location information (usually coordinates on the earth) with attribute information (the characteristics of the object, event or phenomena concerned) and often temporal information (the time or life span of the location and attributes exist).
3 For more information, see Global Forest Watch.
NGFS REPORT18
While acknowledging the need for a forward-looking perspective, stakeholders still largely rely on metrics that are backward-looking in nature. Stakeholders frequently rely on exposure quantifications that use, for instance, footprint or transition sensitivity metrics based on averages and which are backward-looking by design. Such “point-in-time” metrics have shortcomings in that they only provide a snapshot of an evolving problem. Stakeholders have pointed out that they cannot rely on such metrics alone. They need to finance transition and analyse the pathways to climate goals over time by also using forward-looking climate metrics.
In a similar vein, stakeholders face challenges when comparing metrics for which no benchmark is provided or exists. For example, the weighted average carbon intensity of a loan book varies substantially depending on the specific composition of the loan book, not to mention the computational differences (see Chapter 4.2.). Therefore, stakeholders may not be well positioned to compare the relative riskiness or the relative environmental performance on the basis of that metric alone. Alignment
metrics are an example of context-based metrics that build in a comparison against a trend line or benchmark. For example, the open source PACTA methodology builds on highly granular physical asset data (such as steel or power plants) to assess the alignment of a financial asset portfolio with, for example, the International Energy Agency’s Sustainable Development Scenario.19
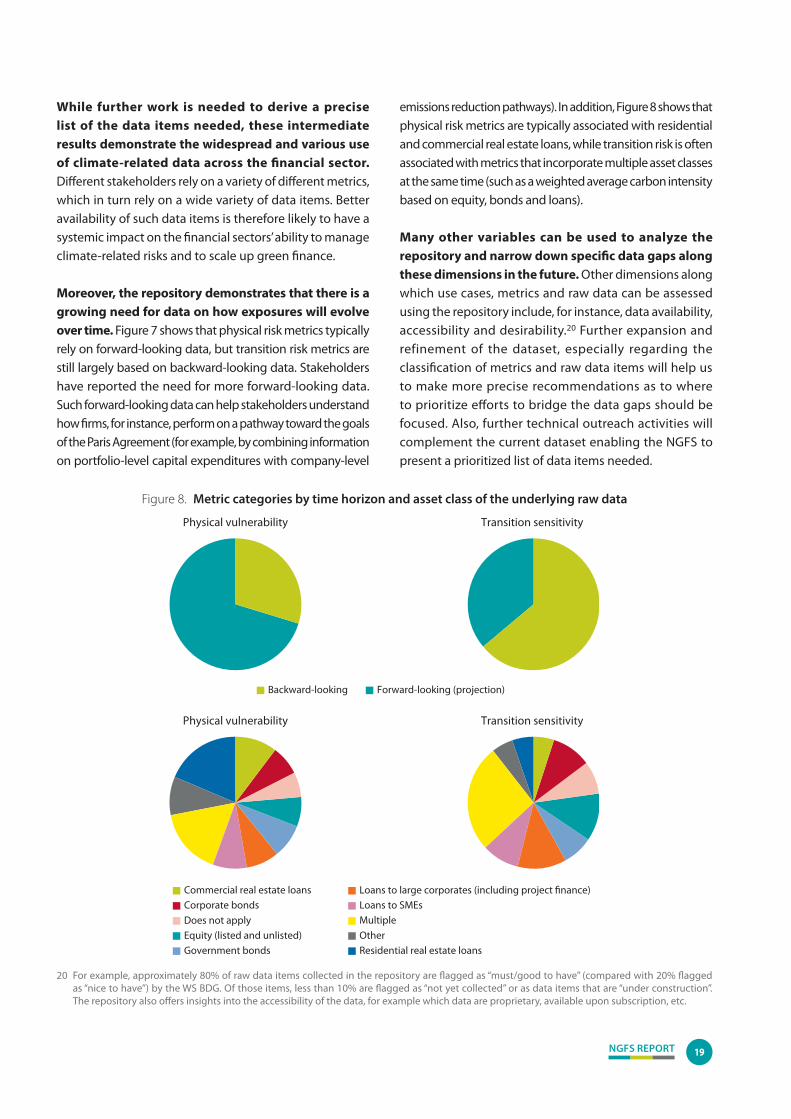
2.3. Deriving the raw data items needed
Based on the various initiatives undertaken in the first phase of its work programme, the Workstream has conducted a preliminary stock-take of the metrics and raw data items used by financial sector stakeholders across the six main use cases in its repository. Figure 7 gives a schematic overview of the data repository. From left to right, it shows the six stakeholder categories, their use cases for climate-related data, the metrics required to support those use cases and the raw data items that feed the metrics.
19 See Paris Agreement Capital Transition Assessment (PACTA), Methodology and Supporting Materials.
Figure 7. Interconnectedness of use cases, metrics and raw data items
NGFS REPORT 19
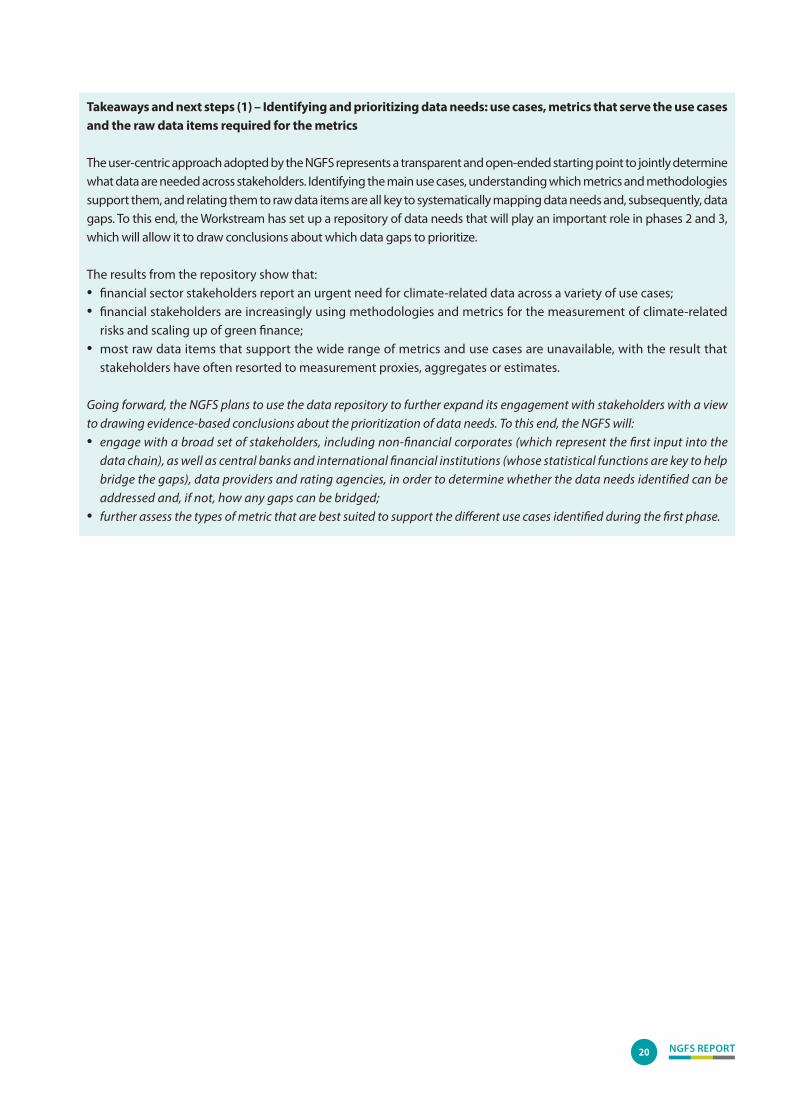
While further work is needed to derive a precise list of the data items needed, these intermediate results demonstrate the widespread and various use of climate-related data across the financial sector. Different stakeholders rely on a variety of different metrics, which in turn rely on a wide variety of data items. Better availability of such data items is therefore likely to have a systemic impact on the financial sectors’ ability to manage climate-related risks and to scale up green finance.
Moreover, the repository demonstrates that there is a growing need for data on how exposures will evolve over time. Figure 7 shows that physical risk metrics typically rely on forward-looking data, but transition risk metrics are still largely based on backward-looking data. Stakeholders have reported the need for more forward-looking data. Such forward-looking data can help stakeholders understand how firms, for instance, perform on a pathway toward the goals of the Paris Agreement (for example, by combining information on portfolio-level capital expenditures with company-level
emissions reduction pathways). In addition, Figure 8 shows that physical risk metrics are typically associated with residential and commercial real estate loans, while transition risk is often associated with metrics that incorporate multiple asset classes at the same time (such as a weighted average carbon intensity based on equity, bonds and loans).
Many other variables can be used to analyze the repository and narrow down specific data gaps along these dimensions in the future. Other dimensions along which use cases, metrics and raw data can be assessed using the repository include, for instance, data availability, accessibility and desirability.20 Further expansion and refinement of the dataset, especially regarding the classification of metrics and raw data items will help us to make more precise recommendations as to where to prioritize efforts to bridge the data gaps should be focused. Also, further technical outreach activities will complement the current dataset enabling the NGFS to present a prioritized list of data items needed.
20 For example, approximately 80% of raw data items collected in the repository are flagged as “must/good to have” (compared with 20% flagged as “nice to have”) by the WS BDG. Of those items, less than 10% are flagged as “not yet collected” or as data items that are “under construction”. The repository also offers insights into the accessibility of the data, for example which data are proprietary, available upon subscription, etc.
Figure 8. Metric categories by time horizon and asset class of the underlying raw data
Backward-looking Forward-looking (projection)
Physical vulnerability Transition sensitivity
Equity (listed and unlisted)
Government bonds
Does not apply
Corporate bonds
Commercial real estate loans Loans to large corporates (including project finance)
Residential real estate loans
Other
Multiple
Loans to SMEs
Physical vulnerability Transition sensitivity
NGFS REPORT20
Takeaways and next steps (1) – Identifying and prioritizing data needs: use cases, metrics that serve the use cases and the raw data items required for the metrics
The user-centric approach adopted by the NGFS represents a transparent and open-ended starting point to jointly determine what data are needed across stakeholders. Identifying the main use cases, understanding which metrics and methodologies support them, and relating them to raw data items are all key to systematically mapping data needs and, subsequently, data gaps. To this end, the Workstream has set up a repository of data needs that will play an important role in phases 2 and 3, which will allow it to draw conclusions about which data gaps to prioritize.
The results from the repository show that:• financial sector stakeholders report an urgent need for climate-related data across a variety of use cases;• financial stakeholders are increasingly using methodologies and metrics for the measurement of climate-related
risks and scaling up of green finance;• most raw data items that support the wide range of metrics and use cases are unavailable, with the result that
stakeholders have often resorted to measurement proxies, aggregates or estimates.
Going forward, the NGFS plans to use the data repository to further expand its engagement with stakeholders with a view to drawing evidence-based conclusions about the prioritization of data needs. To this end, the NGFS will: • engage with a broad set of stakeholders, including non-financial corporates (which represent the first input into the
data chain), as well as central banks and international financial institutions (whose statistical functions are key to help bridge the gaps), data providers and rating agencies, in order to determine whether the data needs identified can be addressed and, if not, how any gaps can be bridged;
• further assess the types of metric that are best suited to support the different use cases identified during the first phase.
NGFS REPORT 21
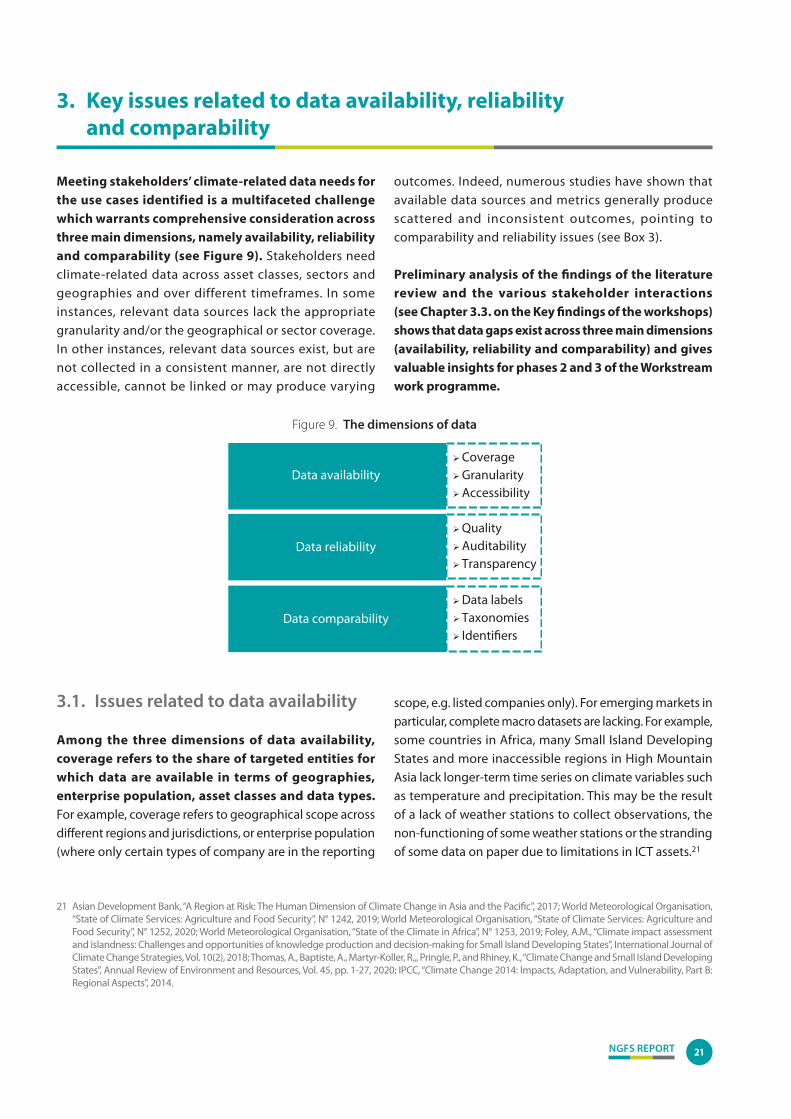
Meeting stakeholders’ climate-related data needs for the use cases identified is a multifaceted challenge which warrants comprehensive consideration across three main dimensions, namely availability, reliability and comparability (see Figure 9). Stakeholders need climate-related data across asset classes, sectors and geographies and over different timeframes. In some instances, relevant data sources lack the appropriate granularity and/or the geographical or sector coverage. In other instances, relevant data sources exist, but are not collected in a consistent manner, are not directly accessible, cannot be linked or may produce varying
outcomes. Indeed, numerous studies have shown that available data sources and metrics generally produce scattered and inconsistent outcomes, pointing to comparability and reliability issues (see Box 3).
Preliminary analysis of the findings of the literature review and the various stakeholder interactions (see Chapter 3.3. on the Key findings of the workshops) shows that data gaps exist across three main dimensions (availability, reliability and comparability) and gives valuable insights for phases 2 and 3 of the Workstream work programme.
3. Key issues related to data availability, reliability and comparability
21 Asian Development Bank, “A Region at Risk: The Human Dimension of Climate Change in Asia and the Pacific”, 2017; World Meteorological Organisation, “State of Climate Services: Agriculture and Food Security”, N° 1242, 2019; World Meteorological Organisation, “State of Climate Services: Agriculture and Food Security”, N° 1252, 2020; World Meteorological Organisation, “State of the Climate in Africa”, N° 1253, 2019; Foley, A.M., “Climate impact assessment and islandness: Challenges and opportunities of knowledge production and decision-making for Small Island Developing States”, International Journal of Climate Change Strategies, Vol. 10(2), 2018; Thomas, A., Baptiste, A., Martyr-Koller, R.,, Pringle, P., and Rhiney, K., “Climate Change and Small Island Developing States”, Annual Review of Environment and Resources, Vol. 45, pp. 1-27, 2020; IPCC, “Climate Change 2014: Impacts, Adaptation, and Vulnerability, Part B: Regional Aspects”, 2014.
Figure 9. The dimensions of data
Data availability CoverageGranularityAccessibility
Data reliability
QualityAuditabilityTransparency
Data comparability
Data labelsTaxonomiesIdentifiers
3.1. Issues related to data availability
Among the three dimensions of data availability, coverage refers to the share of targeted entities for which data are available in terms of geographies, enterprise population, asset classes and data types. For example, coverage refers to geographical scope across different regions and jurisdictions, or enterprise population (where only certain types of company are in the reporting
scope, e.g. listed companies only). For emerging markets in particular, complete macro datasets are lacking. For example, some countries in Africa, many Small Island Developing States and more inaccessible regions in High Mountain Asia lack longer-term time series on climate variables such as temperature and precipitation. This may be the result of a lack of weather stations to collect observations, the non-functioning of some weather stations or the stranding of some data on paper due to limitations in ICT assets.21
NGFS REPORT22
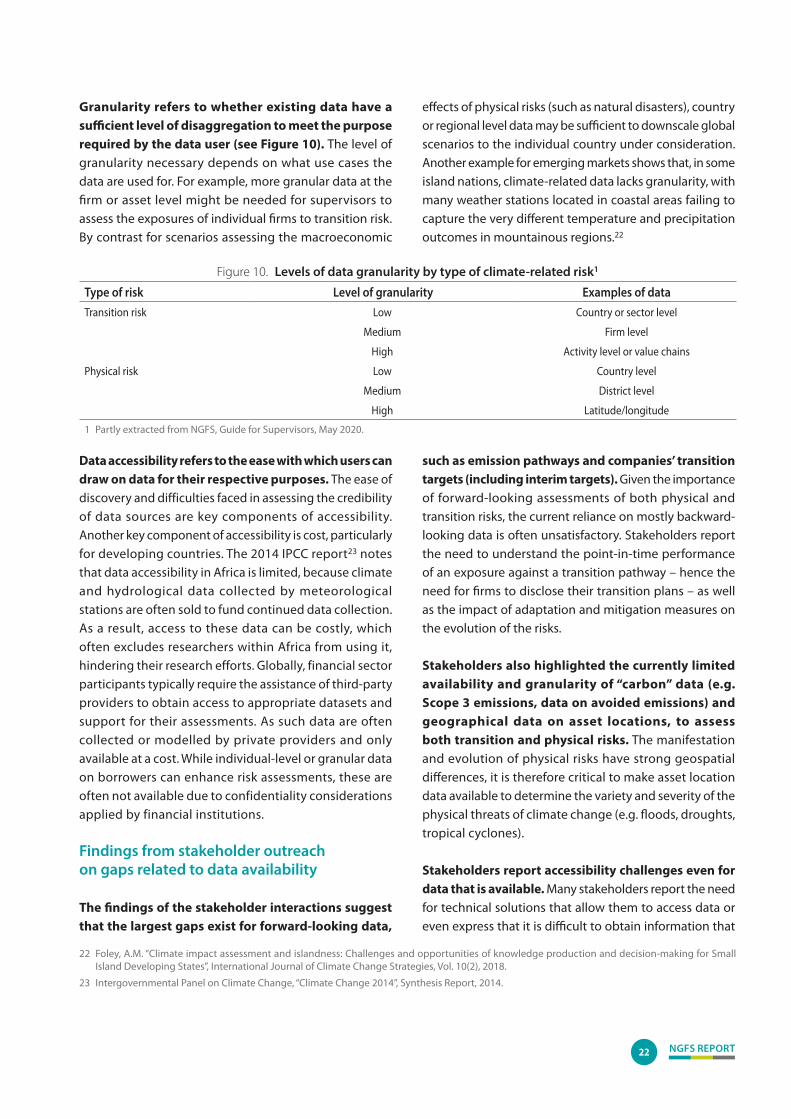
Granularity refers to whether existing data have a sufficient level of disaggregation to meet the purpose required by the data user (see Figure 10). The level of granularity necessary depends on what use cases the data are used for. For example, more granular data at the firm or asset level might be needed for supervisors to assess the exposures of individual firms to transition risk. By contrast for scenarios assessing the macroeconomic
effects of physical risks (such as natural disasters), country or regional level data may be sufficient to downscale global scenarios to the individual country under consideration. Another example for emerging markets shows that, in some island nations, climate-related data lacks granularity, with many weather stations located in coastal areas failing to capture the very different temperature and precipitation outcomes in mountainous regions.22
22 Foley, A.M. “Climate impact assessment and islandness: Challenges and opportunities of knowledge production and decision-making for Small Island Developing States”, International Journal of Climate Change Strategies, Vol. 10(2), 2018.
23 Intergovernmental Panel on Climate Change, “Climate Change 2014”, Synthesis Report, 2014.
Figure 10. Levels of data granularity by type of climate-related risk1
Type of risk Level of granularity Examples of dataTransition risk Low Country or sector level
Medium Firm level
High Activity level or value chains
Physical risk Low Country level
Medium District level
High Latitude/longitude
1 Partly extracted from NGFS, Guide for Supervisors, May 2020.
Data accessibility refers to the ease with which users can draw on data for their respective purposes. The ease of discovery and difficulties faced in assessing the credibility of data sources are key components of accessibility. Another key component of accessibility is cost, particularly for developing countries. The 2014 IPCC report23 notes that data accessibility in Africa is limited, because climate and hydrological data collected by meteorological stations are often sold to fund continued data collection. As a result, access to these data can be costly, which often excludes researchers within Africa from using it, hindering their research efforts. Globally, financial sector participants typically require the assistance of third-party providers to obtain access to appropriate datasets and support for their assessments. As such data are often collected or modelled by private providers and only available at a cost. While individual-level or granular data on borrowers can enhance risk assessments, these are often not available due to confidentiality considerations applied by financial institutions.
Findings from stakeholder outreach on gaps related to data availability
The findings of the stakeholder interactions suggest that the largest gaps exist for forward-looking data,
such as emission pathways and companies’ transition targets (including interim targets). Given the importance of forward-looking assessments of both physical and transition risks, the current reliance on mostly backward-looking data is often unsatisfactory. Stakeholders report the need to understand the point-in-time performance of an exposure against a transition pathway – hence the need for firms to disclose their transition plans – as well as the impact of adaptation and mitigation measures on the evolution of the risks.
Stakeholders also highlighted the currently limited availability and granularity of “carbon” data (e.g. Scope 3 emissions, data on avoided emissions) and geographical data on asset locations, to assess both transition and physical risks. The manifestation and evolution of physical risks have strong geospatial differences, it is therefore critical to make asset location data available to determine the variety and severity of the physical threats of climate change (e.g. floods, droughts, tropical cyclones).
Stakeholders report accessibility challenges even for data that is available. Many stakeholders report the need for technical solutions that allow them to access data or even express that it is difficult to obtain information that
NGFS REPORT 23
24 World Resources Institute, UNEP Finance Initiative and 2° Investing Initiative, “Portfolio Carbon Initiative: Exploring metrics to measure the climate progress of banks”, May 2018.
25 Liesen, A., Hoepner, A.G., Patten, D.M. and Figge, F., “Does stakeholder pressure influence corporate GHG emissions reporting? Empirical evidence from Europe”, Accounting, Auditing & Accountability Journal, Vol. 28, N° 7, pp. 1047-1074; Hoepner, A.G.F. and Yu, P.S., “Science Based Targets Without Science Based Disclosure? Towards a Complete Carbon Data Science”, Centre for Social and Environmental Accounting Research paper, 2017.
already exists. The root causes of this seem to be that the data are not collected in a systematic manner, because their proprietary nature creates barriers to transparency and to uses other than those for which the data have been initially collected (in particular, administrative data). Another obstacle to accessing and making use of existing climate-related data is the lack of unique identifiers, which are crucial for interlinking climate-related data and financial data. Data are thus scattered across different sources and/or only available via private data providers (for example, subscription plans, licences). Moreover, in some cases and especially for data derived from administrative sources, information is not immediately serviceable for statistical/analytical uses, as a clear understanding of the contents and rules that govern data collection (for example, in terms of periodicity, timeliness, methodology, etc.) is required to effectively bridge the gap between the administrative data and needs of statisticians or analysts.
3.2. Issues related to data reliability and comparability
Reliable and comparable data is a prerequisite for ensuring trust in climate-related data and avoiding greenwashing. There is therefore a preference for raw data as opposed to metrics to support investment decisions. Currently, poor quality and unaudited data, alongside non-transparent methodologies, continue to pose significant limitations to the usability of climate-related data.
Reliability depends on the quality of the raw data, as well as the auditability and transparency of the providers. The assessment of quality consists of assessing the plausibility of information, checking its internal consistency (such as emissions reported under Scopes 1, 2 and 3) and benchmarking it to external data sources (for example, aggregated emissions at the sectoral and national level based on official statistics). Data auditing is the process by which data quality or usability for a specific purpose is assessed. However, currently climate-related data are often not subject to audits, which negatively impacts their reliability. Moreover, a lack of transparency on the
methodologies, definitions and criteria used acts as an obstacle to assessing the reliability of available data, whether from external providers or firms’ disclosures.
Currently, comparison of data across data sources is made extremely difficult by the widely varying methods used and the difficulties involved in linking and combining the disparate data available. The lack of common definitions and technical standards, such as taxonomies and certification labels (see Chapter 4) is a major obstacle to data comparability. Comparability consists of checking the consistency of information sourced from different providers or reported for distinct purposes, where discrepancies might stem from different coverage, timing, aggregation methods, estimation of missing information and other methodological issues.
Common identifiers are crucial for linking financial and non-financial information, which are often reported separately. In this context, the availability of unique identifiers at the company level (such as a legal entity identifier or LEIs) and the security level (such as an international securities identity number or ISIN) would allow the consistency of individual information to be checked across different data providers.
Findings from stakeholder outreach on gaps related to data reliability and comparability
Attendees at the workshops highlighted persistent gaps in data reliability, in that they are faced with poor quality, unaudited and non-transparent data. This scepticism toward climate-related data may be due to the perception that much reporting in this area is incomplete or biased. This is not entirely unfounded: for example, a joint report by the World Resources Institute24 found that some banks took advantage of the flexible nature of climate risk metrics by reporting on green activities yet providing little disclosure on more carbon-intensive business activities. Moreover, some studies on carbon emissions reporting have warned about incomplete, inaccurate or missing data in corporate disclosure.25 Data vendors tend to refer to
NGFS REPORT24
companies’ disclosure to collect carbon emissions and in case of missing data they complete their database with estimations using their proprietary models26. Studies that compared carbon emissions data from different providers observed that data on direct emissions are more consistent than data on indirect emissions, while Scope 3 emissions data seem to be inconsistent.27
Reliability also depends on the auditability and transparency of the underlying methodologies. In particular, there are large differences among the ESG scores of different data providers and a lack of transparency as to how the scores are determined, leading to inconsistent analyses, depending on the source chosen (see Box 3). In addition, higher environmental scores can sometimes be associated with higher CO2 emissions. Using these indicators can mislead investors when they are making their supposedly green investment decisions. For as long as there is no
standardized methodology and better raw data available for the production of such indicators, the door is left open for greenwashing, undermining the credibility of green investment.
Finally, as regards comparability, differences in the design and focus of the multiple climate-related disclosures frameworks, together with a lack of consistency, can create challenges for end-users when comparing information reported across different frameworks. Data comparability also pertains to the robustness of methodologies and computation methods. Mechanisms are needed to ensure transparency on their use. The methodologies observed by the NGFS rely on divergent computation methods, even for key metrics used across stakeholders and geographies. Such divergences can have a profound effect on the outcomes of analyses, while transparency on the methods adopted remains limited.
Box 3Comparability and transparency issues in practice
The need for more transparency on methodologies and aggregation rules seems particularly prevalent in the area of ESG ratings. A 2018 survey of ESG professionals indicated that experts would like to see greater consistency and comparability across ESG rating methodologies, followed by improved quality and disclosures of methodologies, with a greater focus on relevant and material issues.1 In a survey of investors, respondents criticized inaccuracies and the use of out of date or backward-looking data in the computation of ratings and, more generally, expressed doubts as to whether ESG performance can be ever captured in a single score.2
Given that a large part of this divergence might be explained by aggregation rules, using ratings at a more granular level might partially address the issue. This could involve separating out each dimension of environmental, social, and governance performance. With increased granularity, measures can be adapted to meet better the analytical needs of investors, researchers and public authorities.3 Divergences might also be explained by different frameworks. For instance, Bloomberg measures ESG disclosure rather than ESG performance.4
…/…
1 See SustainAbility Institute, “Rate the Raters 2019: Expert Views on ESG Ratings”, Report, February 2019.
2 See SustainAbility Institute “Rate the Raters 2020: Investor Survey and Interview Results”, March 2020.
3 See Berg, F., Kölbel, J.F. and Rigobon, R., “Aggregate Confusion: The divergence of ESG Ratings”, 2019.
4 Widyawati, L., “Measurement concerns and agreement of environmental social governance ratings”, Accounting & Finance Vol. 61, N° 51, 2020.
26 Manish S. and Lee, E.L., “Filling the blanks: comparing carbon estimates against disclosures”, MSCI ESG Research Issue Brief, July 2016.
27 Busch, T., Johnson, M. and Pioch, T., “Corporate carbon performance data: Quo vadis?”, Journal of Industrial Ecology, 2020, pp. 1-14.
NGFS REPORT 25
3.3. Key findings from the workshops
Data needs Main reported data-related issues and gapsData needs for assessing physical risks: Mains issues related to data availability:
• Geographical data: location of physical assets (location of firms’ facilities) and value and supply chains (location of firms’ suppliers and customers) at a very granular level (asset level).
• Physical hazards-related data: impact of past extreme weather events (historical data) and projection of future extreme weather events (forward-looking data) on/for the aforementioned physical assets (insurers’ datasets can be very insightful).
• Adaptive capacity data: firms’ degree of sensitivity to extreme weather events (e.g. firms’ adaptation plans and resilience measures, data on how they coped with extreme weather events in the past).
• Asset-level location data exist to some extent, but are rather incomplete.
• Geographical data on factories, suppliers and customers are seldom publicly available.
• Analysts can provide data on firms’ adaptive capacity to physical hazards (e.g. whether a firm is aware of the flood risk to which its assets are exposed, has taken mitigation action, etc.), but these data are not easily or uniformly available, as they are neither public nor audited.
Data needs to assess transition risks: Mains issues related to data availability:
• “Carbon” data: Scopes 1, 2 and 3 on aggregate and broken down by jurisdictions, firms’ transition plans/pathways to show how emissions will be reduced over time and targets (including interim targets) to achieve climate goals (e.g. Paris aligned, net zero), carbon price exposure (including extent to which firms can pass the higher carbon emissions costs to their clients).
• Geographical data: location of physical assets and supply chains at asset level.
• Energy efficiency data (e.g. ratings of real estate).
• Preparedness of companies to the transition.
• Data on Scopes 1 and 2 are the most available, although they remain incomplete. Data on Scope 3 are very often estimated and show the most significant gaps. Data on avoided emissions are hard to collect.
• Firms’ alignment and transition plans are not always available.
However, even for individual climate-related items, substantial inconsistencies across providers persist. Currently, the environmental dimension is more aligned across the providers than in the social and governance dimensions. However, consistency varies – data on direct emissions are more consistent than data on indirect emissions, and they are especially inconsistent for Scope 3 indicators. The mandatory emissions reporting schemes (such as the EU ETS or EPA GHGRP)5 do not significantly increase the consistency of the data, which is explained by limited coverage of those schemes, which usually cover between 30% and 50% of a company’s carbon emissions, so the aggregated facility level emissions are not strongly correlated with the overall Scope 1 emissions. The emissions data consistency across providers also decreases significantly when estimations are required to fill data gaps.6 One comparability problem that arises in practice from the use of data from third-party providers
is inconsistency related to different methodologies and a lack of transparency. Busch et al.6e compare firm-level carbon emissions data from different providers both for reported figures (mandatory or voluntary) and third-party estimations. Voluntary reporting is done through various channels, and many firms share revised figures in their company reports rather than through centralized reporting platforms, such as the Carbon Disclosure Project (CDP). Nevertheless, consistency in company-reported figures is higher than estimates by data providers, largely because data providers use very different estimation techniques and there is a lack of transparency in the different estimation methods used between providers as well as the complexity of Scope 3 emissions. The stronger consistency in firms’ self-reported results for Scope 1 and Scope 2 emissions might also reflect the fact that investors have tighter scrutiny over transparent disclosures on those dimensions, and they are often covered by mandatory reporting.
5 European Emissions Trading System and United States Environmental Protection Agency Greenhouse Gas Reporting Program.
6 Busch, T., Johnson, M.P. and Pioch, T., “Corporate Carbon Performance Data: Quo Vadis”, Journal of Industrial Ecology, 2020.
NGFS REPORT26
Takeaways and next steps (2) – Meeting data needs in terms of availability, reliability and comparability
Meeting stakeholders’ climate-related data needs for the identified use cases is a multifaceted challenge, which warrants comprehensive consideration across three main dimensions, namely availability, reliability and comparability. Preliminary analysis of the findings of the literature review and the various stakeholder interactions shows how data gaps exist across these main dimensions:• Availability: the findings of the interactions with stakeholders suggest that the largest gaps exist for forward-looking
data, such as emissions pathways and companies’ transition targets (including interim targets). Stakeholders also highlighted the current limited availability and granularity of “carbon” data (e.g. Scope 3 emissions, data on avoided emissions) and geographical data on asset locations to assess both transition and physical risks.
• Reliability: numerous studies have shown that available data sources and metrics often produce scattered and inconsistent outcomes.
• Comparability: differences in the design and focus of the multiple climate-related disclosures frameworks, together with a lack of consistency, can create challenges for end-users when comparing the information reported across different frameworks.
Going forward, the NGFS will:• examine possible recommendations to increase data availability, including initiatives that make data available free
of charge or at nominal cost to cover data processing. • consider the types of verification scheme that could enhance the quality of raw data items and examine possible
recommendations on how to achieve greater transparency and comparability for methodologies.
Data needs for assessing both physical and transition risks: Mains issues related to data availability:
• Science-based climate-related data (either observed or simulated), on changes in frequency and severity of acute and chronic physical effects expressed as temperature rises, for instance.
• Macro/country level data to understand geographic and industry risks, carbon pricing, footprint and climate-related pledges/targets.
• Micro/company-level data to understand climate-related business plans (e.g. decarbonization plans and targets).
• Forward-looking indicators (e.g. OpEx, CapEx).1
• Science: Some data available in publicly accessible environmental databases (PAED) or other climate variables datasets. Financial stakeholders are aware that they cannot get away from science on this topic, and that it is important to acquire scientific capacity, including for interpretation of data (e.g. hiring climate scientists, doing partnership with academia).
• Macro level data: the availability of data varies depending on the sector. For instance, lots of self-reported data and scenarios are available for the energy and industry sectors, whereas large data gaps remain in sectors like IT and agriculture, food and beverages. The availability of data also varies across countries.
• Micro-level data: climate-related data are often available at group level, but availability varies depending on the firm’s size. The lack of climate-related data at entity level hinders comprehensive credit-risk analysis. There are also limited data along the value chain.
• Forward-looking: clear data on OpEx and CapPEx are hard to find.
Cross-cutting issues regarding climate-related data:
• Proportionality: Disclosure and analysis of climate-related data should not put small companies at a disadvantage, while larger firms have the capacity to obtain more data and to analyze that data.
• Standardization and comparability: Progress in data collection requires common languages. Ideally, a global taxonomy is a prerequisite for data standardization but differences in jurisdictions also need to be taken into account, such as transitioning from coal in some emerging countries.
• Auditability and data quality: Climate-related data should be as reliable and robust as financial data, which benefit from well-established auditing standards. However, although better quality data will make investment decisions less subjective, financial stakeholders should not wait for perfect data and leverage data sources and approaches that are already available.
• Access to digestible data: The extent to which the financial sector can leverage open source data tools should be analyzed; the ease of interfacing of external datasets with internal ones is also important.
• Disclosures: Enhanced disclosures are desirable, but are a multi-year process. There is a need for cross-regional discussion and global coordination.
• Transparency on metrics/methodologies: metrics are simple to compare, but can mask very different assumptions with potentially significant impacts on results. Materiality remains an important criterion when choosing metrics to measure impact and performance of investments.
1 “Sustainable” CapEx and OpEx refer to the proportions of Capital Expenditure (CapEx) and Operating Expenditure (OpEx) dedicated to environmentally sustainable compatible activities.
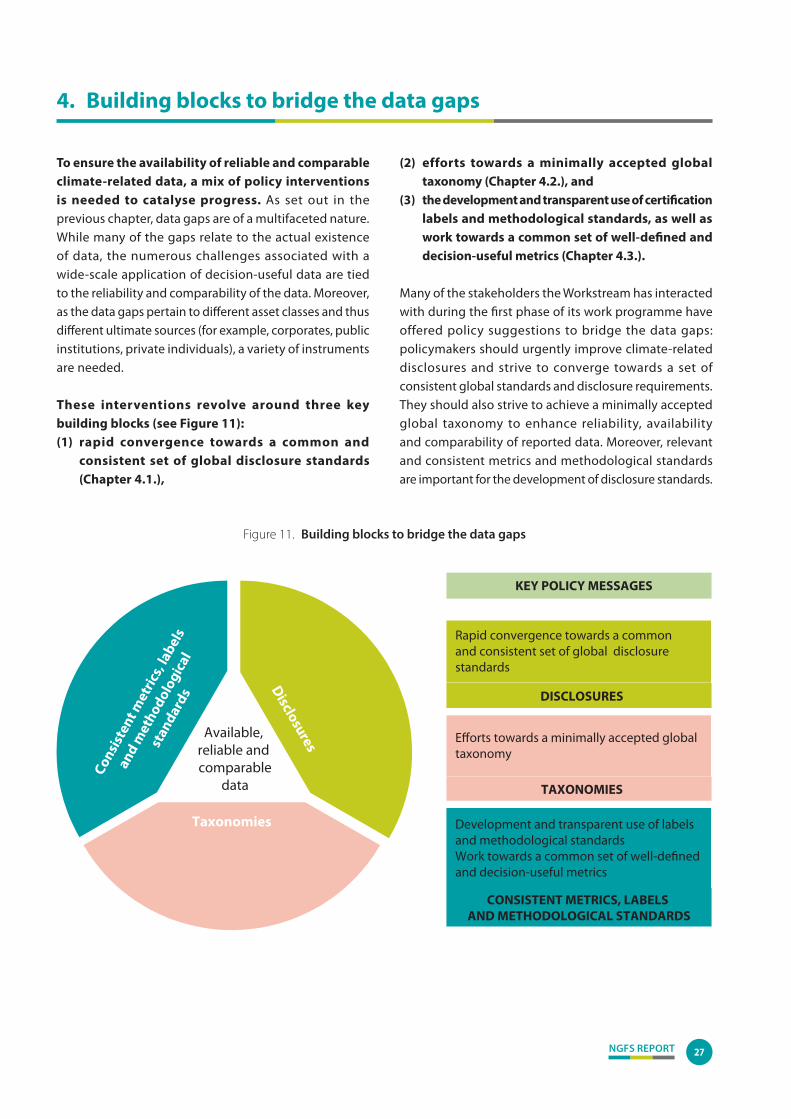
NGFS REPORT 27
To ensure the availability of reliable and comparable climate-related data, a mix of policy interventions is needed to catalyse progress. As set out in the previous chapter, data gaps are of a multifaceted nature. While many of the gaps relate to the actual existence of data, the numerous challenges associated with a wide-scale application of decision-useful data are tied to the reliability and comparability of the data. Moreover, as the data gaps pertain to different asset classes and thus different ultimate sources (for example, corporates, public institutions, private individuals), a variety of instruments are needed.
These interventions revolve around three key building blocks (see Figure 11): (1) rapid convergence towards a common and
consistent set of global disclosure standards (Chapter 4.1.),
(2) efforts towards a minimally accepted global taxonomy (Chapter 4.2.), and
(3) the development and transparent use of certification labels and methodological standards, as well as work towards a common set of well-defined and decision-useful metrics (Chapter 4.3.).
Many of the stakeholders the Workstream has interacted with during the first phase of its work programme have offered policy suggestions to bridge the data gaps: policymakers should urgently improve climate-related disclosures and strive to converge towards a set of consistent global standards and disclosure requirements. They should also strive to achieve a minimally accepted global taxonomy to enhance reliability, availability and comparability of reported data. Moreover, relevant and consistent metrics and methodological standards are important for the development of disclosure standards.
4. Building blocks to bridge the data gaps
KEY POLICY MESSAGES
Rapid convergence towards a common and consistent set of global disclosure standards
DISCLOSURES
Efforts towards a minimally accepted global taxonomy
TAXONOMIES
Development and transparent use of labels and methodological standardsWork towards a common set of well-defined and decision-useful metrics
CONSISTENT METRICS, LABELS AND METHODOLOGICAL STANDARDS
Available, reliable and comparable
data
Disclosures
Cons
isten
t met
rics,
labe
ls
and
met
hodo
logi
cal
stan
dard
s
Taxonomies
Figure 11. Building blocks to bridge the data gaps
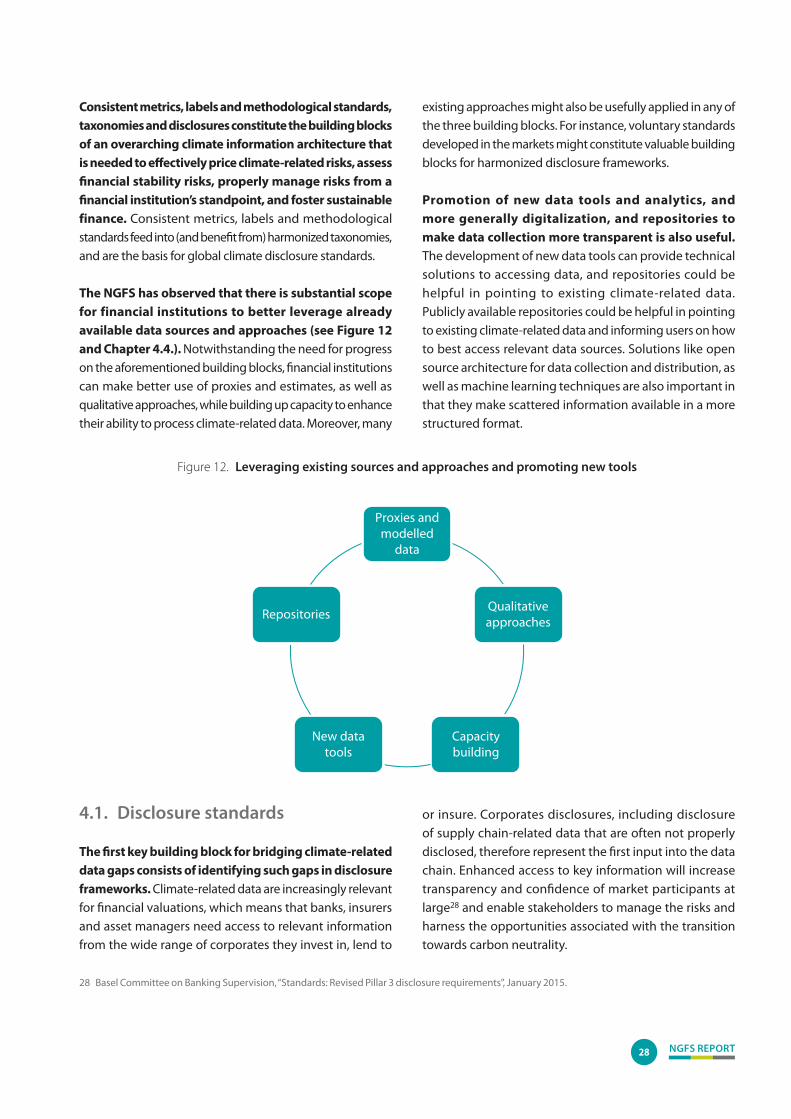
NGFS REPORT28
Consistent metrics, labels and methodological standards, taxonomies and disclosures constitute the building blocks of an overarching climate information architecture that is needed to effectively price climate-related risks, assess financial stability risks, properly manage risks from a financial institution’s standpoint, and foster sustainable finance. Consistent metrics, labels and methodological standards feed into (and benefit from) harmonized taxonomies, and are the basis for global climate disclosure standards.
The NGFS has observed that there is substantial scope for financial institutions to better leverage already available data sources and approaches (see Figure 12 and Chapter 4.4.). Notwithstanding the need for progress on the aforementioned building blocks, financial institutions can make better use of proxies and estimates, as well as qualitative approaches, while building up capacity to enhance their ability to process climate-related data. Moreover, many
existing approaches might also be usefully applied in any of the three building blocks. For instance, voluntary standards developed in the markets might constitute valuable building blocks for harmonized disclosure frameworks.
Promotion of new data tools and analytics, and more generally digitalization, and repositories to make data collection more transparent is also useful. The development of new data tools can provide technical solutions to accessing data, and repositories could be helpful in pointing to existing climate-related data. Publicly available repositories could be helpful in pointing to existing climate-related data and informing users on how to best access relevant data sources. Solutions like open source architecture for data collection and distribution, as well as machine learning techniques are also important in that they make scattered information available in a more structured format.
Proxies andmodelled
data
Qualitativeapproaches
Capacitybuilding
New datatools
Repositories
Figure 12. Leveraging existing sources and approaches and promoting new tools
4.1. Disclosure standards
The first key building block for bridging climate-related data gaps consists of identifying such gaps in disclosure frameworks. Climate-related data are increasingly relevant for financial valuations, which means that banks, insurers and asset managers need access to relevant information from the wide range of corporates they invest in, lend to
or insure. Corporates disclosures, including disclosure of supply chain-related data that are often not properly disclosed, therefore represent the first input into the data chain. Enhanced access to key information will increase transparency and confidence of market participants at large28 and enable stakeholders to manage the risks and harness the opportunities associated with the transition towards carbon neutrality.
28 Basel Committee on Banking Supervision, “Standards: Revised Pillar 3 disclosure requirements”, January 2015.
NGFS REPORT 29
While reporting standards around the world are largely incomparable, they can serve as an interim data series until more comparable climate-related data are available globally. As environmental and climate-related action needs to be taken without delay, the use of data across multiple reporting standards is a good interim option. In the medium term the development of disclosure frameworks can facilitate a deepening and broadening of reported data, which will provide the most consistent and reliable data to bridge existing data gaps. In the European Union, for example, a public consultation is currently underway on a proposal for a Corporate Sustainability Reporting Directive (CSRD),29 which aims to extend the existing reporting requirements. It extends the scope to cover all large companies and all companies listed on regulated markets, and requires reported information to be audited. In addition, it introduces more detailed reporting requirements and a requirement to report data in a machine readable format.
In response to the growing demand for climate-related information, a large number of disclosure initiatives have aimed to address some of the current shortcomings. It is estimated that almost 400 disclosure frameworks exist related
29 For more information, see the Communication on the sustainable finance package.
30 Financial Stability Board, “Proposal for a disclosure task force on climate-related risks”, November 2015.
31 Reporting on enterprise value, Illustrated with a prototype climate-related financial disclosure standard, December 2020.
to climate or sustainability in the form of guidance set out by industry or NGO groups, national laws or government-led schemes, or principles set out by international organisations.30 For example, the TCFD, which was established by the Financial Stability Board, developed and published its recommendations for climate-related disclosures in 2017. Building on these recommendations, the “group of five” (CDP, CDSB, GRI, IIRC and SASB) has developed a prototype for climate-related disclosures.31 A survey by IOSCO finds that, even though there are no formal laws or requirements that mandate the use of any specific framework, many regulators have issued or are planning to issue guidelines that refer to voluntary disclosure frameworks such as the GRI, TCFD, IIRC and CDP. It is also worth noting that individual jurisdictions have set or are in the process of setting disclosure requirements that may or may not be aligned with any of the aforementioned frameworks. In early 2021 the IFRS Foundation, with the support of IOSCO and building on existing frameworks such as the TCFD and the “group of five” prototype, announced a plan to create a sustainability standards board. This would pave the way for greater consistency in sustainability-related financial reporting standards and, as a priority, the convergence of climate reporting standards.
Box 4Adoption of voluntary disclosure initiatives
The recommendations of the Task Force on Climate-related Financial Disclosures (TCFD) have had strong traction with over 1,500 supporters, the majority (75%) from Asia Pacific and European countries across a broad range of sectors with a combined market capitalization of $12.6 trillion. Despite the sharp increase in the number of supporters, the TCFD 2020 Status Report1 found some challenges in actual implementation of the recommendations. For example, companies’ disclosures of the potential financial impact of climate change on their businesses and strategies remain low, while such information is considered “most useful” by expert users for decision-making. Progress is also needed with respect to disclosures by asset managers and asset owners, particularly on metrics and targets for products, funds and investment strategies.
Similarly, in 2019 the Alliance for Corporate Transparency, in assessing the disclosures of 1,000 European companies, found that among companies that provide information on their sustainability policies, there are shortfalls in information pertaining to targets and key performance indicators. In general, they found that the quality and comparability of companies’ sustainability reporting do not allow for an understanding of impacts, risks and companies’ plans. They also observed that, while there was cause for a principles-based approach to non-financial reporting in the past, the time has come to strengthen requirements to ensure compliance by the majority of companies. However, it is crucial that this does not result in the mandating of easily reportable information instead of genuinely material information.
1 Task Force on Climate-related Financial Disclosures, 2020 Status Report, October 2020. …/…
NGFS REPORT30
While some progress has been made in recent years, a number of key issues need to be addressed in the disclosure frameworks for financial and non-financial corporations: a. Owing to their largely voluntary nature, climate-related
disclosures are still limited across economic sectors. As set out in Box 4, the uptake of voluntary disclosure regimes among non-financial corporates remains limited. It is worth noting that the scope of the existing disclosure regimes is often limited to larger, listed firms. As regards disclosures in the financial sector, a recent report by the European Central Bank assessed the level of disclosures of 125 of Europe’s largest banks.32 It evaluated climate disclosures across several basic information categories based on the recommendations of the TCFD. Only 3% of banks made disclosures in every category, and 16% made no disclosure in any category. Similarly, in a survey, the IAIS and SIF found that among over 1000 insurers only 15-20% of insurers have made plans to, or are already
32 European Central Bank, “ECB report on institutions’ climate-related and environmental risk disclosures”, November 2020.
33 World Economic Forum, “Toward Common Metrics and Consistent Reporting of Sustainable Value Creation”, Consultation Draft, January 2020; Accountancy Europe, “Interconnected Standard Setting for Corporate Reporting”, December 2019.
34 See, for example, European Financial Reporting Advisory Group, “Proposals for a relevant and dynamic EU sustainability reporting standard-setting”, Final Report, February 2021.
35 Berg, F., Koelbel, F.G. and Rigobon, R., “Aggregate Confusion: The divergence of ESG ratings”, MIT Sloan School Working Paper, N° 5822-19, August 2019.
taking steps to, implement the TCFD Recommendations and to deliver TCFD-aligned disclosures.
b. The fragmentation of the landscape of disclosure frameworks makes comparability across multiple frameworks challenging. Differences in the design and focus of frameworks (for example, in terms of sectors, ESG scores, risks and impact measurement) create challenges for end-users when they need to compare information that has been reported across different frameworks, particularly given the lack of a consistent set of metrics to convey relevant climate-related information across disclosure frameworks.33 Moreover, disclosure frameworks are not necessarily tailored to ensure the flow of relevant data on non-financial corporates to financial institutions.34 Divergences between disclosure frameworks make it more difficult to discern a company’s climate profile and could, at least partially, explain the large divergences between third-party environmental ratings.35 Furthermore, a lack of consistency between frameworks could enable
Although the long-term risks of climate change need to be properly disclosed on balance sheets, a 2017 study by the 2° Investing Initiative observed that poor forecasting and long-term risk disclosure is pervasive across all types of companies owing to a lack of mandatory forward-looking disclosure requirements. Reviewing the case of ten major jurisdictions, the study identified forward-looking requirements in only a very limited number of jurisdictions. In the United States, for example, Securities and Exchange Commission rules on risk reporting do not have a timeframe and only ask for specific forward-looking goals around inflation risk and contractual obligations.
By contrast, some stakeholders consider that climate-related reporting is still in its infancy, and that disclosure
quality will only improve if companies are given latitude to explore ways of disclosing information that is directly relevant to their business activities2. There are also concerns that disclosing against frameworks like that of the TCFD has already become compliance-motivated, instead of motivated by a genuine interest to reflect on climate implications for business, and this would only worsen if the disclosure of certain information was made compulsory. In a 2020 study on the climate reporting practices of a sample of 149 European companies3, the European Lab Project Task Force on Climate-related Reporting (PTF-CRR) found that, while the TCFD’s reporting section on “Metrics and targets” tends to be more accurate, others are less advanced. In general the report makes it difficult for users to get a complete picture of the company’s management of climate risks and opportunities.
2 European Bank for Reconstruction and Development Global Centre for Excellence on Climate Adaptation, Advancing TCFD Guidance on Physical Climate Risks and Opportunities, 2018.
3 How to improve climate-related reporting, a summary of good practices from Europe and beyond, February 2020.
NGFS REPORT 31
greenwashing and compromise reliability, as reporting firms are able to “cherry pick” approaches.36, 37
c. Mechanisms for the verification and audit of climate-related financial disclosures are essential to make data reliable and comparable. The absence of technical guidance and independent verification schemes affects the reliability of climate-related data. External assurance of information facilitates the application of standards and definitions. An assurance framework similar to that used for financial statements will provide the possibility of external assurance. Verification requirements of non-financial disclosures differ strongly between countries, with only a few countries requiring mandatory assurance of non-financial reporting.38 Moreover, for typical data items such as Scope 3 financed emissions, the GHG Protocol offers multiple calculation methods to track carbon emissions across the value chain. Therefore, even estimates by data vendors for the same company can be particularly inconsistent and their use typically lead to double counting. It stands to reason that, ultimately, climate-related disclosures need to be subject to external assurance to achieve globally consistent disclosure practices.39
d. The lack of common definitions and thresholds for materiality affects the availability of climate-related data. Climate change is projected to have a wide variety of impacts over the long term, but not all of them may be relevant to all stakeholders (for example, investors).40 First, disclosure frameworks differ in terms of the materiality lens. Some frameworks focus solely on financial materiality, while others consider environmental materiality or both. Secondly, disclosure frameworks typically neither set common materiality thresholds, nor define quantitative approaches to gauge financial impacts, paving the way for heterogeneous interpretations and incomplete data across sectors. Moreover, while some frameworks have described processes for assessing materiality from the perspective of key stakeholders, these might not be catered for assessing financial materiality.41 A common and consistent approach to determining materiality is
36 Sustainable Finance and the Role of Securities Regulators and IOSCO, Final Report, April 2020.
37 Bingler, J., Kraus, M. and Leippold, M., “Cheap Talk and Cherry-Picking: What ClimateBert has to say on Corporate Climate Risk Disclosures”, March 2021.
38 European Financial Reporting Advisory Group, “Final Report, Proposals for a relevant and dynamic EU sustainability reporting standard-setting”, February 2021.
39 International Financial Reporting Standards, “Consultation Paper on Sustainability Reporting”, September 2020.
40 Accountancy Europe, “Interconnected Standard Setting for Corporate Reporting”, December 2019.
41 European Central Bank, “ECB report on institutions’ climate-related and environmental risk disclosures”, November 2020.
important in order to ensure the reliability of climate disclosures and the availability of relevant data for the financial system.
4.2. Taxonomies
Taxonomies are another building block in improving data reliability and comparability, and therefore in providing financial institutions and investors with relevant information. The development of taxonomies is seen by many stakeholders as a prerequisite for the consistent collection of data and comparable analysis of these data. Currently, jurisdictions have established separate taxonomies for green finance in their regions, including pathways and targets that are relevant in the regional context. There is therefore a need for a cross-regional discussion of taxonomies.
A minimally accepted global taxonomy could help ensure comparability of raw data across the world, so convergence of different taxonomies over time will be important to ensure consistency in climate-related disclosures. A universal taxonomy would ensure comparability of raw data across the world and allow for a more structured approach to tackling data issues by ensuring similar wording. Complete comparability of data across sectors and regions can only be achieved if it is based on one taxonomy.
Experiences drawn from the development of statistical classifications shows the multi-year processes needed for the adoption and implementations of global standards (such as the System of National Accounts). If a common minimum global taxonomy is seen by the financial sector as desirable, the related challenges in terms of feasibility need to be studied more in-depth and implementation may take a long time. Even then, the one-time establishment of a classification is not sufficient in itself; it needs to be regularly updated to ensure its continued relevance. There is a trade-off between faster
NGFS REPORT32
availability of data and the harmonization of the climate-related data universe. Given the challenges involved in achieving such an objective, progress may require some time and more in-depth work on comparing existing taxonomies and identifying commonalities. Ways of striking the right balance between timeliness, consistency and comparability will have to be explored, ensuring that the desire for faster progress in some geographies will not be hampered, while at the same time being cognizant of the need for flexibility to account for differences in regional institutional frameworks.
The EU Taxonomy42 is an example of how terminology has been harmonized and raw data structured across one region of the world. It is complex to draw up and time is needed to take into account the specificities and constraints of jurisdictions, economic activities and users. Many attendees at the workshops pointed to the need to enable the recognition of transition pathways in taxonomies, as a way of catering for differences in regional starting points, and facilitating transition financing for companies and other economic players that aim to improve their environmental impacts. Other stakeholders questioned the added complexity involved in developing a minimum harmonized global taxonomy and suggested that providing for the disclosure of the pathways and distance to targets would be an easier way forward. The EU Taxonomy would therefore not necessarily be, in their view, a suitable global standard. It is seen by some as EU-centric and focused on environmental issues only,43 and should go into further detail on climate adaptation and mitigation. Some countries may see the issue of transitioning to less fossil fuel and coal-intensive technologies as more pressing than pure environmental considerations. The European Commission has already identified that more work is needed on how the EU Taxonomy can enable inclusive transition financing for companies and other economic actors working to improve their environmental impact.44
42 The European Union Sustainable finance package (published on 21 April 2021) includes an EU Taxonomy Climate Delegated Act that sets criteria to help actors determine what activities can be considered as Taxonomy-aligned for the purposes of disclosure obligations. Out of six environmental objectives, these criteria only cover climate change mitigation and adaptation, with the other objectives to be covered in the future.
43 At least for the time being, but the EU Taxonomy Regulation tasks the Platform on Sustainable Finance with advising the European Commission on how to address other sustainability objectives, including social objectives.
44 Platform on Sustainable Finance, “Transition finance report”, March 2021.
45 Organisation for Economic Co-operation and Development, “Developing Sustainable Finance Definition and Taxonomies”, October 2020.
There is a need to intensify and coordinate the development of taxonomies across the globe and to examine the possibility of harmonization over time. Until such a taxonomy is in place, the NGFS can facilitate the sharing of best practices across jurisdictions, especially in regions where taxonomies do not yet exist. Keeping track of taxonomies being developed across the globe and examining the possibility of harmonizing them over time are important steps towards the eventual development of a global taxonomy. For instance, a 2021 survey by the Irving Fisher Committee on Central Bank Statistics (IFC) of the BIS includes a stock-take of definitions and taxonomies of sustainable finance existing in member countries, with questions on which main economic sectors and main financial products are covered by these taxonomies. In a similar context, the International Platform on Sustainable Finance (IPSF) has created a dedicated working group on taxonomies to comprehensively compare existing taxonomies for environmentally sustainable investments, identify commonalities and differences in their respective approaches, criteria and outcomes. In addition, the OECD’s report on green taxonomies provides best practices for harmonization of taxonomies.45 These are important steps towards the eventual development of a global taxonomy and efforts need to be intensified and well-coordinated, especially in regions where taxonomies do not yet exist. As methodologies for the examination of climate-related risks are further developed than for sustainability as a whole and, are therefore, in greater need of a globally agreed approach, limiting the scope to a climate-related taxonomy may be a pragmatic first step.
4.3. Metrics, labels and methodological standards
Certification labels and harmonized methodological standards are another key building block in improving data reliability as well as comparability.
NGFS REPORT 33
i. Certification labels
Data certification labels are needed to ensure the reliability of data.46, 47 Certification labels may facilitate the identification of climate-related data and the construction of datasets (for example, energy efficiency certificates). They should be harmonized across regions, and the information they provide should be made reliable, comparable, homogeneous and easily available. Certification labels can play a role in building climate-related
46 A certification label is a label or symbol indicating that compliance with standards has been verified. Use of the label is usually controlled by the standard-setting body. Where certification bodies certify against their own specific standards, the label can be owned by the certification body, for example Energy Performance Certificates or ISO standards.
47 Certification is a procedure by which a third party gives written assurance that a product, process or service is in conformity with certain standards. Certification can be seen as a form of communication along the supply chain. The certificate demonstrates to the buyer that the supplier complies with certain standards, which might be more convincing than if the supplier itself provided the assurance.
48 Standards are defined by ISO as “(...) documented agreements containing technical specifications or other precise criteria to be used consistently as rules, guidelines or definitions, to ensure that materials, products, processes and services are fit for their purpose”.
data repositories and the emergence of standards,48 for instance Energy Performance Certificates (see Box 5) or ISO standards (see the ISO 1409x series designed to assess the impacts of climate change and put in place measures for effective adaptation). In a thriving landscape of certification labels, it is important to understand how and under which conditions certification labels may be used in a transparent way, notably to build data repositories, and their climate-related impact.
Box 5Comparability and availability of energy efficiency certificates –
the case of Europe
The building sector is one of the largest energy consumers in Europe1 and is responsible for more than one-third of the EU’s emissions. Therefore, refurbishing and improving the building stock in the EU will help pave the way for a decarbonized and clean energy building sector.
Energy performance certificates (EPCs) provide information on the energy efficiency of buildings and are mandatory across all 27 EU Member States, Norway and the United Kingdom. They can be a relevant indicator for climate risk, for instance, by allowing financial institutions to assess the energy efficiency of properties used to secure mortgages, as they may affect future price developments. However, current data shows that only 1% of buildings undergo energy efficient renovations each year, so effective action is crucial to making Europe climate-neutral by 2050.
EPCs were introduced under the Energy Performance of Buildings Directive (EPBD) in 2002. EPCs allow the comparison of buildings’ energy requirements/consumption and their potential energy costs. They need to be produced for every new building or buildings that have been subject to major renovations and must be made available when a building is sold or rented. EPCs have to include an energy performance rating and recommendations for cost-effective improvements. Most countries apply an energy label scale (typically from A to D-G), although the format is not regulated or standardized. The (legal) implementation of the Directive is quite heterogeneous across Europe, reinforced by differences in the structures and dynamics of real estate markets (such as ownership arrangements or the number of real estate transactions), as well as by different levels of resources dedicated to the enforcement of EPC compliance. …/…
1 Buildings account for 40% of energy consumed; see the Communication from the Commission to the European Parliament, the European Council, the Council, the European Economic and Social Committee and the Committee of the Regions on the European Green Deal of 11 December 2019.

NGFS REPORT34
ii. Methodological standards and consistent metrics
A precondition for assuring the quality of disclosures is the development of sufficiently granular methodological standards that prescribe how data items are defined and metrics computed. As methodologies develop rapidly, there is a growing need to converge towards a set of comparable metrics and consistent methodological standards.
As regards convergence of metrics, there is growing consensus on the need for more forward-looking and context-based metrics. More advanced context-based measures allow for comparisons against a trend line or benchmark, such as an available (carbon) budget or a transition pathway. The preliminary results of the repository exercise show that, although metrics rely slightly more often on backward-looking data than they do on forward-looking data, there is clearly a growing need for data on how exposures will evolve over time.
49 A framework and Principles for Climate Resilience Metrics in Financing Operations, IDB, Discussion Paper, December 2019.
Many key climate-related indicators are difficult to interpret in the absence of context. To deal with this, context-based indicators convey climate performance relative to suitable benchmarks (see Box 6).
Nevertheless, combinations of different metrics are likely to be needed in order to appropriately measure climate-related risks and scale up green finance. Measurements of climate risk, climate impact and the scaling up of green finance is typically more informative when based on sets of metrics, including context-based measures. The Inter-American Development Bank49 argues that the most effective climate resilience metrics should reflect context specificity and diversity, be compatible with variable and often long timescales associated with climate impacts, cope with the inherent uncertainties associated with future climate conditions and be able to handle variable project boundaries. As all metrics do not yet satisfy these criteria, this shortcoming is somewhat addressed through the wide range of metrics available to choose from.
Hence, EPC ratings are not readily comparable and there are differences in market penetration and general acceptance.2 Almost all countries have started an EPC database, which can act as a useful source of information. Around 45 million residential EPCs can either be accessed via publicly available EPC databases (available for nine countries) or provided by national authorities. The quality of the ratings is meant to be assured by independent control systems and – in most countries – penalties for non-compliance. Standardization of certifiers’ qualifications and software tools would be required to enhance the reliability of
EPC ratings. This would facilitate public acceptance across markets, which is yet to be achieved in many countries.
The EPC is a useful tool for supporting the long-term decarbonisation of the building stock that could be enhanced in order to provide an improved and more reliable service for users (among others, financial institutions). Calculation methodologies should be harmonized across Europe, and information on EPCs should be made comparable, homogeneous and easily available.
2 Energy Performance Certificates in Europe – Assessing their status and potential, BPIE, March 2020.
NGFS REPORT 35
Harmonization of the approaches adopted by financial market participants supports the comparability of data. The methodologies and disclosure frameworks observed by the NGFS often rely on different computation methods, even for key metrics used across stakeholders and geographies. Such divergences may hinder comparability of climate-related data and thus have a profound effect on the outcomes of analyses, especially as transparency on the methods adopted remains limited. For example, De Nederlandsche Bank has
50 DNB, “Misleading Footprints, Inflation and exchange rate effects in relative carbon disclosure metrics”, Occasional Study, January 2021.
recently shown in a study that inflation and exchange rate effects can have a substantial impact on the outcomes of relative carbon footprint metrics.50
It is worth noting that a number of initiatives have produced widely used open source methodologies and voluntary methodological standards. The PACTA tool, as developed by 2° Investing Initiative is an example of an open source tool to produce a set of standardized
Box 6Towards context-based indicators
Context-based indicators are based on relative industry benchmarks or absolute benchmarks such as “carbon budgets” that are derived from certain climate goals. For example, there is broad interest in understanding whether specific countries and corporates are operating in “alignment” with climate goals such as those set out in the Paris Agreement. A growing number of investors want their capital to be invested in alignment with transition to net-zero carbon emissions.1 Therefore, a number of metrics are under development2 which attempt to estimate “portfolio temperature alignment”.
A key example of a context-based indicator is the Science Based Targets initiative (SBTi) which aims to measure companies’ alignment with 1.5° and 2° emissions targets respectively. A progress report by the SBTi for 2020 shows that companies committing to science-based emissions targets were able to reduce their GHG emissions by 25% between 2015 and 2019, performing far better than the global average over that period.3
While they are easier to interpret and compare than carbon footprint or intensity metrics, context-based indicators are no panacea. Their greater level of sophistication brings uncertainties or complexities that underpin their calculation. For example, indicators which intend to provide a sense of relative performance, such as simple carbon intensity metrics, occasionally misrepresent underlying climate performance when there are fluctuations in the denominator of the metric. Nonetheless, the complexity of many portfolio temperature alignment metrics limits their transparency and leads to differing estimates being produced in different approaches. To overcome these challenges, a number of stakeholders are working to develop best practices to enable greater standardization of such approaches in the future.4, 5
Eventually, context-based metrics may also be used to assess a broader range of environmental and nature-based risks beyond climate change.6 The capacity of the nine planetary boundaries7 defined by scientists in 2009 could be used to benchmark absolute environmental performance in much the same way that carbon budgets provide context with respect to climate performance.
1 See, for example,the Net-Zero Asset Owner Alliance.
2 Institut Louis Bachelier, The Alignment Cookbook – A Technical Review of Methodologies Assessing a Portfolio’s Alignment with Low-Carbon Trajectories or Temperature Goal, July 2020.
3 Science Based Targets Initiative, “From Ambition to Impact: How companies are reducing emissions at scale with Science-Based Targets”, Annual Progress Report, 2020, January 2021.
4 Portfolio Alignment Team led by David Blood and Iren Levina, Measuring Portfolio Alignment: Assessing the position of companies and portfolios on the path to net zero, Q4 2020.
5 TCFD, “Forward-Looking Financial Sector Metrics, Consultation”, October 2020.
6 Note that other context-based indicators could include water risk metrics based on basin specific characteristics. See for instance: Exploring the case for corporate context-based water targets, April 2017.
7 Planetary boundaries is a concept involving Earth system processes that contain environmental boundaries. It was proposed in 2009 by a group of Earth system and environmental scientists, led by Johan Rockström from the Stockholm Resilience Centre and Will Steffen from the Australian National University. For more information, see Planetary boundaries.
NGFS REPORT36
alignment metrics. It enables users to measure the alignment of financial portfolios with climate scenarios. One notable example of a methodological standard is the attribution methodology for the computation of financed emissions devised by the PCAF,51 which has been embraced by the GHG Protocol (see Box 7). In the context of the need for forward-looking data on corporate exposures, the Science Based Targets initiative,52 which guides companies in setting science-based targets that are in line with what the latest climate science deems necessary to meet the goals of the Paris Agreement, is of particular relevance (see Box 6).
4.4. Existing sources and approaches
The sphere of climate-related data and analysis is still developing, and it may take some time before high-quality data is available globally. During workshops, market participants widely acknowledged that data will never be perfect and that they should start taking action with what is available so far. Therefore, making best use of existing data is another way of bridging data gaps in the medium term.
i. Proxies and modelled data
Proxies can be used as an intermediate step for financial institutions to better leverage data sources and approaches that are already available. For example, industry averages can be used to estimate financed emissions when data is not (yet) available for a specific firm. Country-specific differences might also apply for industry averages. For instance, differences in carbon intensity between emerging market and developing countries and advanced countries could have an effect on climate transition risk exposure.
In some cases, modelled data may also be a useful way to fill data gaps. However, as discussed in Box 7, the approach of filling data gaps with modelled data suffers from limitations. These include difficulties when attempting to downscale global climate models to a higher resolution (especially in some developing countries), mismatches on spatial scales or
51 PCAF is a global partnership of financial institutions that work together to develop and implement a harmonized approach to assess and disclose the greenhouse gas (GHG) emissions associated with their loans and investments.
52 The SBTi is a partnership between CDP, the United Nations Global Compact, World Resources Institute (WRI) and the World Wide Fund for Nature (WWF).
53 Foley, A.M., “Climate impact assessment and islandness: Challenges and opportunities of knowledge production and decision-making for Small Island Developing States”, International Journal of Climate Change Strategies, Vol. 10(2), 2018.
54 Kalesnik, V. Wilkens, M. and Zink, J., “Green Data or Greenwashing? Do Corporate Carbon Emissions Data Enable Investors to Mitigate Climate Change?”, November 2020.
granularity, inconsistencies owing to different methodologies used by providers and lower accuracy of modelled data when compared with self-reported data. As such, it is best to consider the use of modelled data as an intermediate step, which will help bridge some data gaps in the short term.
Country authorities should play a role in modelling work. They can do this, for example, by setting expectations on how it should be done, or by doing it themselves and making the modelled set of data publicly available to support greater consistency and comparability of results. This makes sense in cases where modelled data might be a common good (such as making low resolution geographical data more granular) rather than for modelling that is only relevant to a specific firm. For transition risk, the scope of carbon emissions reporting is limited, and most firms (including almost all SMEs) do not disclose their carbon footprint. In addition, firms that do communicate their figures are prone to erroneous reporting owing to the lack of disclosures standards (particularly for Scope 3).
However, several papers highlight the potential limitations of using modelled data to fill data gaps. Some highlight the issues that arise when attempting to downscale global climate models to a higher resolution that encompasses Small Island Developing States (SIDS).53 For many small islands, their land area would be considered ocean in a lower resolution global model, which can lead to issues with downscaling. This means that validation of downscaling is even more important, but limited longer-term climate-related data availability make this validation difficult. Data gaps are more limiting for islands than continents owing to their fragmentation and isolation. The mismatches in spatial scales of the models and the limited ability to validate model results reduce the models’ credibility for use with SIDS. Other research suggests that data on firms’ emissions estimated by third-party data providers is 2.4 times less effective in identifying the worst emitters than self-reported data on emissions.54 The abovementioned shortcomings of modelled data suggest that there is a case to push for mandatory reporting of emissions by firms in order to obtain a more precise picture of transition and physical risks.
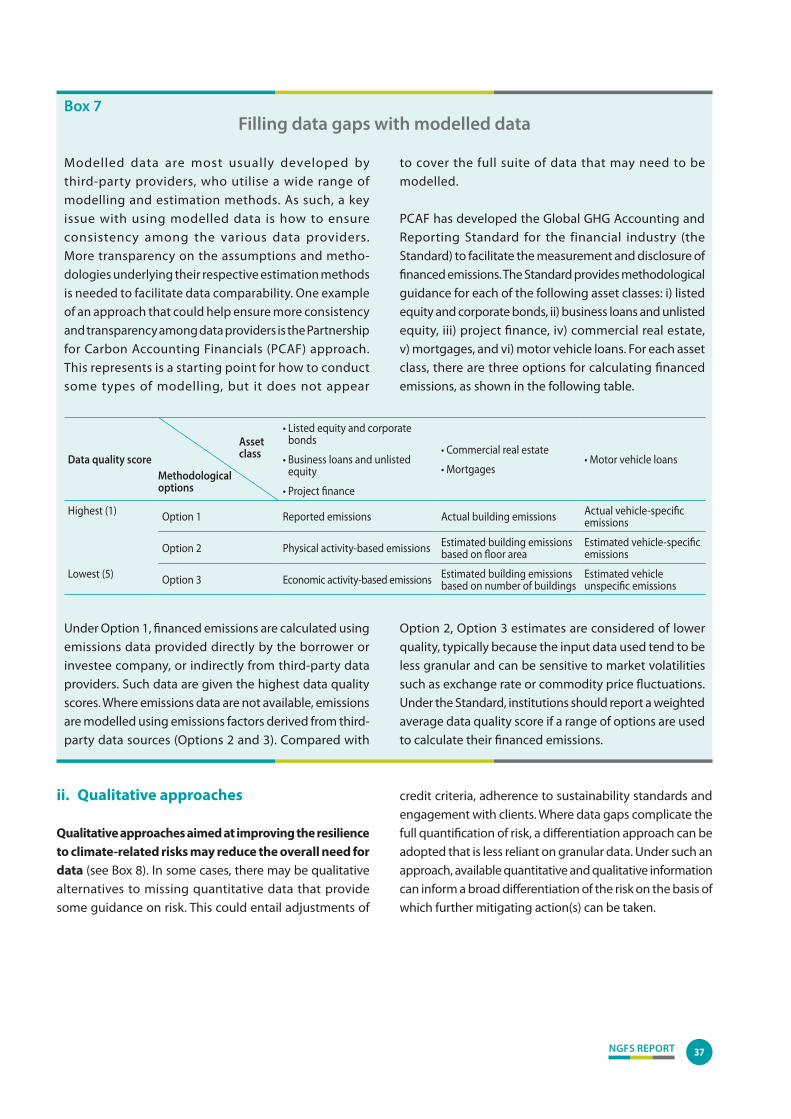
NGFS REPORT 37
Box 7Filling data gaps with modelled data
Modelled data are most usually developed by third-party providers, who utilise a wide range of modelling and estimation methods. As such, a key issue with using modelled data is how to ensure consistency among the various data providers. More transparency on the assumptions and metho-dologies underlying their respective estimation methods is needed to facilitate data comparability. One example of an approach that could help ensure more consistency and transparency among data providers is the Partnership for Carbon Accounting Financials (PCAF) approach. This represents is a starting point for how to conduct some types of modelling, but it does not appear
to cover the full suite of data that may need to be modelled.
PCAF has developed the Global GHG Accounting and Reporting Standard for the financial industry (the Standard) to facilitate the measurement and disclosure of financed emissions. The Standard provides methodological guidance for each of the following asset classes: i) listed equity and corporate bonds, ii) business loans and unlisted equity, iii) project finance, iv) commercial real estate, v) mortgages, and vi) motor vehicle loans. For each asset class, there are three options for calculating financed emissions, as shown in the following table.
Data quality score
• Listed equity and corporate bonds
• Business loans and unlisted equity
• Project finance
• Commercial real estate
• Mortgages• Motor vehicle loans
Highest (1) Option 1 Reported emissions Actual building emissions Actual vehicle-specific emissions
Option 2 Physical activity-based emissions Estimated building emissions based on floor area
Estimated vehicle-specific emissions
Lowest (5) Option 3 Economic activity-based emissions Estimated building emissions based on number of buildings
Estimated vehicle unspecific emissions
Asset class
Methodological options
Under Option 1, financed emissions are calculated using emissions data provided directly by the borrower or investee company, or indirectly from third-party data providers. Such data are given the highest data quality scores. Where emissions data are not available, emissions are modelled using emissions factors derived from third-party data sources (Options 2 and 3). Compared with
Option 2, Option 3 estimates are considered of lower quality, typically because the input data used tend to be less granular and can be sensitive to market volatilities such as exchange rate or commodity price fluctuations. Under the Standard, institutions should report a weighted average data quality score if a range of options are used to calculate their financed emissions.
ii. Qualitative approaches
Qualitative approaches aimed at improving the resilience to climate-related risks may reduce the overall need for data (see Box 8). In some cases, there may be qualitative alternatives to missing quantitative data that provide some guidance on risk. This could entail adjustments of
credit criteria, adherence to sustainability standards and engagement with clients. Where data gaps complicate the full quantification of risk, a differentiation approach can be adopted that is less reliant on granular data. Under such an approach, available quantitative and qualitative information can inform a broad differentiation of the risk on the basis of which further mitigating action(s) can be taken.
NGFS REPORT38
iii. Capacity building
The rapid deployment of methodologies for managing climate-related risks and for scaling up green finance has revealed capacity gaps. Similar to other climate-related issues, the data issue points to a shortage of capacities and skills within financial institutions and among investors
55 Climate Finance Advisors, Benefit LLC (2020) Understanding the Role of Climate Risk Transparency on Capital Pricing for Developing Countries. Findings Report. Washington DC.
and regulators. A report by Climate Finance Advisors with the assistance of the UK Foreign, Commonwealth and Development Office,55 aimed at helping developing countries in the race towards building resilience to climate change, observed that while advancements in climate risk analytics have evolved rapidly, and multiple climate risk software analytics tools exist today, they are complicated
Box 8Relying on less data-heavy solutions
In addition to the six main use cases (Chapter 2.2.), climate-related data could also serve other use cases which require less information and data with lower granularity. This box sets out some examples of such approaches. • Strategic decision-making to green the balance sheet
as an alternative to more quantitatively determining alignment with Paris Agreement goals: many credit institutions have undertaken or plan to undertake commitments towards greening their balance sheets as part of the actions included in their corporate social responsibility framework and also as measures to mitigate reputational, legal and business model risks. Institutions can design these actions and measures using general climate information, that is, without a comprehensive and detailed list of climate-related data. For example, information on total exposure to fossil fuels sectors could be enough to set a limit on financing companies within these sectors (or even to fully exclude them from the institution’s assets) to make the balance sheet greener. In order to do that, the internal risk management information and official data based on official public statistical classification of activities like the EU NACE codes1 are already available for institutions.
• Criteria changes to reduce portfolio risk without quantification: sector/industry exclusion policies or limits aim to reduce the physical and transition risks to which financial institutions’ portfolios are exposed. Detailed climate-related data is not necessary to define credit criteria. For example, simple carbon intensity metrics are already available in some industries (for example power generation and automotive). Another way of addressing such limits is to diversify portfolios by,
for example, reducing concentrations to climate-vulnerable assets or integrating climate risk indicators in lending or investment criteria.
• Engagement with clients: to inform their risk assessment and management, financial institutions could seek to understand the potential current and future impacts of physical and transition risks on their clients, counterparties and organisations in which they (may) invest, by engaging with clients and counterparties where this information is considered material to a financial institution’s own risks. According to public statements and industry surveys, financial institutions also have a very important role to play in advising and helping their clients in the transition to a low-carbon economy. In this regard, general information on clients’ main activities, such as carbon emissions, and on their customers’ profile, as well as on industry regulations could suffice in order for institutions to give key recommendations to their clients for adapting their processes and activities and to take out insurance against extreme weather situations.
• Development of internal classifications: some institutions have developed internal classifications to distinguish between “green” and “non-green” assets without using a very comprehensive set of climate-related data. In this respect, the Green Bond Principles and Green Bond Loans frameworks are very useful tools, in particular, for project finance transactions. These definitions and frameworks for “green” products are relevant for the issuance of green bonds. In the field of green bonds, institutions can also conduct an advisory activity for their large corporate clients by structuring and originating the issuances.
1 NACE is the abbreviation for the statistical classification of economic activities in the European Community.
NGFS REPORT 39
to use, because different investors may need to employ different approaches to assessing and quantifying how climate change poses financial risks to their investments over meaningful time horizons. Among the investors interviewed for the report, many noted that the application of tools remains bespoke and that only a small number of investors are integrating them into their risk management functions or using them consistently in their investment decision-making processes.
As set out in the First comprehensive report by the NGFS, there is a need to build intellectual capacity and to share knowledge. It is clear that the climate risk management capacity in the form of trained risk managers with the skill sets to apply the tools, interpret the risk data and integrate such information to actively manage climate risks is greatly lacking for many investor types, as well as for policymakers and regulators. These capacity gaps present headwinds for investors or policymakers seeking to engage in sound climate-related risk management or scale up their investment in resilience or sustainability. And yet, the upsides of addressing such capacity gaps are significant, not only in terms of better managing climate risks but possibly also financially.
iv. New data tools
To increase the availability of robust, high-quality data new data tools and analytics, and more generally digitalization, are needed to make data collection more transparent. Many stakeholders have emphasized that technical solutions need to have access to data. But access to existing climate-related data is often difficult, because data are scattered across different sources and/or only available via private data providers (for example via subscription plans or licences).
Solutions such as open source architecture for data collection and distribution and machine learning techniques are important in that they make scattered information available in a more structured format. For instance, a majority of respondents to the European Commission’s public consultation on the review of the Non-Financial Reporting Directive considered that developing non-financial information standards and making non-financial information machine-readable and easily accessible via an EU single access point (ESAP) would enhance its searchability, readability and comparability. Machine learning techniques are often seen as a black box, as it is difficult to understand how results are obtained (see Box 9 for more details on the role of machine learning and artificial intelligence).
Box 9Climate change data gaps:
The role of machine learning and artificial intelligence
Quantifying and modelling the effects of climate change is challenging due to missing data. This box describes a three-part taxonomy for missing data as follows, organized from the easiest problem to address to the most difficult:
A. Incomplete data or incorrect observations in already-collected data. For example, missing temperature data in the historical record.
B. Unstructured data that must be converted to a structured format or uncollected data that can be collected in principle. For example, data on the robustness of coastal infrastructure to past rises in sea level or the exposures of companies to legacy power sectors. These data may be directly collected in structured format or extracted from unstructured data such as text or images.
C. Impossible data that can never be collected because the world has not yet experienced the relevant states. For example, the robustness of coastal infrastructure to a rise in sea levels that has never before been observed, or the exposure of companies to previously unseen shifts in consumer preferences regarding power generation sources.
The specific type of missing data dictates the approach or technique that may address the issue. This box outlines how emerging tools in machine learning and artificial intelligence might be used to address these missing data challenges. The terms “machine learning” (ML) and “artificial intelligence” (AI) refer to a wide range of frequently overlapping tools that have emerged from the rich fields of mathematics, statistics and …/…
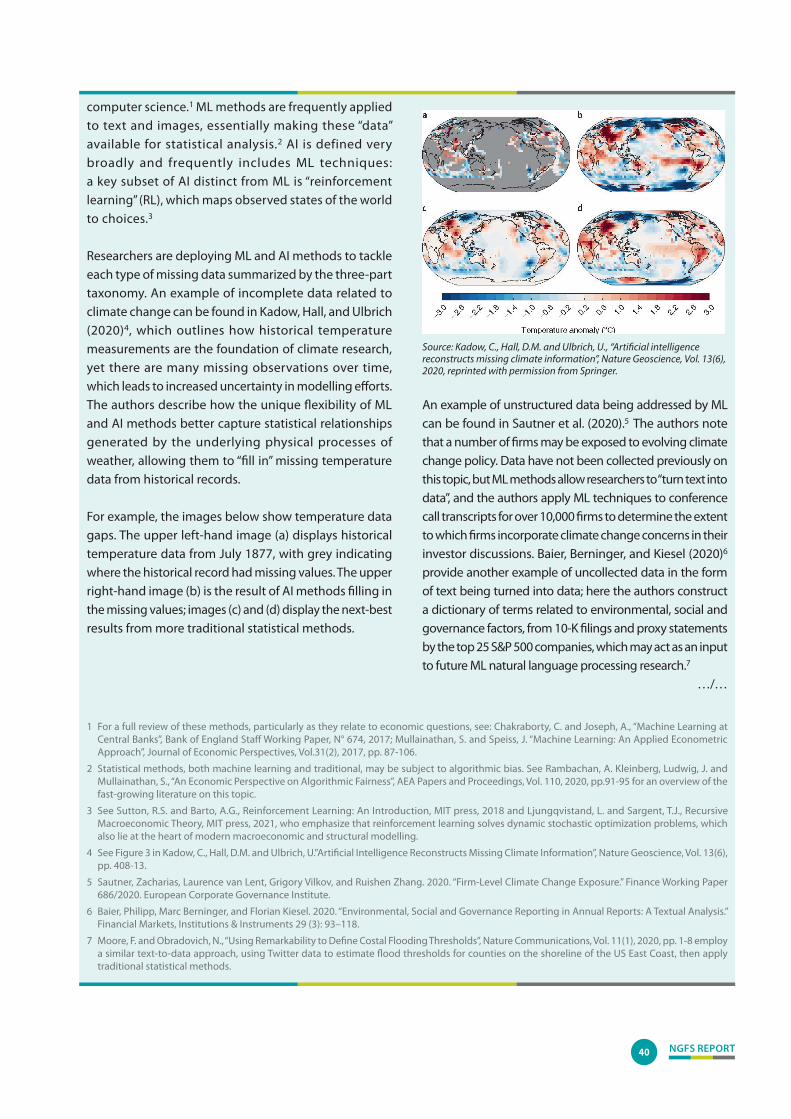
NGFS REPORT40
computer science.1 ML methods are frequently applied to text and images, essentially making these “data” available for statistical analysis.2 AI is defined very broadly and frequently includes ML techniques: a key subset of AI distinct from ML is “reinforcement learning” (RL), which maps observed states of the world to choices.3
Researchers are deploying ML and AI methods to tackle each type of missing data summarized by the three-part taxonomy. An example of incomplete data related to climate change can be found in Kadow, Hall, and Ulbrich (2020)4, which outlines how historical temperature measurements are the foundation of climate research, yet there are many missing observations over time, which leads to increased uncertainty in modelling efforts. The authors describe how the unique flexibility of ML and AI methods better capture statistical relationships generated by the underlying physical processes of weather, allowing them to “fill in” missing temperature data from historical records.
For example, the images below show temperature data gaps. The upper left-hand image (a) displays historical temperature data from July 1877, with grey indicating where the historical record had missing values. The upper right-hand image (b) is the result of AI methods filling in the missing values; images (c) and (d) display the next-best results from more traditional statistical methods.
Source: Kadow, C., Hall, D.M. and Ulbrich, U., “Artificial intelligence reconstructs missing climate information”, Nature Geoscience, Vol. 13(6), 2020, reprinted with permission from Springer.
An example of unstructured data being addressed by ML can be found in Sautner et al. (2020).5 The authors note that a number of firms may be exposed to evolving climate change policy. Data have not been collected previously on this topic, but ML methods allow researchers to “turn text into data”, and the authors apply ML techniques to conference call transcripts for over 10,000 firms to determine the extent to which firms incorporate climate change concerns in their investor discussions. Baier, Berninger, and Kiesel (2020)6 provide another example of uncollected data in the form of text being turned into data; here the authors construct a dictionary of terms related to environmental, social and governance factors, from 10-K filings and proxy statements by the top 25 S&P 500 companies, which may act as an input to future ML natural language processing research.7
…/…
1 For a full review of these methods, particularly as they relate to economic questions, see: Chakraborty, C. and Joseph, A., “Machine Learning at Central Banks”, Bank of England Staff Working Paper, N° 674, 2017; Mullainathan, S. and Speiss, J. “Machine Learning: An Applied Econometric Approach”, Journal of Economic Perspectives, Vol.31(2), 2017, pp. 87-106.
2 Statistical methods, both machine learning and traditional, may be subject to algorithmic bias. See Rambachan, A. Kleinberg, Ludwig, J. and Mullainathan, S., “An Economic Perspective on Algorithmic Fairness”, AEA Papers and Proceedings, Vol. 110, 2020, pp.91-95 for an overview of the fast-growing literature on this topic.
3 See Sutton, R.S. and Barto, A.G., Reinforcement Learning: An Introduction, MIT press, 2018 and Ljungqvistand, L. and Sargent, T.J., Recursive Macroeconomic Theory, MIT press, 2021, who emphasize that reinforcement learning solves dynamic stochastic optimization problems, which also lie at the heart of modern macroeconomic and structural modelling.
4 See Figure 3 in Kadow, C., Hall, D.M. and Ulbrich, U.”Artificial Intelligence Reconstructs Missing Climate Information”, Nature Geoscience, Vol. 13(6), pp. 408-13.
5 Sautner, Zacharias, Laurence van Lent, Grigory Vilkov, and Ruishen Zhang. 2020. “Firm-Level Climate Change Exposure.” Finance Working Paper 686/2020. European Corporate Governance Institute.
6 Baier, Philipp, Marc Berninger, and Florian Kiesel. 2020. “Environmental, Social and Governance Reporting in Annual Reports: A Textual Analysis.” Financial Markets, Institutions & Instruments 29 (3): 93–118.
7 Moore, F. and Obradovich, N., “Using Remarkability to Define Costal Flooding Thresholds”, Nature Communications, Vol. 11(1), 2020, pp. 1-8 employ a similar text-to-data approach, using Twitter data to estimate flood thresholds for counties on the shoreline of the US East Coast, then apply traditional statistical methods.
NGFS REPORT 41
v. Repositories
Publicly available repositories could be helpful as a way of pointing to existing climate-related data and informing users on how best to access relevant data sources. However, further work is needed to make existing data more broadly available to policymakers and financial institutions. To date, several initiatives have been launched in order to pool climate raw data in a single point that would need more in-depth analysis.
In Europe, to facilitate accessibility, the Transparency Directive56 requires the European Securities and Markets Authority (ESMA) to establish the European electronic access point, which serves as a single, centralized point of entry for the public to access regulated information stored by all officially appointed mechanisms (OAMs). On the back of this Directive, the European Fund and Asset Management Association (EFAMA) recommends
56 Directive 2004/109/EC of the European Parliament and of the Council of 15 December 2004 on the harmonisation of transparency requirements in relation to information about issuers whose securities are admitted to trading on a regulated market (OJ L 390, 31.12.2004, p. 38).
that there should be a public EU central database to allow easy access to ESG data reported by companies. As mentioned above, a consultation launched by the Commission in January 2021 is seeking views on the ESAP, which aims to improve the availability of and access to a wide range of public financial and sustainability-related information from both listed and non-listed companies, potentially also covering SMEs.
In the United States, the OPEN Government Data Act requires open government data assets made available by federal agencies (excluding the Government Accountability Office, the Federal Election Commission and certain other government entities) to be published as machine-readable data. When not otherwise prohibited by law, and to the extent practicable, public data assets and non-public data assets maintained by the federal government must be available: (1) in an open format that does not impede use or reuse and that has standards maintained by a standards
In a similar vein, the ability of ML methods to “turn images into data” provides another avenue for researchers to generate new data from previously untapped sources such as satellite or other remote imaging. Lary et al. (2016)8 outline broadly how remote-sensing data may be analyzed by ML methods, effectively creating new data from image sources, with a number of potential climate change applications. ML and AI tools effectively generate new data from previously collected sources, unlocking great potential for filling in climate science data gaps.
Finally, structural models are the main tools researchers have for challenges related to impossible data – data that cannot be collected because the world simply has not experienced the relevant states. Fischer and
Heutel (2013)9 gives an introduction to such work, and Cai et al. (2013)10 and Lontzek et al. (2015)11 in particular combine structural modelling with climate modelling to demonstrate that GHG reduction may be more valuable than simpler models imply. RL methods may allow much more complicated versions of such structural models to be solved. For example, forward-looking agent behavior may be added to models such as those suggested in Farmer et al. (2015)12 using RL methods. Thus AI, and specifically RL, may allow more detailed economic-climate models to be solved and inform policy decisions. Finally, as noted in Pindyck (2013)13 uncertainty about future paths remains quite high – an enduring challenge presented by the problem of climate change even with new tools and data.
8 Lary, David J, Amir H Alavi, Amir H Gandomi, and Annette L Walker. 2016. “Machine Learning in Geosciences and Remote Sensing.” Geoscience Frontiers 7 (1): 3–10.
9 Fischer, Carolyn, and Garth Heutel. 2013. “Environmental Macroeconomics: Environmental Policy, Business Cycles, and Directed Technical Change.” Annual Review of Resource Economics 5 (1): 197–210.
10 Cai, Yongyang, Kenneth L Judd, and Thomas S Lontzek. 2013. “The Social Cost of Stochastic and Irreversible Climate Change.” Working Paper 18704. Working Paper Series. National Bureau of Economic Research.
11 Lontzek, Thomas S, Yongyang Cai, Kenneth L Judd, and Timothy M Lenton. 2015. “Stochastic Integrated Assessment of Climate Tipping Points Indicates the Need for Strict Climate Policy.” Nature Climate Change 5 (5): 441–44.
12 Farmer, J Doyne, Cameron Hepburn, Penny Mealy, and Alexander Teytelboym. 2015. “A Third Wave in the Economics of Climate Change.” Environmental and Resource Economics 62 (2): 329–57.
13 Pindyck, Robert S. 2013. “Climate Change Policy: What Do the Models Tell Us?” Journal of Economic Literature 51 (3): 860–72.
NGFS REPORT42
organization; and (2) under open licences with a legal guarantee that the data be available at no cost to the public with no restrictions on copying, publishing, distributing, transmitting, citing or adapting.57
Because they are at the heart of statistical reporting frameworks, central banks have committed themselves to working on better integrating climate-related data needs in those statistics. For example, the Statistics Committee of the ESCB has set up an expert group to support it in focusing its efforts on the most important aspects of climate-related issues and to provide members with a platform for exchanging best practices. Another example is the Irving Fisher Committee on Central Bank Statistics (IFC), which is a forum among central bank economists and statisticians for discussion of statistical issues of interest to central banks that have started work on in analyzing data availability, quality and gaps for green finance.
57 For more information, see the OPEN Government Data Act.
58 G20 Green Finance Study Group, G20 Green Finance Synthesis Report 2020, July 2017.
Some aspects of data accessibility were also reviewed in the G20 Green Finance Synthesis report for 2017.58 This report touches on the importance of PAED for green finance and the challenges that limit the effective use of such data, as well as some voluntary ways of improving the availability, accessibility and relevance of PAED. The development of a UN Environment-OECD Catalogue of PAED was foreseen in that report (see Box 10).
Numerous new commercial data and analytics products in relation to climate change have come to market. Given the urgency of the need to accelerate the climate transition, some market players believe that open source initiatives offer solutions that respond swiftly to the need for data to improve the integration of climate risk and opportunity factors in investing, banking and finance, financial sector supervision, corporate decisions and policymaking. This is, for instance, the business model on which the OS-Climate initiative has been built.
Box 10Experience with open source repositories of data –
Mexico and beyond
The G20 Green Finance Study Group (GFSG)1 identified publicly available environmental data (PAED) and environmental risk assessments as institutional and market barriers to the promotion of green finance and environmental risk exposures. In this context, PAED refers to environmental information that are provided and reported by non-corporate entities and can be useful for financial analysis.2 Such information, some of which is forward-looking in nature, comes largely from public sources, including governments, international organizations, science institutes or non-governmental organizations, can help financial firms assess the probabilities and impacts of both physical and transition risks, as well as investment opportunities.
To encourage the use of climate-related data by the financial sector in mainstream financial decision-making, regulators can take action by ensuring, for instance,
that this type of data adhere to the four principles of the International Open Data Charter: open by default; accessible and usable; timely and comprehensive; and comparable and interoperable.
Recognizing that its geographic characteristics place it among the countries most vulnerable to the effects of climate change, and that climate change affects 90% of the territory and negative externalities estimated from environmental degradation are already valued as 4.7% of GDP, Mexico decided to take an in-depth look at how PAED could be better applied in Mexico’s financial sector.
Mexico has made significant improvements to its open data practices in recent years, establishing itself
…/…
1 The SFSG was relaunched by the G20 in April 2021 under the Italian presidency, and transformed into a G20 Sustainable Finance Working Group.
2 G20 Green Finance Study Group, G20 Green Finance, Synthesis Report, July 2017.
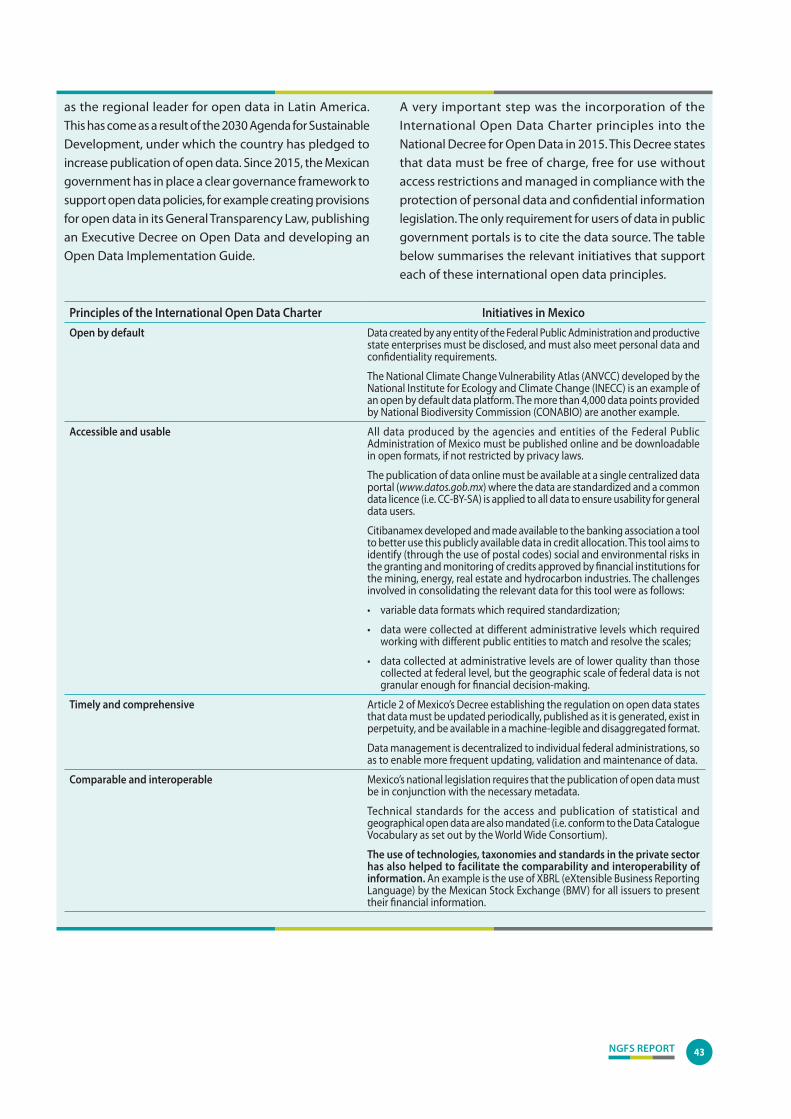
NGFS REPORT 43
as the regional leader for open data in Latin America. This has come as a result of the 2030 Agenda for Sustainable Development, under which the country has pledged to increase publication of open data. Since 2015, the Mexican government has in place a clear governance framework to support open data policies, for example creating provisions for open data in its General Transparency Law, publishing an Executive Decree on Open Data and developing an Open Data Implementation Guide.
A very important step was the incorporation of the International Open Data Charter principles into the National Decree for Open Data in 2015. This Decree states that data must be free of charge, free for use without access restrictions and managed in compliance with the protection of personal data and confidential information legislation. The only requirement for users of data in public government portals is to cite the data source. The table below summarises the relevant initiatives that support each of these international open data principles.
Principles of the International Open Data Charter Initiatives in MexicoOpen by default Data created by any entity of the Federal Public Administration and productive
state enterprises must be disclosed, and must also meet personal data and confidentiality requirements.
The National Climate Change Vulnerability Atlas (ANVCC) developed by the National Institute for Ecology and Climate Change (INECC) is an example of an open by default data platform. The more than 4,000 data points provided by National Biodiversity Commission (CONABIO) are another example.
Accessible and usable All data produced by the agencies and entities of the Federal Public Administration of Mexico must be published online and be downloadable in open formats, if not restricted by privacy laws.
The publication of data online must be available at a single centralized data portal (www.datos.gob.mx) where the data are standardized and a common data licence (i.e. CC-BY-SA) is applied to all data to ensure usability for general data users.
Citibanamex developed and made available to the banking association a tool to better use this publicly available data in credit allocation. This tool aims to identify (through the use of postal codes) social and environmental risks in the granting and monitoring of credits approved by financial institutions for the mining, energy, real estate and hydrocarbon industries. The challenges involved in consolidating the relevant data for this tool were as follows:
• variable data formats which required standardization;
• data were collected at different administrative levels which required working with different public entities to match and resolve the scales;
• data collected at administrative levels are of lower quality than those collected at federal level, but the geographic scale of federal data is not granular enough for financial decision-making.
Timely and comprehensive Article 2 of Mexico’s Decree establishing the regulation on open data states that data must be updated periodically, published as it is generated, exist in perpetuity, and be available in a machine-legible and disaggregated format.
Data management is decentralized to individual federal administrations, so as to enable more frequent updating, validation and maintenance of data.
Comparable and interoperable Mexico’s national legislation requires that the publication of open data must be in conjunction with the necessary metadata.
Technical standards for the access and publication of statistical and geographical open data are also mandated (i.e. conform to the Data Catalogue Vocabulary as set out by the World Wide Consortium).
The use of technologies, taxonomies and standards in the private sector has also helped to facilitate the comparability and interoperability of information. An example is the use of XBRL (eXtensible Business Reporting Language) by the Mexican Stock Exchange (BMV) for all issuers to present their financial information.
NGFS REPORT44
Takeaways and next steps (3) – Developing policy recommendations to help bridge data gaps
To ensure the availability of reliable and comparable climate-related data, a mix of policy interventions is needed to catalyse progress. These interventions are based on the following building blocks: 1. rapid convergence towards a common and consistent set of global disclosure standards;2. efforts towards a minimally accepted global taxonomy;3. development and transparent use of well-defined and decision-useful metrics, certification labels and methodological
standards.
Notwithstanding the above, the NGFS has observed that there is substantial scope for stakeholders (corporates, financial institutions, investors and policymakers) to better leverage data sources and approaches that are already available (i.e. use of proxies, estimates and qualitative approaches and capacity building). The promotion of new data tools and analytics, and more generally digitalization, and of repositories to make data collection more transparent are also useful.
Going forward, the NGFS will:• identify how the progressive harmonization of metrics and methodological standards, certification labels and taxonomies
can contribute to the reliability and comparability of data, together with a wider implementation of mandatory disclosures in financial statements. In doing so, the NGFS will engage with relevant stakeholders, including non-financial corporates and methodologies providers.
• examine how publicly accessible databases can improve data availability and comparability. In doing so, the NGFS will reach out to initiatives that pool climate-related raw data in a single point and to relevant stakeholders in the field of geospatial data, paying specific attention to the use of new technologies, for example AI.
NGFS REPORT 45
This progress report on bridging data gaps is a collaborative effort of the members of the “Bridging the Data Gaps’ Workstream of the NGFS. This document was prepared under the auspices of the co-chairs of the Workstream, Patrick Amis (European Central Bank) and Fabio Natalucci (International Monetary Fund), with support from the NGFS Secretariat at the Banque de France (Léa Grisey and Nathalie Rouillé) and the Workstream’s team leads (Justin Dijk from De Nederlandsche Bank, Guan Schellekens from the European Central Bank and Elena Triebskorn from the Deutsche Bundesbank). The co-chairs of the Workstream are grateful for the contributions provided by all Workstream members, and, in particularly: Spyros Alogoskoufis (European Central Bank), Geraldine Ang (OECD), Jenneke Bijl-Segers (De Nederlandsche Bank), Celso Brunetti (Federal Reserve Board), Jose Canales (Banco de Espaňa), Rudolf Christoph (Deutsche Bundesbank), Francisco Conceição (Banco de Portugal), Johnny Di Giampaolo (Banca d’Italia), Stéphane Dees (Banque de France), Stephen Fay (Australian Prudential Regulation Authority), Maurice Fehr (Deutsche Bundesbank), Santiago Figueroa (Banco de Mexico), Laura Graziani Palmieri (Banca d’Italia), Diana Hancock (Federal Reserve Board), Yuri Ikeda (Japan Financial Services Agency), Anu Karhu (Bank of Finland), Gurubala Kotta (Federal Reserve Board), Laura-Chloe Kuntz (Deutsche Bundesbank), Mahmut Kutlukaya (International Monetary Fund), Leo Lai (Hong Kong Monetary Authority), Josh Lattimore (Office of the Superintendent of Financial Institutions of Canada), Gor Lazyan (Central Bank of Armenia), Harry Lee (Monetary Authority of Singapore), Willy Mak (Hong Kong Monetary Authority), Julien Mazzacurati (European Securities and Markets Authority), Thomas Mclaren (Bank of England), Rachael McCririck (Reserve Bank of Australia), Patricia Moles (Banco de México), Małgorzata Osiewicz (European Central Bank), Martijn Regelink (World Bank), Christian Schmieder (Bank for International Settlements), Ranjit Singh (International Monetary Fund), Felix Suntheim (International Monetary Fund), Saori Takahashi (Japan Financial Services Agency), Eszter Tanai (European Central Bank), Maria Luisa Tejedor (Banco de Espaňa), Virginie Traclet (Bank of Canada), Brenda Van Tendeloo (National Bank of Belgium).
Acknowledgements
NGFS REPORT46
List of acronyms
ADB Asian Development Bank
AI Artificial intelligence
BIS Bank for International Settlements
BPIE Buildings Performance Institute Europe
CBI Climate Bonds Initiative
CDP Carbon Disclosure Project
CDSB Climate Disclosure Standards Board
CER-ETH Center of Economic Research at ETH Zurich
EBRD European Bank for Reconstruction and Development
EFAMA European Fund and Asset Management Association
EPBD Energy Performance of Buildings Directive
EPC Energy performance certificates
ERA Environmental risk assessment
ESAP ESCB
European single access point
European System of Central Banks
ESG Environmental, Social and Governance
ESMA European Securities and Markets Authority
ESRB European Systemic Risk Board
FSB Financial Stability Board
GCECA Global Centre of Excellence on Climate Adaptation
GDP Gross Domestic Product
GFSG Green Finance Study Group
GHG Greenhouse gas
GRI Global Reporting Initiative
IAIS International Association of Insurance Supervisors
ICT Information and Communication Technologies
IEA SDS International Energy Agency Sustainable Development Scenarios
IFC Irving Fisher Committee
IFRS International Financial Reporting Standards
IIF Institute of International Finance
IIRC International Integrated Reporting Council
NGFS REPORT 47
IOs International organizations
IOSCO International Organization of Securities Commissions
IPCC Intergovernmental Panel on Climate Change
IPSF International Platform for Sustainable Finance
ISIN International securities identification number
LEI Legal entity identifier
ML Machine learning
NBB National Bank of Belgium
NGFS Network for Greening the Financial System
NGO Non-governmental organization
OAM Officially appointed mechanisms
OECD Organisation for Economic Co-operation and Development
OMFIF Official Monetary and Financial Institutions Forum
PACTA Paris Agreement Capital Transition Assessment
PAED Publicly available environmental data
PCAF Partnership for Carbon Accounting Financials
RCP Representative concentration pathway
RL Reinforcement learning
SASB Sustainability Accounting Standards Board
SBTi Science Based Targets initiative
SDG Sustainable Development Goals
SIDS Small Island Developing States
SIF Sustainable Insurance Forum
SME Small and medium-sized enterprises
STC Statistics Committee of the European System of Central Banks
TCFD Task Force on Climate-related Financial Disclosures
WACI Weighted Average Carbon Intensity
WMO World Meteorological Organization
WS BDG Workstream on bridging the data gaps
WWF World Wildlife Fund
NGFS REPORT48
List of boxes and figures
List of boxes
Box 1 Work by NGFS workstreams on determining data needs and data availability, and suggestions for bridging data gaps
Box 2 The mechanics of assessing physical risk and its applicability across use cases
Box 3 Comparability and transparency issues in practice
Box 4 Adoption of voluntary disclosure initiatives
Box 5 Comparability and availability of energy efficiency certificates – the case of Europe
Box 6 Towards context-based indicators
Box 7 Filling data gaps with modelled data
Box 8 Relying on less data-heavy solutions
Box 9 Climate change data gaps: The role of machine learning and artificial intelligence
Box 10 Experience with open source repositories of data – Mexico and beyond
List of figures
Figure 1 Interconnectedness of use cases, metrics and raw data items by stakeholder category in the repository
Figure 2 Overview of the steps taken, the stakeholders involved and the way forward
Figure 3 Schematic overview of the layered structure of the repository
Figure 4 Stakeholders and the identified use cases
Figure 5 Preliminary classification of available metrics
Figure 6 Use cases and the associated metrics
Figure 7 Interconnectedness of use cases, metrics and raw data items
Figure 8 Metric categories by time horizon and asset class of the underlying raw data
Figure 9 The dimensions of data
Figure 10 Levels of data granularity by type of climate-related risk
Figure 11 Building blocks to bridge the data gaps
Figure 12 Leveraging existing sources and approaches and promoting new tools

NGFS REPORT 49
Exposure quantification
The measurement of the maximum potential loss on loans, bonds, equity and other financial instruments provided by a credit institution, asset manager, insurer (asset side) or other buy-side entity (for example, pension fund, hedge fund, etc.) to a counterparty, as a result of climate-related factors.
Investment and lending decisions
The decision made by a credit institution, asset manager, insurer (asset side) or other buy-side entity (for example pension fund, hedge fund, etc.) on the amount of funds to be deployed in investment opportunities such as bonds and equity, or to provide/refinance a loan.
Climate-related risks and opportunities may change the profile of an organization’s debt and equity structure, either by increasing debt levels to compensate for reduced operating cash flows or for new capital expenditures or R&D. It may also affect the organization’s ability to raise new debt or refinancing existing debt, or to reduce the tenors available to it. There could also be changes to capital and reserves from operating losses, asset write-downs or the need to raise new equity to meet investments.1
Macroeconomic modelling
Macroeconomic modelling is used to analyse the impacts of climate-related issues on macroeconomic indicators like GDP, employment and inflation. A typical example of the need for macroeconomic modelling is policy analysis, or the analysis of the macroeconomic impacts of climate change. In the case of policy analysis, the impacts of policies to mitigate or adapt to climate change are observed. The policies can concern, for instance, investment decisions on energy transformation or innovation, measures related to the industrial structure or competitiveness of an industry.2 In turn, analysis of the macroeconomic impacts of climate change concern output, GDP and inflation, for instance, or potential supply and demand shocks.
Economic growth analysis is one example of macroeconomic analysis, which can be used to observe, for instance, how climate change impacts on GDP, output, economic activity and industries in the long term. It can also be used to observe what effects climate-related policy measures such as government investments have on growth.
Financial stability monitoring
Financial stability monitoring consists of the assessment of financial systems vulnerabilities, defined as the collection of factors that contribute to the potential for widespread externalities. For the purpose of financial stability monitoring, transition risks and physical risks related to climate change are observed from the macroeconomic point of view. It is essential to recognize the systemic risks and multiple transmission channels (direct and indirect) of climate change-related risks and its control to economy and finances. Transmission channels are the ways in which economies, industries/sectors,
Annex: Glossary of use cases
1 Task Force on Climate-related Financial Disclosures, Final Report, Recommendations of the Task Force on Climate-related Financial Disclosures, June 2017.
2 Andersson, M., Baccianti, C. and Morgan, J., “Climate change and the macro economy”, Occasional Paper Series, N° 243, ECB, Frankfurt am Main, June 2020.
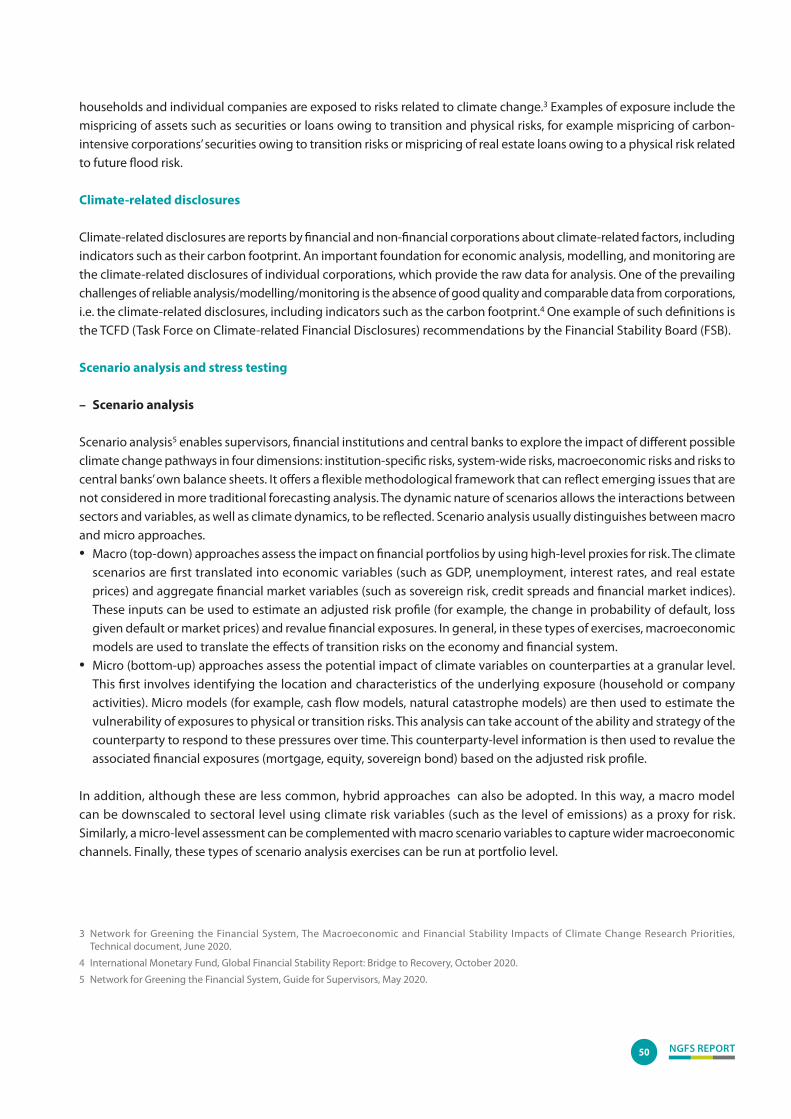
NGFS REPORT50
households and individual companies are exposed to risks related to climate change.3 Examples of exposure include the mispricing of assets such as securities or loans owing to transition and physical risks, for example mispricing of carbon-intensive corporations’ securities owing to transition risks or mispricing of real estate loans owing to a physical risk related to future flood risk.
Climate-related disclosures
Climate-related disclosures are reports by financial and non-financial corporations about climate-related factors, including indicators such as their carbon footprint. An important foundation for economic analysis, modelling, and monitoring are the climate-related disclosures of individual corporations, which provide the raw data for analysis. One of the prevailing challenges of reliable analysis/modelling/monitoring is the absence of good quality and comparable data from corporations, i.e. the climate-related disclosures, including indicators such as the carbon footprint.4 One example of such definitions is the TCFD (Task Force on Climate-related Financial Disclosures) recommendations by the Financial Stability Board (FSB).
Scenario analysis and stress testing
– Scenario analysis
Scenario analysis5 enables supervisors, financial institutions and central banks to explore the impact of different possible climate change pathways in four dimensions: institution-specific risks, system-wide risks, macroeconomic risks and risks to central banks’ own balance sheets. It offers a flexible methodological framework that can reflect emerging issues that are not considered in more traditional forecasting analysis. The dynamic nature of scenarios allows the interactions between sectors and variables, as well as climate dynamics, to be reflected. Scenario analysis usually distinguishes between macro and micro approaches.• Macro (top-down) approaches assess the impact on financial portfolios by using high-level proxies for risk. The climate
scenarios are first translated into economic variables (such as GDP, unemployment, interest rates, and real estate prices) and aggregate financial market variables (such as sovereign risk, credit spreads and financial market indices). These inputs can be used to estimate an adjusted risk profile (for example, the change in probability of default, loss given default or market prices) and revalue financial exposures. In general, in these types of exercises, macroeconomic models are used to translate the effects of transition risks on the economy and financial system.
• Micro (bottom-up) approaches assess the potential impact of climate variables on counterparties at a granular level. This first involves identifying the location and characteristics of the underlying exposure (household or company activities). Micro models (for example, cash flow models, natural catastrophe models) are then used to estimate the vulnerability of exposures to physical or transition risks. This analysis can take account of the ability and strategy of the counterparty to respond to these pressures over time. This counterparty-level information is then used to revalue the associated financial exposures (mortgage, equity, sovereign bond) based on the adjusted risk profile.
In addition, although these are less common, hybrid approaches can also be adopted. In this way, a macro model can be downscaled to sectoral level using climate risk variables (such as the level of emissions) as a proxy for risk. Similarly, a micro-level assessment can be complemented with macro scenario variables to capture wider macroeconomic channels. Finally, these types of scenario analysis exercises can be run at portfolio level.
3 Network for Greening the Financial System, The Macroeconomic and Financial Stability Impacts of Climate Change Research Priorities, Technical document, June 2020.
4 International Monetary Fund, Global Financial Stability Report: Bridge to Recovery, October 2020.
5 Network for Greening the Financial System, Guide for Supervisors, May 2020.
NGFS REPORT 51
Some practical examples for which scenario analysis can be used include assessing the expected losses of an asset portfolio if average temperature rises by 3ºC or the expected losses in an economy where floods and other extreme weather events occur more frequently than before. For this kind of application, the availability of geographical coordinates data of assets such as real estate loans or securities is relevant.
One practical example of macroprudential scenario analysis is to model the structural changes to the economy and its sectors resulting from the transition to a more sustainable direction. In the macroprudential approach, it is also essential to focus on defining the transmission channels through which the transition to sustainable economy is conveyed.
– Stress testing
Stress testing6 and sensitivity analysis are risk framework methods that focus on the sensitivity of portfolios and the impact climate change (the likelihood and severity of the materialization of climate-related risks) has on exposures’ actual riskiness.• Climate stress tests: assessment featuring fully-fledged scenarios that map out possible future development paths
of transition variables (e.g. carbon prices), physical variables (temperature increases) and the related changes in macro variables (e.g. output in different sectors, GDP, unemployment) and financial variables (e.g. interest rates). These scenarios are then translated into changes in portfolios’ (risk) attributes. Stress testing can take place at the portfolio, industry or counterparty-level.
Climate stress tests usually apply predefined climate scenarios (certain temperature pathways), for which, for instance, emissions reduction pathways associated with specific climate goals are established. The international scientific community has developed several databases for identifying climate pathways (i.e. 2ºC consistent) and the implied trajectories for economic variables and sectors. These mostly use Integrated Assessment Models, which combine insights from various disciplines into a single framework, using socioeconomic, energy and climate factors. Instead of looking at scenarios that satisfy certain temperature targets, climate stress can also be modelled through event-based shocks (for example, policy, technology and preference shocks).
• Climate sensitivity analysis is a more simple exercise that does not use scenarios, but assesses changes in portfolios’ risk attributes by changing some of the inputs in financial models based on shading and classification of exposures into “green” versus “non-green” exposures (which determines an exposure’s vulnerability to climate-related events and policies).
6 European Banking Authority, “On management and supervision of ESG risks for credit institutions and investment firms”, EBA Discussion paper, October 2020.

NGFSSecretariat