Virtual Progress: The Effect of Path Characteristics on Perceptions of Progress and Choice
22
Virtual Progress: The Effect of Path Characteristics on Perceptions of Progress and Choice Dilip Soman • Mengze Shi Rotman School of Management, University of Toronto, 105 St. George Street, Toronto, Ontario, Canada L5L 1C6 [email protected] • [email protected] I n goal-oriented services, consumers want to get transported from one well-defined state (start) to another (destination) state without much concern for intermediate states. A cost-based evaluation of such services should depend on the total cost associated with the service—i.e., the price and the amount of time taken for completion. In this paper, we demon- strate that the characteristics of the path to the final destination also influence evaluation and choice. Specifically, we show that segments of idle time and travel away from the final destination are seen as obstacles in the progress towards the destination, and hence lower the choice likelihood of the path. Further, we show that the earlier such obstacles occur during the service, the lower is the choice likelihood. We present an analytical model of consumer choice and test its predictions in a series of experiments. Our results show that in choosing between two services that cover the same displacement in the same time (i.e., identical aver- age progress), consumer choice is driven by the perception of progress towards the goal (i.e., by virtual progress). In a final experiment, we show that the effects of virtual progress may outweigh the effects of actual average progress. ( Goal-Oriented Services; Behavioral Decision Making; Progress; Choice; Path Characteristics; Transportation ) Introduction In many service situations, consumers are transported from one state to another over a certain interval of time. For example, an airline may transport passen- gers from Denver to Boston over four hours, or a sup- plier of machine tools may undertake to deliver and install a new assembly line of 80 machine tools over 20 weeks. In both cases, the service moves the con- sumer (the passenger, or the assembly line) from a start state (Denver, or the absence of the assembly line) to a destination state (Boston, or the existence of a new line) over a specified period of time (four hours, or 20 weeks, respectively; we refer to this as the elapsed time). In these services, the goal of the consumer is to attain the destination state without much regard to the intermediate states. Given their goal-oriented nature, the most basic evaluation of such services might use a total cost approach in which the evaluation is a function of the cost of time involved (i.e., a function of elapsed time, Becker 1965) and any additional costs incurred. These additional costs could be monetary (i.e., the price paid) or nonmonetary (e.g., the hassle of chang- ing planes). Consumers should be indifferent between services in which each element of cost is held con- stant. However, we argue in this paper that in addi- tion to cost factors like the elapsed time and price, the evaluation of services is influenced by the path characteristics of the service. Specifically, certain path 0025-1909/03/4909/1229 1526-5501 electronic ISSN Management Science © 2003 INFORMS Vol. 49, No. 9, September 2003, pp. 1229–1250
Transcript of Virtual Progress: The Effect of Path Characteristics on Perceptions of Progress and Choice
Virtual Progress: The Effect of PathCharacteristics on Perceptions of
Progress and Choice
Dilip Soman • Mengze ShiRotman School of Management, University of Toronto, 105 St. George Street,
Toronto, Ontario, Canada L5L [email protected] • [email protected]
In goal-oriented services, consumers want to get transported from one well-defined state(start) to another (destination) state without much concern for intermediate states. A
cost-based evaluation of such services should depend on the total cost associated with theservice—i.e., the price and the amount of time taken for completion. In this paper, we demon-strate that the characteristics of the path to the final destination also influence evaluationand choice. Specifically, we show that segments of idle time and travel away from the finaldestination are seen as obstacles in the progress towards the destination, and hence lower thechoice likelihood of the path. Further, we show that the earlier such obstacles occur duringthe service, the lower is the choice likelihood. We present an analytical model of consumerchoice and test its predictions in a series of experiments. Our results show that in choosingbetween two services that cover the same displacement in the same time (i.e., identical aver-age progress), consumer choice is driven by the perception of progress towards the goal (i.e.,by virtual progress). In a final experiment, we show that the effects of virtual progress mayoutweigh the effects of actual average progress.(Goal-Oriented Services; Behavioral Decision Making; Progress; Choice; Path Characteristics;Transportation)
IntroductionIn many service situations, consumers are transportedfrom one state to another over a certain interval oftime. For example, an airline may transport passen-gers from Denver to Boston over four hours, or a sup-plier of machine tools may undertake to deliver andinstall a new assembly line of 80 machine tools over20 weeks. In both cases, the service moves the con-sumer (the passenger, or the assembly line) from astart state (Denver, or the absence of the assembly line)to a destination state (Boston, or the existence of a newline) over a specified period of time (four hours, or20 weeks, respectively; we refer to this as the elapsedtime). In these services, the goal of the consumer is
to attain the destination state without much regard tothe intermediate states.
Given their goal-oriented nature, the most basicevaluation of such services might use a total costapproach in which the evaluation is a function ofthe cost of time involved (i.e., a function of elapsedtime, Becker 1965) and any additional costs incurred.These additional costs could be monetary (i.e., theprice paid) or nonmonetary (e.g., the hassle of chang-ing planes). Consumers should be indifferent betweenservices in which each element of cost is held con-stant. However, we argue in this paper that in addi-tion to cost factors like the elapsed time and price,the evaluation of services is influenced by the pathcharacteristics of the service. Specifically, certain path
0025-1909/03/4909/12291526-5501 electronic ISSN
Management Science © 2003 INFORMSVol. 49, No. 9, September 2003, pp. 1229–1250
SOMAN AND SHIEffect of Path Characteristics on Perceptions of Progress and Choice
characteristics convey a greater perceived progresstowards the destination, and a belief that the elapsedtime is utilized efficiently. This perceived progresstowards the destination represents an additional vari-able that influences consumer choice.
Note that the comparison of two paths in whichan identical output (i.e., distance traveled or num-ber of machines installed) is produced in an identicalelapsed time might lead to a conclusion that the math-ematical rate of progress, as viewed over the entirepath, is identical (cf. Allen 1997). However, we pro-pose that the perceived progress as experienced dur-ing the path also influences consumer judgment anddecision making. We use the term virtual progress tocapture this perception of progress. It is not our inten-tion to argue that the effects of virtual progress areeither unreal or irrational; we simply use the word“virtual” to capture a source of progress that may notbe immediately obvious from a simple mathematicalrepresentation of the service situation.
In the rest of this paper, we first review relevantliterature, present an analytical model of consumerchoice, and derive predictions about specific relation-ships between path characteristics and choice. Second,we present the results of six experiments designedto test these predictions and to highlight the impor-tance of virtual progress. The first five experimentsstudy choices between services in which the elapsedtime and price is held constant, but in which thepath characteristics vary. In a final experiment, weshow that virtual progress is not merely an artifactualphenomenon that only comes into prominence whenelapsed time is held constant, but that consumers areactually willing to choose longer paths that have ahigher degree of perceived progress. Finally, we con-clude with a general discussion and propose direc-tions for future research.
The Effect of Path Characteristics onEvaluations—A Model ofConsumer ChoiceRecent research in behavioral decision making sug-gests that sequences of events create consumer experi-ences (Ariely 1998, Ariely and Carmon 2000, Carmonand Kahneman 1996). Research has also shown that
the evaluation of such experiences is not greatlyinfluenced by the actual duration of the experience(Fredrickson and Kahneman 1993) or by the final out-come (Hsee and Abelson 1991), but rather by somedefining features or gestalt characteristics of the expe-riences (Ariely and Carmon 2000, Kahneman et al.1993). These features include the relative value of theoutcome as compared to its past values (Loewensteinand Prelec 1993), the rate of change of the outcome(Hsee and Abelson 1991), the peak intensity of theexperience (Ariely 1998), and the affective experienceat the end of the sequence (Ariely and Carmon 2000).
We identify another path characteristic that isespecially relevant for goal-oriented services—theperceived progress towards the destination. Priorresearch suggests that the achievement of subtaskstowards the attainment of a goal often signals asense of progress that contributes to feelings of well-being and high morale in individuals (Brunstein 1993,Cantor and Kihlstrom 1987). Theories of motivation(Deci and Ryan 1985) suggest that people like tobe in situations in which they are constantly mak-ing progress towards their goal, and further, thatprogress enhances psychological well-being (Sheldonand Kasser 1995, 1998). This suggests that in situa-tions where consumers are focussed on the goal ofreaching the destination, they actively choose activi-ties that will help them attain this goal (Locke andLatham 1990, Sheldon and Kasser 1998).
Modeling Consumer ChoiceWe first consider service alternatives that have iden-tical prices, and start (O) and destination (D) loca-tions. The elapsed time T represents the time neededto traverse this distance. We represent the opportu-nity costs of elapsed time T as c�T � where c′�T � > 0(Becker 1965, Soman 2001).
We next incorporate the effects of perceivedprogress. We characterize a service path as a series ofvelocities �vt t ∈ 0T �� where velocity vt is a mea-sure of the progress towards destination at any giventime t. Velocity vt can represent the speed of air-planes, the rate at which machine tools are delivered,or the rate of change in a patient’s blood glucoselevel, and it can be positive, zero, or negative. Apositive velocity transports the consumer closer to
1230 Management Science/Vol. 49, No. 9, September 2003
SOMAN AND SHIEffect of Path Characteristics on Perceptions of Progress and Choice
the destination (resulting in positive displacement), zerovelocity keeps the consumer at the same location (idleperiod), and a negative velocity (a flight traveling inthe opposite direction) moves the consumer awayfrom the destination (negative displacement).1
Prior research shows that people anticipate utili-ties from future events (cf. Elster and Loewenstein1992). Specifically, we propose that consumers evalu-ating a path anticipate gaining some value u�vt� fromthe velocity vt at any time t, and that this value isa function of the difference between the actual veloc-ity and a reference velocity (Loewenstein and Prelec1993). Further, research has shown that future out-comes have a lower impact than current outcomesbecause people tend to undervalue—or discount—the future (Liberman and Trope 1998, Rachlin andRaineri 1992). We capture this by a discounting func-tion such that u0�vt�, the present anticipated valuearising from time t, equals u�vt��
t (� = discountingfactor, 0 ≤ �≤ 1). When �= 1, there is no discountingand future outcomes carry as much weight as presentoutcomes, and when � = 0, future outcomes play norole and only the current outcome matters. Recentresearch infers implicit discount rates for the deci-sion weights associated with delayed attributes andsuggests that typical values of � are in the range of0.8–0.95 (see Loewenstein and Prelec 1992). Generally,it appears that individuals care about future events,but undervalue these future events relative to thepresent (Soman 2002).
We further propose that values are generated foreach instant during the service and that the valuationof the entire service (U ) is the simple aggregation ofsuch values plus a negative value associated with thelength of the elapsed time. We use the notation “U”rather than “V ” to represent value to avoid confusion
1 In this paper, we consider situations where consumers focus onthe goal of reaching the destination. As a result, the velocity is aone-dimension vector that measures the progress to the goal. Inservice situations where consumers have multiple goals, the veloc-ity becomes a multiple-dimension vector, with each element of thevector measuring the progress to the corresponding goal. The val-uation of the service will be an additive measure of the valuationof progress to individual goals. We thank a reviewer for pointingout this model extension.
with the notation for velocity. Therefore, the predictedvalue is
U =∫ T
0u�vt��
t dt− c�T �� (1)
Note that service valuation also decreases with theelapsed time T . Equation (1) represents our basicmodel of consumer decision making.2
Anticipated Value from ProgressWe model the anticipated value arising from theperceived progress towards destination through thedeviation of a service route from the consumer’sexpected progress over time. A rich literature has doc-umented that utility (or value) of an outcome is eval-uated with reference to some underlying expectedlevel of that outcome (e.g., Kahneman and Tversky1979). In this spirit, we argue that a consumer wouldobtain a positive value when progressing faster thanexpected, but receive a negative value when movingslower than expected. Let Rt be the expected rate ofprogress at time t. We propose that this is a constant;i.e. Rt = v where t ∈ 0T �. This is consistent withLoewenstein and Prelec (1993), who suggest that con-sumers develop their reference based on a uniformpath from start to destination state (i.e., v= v=D/T ).We also validate this assumption using a series ofverbal protocols where subjects were asked to thinkaloud as they evaluated a number of services withdifferent path characteristics. One of the most promi-nent themes that emerged from this analysis was atendency to start the evaluation by computing theaverage velocity (see also Flint 1998). Even when eval-uating a path singly, subjects tended to compare itwith some internally generated “control” path of uni-form velocity. Thus, while we do not impose restric-tions on the value of v, past research and our protocolanalysis suggest that v is a good approximation for v.
2 The effect of path characteristics that we study is independentof the opportunity cost of time, c�T �. Therefore, we leave the costfunction c�T � in a general form without imposing any restrictionson its specification, e.g., whether c�T � should be a function of thediscount factor.
Management Science/Vol. 49, No. 9, September 2003 1231
SOMAN AND SHIEffect of Path Characteristics on Perceptions of Progress and Choice
Let g�·� and l�·� represent gain (velocity greater thanreference) and loss (velocity less than reference) func-tion, respectively. Then,
g�vt�=vt − v+ �vt − v�
2 (2)
l�vt�=vt − v− �vt − v�
2� (3)
If a consumer has a gain, then loss l�vt�= 0. Similarly,if he experiences a loss, then g�vt� = 0. We can thenwrite a consumer’s predicted value from velocity vt as
u�vt�={g�vt� if vt ≥ v
−�l�vt� if vt < v(4)
where � is the coefficient of loss aversion (Tverskyand Kahneman 1991). Consistent with loss aversion,we posit that � > 1; that is, losses loom larger thangains in decision making.3 Note that if there are nogains or losses (i.e., the actual service path is identicalto the “reference” path), our proposed model is sim-plified to the special case where only the elapsed timematters in the evaluation of the service.
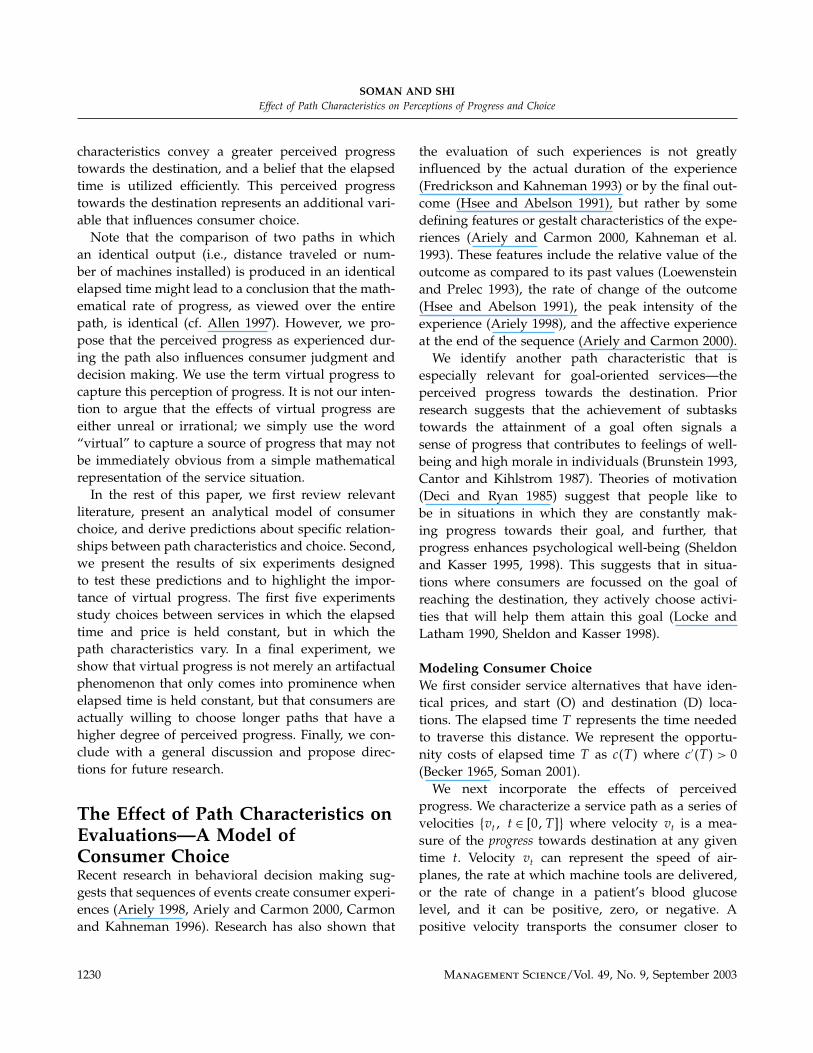
Figure 1 represents consumer decision makingusing a schematic representation of the model. Thefirst panel shows a reference path (dotted line) andthe actual path (solid line), while the second panelshows the corresponding velocity profiles. Gains andlosses are represented by the shaded areas and labeledas G and L, respectively. The third panel shows theeffect of intertemporal discounting—areas that arefurther away from the time of decision making areshrunk by a greater degree than areas that are closer.The resulting sum of the shrunken areas (Gd1 +Gd2 −Ld1 − Ld2) represents the contribution of path char-acteristics to the final evaluation of the service path(the final evaluation also includes the negative valueassociated with the elapsed time). Note that this sim-ple schematized version of the model treats time dis-cretely in terms of four segments of the service, whilethe model in Equation (1) treats time as a continuousvariable.
3 Equation (4) reflects constant loss aversion. Alternately, one couldconsider a more complicated utility function with diminishing sen-sitivity, but the extra complexity does not change the nature of theresults derived later.
Figure 1 Graphical Illustration of the Model: How Path CharacteristicsTranslate to Velocity and Value
Time
Vel
oci
ty a
nd V
alue
Dis
pla
cem
ent
A) Displacement (Path Characteristics)
C) Discounted Velocity and Value (Dark regions represent
loss of value due to discounting)
Gd1
Ld1 Ld2
Gd2
B) Undiscounted Velocity and Value (G=Gain, L=Loss)
G1G2
L1 L2
Reference Velocity
In this paper, we are particularly interested in pathcharacteristics that hinder progress, and we refer tothese as obstacles. Two such obstacles are (a) the pres-ence of idle time during the path, and (b) movementaway from the final destination (or the presence ofnegative displacement).
(a) Presence of Idle Time. A growing body of litera-ture in marketing suggests that consumers are averseto waiting before or during a service (Larson 1987)and that waiting generally reduces service evaluations(Carmon et al. 1995, Taylor 1994). In goal-oriented ser-vices, idle time would allow the consumer to focuson the delay, resulting in impatience and frustration.Also, paths with idle times are likely to be seen as
1232 Management Science/Vol. 49, No. 9, September 2003
SOMAN AND SHIEffect of Path Characteristics on Perceptions of Progress and Choice
inefficient and, hence, of low perceived progress. Con-sumers will be motivated to minimize potential futurefrustration and pain (Sawrey and Telford 1971), andhence we expect that they will be more likely tochoose services that have no idle time.
(b) Presence of Negative Displacement. Feelings ofgoal impediment and frustration will also occur whenthe service takes the consumer in a direction oppo-site to the destination for some portion of the elapsedtime. Traveling in the opposite direction is counter togoal-oriented behavior, and hence can be seen as asource of frustration (Locke and Latham 1990, Sawreyand Telford 1971). Hence, we propose that the pres-ence of negative displacement will reduce the choicelikelihood.
To model the presence of obstacles, without lossof generality, suppose that a service alternative ofelapsed time T consists of an idle period (tI tI + TI )and a negative displacement of time period (tN
tN +TN ).4 Therefore, an idle of length TI starts at timetI and a negative displacement of length TN beginsat time tN . We let −vN (vN > 0) denote the velocityof negative displacement. According to Equations (3)and (4), during the service segment of idle period, aconsumer’s predicted value u�vt = 0� = −�v. Thus, aconsumer’s total predicted value from the entire idleperiod (tI tI +TI ) (denoted as UI ) is
UI =∫ tI+TI
tI
�−�v��t dt =−�v1−�TI
− ln��tI � (5)
It can also be shown that a consumer’s total predictedvalue from the entire period of negative displacement(denoted as UN ) is
UN =∫ tN+TN
tN
�−���v+vN ��t dt
= −��v+vN �1−�TN
− ln��tN � (6)
Finally, because a larger magnitude of positive dis-placement has to occur in a period of time shorterthan the elapsed time, the velocity in these segments(assumed constant) is
vp =D+vNTN
T −TI −TN
�
4 Detailed proofs of all results are available from the authors.
As a result, consumers experience gain during thesegment of positive displacement for a reasonablevalue of v. We can show that the predicted value fromall positive displacement segments is
Up =∫0T �\tI tI+TI �\tN tN+TN �
�vp − v��t dt
= �vp − v��1−�T �−�tI �1−�TI �−�tN �1−�TN �
− ln�� (7)
The predicted value of the entire service path is asummation of predicted value of all three types ofservice segments [U =Up+UI +UN −c�T �]. Using (5),(6), and (7) and assuming that �= 1, we can simplifythe predicted value of service to U = −��− 1�vTI +�v+vN �TN �+ �D− vT �−c�T �. Because �> 1, the pres-ence of such obstacles including both idle and nega-tive displacements would decrease the predicted ser-vice valuations for a given T . Service paths withidle and/or negative displacements are anticipated tooffer lower valuation than the reference path (constantvelocity) of the same elapsed time. This result holdsfor sufficiently large values of � (including the valuestypically found in the literature). Obviously, when � isvery low, the future does not matter much and choicewill be heavily influenced by earlier periods.
Location of ObstaclesPrevious research shows that consumer decision mak-ing is influenced by visceral factors like irritation andfrustration when these painful events occur withintemporal proximity rather than when they are tem-porally delayed (Loewenstein 1996), and their behav-ioral impact is also greater when they are proximal(Soman 1998, 2002). In choosing goal-oriented ser-vices, the presence of a temporally proximal obsta-cle will make the anticipated frustration and painmore salient, and hence may strongly influence choicebehavior. However, if the obstacle occurs later, theeffect on choice behavior will be weaker (Libermanand Trope 1998, Soman 2002).
In our model, the location of idle is described bytI . To show how the location of idle affects the pre-dicted service value (U ), we derive the marginal effectby taking the first-order derivative, �U/�tI = vp +��− 1�v��1− �TI ��tI ≥ 0. The positive derivative indi-cates that the predicted service value (U ) will be higher
Management Science/Vol. 49, No. 9, September 2003 1233
SOMAN AND SHIEffect of Path Characteristics on Perceptions of Progress and Choice
with larger tI (later idle). Similarly, we model the loca-tion of negative displacement by tN . Following thesame approach for the negative displacement, wecompute �U/�tN = vp + ��− 1�v+�vN ��1−�TN ��tN ≥0. The positive derivative shows that predicted servicevaluation is higher with larger tN (a later negative dis-placement).
In summary, we predict that:(a) The presence of idle time and negative displace-
ment would reduce the choice likelihood of a servicepath, and
(b) Conditional on the presence of idle time or neg-ative displacement, the choice likelihood is lower ifthese obstacles occur earlier during the elapsed time.
Note that our model considers virtual progress asan aggregate of moment-by-moment values based onsuitably discounted perceived progress as anticipatedat that moment. In contrast, we conceptualize math-ematically computed progress on the basis of theoverall path. Therefore, virtual progress could be con-sidered to be an evaluation akin to the aggregation oflocal evaluations, rather than one global evaluation.
Experimental EvidenceWe next report the results of six experiments designedto test the above two predictions and to highlight theimportance of virtual progress to consumer decisionmaking. In the first four, subjects compared a pair ofservice options that were identical in terms of startand destination states. Each subject saw a one-pagequestionnaire with two options from one of the fol-lowing domains: (a) transport, (b) medical treatments,and (c) supplier selection decisions. Because the stim-ulus materials and the experimental procedures aresimilar across experiments, we describe them in detailhere.
Transport (Flight or Train) ChoicesSubjects in the transport domain were asked to imag-ine that they were planning to make reservations foran upcoming trip between a specified pair of cities.They were then asked to choose from a pair of flightsor train routes. The routes were either nonstop orinvolved a stop at a third specified city. All cities ina given experiment were selected such that their spa-tial arrangement was roughly linear. A map showing
the relative positions of the cities was provided aspart of the stimulus material. Information about theroutes was provided using standard “travel agent” or“timetable” formats, in which the arrival and depar-ture times from a given city as well as the distancetraveled in each segment was provided.
In all experiments, subjects faced a choice betweena control option (uniform velocity between start anddestination state) and a test option that includedidle time or negative displacement. All subjects weretold that they were not interested in sightseeing andthat they could not leave the train or plane when ithad stopped (except to make a connection). In someexperiments, the control option was priced marginallyhigher than the test option; therefore subjects had toincur a cost to choose it.
Choosing Medical TreatmentsSubjects in this domain made a choice between a pairof treatment plans for high blood glucose. They weretold to imagine that after a routine health checkup,their doctor had told them that their blood glucoselevel was higher (200 mg/dl) than ideal (100 mg/dl).They were further told: “Having a glucose level of 200isn’t a serious problem in the short run (the accept-able range is 75 to 225). There are no negative effectsand no immediate reactions. However, having a highglucose level over a period of a few years is harmful.Specifically, it can result in damage to kidneys, vision,and sensations. Your doctor says you should start atreatment course that will reduce the blood glucose to100 within a 50-day period.”
Subjects read that treatments for high blood glucoseare based on a combination of injections, medications(tablets), and dietary restrictions, and that the patternof change of the glucose level over time depends onthe order in which these elements are given. Specif-ically, glucose levels might rise and fall temporarilyduring the course of the treatment, but would alwaysremain within the acceptable range. Finally, subjectsfaced a choice between two treatment plans, both ofwhich would reduce the glucose level from 200 to 100over a 50-day period. Information about the antici-pated glucose levels over the 50-day period was pre-sented in the form of a plot over time. In the controlplan, the blood glucose level reduces uniformly at the
1234 Management Science/Vol. 49, No. 9, September 2003
SOMAN AND SHIEffect of Path Characteristics on Perceptions of Progress and Choice
rate of 2 per day over the 50-day period. In the testplan, the change is not uniform and had either an idleor a negative displacement.
Subjects read that from a medical perspective, bothtreatments are equally beneficial and that the doctor“encourages you to choose the treatment that youthink you are more comfortable with.” Both treatmentsinvolved the same number and schedule of visitsto the doctor’s office, but the control option wasdescribed as “a more rigid program requiring extraeffort on your part to carefully monitor and self-administer medications and perform glucose testingusing a home kit.” Subjects who chose the controloption thus incurred an additional cost of monitoringand testing.
Building MachinesSubjects in this domain were asked to imagine thatthe factory they were working for was in the pro-cess of selecting a supplier who would build andinstall 80 new machine tools. The work would be car-ried out over 20 weeks, and would be done in theevening with the new machines occupying designatednew areas that would cause no disruption to regu-lar production. Subjects were also told that the newmachines could not be used until all 80 had beeninstalled because they would all be linked to a com-mon computer.
Subjects then faced a choice between two suppli-ers. One supplier (the control option) would buildand install at the uniform rate of four machines perweek and would guarantee completion in 20 weeks.Due to prior commitments, the second supplier (testoption) would do the installation with a four-weekrecess in the middle. This supplier would contract towork at the rate of five machines per week, and there-fore would also guarantee completion in a total of20 weeks. Both suppliers quoted the same total price;however, the test supplier offered an extended war-ranty on the machines (11 years instead of 10). Sub-jects who chose the control option therefore incurredthe opportunity cost of foregoing the extended war-ranty offer on their machines.
Note that in the medical treatment and buildingmachines domains, the control options as describedearlier were identical across all experiments and
will not be described separately in the rest of thediscussion.
Dependent Variables and Other MeasuresThe dependent variable in all experiments was thechoice that the subject made between the control andtest options. In some cases, the choice measure wasaugmented or replaced by a relative preference mea-sure on a 9-point scale, with 5 indicating indifference.These choice measures were always collected beforeany other measures were taken. For the purposes ofdiscussion, we have scaled the choice and relativepreference measures such that higher numbers indi-cate a greater preference for the test option involvingidle time or negative displacement.
In some cases, we also measured the perceivedprogress (PROG) and the extent to which subjectswere confident that the service would proceed asscheduled (PATH). To measure PROG, we used twoitems on which subjects indicated their agreementon 9-point scales (1 = Completely Disagree, 9 = Com-pletely Agree). The first item was “This path usedthe [elapsed time period] effectively in reaching thedestination;” while the second item was “I will expe-rience a sense of progress or accomplishment as I gothrough the [elapsed time period].” The correlationbetween the two items was consistently high (rangingfrom 0.78 to 0.93 across experiments); hence, we usedthe average of these two items as a measure of per-ceived progress (PROG). Subjects were also asked toindicate PATH on a 9-point scale, “based on the infor-mation provided, please indicate whether you believethat the [service] will not progress as per the described[path].” This measure was collected to rule out thepossibility that our results were driven by the infer-ence that the service was more likely to proceed perschedule in the control condition than in the test con-dition. Both PATH and PROG measures were takenafter the choice measure. In experiments using stu-dent subjects, we collected these measures in a sep-arate questionnaire after unrelated tasks to minimizethe possibility of halo effects causing self-generatedvalidity (Feldman and Lynch 1988).
We next discuss each experiment by referring to anaccompanying table that lists details (like subject pop-ulations and sample sizes) as well as the results andanalysis.
Management Science/Vol. 49, No. 9, September 2003 1235
SOMAN AND SHIEffect of Path Characteristics on Perceptions of Progress and Choice
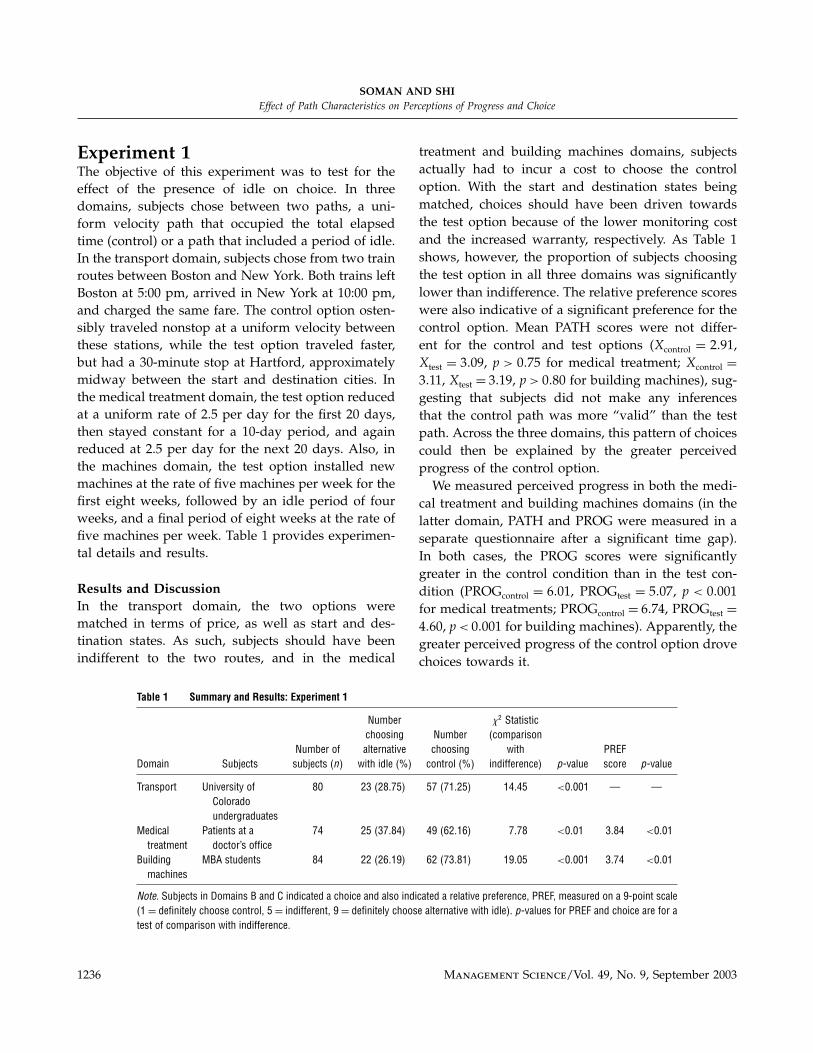
Experiment 1The objective of this experiment was to test for theeffect of the presence of idle on choice. In threedomains, subjects chose between two paths, a uni-form velocity path that occupied the total elapsedtime (control) or a path that included a period of idle.In the transport domain, subjects chose from two trainroutes between Boston and New York. Both trains leftBoston at 5:00 pm, arrived in New York at 10:00 pm,and charged the same fare. The control option osten-sibly traveled nonstop at a uniform velocity betweenthese stations, while the test option traveled faster,but had a 30-minute stop at Hartford, approximatelymidway between the start and destination cities. Inthe medical treatment domain, the test option reducedat a uniform rate of 2.5 per day for the first 20 days,then stayed constant for a 10-day period, and againreduced at 2.5 per day for the next 20 days. Also, inthe machines domain, the test option installed newmachines at the rate of five machines per week for thefirst eight weeks, followed by an idle period of fourweeks, and a final period of eight weeks at the rate offive machines per week. Table 1 provides experimen-tal details and results.
Results and DiscussionIn the transport domain, the two options werematched in terms of price, as well as start and des-tination states. As such, subjects should have beenindifferent to the two routes, and in the medical
Table 1 Summary and Results: Experiment 1
Number �2 Statisticchoosing Number (comparison
Number of alternative choosing with PREFDomain Subjects subjects (n) with idle (%) control (%) indifference) p-value score p-value
Transport University of 80 23 �28�75� 57 �71�25� 14�45 <0�001 — —Coloradoundergraduates
Medical Patients at a 74 25 �37�84� 49 �62�16� 7�78 <0�01 3�84 <0�01treatment doctor’s office
Building MBA students 84 22 �26�19� 62 �73�81� 19�05 <0�001 3�74 <0�01machines
Note. Subjects in Domains B and C indicated a choice and also indicated a relative preference, PREF, measured on a 9-point scale(1= definitely choose control, 5= indifferent, 9= definitely choose alternative with idle). p-values for PREF and choice are for atest of comparison with indifference.
treatment and building machines domains, subjectsactually had to incur a cost to choose the controloption. With the start and destination states beingmatched, choices should have been driven towardsthe test option because of the lower monitoring costand the increased warranty, respectively. As Table 1shows, however, the proportion of subjects choosingthe test option in all three domains was significantlylower than indifference. The relative preference scoreswere also indicative of a significant preference for thecontrol option. Mean PATH scores were not differ-ent for the control and test options (Xcontrol = 2�91,Xtest = 3�09, p > 0�75 for medical treatment; Xcontrol =3�11, Xtest = 3�19, p > 0�80 for building machines), sug-gesting that subjects did not make any inferencesthat the control path was more “valid” than the testpath. Across the three domains, this pattern of choicescould then be explained by the greater perceivedprogress of the control option.
We measured perceived progress in both the medi-cal treatment and building machines domains (in thelatter domain, PATH and PROG were measured in aseparate questionnaire after a significant time gap).In both cases, the PROG scores were significantlygreater in the control condition than in the test con-dition (PROGcontrol = 6�01, PROGtest = 5�07, p < 0�001for medical treatments; PROGcontrol = 6�74, PROGtest =4�60, p < 0�001 for building machines). Apparently, thegreater perceived progress of the control option drovechoices towards it.
1236 Management Science/Vol. 49, No. 9, September 2003
SOMAN AND SHIEffect of Path Characteristics on Perceptions of Progress and Choice
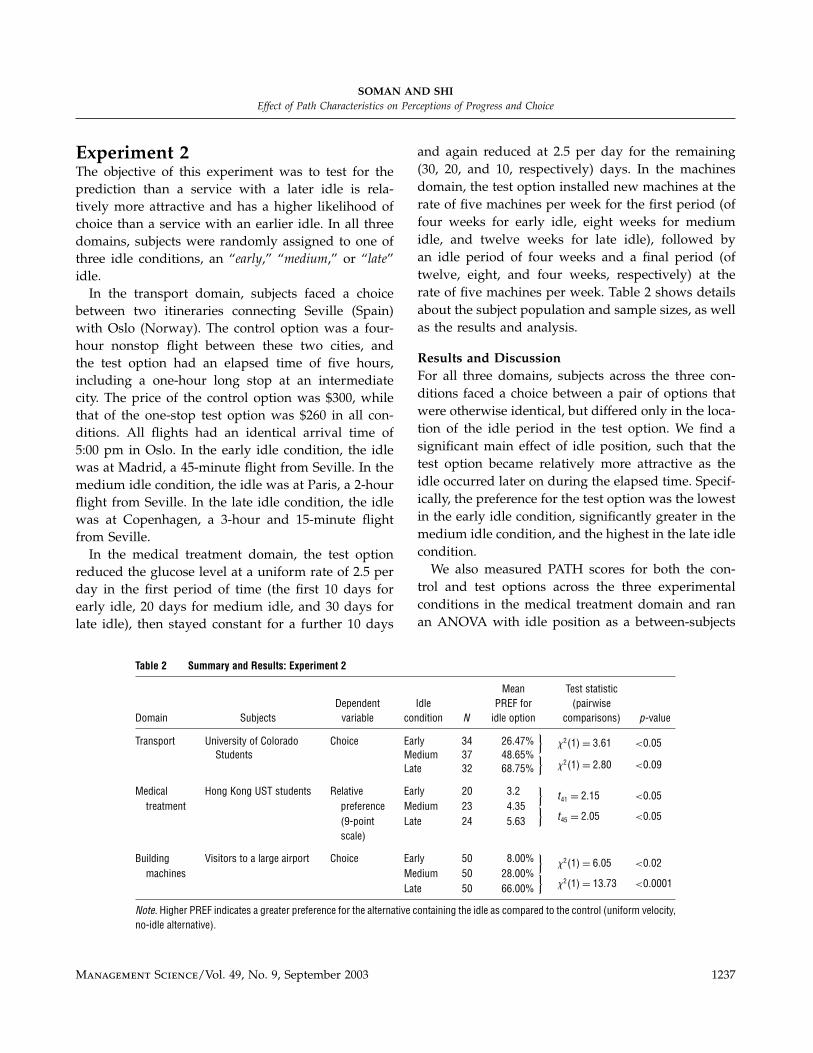
Experiment 2The objective of this experiment was to test for theprediction than a service with a later idle is rela-tively more attractive and has a higher likelihood ofchoice than a service with an earlier idle. In all threedomains, subjects were randomly assigned to one ofthree idle conditions, an “early,” “medium,” or “late”idle.
In the transport domain, subjects faced a choicebetween two itineraries connecting Seville (Spain)with Oslo (Norway). The control option was a four-hour nonstop flight between these two cities, andthe test option had an elapsed time of five hours,including a one-hour long stop at an intermediatecity. The price of the control option was $300, whilethat of the one-stop test option was $260 in all con-ditions. All flights had an identical arrival time of5:00 pm in Oslo. In the early idle condition, the idlewas at Madrid, a 45-minute flight from Seville. In themedium idle condition, the idle was at Paris, a 2-hourflight from Seville. In the late idle condition, the idlewas at Copenhagen, a 3-hour and 15-minute flightfrom Seville.
In the medical treatment domain, the test optionreduced the glucose level at a uniform rate of 2.5 perday in the first period of time (the first 10 days forearly idle, 20 days for medium idle, and 30 days forlate idle), then stayed constant for a further 10 days
Table 2 Summary and Results: Experiment 2
Mean Test statisticDependent Idle PREF for (pairwise
Domain Subjects variable condition N idle option comparisons) p-value
Transport University of Colorado Choice Early 34 26�47%}
�2�1�= 3�61 <0�05Students Medium 37 48�65% }
�2�1�= 2�80 <0�09Late 32 68�75%
Medical Hong Kong UST students Relative Early 20 3�2}
t41 = 2�15 <0�05treatment preference Medium 23 4�35 }
t45 = 2�05 <0�05(9-point Late 24 5�63scale)
Building Visitors to a large airport Choice Early 50 8�00%}
�2�1�= 6�05 <0�02machines Medium 50 28�00% }
�2�1�= 13�73 <0�0001Late 50 66�00%
Note. Higher PREF indicates a greater preference for the alternative containing the idle as compared to the control (uniform velocity,no-idle alternative).
and again reduced at 2.5 per day for the remaining(30, 20, and 10, respectively) days. In the machinesdomain, the test option installed new machines at therate of five machines per week for the first period (offour weeks for early idle, eight weeks for mediumidle, and twelve weeks for late idle), followed byan idle period of four weeks and a final period (oftwelve, eight, and four weeks, respectively) at therate of five machines per week. Table 2 shows detailsabout the subject population and sample sizes, as wellas the results and analysis.
Results and DiscussionFor all three domains, subjects across the three con-ditions faced a choice between a pair of options thatwere otherwise identical, but differed only in the loca-tion of the idle period in the test option. We find asignificant main effect of idle position, such that thetest option became relatively more attractive as theidle occurred later on during the elapsed time. Specif-ically, the preference for the test option was the lowestin the early idle condition, significantly greater in themedium idle condition, and the highest in the late idlecondition.
We also measured PATH scores for both the con-trol and test options across the three experimentalconditions in the medical treatment domain and ranan ANOVA with idle position as a between-subjects
Management Science/Vol. 49, No. 9, September 2003 1237
SOMAN AND SHIEffect of Path Characteristics on Perceptions of Progress and Choice
independent variable and option (control vs. test)as a within-subjects independent variable. ANOVAresults yielded no significant effects (all p’s > 0�45),suggesting that different confidence levels about theschedules did not drive our results.
We also measured the perceived progress (PROG)in a separate questionnaire for the medical treatmentdomain. The mean PROG score for the control optiondid not differ across the three experimental condi-tions (PROGcontrol = 6�16). However, consistent withour expectation, the mean PROG score for the testoption was the lowest in the early idle condition(PROGearly = 2�95), significantly greater in the mediumidle condition (PROGmedium = 4�04, p < 0�01), and thehighest in the late idle condition (PROGlate = 5�71, p <
0�01). The increase in choice for the test option as theidle period happened later in the elapsed time seemedto be driven by a simultaneously increasing percep-tion of progress of the test path.
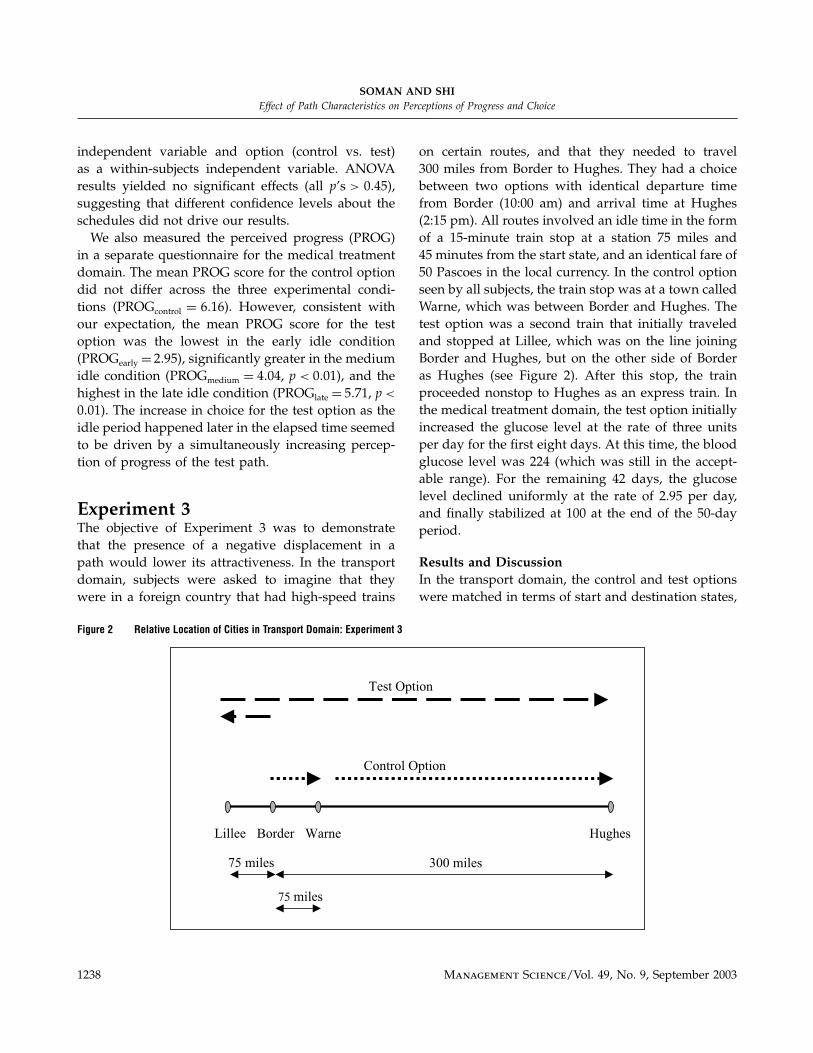
Experiment 3The objective of Experiment 3 was to demonstratethat the presence of a negative displacement in apath would lower its attractiveness. In the transportdomain, subjects were asked to imagine that theywere in a foreign country that had high-speed trains
Figure 2 Relative Location of Cities in Transport Domain: Experiment 3
Test Option
Control Option
Lillee Border Warne Hughes
75 miles
75 miles
300 miles
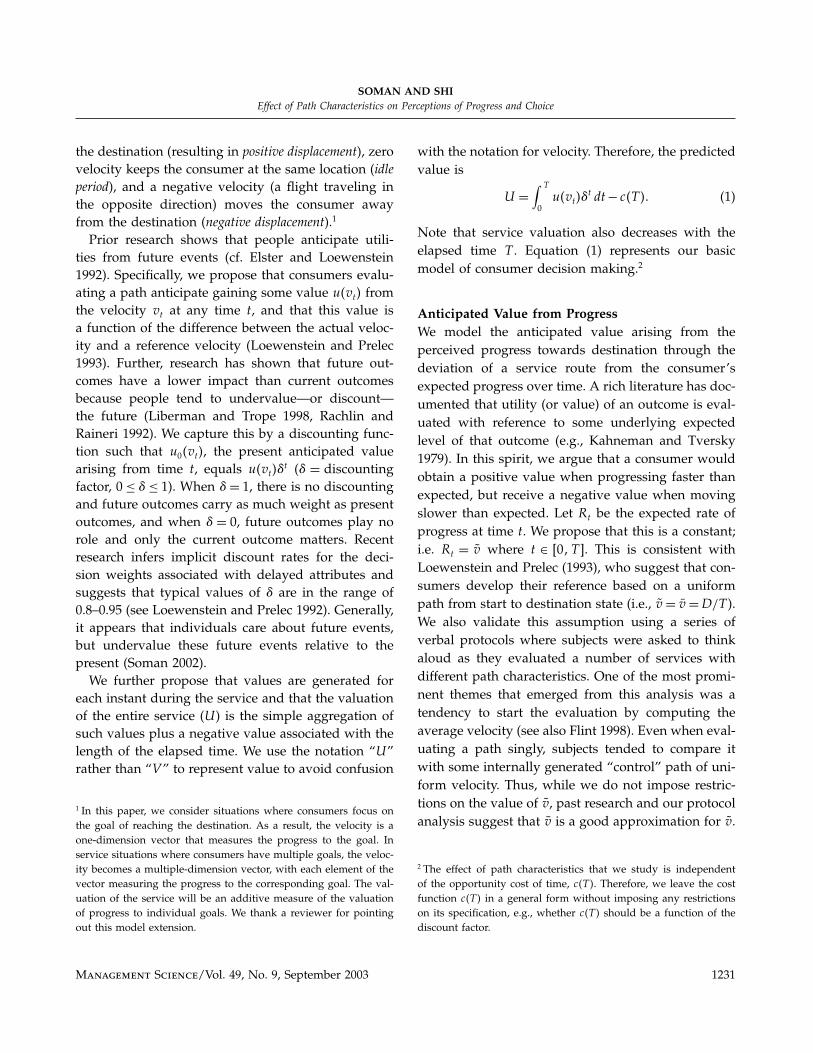
on certain routes, and that they needed to travel300 miles from Border to Hughes. They had a choicebetween two options with identical departure timefrom Border (10:00 am) and arrival time at Hughes(2:15 pm). All routes involved an idle time in the formof a 15-minute train stop at a station 75 miles and45 minutes from the start state, and an identical fare of50 Pascoes in the local currency. In the control optionseen by all subjects, the train stop was at a town calledWarne, which was between Border and Hughes. Thetest option was a second train that initially traveledand stopped at Lillee, which was on the line joiningBorder and Hughes, but on the other side of Borderas Hughes (see Figure 2). After this stop, the trainproceeded nonstop to Hughes as an express train. Inthe medical treatment domain, the test option initiallyincreased the glucose level at the rate of three unitsper day for the first eight days. At this time, the bloodglucose level was 224 (which was still in the accept-able range). For the remaining 42 days, the glucoselevel declined uniformly at the rate of 2.95 per day,and finally stabilized at 100 at the end of the 50-dayperiod.
Results and DiscussionIn the transport domain, the control and test optionswere matched in terms of start and destination states,
1238 Management Science/Vol. 49, No. 9, September 2003
SOMAN AND SHIEffect of Path Characteristics on Perceptions of Progress and Choice
Table 3 Summary and Results: Experiment 3
Choice forNumber of alternative �2 Statisticsubjects with negative (comparison with Relative
Domain Subjects (n) displacement (%) indifference) p-value PREF score p-value
Transport Passengers at 100 25 �25�00� 25�00 <0�01 3�84 <0�01a train station
Medical Visitors to a 90 21 �23�33� 21�51 <0�01 3�49 <0�01treatment pharmacy store
Note. PREF was measured on a 9-point scale (1= definitely choose control, 5= indifferent, 9= definitely choose alternativewith negative displacement). p-values for PREF are for a test of comparison with Indifference.
as well as price. As such, subjects should have beenindifferent between the two. In the medical treat-ment domain, subjects’ choices should have beendriven away from the control option due to thelarger monitoring costs associated with it. However,Table 3 shows that in both domains, subjects dis-played a strong and significant preference for thecontrol option for both actual choice and relative pref-erence measures. This pattern of choices is consistentwith the greater anticipated perceived progress madein the control option. Specifically, in the transportdomain the mean PROG score for the control option(PROGcontrol = 6�12) was significantly greater than themean PROG score in the test option (PROGtest = 3�93,p < 0�001).
We also interviewed a subsample (n = 20) afterthey had turned in their surveys and asked themto provide reasons for their choice. A total of 38choices (average 1.9, range 1–3 per respondent) werecoded by three independent coders as relating toeither (a) uncertainties associated with the paths (e.g.,“trains often break down and if this happens, I’drather be closer to my destination than further”),(b) progress-related reasons (e.g., “It seems to be awaste to go in the opposite direction,” or “I seem tobe getting to where I want to go smoothly and with-out unnecessary excursions”), or (c) personal prefer-ences and miscellaneous reasons (e.g., “I prefer ridingon express trains”). The coders agreed on 34 items,and the remaining 4 were categorized by discussion.Uncertainties accounted for 21% (8/38), personal pref-erences for 32% (12/38), while progress-related rea-sons accounted for 47% (18/38) of the provided rea-sons. While other factors might have had a role to
play in decision making, the anticipated perceivedprogress made in the control condition seemed to bedriving choices towards it.
Experiment 4In this experiment, subjects chose between twooptions, one of which included some negative dis-placement. The negative displacement was locatedeither at the beginning or at the end of the elapsedtime. We predict that the choice likelihood would begreater if the negative displacement occurs at the end.
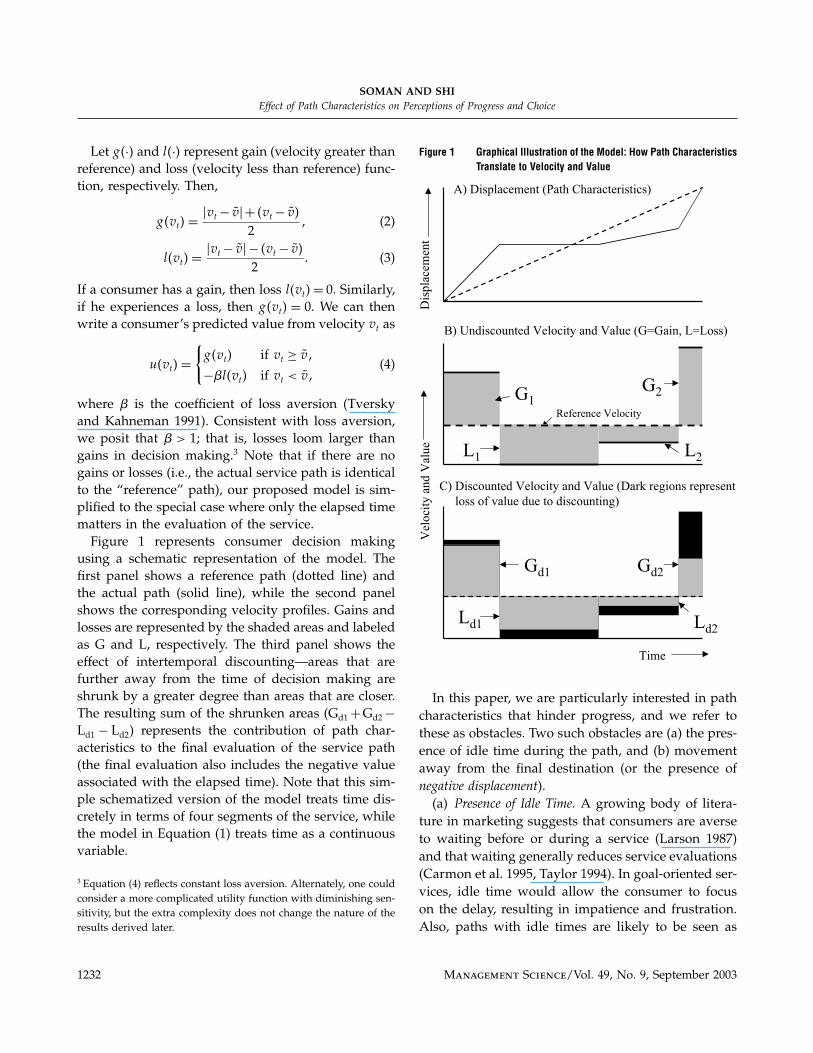
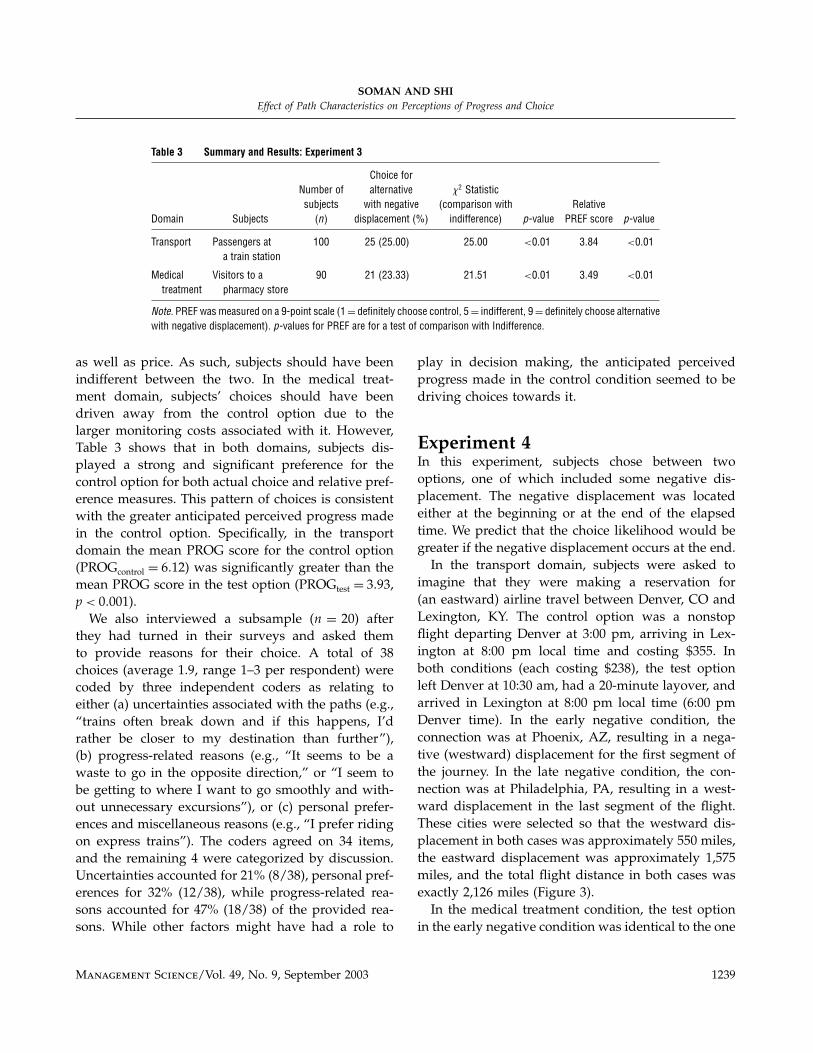
In the transport domain, subjects were asked toimagine that they were making a reservation for(an eastward) airline travel between Denver, CO andLexington, KY. The control option was a nonstopflight departing Denver at 3:00 pm, arriving in Lex-ington at 8:00 pm local time and costing $355. Inboth conditions (each costing $238), the test optionleft Denver at 10:30 am, had a 20-minute layover, andarrived in Lexington at 8:00 pm local time (6:00 pmDenver time). In the early negative condition, theconnection was at Phoenix, AZ, resulting in a nega-tive (westward) displacement for the first segment ofthe journey. In the late negative condition, the con-nection was at Philadelphia, PA, resulting in a west-ward displacement in the last segment of the flight.These cities were selected so that the westward dis-placement in both cases was approximately 550 miles,the eastward displacement was approximately 1,575miles, and the total flight distance in both cases wasexactly 2,126 miles (Figure 3).
In the medical treatment condition, the test optionin the early negative condition was identical to the one
Management Science/Vol. 49, No. 9, September 2003 1239
SOMAN AND SHIEffect of Path Characteristics on Perceptions of Progress and Choice
Figure 3 Displacement—Time Plots for Transport Stimuli: Experiment 4
Den
ver
L
exin
gto
n
Phoenix
Philadelphia
Early Negative Condition Late Negative Condition
Test Option
Control Option
3:00p 6:00p 10:30a 3:00p 6:00p
15
76
mil
es
15
76
mil
es5
50
m.
55
0 m
.
used in Experiment 3. In the late negative condition,the treatment reduced the glucose level for the first42 days at a uniform rate of 2.95 per day. At the endof this period, the glucose level was 76 (still in theacceptable range). For the last eight days, the glucoseincreased at a uniform rate of 3 per day and stabilizedat the level of 100 at the end of the 50-day period.
Table 4 Summary and Results: Experiment 4
Mean PREFNegative for negative Test statistic
Dependent displacement displacement (pairwiseDomain Subjects variable condition N option comparisons) p-value
Transport Passengers waiting Choice Early 30 33�33%}
�2�1�= 6�67 <0�01for flights at a large Late 30 66�66%international airport Relative Early 30 3�60
}t58 = 2�07 <0�05
preference Late 30 4�90(9-point scale)
Medical University of Relative Early 28 3�25}
t53 = 2�02 <0�05treatment Colorado students preference Late 27 4�33
(9-point scale)
Note. PREF was measured on a 7-point scale (1= definitely choose control, 4= indifferent, 7= definitely choose alternative with negativedisplacement) in the transportation domain and a 9-point scale in the medical treatment domain.
Results and DiscussionThe choice task for subjects in the early and late nega-tive conditions was identical except for the location ofthe negative displacement in the test option. We pre-dicted that the preference for the test option wouldincrease as the negative displacement occurred lateron during the elapsed duration. As Table 4 shows, the
1240 Management Science/Vol. 49, No. 9, September 2003
SOMAN AND SHIEffect of Path Characteristics on Perceptions of Progress and Choice
results of the experiment for both the transport andmedical treatment domains are consistent with thisexpectation.
As in previous experiments, we asked subjectsin the medical treatment domain for their PATHand PROG scores in a separate questionnaire. Whenanalyzed in an ANOVA with the negative position asa between-subjects factor and control vs. test optionas a within-subject factor, the PATH yielded no signif-icant effects (all p’s > 0�60), implying that our resultscould not be explained by differences in beliefs aboutthe validity of the paths. The mean PROG scores,however, are consistent with our theorizing. Specifi-cally, the mean PROG score for the control option wasno different across the two experimental conditions(PROGcontrol = 6�23). However, the mean PROG scoreincreased significantly from the early negative condi-tion (PROGearly = 2�57) to the late negative condition(PROGlate = 5�63, p < 0�01).
Experiments 1–4 collectively supported our predic-tions. However, these results still begged two ques-tions. First, we did not know whether the effectsof idle and negative displacement and their loca-tion interacted with each other. We had no reason toexpect any interactions, but wanted a within-subjectsreplication in which each subject was exposed tonumerous test options in which idle and negativedisplacement coexisted. We note that there are bothpros and cons to using within-subjects designs ratherthan between-subjects designs. As one speculation,within-subject designs may make the subject cog-nizant that the progress computed over the entirepath was in fact constant for all options and may,hence, weaken the effects of virtual progress. On theother hand, the within-subject design may also artifi-cially highlight the differences in paths across the con-ditions and strengthen the effects of virtual progress.Given that no one option was obviously superior, wefelt that it was important to use both. Second, wewanted to address the managerially relevant questionof whether these differences in predicted utility trans-late to differences in willingness to pay for the service.Both of these questions are addressed next.
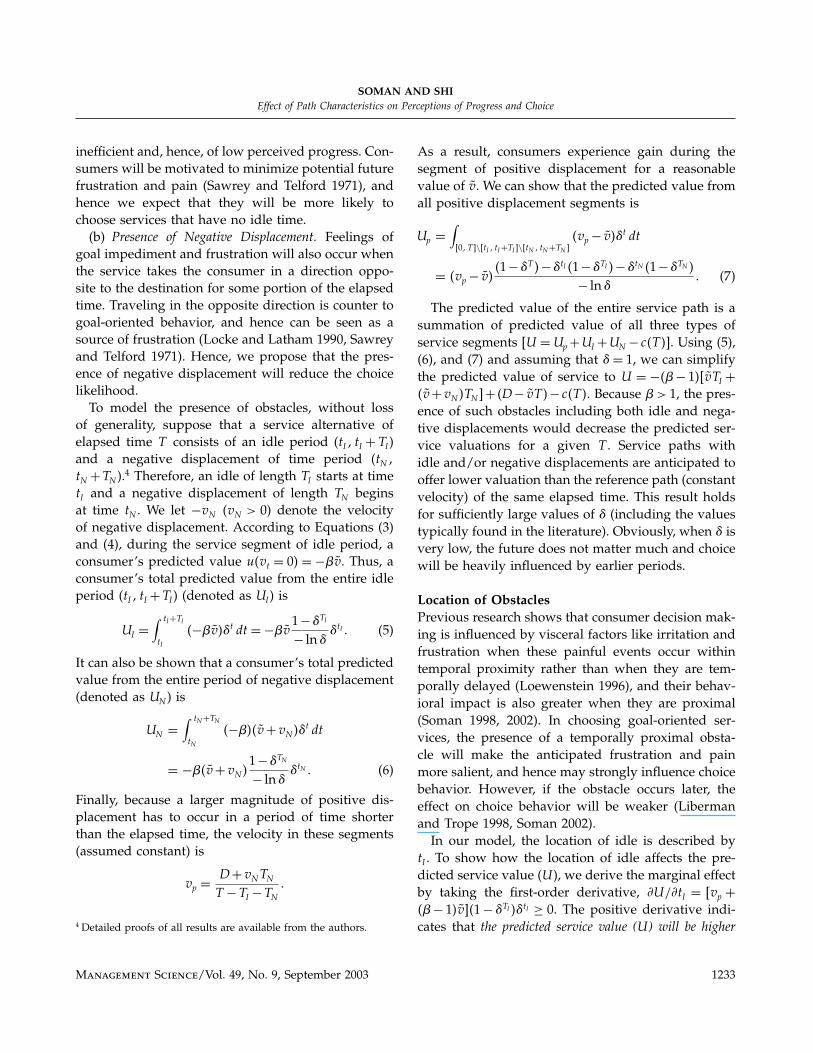
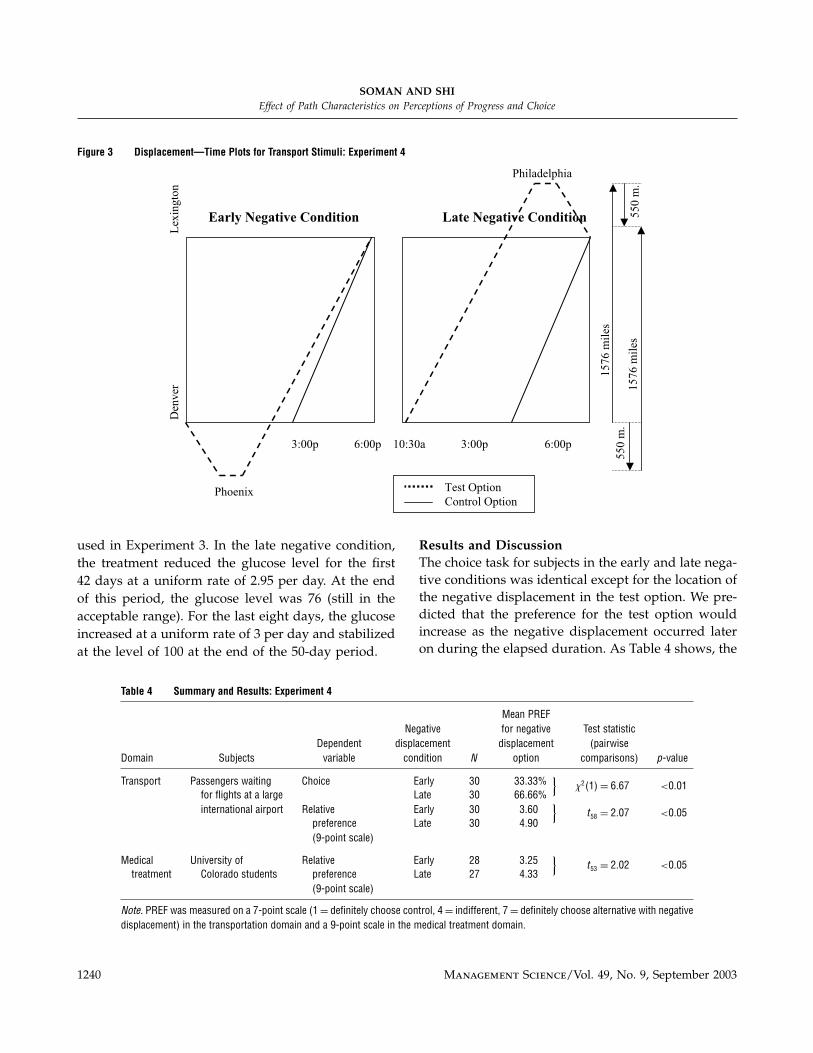
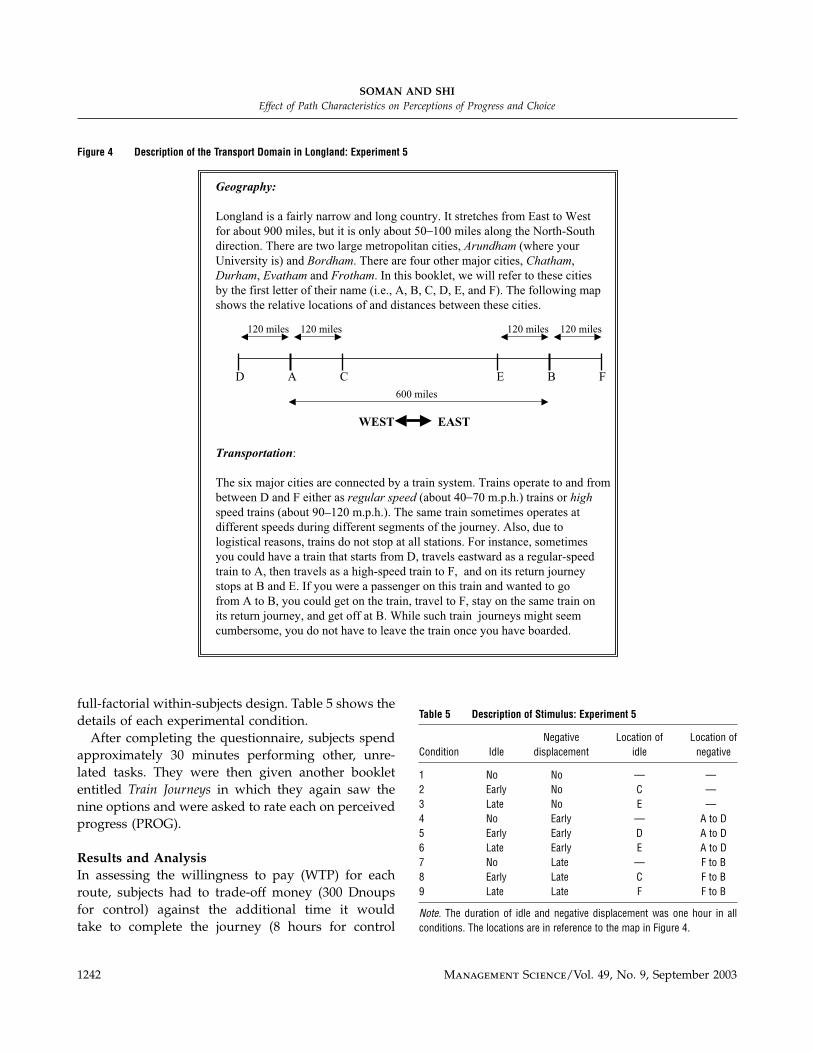
Experiment 5Subjects and ProcedureEighteen students from a state university participatedin this experiment (part of several unrelated stud-ies) in exchange for course credit. Subjects receivedan experimental booklet entitled Traveling in Longlandand were asked to imagine that they were exchangestudents in a (fictitious) country called Longland. Thegeography and train network of this country weredescribed (see Figure 4). Subjects were told that “youneed to go from A to B to get some paperwork doneregarding your trip back to the USA. The quickestway to do this is to catch a high-speed nonstop trainfrom A to B (called the “AB Express”) which leavesA at 10:00 am and arrives in B at 5:00 pm. How-ever, the fare for this train is 300 Dnoups” (the Dnoupis the local currency, 1 Dnoup = 1 U.S. dollar). Theywere further told that there were a number of cheaperoptions available, all of which left A at 10:00 am andarrived in B at 8:00 pm. They were told that “on eachof the following nine pages, you will be shown theitinerary of one option. For each option, please indi-cate the price (in Dnoups) you would be willing topay; i.e., a price that you think is a fair price for theitinerary. Remember that once you board the train atA, you cannot leave it until you reach B.” They werealso reminded that “trains travel at roughly a constantspeed between two stations,” but that the same traincould be a regular speed train for one segment and anexpress for another segment of the journey. Subjectswere also instructed to “look carefully at all the avail-able options before writing down your responses.”
DesignThe nine options were created by fully crossing threelevels of the idle factor with three levels of the neg-ative displacement factor. For the idle factor, therewas either no idle, an early idle between 11:00 amand 12:00 pm, or a late idle between 6:00 pm and7:00 pm. For negative displacement, there was eitherno negative travel, negative travel of 120 miles at thestart (10:00 am to 11:00 am, from A to D), or negativetravel of 120 miles at the end (7:00 pm to 8:00 pm,from F to B). This experiment employed a 3 (idle: no,early, late) × 3 (negative displacement: no, early, late)
Management Science/Vol. 49, No. 9, September 2003 1241
SOMAN AND SHIEffect of Path Characteristics on Perceptions of Progress and Choice
Figure 4 Description of the Transport Domain in Longland: Experiment 5
Geography:
Longland is a fairly narrow and long country. It stretches from East to West
for about 900 miles, but it is only about 50_100 miles along the North-South
direction. There are two large metropolitan cities, Arundham (where your
University is) and Bordham. There are four other major cities, Chatham,
Durham, Evatham and Frotham. In this booklet, we will refer to these cities
by the first letter of their name (i.e., A, B, C, D, E, and F). The following map
shows the relative locations of and distances between these cities.
Transportation:
The six major cities are connected by a train system. Trains operate to and frombetween D and F either as regular speed (about 40_70 m.p.h.) trains or high
speed trains (about 90_120 m.p.h.). The same train sometimes operates at
different speeds during different segments of the journey. Also, due to
logistical reasons, trains do not stop at all stations. For instance, sometimes
you could have a train that starts from D, travels eastward as a regular-speed
train to A, then travels as a high-speed train to F, and on its return journey
stops at B and E. If you were a passenger on this train and wanted to go
from A to B, you could get on the train, travel to F, stay on the same train on
its return journey, and get off at B. While such train journeys might seem
cumbersome, you do not have to leave the train once you have boarded.
D A C E B F
600 miles
120 miles 120 miles 120 miles 120 miles
WEST EAST
full-factorial within-subjects design. Table 5 shows thedetails of each experimental condition.
After completing the questionnaire, subjects spendapproximately 30 minutes performing other, unre-lated tasks. They were then given another bookletentitled Train Journeys in which they again saw thenine options and were asked to rate each on perceivedprogress (PROG).
Results and AnalysisIn assessing the willingness to pay (WTP) for eachroute, subjects had to trade-off money (300 Dnoupsfor control) against the additional time it wouldtake to complete the journey (8 hours for control
Table 5 Description of Stimulus: Experiment 5
Negative Location of Location ofCondition Idle displacement idle negative
1 No No — —2 Early No C —3 Late No E —4 No Early — A to D5 Early Early D A to D6 Late Early E A to D7 No Late — F to B8 Early Late C F to B9 Late Late F F to B
Note. The duration of idle and negative displacement was one hour in allconditions. The locations are in reference to the map in Figure 4.
1242 Management Science/Vol. 49, No. 9, September 2003
SOMAN AND SHIEffect of Path Characteristics on Perceptions of Progress and Choice
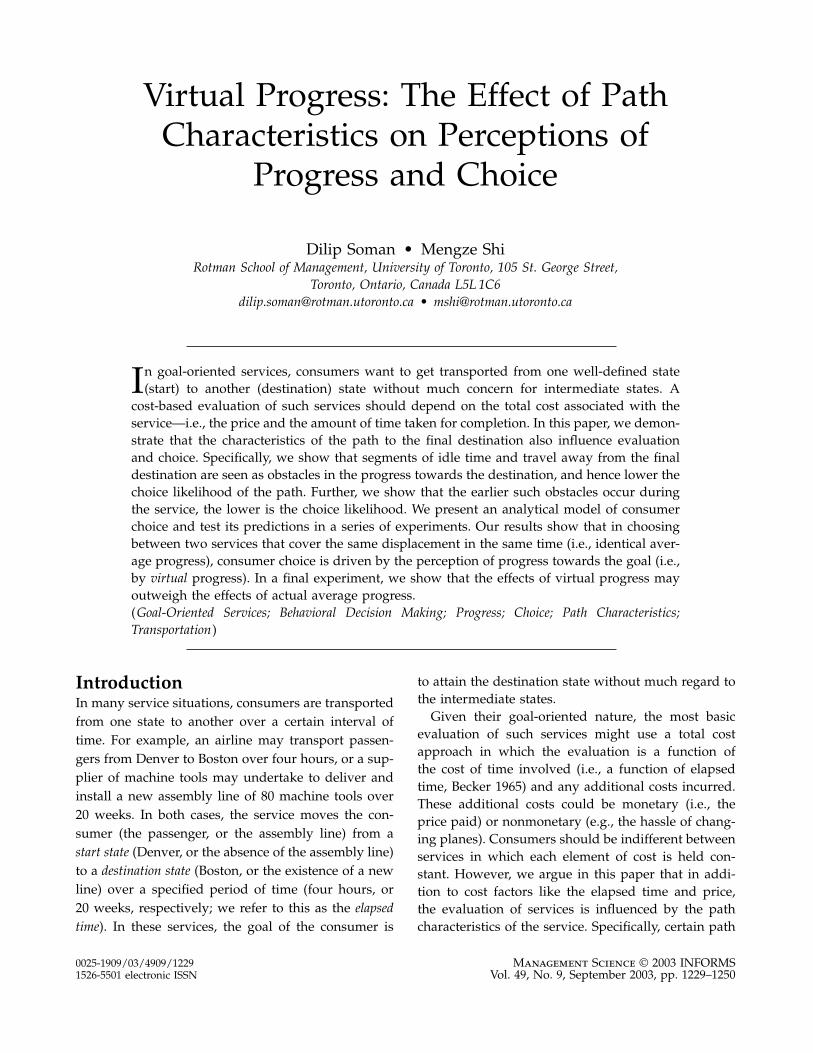
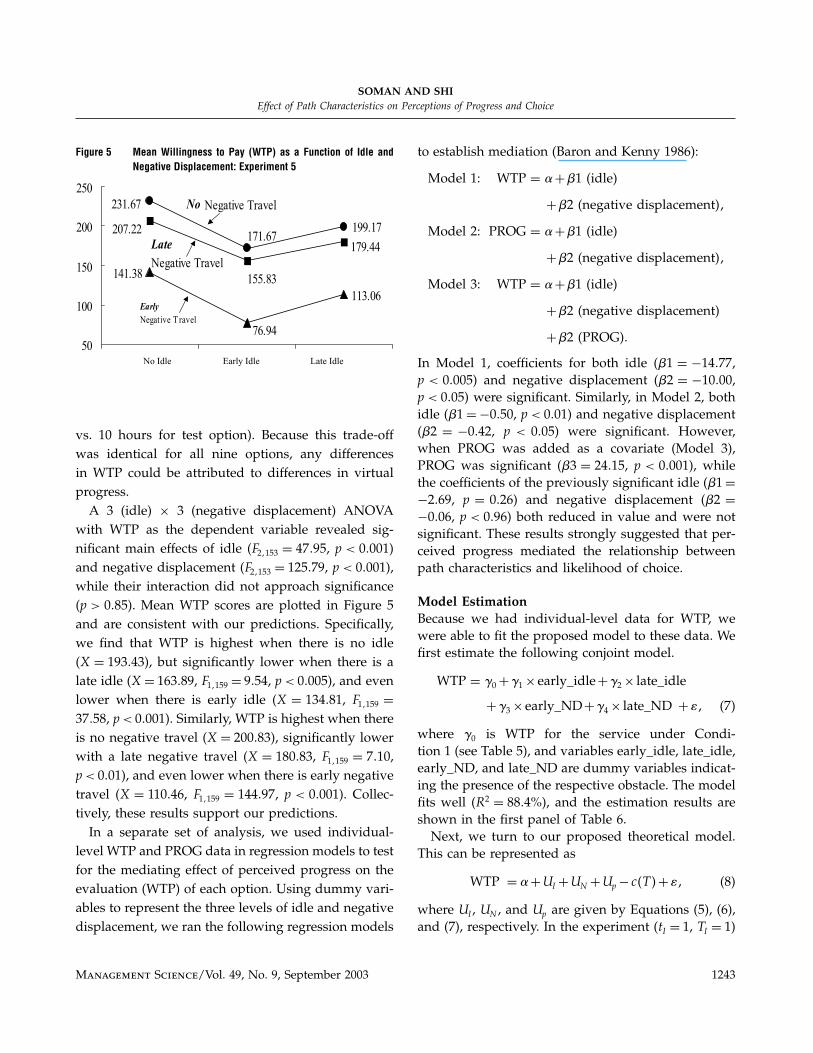
Figure 5 Mean Willingness to Pay (WTP) as a Function of Idle andNegative Displacement: Experiment 5
113.06
141.38
76.94
179.44
155.83
207.22 199.17171.67
231.67
50
100
150
200
250
No Negative Travel
Late
Negative Travel
Early
Negative Travel
No Idle Early Idle Late Idle
vs. 10 hours for test option). Because this trade-offwas identical for all nine options, any differencesin WTP could be attributed to differences in virtualprogress.
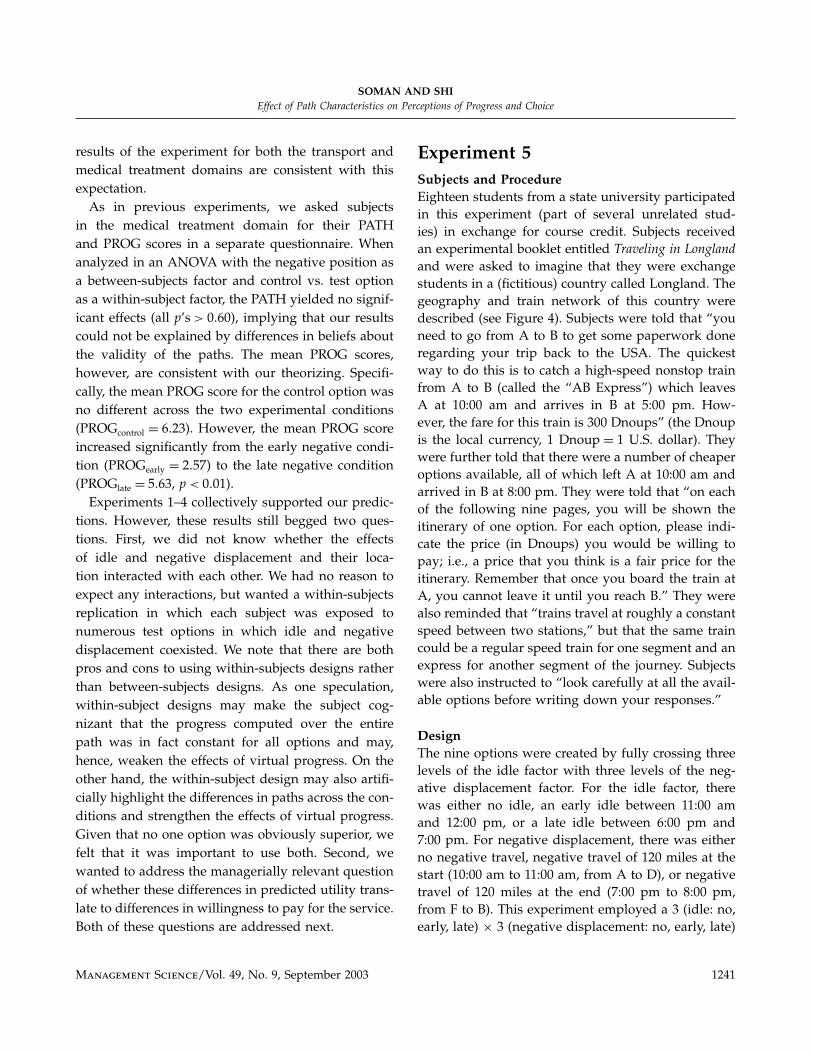
A 3 (idle) × 3 (negative displacement) ANOVAwith WTP as the dependent variable revealed sig-nificant main effects of idle (F2153 = 47�95, p < 0�001)and negative displacement (F2153 = 125�79, p < 0�001),while their interaction did not approach significance(p > 0�85). Mean WTP scores are plotted in Figure 5and are consistent with our predictions. Specifically,we find that WTP is highest when there is no idle(X = 193�43), but significantly lower when there is alate idle (X = 163�89, F1159 = 9�54, p < 0�005), and evenlower when there is early idle (X = 134�81, F1159 =37�58, p < 0�001). Similarly, WTP is highest when thereis no negative travel (X = 200�83), significantly lowerwith a late negative travel (X = 180�83, F1159 = 7�10,p < 0�01), and even lower when there is early negativetravel (X = 110�46, F1159 = 144�97, p < 0�001). Collec-tively, these results support our predictions.
In a separate set of analysis, we used individual-level WTP and PROG data in regression models to testfor the mediating effect of perceived progress on theevaluation (WTP) of each option. Using dummy vari-ables to represent the three levels of idle and negativedisplacement, we ran the following regression models
to establish mediation (Baron and Kenny 1986):
Model 1: WTP = !+�1 (idle)
+�2 (negative displacement)
Model 2: PROG = !+�1 (idle)
+�2 (negative displacement)
Model 3: WTP = !+�1 (idle)
+�2 (negative displacement)
+�2 (PROG)�
In Model 1, coefficients for both idle (�1 = −14�77,p < 0�005) and negative displacement (�2 = −10�00,p < 0�05) were significant. Similarly, in Model 2, bothidle (�1 =−0�50, p < 0�01) and negative displacement(�2 = −0�42, p < 0�05) were significant. However,when PROG was added as a covariate (Model 3),PROG was significant (�3 = 24�15, p < 0�001), whilethe coefficients of the previously significant idle (�1 =−2�69, p = 0�26) and negative displacement (�2 =−0�06, p < 0�96) both reduced in value and were notsignificant. These results strongly suggested that per-ceived progress mediated the relationship betweenpath characteristics and likelihood of choice.
Model EstimationBecause we had individual-level data for WTP, wewere able to fit the proposed model to these data. Wefirst estimate the following conjoint model.
WTP = "0 +"1 ×early_idle+"2 × late_idle
+"3 ×early_ND+"4 × late_ND +# (7)
where "0 is WTP for the service under Condi-tion 1 (see Table 5), and variables early_idle, late_idle,early_ND, and late_ND are dummy variables indicat-ing the presence of the respective obstacle. The modelfits well (R2 = 88�4%), and the estimation results areshown in the first panel of Table 6.
Next, we turn to our proposed theoretical model.This can be represented as
WTP = !+UI +UN +Up − c�T �+# (8)
where UI , UN , and Up are given by Equations (5), (6),and (7), respectively. In the experiment (tI = 1, TI = 1)
Management Science/Vol. 49, No. 9, September 2003 1243
SOMAN AND SHIEffect of Path Characteristics on Perceptions of Progress and Choice
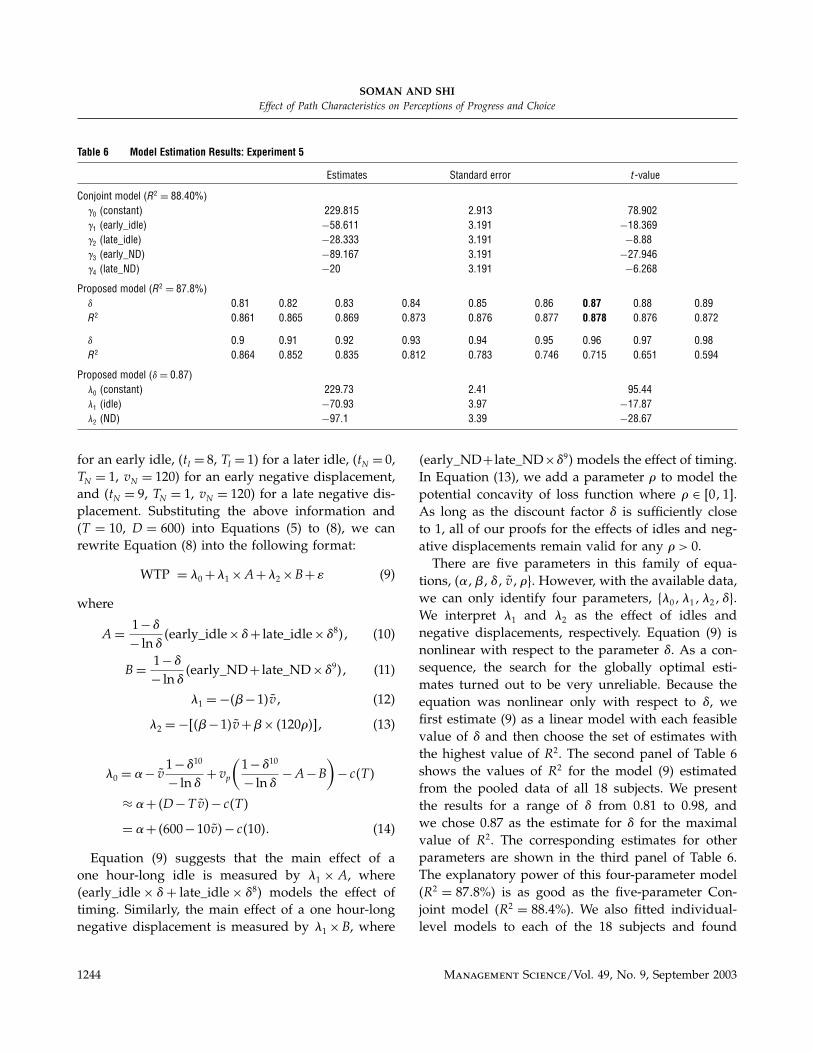
Table 6 Model Estimation Results: Experiment 5
Estimates Standard error t-value
Conjoint model (R2 = 88�40%)�0 (constant) 229�815 2�913 78�902�1 (early_idle) −58�611 3�191 −18�369�2 (late_idle) −28�333 3�191 −8�88�3 (early_ND) −89�167 3�191 −27�946�4 (late_ND) −20 3�191 −6�268
Proposed model (R2 = 87�8%)� 0.81 0�82 0�83 0�84 0�85 0�86 0�87 0�88 0�89R2 0.861 0�865 0�869 0�873 0�876 0�877 0�878 0�876 0�872
� 0.9 0�91 0�92 0�93 0�94 0�95 0�96 0�97 0�98R2 0.864 0�852 0�835 0�812 0�783 0�746 0�715 0�651 0�594
Proposed model (�= 0�87) 0 (constant) 229�73 2�41 95�44 1 (idle) −70�93 3�97 −17�87 2 (ND) −97�1 3�39 −28�67
for an early idle, (tI = 8, TI = 1) for a later idle, (tN = 0,TN = 1, vN = 120) for an early negative displacement,and (tN = 9, TN = 1, vN = 120) for a late negative dis-placement. Substituting the above information and(T = 10, D = 600) into Equations (5) to (8), we canrewrite Equation (8) into the following format:
WTP = $0 +$1 ×A+$2 ×B+# (9)
where
A= 1−�
− ln��early_idle×�+ late_idle×�8� (10)
B = 1−�
− ln��early_ND+ late_ND×�9� (11)
$1 =−��−1�v (12)
$2 =−��−1�v+�× �120'�� (13)
$0 = !− v1−�10
− ln�+vp
(1−�10
− ln�−A−B
)− c�T �
≈ !+ �D−T v�− c�T �
= !+ �600−10v�− c�10�� (14)
Equation (9) suggests that the main effect of aone hour-long idle is measured by $1 ×A, where�early_idle × �+ late_idle × �8� models the effect oftiming. Similarly, the main effect of a one hour-longnegative displacement is measured by $1 ×B, where
�early_ND+ late_ND×�9� models the effect of timing.In Equation (13), we add a parameter ' to model thepotential concavity of loss function where ' ∈ 01�.As long as the discount factor � is sufficiently closeto 1, all of our proofs for the effects of idles and neg-ative displacements remain valid for any ' > 0.
There are five parameters in this family of equa-tions, (!�� v'}. However, with the available data,we can only identify four parameters, {$0$1$2�}.We interpret $1 and $2 as the effect of idles andnegative displacements, respectively. Equation (9) isnonlinear with respect to the parameter �. As a con-sequence, the search for the globally optimal esti-mates turned out to be very unreliable. Because theequation was nonlinear only with respect to �, wefirst estimate (9) as a linear model with each feasiblevalue of � and then choose the set of estimates withthe highest value of R2. The second panel of Table 6shows the values of R2 for the model (9) estimatedfrom the pooled data of all 18 subjects. We presentthe results for a range of � from 0.81 to 0.98, andwe chose 0.87 as the estimate for � for the maximalvalue of R2. The corresponding estimates for otherparameters are shown in the third panel of Table 6.The explanatory power of this four-parameter model(R2 = 87�8%) is as good as the five-parameter Con-joint model (R2 = 88�4%). We also fitted individual-level models to each of the 18 subjects and found
1244 Management Science/Vol. 49, No. 9, September 2003
SOMAN AND SHIEffect of Path Characteristics on Perceptions of Progress and Choice
that the proposed model fits as well as the Conjointmodel based on the R2 value criterion. For all indi-viduals, the estimate for discount parameter rangesfrom 0.8 to 0.91 and the effect of negative displace-ment is consistently stronger than the effect of idle forall individuals.5
Given its theoretical (and therefore nonlinear)nature, and given that the experiment was conductedusing a fully crossed design, we did not expect ourproposed model to outperform the linear conjointmodel. Our goal in estimating the model using theexperimental data was simply to ascertain that theparameters were consistent with our expectations andthat the model performed reasonably well in termsof fit. As the results show, both of these goals wereattained.
Are the Effects of VirtualProgress Real?Collectively, the first five experiments showed that insituations where the elapsed time (and hence actualprogress) is held constant, path characteristics system-atically influence consumer choice and their willing-ness to pay for a service. Further, our proposed modelfit the experimental data well. While the results con-sistently point to the need to pay attention to pathcharacteristics, one criticism of these experiments isthe possibility that by holding elapsed time constant,we artificially increased the salience of path character-istics. This criticism was somewhat valid in some ofthe experiments, but in other cases (Experiments 2, 4,and 5) subjects chose between a control option and atest option that differed both in elapsed time and pathcharacteristics. However, we wanted to establish thatpath characteristics are more than a marginal factorthat operates only when elapsed time is held constant.Experiment 6 was designed with this objective.
Experiment 6Design and ProcedureWe used a 2 (elapsed time) × 2 (virtual progress)between-subjects design. Nonstudent subjects (adults
5 Detailed estimation results can be obtained from the authors.
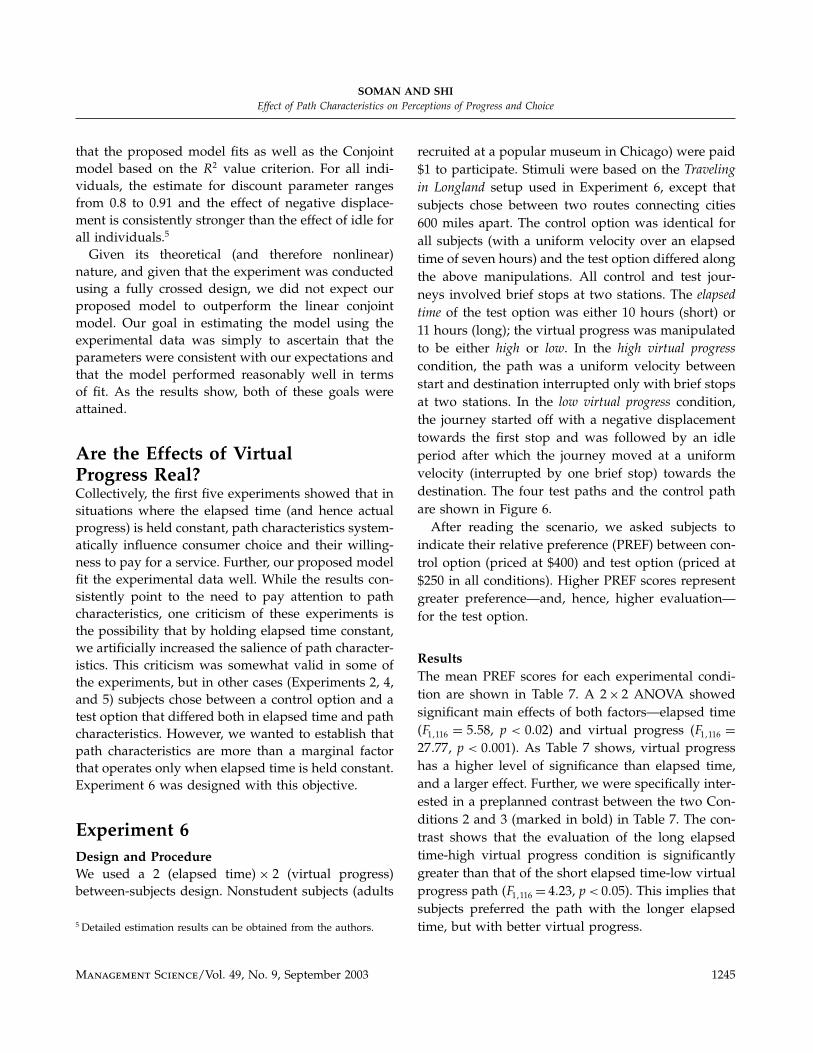
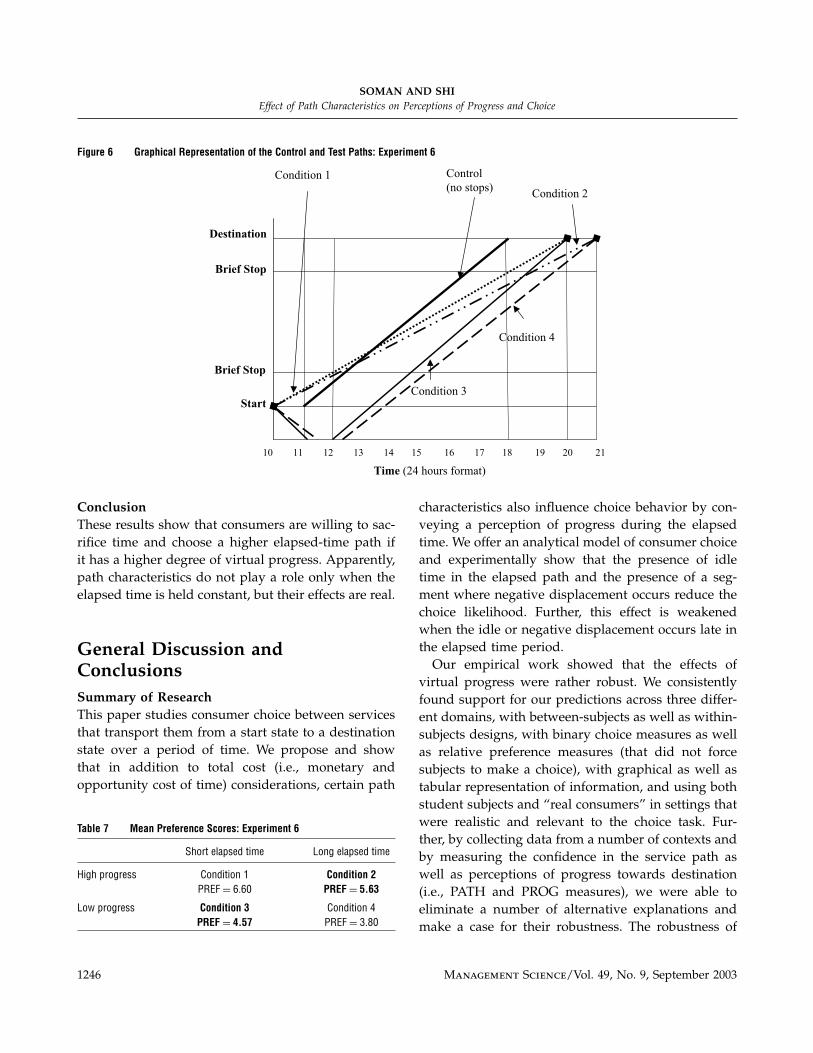
recruited at a popular museum in Chicago) were paid$1 to participate. Stimuli were based on the Travelingin Longland setup used in Experiment 6, except thatsubjects chose between two routes connecting cities600 miles apart. The control option was identical forall subjects (with a uniform velocity over an elapsedtime of seven hours) and the test option differed alongthe above manipulations. All control and test jour-neys involved brief stops at two stations. The elapsedtime of the test option was either 10 hours (short) or11 hours (long); the virtual progress was manipulatedto be either high or low. In the high virtual progresscondition, the path was a uniform velocity betweenstart and destination interrupted only with brief stopsat two stations. In the low virtual progress condition,the journey started off with a negative displacementtowards the first stop and was followed by an idleperiod after which the journey moved at a uniformvelocity (interrupted by one brief stop) towards thedestination. The four test paths and the control pathare shown in Figure 6.
After reading the scenario, we asked subjects toindicate their relative preference (PREF) between con-trol option (priced at $400) and test option (priced at$250 in all conditions). Higher PREF scores representgreater preference—and, hence, higher evaluation—for the test option.
ResultsThe mean PREF scores for each experimental condi-tion are shown in Table 7. A 2× 2 ANOVA showedsignificant main effects of both factors—elapsed time(F1116 = 5�58, p < 0�02) and virtual progress (F1116 =27�77, p < 0�001). As Table 7 shows, virtual progresshas a higher level of significance than elapsed time,and a larger effect. Further, we were specifically inter-ested in a preplanned contrast between the two Con-ditions 2 and 3 (marked in bold) in Table 7. The con-trast shows that the evaluation of the long elapsedtime-high virtual progress condition is significantlygreater than that of the short elapsed time-low virtualprogress path (F1116 = 4�23, p < 0�05). This implies thatsubjects preferred the path with the longer elapsedtime, but with better virtual progress.
Management Science/Vol. 49, No. 9, September 2003 1245
SOMAN AND SHIEffect of Path Characteristics on Perceptions of Progress and Choice
Figure 6 Graphical Representation of the Control and Test Paths: Experiment 6
10 11 12 13 14 15 16 17 18 19 20 21
Destination
Control
(no stops)Condition 1
Condition 2
StartCondition 3
Condition 4
Time (24 hours format)
Brief Stop
Brief Stop
ConclusionThese results show that consumers are willing to sac-rifice time and choose a higher elapsed-time path ifit has a higher degree of virtual progress. Apparently,path characteristics do not play a role only when theelapsed time is held constant, but their effects are real.
General Discussion andConclusionsSummary of ResearchThis paper studies consumer choice between servicesthat transport them from a start state to a destinationstate over a period of time. We propose and showthat in addition to total cost (i.e., monetary andopportunity cost of time) considerations, certain path
Table 7 Mean Preference Scores: Experiment 6
Short elapsed time Long elapsed time
High progress Condition 1 Condition 2PREF= 6.60 PREF= 5.63
Low progress Condition 3 Condition 4PREF= 4.57 PREF= 3.80
characteristics also influence choice behavior by con-veying a perception of progress during the elapsedtime. We offer an analytical model of consumer choiceand experimentally show that the presence of idletime in the elapsed path and the presence of a seg-ment where negative displacement occurs reduce thechoice likelihood. Further, this effect is weakenedwhen the idle or negative displacement occurs late inthe elapsed time period.
Our empirical work showed that the effects ofvirtual progress were rather robust. We consistentlyfound support for our predictions across three differ-ent domains, with between-subjects as well as within-subjects designs, with binary choice measures as wellas relative preference measures (that did not forcesubjects to make a choice), with graphical as well astabular representation of information, and using bothstudent subjects and “real consumers” in settings thatwere realistic and relevant to the choice task. Fur-ther, by collecting data from a number of contexts andby measuring the confidence in the service path aswell as perceptions of progress towards destination(i.e., PATH and PROG measures), we were able toeliminate a number of alternative explanations andmake a case for their robustness. The robustness of
1246 Management Science/Vol. 49, No. 9, September 2003
SOMAN AND SHIEffect of Path Characteristics on Perceptions of Progress and Choice
the phenomenon is a testimony to its theoretical andpractical importance.
We would like to dwell on our PROG measure andexplore what the measure captured. It was our inten-tion that the two dimensions used to estimate PROGwould capture two dimensions of perceived progressfor the path (i.e., the utilization of the elapsed time,and an overall gestalt measure of progress). Givenmethodological constraints, however, it is possiblethat PROG was representing some kind of an over-all attractiveness measure. While we minimized thepossibility that PROG was simply correlated to choicedue to “self generated validity,” we would have liked,ideally, to develop and validate a scale for measuringperceived progress. Unfortunately, this was beyondthe scope of our present research.
Theoretical and Managerial ImplicationsResearch in the area of organizational behavior andsocial psychology has studied the importance of goalsin achieving success and in subjective well-being (cf.Brunstein 1993, Sheldon and Kasser 1995). However,surprisingly little research (and, to our knowledge,none in marketing) has been done on people’s predic-tions about their experiences as they work to achievea goal. To our knowledge, the present research is thefirst to identify perceived progress as a predictor ofutility and choice.
Our results in the domain of goal-oriented servicesmay have implications for the well-being of individ-uals who are working to achieve a goal. We pre-dict that people will like to receive feedback fromthe environment telling them that they are makingprogress towards their goal. In the absence of know-ing about their progress, people might experiencefrustration and, hence, be poorly motivated to workfurther towards their goal.
Note that our research draws a distinction betweena mathematically computed progress for the entirepath and virtual progress—an aggregate of moment-by-moment values based on perceived progress atthat moment. At a conceptual level, this distinctionbetween a global evaluation and an aggregate of sev-eral local evaluations is similar in spirit to other con-sumer behavior phenomena. One striking similarity iswith the research on mental accounting (Thaler 1999),
which shows that by artificially partitioning theirincomes into separate accounts, consumers attend to“virtual” considerations (like budgeting) resulting ina suboptimal allocation of incomes. These parallelssuggest a more pervasive tendency to attend to localoptimization at the expense of a globally satisfyingsolution, perhaps because the local optimum is psy-chologically more satisfying.
While these results are interesting from a purelytheoretical standpoint, they have important man-agerial implications for the design and marketingof services. Results from the experiments suggestthat it is important for service providers to ensurethat consumers feel that they are moving towardstheir final destination. Specifically, service providersshould attempt to start services as soon as possible,avoid negative displacement, minimize idle times,and attempt to “fill” the idle times with perceptionsof progress. It is also important to create perceptionsof progress in other settings, i.e., for consumers wait-ing in queues. Our results suggest that a queue dis-cipline in which consumers can actively see the rateof progress (e.g., a queue which physically moves asconsumers are serviced) will result in better serviceevaluations as compared to another in which the rateof progress is not transparent.6 In short, while theprice and elapsed time of a service influence choicebehavior, it is important to create a perception of“being on the move” to increase consumer evaluationand choice.
Limitations and Future ResearchThe present research was not without limitations. Weprovided an analytical account and experimental sup-port of consumer choice behavior and showed thata perception of progress mediates the effect of pathcharacteristics on choice. However, an investigation ofthe psychological antecedents of this perception wasbeyond the scope of the present paper. Based on priorresearch, the underlying process may be purely affec-tive, with consumers experiencing annoyance and
6 One of Murphy’s laws is “the other line (queue) always movefaster.” People probably choose the queue in which consumersseem to be making more progress, only to find out that this per-ceived progress was virtual and that other queues were just asgood, or perhaps even better.
Management Science/Vol. 49, No. 9, September 2003 1247
SOMAN AND SHIEffect of Path Characteristics on Perceptions of Progress and Choice
frustration during idle times or periods of negativedisplacement (Larson 1987). Alternately, the underly-ing process may be perceptual, with the presence ofidle time and negative displacement increasing theperceived elapsed time (Osuna 1985). Future researchcould investigate such psychological antecedents inmore detail.
Second, we note that the present research is anaccount of consumer choice made prior to enteringthe service situation, and we argue that this choiceis based on the predicted utility as assessed at thetime of making the choice. Prior research in the areaof sequences and experiences over time has tended tostudy retrospective effects. Some of our results seeminconsistent with this prior research at first blush. Forinstance, Carmon and Kahneman (1996) report thatretrospective evaluation is significantly lowered whenidle occurs towards the end of a service, while ourmodel and results show that late idle is not as damag-ing as early idle. One question of interest, therefore,is whether the predicted utility actually captures howconsumers feel during the course of the service, andat its conclusion. We demonstrate elsewhere (Soman2003) that obstacles (like idle and negative displace-ment) also affect the retrospective evaluation in thesame manner as they affect choice. However, whilelate obstacles are better than early obstacles for antic-ipated value and choice likelihood (as we showedhere), late obstacles reduce retrospective evaluationssignificantly more than early obstacles (Carmon andKahneman 1996, Soman 2003). These results seem tosuggest that due to low predicted utility, consumersmay not choose services that they would have retro-spectively evaluated highly.
Third, we manipulated the perception of progressby holding the goal constant (reaching the destina-tion state without concern for intermediate states)but changing the path characteristics. An alternativeapproach would be to not only manipulate path char-acteristics, but also the goal. For example, suppose theconsumer’s goal was not only to reach the final des-tination but also to get some work done on the train.We speculate that path characteristics would have lessof an effect on choice behavior in this situation. Whilethis approach was beyond the scope of our present
investigation, it provides a fruitful avenue for futureresearch to explore.
Fourth, we did not study learning effects, specifi-cally whether the effects of virtual progress weakenwith expertise and experience. While we do not haveanswers to these questions and leave the issue forfuture research, we would like to offer some specu-lations. First, it is likely that extremely frequent usersof goal-oriented services quickly realize the “nonop-timality” of using virtual progress in their deci-sion making and, hence, quickly converge towardsan elapsed-time-only model. Examples of such con-sumers are daily users of the subway trains in largecities like Hong Kong, where a number of possiblepaths are available to travel between certain centrallocations. However, consumers in infrequent com-muting situations (e.g., flights) might still be suscep-tible to the effects of virtual progress. Second, expertconsumers are likely to use a decision-making strat-egy in which they anticipate how they would feel atthe conclusion of the service (Shiv and Huber 2000).As we discussed earlier, this concluding evaluationwill be influenced more by late obstacles than earlyones. Hence, to the extent that consumers weight theiranticipated satisfaction in making choice decisions,we expect that the effects of time discounting in ourmodel will be weakened. However, we would stillexpect a preference for paths without idle or negativedisplacement.
Fifth, while we conducted our experiments in threeseparate domains, we acknowledge that the medi-cal treatments domain might not have offered a veryclean test of the effects of virtual progress, and thatalternative explanations might have contributed tothe results in the domain. For example, it is con-ceivable that even when subjects were told that ablood sugar level of 224 was acceptable, a risk-averseindividual would choose to avoid being so “close tothe boundary.” Additionally, some medical treatmentsituations might also represent situations in whichintermediate progress might provide some diagnos-tic information to both the consumer and physician,and hence is not purely virtual (cf. Orlando 1998).Our objective was not to claim that these factorsplay no role and that virtual progress is the onlydeterminant of the results. Instead, by using the best
1248 Management Science/Vol. 49, No. 9, September 2003
SOMAN AND SHIEffect of Path Characteristics on Perceptions of Progress and Choice
levels of control we could exercise in the medicaltreatment domain in conjunction with the results fromother domains, we simply wanted to demonstrate thebreadth of the virtual progress effect. Healthcare is anarea where we speculate that intermediate progressis important for several reasons, and it presents anintriguing avenue for future research to explore.
Finally, one interesting extension of this researchrelates to the study of how consumers structure tasksthat have a fixed total quantity but are comprisedof a number of parts of varying sizes. Our theoreti-cal development suggests that consumers may like tostructure the task in such a manner as to achieve earlyperception of progress. Consequently, they may preferto get a larger number of easier tasks done early andleave the longer ones for the end. Other routine deci-sions and evaluations like decisions to take a break,renege from a task, speed up performance, or refreshand restart the effort are all related to perceptionsof progress and represent fruitful avenues for futureresearch.
AcknowledgmentsThe research reported in this paper was conducted when bothauthors were at the Hong Kong University of Science andTechnology, and the support of that university is acknowledged.The authors thank Julien Cayla, Amar Cheema, Kareen Kinzli, andVivian M. W. Lam for excellent research assistance. They also thankDan Ariely, George Loewenstein, Teesta Soman, seminar partici-pants at Duke, Harvard, Stanford, and Syracuse Universities, andat the National University of Singapore, the editors, the associateeditor, and three anonymous reviewers for comments on previousdrafts of this paper.
ReferencesAllen, Bruce. 1997. The logistics revolution and transportation. Ann.
Amer. Acad. Political Soc. Sci. 553 106–116.Ariely, Dan. 1998. Combining experiences over time: The effects
of duration, intensity changes and on-line measurements onretrospective pain evaluations. J. Behavioral Decision Making11 19–45., Ziv Carmon. 2000. Gestalt characteristics of experiences: Thedefining features of summarized events. J. Behavioral DecisionMaking 13(2) 191–201.
Baron, Reuben, David Kenny. 1986. The moderator-mediator vari-able distinction in social psychological research: Conceptual,strategic, and statistical considerations. J. Personality Soc. Psych.51(6) 1173–1182.
Becker, Gary S. 1965. A theory of the allocation of time. Econom. J.75 493–517.
Brunstein, Joachim. 1993. Personal goals and subjective well-being:A longitudinal study. J. Personality Soc. Psych. 65(5) 1061–1070.
Cantor, N., J. Kihlstrom. 1987. Personality and Social Intelligence.Prentice Hall, Englewood Cliffs, NJ.
Carmon, Ziv, Daniel Kahneman. 1996. The experienced utilityof queuing: Experience profiles and retrospective evaluationsof simulated queues. Working paper, Fuqua School, DukeUniversity, Durham, NC., J. George Shanthikumar, Tali Carmon. 1995. A psycholog-ical perspective on service segmentation: The significance ofaccounting for consumers’ perceptions of waiting and service.Management Sci. 41(11) 1806–1815.
Deci, E. L., R. M. Ryan. 1985. Intrinsic Motivation and Self-Determination in Human Behavior. Plenum, New York.
Elster, Jon, George Loewenstein. 1992. Utility from memory andanticipation. G. Loewenstein, J. Elster, eds. Choice Over Time.Russell Sage Foundation, New York, 213–234.
Feldman, Jack, John G. Lynch. 1988. Self-generated validity andother effects of measurement on belief, attitude, intention andbehavior. J. Appl. Psych. 73(3) 421–435.
Flint, Perry. 1998. Hub complex. Air Transport World (October)28–34.
Fredrickson, Barbara L., Daniel Kahneman. 1993. Duration neglectin retrospective evaluations of affective episodes. J. PersonalitySoc. Psych. 65 45–55.
Hsee, Christopher, Robert Abelson. 1991. Velocity relation: Satisfac-tion as a function of the first derivative of outcome over time.J. Personality Soc. Psych. 60(3) 341–347.
Kahneman, Daniel, Amos Tversky. 1979. Prospect theory: An anal-ysis of decision under risk. Econometrica 47 263–291., B. L. Fredrickson, C. A. Schreiber, D. A. Redelmeier. 1993.When more pain is preferred to less: Adding a better end.Psych. Sci. 4 401–405.
Larson, R. 1987. Perspectives on queues: Social justice and the psy-chology of queuing. Oper. Res. 35(6) 895–905.
Liberman, Nira, Yaacov Trope. 1998. The role of feasibility anddesirability considerations in near and distant future decisions:A test of temporal construal theory. J. Personality Soc. Psych.75 5–18.
Locke, Edwin A., Gary Latham. 1990. A Theory of Goal Setting &Task Performance. Prentice Hall, Englewood Cliffs, NJ.
Loewenstein, George. 1996. Out of control: Visceral influenceson behavior. Organ. Behavior Human Decision Processes 65(3)272–292., Drazen Prelec. 1992. Anomalies in intertemporal choice:Evidence and an interpretation. G. Loewenstein, J. Elster, eds.Choice Over Time. Russell Sage Foundation, New York, 119–146., . 1993. Preferences for sequences of outcomes. Psych. Rev.100 91–108.
Orlando, Melinda. 1998. Outcomes: Essential information for clini-cal decision support. J. Health Care Finance 24(3) 71–81.
Osuna, Edgar. 1985. The psychological cost of waiting. J. Math.Psych. 29 82–105.
Management Science/Vol. 49, No. 9, September 2003 1249
SOMAN AND SHIEffect of Path Characteristics on Perceptions of Progress and Choice
Rachlin, Howard, Andres Raineri. 1992. Irrationality, impulsive-ness and selfishness as discount reversal effects. G. Loewen-stein, J. Elster, eds. Choice Over Time. Russell Sage Foundation,New York, 93–118.
Sawrey, James, Charles Telford. 1971. Psychology of Adjustment.Allyn and Bacon Inc., Boston, MA.
Sheldon, K. M., T. Kasser. 1995. Coherence and congruence: Twoaspects of personality integration. J. Personality Soc. Psych.68 531–543., . 1998. Pursuing personal goals: Skills enable progress,but not all progress is beneficial. Personality Soc. Psych. Bull.24 1319–1331.
Shiv, Baba, Joel Huber. 2000. The impact of anticipating satisfactionon consumer choice. J. Consumer Res. 27(2) 202–216.
Soman, Dilip. 1998. The illusion of delayed incentives: Evalu-
ating future money-effort transactions. J. Marketing Res. 34427–437.. 2001. The mental accounting of sunk time costs: Why time isnot like money. J. Behavioral Decision Making 14(3) 169–185.. 2002. The effect of time delay on multiattribute choice. J.Econom. Psych. Forthcoming.. 2003. Prospective and retrospective evaluations of experi-ences: How you evaluate an experience depends on when youevaluate it. J. Behavioral Decision Making 16(1) 35–52.
Taylor, Shirley. 1994. Waiting for service: The relationship betweendelays and evaluations of service. J. Marketing 58(April) 56–69.
Thaler, Richard H. 1999. Mental accounting matters. J. BehavioralDecision Making 12(3) 183–206.
Tversky, Amos, Daniel Kahneman. 1991. Loss aversion in risklesschoice: A reference-dependent model. Quart. J. Econom. 106(4)1039–1061.
Accepted by Jagmohan S. Raju; received August 11, 2002. This paper was with the authors for 1 revision.
1250 Management Science/Vol. 49, No. 9, September 2003