Proceedings of the Workshop on Research
92
United States Department of Proceedings of the Workshop on Research Agriculture Forest Service Methodologies and Applications for Pacific Pacific Southwest Island Agroforestry Research Station General Technical Report PSW-GTR-140 July 16-20,1990, Kolonia, Pohnpei, Federated States of Micronesia
-
Upload
khangminh22 -
Category
Documents
-
view
0 -
download
0
Transcript of Proceedings of the Workshop on Research

United States Department of Proceedings of the Workshop on Research Agriculture
Forest Service Methodologies and Applications for Pacific Pacific Southwest Island AgroforestryResearch Station
General Technical Report PSW-GTR-140 July 16-20,1990, Kolonia, Pohnpei, Federated States of Micronesia

Raynor. Bill; Bay, Roger R. technical coordinators. 1993. Proceedings of the workshop on research methodologies and applications for Pacific Island agroforestry; July 16-20, 1990; Kolonia, Pohnpei, Federated States of Micronesia. Gen. Tech. Rep. PSW-GTR-140. Albany, CA: Pacific Southwest Research Station, Forest Service, U.S. Department of Agriculture; 86 p.
Includes 19 papers presented at the workshop, covering such topics as sampling techniques and statistical considerations, indigenous agricultural and agroforestry systems, crop testing and evaluation, and agroforestry practices in the Pacific Islands, including Micronesia, Northern Marianas Islands, Palau, and American Samoa.
Retrieval Terms: Agricultural systems, cropping experiments, American Samoa, Micronesia, Northern Marianas, Pohnpei Island, Yap
Technical Coordinators:
Bill Raynor is a researcher in the Land Grant Programs, College of Micronesia, Kolonia, Pohnpei, Federated States of Micronesia. Roger R. Bay, formerly Director, Pacific Southwest Research Station, Forest Service, U.S. Department of Agriculture, Berkeley, Calif., is a consultant to the College of Tropical Agriculture and Human Resources, University of Hawaii, Honolulu, Hawaii.
Cover. Yapese elder climbing a coconut tree. Photograph by Leonard A. Newell.
Publisher:
Pacific Southwest Research Station Albany, California (Mailing address: P.O. Box 245, Berkeley, CA 94701-0245 Telephone: 510-559-6300)
February 1993

Proceedings of the Workshop on Research Methodologies and Applications for Pacific Island Agroforestry July 16-20, 1990, Kolonia, Pohnpei, Federated States of Micronesia
Bill Raynor and Roger R. Bay, Technical Coordinators
Contents
Preface ...................................................................................................................................................................iiNeeds and Priorities in Agroforestry Research in the Pacific
Roger R. Bay ...................................................................................................................................................1Analysis of an Agroforest: The Variable Radius Quadrat Method
Harley I. Manner .............................................................................................................................................3Permanent Field Plot Methodology and Equipment
Thomas G. Cole ..............................................................................................................................................7Statistical Considerations for Agroforestry Studies
James A. Baldwin .......................................................................................................................................... 16Socio-Cultural Studies of Indigenous Agricultural Systems: The Case for Applied Research
Randall L Workman ..................................................................................................................................... 21Economics and Agroforestry
John W. Brown .............................................................................................................................................. 26Future Networking and Cooperation Summary of Discussion
Roger R. Bay ................................................................................................................................................. 31A Review of Traditional Agroforestry in Micronesia
Harley I. Manner ...........................................................................................................................................32Micronesian Agroforestry: Evidence from the Past, Implications for the Future
Marjorie V. C. Falanruw................................................................................................................................ 37An Indigenous Pacific Island Agroforestry System: Pohnpei Island
Bill Raynor and James Fownes .....................................................................................................................42Yapese Land Classification and Use in Relation to Agroforests
Pius Liyagel ..................................................................................................................................................59Design and Analysis of Mixed Cropping Experiments for Indigenous Pacific Island Agroforestry
Mareko P. Tofinga .......................................................................................................................................60General Considerations in Testing and Evaluating Crop Varieties for Agroforestry Systems
Lolita N. Ragus .............................................................................................................................................65Documentation of Indigenous Pacific Agroforestry Systems: A Review of Methodologies
Bill Raynor.....................................................................................................................................................69Knowledge Systems in Agroforestry
Wieland Kunzel .............................................................................................................................................75Potentials of Integrating Spice Crops with Forestry in the Pacific Islands
John K. Gnanaratnam ................................................................................................................................. 78Agroforestry Programs and Issues in the Northern Marianas Islands
Anthony Paul Tudela ..................................................................................................................................... 80Agroforestry in Palau
Ebais Sadang ................................................................................................................................................. 82Indigenous Agroforestry in American Samoa
Malala (Mike) Misa and Agnes M. Vargo ...................................................................................................... 83

Preface The increasing popularity of agroforestry as a land-use
option in developing areas of the tropics has not gone unnoticed in the Pacific islands. So far, most of the agroforestry practices and technologies being introduced into the Pacific islands region are based on systems developed in Africa and Asia; for example, alley-cropping. Although these systems can be useful and have their applications in the region, we must also recognize the local indigenous agroforestry systems―systems developed over thou-sands of years of island experience.
Agroforestry is a dominant form of agriculture on many islands, and systems vary widely from island to island, owing to differences in climate, topography, and culture. The scant re-search done in the recent past strongly indicates that these systems can offer the scientific community valuable insights into the development of sustainable agro-ecosystems, and, in many cases, can serve as foundations for future agricultural development. Indigenous agroforestry systems should be studied for several basic reasons:
• The science underlying these systems is still not fully understood, but could prove valuable in the development of improved sustainable food production systems;
• “Local technology transfer” from one island or region to another would be encouraged;
• New discoveries of species, cultivars, and uses of plants could be important to world agriculture, medicine, and other areas;
• Pride would be instilled in indigenous knowledge and practices and could encourage local innovation;
• Interaction between researchers and practitioners/farmers would be increased by putting the researcher out “in the field” to develop a better understanding of the practitioners’ problems!
Time, however, is not on the researcher's side. Signs of disintegration of indigenous systems are everywhere―a decline in nutritional status among islanders, increased soil erosion and deforestation, and environmental pollution. Modem farming methods of monocropping and heavy use of pesticide and inorganic fertilizers are being adopted and held in high esteem on most islands. Conversely, local knowledge is often seen as useless and backward, and is not being passed on to younger generations.
Unfortunately, research is also hindered by a lack of available methodologies for the study of indigenous agroforestry. Existing research methods are varied and not well developed. What little quantitative research has been done has to a large part been carried out in research stations, an “artificial” environment where it is extremely difficult to simulate the complexity and diversity of indigenous systems. Furthermore, researchers, policymakers, and practitioners disagree about research priorities.
One result was the organization of this workshop by the newly formed Agroforestry Task Force of the USDA-funded Agricultural Development in the American Pacific Project (ADAP), with the assistance of the Institute of Pacific Islands Forestry of the Pacific Southwest Research Station; College of Micronesia Land Grant Programs; and Pohnpei State Department of Conservation and Resource Surveillance. The workshop objectives were to:
• Review concepts and evaluate current research on indigenous agricultural systems in the Pacific
• Identify key research areas and priorities • Develop standardized research methodologies for
agroforestry research in the Pacific • Establish a regional network for cooperative research. The island of Pohnpei was selected as the workshop site
because indigenous agroforestry is the dominant agricultural land-use on the island (33 percent of the total land area), and the system has been relatively well-studied. Thirty-seven scientists and local resource management agency representatives attended from Pohnpei, Kosrae, and Yap in the Federated States of Micronesia; Republic of the Marshall Islands; Republic of Palau; Commonwealth of the Northern Marianas; Guam; Hawaii; Fiji; Western Samoa; American Samoa; Honolulu, Hawaii; and the continental United States.
To say that the workshop, held July 26-30, 1990, in Kolonia, Pohnpei, accomplished all the objectives would be an exaggeration. Many more questions and issues were brought up than were solved. On the other hand, this conference represented the first time that researchers, policy makers, and extension personnel in the American-affiliated Pacific have met together to discuss indigenous agroforestry and its relevance to current and future agricultural research and development. People met each other, and future working relationships were forged. Pacific island participants gained a better understanding of the researchers’ perspective, and researchers were able to get direct feedback on their activities from local policy-makers and extension specialists. The new bonds were formalized in the formation of the Pacific Agroforestry Network (PAN). As a result of this work-shop, a new impetus has been given to research in indigenous agroforestry in the region. These proceedings provide a record of this important event as well as a collection of useful information for people working in agroforestry research and extension in the Pacific and in other regions.
Bill RaynorLand Grant Programs, College of Micronesia Kolonia, Pohnpei, Federated States of Micronesia Technical Coordinator
ii USDA Forest Service Gen. Tech. Rep. PSW-GTR-140. 1993.

Needs and Priorities in Agroforestry Research in the Pacific1
Roger R. Bay2
Abstract: This paper summarizes a longer presentation of research needs identified by two working groups commissioned by the Land Grant Colleges of the Pacific. Major discussion points by the workshop participants are also summarized.
ADAP (Agricultural Development in the American Pacific) is a regional project initiated in mid-1987 by the Directors of Land-Grant Colleges in the American Pacific―American Samoa Community College, University of Guam, University of Hawaii, College of Micronesia, and Northern Marianas College. The effort is supported by special funding from the U.S. Congress through the U.S. Department of Agriculture. Although initially designed to develop agriculture in the American Pacific, including faculty, staff and institutions, the Directors also ex-pressed interest in forestry and its relationship to agriculture on the islands.
Forests, including natural stands, plantations, and traditional agroforests, are important resources on the islands. The percent of land containing some type of tree cover, including agroforests, varies from a low of 66 percent on Yap to a high of 92 percent on American Samoa. Traditionally, subsistence agriculture has been closely associated with individual trees, forest products, and the larger natural stands of forests covering upland watersheds and the coastal mangroves. As agriculture develops, the needs and opportunities to manage and protect these forest lands also must be considered in the total island complex.
The ADAP Forestry Advisory Committee In 1989, the Directors established an ad hoc Forestry Advi
sory Committee to consider tropical forestry needs in research, extension, and education, and to recommend actions appropriate for the Land-Grant Colleges. The committee consisted of representatives from the five land-grant colleges of the American Pacific, several federal and state agencies, and the East-West Center. All had experience living or working in the Pacific Islands. The committee had for its deliberations agency back-ground reports, notes, and direct comments from forestry and natural resources specialists on the many islands.
The committee developed a list of 24 major forestry re-search, education, and extension needs for the American Pacific Islands.3 These were divided into three main priority groups. The five highest priority needs were:
1 An abbreviated version of this paper was presented at the Workshop on Research Methodologies and Applications for Pacific Island Agroforestry, July 16-20, 1990, Kolonia, Pohnpei, Federated States of Micronesia.
2 Consultant to University of Hawaii, College of Tropical Agriculture and Human Resources, Honolulu, Hawaii.
3 Bay, Roger R. Tropical forestry research, education, and extension needs in the American Pacific. Report submitted to the American Pacific Land Grant Directors, July 1989. Available from the College of Tropical Agriculture and Human Resources, University of Hawaii, 96822.
1. Professional and technical education 2. Agroforestry research and extension 3. Environmental education 4. Watershed management research and extension 5. Staff development and training These five were then considered in additional detail, with
additional suggestions on program studies and possible sources of support.
In addition to the listing of needs and priorities, the commit-tee specifically recommended that the Directors establish a formal agroforestry task force within the ADAP program structure to follow-up on and further develop recommendations in their report.
The ADAP Agroforestry Task Force Acting on the recommendations, the Land-Grant Directors
approved and established an agroforestry task force as one of the six task forces operating in ADAP. The task force is made up of a Land-Grant faculty or staff person from each college and a counterpart representing a nearby forestry or agriculture agency. The USDA Forest Service and the East-West Center also participate. The purpose of this larger representation of local and regional agency people was to encourage cooperative efforts at the local and regional levels as well as to add important expertise to the group.
The first task force meeting, held in November 1989, developed a number of pre-proposals for high priority projects in agroforestry education-extension-training, and research for the Pacific region. Those of highest priority in research were to:
1. Conduct a workshop to evaluate and further develop agroforestry research methodologies with local scientists
2. Document indigenous Pacific Agroforestry systems In total, the task force reviewed and ranked a dozen propos
als in agroforestry.
Research Proposals
• Agroforestry research methods workshop • Document indigenous agroforestry systems in the Pacific • Evaluate agroforestry site characteristics and develop rec
ommendations for establishment of future agroforests. • A study to maximize yields from alley cropping • Develop methods to reclaim badlands • Collection, evaluation, and maintenance of germplasm • Study multipurpose tree species response to fertilization
on poor, acid soils
USDA Forest Service Gen. Tech. Rep. PSW-GTR-140. 1993. 1

Education and Extension
• Train college staff in agroforestry principles • Train extension agents to improve basic skills from com
munications to agroforestry practices • Improve overall knowledge and operations of current
agroforestry organization and practices • Extend environmental education to decision-makers and
landowners • Develop environmental education programs for K- 12 stu
dents and teachers This workshop in Pohnpei is the direct result of their highest
priority recommendation, supported by funding from the ADAP Land-Grant Directors. The task force intends to encourage proposals from the staff at the Pacific Land Grant Colleges to address additional priority needs.
Workshop Discussion on Agroforestry Research
The following paragraphs are summaries of comments and discussions by workshop participants made during a general discussion period:
• Needs in conservation education for grades K through 12 should involve the Departments of Education of the various island governments. Training of teachers in the use of various modules is needed. Materials relating to forestry and conservation also should be translated into local languages. Some international organizations may have funds for case studies, posters, etc.
• There is a need to re-orient agencies and others to place agroforestry higher on the priority list for all islands. Institutional priorities should be redirected, and we should be fostering a mental-social change in how people view agroforestry.
• Local farmers should be brought into the priority-setting process. They know their system and local conditions. Their traditional knowledge needs to be coordinated with the structured knowledge of scientists. Other local people from forestry and agriculture agencies should identify their needs.
• More funding and more people are needed on most islands to address local problems in agroforestry. Current limited staffs are sometimes consumed by many meetings and frequent visitors. Effort must be made to allocate limited funds to lower levels for direct project work.
• There is a problem obtaining input from local agencies and people on their needs or priorities.
• Each state should appropriate some funds so colleges can match with cooperative funds of their own to meet local needs in that state. Some legislators believe earlier research has not been summarized and is not available.
• Task force members should be responsible for documenting trees and other plants on their islands before varieties and even species are lost. Medicinal plants are also important to document.
• Some believe there is a desire for diversity by local farmers in agroforestry - new plants for new foods on the islands. An Agroforestry Development Center in Micronesia should be considered.
• Agroforestry responsibility falls between agriculture and forestry agencies. Some agency needs to be responsible. Counterparts between agencies are needed.
• Who will be able to do the needed research? Commitments from agencies and local people to help scientists with projects are needed.
• Adaptation of indigenous systems in agroforestry is very important. We do not necessarily have to search for or develop completely new systems.
2 USDA Forest Service Gen. Tech. Rep. PSW-GTR-140. 1993.

Analysis of an Agroforest: The Variable Radius Quadrat Method1
Harley I. Manner2
Abstract: Procedures and methods used to determine the structure of an agroforest are presented. Simple statistical procedures to present the data in a meaningful form are also discussed.
Agroforests are an important vegetation type in Micronesia and the Pacific Basin. Given the many different physical and cultural environments in which agroforestry is practiced, agroforests differ greatly in their composition, productivity, and interaction between species. Even on the same island, no two agroforests are alike. Unlike a tomato or taro field, the agroforest is extremely complex. Many students of agroforestry ask the basic question “How do we analyze an agroforest so that we can get meaningful and comparatively useful results?” Or, “Is there a method that we can use to get some idea as to what is in an agroforest?” Closely related to that question, is “How productive is an agroforest and how do we measure the productivity of the components of the agroforest?” In order to answer the latter question, however, we need to determine the structure (composition, number of species, number of trees, ages of trees, etc.) of the agroforest.
Some Initial Considerations Because agroforests are composed of many different spe
cies which vary in age, height, DBH and other characteristics, and are found in different physical and cultural environments, no two agroforests are exactly alike. Thus it is important to use standardized methods and procedures such that comparisons can be made between the agroforests on different islands and areas. However, before a standard method of analysis can be applied, three initial considerations need to be made:
1. The site (quadrat area) selected for study must be representative of the agroforest under study. In other words, the site chosen must be as similar as possible to the surrounding agroforest. For example, if in a particular agroforest, taro is a commonly found species in the undergrowth, but your quadrat area does not have any taro, then your study site is not representative. It may be best to select another study site within the agroforest, especially if you don't have time to analyze a large number of quadrats.
This assessment of representativeness is usually made visually, but is based on a fairly good working knowledge of the range of agroforestry types. In turn, knowledge of the range of agroforestry types can be gained through a reconnaissance of the
1 An abbreviated version of this paper was presented at the Workshop on Research Methodologies and Applications for Pacific Island Agroforestry, July 16-20, 1990, Kolonia, Pohnpei, Federated States of Micronesia.
2 Geographer, College of Arts and Science, University of Guam, Mangilao, Guam 96923.
island, field interviews, or informal discussions with landowners, to name a few. When analyzing an agroforest for its components, an agroforester will constantly ask whether the site under analysis is representative, and, if not, should a more appropriate site to study be found.
2. The site must be large enough to contain the range of species found in the agroforest. If the agroforest at the site is too small, it may not be a representative site. It may also contain species commonly found in other ecosystems. For example, the composition of an agroforest near a pathway or roadside will contain somewhat different species than the center of an agroforest. By selecting a large enough site, such effects are minimized and the likelihood of getting good data are greatly increased.
3. The agroforest and the quadrat in particular should be homogenous in terms of the distribution of its components. However, within every agroforest, there are bound to be differences in the pattern of vegetation. As the investigator, you need to decide whether the differences represent a situation on non-homogeneity. If such patterns are common enough, they need to also be analyzed. For example, in the Mwoakillese agroforests at Sokehs, Pohnpei, there are patches of Cyrtosperma chamissionis. Such patches should be described separately as a subunit of that agroforest.
Other factors that need to be considered include sampling design (whether random, stratified, or other), availability of time and money for analysis, the number of agroforestry types, and the purposes of your study, to name a few. These topics are beyond the scope of this paper, but there are many references available.
The Variable Radius Quadrat The variable radius quadrat is a relatively easy method to
use in agroforests. Unlike fixed area quadrats or sampling plots, the variable radius quadrat depends on the number of trees (or other plants) to determine the size of sampling area. This method is called the variable area quadrat method because the area of trees (of a particular number) will vary from place to place. An important characteristic of the agroforest is the density of trees, which can be determined by using this method. The procedures for using this method and the accompanying Form 1 are presented below:
1. Fill in the preliminary information found at the top of Form 1. Other information of your choosing can be added to the sheet.
2. Locate a point (randomly or systematically) in the agroforest.
3. Mentally locate or physically mark the 10 (or 20) closest trees/shrubs that have a d.b.h. (diameter at breast height or 1.3 m above the ground), starting at the center and moving outward. It is better to use 20 trees than 10 trees, particularly if you have
USDA Forest Service Gen. Tech. Rep. PSW-GTR-140. 1993. 3
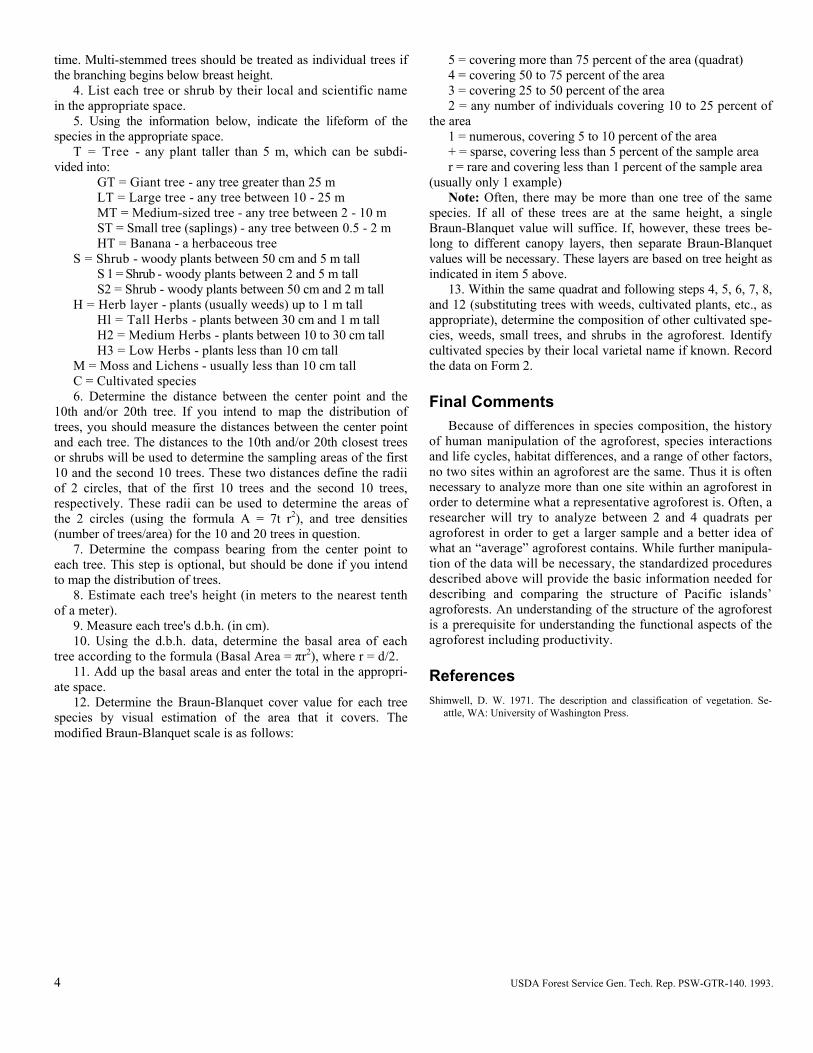
time. Multi-stemmed trees should be treated as individual trees if the branching begins below breast height.
4. List each tree or shrub by their local and scientific name in the appropriate space.
5. Using the information below, indicate the lifeform of the species in the appropriate space.
T = Tree - any plant taller than 5 m, which can be subdivided into:
GT = Giant tree - any tree greater than 25 m LT = Large tree - any tree between 10 - 25 m MT = Medium-sized tree - any tree between 2 - 10 m ST = Small tree (saplings) - any tree between 0.5 - 2 m HT = Banana - a herbaceous tree
S = Shrub - woody plants between 50 cm and 5 m tall S 1 = Shrub - woody plants between 2 and 5 m tall S2 = Shrub - woody plants between 50 cm and 2 m tall
H = Herb layer - plants (usually weeds) up to 1 m tall Hl = Tall Herbs - plants between 30 cm and 1 m tall H2 = Medium Herbs - plants between 10 to 30 cm tall H3 = Low Herbs - plants less than 10 cm tall
M = Moss and Lichens - usually less than 10 cm tall C = Cultivated species 6. Determine the distance between the center point and the
10th and/or 20th tree. If you intend to map the distribution of trees, you should measure the distances between the center point and each tree. The distances to the 10th and/or 20th closest trees or shrubs will be used to determine the sampling areas of the first 10 and the second 10 trees. These two distances define the radii of 2 circles, that of the first 10 trees and the second 10 trees, respectively. These radii can be used to determine the areas of the 2 circles (using the formula A = 7t r2), and tree densities (number of trees/area) for the 10 and 20 trees in question.
7. Determine the compass bearing from the center point to each tree. This step is optional, but should be done if you intend to map the distribution of trees.
8. Estimate each tree's height (in meters to the nearest tenth of a meter).
9. Measure each tree's d.b.h. (in cm). 10. Using the d.b.h. data, determine the basal area of each
tree according to the formula (Basal Area = πr2), where r = d/2. 11. Add up the basal areas and enter the total in the appropri
ate space. 12. Determine the Braun-Blanquet cover value for each tree
species by visual estimation of the area that it covers. The modified Braun-Blanquet scale is as follows:
5 = covering more than 75 percent of the area (quadrat) 4 = covering 50 to 75 percent of the area 3 = covering 25 to 50 percent of the area 2 = any number of individuals covering 10 to 25 percent of
the area 1 = numerous, covering 5 to 10 percent of the area + = sparse, covering less than 5 percent of the sample area r = rare and covering less than 1 percent of the sample area
(usually only 1 example) Note: Often, there may be more than one tree of the same
species. If all of these trees are at the same height, a single Braun-Blanquet value will suffice. If, however, these trees be-long to different canopy layers, then separate Braun-Blanquet values will be necessary. These layers are based on tree height as indicated in item 5 above.
13. Within the same quadrat and following steps 4, 5, 6, 7, 8, and 12 (substituting trees with weeds, cultivated plants, etc., as appropriate), determine the composition of other cultivated species, weeds, small trees, and shrubs in the agroforest. Identify cultivated species by their local varietal name if known. Record the data on Form 2.
Final Comments Because of differences in species composition, the history
of human manipulation of the agroforest, species interactions and life cycles, habitat differences, and a range of other factors, no two sites within an agroforest are the same. Thus it is often necessary to analyze more than one site within an agroforest in order to determine what a representative agroforest is. Often, a researcher will try to analyze between 2 and 4 quadrats per agroforest in order to get a larger sample and a better idea of what an “average” agroforest contains. While further manipulation of the data will be necessary, the standardized procedures described above will provide the basic information needed for describing and comparing the structure of Pacific islands’ agroforests. An understanding of the structure of the agroforest is a prerequisite for understanding the functional aspects of the agroforest including productivity.
References Shimwell, D. W. 1971. The description and classification of vegetation. Se
attle, WA: University of Washington Press.
4 USDA Forest Service Gen. Tech. Rep. PSW-GTR-140. 1993.

USDA Forest Service Gen. Tech. Rep. PSW-GTR-140. 1993. 5

6

Permanent Field Plot Methodology and Equipment1
Thomas G. Cole2
Abstract: Long-term research into the composition, phenology, yield, and growth rates of agroforests can be accomplished with the use of permanent field plots. The periodic remeasurement of these plots provide researchers a quantitative measure of what changes occur over time in indigenous agroforestry systems.
Permanent plot methodology can be used to conduct several different types of surveys. Two that are appropriate to the Pacific are island-wide and case studies. An island-wide survey is ideal for obtaining baseline information concerning agroforest composition. Remeasurement of the plots will provide growth rates and change information.
Product yields and phenological information from the agroforest are somewhat difficult to obtain from an island-wide survey. Many times the logistics of obtaining this information from all of the permanent plots is too difficult or time-consuming. Many times the plots have to be visited weekly or monthly to determine yields or the onset of flowering or fruiting. To overcome these problems, a subsample of the original plots can be randomly selected and used to collect the data. The information obtained from the subsample can then be expanded to an island-wide basis.
Conversely, case studies are used to focus in on ecological or cultural processes underway in the agroforests. A case study would involve the intensive study of a specific agroforest site. This research is not aimed at determining how many breadfruit or coconut trees there are on the island, but is concerned with broader processes such as plant interactions, nutrient cycling, cultural practices, competition, or other facets of the agroforest system.
Plot Referencing A key factor when establishing permanent plots is the refer
encing of the plot and individual plants so as to be able to relocate them in the future. Appendix 1 lists procedures used by the USDA Forest Service to reference permanent plots. Plots established in this manner on Pohnpei have been relocated and remeasured after a 7-year period.
Two methods are commonly used to mark individual trees: metal tags or tree marking paint. In the forest, we mark trees with an aluminum number tag and nail. In addition we physically mark where the diameter is measured with a nail. Farmers probably would not approve the use of nails to mark their agroforest plants and trees. An alternative is the use of tree marking paint, although the paint will wear off eventually. Marking
1 An abbreviated version of this paper was presented at the Workshop on Research Methodologies and Applications for Pacific Island Agroforestry, July 16-20, 1990, Kolonia, Pohnpei, Federated States of Micronesia.
2 Forester, Pacific Southwest Research Station, Forest Service, U.S. Department of Agriculture, Honolulu, Hawaii 96813.
each tree with a number on the base and at d.b.h. will help prevent remeasurement errors (Avery 1975, Spun: 1952). In addition to being tagged or painted, each plant has its physical location referenced by measuring the distance and compass bearing to plot center. If the tree tag is lost or paint rubbed off, the plot can still be reconstructed using this spacial [SIC] information. The plot center can also be relocated with this individual tree data. We need to know the location of plot center when the plot is remeasured to determine ingrowth and any new plantings.
Measuring the Tree Component The measurement of the tree component (in contrast to crop
component) of the agroforest can be accomplished by using a multi-resource inventory form (Appendix 2). The inventory techniques and field forms were developed by the Forest Inventory and Analysis for Pacific Coast States Research Work Unit of the USDA Forest Service's Pacific Northwest Research Station. They were used to conduct a forest inventory in the mangroves and upland forests of Micronesia and American Samoa (Cole and others 1988; MacLean and others 1988a, 1988b). This form will be useful if one of the objectives of the research is to determine tree volume. Field procedures, codes, and data items on the form are explained in Appendix 1.
Equipment needed for permanent growth plot work is common to the forestry profession and includes:
- diameter tape - loggers tape (15 meter [m]) - cloth tape (30 m) - compass - bark thickness gauge - Relaskope (or other hypsometer if volume is not
determined) - nails, hammer, numbered tags, or paint - clip board and field forms - map and aerial photographs
This equipment may be purchased from several suppliers, four of which are listed in Appendix 3.
Tree Volume Determining the cubic volume of trees is a traditional method
of reporting yield. One of its most common uses is in the estimation of the quantity of lumber or biomass which the tree contains. While it is unlikely that the agroforests will be harvested, select trees may be removed. This is especially true for breadfruit trees, which may become overmature, leading to low fruit yields. Other forest trees may be present in the agroforest which were specifically planted or kept by the landowner for timber. Volume is useful information for the farmer to have.
Volume is also a common measurement used for describing tree growth. Many models report growth as an increase in cubic
USDA Forest Service Gen. Tech. Rep. PSW-GTR-140. 1993. 7

volume (Goodwin 1986, Waring 1983). Using volume (cubic meters) to report growth or the size of the trees allows comparisons to be made between species and sites. Describing growth using only diameter and height measures is deceptive because a small increase in diameter equates to a large increase in the volume of the tree. Conversely, a large increase in height does not increase volume significantly. Two factors contribute to this phenomenon: First, height growth tends to occur in the branches, whereas the major volume portion of a tree is its stem. Secondly, the formula for area of a circle used in volume calculations (see volume formulas below) has a multiplicative effect. A doubling of diameter causes a fourfold increase in volume (1:4 ratio), whereas a doubling of height only doubles the volume (1:1 ratio).
Tree volumes are calculated by dividing the tree into conic or geometric sections (fig. 1). The tree is ocularly divided into logical segments and the diameter and height estimated at both the top and bottom of the segment (or at the mid-point). These measurements are then used to estimate the cubic volume of wood in the segment.
Various formulas may be used to calculate wood volume. One is Smalian’s formula for a paraboioid frustum. Two others are Newton's and Huber's, which are based on measuring the diameter at the mid-point of the segment (Hunch and others 1972):
Smalian’s: Volume = H/2 (At + Ab) (overestimates volume) Huber’s: Volume= H (Am) (underestimates volume) Newton’s: Volume = H/6 (At + 4Am + Ab) (most accurate) where: At = cross-sectional area at top
Am = cross-sectional area at middle Ab = cross-sectional area at bottom H = length of the segment
The biomass of the branches are calculated in the same manner as calculating wood volume. The thickness of the bark is subtracted from each of the diameter measurements to compute the solid wood content of the tree.
Several types of hypsometers are available which may be used to estimate height. Most of these instruments operate on the
Figure 1-Tree ocularly divided into conic sections for volume estimation
8 USDA Forest Service Gen. Tech. Rep. PSW-GTR-140. 1993.

theory of right triangles (fig. 2). A hypsometer is basically a device which reads angles from the vertical. Most are calibrated so that when you stand at a known distance from the tree, the height is read directly from the scale. Others read the angle in percent from the vertical. The reading is then multiplied by the distance from the tree to determine the height of the tree.
Besides knowing the height of the tree, the cross-sectional area of the top and bottom of the segment are needed to estimate volume. We use a instrument called a Relaskop, which―besides measuring heights―can be used to estimate upper stem diameters. The Relaskop is fairly simple to operate and very flexible. Instead of being calibrated to only one distance, diameters and heights can be read directly from the scales at five different distances (10, 15, 20, 25, 30 meters) from the base of the tree.
The Relaskop has three height scales: the 20, 25, and 30 meter (fig. 3). The name of the scale is also the base distance from the tree. Both the 20- and 30- meter scales can be divided in half to create 10 and 15 meter scales. At 10 meters from the tree the 20-meter scale is used to estimate the height or diameter, all readings are divided by two.
Upper stem diameters, depending on the base distance, are estimated by using the No. 1 wide band and the four narrow black and white bands (4 narrow bands =1 wide band). The wide and narrow bands correspond to the following upper stem diameters at various base distances:
Distance (m) No. 1 wide band Narrow band (cm) (cm)
10 20 5.0 15 30 7.5 20 40 10.0 25 50 12.5 30 60 15.0
When looking through the viewfinder, you can see the left side of the stem aligned with the edge of the No. 1 band (fig. 4).
The right side of the tree, if large, will then line up with one of the narrow bands. For example, if the stem of the tree covers the wide band and 3.5 narrow bands, then the diameter is 56.25 cm when 15 m from the tree. We can usually estimate to one-half of a narrow band.
Figure 2-Right triangle theory behind operation of hypsometers
USDA Forest Service Gen. Tech. Rep. PSW-GTR-140. 1993. 9

Figure 3-Relaskop scales, full length and as actually seen through viewfinder
Summary Establishing permanent plots is costly and time consuming.
Therefore, it is important to clearly define the objectives of the work long before it starts. The questions to be answered must be known so the work can be designed to answer them. I recommend the FAO’s Manual of Forest Inventory as a good reference to read before attempting any survey. The worst thing is to complete a survey and find out you needed to take one more measurement or reading in order for the data to be valid. Proper planning will prevent this.
References Avery, Thomas E. 1975. Natural resource measurements. New York: McGraw-
Hill, Inc. 339 p. Cole, Thomas G.; Whitesell, Craig D.; Whistler, W. Arthur; McKay, Neil;
Ambacher, Alan H. 1988. Vegetation survey and forest inventory, American Samoa. Resour. Bull. PSW-25. Berkeley, CA: Pacific Southwest Forest and Range Experiment Station, Forest Service, U.S. Department of Agriculture; 14 p. + 4 maps.
Finlayson, William. (undated). The Relaskop. Salzburg, Austria: Feinmechanische Optische Betriebsgesellschaft M.B.H. (FOB). 34 p.
Food and Agriculture Organization of the United Nations. 1973. Manual of forest inventory with special reference to mixed tropical forests, Rome, Italy; 200 p.
Goodwin, A.N.; Candy, S.G. 1986. Single-tree and stand growth models for a plantation of Eucalyptus globulus Labill. in Northern Tasmania. Aust. For. Res.; 16:131-44.
Husch, Bertram; Miller, Charles I.; Beers, Thomas W. 1972. Forest mensuration. New York, NY: Ronald Press Company; 410 p.
MacLean, Colin D.; Cole. Thomas G.; Whitesell, Craig D.; McDuffie, Katharine E. 1988a. Timber resources of Babelthuap, Republic of Palau. Resour. Bull. PSW-23. Berkeley, CA: Pacific Southwest Forest and Range Experiment Station, Forest Service, U.S. Department of Agriculture; 8 p.
MacLean, Colin D.; Whitesell, Craig D.; Cole, Thomas G.; McDuffie, Katharine, E. 1988b. Timber resources of Kosrae, Pohnpei, Truk, and Yap Federated States of Micronesia. Resour. Bull. PSW-24. Berkeley, CA: Pacific South-west Forest and Range Experiment Station, Forest Service, U.S. Department of Agriculture; 8 p.
Spurn, Stephen H. 1952. Forest inventory. New York, NY: Ronald Press Company.
Waring, R.H. 1983. Estimating forest growth and efficiency in relation to canopy leaf area. Adv. Ecol. Res.; 13:327-354.
10 USDA Forest Service Gen. Tech. Rep. PSW-GTR-140. 1993.

Appendix 1▬Field Procedures for the Establishment of Permanent Growth Plots
The sequence of the following procedures is presented in approximately the same order as the numbering sequence on the field form.
Locating the Plot on the Ground Planning Travel
Before starting field operations, each field crew must have: 1. Maps - with field plot locations shown. 2. Aerial photos - with field plot locations, photo scale, and
magnetic north arrow shown.
The plot location will be marked on the front of the photo. The ground plot number and the photo scale will be marked on the back of the photo. Maps are used in traveling to the general vicinity of the plot. Aerial photos are used to locate the plot as marked on the photo. Field crews will select the field plot locations to be visited each day before the day's work and determine the best and quickest route of travel to the plots.
Referencing Plot Location The crew will first find a point on the ground (preferably a
tree) in the general plot vicinity which can be readily identified on both the ground and the photo. This point, called the Reference Point or RP, should not be more than 200 m from the plot
USDA Forest Service Gen. Tech. Rep. PSW-GTR-140. 1993. 11

point marked on the photo, if at all possible. However, a point of more than 200 m, if clearly identifiable, is preferable to one closer if the identification of the closer point is uncertain. Crews should record on the field form any distinctive cultural or topo-graphic features which will help in relocating the field plots. Distances from key road, trail, or stream intersections, and changes since photography, such as cutting and roads, should be noted where these will help in future relocation.
Selecting RP Tree Select a tree distinctive on both the photo and ground. Using
a stereoscope, carefully prick the base of the tree if visible, or where it appears to be from the crown position and shadow on the photo, and circle and label it RP on the back of the photo. Also record the RP tree species and d.b.h. on the field form. This will be the Reference Point or RP which marks the beginning of the compass course to the plot. Since this RP tree is a critical item in the relocation of the sample plots, it should be one not likely to die or be cut within the next 10 years. Where a suitable reference tree is not available, another object may serve as a RP, e.g., a distinctive fence corner, building corner, etc. If such is used, indicate this on the field form and clearly describe it.
Determining Azimuth and Distance from RP to Plot Location
Determine the azimuth to the nearest degree and the distance to the nearest 5 m from the RP to the plot.
Record the distance and azimuth on the field form.
Referencing by Inspection At times the plot center can be located on the ground by
inspection much easier and more rapidly than by measuring from the RP tree. This will often be the case in open stands or when a plot falls in a small opening or other spot that can be located precisely by photo interpretation.
When referencing by inspection, the crew will first locate and mark the plot center. The distance to the nearest meter and azimuth will be measured on the ground rather than scaled off the photo. All plot reference data must be filled out on the plot card. Indicate that the plot was referenced by inspection.
Marking RP Tree Survey crews will nail aluminum plot tags (square tags) on
the RP tree at d.b.h. and below stump height. Drive the nails into the tree at an upward angle and always leave at least 5 cm of nail exposed. Scribe the RP information on this tag. Enter the symbol RP, plot number, azimuth from the RP tree to plot location to nearest degree and distance.
Example: RP #020 325° 100 m
If the RP tree might be in the plot, tag the tree as above.
Plot RP Data Before leaving the RP tree and moving to the plot, record
photo number and required reference data on field form: SP Record appropriate species code of plot reference tree. DBH Record diameter of plot reference tree to the nearest
centimeter. AZ Record azimuth to nearest degree from plot RP to plot center. DIST Record distance from RP tree to plot center.
Establishing the Plot Measure from the RP to the plot center along the proper
azimuth and distance. Flag and tag trees along the course of travel to aid in relocating the plot. At the end of the measured distance, mark plot center and double check photo to see if you are in the correct location. If not, move to correct location and not the direction and distance moved on the field form. Mark the plot with a meter length of PVC pipe leaving 0.5 m above the ground.
Referencing and Marking Plot Center Begin plot establishment: 1. Select two witness trees which are near the plot center
and which form, if possible, nearly a right angle with plot center and each other.
2. Scribe on the aluminum tags the plot number, witness tree number, and azimuth and distance to plot center pin.
3. Nail the tags at eye level and below stump height on each tree on the side facing the plot center pin. Leave at least 5 cm of the nail exposed.
4. For each witness tree, record the following: Species Diameter Azimuth to the nearest degree from plot center to the witness tree. Slope distance to nearest one-tenth meter from plot center to witness tree.
Tree Data Point (PN) Record point number for plots that have multiple point.
Tree Number (TN) Record a 2-digit tree number for all plants or trees. The number will be tagged on the tree below stump height (> 0.3 m) on the side facing the center pin.
Species Code (SPC) Record the species code. This is usually the first two letters of the genus and species names (4-digit code). If a variety then add the first letter of the varietal name to the normal species code.
Azimuth (AZ) Record the azimuth as a 3-digit code. Starting from 0° (magnetic north), measure clockwise from plot center to the center of the tree or plant.
12 USDA Forest Service Gen. Tech. Rep. PSW-GTR-140. 1993.

Distance (DIS) Record measured slope distance as a 3-digit code to the nearest tenth meter from the center of the tree at d.b.h. to the center pin.
History (H) Record a 1-digit history code as listed below:
Code Description 1 Live plant or tree 2 Dead plant or tree (salvable) 3 Live plant or tree recorded on previous survey
(i.e., a survivor). 4 New live plant or tree not recorded on previ
ous survey (ingrowth). 5 Standing dead plant or tree recorded as alive
on previous survey (salvable dead). 6 Nonsalvable dead tree, recorded as live tree
on previous survey. 7 Plant or tree recorded as live on previous
surveys, but now missing (stump present). 8 Plant or tree missed on previous survey.
Damage Code (DC) When something is wrong with a plant or tree that will prevent it from (1) living to maturity or surviving 10 or more years if already mature or (2) producing marketable products (e.g., fruit, straight logs), a damage code is appropriate. Damage codes are to be used for severe damage or pathogen activity on live plants or trees. When damaged by more than one serious agent, code the most severe one.
Code Damage or Cause of Death 00 No serious injury or damage 01 Insects 11 Bark beetles 12 Twig borers 13 Defoliators 20 Disease 21 Conks 22 Mistletoe 27 Other disease or rot30 Fire damage 40 Animal damage50 Weather damage 51 Lightning52 Wind 69 Suppressed 70 Natural mechanical injury 71 Top out, dead, or spike top 72 Leaves noticeable small and/or sparse or off
color 75 Logging or construction damage (powered
equipment) 80 Unknown
Cull (CU) Cull is used in the determination of net volume. For all trees estimate the percent volume loss due to rot, missing portions, or deformation. A 1-digit code is used:
Code Cull (percent) 1 Less than 10 2 10-25 3 26-50 4 More than 50
Crown Ratio (CR) Crown ratio or percent of tree height in live crown is expressed as a percent of total tree height, including dead, broken, or missing portions of the tree (crown length divided by total tree height).
For trees of uneven length, ocularly transfer lower branches on the longer side to fill holes in the shorter side until a full, even crown has been generated. A 1-digit code is used:
Code Crown ratio (percent) 2 less than 20 4 21 - 40 6 41 - 60 8 61 - 80 9 greater than 81
Crown Class (CC) Crown class is a designation of those trees in a forest having crowns of similar development and occupying similar positions in the crown cover. A 1-digit code is used:
Code Crown class 1 Open grown 2 Dominant 3 Codominant 4 Intermediate 5 Overtopped
Descriptions of the five crown classes used are: Open grown―trees growing in the open, receiving full light
from above and from the sides; not crowded from the sides. Dominant―trees with crowns extending above the general
level of the crown canopy and receiving full light from above and partly from the side; taller than the average trees in the stand.
Codominant―trees with crown forming the general level of the crown canopy and receiving full light from above but comparatively little from the sides; usually with medium-size crowns more or less crowded on the side.
Intermediate―trees shorter than dominants or codominants, with crowns below or barely reaching into the main canopy foamed by dominant and codominant trees; receiving little direct light form above and none from the sides and usually with small crowns considerably crowded on the sides.
Overtopped―trees with crowns entirely below the general level of the canopy, receiving no direct light from either above or from the sides.
Form Factor (FF) Omit, not used.
Diameter at Breast Height (d.b.h.)
Record current d.b.h. to the nearest 1/10 cm as a 4-digit code for all plants or trees greater than 2.5 cm in diameter and 2.0 m tall. Diameters will be measured at a point 1.3 m above the ground level or root collar on the uphill side of the tree, except as
USDA Forest Service Gen. Tech. Rep. PSW-GTR-140. 1993. 13

noted below for teefern or irregularities at d.b.h. A measured d.b.h. of 25.0 cm is recorded 0250.
Each plant or tree in the plot should be marked with an aluminum nail (painted) at the point where d.b.h. is measured. All trees should be nailed on the side of the tree facing plot center on level ground, or on the uphill side of the tree on slopes. Leave as much of the nail exposed as possible, provided it is solidly affixed to the tree.
Measure the diameter directly above the nail. Check for bole irregularities before measuring d.b.h.
When measuring d.b.h., it may be necessary to remove branches to make the measurement. Do not chop off limbs other than to make a more accurate, efficient measurement. To do otherwise treats the plot differently from other areas, offends some landowners, may harm the tree, and wastes time.
For treefern, diameters will be measured at a point 1 meter above the ground.
In case of irregularities at d.b.h.; i.e., swellings, bumps, depressions, branches, etc., diameter will be measured immediately above the irregularity at the place where it ceases to affect the normal stem form. If possible, mark the point of measurement with an aluminum nail.
Fork at or above 1.3 meters―consider it a single tree. Measure diameter below the swell caused by the fork, but as close to 1.3 m as possible.
Fork below 1.3 meters―consider each fork as a separate tree. Measure diameter 0.5 m above fork if possible or at 1.3 m above the ground, whichever is higher on the tree.
Two trees grown together―when two closely spaced trees grow together, they will sometimes have the appearance of a forked tree. This is common in some mangrove stands. Such trees should be treated as separate trees and recorded as such. Diameter will be determined by driving two nails half way around the circumference from each other, measuring the distance with a diameter tape, and doubling the result.
When the diameter is physically impossible to measure with a diameter tape because of forking, huge root collars, etc., then the diameter will be measured with a Relaskop. Record under remarks, “d.b.h. estimated.”
DBH Height (DBH HT) Record the height d.b.h. is actually measured at, usually 1.3 meters.
Treefern (TF) Merchantable length of a treefern trunk is taken from ground level to a point 1 meter below the base of the live fronds. Minimum length for treeferns is 1 meter. The length will be measured to the nearest half meter and recorded as a 3-digit code; e.g., 3.4 meters would be 035.
Double Bark Thickness (DBT) Measure and record double bark thickness at d.b.h. to the nearest tenth centimeter. Record as a 3-digit code. Use code 999 for treefern.
Basal Diameter (BD) Record current basal diameter to the nearest tenth centimeter as a 4-digit code for all trees. Diameters will be measured at a point 0.3 meters above the ground. A measured basal diameter of 26.3 is recorded 0263. In the event of excessive flutes or other deformities, estimate basal diameter.
Basal Diameter Height (BD HT) Record the height where basal diameter is measured or estimated.
Tree Volume Measurements Due to extreme infra-species variability in growth form, tree
volumes will be computed based on geometry or conic sections. The length of the conic sections will be determined by up to three taper changes (TC) in the tree form which affect volume.
For trees with sawlogs, a mandatory taper change is the top of the sawtimber portion which may be limited by defect, branches, dead top, deformity or minimum top diameter outside bark of 22.5 cm.
For trees with forks or excessive branches in the upper stem, the main crotch will be measured and a specific number of branches will be given an average upper/lower diameter and average length. Taper Change Diameter (TCD) Record to the nearest cm the diameter outside bark at points along the bole above d.b.h. where taper changes occur (field form has space for recording two measurements).
Taper Change Heights (TCH) Record to the nearest half meter the height from the stump to points along the bole where taper change diameters are taken (field form has space for recording two measurements).
Sawlog Classification (SC) For each tree record the appropriate code to identify presence or absence of sawlogs.
Code Quality Definition 1 No sawlog Trees with d.b.h.? 27.5 cm with
less than one 2.5 m butt log. 2 Sawlog Trees with d.b.h > 27.5 cm with at
least one 2.5 m butt log.
Crotch Height (CH) Record to the nearest half meter the height to the top of the crotch.
Upper Stem Diameter (USD) Measure the top diameter outside bark to the nearest cm of the upper stem, usually to a 10 cm top.
Upper Stem Height (USH) Measure the height to the nearest meter of the upper stem to 10 cm top outside bark. The upper stem measurement is to be used only for the portion of the main stem above the sawtimber portion.
Tip Diameter (TiD) Record the diameter of the tip of the main stem, usually 0.1 cm.
Tip Height (TiH) Record the height to the tip of the main stem.
Number of Branches (NB) Record number of upper branches. Record 99 for no branches.
Lower Branch Diameter (LBD) When multiple branches occur, estimate the lower branch diameters, average them, and record to the nearest cm. Record 99 for no entry.
14 USDA Forest Service Gen. Tech. Rep. PSW-GTR-140. 1993.

Branch Length (BL) Estimate the branch lengths to the tip, Appendix 3▬Sources of Forestryaverage them (if necessary), and record as a single entry to the Equipment3
nearest meter. Record 99 for no entry. Forestry Suppliers
Upper Branch Diameter (UBD) Record the diameter of the tips P.O. Box 8397
of the branches, usually 0.1 cm. Jackson, MS 39284-8397 (phone 601-354-3565)
Total Height (TH) Measure total height for all tally trees to the nearest meter. Total height is the height from the tree base to the Ben Meadows Company
top of the tree. Record as a two digit code, e.g., 25.4 meters P.O. Box 80549
would be 25. Atlanta, Georgia 30366 (phone 404-455-0907)
Bolts Bailey's Western Division Record the number of craftwood bolts. A craftwood bolt is a 44650 Hwy. 101
2-meter portion of a tree about the merchantable sawlog top, P.O. Box 550 meeting a specified diameter. These bolts are used for produc- Laytonville, CA 95454 tion of handicrafts. (phone 707-984-6133)
For all species with craftwood potential 27.5 cm d.b.h. and larger, record the number of craftwood bolts. In the case of high General Supply Corporation value trees with excessive forking, estimate craftwood bolts in P.O. Box 9347 the whole tree. Record the number of bolts by mid-diameter 303 Commerce Park Drive classes as follows: 25, 35, 45, 55, 65, 75. Jackson, MS 39286-9347
(phone 601-981-3882)
3 Trade names and commercial enterprises on products are mentioned solely for information. No endorsement by the U.S. Department of Agriculture or other agencies is implied.
USDA Forest Service Gen. Tech. Rep. PSW-GTR-140. 1993. 15

Statistical Considerations for Agroforestry Studies1
James A. Baldwin2
Abstract: Statistical topics that related to agroforestry studies are discussed. These included study objectives, populations of interest, sampling schemes, sample sizes, estimation vs. hypothesis testing, and P-values. In addition, a relatively new and very much improved histogram display is described.
As the title implies, I would like to discuss various statistical topics that relate to agroforestry studies. I will cover a few points on study objectives, then move on to sampling and analysis, and finally describe a new data display technique.
Study Objectives Study objectives are crucial to any study, but I have found
that in many studies the objectives are only written down when the final report or manuscript is being prepared. These objectives need to be examined by peers in your field along with the rest of the study plan. After such review, the study objectives should be capable of being realized, specific, and a fixed―not moving―target. You will get the credit for good work, and your reviewers can share the blame if something is amiss with the objectives and design.
Population of Interest After the objectives have been decided upon, the population
of interest needs to be defined; for example: • All farms on Pohnpei • 23 farms on Pohnpei that introduced a new agroproduct
since 1988 • One particular farm • One particular area of a particular farm • All farms with mango trees All of the above examples are legitimate populations of
interest. The important point is that the population needs to be defined before any of the sampling begins. All of your inferences will be directed to this population.
Unfortunately, one is not always able to sample the population of interest. Typical reasons for this are timing, not having permission granted, and lack of accessibility. These problems lead to differentiating between the “target” population and the “sampled” population.
Inferences about the sampled population are based on appropriately collected data. Inferences about the target population are based on how well you can convince someone about the
1 An abbreviated version of this paper was presented at the Workshop on Research Methodologies and Applications for Pacific Island Agroforestry, July 16-20, 1990, Kolonia, Pohnpei, Federated States of Micronesia.
2 Mathematical Statistician, Pacific Southwest Research Station, Forest Service, U.S. Department of Agriculture, P.O. Box 245, Berkeley, CA 94701.
similarity of the target and sampled population. After reflecting upon these two populations, you usually need to reconsider your, study objectives.
Sampling Schemes and Estimators Three basic types of sampling schemes are available:
Purposive sampling, Systematic sampling, and Probability sampling.
Purposive sampling is sometimes called “convenience” sampling. Statisticians also use even less flattering terms for it. An example is “That tree looks typical. Let's sample it.” The obvious problem is that this type of sampling introduces the biases of the person sampling (not necessarily the researcher). In addition, your inferences from such collected data will be suspect at best. Because with little additional effort one can use a sampling scheme with known properties, I cannot recommend purposive sampling for any scientific inquiry.
Systematic sampling is sometimes used if it is convenient to take a sample in some regular order. For example, every fifth tree could be chosen rather than a simple random sample of trees. A sample mean from such a sampling scheme can be more precise than that of a simple random sample. Unfortunately, the estimate of the precision of a systematic sample can require stringent assumptions to be accurate.
Within probability sampling, we have simple random sampling, stratified random sampling, PPS (Probability Proportional to Size), and SALT (Sampling At List Time). Only simple random sampling and PPS sampling are described below.
For a simple random sample of plot centers on an island, just overlay a rectangle on a map of the island. Sample points are selected by choosing uniform random numbers on each of the horizontal and vertical scales. Ignore any points that fall in the ocean. Continue until you meet the required sample size. Unfortunately, this scheme will not get you a simple random sample of farms.
If you are selecting farms, one method is to choose each farm with a probability proportional to its size. If you do not know its size, then the “uniform grid” method described earlier will result in such a sampling scheme (PPS sampling).
To fix ideas, suppose we have the following data on five farms:
Farm: A B C D E Acres: 10 20 30 50 100 Tons of mangoes: 9 23 35 43 105 Suppose we want to sample two farms and estimate the total
mango production (from this example we know that the total is 215 tons). (Any resemblance to actual mango production is purely coincidental and extremely unlikely.)
16 USDA Forest Service Gen. Tech. Rep. PSW-GTR-140. 1993

Simple Random Sampling
We can choose two farms for a simple random sample in two ways. In the first method we randomly select one farm and determine the mango production on that farm. For the second farm we randomly choose one farm from the remaining farms and determine its mango production. This is called “simple random sampling without replacement” because each farm can only be chosen once.
The complete list of potential samples (ignoring the order of selection) of size 2 (without replacement) is
AB,AC,AD,AE,BC,BD,BD,CD,CE,DE If we sample “with replacement,” then that means that a
farm could be selected on the first draw and again on the second draw. The complete list of potential samples (again ignoring order) of size 2 with replacement is
AA,AB,AC,AD,AE,BB,BC,BD,BE,CC,CD,CE,DD,DE,EE If we chose farms A and C by either method, we would take
the average mango production and multiply by 5 to estimate the total mango production:
estimate = 5*(9+35)/2 = 110 tons This formula is just the total number of farms multiplied by
the estimate of the average production per farm. Again, we know that the “true” total is 215 tons.
PPS-with Replacement
The PPS-with replacement sampling scheme needs more explicit formulas to describe how it works. To generalize, sup-pose our example consists of a sample of size n with replacement and probability proportional to a farm’s area is taken from a population of N farms. For farm i, the area is labeled ai and the measurement of interest (tons of mangoes) is labeled yi. We want to estimate the sum of all of the yi’s, namely,
N Y= ∑ yi
i =1
One estimate of the total is the following
N Y
ppz = 1 ∑
yi n i=1 zi
where zi is the probability of selecting farm i on any one draw.
N Usually z i = a i/ ∑ aj
i=1
An estimate of the variance of Y ppz is given by
2 n v(Y
ppz )= ∑ yi − Y
ppz
/ n(n -1) i=1 zi
1If zi = N
, then each farm has an equal chance of being selected
and we have a simple random sample with replacement.
USDA Forest Service Gen. Tech. Rep. PSW-GTR-140. 1993.
1 n yiY = ∑ n i =11/N
= Ny
We also end-up with the usual variance formula.
PPS-Without Replacement
We use the same notation as before. The only difference now is that we sample without replacement, i.e., no farm can be chosen more than once.
One estimate of the total is the Horvitz-Thompson (HT) estimator
n Y
HT = ∑π
yi
i =1 i
where πi is the probability of selecting farm i in the sample. An
ˆestimate of the variance of Y is given by
n −1 n (πi π j − πij ) yi − y j
2
v(Y HT ) = ∑ ∑
i =1 j > i πij πi π j
assuming that all πij> 0 where πij is the probability that both farms i and j are included in the sample.
If we call the probability of selecting farm i on the first draw N
pi, then p,= ai / ∑ a j . In other words, the probability of selecj =1
tion (on the first draw, at least) is proportional to the size of the farm.
When n =1, then πi = pi. When n = 2, then N p j
πi = pi 1 + ∑ j ≠ i 1 − p j
When n is much bigger than 2 the formulas become increasingly complicated and the πi’s need to be estimated from simulations.
An alternative for larger sample sizes is Murthy’s estimator
YM = = ( ) ∑ N
i i i s P y
s P 1
1
where P i s = conditional probability of getting the set of farms
that was drawn, given that the ith farm was drawn first P(s) = unconditional probability of getting the set of farms
that was drawn Even this estimator becomes nearly impossible to calculate
without simulations when n is much bigger than 11 or 12.
ˆThe estimate of the variance of YM is given by 1 n n
∑ ∑ [P( )P − j s P i s P ij s ]v (Y M ) =
P( )2 i =1 j >is
s
2
⋅ pi p j yi −
y j pi p j
17

where P ijs is the conditional probability of getting the observed sample farms given that farms i and j were selected in the first two draws.
Comparing the Sampling Schemes The percentage of time that any two particular farms would
be selected under the four sampling schemes can vary (table 1): Simple random sampling with and without replacement and
PPS sampling with and without replacement. For example, under PPS sampling without replacement, we expect to obtain farms D and E in our sample 36 percent of the time.
Each combination of farms for each sampling scheme yields varying values (table 2). Notice that all sampling methods are unbiased: all have a mean of 215 tons. But the standard deviations differ. The estimator for PPS with replacement has a standard error only one-seventh the size as that of the simple random with replacement estimator. Apparently the sampling scheme can make a large difference in the precision of the summary statistics.
Sample Size “What sample size should I take?” is one of the most
frequently asked questions a statistician helps to answer. And the answer depends on several facts that you need to supply the statistician.
If you are estimating a population statistic (such as total farm production of mangoes), then you need to tell the statisticcian how close you need to be to the true value. The statisticcian will translate this into a statement something like “95 percent of the time we want to be within 2.5 tons of the true total production.”
One common misconception is thinking about an adequate sample size in terms of a proportion of the population size. We hear “we took a 5 percent sample” or even “we took only a 5
Table 1-Percentages for each potential sample for various sampling schemes1
Simple Simple Farms random random PPS PPS
selected (wr) (wor) (wr) (wor)
AA 4 0 0 0 AB 8 10 1 1 AC 8 10 1 2 AD 8 10 2 3 AE 8 10 4 7 BB 4 0 1 0 BC 8 10 3 3 BD 8 10 4 6 BE 8 10 9 14 CC 4 0 2 0 CD 8 10 7 8 CE 8 10 14 21 DD 4 0 6 0 DE 8 10 23 36 EE 4 0 23 0
1 wr = with replacement wor = without replacement.
18
percent sample.” If there is one thing I would like to convince you about, it is thinking about sample size as an absolute number rather than as a percentage of the total population size.
For example, if we sampled 10 individuals from a population of 1,000 individuals, we would get almost exactly the same precision for our estimator as if we had 1,000,000 individuals in the population. This happens despite the wildly different relative sample sizes (10 out of 1,000 vs. 10 out of 1,000,000).
This can be seen from the formula of standard error. If N is the population size, n is the sample size, and a is the standard deviation of the population, then the standard error is given by
s.e. = N
n N n
− σ
When n is small compared to N, the rightmost term, is very close to 1 and, therefore, does not influence( ) N nN / −
the standard error. It is the term 1 / n that has the most influence and it only depends on the absolute (and not the relative) sample size.
Estimation vs. Hypothesis Testing Long before analyzing the data, the researcher needs to
decide about which questions need to be placed in “Hypothesis Testing” terms and which in “Estimation” terms.
Estimation and hypothesis testing try to answer two different types of research questions. For example, estimation might try to answer the question “How much change in production occurred from the previous year?” A similar question for hypothesis testing might be “Is there a large change from the previous year?”
Table 2-Estimates for each potential sample for various sampling schemes1
Farms selected
Simple random (wr)
Simple random (wor)
PPS (wr)
PPS (wor)
AA AB AC AD AE BB BC BD BE CC CD CE DD DE EE Mean S.E.
45 80 110 130 285 115 145 165 320 175 195 350 215 370 525 215 116
-80
110 130 285
-145 165 320
-195 350
-370
-215 101
189 212 217 185 205 242 243 211 231 245 213 233 181 201 220 215 16
-175 179 157 211
-202 180 234
-184 238
-216
-215
21
1 wr =with replacement wor = without
- = that particular combination of farms is impossible to select under
the sampling scheme.
USDA Forest Service Gen. Tech. Rep. PSW-GTR-140. 1993.

Figure 1-Histograms with same bin widths but different starting values
The hypothesis testing question requires more information than the estimation question: you must be able to supply a definition for how “large” is a large change. The definition of “large” cannot be answered by the statistician or by the data collected. But frequently it is difficult, if not impossible, to supply a definition either because it just is not known or there is extreme controversy as to what constitutes a large change.
When the definition of “large” is unknown, then usually confidence intervals (an estimation procedure) are constructed. But you must remember this about confidence intervals: The confidence percentage (usually 95 percent) is associated with the procedure and not any particular interval you might get. The confidence interval procedure guarantees that, in the long run, the procedure will result in an interval that covers the “true” parameter being estimated 95 percent of the time. There is not a 95 percent chance of your specific interval containing the true value.
P-Values The P-value is the probability of obtaining a statistic at
least as extreme as the observed statistic given that the null hypothesis is true. For example, if someone else has twice your budget for sampling, that someone will have smaller P-values even though there is no difference in the phenomenon that you are investigating. The P-value depends on the population’s variability, the study’s sample size, and the “biological size” of what’s begin [SIC] studied.
P-values are one of the most misused numbers in statistical analysis. A P-value is many times incorrectly used to imply the importance of a hypothesis, and it cannot do so. A P-value (by itself) does not indicate importance, lack of importance, likelihood of the alternative hypothesis being true, or whether you should publish your results.
Display of Data Displaying your data is of obvious importance to show what
your data suggests. One of the common displays, the lowly histogram that you have all had to construct at one time or another, has had several improvements lately.
First, the usual histogram is described. Each sample point is stacked in the bin it belongs to with the bins described by a bin width and a starting value. Figure 1 shows two histograms with the same bin width but different starting values. Would you draw the same conclusions from these two different representations of the same data?
Figure 2 shows two histograms now with the same starting values but different bin widths. Which bin width allows an adequate description of the data?
In constructing the histogram, we took “bricks” that represented the sample points and stacked them into the associated bin. Now consider two modifications: First, instead of placing the brick in the bin that contains the sample point, we center the brick directly on top of the sample point. Where the bricks overlap we break the bricks to fit flush with the horizontal axis (fig. 3).
Second, we change the shape of the brick from a rectangular shape to a smoother shape. These shapes are now called “kernels” and their widths are called band widths rather than bin widths. Naturally, we now call the method the kernel method.
Figure 4 shows two kernel estimates with different band-widths.
There are several methods for choosing the bandwidth for the kernel method. One commonly used method is to choose the bandwidth that is optimal for the normal distribution:
bandwidth = 1.06 s n -1/5
where s is the sample standard deviation and n is the sample size. If we stick with the usual histogram, the optimal bin width for the normal distribution is
bin width = 3.49 s n-1/3
USDA Forest Service Gen. Tech. Rep. PSW-GTR-140. 1993. 19

Figure 2-Histograms with same starting values but different bin widths
Conclusions
Statisticians can offer a wide variety of assistance for your studies throughout the planning, implementation, analysis, and writing stages. Please try to take advantage of their services.
References
Cochran, W.G. 1977. Sampling techniques, 3rd ed. New York, NY: John Wiley & Sons; 428 p.
Silverman, B.W. 1986. Density estimation for statistics and data analysis. London: Chapman and Hall; 175 p.
Whorton, B.J. 1989. Kernel methods for estimating the utilization distribution in home range studies. Ecology 70 (1): 164-168.
Figure 3-Constructing a “new” histogram with “bricks” centered over each data point
Figure 4-Display of data using the Kernel method with two different bandwidths
20 USDA Forest Service Gen. Tech. Rep. PSW-GTR-140. 1993.

Socio-Cultural Studies of Indigenous Agricultural Systems: The Case for Applied Research1
Randall L. Workman2
Abstract: Agroforestry has the potential to contribute greatly to Pacific island development efforts. However, success will depend on fully realizing the social implications of agricultural research on island cultures. Agroforesters must recognize their role as "agents of change." Because of this, they must strive for the involvement of the community in all stages of their research. The applied research approach, exemplified by the Farming Systems Research and Development methodology, is offered as a model approach.
Agroforesters are among the newest actors to join Micronesia’s efforts to develop their economic and political lands. I purposely speak of the “economic and political land;” it is a cultural view expressed in the Fijian term vanua, which literally means “land,” yet means the social and cultural elements of the physical ecosystem identified with the family group occupying it (Clarke 1990, p. 247). This broader view of the island environment as a social ecology makes the challenge confronting agroforesters a bit more complex than general biological knowledge can address. As information specialists applying knowledge to the islands’ development effort, many others have come before. The limited success of socio-economic development efforts over the first 20-30 years has been well documented (Fox 1978, Mason 1982, Nevin 1977, Workman and others 1983, Ballendorf and Karolle 1982). Agroforestry is being introduced to Micronesia as environmental concerns have increased in the world’s political agenda. The extent to which agroforestry research can bridge the gap between Micronesian cultural knowledge of the ecosystem and Western science will determine the level of “success” achieved.
The Question of Methods Micronesia’s multi-cultural setting for research highlights
often overlooked parts to the professional’s role―a role which creates a conflict between doing “basic” research advancing the general biological sciences and doing useful “applied” research advancing traditional cultural knowledge of island ecosystems. Dwight Harshbarger (1984) used the concept of “value added” or the value of research to communities beyond the fact that research has been completed and reported. What contribution does research add to development? This question raises concerns for researchers that have not received much attention until recently.
Pacific Island governments face serious development difficulties, and they need the help of researchers to find ways to
1 An abbreviated version of this paper was presented at the Workshop on Research Methodologies and Applications for Pacific Island Agroforestry, July 16-20, 1990, Kolonia, Pohnpei, Federated States of Micronesia.
2 Guam Cooperative Extension, College of Agriculture and Life Sciences,University of Guam Station, Mangilao, Guam 96923.
“incorporate traditional knowledge and resource-management systems or techniques into modem life” (Clarke 1990, p. 233). Graham Baines (1989, p. 273) has stated this larger dilemma quite explicitly;
Governments are proceeding to implement forms of economic development which are in conflict with these traditional systems. This poses a development dilemma which is crucial for the future of the people of the South Pacific islands. To what extent can the traditional systems accommodate further change? Will serious efforts be made to adjust approaches to economic development so as to ease those disruptions to traditional resource-management systems which are eroding Pacific island societies themselves?
Any development program is a social effort by people to gain control of their communal and natural environments. Control refers to a capacity to have the outcome of actions match the intentions and planned objectives which a community wants. Islanders make choices about the allocation of their natural resources by applying their cultural system of knowledge to achieve their desires. Even so, there are many islanders and thus many different desires, opportunities, and amounts of resources. As information specialists, researchers provide information and training to help people make decisions. Thus, the role of re-searchers is to help people to exercise control over their development. This view of research as intervention into the pursuit for controlled development allows us to view the dilemma of re-search in a new light.
When the concept of applied research first emerged, it was generally believed that Western science could solve problems (Boeckmann & Lengermann 1978). Yet the application of re-search is a social process of negotiation that involves value-interest conflicts and organizational politics (Sjoberg 1975, Voth 1975, Burton 1978, Cronbach and Associates 1980, Hamnet and others 1984). The tasks of an applied researcher, therefore, are to help islanders obtain information useful for decisions among themselves and to assist in implementing island programs for desirable outcomes.
Applied research is born of decision-making needs of policymakers who pursue control of the development process. As such, research is inescapably linked to the change process― the researcher is an “agent of change.” Thus, it is helpful to conceptualize research as a social process dependent on negotiation of values and interests. Also, although there may be no way to avoid the role of change agent, the role can be performed in several different styles. Styles vary in the extent to which change is promoted.
One type of change being criticized intensely is the replacement of indigenous island knowledge systems with technologically structured “scientific” information. Although the knowledge of island farmers and agroforestry researchers differ, they may be compatible, and it may be possible to integrate them. However the role often taken by researchers is that of an “expert”―the person who possesses a unique knowledge. Seeing
USDA Forest Service Gen. Tech. Rep. PSW-GTR-140. 1993. 21

oneself in this role can interfere with the ability to learn from the knowledge of the community. Many “experts” lack interest in local island knowledge or distrust it as practical and parochial (not global). Johannes (1981, p. ix) is more blunt, stating that a reason natural scientists routinely overlook local knowledge is “the elitism and ethnocentrism that run deep in much of the Western scientific community.”
By being aware of their role as agents of change, researchers can purposefully expand the total “value added” by their research.
Basic Versus Applied Research Methods Science is by definition very method-oriented, with a
great deal of emphasis put on “scientific” methods. Yet there are differences between methods for increasing indigenous knowledge systems and those for increasing structured “West-ern” knowledge. Research methods also differ depending on whether the purpose is to gain knowledge for action among islanders or to gain publishable research advancing general knowledge amongst the scientific community. Currently, “re-search” is rarely used in the political policy-making process in the Pacific islands, and thus rarely contributes to any changes in local island environments.
The difference between “basic” and “applied” research methods is the difference between research for validating knowledge versus research for informed local policy making. Basic research may seek to influence policy, but the highest priority is to select methods that maintain accuracy for validation. In contrast, applied research also seeks to maintain accuracy for validation, but the highest priority is to select methods that lead to the use of research findings in the political policy process. This difference between basic and applied research is displayed as follows:
Applied Research Basic Research Utility in practice Accurate for validation Feasible over time Feasible over time Accurate for validation Utility in practice
Research, merely defined as scientific appraisal, emphasizes experimental research design and methods that lead to academic validation of knowledge. The basic research study goes through four successive phases that involve only the researcher(s): planning, execution, interpretation, and reporting. The “time” of the research is a “time out” from the world of action; it is removed from the system of politics and policy-making so the procedure can be more “value free.” Yet it is assumed that when the research findings are reported, they will affect change, contributing in some way to controlled action.
The limitations of this “basic” approach to research for achieving a study that gets “used” is well documented, and argued more eloquently than needed here (Cronbach and Associates 1980, Hamnett and others 1984, Patton 1978, 1985). The main issue has been well expressed by Champion (1985, p. 30).
Could it be that many professionals in this business are more interested in being seen as doing splendid methodological work by their colleagues and peers than in making a useful, but largely invisible, contribution to good policy, good program design and even good government? Could it be that immaculate or ingenious methodology becomes too much an end in itself?
Cronbach and Associates (1980) call this conventional model of basic research a “stand alone study.” They assert that the valued priority on accuracy for validation dictates against involving the people who will use the research results in planning and policy-making, and against getting them results in time for making policy decisions.
Cronbach sums up his “critique” of basic research by stating that it is a myth for both basic and applied science to believe that “one best action” will be made crystal clear by a factual study. He also asserts that the timeliness of reports is a major factor to a research study’s contribution to policy-making. Interaction between the researcher and the users of the research results are important determinants of the use of re-search by decision-makers.
To make research useful to indigenous Pacific Island leaders then, an applied research methodology is justified to the extent that the purpose is to facilitate policy development. Methods, therefore, should be selected by their contribution to public thinking and action to be influenced by the study. Excellence ought to be judged by how research can serve the island society. Applied research can improve the welfare of citizens only by contributing to the political process that shapes social actions. Research pays off to the extent that it offers knowledge related to pending actions and helps people think more clearly.
Applied research methods differ from basic methods by the addition of two procedures:
(1) Involving people who will be influential in the use of the research results in planning and conducting the study, and
(2) Distributing timely communications to potential users as the study begins and proceeds.
Broadly, applied research ought to inform and improve the operation of programs in the island community. This broader view of science is grounded in the same basic assumptions and objectives that underline the community development process. Drawing from several sources (Littrell 1977, Burton 1978) these can be presented as:
1. Applied research is interested in developing the ability of public decision-makers to meet and deal with their environment.
2. Public decision-makers are capable of shaping much of their environment, and of giving direction to the collective behavior through interaction and the conscious assessment of in-formation about their environment.
3. There exist multiple interpretations of reality among decision-makers, and these value interests can often conflict.
4. A variety of policy needs may exist simultaneously, but these are not the only ends which decision makers may want a research study to serve, since research findings have a variety of political and economic as well as social functions.
5. Group action and community decision-making results in “better” and more lasting change efforts.
Farming Systems Research and Development
The uniqueness of applied research, and one of its leading strategies―Farming Systems Research and Development (FSR&D)―is that successful implementation of research re-
22 USDA Forest Service Gen. Tech. Rep. PSW-GTR-140. 1993.

sults necessitates the involvement of people in the community. FSR&D focuses on people in their environment. This environment is studied by examining all its various elements: economic, political, social and physical. While these elements are often separated in academic research, in real life the elements are inseparable.
FSR&D looks at the interactions taking place within the whole farm setting and measures the results in terms of farmers’ and society’s goals. Basic research separates tasks into progresssively narrower subject areas to be studied independently and evaluates results by standards within the discipline. Several factors contribute to the greater adaptability of FSR&D:
(1) the involvement of critical decision-makers to the development process, including the islands’ local innovators and entrepreneurs
(2) comprehensive inclusion and consideration of multiple contributing factors
Basic research objectives are often increased farm income and commercialization. In contrast, FSR&D defines “farm development” as efficient and productive use of limited agricultural resources. FSR&D assumes that productivity is more truly measured by the quality and quantity of food output and ecological efficiency from the farm unit.
FSR&D also takes into consideration local values and cultural motivations which are often very different from those of Euro-American societies. In Micronesia, as in many other parts of the developing world, island lifestyles and values leading people into farming are often unaffected by research appealing to capitalist commercial enterprise. The pressure in academic research concentrates effort toward those few economic and biological factors most crucial to crop production and profit margins. Yet, as Harwood (1980) points out, the greatest advances in farm development have occurred only where such technological crop production factors are encouraged by cultural values. FSR&D directs attention to “appropriate” technology and resource management practices based on the motivating interests of local people.
The applied research approach of FSR&D gives it great potential for stimulating change initiated by local innovators/ farmers. The key remains the involvement of community people in research. Basic research, where the scientists “do it all by themselves,” is the easiest and quickest way for scientists, especially off-island consultants, to do research, since they can control the research activity. On the other hand, the applied approach to research requires the commitment of local island researchers―both for involving local people, and in overcoming the reluctance of funding institutions to accept local involvement.
Involving People as Research Partners Planning and conducting a research study consists of many
decisions. The project leader (researcher) is responsible for a continuous series of choices between actions, changes in the original plan, and interpretations of data collected. Successful applied research depends on the joint effort of local village leaders, public officials, local professionals, and research techni
cians and scientists. None can be excluded from the process if it is to be effective. A mutually agreeable methodology has to be developed by the community being studied and the researchers doing the study. By participating in the discussions and decisions, both researcher and user/decision-maker validate the in-formation resulting from the research. Acceptance and use of research is built into research procedures encouraging a shared sense of ownership - “our study showed...”
Involving people means including non-scientists in the re-search process and conducting events that occupy their attention. Applied research procedures are only partly influenced by the researcher. His/her expertise is needed to identify the alternative choices and explain details. But it is through the involvement of local people that decisions are made, since decision-making requires the consideration of cultural values, personal beliefs and opinions. These are the areas of “expertise” provided by community people. Research procedures should encourage the participation of various individuals and groups in the community and involve them in different ways, at different times, and with different levels of responsibility. Involvement thus includes a wide range of activities.
Methods of involvement consist of several objectives as the researcher builds a relationship with community people. Patrick Boyle (1981) lists four of these objectives:
1. Creating awareness of the decision situation, unsolved problems and/or opportunities
2. Designing the decision question, listing alternative choices, and specifying decision criteria
3. Organizing event(s) leading to a decision choice based on information and criteria
4. Implementing alternatives, reassessing decision conesquences or redesigning the decision question
Different types of decisions will differ in the amount of effort needed by the researcher to achieve these objectives. For example, routine administrative decisions will need less time for objectives 1 and 2, and involve fewer people than non-routine decisions. Decisions tied to emotions or values will be more complicated and need more time than impersonal decisions. Decisions on specific technical research procedures will allow more input from the researcher, while those addressing issues of wording, behavioral styles, and implementation of procedures will need more input from local people.
Some decisions will also require more formally organized involvement methods than other decisions which can be handled informally. A number of different involvement methods are available depending on the situation and type of decision. The following are some of the most common methods employed to achieve involvement:
1. Task Force or Project Steering Committee 2. Community Advisory Group 3. Ad Hoc Nominal Group Meeting or Village Forums 4. Formal Hearings With Community Organizations 5. Brainstorming Meetings 6. Focus Group Interviews 7. Surveys (e.g., Rapid Rural Appraisal) 8. Project Collaborators (Ombudsman)
USDA Forest Service Gen. Tech. Rep. PSW-GTR-140. 1993. 23

Involving people in a research project is accomplished by inviting them to join and then working with them as influential partners. The elitist view that research is purely a technical matter, that only scientists have the expertise, that research comes from, is produced by and written for outsiders, not islanders, must be avoided. When Micronesians perceive that a re-search project is being handled in this way, they may help for immediate social or dollar rewards, but they will see nothing they can offer to or use from the final results. Their involvement is limited only to serve the researcher’s purpose―to complete the study. To do more depends on the researcher.
Considerations of Local Culture At times, it appears that researchers can set island goals and
public policy. This is not the case, and both local officials and farmers will quickly demonstrate that such decisions are theirs. However, researchers generate information so people can judge the consequences of their various actions. Even when not trying to effect change, researchers intervene into the lives of local people and their culture. The researcher cannot avoid consideration of whose interests and values decide which research should be undertaken or what role local culture takes in the research process.
Culture is a human phenomenon that marks one group of people as being different from another. It marks boundaries that, when crossed, inform people that they have entered a place with a different set of rules, values, and understandings. The term is used to discuss differences between all sorts of groups, including ethnic, political, economic, and even scientific cultures. People in different cultures tend to (Workman and others 1987):
― have different world views ― differ in regard to how to make assertions about the
world ― attribute the right to make assertions about the world to
some certain select group of people and not to others, and ― determine what is polite for the stranger (e.g., researcher)
to ask and for the host to answer Unfortunately, many researchers view differences in lan
guage, customs, perceptions of time, values for non-economic development and resistance to change as problems to be over-come. This is short-sighted. Cultural differences, especially dif
ferences in world views, can provide the impetus to create more useful research for development efforts and also increase our knowledge about the world.
Several considerations seem to be essential for deciding when culture is important to an applied research study (Work-man and others 1987):
1. Whenever there is confusion over “what is it we’re talking about?,” “What is the unanswered question before us?” or “exactly what decision needs to be made?”;
2. Whenever there are conflicts where the researcher must assess the situation and understand whether the problem is due to the research methodologies being culturally alien, organizational factors in the lines of authority, working relationships, and/or patterns of interaction;
3. Whenever questions arise about the purpose of the re-search project.
The essence of these considerations for researchers is that they are members of a particular interest group affecting the lives of other people. Social cultures are dynamic human creations that are constantly changing. The researcher needs to consider culture to (1) respect the right of self-determination and (2) to enable those who experience change to participate in creating that change.
Conclusions Researchers in indigenous agricultural systems must take
an applied methodological approach in order to improve island ecosystems. Applied methods ensure that the research project will help local people gain mastery of their natural and social environment, and that it will take actions needed to integrate local knowledge systems with the global technological knowledge system (Clarke 1990, p. 224).
Researchers in Micronesia must accept the role of “change agent,” either intentionally or unintentionally. This introduces a responsibility to select research methods that can ethically carry out that role. Unfortunately, the “basic” research philosophy is based on the belief that scientists only create knowledge, they are not responsible for its application. By understanding the difference between methods for basic and applied research, researchers can more assertively influence the kind of change promoted by their research.
24 USDA Forest Service Gen. Tech. Rep. PSW-GTR-140. 1993.

References Baines, G. B. K. 1989. Traditional resource management in the Melanesian
South Pacific: A development dilemma. In: F. Berkes, ed. Common Property Resources: Ecology and Community-Based Sustainable Development. London: Belhaven Press; 273-295.
Ballendorf, D. A.; Darolle, M. 1982. Stages of growth in the development of social services in Micronesia. Unpublished manuscript submitted for publication 1983, Journal of Social Work.
Ballendorf, D. A. 1984. Formulating future delivery systems for social services in Micronesia: Observations and prescriptions. Paper presented at the Fourth Annual Social Work Conference; Guam.
Boeckmann, M. E.; Lengermann, P. M. 1978. Evaluation research: System, functions, future. Sociological Focus II(4, October): 329-340.
Boyle, Patrick G. 1981. Planning better programs. New York, NY: McGraw-Hill.
Burton, J. E., Jr. 1978. A systems-process model for program evaluators. Journal of Community Development Society 9 (1, Spring): 45-57.
Champion, H. 1985. Physician heal thyself: One public manager’s view of program evaluation. Evaluation Network, Vol 6 (Feb.): 30-31.
Clarke, W. C. 1990. Learning from the past: Traditional knowledge and sustainable development. The Contemporary Pacific. Vol. 2, No. 2 (Fall): 233-253.
Cronbach, L. 1977. Remarks to the new society. Evaluation Research Society Newsletter 1: 1-3.
Cronbach, L. and Associates. 1980. Toward reform of program evaluation. San Francisco, CA: Jossey-Bass.
Fox, M. G. 1978. Social development planning in Micronesia. Journal of Asian Pacific and World Perspectives, 2 (2, Winter): 1978-79.
Hamnet, M. P.; Porter, D.; Singh, A.; Kumer, K. 1984. Ethics, politics, and international social science research. Honolulu: University of Hawaii Press. Harshbarger, D. 1984. Value added and the evaluator. Evaluation News 5 (2, February): 20-33..
Harwood, R. R. 1979. Small farm development: understanding and improving farming systems in the humid tropics. Boulder, CO: Westview Press.
Johannes, R. E. 1981. Words of the lagoon. Berkeley, CA: University of California Press.
Klee, G. A. (ed.). 1980. World systems of traditional resource management. London: Edward Arnold Publisher.
Littrell, D. W. 1977. The theory and practice of community development. Extension Division University of Missouri-Columbia.
Mason, L. 1982. Growing old in the trust territory. Pacific Studies (Fall): 7. Nevin, D. 1977. The American touch in Micronesia. New York, NY: W. W.
Worton. Patton, M. Q. 1978. Utilization focused evaluation. Beverly Hills, CA: Sage
Publications. Patton, M. Q. 1985. Cross-cultural non-generalizations. In: Patton, M. Q., ed.
Culture and Evaluation, New Directions For Program Evaluation. No. 25. San Francisco, CA: Jossey-Bass.
Sjoberg, G. 1975. Politics, ethics and evaluation research. In: Gutlentag, M.; Struening, E. The Handbook of Evaluation Research (Vol. 2). Beverly Hills, CA: Sage Publications.
Voth, D. E. 1975. Problems in evaluating community development. Journal of Community Development Society 6 (i.Spring): 147-162.
Workman, R. L.; and others 1983. Island voyagers in new quests: An assessment of degree completion among Micronesia college students. Miscellaneous Publication No. 4, Micronesian Area Research Center, University of Guam.
Workman, R. L.; Ginsberg, P. E.; Ziegahn, L.; Long, J. S.; Bhola, H. S. 1987. Applying cultural awareness for useful evaluations of social development. Paper presented at the annual Meetings of the American Evaluation Association. Boston, MA.
USDA Forest Service Gen. Tech. Rep. PSW-GTR-140. 1993. 25

Economics and Agroforestry1
John W. Brown2
Abstract: The concept of sustainability is an underlying theme in much of the literature dealing with the economics of agroforestry. Four major areas of concern for economic investigation into sustainable agroforestry systems― profitability, dynamics, externalities, and markets―are addressed using examples from the available literature. Finally, the social constraints that farmers face when adopting agroforestry technologies are discussed.
Upon examining the literature on the economics of agroforestry, one is struck by two reoccurring themes― sustainability and fanning systems research and extension (FSR/ E). Sustainability is often the justification for much of the work being done in agroforestry. Reid (1989) states that, worldwide, as much as one-half of all forest clearing is done to replace degraded agricultural land. However, the removal of forests is often counterproductive because trees, either used in rotation with other crops or grown concurrently with them, are seen to allow the maintenance of a higher level of soil fertility than continuous monocrop production (Weirsum 1981, Vergara 1987, Kang and others 1989). Farming systems research and extension is frequently recommended as the preferred method in dealing with the complexities of agroforestry systems and with their introduction into complex social systems (Michie 1986, Wallace and Jones 1986).
Sustainability is often a vaguely defined concept (Batie 1989). An example is the definition given by Harwood (1988) as quoted by Francis and Hilderbrand (1989): ... an agriculture that can evolve indefinitely toward greater human utility, greater efficiency of resource use and a balance with the environment that is favorable both to humans and to most other species.
A somewhat better definition is that of the World Commission on Environment and Development (Reid 1989):... meets the needs and aspirations of the present without compromising the ability of future generations to meet their own needs.
Both of these definitions express the basic precept that we should not rob future generations to fulfill our current greed. However, they do not provide much guidance as to how to proceed towards a sustainable agriculture; rather, they are statements of an ethical position. Reganold and others (1990) provide a description of what sustainable agriculture should be: For a farm to be sustainable, it must produce adequate amounts of high quality food, protect its resources and be both environmentally safe and profitable.
This is both a definition of a sustainable farm and a list of conditions which must be met in order for the farm to succeed. The first condition is that the farm must provide adequate amounts of high quality food. This also implies that the farm must satisfy
1 An abbreviated version of this paper was presented at the Workshop on Research Methodologies and Applications for Pacific Island Agroforestry, July 16-20, 1990, Kolonia, Pohnpei, Federated States of Micronesia.
2 Agricultural Experiment Station, College of Agriculture and Life Sciences, University of Guam, Mangilao, Guam 96923.
the demands of its markets. This is true whether the produce is consumed on the farm or if it is sold.
The second condition is that the farm must protect its re-sources, a reference to the dynamic aspect of sustainability. The farm exists not only in the present, but also in the future. The farmer must take into account the usage and stock of his re-sources over time.
The third condition is that the farm must be environmentally safe, a reference to what economists call externalities. Farming systems have effects both on and off the farm. Off-farm externalities, such as sedimentation and chemical pollution of water supplies, must be considered in the social valuation of farming systems. Finally, the farm must be profitable. The farming system must meet the needs of its operators. A farmer does not farm without constraints―societal constraints, the limits of his time, and financial and physical constraints. To be adopted, a farming system (e.g., agroforestry) must meet a farmer’s needs better than alternative systems.
Reganold and others have provided four areas of concern for economic investigation into sustainable agroforestry systems: 1) profitability, the farmer's behavior of optimizing subject to constraints, 2) dynamics (time), 3) externalities and 4) markets. The remainder of this paper will discuss each of these areas.
Profitability Much of the economic research in agroforestry has fo
cused on how to maximize the output of the farm given the physical, financial, and time constraints of the farmer. In contrast, little work has been done to examine how this maximization is affected by the social constraints faced by and values of the farmer.
The most common theoretical approach taken is to start with the development of a production possibilities frontier (PPF) (Filius 1981). Sometimes the PPF is simply labeled as a theoreticcal demonstration of biological competition (Hoekstra 1990). The PPF is drawn with the maximum potential quantity of a crop on one axis and the maximum of a forestry product from the same area on the other axis (fig. 1). A straight line between the two points represents the output combinations of the plot if different fractions of it are used in the production of the two crops. Point A in Figure 1 is the output of a 50-50 mix of the two monocultures. All points on the straight line have a land efficiency ratio (LEF) of one (Vandermeer 1989).
Field trials are then performed using an intercropping system in various combinations, and these points are plotted on the same graph. Points that lie above the straight line are said to have a LER greater than 1.0, and points that lie below the straight line have a LER of less than 1.0. Points with a LER of less than 1.0 indicate that better yields can be obtained by monocropping the area. Finally, the points that form the outer boundary are con-
26 USDA Forest Service Gen. Tech. Rep. PSW-GTR-140. 1993.

Figure 1-The diagramming of hypothetical yield set (after Vandermeer, 1987). The curved line shows the maximum yields under an agroforestry system, and the straight line indicates the maximum yields under various proportions of monocropping
nected, and this is the production possibilities frontier (PPF), or the yield set (Vandermeer 1989).
Several problems exist with this approach. First, a PPF presents only a single set of inputs. If the quantity of labor or of any other input varieties between the trials, the resulting curve is not a PPF. Second, the PPF shown in figure 1 does not show the maximum possible production for each combination of land use. Figure 2 shows that the intercrop can be combined with the monocrop system to give a larger production over part of the range of combinations. Third, if the trials use different combinations of inputs and produce different combinations of outputs, then it cannot be told from a graph such as figure 1 which trial is economically superior for the farmer. Finally, the information requirements for such an approach can overwhelm a research program.
A better way to work with the static (timeless) analysis of production trials is to use the partial budget approach (Etherington and Matthews 1983). A partial budget starts with the current farm condition, and then looks at how changes affect the farm’s budget. It investigates the cost of the change and the benefit to the farmer. It is referred to as a “partial budget” because it does not look at the whole farm budget, but rather examines only the changes in income produced by a change in activities. Hoekstra (1990) discusses some of the valuation questions in assembling partial budgets. In a ICRAF working paper, Hoekstra (1987) lists published sources of information and provides a more through discussion of the methodological issues involved in data collection for economic analysis.
A most important concept in the partial budget is the opportunity cost of a change. For example, in introducing alley crop-ping to a farmer’s corn field, one of the things being given-up is
Figure 2-The production possibilities frontier is the outer convex set of points under all combinations of alternatives including a combination of monocropping and agroforestry.
the corn that could have been grown in the space the trees are now using. This is an opportunity cost. To demonstrate partial budgeting, an example analysis (table 1) on adopting a sorghum-Leucaena alley cropping system in a semi-arid of India (Singh and others 1989) is reproduced here. It is typical of the type of analysis one finds in the literature.
The introduction of Leucaena alleys is considered to be an addition to the current practice of monocropping sorghum. There-fore, the opportunity cost is the sorghum forgone by adopting the sorghum-Leucaena system. Table 1 provides a summary of the partial budget analysis and gives the opportunity cost on top and the gains from alley cropping on the bottom. It appears from this analysis that the net-gain from converting from a sorghum mono-cropping system to the sorghum-Leucaena alley cropping system is 5,015 Indonesian rupiahs (INR) per hectare.
The one weakness in this analysis is that the differences in inputs between the two systems is not taken under consideration. In particular, there is no mention of the differences in labor requirements. Labor is seldom a “free good.” Unless the farmers do not have any alternative use for their labor and they do not value their leisure, then the differences in the labor requirement must be included in the analysis. The analysis would then look as shown in the column of Table 2 headed “year 1.” Here it is assumed that 1) labor is the only input, 2) the farmers value their labor at INR 4 per hour, and 3) sorghum requires 500 hours of labor while alley cropping requires 1000 hours.
With the inclusion of the labor costs, the net-gain from alley cropping is decreased to INR 3015 per year. This is still a considerable increase in income from the introduction of alley farming.
USDA Forest Service Gen. Tech. Rep. PSW-GTR-140. 1993. 27

Table 1-An example partial budget analysis1 Table 2-A hypothetical 5 year project analysis
Yield Price Revenue (t/ha) INR/t INR/ha
Sole crop sorghum Grain 1.55 2250 3488 Stover 5.1 500 2550
Total 6038
Alley croppedsorghum-Leucaena
Grain 1.09 2250 2453 Stover 3.9 500 1950
Fodder, in-season 7.2 250 1800 off-season 3.1 500 1500
Fuel, stems 6.5 300 1950 stumps 3.3 400 1320
Seeds 0.4 200 80
Total 11053
Net gain 5015
1Adopted from Singh and others (1989), using the high, in-season prices for sorghum grain and stover.
Dynamics The second aspect of a sustainable farm are the dynamics or
time dimensions. Often the concept of dynamics is dealt with by adding a third dimension of time to the PPF and showing how the shape of the PPF changes with time (Etherington and Matthews 1983), or it is shown in a plot of how soil status changes over time as the proportion of land used in trees and agricultural crops varies (Huxley 1989). However, again the partial budget approach is much easier to apply.
Table 2 demonstrates how changes in output over time due to different cropping methods are normally compared in a partial budget analysis, by calculating a net present value (NPV). People normally require a reward for postponing gratification. This is why banks pay interest on deposits. An investment in soil fertility is very similar to putting money in a bank. It requires a dividend in the future for one to make the deposit and forgo current consumption. The amount of dividend is measured by the use of a discount rate. This is the “interest rate” which farmers use to compare present and future consumption.
If the farmers discount rate is r, then the promise of one dollar n-years in the future is worth 1/(1 + r)n to the farmer now. For example, at 20 percent, 100 dollars five years from now is worth $100/(1.20)5 or $40.19 now. In other words, if $40.19 were put in the bank now at twenty percent interest, it would be worth $100.00 five years from now.
To complete table 2, it is assumed that the investment in ally cropping in the example requires 1) an investment of INR 10,000
Year 1 Year 2 Year 3 Year 4 Year 5 Sorghum
Total revenues 6038 6038 6038 6038 less input costs 2000 2000 2000 2000 2000
net-income 4038 4038 4038 4038 4038
Sorghum-Leucaena Total revenues 11053 3 11053 11053 11053 Less input costs 4000 4000 4000 4000 4000
net-income 7053 7053 7053 7053 7053
Net-gain from adopting alley 3015 3015 3015 3015 cropping
Discount formula 1/1.20 1/1.202 1/1.203 1/1.204 1/1.205
Discount factor 0.833 0.694 579 482 0.402
Present Value 2511 2092 1746 1453 1212
Total present value 9014
Total present cost 10000
Net present value -986
6038
1105
3015
0. 0.
per hectare in the year before cropping begins, 2) the discount rate the farmers use is 20 percent, and 3) the project’s benefits last for 5 years. Economists at the CIMMYT have found that a 40 percent return is the minimum general rate that small farmers will accept (Harrington 1982). However, this figure is not uniformly accepted. The discount rate used by farmers is a suitable subject for research.
In table 2, each of the net-gains have been discounted back to year zero, the year of the first investment. The total present value of the net-gains is then calculated as the sum of the discounted values from each year. This totals to a present value of INR 9,014. The costs of the project in year zero are not discounted as they occur at the beginning of the project. Thus, the net present value (NPV) is the difference between the present values of the costs and of the benefits or a negative INR 986. In this example, the farmer would not undertake the project. If the project produced a sixth year of benefits, then it would have a positive NPV, and the farmer might consider it more favorably.
This example demonstrates one of the problems of sustain-able agriculture. Unless the NPV of all future gains due to the increases in soil fertility exceeds the gains from mining the soil in the present year, the farmers most likely will not adopt sustainable agriculture practices.
Externalities The third component of sustainable agriculture is the social
or external aspects. Generally, these are the most difficult class
28 USDA Forest Service Gen. Tech. Rep. PSW-GTR-140. 1993.

of effects to value economically. They include such things as protection of the reef and fisheries, avoiding pollution of the water supply, and building food reserves for the community in case of a crop failure or a natural disaster (e.g., a typhoon). The general concept is that society should be willing to make an investment in preventing the effects of non-sustainable agriculture systems that occur off the farm. The criteria and calculations are the same as for the farmer in that the present value of the gains must exceed the present value of the costs over the life span of the project. The difficulty usually lies in valuing the changes produced by the proposed projects (e.g., a decrease in the pesticide level in drinking water).
Vogel (1989) discusses the implications of increasing the scale of the economic analysis from the farm level to a broader social perspective, however his discussion does not cover the inclusion of externalities. Daru and Tips (1985) discuss the social and economic factors affecting farmer participation in a watershed management and agroforestry intensification project in Java which was designed to deal with these externalities, but they do not analyze the costs or benefits. In fact, in the literature it appears that few examples of this type of analysis have been applied to agroforestry projects. Further, a more complete analysis of the methodology is beyond the scope of this paper.
Markets The fourth area of sustainability is markets. Reeves (1986)
claims that “marketing is arguably the most neglected issue in farming systems research.” Marketing often receives a token amount of attention during the initial survey phase of project, but then little attention is paid to it afterwards (Reeves 1986).
Marketing includes everything that is done to the product from the time that it is harvested to the time that it is consumed. Reeves’ study deals with the choice of marketing channels made by small grain farmers in the Western Sudan. It is useful in its demonstration of the partial budget approach, and how the bud-get is affected by the prices received through differing marketing channels. It also deals with the reasons why the farmers use the different channels even though the price that they receive varies considerably with the choice of marketing channel used. Reeves is an economic anthropologist, and his approach is a good example of the mixing of scientific disciplines.
Other marketing considerations would include: 1) the avail-ability of shipping and storage facilities, 2) the seasonal and year to year price changes that affect farmers and their risks, and 3) the desirability of the product in the market. The problem of consumer acceptance has led to the downfall of many wellintentioned projects.
Social Constraints Finally, consideration must be given to the individual and
social constraints that farmers adopting agroforestry may have to face, and the possibility that producers may have goals other
than profit maximization. Olofson (1985) surveyed farmers using traditional agroforestry techniques in the Philippines. Among the constraints that he found modifying the farmers’ behavior were: 1) age of the farmer, 2) lack of available family labor to the farmer, 3) prior erosion, hardpanning, and steepness of individual plots, 4) distance to individual plots and the relative weight of the different potential crops, 5) prior cropping patterns on borrowed land that needed to be continued, and 6) the lack of a draft animal which required borrowing an animal and its owner, and returning a favor later.
Francis (1989) investigated land tenure systems and how they affected the adoption of alley farming in Nigeria. He found that the ownership of land and the right to plant trees did not necessarily coincide and that these tenure systems “are crucial in determining the acceptability and viability of alley farming.”
Rocheleau (1987) divides the management of farming tasks into three areas: control of the resource, responsibility to provide a product, and labor for the tasks. She points out that the division of these between family members will vary among the multiple areas of a farmstead. In fact this distinct division among multiple users within a “family unit” can extend to a single tree species which may provide differing resources to each family member.
Economists recognize that farmers may not be maximizing profits. The most common alternative thesis is that the farmers are maximizing their expected utility under conditions of uncertainty. This is simply a way of dealing with the risks facing farmers and with the fact that they are frequently observed not maximizing expected profits.
There has been little study of multiple goals such as subsistence, status, leisure, and cash flow management. Barnett and others (1982) tested a multi-objective, goal-programming model in attempting to explain the behavior of Senegalese subsistence farmers. They concluded that it did not offer any better predicttive power than did the profit-maximizing hypothesis.
Conclusions In conclusion, most economic analysis of agroforestry
systems has been descriptive. Where quantitative analysis has been done, most have taken the form of partial budget analysis. In the area of general economic analysis of agricultural development, the inclusion of risk-avoiding behaviors by farmers has been a response by economists based on the observation that farmers do not always adopt high yielding cultivars. The dynamic aspects of agroforestry and sustainable agriculture have not been given as much quantitative analysis as they deserve. Little quantitative work has been done in the area of externalities and agroforestry, although there has been some work by environment economists dealing with agricultural externalities. Social system constraints have mostly been dealt with by anthropologists. Finally, economists need to develop better methods to deal with multiple goals of farmers who operate partially or largely outside of the market system.
USDA Forest Service Gen. Tech. Rep. PSW-GTR-140. 1993. 29

References Barnett, D.; Blake, B.; McCarl, B.A. 1982. Goal programming via multidi
mensional scaling applied to Senegalese subsistence farms. American Journal of Agricultural Economics 64(4):720-727.
Batie, S.S. 1989. Sustainable development: challenges to the profession of agricultural economics. American Journal of Agricultural Economics 71(5):1083-1101.
Daru, R.D.; Tips, W.E.J. 1985. Farmers participation and socio-economic effects of a watershed management programme in Central Java (Solo river basin, Wiroko watershed). Agroforestry Systems 3(2):159-180.
Etherington, D.M.; Matthews, P.J. 1983. Approaches to the economic evaluation of agroforestry farming systems. Agroforestry Systems 1(4):347-360.
Filius, A.M. 1981. Economic aspects of agroforestry. In: Wiersum, K.F., ed. Viewpoints on agroforestry. Agricultural University Wageningen, The Netherlands; 47-73.
Francis, C.A. 1989. Farming systems research-extension and the concepts of sustainability. Farming Systems Research Extension Newsletter No. 3:6-11.
Francis, P.A. 1989. Land tenure systems and the adoption of alley farming. In: Kang, B.T.; Reynolds, L., eds. Alley farming in the humid and subhumid tropics, Proceedings of a workshop; Ibadan, Nigeria, March 10-14, 1986. IDRC, Ottawa, Canada; 182-194.
Harrington, L. 1982. Exercises in the economic analysis of agronomic data. Economic program working paper, CIMMYT, Mexico City.
Harwood, R.R. 1988. History of sustainable agriculture: U.S. perspective. In: Proceedings of the International conference on sustainable agricultural systems. Columbus, OH: Ohio State University.
Hoekstra, D. A. 1987. Gathering socio- and bio-economic information for agroforestry projects. ICRAF, ICRAF working paper no. 50. Nairobi, Kenya. 26 p.
Hoekstra, D.A. 1990. Economics of agroforestry. In: MacDicken, Kenneth G.; Vergara, N.T., eds. Agroforestry, classification and management. ICRAF, Nairobi, Kenya. New York, NY: Wiley; 310-331.
Huxley, P.A. 1989. Hedgerow intercropping: some ecological and physiological issues. In: Kang, B.T.; Reynolds, L., eds. Alley farming in the humid and subhumid tropics. Proceedings of a workshop, Ibadan, Nigeria, March 10-14,1986. IDRC, Ottawa, Canada; 208-218.
Kang, B.T.; van der Kruijs, A.C.B.M.; Couper D.C. 1989. Alley cropping and food production in the humid and subhumid tropics. In: Kang, B.T.; Reynolds, L., eds. Alley farming in the humid and subhumid tropics. Proceedings of a workshop, Ibadan, Nigeria, March 10-14, 1986. IDRC, Ottawa, Canada; 16-26.
Michie, B.A. 1986. Indigenous technology and farming systems research: agroforestry in the Indian desert. In: Jones, J.R.; Wallace, B.J., eds. Social sciences and farming systems research. Boulder, CO: Westview; 221-244.
Olofson, H. 1985. Traditional agroforestry, parcel management, and social forestry development in a pioneer agricultural community: the case of Jala-Jala Rizal, Philippines. Agroforestry Systems 3(4):317-337.
Reeves, E.B. 1986. Getting marketing into farming systems research: A case study from the Western Sudan. In: Jones, J.R.; Wallace, B.J., eds. Social sciences and farming systems research. Boulder, CO: Westview; 100-122.
Reganold, J.P.; Papendick, R.I.; Parr, J.A. 1990. Sustainable agriculture. Scientific American 262:112-120.
Reid, W.V.C. 1989. Sustainable development lessons from success. Environment 31(4):7-9, 29-35.
Rocheleau, D.E. 1987. The user perspective and the agroforestry research and action agenda. In: H.L. Gholz, ed. Agroforestry: Realities, possibilities and potentials. Dordrecht, The Netherlands: Martins Nijhoff Pub.; 59-87.
Singh, R.P.; Van den Beldt, R.J.; Hocking, D.; Korwar, G.R. 1981. Alley farming in the semi-arid regions of India. In: Kang, B.T.; Reynolds, L., eds. Alley farming in the humid and subhumid tropics. Proceedings of a workshop, Ibadan, Nigeria, March 10-14, 1986. IDRC. Ottawa, Canada; 108-122.
Vandermeer, J. 1987. The ecology of intercropping. Cambridge: Cambridge University Press; 237 p.
Vergara, N.T. 1987. Agroforestry: a sustainable land use for fragile ecosystems in the humid tropics. In: Gholz, H.L., ed. Agroforestry: Realities, possibilities and potentials. Dordrecht, The Netherlands: Martinus Nijhoff Pub.; 7-20.
Vogel, W.O. 1989. Economic returns to alley farming. In: Kang, B.T.; Reynolds, L., eds. Alley farming in the humid and subhumid tropics. Proceedings of a workshop, Ibadan, Nigeria, March 10-14, 1986. IDRC. Ottawa, Canada; 196-207.
Wallace, B.J.; Jones, J.R. 1986. Social science in FSR: Conclusions and future directions. In: Jones, J.R.; Wallace, B.J., eds. Social sciences and farming systems research. Boulder, CO; 263-281.
Wiersum, K.F. Outline of the agroforestry concept. In: Wiersum, K.F., ed. Viewpoints on agroforestry. The Netherlands: Agricultural University Wageningen; 1-21.
30 USDA Forest Service Gen. Tech. Rep. PSW-GTR-140. 1993.

Future Networking and Cooperation Summary of Discussion1
Roger R. Bay2
Abstract: At the end of the workshop, I led a lightly structured and informal discussion concerning methods of continuing and improving communications and cooperation among workshop participants. The group specifically ad-dressed three areas: maintaining informal one-on-one direct contacts, improveing the use of the ADAP computer system for mail, and the desirability of starting an informal newsletter about agroforestry activities in the Pacific. In addition, the group briefly discussed opportunities for cooperative studies.
Informal, Direct Contacts Most participants felt that the workshop provided the op
portunity for individuals from many islands with agroforestry interests to become better acquainted with current activities and individual interests. Now, it is the responsibility of the individuals to continue these contacts, not only between islands but also within island agencies and college staff. With ADAP, many of the same people are involved with other task forces and work-shops, which can afford opportunities to continue dialog about forestry matters.
Computer Mail ADAP colleges currently are linked with a computer system
used to transmit messages and short papers between colleges. Within the ADAP area, Palau may soon be linked to the College of Micronesia and their ADAP computer, thus expanding the network. Participants agreed that it is particularly important to make greater use of this system of E-mail since it is available in each college office. Eventually, this should also facilitate the exchange of data as more joint and cooperative studies are started. College staff need to recognize the opportunity to inter-act with agency staff and explore the possibility using E-mail for communication with agencies.
1 An abbreviated version of this paper was presented at the Workshop on Research Methodologies and Applications for Pacific Island Agroforestry, July 16-20, 1990, Kolonia, Pohnpei, Federated States of Micronesia.
2 Consultant, College of Tropical Agriculture and Human Resources, University of Hawaii, Honolulu, Hawaii 96822.
Newsletter The advantages and disadvantages of starting an ADAP
agroforestry newsletter were discussed for some time. Most participants were supportive of the effort and felt that the news-letter would serve an excellent network device. Bill Raynor, College of Micronesia, volunteered to spearhead the effort from Pohnpei. Craig Whitesell and Tom Cole offered the help of their Pacific Southwest Research Station office of the Forest Service for support. The group agreed to accept these offers of help and to support the effort with appropriate contacts at the various islands. ADAP agroforestry task force members should be the principal contacts in their respective areas. The island forestry and agriculture agencies, particularly those located on islands or states away from college locations, should also be able to pro-vide information. Dr. Mareko Tofmga, from the University of the South Pacific, Western Samoa, volunteered as a key contact to the USP system. Participants were urged to continue their support by providing written information about their respective island activities in agroforestry as the newsletter develops. The first edition is expected in a few months.
Future Cooperative Programs The earlier discussion on agroforestry needs and priorities
noted that one of the high priority programs recommended by the ADAP task force on agroforestry consisted of a regional project to document indigenous agroforestry systems in the American Pacific. Many participants supported the general concept of documenting the existing systems before the expertise and experience of local farmers is lost. However, it was also emphasized that the cooperation of local college and agency people was highly important to such an effort. Also, state legislative bodies and the governors office should be asked about the need on a local basis. Any kind of a regional project must be sensitive to local traditions and social customs involving private and village lands and activities. The support of the individual island entities would be needed for any such regional effort to be fully successful.
USDA Forest Service Gen. Tech. Rep. PSW-GTR-140. 1993. 31

A Review of Traditional Agroforestry in Micronesia1
Harley I. Manner2
Abstract: For the many Micronesian islands, agroforestry was a sustainable land use system, and an integral component of the traditional subsistence system which provided the people with many of the necessities of life. Given the increasing pressures on limited land resources, the social and environmenttal problems associated with modern agriculture, particularly its use of pesticides and fertilizers, greater attention is being paid to agroforestry as a low-input sustainable agricultural system, appropriate to Micronesia and the rest of the Pacific. Unfortunately, relatively little detailed information exists on agroforestry systems. This paper is an overview of the agroforestry systems of Micronesia. It suggests that Micronesians developed a range of sustainable agroforestry technologies and systems appropriate to their varied socio-environmental contexts, systems which have applicability in today's Micronesia.
The geographic region of Micronesia is located approximately between 131.10°E and 176.54°E longitude and 20.33°N, and 2.39°S latitude and encompasses an oceanic area of slightly more than 7 million km2 (Karolle 1988). The total land area, by contrast, amounts to only 2,707 km2. Politically, Micronesia includes the Federated States of Micronesia (Kosrae, Pohnpei, Truk, Yap, and their affiliated atolls in the Caroline Islands), the Republic of the Marshall Islands, the Commonwealth of the Northern Marianas, the Territory of Guam, Republic of Palau, and the independent states of Kiribati, Tuvalu, and Nauru.
Within the region there are high volcanic islands, low coral limestone-based atolls, and more geologically complex islands. Soils range from deeply weathered oxisols on the high islands to entisols, particularly the psamments of the atolls. Average temperatures are in the mid-80s, while rainfall ranges between 1000 to more than 4000 mm per annum, depending on geographic location and elevation. The lowest rainfall totals are found to the east and south of the Marshall Islands in the “arid” Pacific, while most of the high islands receive adequate totals because of orographic effects. Tropical rainforest is the natural vegetation of the moister high islands, while a strand and salt tolerant woodland predominates on the atolls.
Agroforestry Defined While many definitions of agroforestry have been proposed
(for example, see Wiersum 1981), for this discussion, agroforestry is defined as
... any form of permanent land use which combines the production of agricultural and/or animal products and tree crops and/or forest plants simultaneously or sequentially on the same unit of land, which aims at optimal sustained, multiple purpose production under the beneficial effect of improved edaphic and micro-climate conditions provided by simulated forest conditions, and management practices which are compatible with the cultural practices of the local population (Wiersum 1981, p. 6).
Given this definition, it will become apparent that most if not all of the traditional agricultural systems of Micronesia are, indeed, agroforestry systems.
The systems of agroforestry in Micronesia include the more permanent and stabilized systems of wetland taro agriculture, mixed tree gardening, backyard or kitchen gardens, and intermittent (shifting cultivation) tree gardening and open canopy culture (OTA 1987). On many Micronesian islands, more than one agroforestry system was used for the production of food and other necessities in conjunction with mangrove, reef, and ocean exploitation.
Mixed Tree Gardening The tree garden or agroforest, consisting of a wide range of
cultivated and naturally occurring annual and perennial species, is a widely distributed and permanent form of traditional agroforestry in Micronesia (OTA 1987, Falanruw and others 1987, Raynor 1989) which provided Micronesians with an abundant supply of different tree crops and agricultural products from marginal lands. As indicated in table 1, these agroforests cover considerable areas of the high Micronesian islands.
The composition and structure of these forest gardens vary with habitat and island. Along the coast, these tree gardens are relatively simple (consisting of few species) and dominated by coconuts, while higher slopes are dominated by breadfruit. In Truk and Pohnpei, breadfruit is a dominant species of mixed tree
Table 1-Land-use classes in Micronesian high islands
Item Palau Kosrae Pohnpei Chuuk1 Yap
.................................Hectares ..........................
Forest
Secondary Forest and Vegetation
Agroforest Agroforest Agroforest with coconuts Coconut plantation
Total Agroforest Nonforest ,
Total area
28093
594
8
179 743
930 8285
37062
7066
1272
1659
926 ―
2585 263
11186
19683
1843
1945
9796 124
11865 2102
35493
986
252
66
2312 ―
2378 554
4170
3882
553
1515
864 159
25382743
9716
Sources. Kosrae: Whitesell and others 1986. Palau: Cole and others 1987. 1 An abbreviated version of this paper was presented at the Workshop on Pohnpei: McLean and others 1986. Truk: Falanruw and others 1987. Yap:
Research Methodologies and Applications for Pacific Island Agroforestry, July Falanruw and others 1987. 16-20, 1990, Kolonia, Pohnpei, Federated States of Micronesia. 1Chuuk data is for the high islands of Weno, Dublon, Fefan and Eten only.
2 College of Arts and Sciences, University of Guam, Mangilao, Guam 96923.
32 USDA Forest Service Gen. Tech. Rep. PSW-GTR-140. 1993.

gardening (Goodenough 1951, Raynor 1989). Raynor (1989) recorded 131 varieties of breadfruit on Pohnpei. On the steep and stony slopes of Pohnpei Island, trees and other food plants are grown in pockets of soil located between a pavement of boulders and large stones. These gardens are characterized by an upper canopy of breadfruit, coconuts, and other food trees; a secondary canopy of bananas and Piper methysticum; and a ground cover of Cyrtosperma, Colocasia, and Alocasia taros, and pineapple. Each breadfruit tree may also support between two to four yam vines (Dioscorea spp.). A detailed description of the composition and structure of Pohnpeian agroforests is found in Raynor (1989). On Guam, breadfruit, coconuts, and Cycas circinalis (fadang) were harvested from the mixed tree gardens. In Palau, these mixed forests or chereomel, contain timber trees, coconuts, mango, breadfruit, Terminalia catappa, and Inocarpus edulis (McCutcheon 1981). These agroforests are also sources of traditional medicines and other culturally valued products, building materials and firewood, and a habitat for feral and domestic animals.
On atolls, the pattern of agroforestry is arranged in zones and reflects the distribution of natural vegetation and the severity of environmental constraints (wind-generated salt spray, wave damage, saline ground water, and drought). The shores and beaches contain a sparse, salt tolerant herbaceous cover, backed by a fringing vegetation of shrubs and low trees which serve as a windbreak and buffer against hurricane-generated waves and salt spray. Species commonly found in this zone are Scaevola taccada, Cordia subcordata, Tournefortia argentea, Pandanus tectorius, Soulmea amara, and Guettarda speciosa. Moving inland, this fringing vegetation gives way to a taller strand forest, then a less salt tolerant, mixed mesophytic forest, a marsh or swamp forest in the central depression, and on the lagoon shore of the islet, a mesophytic-halophytic beach forest. Commonly found tree species of the strand and mixed mesophytic forests include Pandanus tectorius, Pipturus argenteus, Calophyllum inophyllum, Pisonia grandis, Morinda citrifolia, and Premna obtusifolia. On the larger islets, the strand forest is planted to coconuts, while the mesophytic forest is planted to both coconuts and breadfruit. The interior of the islet is often described as a breadfruit dominant zone, and as breadfruit is intolerant of salt, it is less commonly found on small and inter-mediate sized islets. In terms of percentages, coconut dominant woodlands and agroforests cover 50-70 percent of an atoll’s area; mixed coconuts and breadfruit agroforests cover 30 per-cent; and the breadfruit dominant agroforests cover less than 10 percent. On the larger islets of Arno Atoll, Marshall Islands, coconut agroforests covered 69 percent of the area at a density of 95 trees per 0.4 ha; coconut and breadfruit agroforests cover 9 percent of the area at a density of 15 to 30 breadfruit trees per 0.4 ha (Anderson 1951, Hatheway 1953).
Many other trees and food plants are found in these agroforests. Understory species of the atoll agroforests include Pandanus tectorius, Tacca leontopetaloides, Carica pa-paya, Crataeva speciosa, Musa spp., Syzygium malaccensis, Alocasia macrorrhiza, Xanthosoma brasiliensis, Mangifera indica, Ixora casei, Morinda citrifolia, Ananas cosmosus, and Capsicum frutescens to name a few. While the focus of pro
duction is either the coconut or breadfruit, there is a substantial though yet unquantified cultivation of Alocasia macrorrhiza, Xanthosoma brasiliensis, bananas, and other food crops. Many other species of the agroforest are important as sources of timber, medicines, ornamentals, or other culturally useful product. Pigs and chickens are allowed to forage, and birds and crabs are hunted in these agroforests.
Intermittent Tree Gardening Intermittent tree gardening, also known as slash-and-burn
cultivation, shifting cultivation, and swiddening, is practiced in secondary forest fallows on all the high islands of Micronesia. Structurally and functionally, this system of landuse is little different from the systems described for the other parts of the Pacific region, except that in Kosrae, burning was not used in garden clearing (Wilson 1968). Unlike the agroforests or mixed tree gardens described above, intermittent tree gardening is an impermanent form of land use that involves the short-term cultivation of crops in forest clearings and their abandonment to fallow after one to two years of production. Garden site abandonment results in succession to forest, the regeneration soil fertility and tilth, and the decrease of crop pests and diseases. Coconut and breadfruit trees are often planted in these sites and may be bearing when the site is again cleared for a garden, 15 to 40 years later.
As in the agroforests, a wide range of annual and perennial crops are grown in these gardens, but under different light and space conditions. More than 30 varieties of yams are grown in Yap for ceremonial presentation or subsistence consumption (Hunter-Anderson 1984). Bascom (1946) listed 156 Pohnpeian varieties. Recently, Raynor (1989) recorded 178 cultivars of yams but only 10 and 8 varieties of the lesser important Colocasia esculenta and Alocasia sp. respectively on Pohnpei. Other important agroforest species, for which there are many cultivars, are bananas, Piper methysticum (sakau), Alocasia macrorrhiza, Cyrtosperma chamissonis, Colocasia esculenta, sugarcane, Hi-biscus esculenta, cassava, and sweet potatoes. Wilson (1968) recorded 8 varieties of coconuts, 26 of Musa spp., 13 of Colocasia esculenta, 14 of Cyrtosperma chamissonis, and 25 ofArtocarpus altilis on Kosrae. The many cultivars found in the intermittent and mixed tree gardens differed in their seasonality, productiveity, resistance to drought and other environmental constraints, and thus provided Micronesians with a fairly continuous supply of staple foods throughout the year.
Not much is known about the traditional intermittent agroforestry practices of Guam and the Northern Marianas. Underwood (1987) wrote that prior to the Spanish arrival, the Chamorros were mainly dependent on the ocean and by hunting for fruit bats, birds and land crabs. While slash and bum cultivation was practiced, the cultivation of root crops was rudimenttary. However, by the end of the 19th century, subsistence agriculture on the ranch or “lancho” became accepted as the Chamorro way of life (Underwood 1987). With modernization and development, most of these lanchos are now located in southern Guam, consisting of a “simply built cooking and sleeping house surrounded by food trees, chickens, pigs, and gardens”
USDA Forest Service Gen. Tech. Rep. PSW-GTR-140. 1993. 33

(OTA 1987). Presently, few of these lanchos are cultivated without the use of fertilizers or pesticides, and burning of the short fallow forest is rarely practiced because of the difficulty in obtaining burning permits.
In the Northern Marianas islands, lanchos are more difficult to find because of the impacts of economic growth, division of family lands, food stamp programs, population increases (OTA 1987, Sproat 1968), and the early development of agricultural exports. For example, during the Japanese administration of the Northern Marianas, traditional subsistence agriculture was largely replaced by sugarcane plantations. During the 1930s, sugarcane was grown on more than 80 percent of the arable laud area on the islands of Rota and Saipan.
Kitchen and Backyard Gardens Kitchen (or dooryard) gardens, and backyard gardens are
common features of most households throughout Micronesia. These gardens provide villagers a nearby source of food, fruit, spices, herbs, flowers, and medicinal plants. In urban house-holds and villages, these agroforests supplement the wage in-come. Common fruit trees are Annona muricata, Psidium guajava, coconuts, breadfruit, bananas, and various species of citrus. Cananga odorata, Plumeria rubra and Plumeria obtusa, Hibis-cus hybrids, Cordyline fruticosa, and Codiaemum variegatum and other ornamental trees and shrubs, some which have ritual or ceremonial significance, are other common introduced components of kitchen gardens of the high and low islands of Micronesia. Colocasia esculenta, Cyrtosperma chamissonis, Alocasia macrorrhiza, and cassava (Manihot esculenta) are fairly common undergrowth species. In the Central Carolines, Crataeva speciosa has special importance (Sproat 1968).
In Guam, Averrhoa bilimbi (“pickle” tree), Averrhoa carambola, mango, coconuts, Carica papaya, Annona muricata, Capsicum frutescens, Bixa orellana, Citrus spp., Jatropha integerrima, Cycas circinalis, Plumeria rubra, P. obtusifolia, Araucaria excelsa and Dracaena marginata are found in many houselots. Piper betle, Areca catechu, Citrus mitis, and Muntingia calabura are common trees found in many Palauan households (McCutcheon 1981).
Wetland Taro Cultivation Throughout the Pacific, taro, particularly Colocasia esculenta
and Cyrtosperma chamissonis, are important staple and ritual foods. In the Micronesian islands, Colocasia esculenta is the favored aroid in Palau (McCutcheon 1981, Kramer 1929, Sugiura 1942) and Pohnpei (Hunter-Anderson 1984), while Cyrtosperma chamissonis (lak) is preferred in Yap (Hunter-Anderson 1984) and Truk (Alex 1965).
In Micronesia, the bulk of taro production of Colocasia esculenta and Cyrtosperma chamissonis taros takes place in permanent to semi-permanent lowland patches. On the high islands, the favored areas for the wetland cultivation of taro are the freshwater swamps and marshes located inland of the man-groves, and the alluvial bottomlands. Areas selected for planting are cleared of vegetation and drained. The soil is then dug up,
and various leaves, twigs, and seagrasses are added as a mulch to increase soil fertility (OTA 1987). In Palau, the leaves of Wedelia biflora, Carica papaya, and Macaranga sp. are favored fertility enriching species (Sugiura 1942). The patch is then worked to produce a fertile muck of desired consistency, and planted with cormels or corm tops. Harvesting occurs six months or later, depending on the species (Colocasia esculenta or Cyrtosperma chamissonis) and varieties planted, and the purposes for which the taro was planted. For example, some varieties of Cyrtosperma chamissonis are grown for prestige and ritual presentations, and may remain in the patch for 10 years or more. In the main, however, Cyrtosperma taro is grown for consumption, and harvested within a few years of planting. The patch is almost immediately replanted, but allowed to lie fallow for a number of years if taro yield and quality was poor. Often certain tree species (for example, Hibiscus tiliaceus in Pohnpei and Puluwat Atoll) are left standing so as to provide shade for the young taro.
In the atolls, by contrast, both Colocasia and Cyrtosperma taros are planted in pits located near the centers of the larger islets where the hydrostatic freshwater lens is the thickest, the water is low in salinity, and the possibility of wind-driven salt spray and water contamination from storm waves is low. On Kapingamarangi Atoll, the taro pits are found on islets greater than 3.8 ha in size (Wiens 1962), and are absent on the smaller islets as the freshwater lens is poorly developed or absent. On these islets, coconuts and breadfruit are the principal tree food crops. In Kiribati, Cyrtosperma is planted in “bottomless basket” made from Pandanus or coconut leaves, and covered with layers of chopped leaves and soil (Lambert 1982). Preferred compost leaves are Guettarda speciosa, Tournefortia argentea, Artocarpus altilis, Boerhaevia sp., Wedelia biflora, Triumfetta procumbens, Cordia subcordata, Hibiscus tiliaceus, and Sida fallax. The Cyrtosperma is composted with leaves at least four times a year until it is harvested two to three years after planting.
The taro pits are of variable size. In the Marshall Islands and Ulithi Atoll, many of the pits are small and less than 100 m2, while in Kiribati, they are approximately 20 m x 10 m and 2 to 3 m deep (Lambert 1982). In Mwoakilloa, Kapingamarangi, Nukuoro (Wiens 1962), Losap and Puluwat (Manner 1989), they are, several hectares in size, the result of continued excavation and coalescence over time.
On Puluwat Atoll, Colocasia and Cyrtosperma taro are also planted on oval mounds which have been built in the excavated depressions. These mounds, which stand about 0.5 m above the water table and measure about 50 m2 in area, are made by anchoring coconut and pandanus trunks to form an oval base which is then filled with organic materials (Manner 1989). Plaited coconut fronds and carefully layered coconut husks are also used to keep the mound from eroding. In addition to taro, sugar cane, ornamental and other food plants (for example, Ipomoea aquatica and bananas) are grown on these mounds. In Kapingamarangi, limes, breadfruit, bananas, papayas, Tacca leontopetaloides, and other cultivated plants are grown in association with Cyrtosperma taro (Wiens 1962). Wiens (1964) noted that Cyrtosperma planted near the pit edges and in the shade of the trees were taller and more vigorous, while those planted in the middle of the taro field were smaller and yellowish brown.
34 USDA Forest Service Gen. Tech. Rep. PSW-GTR-140. 1993.

Fallowing and mulching of the mounds and pits are common agroforestry practices. On Losap Atoll, the Cyrtosperma pits are alternately mulched with a layer of coconut fronds and Digitaria violescens. On Namoluk Atoll, the leaves of Wedelia biflora was used as a mulch for Colocasia taro (Marshall 1975). On Puluwat, fallowed and cultivated mounds were repaired with fresh organic litter and organic soils sieved from the water.
On Ulithi Atoll, Cyrtosperma and Colocasia taro are also grown hydroponically in abandoned landing barges, metal and concrete tanks, the latter measuring 2.64 m x 6.1 m x 0.8 m (l x w x h), and 0.1 min thickness. Little is known about these systems.
Agricultural mounds and terraces were also cultivated for long periods of time in the Micronesian high islands. In Pohnpei, earthen mounds and hillside terraces, with or without stone facing, are used to grow bananas, coconuts, Piper methysticum and Alocasia macrorrhiza (Hunter-Anderson 1987).
Discussion and Conclusion This review demonstrates that Micronesians developed a
range of agroforestry systems capable of sustainable food production in widely differing ecosystems on high and low islands. Polyculture and the cultivar diversity (which minimized the impacts of seasonality and varietal failure) in the mixed agroforest, wetland taro fields, intermittent tree gardening, and the kitchen garden provided the islanders with a variety and perhaps surplus of foods throughout the year. Except in too few cases (for example, Bayliss-Smith 1982, and Raynor 1989), these systems have been incompletely studied. Little is known of the productivity of these systems, their contribution to the subsistence (and commercial) economies of the islands, and the structure (for example, species composition) and functioning (productivity, mineral transfers, successional dynamics) of these systems. Although these systems have been classified as sustainable, energetically efficient, and conservative of environments, there is little quantitative proof for these assertions.
The significance and practice of agroforestry in Micronesia is constantly changing. During the 19th century, the introduction of the copra and coconut oil trade resulted in the clearance of natural vegetation and agroforests for coconut plantations, and with the replacement of the subsistence economy by cash, the availability of trade goods, rice and flour, and depopulation of the atolls, taro patches were abandoned or converted to coconut plantations on many atolls and islands (Doty 1954, Hatheway 1953). World War lI also changed the value of agroforestry as labor migrated to wage employment opportunities, a process that continues to this day as migration from small to large islands and even larger continents is a viable alternative to remaining at home (Connell and Roy 1989).
Pohnpei is home to communities of atoll islanders from Kapingamarangi, Ngatik, Mortlocks, Pingalap, and Mwoakilloa. While it has been suggested that migration has economic and social consequences for the migrants who have formed new communities, and those who remained behind, there are few empirical studies on the impacts of migration on the agroforestry systems of these atolls, Pohnpei, and the other large islands of Micronesia. A few questions may be useful at this point, in
setting an appropriate research agenda. For example, as migration is male-dominated, is the agricultural burden on atoll women or an aging atoll population increased? To what extent is the loss of traditional skills and knowledge in agroforestry attributable to migration? Or, how has the flow of remittances and the easier access of tinned and other foods affected the productivity of agroforestry systems? Needless to say, the agroforestry systems of the above atoll communities on Pohnpei and elsewhere are largely unknown.
The processes of change are also evident in the wetland taro patches of the high islands of Micronesia, where there is less wetland taro cultivation today than in the past (Hunter-Anderson 1984). In Palau, most, if not all, Colocasia taro was formerly grown in wetland patches. Today most taros are planted in the intermittent tree gardens (dechel) (McCutcheon 1981), and the abandonment of wetland taro cultivation has also been reported for Moen, Truk by Hunter-Anderson (1987). Reasons for the abandonment of wetland taro include the higher labor and time costs of production, altered consumption patterns (in particular, the increasing dependence on imported starches), typhoon and pest damage to taro, government encouragement of cassava and sweet potatoes production to alleviate the shortage of Colocasia (McCutcheon 1981), the time and labor constraints associated with an urban lifestyle (Hunter-Anderson 1984)), and the attracttiveness of modernization.
For Guam and the Commonwealth of the Northern Marianas, traditional agroforestry seems to be restricted to the kitchen or backyard garden. For the rest of Micronesia, it is still the most important, sustainable land use option. Hopefully, ADAP’s interest in sustainable agriculture will provide the impetus for further research and education in agroforestry, as the agroforestry systems of Micronesia are indeed, sustainable. The agroforestry systems of the atolls are a case in point. Despite the poorly developed and often brackish ground-water resources, susceptibility to drought, hurricanes, and salt spray, infertile soils, and limited land area and plant resources, atoll agroforestry (and the exploitation of marine resources) have sustained atoll dwellers for millennia. We can only learn from studying it.
References Alex, K. K. 1965. Taro and its relatives in Truk. Field Training and Inter-
change in Root Crops, Koror, Palau. Sept. 25 - Oct. 15, 1965. Unpublished report.
Alkire, W. H. 1974. Native classification of flora on Woleai Atoll. Micronesica 10:1- 5.
Anderson, D. 1951. The plants of Arno Atoll. Atoll Research Bulletin 7: 1-4 & i - vii.
Bascom, W. R. 1946. Ponape: A Pacific economy in transition. U. S. Commercial Company Economic Survey Of Micronesia, Honolulu.
Bascom, W. R. 1948. Ponapean prestige economy. Southwestern Journal of Anthropology 4: 211 - 221.
Bayliss-Smith, T. P. 1982. The ecology of agricultural systems. Cambridge, MA: Cambridge University Press.
Catala, R. L. A. 1957. Report on the Gilbert Islands: Some aspects of human ecology. Atoll Research Bulletin 59: 1 - 187.
Cole, T. G.; Falanruw, M. C.; MacLean, C. D.; Whitesell, C. D.; Ambacher, A. H. 1987. Vegetation survey of the Republic of Palau. Resource Bulletin PSW-22. Berkeley, CA: Pacific Southwest Forest and Range Experiment Station, Forest Service, U.S. Department of Agriculture; 13 p. + 17 maps.
USDA Forest Service Gen. Tech. Rep. PSW-GTR-140. 1993. 35

Connell, J.; Roy, P. 1989. The greenhouse effect: the impact of sea level rise on low coral islands in the South Pacific. In: Pernetta, J. C.; Hughes, P. J., eds. Studies and Reviews of Greenhouse Related Climatic Change Impacts on the Pacific Islands; 106 - 133. SPC/UNEP/ASPEI Intergovernmental Meeting on Climatic Change and Sea Level Rise in the South Pacific (Majuro, Republic of the Marshall Islands, July 16 - 20, 1989), Association of South Pacific Environmental Institutions.
Doty, M. S. 1954. Part 1. Floristics and ecological notes on Raroia. Atoll Research Bulletin 33: 1 - 41.
Falanruw, M.; Cole, T.; Ambacher, A.; McDuffie, K.; Maka, J. 1987. Vegetation survey of Moen, Dublon, Fefan, and Eten, Federated States of Micronesia. Resource. Bulletin PSW-20. Berkeley, CA: Pacific Southwest Forest and Range Experiment Station, Forest Service, U.S. Department of Agriculture; 6 p. + 3 maps.
Falanruw, M.; Whitesell, C.; Cole, T.; MacLean, C.; Ambacher, A. 1987. Vegetation survey of Yap, Federated States of Micronesia. Resource Bulletin PSW-21. Berkeley, CA: Pacific Southwest Forest and Range Experiment Station, Forest Service, U.S. Department of Agriculture; 9 p. + 4 maps.
Fosberg, F. R. 1949. Atoll vegetation and salinity. Pacific Science 3: 89-92. Fosberg, F. R. 1955. Northern Marshall Islands expedition, 1951-1952. Narra
tive. Atoll Research Bulletin No. 38. Glassman, S. F. 1952. The flora of Ponape. B. P. Bishop Museum Bulletin 209.
Bishop Museum, Honolulu. Goodenough, W. 1951. Property, kin and community on Truk. Yale University
Publications in Anthropology No. 46. New Haven, Conn. Hall, T.; Pelzer, K. 1946. The economy of the Truk Islands. U. S. Commercial
Company Economic Survey of Micronesia, Honolulu. Hatheway, W. H. 1953. The land vegetation of Amo Atoll, Marshall Islands.
Atoll Research Bulletin 16: 1 - 68. Hunter-Anderson, R. 1984. Notes on a comparative study of traditional horti
culture in five high island groups in Western Micronesia: Palau, Yap, Truk, Ponape, and Kosrae. Unpublished paper. Micronesian Area Re-search Center, University of Guam, Mangilao, Guam.
Hunter-Anderson, R. 1987. Indigenous fresh water management technologies of Truk, Pohnpei and Kosrae, Eastern Caroline Islands, and of Guam, Mariana Islands, Micronesia. Technical Report 65. Water and Energy Research Institute of the Western Pacific, University of Guam, Mangilao, Guam.
Karolle, B. 1988. Atlas of Micronesia. Agana. Guam: Guam Publications. Kramer, A. 1929. Palau. In: Thilenius, G., ed. Ergebnisse der Sudsee-Expedi
tion, 1908-1910. II. Ethnographic: B. Mikronesien. Volume 3. Hamburg, Germany: Friederichsen, de Gruyter andCo.
Kramer, A. 1932. Truk. In: Thilenius, G., ed. Ergebnisse der Sudsee-Expedition 1908-1910. II. Ethnographic: B. Mikronesien. Series 2, Volume 5. Friederichsen, de Gruyter and Co.
Kubary, J. S. 1889. Ethnographische beitrage zur kenntniss des Karolinen Archipels. First Part. P. W. M. Trap, Berlin.
Kubary, J. S. 1892. Ethnographische beitrage zur kenntniss des Karolinen Archipels. Second Part. P. W. M. Trap, Leiden.
Kubary, J. S. 1895. Ethnographische beitrage zur kenntniss des Karolinen Archipels. Third Part. P. W. M. Trap, Leiden.
Lambert. M. 1982. The cultivation of ‘taro’ Cyrtosperma chamissonis Schott in Kiribati. In: South Pacific Commission, Regional Technical Meeting on Atoll Cultivation, Tech. Paper 180. Noumea, New Caledonia; 163-165.
MacLean, C. D.; Cole, T. G.; Whitesell, C. D.; Falanruw, M. C.; Ambacher, A. H. 1986. Vegetation survey of Pohnpei, Federated States of Micronesia. Resource Bulletin PSW-18. Berkeley, CA: Pacific Southwest Forest and Range Experiment Station, Forest Service, U.S. Department of Agriculture; 9 p. + 11 maps.
Manner, H. I.; Mallon, E. 1989. An annotated list of the vascular plants of Puluwat Atoll. Micronesica 22(1): 23 - 63.
Marshall, M.; Fosberg, F. R. 1975. The natural history of Namoluk Atoll, eastern Caroline Islands: with identifications of vascular flora. Atoll Re-search Bulletin 189: 1-65.
McCutcheon, M. S. 1981. Resource exploitation and the tenure of land and sea in Palau. Ph.D. dissertation in Anthropology. Tucson, AR: University of Arizona.
Muller, W. 1917. Yap. In: Thilenius, G., ed. Ergebnisse der Sudsee-Expedition, 1908-1910. II. Ethnographic: B. Mikronesien. Volumes 1. Hamburg, Germany: L. Friederichsen and Company.
Nishida, S. 1915. An account of a trip to the South Seas. Transactions of the Sapporo Natural History Society 4 (1): 80 - 84. Translated from Japanese by the Office of the Engineer, U.S. Army Forces, Far East.
OTA (Office of Technology Assessment). 1987. Integrated renewable re-source management for U.S. insular areas. Congress of the United States, Washington, D. C.
Raynor, W. C. 1989. Structure, production and seasonality in an indigenous Pacific Island agroforestry system: a case example on Pohnpei Island, F.S.M. M.S. thesis in Agronomy and Soil Science, University of Hawaii.
Sarfert, E. 1919. Kusae. In: Thilenius, G., ed. Ergebnisse der Sudsee-Expedition, 1908-1910. 2 Volumes. Hamburg, Germany: L. Friederichsen and Company.
Sproat, M. N. 1968. A guide to subsistence agriculture in Micronesia. Agricultural Extension Bulletin No. 9, Trust Territory of the Pacific Islands, Division of Agriculture. Saipan, Mariana Islands: TTPI Publications Office.
Sugiura, K. 1942. Taro culture of the Palauans. Geographic Research 1 (8): 1017-1035. Translated from Japanese by Office of the Engineer, U.S. Army Forces, Far East. Tokyo, 1956.
Underwood, R. A. 1987. American education and the acculturation of.the Chamorros of Guam. Doctoral dissertation in Education, University of Southern California, Los Angeles.
Whitesell, C.; MacLean, C.; Falanruw, M.; Cole, T.; Ambacher, A. 1986. Vegetation survey of Kosrae, Federated States of Micronesia. Resource Bulletin PSW-17. Berkeley, CA: Pacific Southwest Forest and Range Experiment Station, Forest Service, U.S. Department of Agriculture; 8 p.
Wiens, H. J. 1962. Atoll environment and ecology. New Haven, CT: Yale University Press.
Wiersum, K. F. 1981. Outline of the agroforestry concept. In: Wiersum, K. F., ed. Viewpoints in agroforestry, pp. 1 - 23. Wageningen, Netherlands: Agricultural University.
Wilson, W. S. 1968. Land, activity and social organization of Lelu, Kusaie. Ph.D. dissertation in Anthropology, Philadelphia, PA: University of Pennsylvania.
Woodroffe, C. D. 1985. Vegetation and flora of Nui Atoll, Tuvalu. Atoll Research Bulletin 283: 1 - 28.
36 USDA Forest Service Gen. Tech. Rep. PSW-GTR-140. 1993.

Micronesian Agroforestry: Evidence from the Past, Implications for the Future1
Marjorie V.C. Falanruw2
Abstract: Traditional agroforest systems exist throughout Micronesia. The system found on one Micronesian group of islands, Yap, is described and evaluated in ecological terms. Implications for future development of agriculture in Micronesia are discussed and some specific recommendations are given.
Agroforestry has been defined as a deliberate association of trees or shrubs with crops and/or pastures on the same piece of land in time or space with a significant interaction (Borel 1988). Discussions of agroforestry systems also often refer to their sustainability and adaptability to the local environment and local cultures. The ecological parameters of an area shapes the types of agroecosystems that develop. In a study of agroforestry systems in major ecologic zones of the tropics and subtropics, Nair (1987) found the greatest concentration and diversity in humid lowlands. Most areas of Micronesia are humid lowlands and the native vegetation of most of the area was forest (Fosberg 1960). Thus we may expect a natural tendency for Micronesian agroecosystems to develop towards a forest physiognomy.
Micronesian Agroforests In designing a vegetation classification to be used in map-
ping major vegetation types in Micronesia, it was apparent that some areas of forest were actually tree gardens and should be classified as “agroforest.” The resulting vegetation maps (Cole and others 1988; Falanruw and others 1987 a, b; MacLean and others 1986; Whitesell and others 1986) showed some 20,700 hectares of this vegetation type in the mapped Caroline high islands. The nature of agricultural and . agroforestry systems present on islands of Micronesia varies with local conditions. Except for a thin border of strand vegetation, most of the vegetation of atolls consists of a mix of agroforest and atoll forest trees. Much of the four mapped high islands of Chuuk are covered with coconut/breadfruit agroforest. Considerable acreage on Pohnpei has been mapped as agroforest and a diverse integrated system is found on the high islands of Yap (Falanruw 1985). Raynor (1989) describes structure, production, and seasonality of agroforestry systems in Pohnpei. The farms he surveyed were from 2 to well over 100 years old, having been established mainly on land parcels distributed during the German administration of the island, and many are in the process of being developed. The traditional land tenure system of Yap has not been greatly altered by foreign administrations, and Yap’s
1An abbreviated version of this paper was presented at the Workshop on Research Methodologies and Applications for Pacific Island Agroforestry, July 16-20, 1990, Kolonia, Pohnpei, Federated States of Micronesia.
2 Research Biologist, Pacific Southwest Research Station, USDA Forest Service, P.O. Box 490, Yap, FSM 96943.
agroecosystems appear to have been in place for many generations. While ownership has changed within successive generations of families, the systems have remained in place and individual estates today include parcels of land in different ecological zones (Lingenfelter 1975). This condition results in integrated zones of agricultural/agroforestry systems made up of separately owned plots. A general description of these systems summarized from Falanruw (1985 & 1990) is given below.
A Micronesian Agroforestry System Yap is a tropical island with a mean temperature of 81°F
with average monthly temperatures varying but 2°F. Lying near the intertropical convergence zone, the island’s rainfall pattern is irregular. Some years follow a monsoon pattern of spring drought followed by torrential rainfall in summer and fall. In other years, rain is dispersed more evenly throughout the year. The mean annual rainfall for the period 1949-1980 was 3028 nun. These climatic conditions present classical problems of how to use tropical soils without exposing them to erosion and nutrient depletion. As a high island, Yap provides for the collection of rainfall and the flow of water from uplands to lowlands and then into the sea. This has resulted in a series of natural habitat zones where rainfall is buffered and sediments and nutrients carried with fresh water runoff are filtered out in a series of biotic communities successively less tolerant of siltation (Falanruw 1981). The early inhabitants of Yap modified the islands into an anthropocentric food production system incorporating taro patches, tree gardens, mixed multi-layered gardens alternated with secondary tree cover and some open canopy agriculture without greatly changing the watershed system of the island. Tree gardens function like natural forests and taro patches function as silt traps.
Tree Gardens and Taro Patches The most stable of Yap’s food production systems are tree
gardens and taro patch systems which generally occur about villages, mostly in coastal areas. Human activities in developing villages, gardens and paths between villages appear to have involved the deepening of low areas to obtain fill for house sites, raised gardens and paths. Useful trees were planted in the raised and drained areas along village paths and around home sites. These “home tree gardens” became confluent to form the agroforests of today. Preliminary results of ongoing studies have identified some 55 species of trees producing food or spice products. Commonly associated with these trees are another 62 species of useful shrubs and herbs. Other species are present growing wild or allowed to grow for uses or reasons not yet recorded. Such tree gardens provide food and other products
USDA Forest Service Gen. Tech. Rep. PSW-GTR-140. 1993. 37

while functioning like natural forests in intercepting rainfall and holding the soil.
Low areas were planted to Cyrtosperma chamissonis (Schott) Merr., the giant swamp “taro.” Light is managed and water flow within and through taro patches is regulated to maintain a suit-able growing media. C. chamissonis requires about 3 years to reach a good size, but it may be left to grow longer. Sucker corms are generally replanted at the time that the main corm is harvested. Some plants are left to grow especially large for presentation on special occasions. Taro patches are almost always fully stocked, thus there is minimal exposure of taro patch soils to erosive forces.
The culture of “true taro,” Colocasia esculenta, is also important. When planted in taro pits, this crop is more seasonal, requiring initial preparation of the taro patch during the dryer part of the year. Culture is more intensive, and may include ditching, the working in of green manures and mounding of soil about the developing corms, which mature earlier than C. chamissonis but cannot be left in the ground indefinitely. In deep taro pits, or in areas with little soil, raised beds developed within “retaining walls” of woven coconut fronds may be used. Colocasia is also grown in mixed garden situations. So important are taro patches that the land tenure system provides for ownership of taro patches in areas which may be removed from the main estate. As a result, taro patch habitat is often divided into segments managed by different owners.
Intermittent Mixed Gardens In Forested Areas Inland of villages, gardens are alternated with wild forest
and bamboo cover. The species composition and production of these gardens is being evaluated in an ongoing study. The development of these gardens involves the burning of slash around tree trunks during the dry season to open a “skylight” in the forest. In addition to admitting light, this results in a fall of leaf mulch and removal of root interference with crops. Ashes con-tribute to soil fertility. Larger branches and stems that are not burnt are piled around the perimeter of the garden or across it. The burnt girdled trees are left standing to serve as trellises for yam vines.
Over 15 crops are commonly grown in today’s mixed gar-dens. Cucurbits planted in ash soon after the burn grow especially fast. By the time the heavy rains come, a ground cover has generally become established. The fast growing herbaceous crops help to suppress weeds. Weeds in gardens made in forested areas are generally tree seedlings. Unless they interfere with crops, they are initially left growing as they help to suppress more noxious weeds and can be used as mulch at a later time. The crop species composition changes through the gardening cycle as harvesting is accompanied by a sequence of replanting.
No inputs are needed other than the biological inputs of the site, human labor, and planting material. Technology consists of a knife, matches, digging bar, and the gardener’s experience. For about 19 person days of labor plus harvesting time, one gardener harvested 2,122 pounds of carbohydrate produce in 1 year. In addition, from about the second month on, greens of limited
weight but considerable nutritional significance for her family of 7 were gathered daily to weekly.
A variety of Dioscorea yams planted at the end of one dry season are harvested about the next dry season. Some may be left to grow one or more additional years. If there is need, the gardener generally begins to prepare the next year’s yam garden about this time. In this way, planting material from one garden will be recycled into the next, and the harvest from a first year garden is complimented by the harvest of longer term crops such as bananas from second and third year gardens.
Gardens are visited less frequently as less is harvested and they become more weedy. Nowadays at least, a common reason given for abandoning a garden is the work involved in weeding. The introduction of noxious weeds such as Mimosa invisa Mart. and Eupatorium odoratum L. is causing considerable problems. Species which grow up in abandoned gardens include trees which were cut and left to coppice, seedlings which were left growing and others sprouting from seed imported by birds and fruit bats from the nearby forest. Sometimes cuttings of Hibiscus tiliaceus are planted around the perimeter of raised garden beds to hold these banks and contribute to the fallowing process.
Once gardens are no longer maintained, a canopy of fast-growing species is established within 2 to 3 years. In 9 gardens observed over the last 2 years, the species composition of the secondary vegetation varied somewhat by site but includes a predictable set of species in common. A much longer period appears to be required for the development of a mature species-diverse forest, and the system results in a loss of primary forest species when the fallow period is shortened.
Scientists believe that too frequent burning of the forest canopy resulting in soil degradation led to the spread of the savanna grassland vegetation type (Fosberg 1960; Clarke 1971; Manner 1981 a, b). When questioned about the origin of the savanna, contemporary elders merely reply that it has always been thus, so if the area was once forested it was long ago. It seems likely that it was during times of high population in prehistoric times, land was cleared too often to allow for the re-establishment of forest canopy.
The inhibition of the formation of a forest canopy would result in decreased transpiration and percolation of rainfall into the soil. This increases the need for water management. Evidence of water management is abundant. Ditch drained garden beds can be found in many areas of Yap currently covered with forests, secondary vegetation, and savanna grassland. The presence of these beds is obscured by taller vegetation but in the savanna grasslands they can be identified on aerial photographs in some 23 percent of the area covered with this vegetation type.
Open Canopy Agriculture Today at least, drained beds in savanna grasslands, mostly
established at a time before contemporary elders can recall, are used mainly to grow sweet potatoes. Within each rectangular bed are often a series of ditches running perpendicular to the long axis of the garden. These ditches are closed at either end. They are said to drain water from the planted beds and, being closed at either end, also provide a reservoir of water to “cool the
38 USDA Forest Service Gen. Tech. Rep. PSW-GTR-140. 1993.

soil” and maintain moisture. When beds are prepared, tall grasses and other growth are first cut and left on site. Additional slash from surrounding areas may be added. Soil is then thrown on top of this mulch to cover it and prevent it from growing. The soil used to cover the mulch is evacuated from the ditches surrounding and within the bed. Thus, soil runoff from previous years is replaced on top of the gardens. Clumps of clay soil from the bottom of the ditches is sometimes piled around the perimeter of the garden bed to reduce erosion. When the “water reservoir ditches” within the beds become too deep or reach a zone of clay soil not suitable for use on the garden bed, they are filled with grass and soil and another ditch is prepared parallel to the old one. Sweet potato vines are planted in the beds and grow rapidly to further shade out grass.
The work involved in making such sweet potato gardens is more arduous than forest gardening, the harvest is less diverse, sweet potatoes are not as favored as yams, and they are increaseingly subject to pest and disease problems. Thus we may expect a decline in such gardening in favor of forest gardening.
Pros and Cons of the Traditional/Indigenous System
The traditional Yapese agricultural system provides an ex-ample of ecological adaptation. Rather than rearranging the environment and applying large inputs of energy, water, fertilizers, and other chemicals, it makes use of microhabitat and utilizes natural processes. I thus characterize it as “nature intensive” to contrast it with other major agricultural systems which are labor intensive or energy, chemical, and capital intensive.
The natural flow of water, and nutrients carried with this water are utilized. The tree canopy is manipulated first to pro-vide sunlight for crops and biomass which is converted to ash fertilizer, and later to buffer rainfall and shade out weeds. The system is highly efficient in terms of human energy and requires no other input of energy from fossil fuels. Like a natural tropical forest, it is diverse and structurally complex, factors that result in resilience to perturbations, and thus stability in the long run. Despite irregularities in the weather, the system provides major staples throughout the year, the seasonal production of yams being counterpoint to the breadfruit season, with giant swamp taro providing a back-up throughout the year. Variety is provided by the mixture of tree crops and the mix of species grown in the intermittent gardens. The tree gardens provide long-term stability, and the mixed intermittent gardens provide a means to take advantage of seasonal conditions of drought and rainfall.
Finally, the traditional system of agriculture/agroforestry was integral to the culture. Micronesian cultures were adaptive to environmental conditions (Falanruw 1968, Fosberg 1987). Local conditions have changed however. Infusions of aid, goods, energy, and technology have made it possible to forestall the consequences of ignoring the basic rules of caloric self-sufficiency and sustainability of lifestyle so that anthropocentric indicators of the islands’ limitations are now lacking. Scientists’ recognition of the value of many traditional practices is coming at a time when there is a rush for development based on the Western development formula of applying lots of money, en
ergy, strong chemicals, and powerful technology. The changes which are possible via the application of these resources are fast, spectacular, and so attractive that they lead people to disparage their own resources, technologies, and traditions of production. It is ironic that “nature intensive” systems of agriculture/ agroforestry are today eroding as a result of development efforts based on applications of western science and economics which produced many of the problems that today's ecologists and planners are trying to alleviate and avoid.
Micronesia’s population is increasing rapidly and after a long period of financial support from the United States, the end of the trusteeship period has brought increased need for exports to earn foreign exchange for this new island nation. This is placing increased and new demands on land, and this will eventually impact the traditional agricultural system which requires ample area and a long fallow period in order to be sustained. Modem development efforts generally begin with the bulldozing of land and result in considerable erosion and siltation of taro patches, mangroves, seagrass beds and marine life within the lagoon.
It is clear that there are problems with indigenous agriculture/agroforestry systems. Alternatives, however, are not clear. Despite considerable subsidy for agricultural “development,” there have been few successful Western-type agricultural projects in Micronesia. This situation applies elsewhere in the humid tropics as well. Vermeer (1973) questions whether western systems of agriculture have been successful anywhere in the humid tropics. Industrial agriculture is known to be energy inefficient. For example, the efficiency ratio of highly industrialized corn production in the United States was 3.7 in 1945 and but 2.8 in 1970 (Pimental and others 1973). When the energy costs of the entire food system of the United States (including farm inputs, processing, transportation, and preparation) were calculated (Pimentaland others 1973, Clarke 1978), it was found to be-10, that is, it takes an average of 10 units of energy to put 1 unit of food energy on the table!
Mechanized agriculture cannot be used on steep slopes without great risks of soil erosion, and much of Micronesia is sloping land. Though mechanized agriculture reduces the direct human labor input per yield, it is energy inefficient, increases unemployment of farm personnel, and contributes to the depletion of soils, and other renewable and nonrenewable resources. It also increases pollution and disruption of natural habitat. If such hi-tech, energy inefficient agricultural technology could be transferred to Micronesia, it would require a subsidy that would be difficult to sustain.
Towards a Pacific Alternative For nature-intensive-technology to work, a healthy natural
system is needed. Odum (1972) suggests that it is necessary to leave about 40 percent of natural resources undeveloped in order to maintain a healthy natural system. “Critical” natural habitat― that which is essential to the functioning of the system―must be protected. In Micronesia, this effort is just beginning.
In a nature intensive system to work, people also need to be aware of natural processes. For Micronesians this was once a
USDA Forest Service Gen. Tech. Rep. PSW-GTR-140. 1993. 39

necessity. Today there are a growing number of distractions such as television and the schedule of the Government work day and fiscal year that take people's time and attention away from natural phenomena and food producing systems. Inasmuch as the agricultural revolution was brought about by farmers, not scientists (Richards 1986), it follows that the “agroecological revolution” required to alleviate many of today’s environmental problems must draw upon existing examples of traditional agroecosystems. It thus behooves us to study, understand and build- upon the systems of agriculture/agroforestry which have developed under Micronesians conditions.
Some of the steps which will help build upon existing systems in Yap are:
1. Tend existing systems. There is a need for “traditional technology transfer” to teach the younger generation “how.” Given the great proportion of youth to adults, there is a tendency to remove knowledgeable adult women from the system to serve as baby sitters. In time their knowledge and experience will be lost.
2. Invest in the training of local personnel in ecological concepts so that the environmental costs of both traditional and modem technology will be recognized and taken into consideration in development efforts.
3. Address the “why” of traditional agroforestry in order to discover principles which may be used to extend the system.
4. Given limited forest resources and the importance of maintaining biodiversity and the ecological services provided by forests, it is important to reduce the area of forest that is converted to agriculture. This could be done by reducing the number of plots opened in shifting cycles by decreasing the time required for fallow. This could involve such measures as leaving seed
trees, maintaining functional populations of agents of seed dispersal such as birds and fruit bats, alleviating erosion, and re-moving support for converting forest areas to agriculture.
5. Research on enhancing fallow periods such as with fast growing nitrogen fixing species is needed. For example, indigoenous people in Papua New Guinea and Java recognize that Albizia falcataria, (Paraserianthes falcataria), contributes to soil fertility (Clarke 1971, Stoney pers. comm.). This species grows well in Micronesia, but as it is not native, its impact on the native forest system of Micronesia should be evaluated first.
6. Research and trials on management of weed species. If weeds were easier to manage, gardens could be used for longer periods. This effort should be combined with efforts to prevent the entry of noxious weeds and to control noxious weeds such as the recently introduced Mimosa invisa and Eupatorium odoratum.
7. Native forests should be inventoried and critical areas protected.
8. Degraded savanna grasslands need to be revitalized. 9. Enrich the traditional system with additional adaptive
elements and species such as Hibiscus manihot. 10. Evaluate the contributions of indigenous agriculture.
The lack of support for the development of indigenous agroforestry systems may be due to lack of recognition of their contribution. The valuation of the products of traditional systems may result in more support for their development.
11. Support participatory research and access of field workers to laboratory facilities and technical expertise for soils and other tests.
12. Traditional agriculture/agroforestry, or any food production system cannot remain sustainable if the human population becomes too dense. Family planning is a must!
40 USDA Forest Service Gen. Tech. Rep. PSW-GTR-140. 1993.

References Borel, R. 1988. Agroforestry course, CATIE, Costa Rica. Clarke, W.A. 1971. People and place: An ecology of a New Guinean commu
nity. Berkeley: University of California Press. Clarke, W.A. 1978. Progressing with the past: Environmentally sustainable
modifications to traditional agricultural systems. In: Fisk, E.K., ed. The adaptation of traditional agriculture: Socioeconomic problems of urbanization. Monograph No. 11. Development Studies Centre, Australian National University, Canberra. pp. 142-157.
Cole, T. G.; Falanruw, M. C.; MacLean, C. D.; Whitesell, C. D.; Ambacher, A. H. 1987. Vegetation survey of the republic of Palau. Resource Bulletin PSW-22. Berkeley, CA: Pacific Southwest Forest and Range Experiment Station, Forest Service, U.S. Department of Agriculture; 13 p. + 17 maps.
Falanruw, M.V.C. 1968. Conservation in Micronesia. Atoll Research Bulletin 148:18-20.
Falanruw, M.V.C. 1981. Marine environment impacts of land-based activities in the Trust Territory of the Pacific Islands. In: Marine and Coastal Processes in the Pacific: Ecological Aspects of Coastal Zone Management, UNESCO Technical Papers in Marine Science, Paris; 19-47.
Falanruw, M.V.C. 1985. The traditional food production system of Yap Is-lands. A paper presented at the First International Workshop on Tropical Homegardens, Bandung, Indonesia, Dec. 2-9,1985.
Falanruw, M.V.C.; Whitesell, C.; Cole, T.; MacLean, C.; Ambacher, A. 1987. Vegetation survey of Yap, Federated States of Micronesia. Resource Bulletin PSW-21. Berkeley, CA: Pacific Southwest Forest and Range Experiment Station, Forest Service, U.S. Department of Agriculture; 9 p. + 4 maps.
Falanruw, M.V.C.; Cole, T.; Ambacher, A.; McDuffie, K.; Maka, J. 1987. Vegetation survey of Moen, Dublon, Fefan and Eten, State of Truk, Federated States of Micronesia. Resource Bulletin PSW-20. Berkeley, CA: Pacific Southwest Forest and Range Experiment Station, Forest Service, U.S. Department of Agriculture; 6 p. + 3 maps.
Falanruw, M.V.C. 1990. Traditional adaptation to natural processes of erosion and sedimentation on Yap island, In: Zeimer, R.R.; O'Loughlin, C.L.; Hamilton, L.S., eds. Proceedings of a Symposium on Research Needs and Applications to Reduce Sedimentation in Tropical Steeplands, Fiji.
Fosberg, F.R. 1960. The vegetation of Micronesia. Bulletin of the American Museum of Natural History 119(1):1-75.
Fosberg, F.R. 1987. Commencement address, University of Guam. Lingenfelter, S.G. 1975. Yap: Political leadership and culture change in an
Island Society. Honolulu: Univ. of Hawaii Press. MacLean, C.; Cole, T.; Whitesell, C.; Ambacher, A.; Falanruw, M. 1986.
Vegetation survey of Pohnpei, Federated States of Micronesia. Resource Bulletin PSW-18. Berkeley, CA: Pacific Southwest Forest and Range Experiment Station, Forest Service, U.S. Department of Agriculture; 9 p. + 11 maps.
Manner, H. 1981 a. Ecological succession in new and old swiddens of montane Papua New Guinea, Human Ecology, Vol. 9(3).
Manner, H.; Lang, H. 1981b. A qualitative analysis of the induced grasslands of the Bismark mountains, Papua New Guinea.
Nair, P.K.R. 1987. Agroforestry systems in major ecological zones of the tropics and subtropics. ICRAF Working Paper No. 47, ICRAF, Nairobi.
Odum, E.P. 1972. Ecosystem theory in relation to man. In: J.A. Weins, ed. Ecosystem Structure and Function. Corvallis, OR: Oregon State University Press.
Pimental and others. 1973. Food production and the energy crises. Science Vol.182:443-9.
Raynor, W. 1989. Structure, production, and seasonality in an indigenous Pacific agroforestry system; a case study on Pohnpei, FSM. Unpublished M.A. thesis, University of Hawaii, HI.
Richards, P. 1986. The indigenous agricultural revolution: Ecology and food production in West Africa. University of California Press.
Stoney, C. 1990. Personal communication, Java Social Forestry Project. Vermeer, D.E. 1973. Peasant agriculture: problems and prospects in the 21st
century. Papers presented at a special session, Assoc. Amer. Geographers, Ann. Meeting, Atlanta, GA.
Whitesell, C.; MacLean, C.; Falanruw, M.; Cole, T.; Ambacher, A. 1986. Vegetation survey of Kosrae, Federated States of Micronesia. Resource Bulletin PSW-17. Berkeley, CA: Pacific Southwest Forest and Range Experiment Station, Forest Service, U.S. Department of Agriculture; 8 p. + map.
USDA Forest Service Gen. Tech. Rep. PSW-GTR-140. 1993. 41

An Indigenous Pacific Island Agroforestry System: Pohnpei Island1
Bill Raynor James Fownes2
Abstract: The indigenous agroforestry system on Pohnpei was studied using circular plots laid out in transect across 57 randomly-selected farms. Data were collected on species and cultivar presence, size, density, frequency, as well as soil type, slope, aspect, and other related information. Through farmer inter-views, farm family demographic data was also recorded. Seasonality of major crops was observed. Analysis shows indigenous agroforestry on Pohnpei to be a complex, but extremely well ecologically and culturally adapted, production system.
Indigenous agroforestry is a dominant feature of both the landscape and culture on Pohnpei, the result of more than 2,500 years of development and refinement (Haan 1984). During this time, numerous crop and technology introductions have been made through continued waves of migration, and more recently, through direct and indirect efforts of colonial administrations
1 An abbreviated version of this paper was presented at the Workshop on Research Methodologies and Applications for Pacific Island Agroforestry, July 16-20, 1990, Kolonia, Pohnpei, Federated States of Micronesia.
2Researcher, Land Grant Programs, College of Micronesia, Kolonia, Pohnpei, F.S.M. 96941; Professor, Department of Soil Science and Agronomy, University of Hawaii at Manoa, Honolulu, Hawaii 96822.
(Barrau 1961). Currently, agroforestry both employs and provides sustenance to a large majority of the Pohnpei population.
The island of Pohnpei is located at 6°54' N latitude and 158°14'E longitude in the Caroline Islands group, about 4983 km southwest of the Hawaiian islands (fig. 1). It is the highest (772 m) and second largest (355 km2) in the group and one of the few high islands. The island is of volcanic origin and is about five million years old (Keating and others 1984). Rainfall is high and temporally well-distributed, with an average of 4820 mm and 300 rainy days per year (NOAA 1987). At higher interior elevations, rainfall is estimated to reach 7,500 mm (Laird 1982, van der Brug 1984). Temperatures average 27°C year-round and humidity is high (NOAA 1987). The island is surrounded by a barrier reef and lagoon, with extensive mangrove forest development around most of the shoreline. Pohnpei Island is typically volcanic, with a majority of the land area characterized as steep and mountainous.
Vegetation is mainly upland forest (55.5 percent), mostly in the interior. Coastal areas and lower slopes are characterized by agroforest (33.4 percent) and secondary vegetation (5.2 per-cent). Agroforestry has been expanding rapidly in the last two decades, replacing primary forest and secondary vegetation (MacLean and others 1986).
Figure 1-Location of Pohnpei in the Caroline Islands, Micronesia
42 USDA Forest Service Gen. Tech. Rep. PSW-GTR-140. 1993.

Soils in areas under agroforestry are characterized by Typic Acrorthoxes in the lowlands and Typic Dystropepts on mountain slopes, with a few small areas of Typic Humitropepts (Laird 1982). Soils in the upland mountainous areas are generally deep, well drained, and commonly very stony. Use of these areas is limited by steep slopes and stoniness. Nearly level or gently sloping soils are generally moderately deep and moderately well-drained. Low fertility and wetness are limitations. Bottom land soils are generally poorly drained and are limited by wetness (Laird 1982).
Methods Selection of Survey Sites
The area of this study was the entire agroforestry area on the island of Pohnpei. MacLean and others (1986), using aerial photos and ground surveys, estimated indigenous agroforestry to cover about 33.4 percent of the total land area of Pohnpei, or 11,865 ha as of 1984. It was desired to sample about 1 percent of the agroforest, so based on the reported area of agroforestry and
assuming 2.5 ha as the average land parcel size, it was deter-mined that about 50 farms would be surveyed. A map of Pohnpei was overlaid with a grid of intersecting lines corresponding to every 0.5 km, then 100 random pairs of numbers were generated, corresponding to x,y coordinates of farm survey points. Points that fell in the lagoon, mangrove, or uninhabited jungle areas of the island were discarded and farms on or nearest the remaining 57 survey points were identified (see map, fig. 2).
Field Survey Methods In designing field methods, it was necessary to take into
account that persons other than family members are not generally allowed to enter onto someone's land on Pohnpei. To alleviate this, all farmers were visited several weeks before the actual survey took place. The local extension agent explained the purpose of the study, people to be involved, and what would be done. If the farmer was agreeable, a date for the survey was set. Surveyors were limited to two people, the senior author and the extension agent, and survey methods were designed so that the farmer could accompany us on the survey.
Figure 2-Map of Pohnpei Island showing farm survey sites
USDA Forest Service Gen. Tech. Rep. PSW-GTR-140. 1993. 43

Upon arriving at a farm, the head of household, usually with his/her family, was interviewed using the prepared interview protocol (see Appendix). Then a rough land map, showing property boundaries, buildings, and vegetation types, was sketched. The survey route was then determined with the farmer before starting. A systematic plot lay-out was used, working along a compass line from corner to corner of the survey farm, passing through or near the center, with plots taken at 40 meter centers along the line. If the distance across the farm was too short to make 10 plots, a second compass line branching at a right angle from the first line near the farm center was set and the remaining plots laid out on 40 meter centers along this line.
Circular plots of 8 meter radius (201 m2) were used for ease of layout. Slope and aspect were recorded with a clinometer and compass, respectively, and then weeds (grasses, ferns, and recognized weed species) were recorded by visual estimate of percent cover. All other species were recorded by local name, cultivar (if any), number and heights. On breadfruit trees, d.b.h. was measured. For bananas, taro, and sakau (Piper methysticum), number of stems were counted, and for yams, number of vines were recorded. This was repeated for each plot (see farm survey form in Appendix.)
Species Identification Through farmer interviews, observation, and literature re-
view, important data on each crop species were collected, including genus and species (Glassman 1952, Falanruw and others, in press), Pohnpei name (Rehg and Lawrence 1979, Falanruw and others, in press), life cycle (annual or perennial), seasonality, products, period of introduction (Glassman 1952, Bascom 1965), vegetation type group (Glassman 1952, MacLean and others 1986, Falanruw and others 1987), and other data, such as number of cultivars. Frequencies (percent of farms on which species occurred) and overall individuals per hectare were calculated for each species.
Horizontal Patterns It was observed in the field that distance from the house
affected agroforest management intensity, sex roles (women’s vs. men’s crops), crop security, and other important factors. Distance from the house was recorded for each plot, and then plots were grouped by agroforestry “zones.” These “zones” were only roughly defined since topography and soils also influenced horizontal vegetation patterns. Zones were characterized as follows: Zone 1 - 0-20 meters from house, Zone 2 - 20-100 meters from house, Zone 3 -100-250 meters from house, and Zone 4 - 250 meters or more.
Characterization of Temporal Relations As in other areas where long-term agroforestry is practiced,
Pohnpei indigenous agroforestry could be described as a type of farmer-controlled succession. Farms were classed by a combination of reported farm age and estimated age of dominant existing vegetation types based on field observation. Farm age was deter-
mined by asking farmers when they first began fanning their land and which species of vegetation existed on the land at that time. Since reliability of reported farm ages was dependent on farmer memory, and age of different plots varied somewhat within farms, an attempt was made to identify general agroforest development or successional stages. These are reported in the results.
Seasonality of various crops was determined through on-farm observation during the farm surveys, and was augmented by a weekly market survey.
Results and Discussion Farm Demographics
Age of head of household varied considerably (table 1), but was characterized by older farmers. This was mainly due to the extended family pattern of habitation in the rural areas. Land sizes, determined from land survey maps or estimation, also varied considerably. Most farmers controlled more than one piece of land, in most cases considerably increasing their land-holdings. Family size also reflected the extended family structure. Access to paid off-farm employment varied widely. Nine-teen families (33 percent) had no access to wage labor, and depended almost entirely on farming and fishing for livelihood. For the remaining farm families, labor varied from full-time government work to occasional carpentry or roadwork.
Agricultural Technology and Management Farming technology was generally traditional, with the ma
chete and metal digging stick being the most important tools. Only 8 farmers used commercial fertilizer, and only on black pepper (Piper nigrwn) and market vegetables. Farmers reported soil fertility decline over time affecting mostly annuals and herbaceous perennials, especially kava (Piper methysticum) and banana, with little effect reported on tree crops. Common strategies included rotation of annual and herbaceous perennial crops around the land, setting aside unfarmed portions of the farm for future use, and ultimately, movement to another land. Pesticides were used occasionally only by three farmers, on semi-commer-
Table 1-Demographic data on 57 survey farms
Characteristic Minimum Maximum
Age of head of household (years) 54 76
Size of farm land parcel (Ha) 4.9 5 21
Number of land parcels controlled 2.1 5
Total number of family members residing on farm 14 41
-working on farm 4.2 1 12 -employed off farm 1.2 0 5
Average
30
1.
1
2
44 USDA Forest Service Gen. Tech. Rep. PSW-GTR-140. 1993.

cial vegetables. Overall, farmers were satisfied that their traditional technologies were sufficient.
The Pohnpei farmer asserts considerable influence on the structure of the farm. This is accomplished through periodic slashing of undergrowth, selection of spontaneously generating trees and herbs, occasional planting of crops, and pruning, girdling, and topping existing trees.
Commercial Cropping Many of the farmers occasionally sold produce in Kolonia,
but few considered themselves commercial farmers. Interestingly, while 32 percent of farmers had been involved in the unsuccessful TTPI cacao project in the early 1960’s, no introduced cash crop since then has attracted such a high percentage of farmers (table 2), including black pepper, which at present is a fairly lucrative cash crop. Petersen (1977) recorded similar findings in his research and attributed this to the general distrust that farmers have for new cash crop projects after a series of early failures in the 1960’s and early 70’s. Copra production has also fallen off considerably, with only 23 percent of the farm families still engaged in production. Most felt that copra was far more profitably used as pig feed. A few traditional prestige crops, including kava and yams, have also recently become cash crops, due to the increasing urban population in the district center, Kolonia. Pigs are also frequently marketed, and a number of farmers, especially those without wage labor income, reported much of their income from the marketing of pigs and sakau.
Livestock Chickens were the most common livestock, most being kept
free-run (table 3). Previous to European contact, dogs were the major prestige animal, and were consumed regularly at feasts, but currently, pigs are the most important livestock based on their high prestige value. The relatively low figure (81 percent) for farms on which pigs were recorded is slightly misleading since some families did not permanently reside on the survey lands. Numbers of pigs/ family were also lower than expected. This is probably due to recent enforcement of legislation requiring pigs to be fenced, thus discouraging large numbers of pigs because of the need for a greater investment of capital and labor. Pigs were fenced on 76 percent of the survey farms. Almost all
Table 2-Participation in commercial cash cropping of 57 survey farms
Amount grown Crop type
Farms (No.)
Farms (Pct) Unit Avg. Min. Max.
Cocoa 18 31.6 Trees 268 25 1000 Copra 13 22.8 Trees 370 200 00 Sakau 11 19.3 Ha 1.1 0.4 1.6 Vegetables 10 17.5 Ha 0.3 0.1 0.8 Black Pepper 9 15.8 Plants 468 100 981 Pineapple 5 8.8 Plants 670 20 3000 Citrus 3 5.3 Trees 40 20 50 Betel Nut 3 5.3 Trees 140 20 200 Yam 3 5.3 Ha 0.6 0.4 1
farms with unfenced pigs were found in Kitti municipality, where the legislation has not yet been totally accepted.
Major Crop Species A total of 161 species of plants were found on the Pohnpei
survey farms, 102 of which are cultivated and uncultivated trees, shrubs, and crops. The rest are uncultivated herbaceous weeds (table 4). Of the 102 species, 16 were upper canopy, 24 were sub-canopy, and the remainder were understory. There were 58 cultivated agroforest species, 20 upland forest species, 18 secondary vegetation species, and 6 swamp, strand and mangrove forest species. Not all species were found on every farm. Twenty-six different species were found on the average farm, with 16 being the least and 37 being the most species found on a single farm. Although some of this difference reflects the variability between farms due to management, survey methods, due to the uneven number of plots per farm, probably had the greatest effect. Environmental gradients figured only slightly, since all gradients were generally small, and farmers all planted relatively the same basic complement of crops, regardless of location.
Cultivars Several of the major crops have a number of cultivars.
Cultivar names were collected from the literature (Bascom 1965) and farmer interviews. Cultivars were searched out, collected, and described during this study. Yam (Dioscorea) has the greatest number of cultivar names recorded (177), breadfruit the second most (131), followed by plantain and banana (55). Other crops having numerous cultivars include Cyrtosperma taro (24), Colocasia taro (16), Alocasia taro (10), coconut (9), sugarcane (16), and kava (3).
Out of 131 named cultivars of breadfruit, 28 (22.3 percent) were actually recorded in plots. One cultivar alone, “Meiniwe,” made up more than 50 percent of all trees recorded. Five cultivars made up over 75 percent of trees recorded. For yam, a cultivar of D. alata,‘Kehp en Dol’, made up 18 percent of all yams recorded, followed in importance by several other varieties of D. alata. More than 15 percent of yam varieties were unidentified, due to the reluctance of some farmers to discuss their yams with us. Many of the commonly-occurring yam cultivars were introduced since European contact, reflecting the great number of yam introductions in the last 160 years (Bascom
Table 3-On-farm livestock on 57 survey farms
Amount/Farm Livestock Type
Farms (No.)
Farms (Pct) Avg. Min. Max.
Chickens 48 84 20 2 95 Pigs 46 81 6.5 1 35 Dogs 44 77 3.5 1 12 Goats 4 7 9 1 20 Water Buffalo 2 3.5 1 1 1 Cattle 1 1.8 2 2 2
USDA Forest Service Gen. Tech. Rep. PSW-GTR-140. 1993. 45

Table 4-Common plant species In Pohnpei agroforests (by occurrence)
Names English Scientific Pohnpei Uses #/HA
Upper Canopy Species (>8 m) Trees: Coconut Cocos nucifera nih 1,2,3,6,7,9,13 92 Breadfruit Artocarpus altilis mahi 1,2,7,10,13 72.4 Ylang-ylang Cananga odorata seirenwai 8,11,12,13 47 Mango Mangifera indica kehngid 1,2,12 14.4 Betel Nut Areca catechu pwuh 4 9.5 False Durien Pangium edule duhrien 1,2 9.4 Campnosperma Campnosperma brevipetiolata doling 7,11 6.7 Ivory Nut Palm Metroxylon amicarum oahs 6,7 4.4 Bamboo Bambusa vulgaris pehri 11,13 2.6 Polynesian Chestnut Inocarpus fragifer mwuropw 1,2,13 2.6 Mahogoney Swetenia macrophylla mahokani 11 2.5 Wild Nutmeg Myristica insularis karara 5,7,11 2.3 African Tulip Spathodea campanulata - 11 2.3 Blue Marble Elaeocarpus carolinensis sadak 7,11 2 Albizia Paraserianthes falcataria tuhk kerosin 12,13 1.8 Pittosporum Pittosporum ferrugineum kamal 11,12 1.8 Mountain Palm Clinostigma ponapensis kotop 1,11 1.6 Kapok Ceiba pentandra koatun 12,13,15 1.1 Eugenia Eugenia carolinensis kehnpap 7,11 1.1 ― Parinari laurina ais 5,7,9,11 0.9 Mountain Palm Ptychosperma ledermanii kedei 1,2,11 0.5 Parkia Parkia korom kurum 11 0.3 Eugenia Eugenia stelechantha kirek en wel 7,11 0.2 Banyan Tree Ficus prolixa var. carolinesis aiau 7 0.2 Mangrove Rhizophora apiculata akelel 7,11 0.2
Vines: Rattan Flagellaria indica idanwel 7 2.9
Sub-Canopy Species (2.5-8 m) Trees: Plantain Musa spp. uht 1,2,7,14,15 110 Banana Musa ssp. uht 1,2 48.6 Hibiscus Hibiscus tiliaceus keleu 7,11,12,13,15 36.7 Indian Mulberry Morinda citrifolia weipwul 2,5,7,11,13 23.5 Macaranga Macaranga carolinesis apwid 7,11 19 False Sandalwood Adenanthera pavovnina kaikes 12 19 Soursop Annona muricata sei 1,2 17.2 Premna Premna obtusifolia topwuk 7,12,13,15 15 Glochidion Glochidion ramiflorum mwehk 7,12,13 13.8 ― Aglaia ponapensis marasau 7,12 9 Papaya Carica papaya memiap 1,2 8.6 Lime Citrus aurantifolia karer 1,7,13 8.4 Pandanus Pandanus sp. mwatal 7,15 8 Tree Fern Cyathea nigricans/ponapensis katar 7,11,13 7.2 Rose Apple Eugenia jambos apel en wai 1,2,13 5.4 Strangler Fig Ficus tinctoria nihn 1,7,13 4.3 Ixora Ixora casei ketieu 7,11 4.1 Erythrina Erythrina fusca pahr 11,12,13 4.1 Barringtonia Barringtonia racemosa wih 11,12 4.1 Guava Psidium guajava kuahpa 1,7,13 3 Orange Citrus sinensis orens 1,13 2.8
46 USDA Forest Service Gen. Tech. Rep. PSW-GTR-140. 1993.

Table 4-Common plant species In Pohnpei agroforests (by occurrence) cont’d
Names English Scientific Pohnpei Uses #/HA
Malay Apple ―
Plumeria Oil Palm Cocoa ―
―
―
Barringtonia Barringtonia Pandanus Screwpine
―
Avocado Starfruit Commersonia Guest Tree Pink Bauhinia
Vines: ―
Betel Leaf
Understory Species (<2.5 m)
Shrubs: Kava Pineapple Sugarcane Cassava Ti Plant Ornamental Hibiscus Croton Chili Pepper Gardenia Tobacco Gloryblower Crinum ―
Dwarf Poinciana Coffee ―
Basil ―
Bell Pepper Arnatto
Derris
Ageratum
Devil Weed
Lantana
Melastoma
Pagoda FlowerCrotalaria
Eugenia malaccensis
Claoxylon carolinianum Plumeria rubra Elaeis guineensis
Theobroma cacao
Garcinia ponapensis
Alpinia carolinensis
Glochidion marianum
Barringtonia racemosa
Barringtonia asiatica
Pandanus tectorius
Fragraea berteriana
var. sair Persea americana
Averrhoa carambola
Commersonia bartramia
Kleinhovia hospita
Bauhinia monandra
Freycinetia ponapensis
Piper betel
Piper methysticum
Ananas cosmosus
Saccharum ofcianarum
Manihot esculenta
Cordyline terminalis
Hibiscus rosa-sinensis
Codiaeum variegation
Capsicum annum
Gardenia augusta
Nicotiana tobaccum
Clerodendrum inerme
Crinum asiatica
Pipturus ternatum
Caesalpinia pulcherrima
Coffea arabica
Psychotria hombroniana
Ocimum sanctum
Boehmeria celebica
Capsicum frutescens
Bixa orellana
Derris elliptica
Ageratum conjugation
Chromolaena odorata
Lantana camara
Melastoma marianum
Clerodendrum buchananiiCrotalaria pallida
USDA Forest Service Gen. Tech. Rep. PSW-GTR-140. 1993.
apel en Pohnpei 1,2 2.5 kohi 7 2.1 pohmeria 8,13,14 1.5 nihn aprika 1,2,9 1.5 kakao 1,13 1.4 kehnpwil 7 1.3 iuiu 7,14 1.3 kewikid en lohl 7 1.2 wih 11,12 4.1 wihnmar 11,12,13 0.5 deipw 1,2,6,15 0.5
seir en Pohnpei 8,14 0.5
apokado 1,2,13 0.4 ansu 1,2 0.3 kahil 11,12,13 0.3 keleu en And 7,11 0.3 pilampwoia 14 0.2
rahra 7 0.5 kapwohi 16 0.2
sakau 4,7,10 137 pweinaper 1,2 37.7 sehu 1,10 9.7 dapioka 1,2 5.2 dihng 14 4.9 keleu en wai 14 3.9 korodon 14 3.2 sele 1,14 1.9 iohsep sarawi 7,14 1.8 tipaker 4,14 1.4 ilau 7,14 1.3 kiup 14 1.2 nge 7 0.7 sehmwida 1,14 0.7 koahpi 3 0.4 kempeniel 7 0.3 kadarin 4,16 0.3 kehrari 7 0.3 sele 1 0.2 ― 5,14 ―
peinuhp 7 ―
pwisenkou - ―
wisolmat - ―
randana - ―
kisetikimei 1,7 ―
― 14 ―
krodalaria - ―
47

Table 4-Common plant species In Pohnpei agroforests (by occurrence) cont’d Names English Scientific Uses #/HA
Aroids: Wild Taro Alocasia macrorrhiza oht 2,10,14 47.4 Sweet Taro Colocasia esculenta saws ,2 47
Swamp Taro Cyrtosperma chamissonis mwahng ,2,10 37.6
Dryland Taro Xanthosoma sagittifolium awahn Honolulu 1,2 2.9
Arrowroot Tacca leontopetaloides mokmok ,2 0.3
Vines: Soft Yam Dioscorea alata kehp ,2,10 28.5 Black Pepper Piper nigrum peper 16 16.6 Hard Yam Dioscorea nummalaria kehpeneir 1,2,10 10
Sweet Potato Ipomoea batatas pedehde ,2 1.2
Watermelon Citrullus vulgaris soika ,2 0.8
Yardlong Bean Vigna sesquidepedalis pihns 0.3
Pumpkin Cucurbita maxima pwengkin ,2 0.3
Sweet Yam Dioscorea esculenta kehmpalai ,2 0.3
Morning Glory Ipomoea trilobata omp ,7 ―
Wild Yam Dioscorea bulbifera palai ,7 ―
Merremia Merremia peltata iohl ―
Centrosema Centrosema pubescens ― 2 ―
― Piper ponapense konok ―
Passion flower Passiflora foetida pompom 1 ―
Herbs: Turmeric Curcuma domestica kisiniohng ,7,16 1.8 Ginger Zingiber officianarum sinner 16 ―
Wild Turmeric Curcuma spp. auleng 5,7 0.3
Alpinia Alpinia purpureum iuiu en wai 14 0.2
Wild Ginger Zingiber zerumbet ong en pehle 7 ―
Crape Ginger Costus sericea ― ― ―
Wedelia Wedelia trilobata ― 14 ―
Day Flower Commelina diffusa ― ― ―
Elephant's Foot Elephantopus mollis ― ― ―
Garden Spurge Euphorbia hirta ― ― ―
Aramina Urena lobata ― ― ―
Clover Desmodium spp. ― ― ―
Spanish Needle Bidens pilosa ― ― ―
― Polygala paniculata kisinpwil ― ―
Jamaica Vervain Stachytarpheta jamaicensis ― ― ―
Coleus Plectranthus scutelloides koromahd ― ―
Niruri Phyllanthus niruri limeirpwong ―
Sida Sida acutifolia ― ― ―
Sowthistle Sonchus oleracea ― ― ―
Grasses:
― Cyrtococcum patens rehmaikol ―
Pohnpei
1,1
1
1
1
1
1
1
1
1
2
2
7
7
5
7
7
48 USDA Forest Service Gen. Tech. Rep. PSW-GTR-140. 1993.

Table 4-Common plant species In Pohnpei agroforests (by occurrence) cont’d
Names English Scientific Pohnpei #/HA
Hilo Grass Paspalum conjugatum rehnwai ― ― Ischaemum polystachum rehpadil ―
― Chrysopogon aciculatus rehtakai ―
Marsh Cyperus Cyperus javanica use ―
Goosegrass, Eleusine indica rehtakai ―
Mapania Mapania pandanophylla pwohki ―
Napier Grass Pennisetum purpureum pukso ―
Crabgrass Digitaria radicosa ― - ―
Rice Grass Paspalum orbiculare rehnta ―
― Hypolytrum dissitifolium sapasap ―
― unidentified rehsemen - ―
Foxtail Andropogon glaber rehnta ―
Miscanthus Miscanthus floridulis sapalang ―
Wild Sugarcane Saccharum spontaneum ahlek ―
Ferns: ― Thelypteris maemonesis mahrek ―
Sword Fern Nephrolepis acutifolia Rehdil ―
Birds-Nest Fem Asplenium nidus tehnlik ―
Para Fern Marratia fraxinea paiuwed ―
False Staghorn Fern Gleichenia insularis mwatalenmal ― ―
Uses
-7
7
-
-
-
-
-
-
7
-
7
7 7
14
7
Uses: 1. Food 9. Oil 2. Animal feed 10. Prestige 3. Beverage 11. Lumber, other wood products 4. Narcotic 12. Firewood 5. Dye 13. Trellis 6. Thatch 7. Medicine 8. Flower
(Based on Raynor 1989)
14. Ornamental 15. Fiber 16. Spice
1965.) For plantain and banana, the majority of cultivars of both were even more recently-introduced (within the last 50 years). Coconut was dominated by two cultivars, ‘nih tol’ and ‘nih weita’.
The general impression of many farmers was that cultivar diversity is decreasing. It was admitted that several cultivars of yam had already been lost. The situation is most likely worse with some of the other crops that don’t enjoy the high prestige value of yams.
Agroforest Vertical Structure Vertical structure, or canopy stratification, was determined
by grouping the major occurring species on the farms by height
classes. Results are presented pictorially in a typical cross-section of a Pohnpei farm (fig. 3)
The main upper canopy rarely exceeds 20 meters, and is dominated by coconut (92 trees/ha) and breadfruit (72 trees/ha), with occasional mango, kapok, or forest remnants reaching to 26-28 meters. A patchy sub-canopy, more prevalent in areas in a semi-fallow stage, is dominated by Ylang-ylang (Cananga odorata, at 47 trees/Ha), yam (Dioscorea spp.) vines (29 plants/ Ha), and younger upper canopy species, and reaches 8-12 meters.
The main sub-canopy varies from 2.5 to 8 meters above the ground, and is made up mainly of plantains and bananas (110 and 49 plants/ha), Hibiscus (Hibiscus tiliaceus, at 37 trees/ha), Indian Mulberry (Morinda citrifolia, at 30 trees/ha), yam vines, soursop (Annona muricata, at 17 trees/Ha), Rose apple (Eugenia
USDA Forest Service Gen. Tech. Rep. PSW-GTR-140. 1993. 49

Figure 3-Cross-section of a typical Pohnpei Agroforest.
jambos, at 5 trees/ha), and several other secondary vegetation species that are allowed to grow.
The understory is characterized by numerous plants that reach maturity at below 2.5 meters. The aroids, mainly Alocasia sp. (47 plants/ha), and sakau (137 plants/ha) are the most common, along with pineapple, Colocasia and Cyrtosperma taros, and various herbs of Curcuma spp. Several low bush species, grasses, ferns, and herbs occur on the farms, and are considered as weeds.
Agroforest Horizontal and Temporal Structure Based on a combination of reported farm age and estimated
age of dominant existing vegetation types as noted in the field, four general agroforest successional or development stages were identified. The general characteristics of each of the stages are:
Stage 1 - Establishment - Farming is initiated on new land. Initial clearing of undergrowth, and girdling of large forest trees with fire or knife is done, working out from the house. Crops are usually characterized by banana, kava, and other fast-growing food crops. Perennial tree crops have been planted but are not yet bearing. Many secondary vegetation or upland forest species remain. This stage was represented by only one 2-year old farm in Nett municipality. Stage 2 - Early Agroforest - Tree crops come into bearing and reach maximum yield, while farm expansion continues to land limits. Secondary vegetation and/or upland forest species are gradually replaced by agroforest species through slashing, ring-barking, and cutting. Stage 2 was represented by 17 farms
in Kitti (2), Madolenihmw (6), Nett (4), Sokehs (4), and Uh (1). Farm ages varied from 14-41 years, with an average age of 29 years. Stage 3 - Late Agroforest - Slow decline in production due to tree crop age, increased disease and pests, and possible soil fertility decline. Management begins to drop off. Stage 3 was represented by 25 farms in Kitti (9), Madolenihmw (5), Nett (3), Sokehs (2), and Uh (6). Farm ages varied from 23-100 years old, and averaged 78 years. Younger farms were those that had been started on land that had previously been in agroforestry, and had gone fallow. Stage 4 - Abandonment/Secondary Vegetation Suc-cession - Entire land or various large sections of farm are allowed to revert to secondary vegetation fallow. Some areas, especially near the residence, may continue to be farmed, but use is made of more intensive methods, i.e., mulching, clean weeding, addition of wood ash. Stage 4 was represented by 11 farms in Kitti (4), Madolenihmw (5), and Sokehs (2). Farm ages ranged from 24-100 years with an average age of 79 years. The younger farms had been abandoned for various reasons, most often a lack of available labor. Density, or the number of individuals of a species per
hectare, was calculated for the survey plots overall (table 4). Eight of the most important species (based on total number and frequency) were chosen, representing the three major vegetation types: agroforestry, secondary vegetation, and up-
50 USDA Forest Service Gen. Tech. Rep. PSW-GTR-140. 1993.

land forest. These were then compared to determine variation in Stage 1, farms, where it is found close to the house. On older vegetation patterns over the distance zones (see “Methods”) and farms, sakau is spread more evenly over distance zones but at successional stages. lower densities. Yam is grown more evenly across the farms,
The two most important species of agroforest root crops especially in the two middle age stages (fig. 5). This is probon Pohnpei are sakau and yams. Sakau, a plant which prefers ably due to the secrecy with which Pohnpeians regard yams, fertile soil with high organic matter content (Lebot and Cabalion, preferring to spread them out across the farm rather than 1988), shows a typical pattern of species requiring newly grouping them where a casual passerby might see them. Again cleared land (fig. 4). It is especially prevalent on the new, or in newer farms, yam is found in close to the house in the
Figure 5-Density of yam (Dioscorea sp.) by distance from house and farm successional stage.
USDA Forest Service Gen. Tech. Rep. PSW-GTR-140. 1993. 51

newest farm. Density is not affected by development stage as would be expected, since women's child care responsibilities much since yam is intensively cultivated, including fertiliza- require them to work mainly near the house. Densities of the tion using a grass (Cyrtococcum patens) and various types of plantain also drop with age, perhaps due to the closing of the tree leaves, especially Hibiscus tiliaceus. canopy, decreasing fertility, and increasing nematode popula-
Agroforest tree crops are represented by plantain (fig. 6) tions (especially the banana burrowing nematode, Radolphus and breadfruit (fig. 7). Generally, plantain is grown more densely sp). Density of breadfruit in the young farm is very high close to near the house and falls off with distance from the house in all the house, probably due to heavy planting to allow for some stages. Since plantain is more a "women's crop," this pattern loss-all trees were very young and small. Density was rather
Figure 7-Density of breadfruit (Artocaipus altilis) by distance from house and farm successional stage.
52 USDA Forest Service Gen. Tech. Rep. PSW-GTR-140. 1993.

consistent across other stages of farms, except that it increases in distances, except for in stage 4 farms, where density is higher stage 3 farms with distance from the house, perhaps due to the further from house, probably due to abandonment of land fur-increased suckering of older trees. Overall, results show that thest from house. Adenanthera, on the other hand, is considered farmers plant breadfruit across the farm with little regard to a “weed tree” in agroforest, and is usually cut when it is quite distance from the house. small. There was none on the youngest farms, and it was only
Secondary vegetation is represented by Hibiscus (fig. 8) and found at relatively high densities in stage 4 farms that had been Adenanthera sp. (fig. 9). Hibiscus is typical of a secondary more or less allowed to revert to secondary vegetation. vegetation species that is allowed and even encouraged in the The last vegetation type represented in Pohnpei agroforest agroforest. Densities are fairly constant over both stages and was the upland forest type, represented by Campnosperma sp.
Figure 9-Density of Dalbergia candenatensis by distance from house and farm successional stage.
USDA Forest Service Gen. Tech. Rep. PSW-GTR-140. 1993. 53

(fig. 10), a large jungle evergreen tree, and the smaller tree fern Campnospernma near the house. Tree ferns show a similar pat(Cyathea sp.) (fig. 11). Campnosperma shows a pattern typical tern, gradually being replaced as farms are developed, and thenof large remnant upland species. It is common in younger farms, coming back during abandonment and fallow. is gradually cut out as farms get older, and then begins to comeback as farms are abandoned. Large trees are not allowed to Seasonalitygrow too near the house, for fear they will fall on the house Most of the herbaceous species and a few of the tree crops induring a typhoon, thus the low density or absence of the indigenous Pohnpei agroforest were not observed to be
Figure 11-Density of tree fern (Cyathea spp.) by distance from house and farm successional stage.
54 USDA Forest Service Gen. Tech. Rep. PSW-GTR-140. 1993.

seasonal in production. Several crops which were determined to be physiologically seasonal are shown in figure 12. Yam (Dioscorea spp.) was also found to be somewhat seasonal, although most Pohnpeians reported that certain cultivars could be grown all year. The major yam planting, however, corresponds with the dryer trade-wind season, and part of this is probably due to the higher incidence of a fungus disease, Anthracnose (Colletotrichwn gloeosporioides), on young vines of yams planted early, leading to decreased yields and loss of whole plants in severe infections.
Summary and Conclusions The Pohnpei indigenous agroforestry system is the result of
thousands of years of evolution. As a result, it has become highly integrated into both the environment and the culture of the island. Pohnpei indigenous agroforestry is similar to subsistence systems in other parts of the Pacific, many of which employ the use of few external inputs, effective accumulation and recycling of natural nutrients, and reliance on genetic diversity. The indigoenous agricultural technologies that make up these systems are the result of an understanding of local conditions and knowledge of the ways of managing local energy and material resources.
These technologies are practical techniques that have been developed under a specific set of economic and social conditions.
On Pohnpei, the pressures of a rapidly increasing population and the growing desire to participate in the world cash economy are leading to a decline of the largely subsistence-oriented agroforestry system. Increased urban migration and rapidly increasing food and consumer imports are leading to stresses on the rural social system in general. The situation is no different from other island states in the Pacific.
The challenge facing Pacific island agriculturalists is to improve agriculture in ways that retain the ecological and social strengths of traditional agroforestry while meeting the needs of the present and future populations. One major opportunity may be the integration of cash crops into existing agroforestry systems. This is particularly appropriate since it does not entail major structural, land-use, or social changes, yet can improve the cash income of the rural population. Efforts are being made by the Pohnpei State Division of Agriculture to integrate pepper into the indigenous system by planting it under breadfruit and coconut trees. Other spice or specialty crops, such as ginger, cardamom, nutmeg, and cloves are also being introduced. A few of the indigenous crops, for example, sakau, may have export potentials. Sakau, together with yams and pigs, are already
Figure 12-1988 seasonality of selected crops on Pohnpei Island.
USDA Forest Service Gen. Tech. Rep. PSW-GTR-140. 1993. 55

becoming important cash crops in the local market. Increased efforts into developing these crops through cultivar selection, research on improved management, and expansion of markets are needed.
Opportunities for improving the indigenous agroforestry system also exist through improved research on optimal agroforest structural design, species interactions, and maintenance of soil fertility. Research into canopy dynamics and optimization of light capture by plants can be done on existing farms to make recommendations to farmers on optimal densities and mixtures of important crops. Increased studies of fertility dynamics under traditional management and under improved systems might help to -tend the cropping period and improve both sustainability and production from increasingly limited land resources.
Social research is also needed to determine availability and use of labor in the rural areas, as well as exploring the changing attitudes among the younger generations toward agriculture. Methods of preserving traditional agricultural knowledge must also be developed and applied to save this valuable, but quickly disappearing, resource.
Reliable quantitative data on structure, production, and seasonality is needed to improve existing systems in the Pacific islands. This study has attempted to address this need using fairly simple methods that can be applied on Pohnpei and other islands. It is hoped that other researchers will improve and expand upon these methods and apply them to further study of indigenous Pacific island agroforestry systems. Only then will the agricultural knowledge and technologies developed over thousands of years continue to serve Pacific islanders into the future.
Acknowledgments This paper is a modified chapter from a thesis presented to
the Agronomy and Soil Science Department at the University of Hawaii in partial fulfillment of the requirements for a Master’s degree. The authors would like to thank thesis committee members Drs. Russ Yost, Tom Giambelluca, and the late John Street for their support and assistance during the long process. Dr. Harley Manner of UOG shared his extensive field experience, and Ed Pettys, Hawaii State DOFAW, and Len Newell, USFS, assisted in every step of the way, sharing their knowledge of Micronesia. The Fast-West Center generously supported the main author for nearly three years at UH as a student grantee, and the School of the Pacific Islands, Inc. provided much-appreciated financial and moral support in the field. Thanks to the Division of Agriculture Staff, especially Chief Adelino Lorens, who served as a colleague and mentor on Pohnpei, and Morea
Veratau, who was always available to help. Sincere thanks to extension agents Claudio Panuelo, Elper Hadley, Alpenster Henry, Marcellino Martin, and Augustine Primo who shared their knowledge and experience as they assisted with field data collection. Special appreciation is due to the main author's wife, Pelihter, who acted as translator, advisor, and partner during the entire project. Last, our sincere gratitude to all the hundreds of Pohnpeians who graciously put up with our intrusion upon their privacy and shared their extensive knowledge and overwhelming hospitality with “mehnwai.”
References
Barran, J. 1961. Subsistence agriculture in Polynesia and Micronesia. Bishop Museum Bulletin 223. Honolulu, HI ; 94 p.
Bascom, W.R. 1965. Ponape: A Pacific economy in transition. Anthropological Records, Vol. 22. Berkeley, CA: University of California Press; 157 p.
Falanruw, M.C.; Cole, T.; Whitesell, C. 1987. Vegetation types on acid soils of Micronesia. In: Proceedings of the Third International Soil Management Workshop on the Management and Utilization of Acid Soils in Oceania. Republic of Palau. Feb. 2-6, 1987; 235-245.
Falanruw, M.; Maka, J.; Cole, T.; Whitesell, C. 1990. Common and scientific names of trees and shrubs of Mariana, Caroline, and Marshall Islands. Resource Bulletin PSW-26. Berkeley, CA: Pacific Southwest Research Station, Forest Service, U.S. Department of Agriculture; 91 p.
Glassman, S.F. 1952. The flora of Micronesia. Bishop Museum Bulletin No. 209. Honolulu, HI; 152 p.
Haun, A. 1984. Prehistoric subsistence, population, and socio-political evolution on Ponape, Micronesia. PhD dissertation. University of Oregon; 311 p.
Keating, B.H.; Mattey, D.P.; Naughton, J.; Helsley, C.E.; Epp, D.; Lazarewicz, A.; Schwank, D. 1984. Evidence for a hot spot origin of the Caroline Islands. Jour. Geophysical Res., Vol. 89. No. B-12: 9937-9948.
Laird, W.E. 1983. Soil survey of Island of Ponape, Federated States of Micronesia. USDA Soil Conservation Service; 81 p. w/maps.
Lebot, V.; Cabalion, P. 1988. Kavas of Vanuatu: Cultivars of Piper methysticum Forst. South Pacific Commission Tech. Paper No. 195. Noumea, New Caledonia; 191 p.
MacLean, C.; Cole, T.; Whitesell, C.; Falanruw, M.; Ambacher, A. 1986. Vegetation survey of Pohnpei, Federated States of Micronesia. Resource Bulletin PSW-18. Berkeley, CA: Pacific Southwest Research Station, USDA Forest Service; 9 p. + 11 maps.
National Oceanic and Atmospheric Administration. 1987. Local climatological data: annual summary with comparative data: Pohnpei, Eastern Caroline Islands, Pacific. NOAA, National Climatic Data Center, Asheville, North Carolina; 5 p.
Petersen, G. 1976. Ponapean agriculture and economy: politics, prestige, and problems of commercialization in the Eastern Caroline Islands. PhD dissertation. Columbia University; 317 p.
Rehg, K.L.; Sohl, D. 1979. Ponapean-English dictionary. Honolulu, HI: University of Hawaii Press; 252 p.
Van der Brug, O. 1984. Water resources of Ponape, Caroline Islands. Water Resources Investigations Report 83-4139. USGS. Honolulu, HI; 171 p.
56 USDA Forest Service Gen. Tech. Rep. PSW-GTR-140. 1993.

Appendix 1 MEHN PEIDEK OHNG SOUMWET FARMER INTERVIEW PROTOCOL
Farmer name: Title: Age: Location of farm: Size of land (hectares):
I. Family:
Name Sex Age Relation Occupation (if any)
II. Farm History: -How did you learn to farm?-When did you start farming on this land?-How long has this land been farmed?-How much of this farm have you personally planted?-Have you planted commercial crops?
III. Soils: -What are the different types of soils on your farm?-Were the soils more fertile in the past? How do you know?-Which plants indicate good/bad soil?-How do you maintain soil fertility?-How much land can support your family?
IV. Animals: Type Sex Number Management Other
Cattle Chickens Dogs Goats Pigs Water Buffalo
V. Labor: -What are the main labor inputs on your farm?-How many of the family work on the farm? How often?-Who is responsible for what tasks?
VI. Tools:-What farming tools do you own/use?
VII. Other Inputs:
-Do you use fertilizers/pesticides on your crops? -Do you purchase any inputs?
VIII. Fallow/Crop Mixes: -Do you fallow your land? How often? Why?-What are the main considerations in clearing land?-Which trees/plants are most useful? least useful? why?-What do you consider in spacing crop plants?-Which plants are shade-loving? sun-loving? -Which plants grow well together? poorly together? why?
IX. Planting: -How do you decide how much to plant?-What are the best locations for planting each crop?-How often do you plant/replant perennials?-What are the best times for planting specific crops?-Where do you get planting material?-How do you plant specific crops? (Tools, type of hole, etc.)-What restrictions do you follow (taboos, magic)? Do they
work?
X. Care of Agroforest:
-What are the main husbandry tasks that need to be done?-How often do you carry them out?-How do plants get their nutrients?-What causes a healthy crop plant? unhealthy one?
XI. Crop and Cultivar Diversity Importance:
-Do you grow more than one cultivar of certain crops? How many?
-Are there yield and/or seasonality differences between cul-tivars?
-How do you differentiate between cultivars of important crops?
XII. Yield and Production:
-Does your agroforest produce enough for your family needs? -Do you, market agroforest products? About how much/
month?
XIII. Social/Prestige Participation
-Which first-fruit (nopwei) tributes do your kousapw do? -Do you plant crops, raise animals for prestige purposes? -How often do you attend feasts/related events? What do
you bring?
XIV. Other:
-Why do you practice traditional agroforestry?-Is agriculture changing on Pohnpei? Explain.-What are your future plans for your land?-What are some constraints in farming on Pohnpei?
USDA Forest Service Gen. Tech. Rep. PSW-GTR-140. 1993. 57

Appendix 2
Farm Survey Form
58 USDA Forest Service Gen. Tech. Rep. PSW-GTR-140. 1993.

Yapese Land Classification and Use in Relation to Agroforests1
Pius Llyagel2
Abstract: Traditional land use classification on Yap Island, especially in regards to agroforestry, is described. Today there is a need to classify land on Yap to protect culturally significant areas and to make the best possible use of the land to support a rapidly growing population. Any new uses of land should be-evaluated to assure that actions in one area, even private property, do not damage the property of others.
Long before Europeans were speculating about the exist-ence of an undiscovered continent thought to be located in the Pacific, there was complete consensus in thought of leaders on Yap about the boundaries and usage of each bit of land on Yap. Most all land on Yap is privately owned within a system of family estates. This paper gives a general look at the way lands were classified by Yapese and about the use of these lands and the proper conduct on these lands.
Land Categories Land in Yap is categorized by the intensity of usage. If one
had to describe “agroforests” in Yapese, they would probably refer to ulane binau (within the village) as this is where most agroforestry occurs. These are the most valuable lands to Yapese. The resources of these lands provide Yapese with food, materi-als for shelter and even materials for clothing. The village agroforests are also important culturally for they contain many categories of land parcels, ranging from stone platforms associ-ated with ancestral spirits of an individual family, to community meeting houses for the village. Different degrees of restriction apply to different categories of land. For example, some areas, referred to as tabgul are restricted to all but certain old people. Other areas are part of a particular household group. Some areas are restricted to women or lower classes. Gardens and taro patches are the private areas of their makers. The resources of other areas between villages are more freely available to people from those villages. Some areas are designated as playgrounds for young folks to play freely and even make noise.
1 An abbreviated version of this paper was presented at the Workshop on Research Methodologies and Applications for Pacific Island Agroforestry, July 16-20, 1990, Kolonia, Pohnpei, Federated States of Micronesia.
2 Forester, Division of Forestry, Department of Research & Development, Colonia, Yap FSM 96943.
Because of these different uses of land within the agroforests of Yap, there is a respect, or lior, for the village and certain etiquette is observed, such as showing signs of respect and not wandering about, especially when there is a funeral or a meet-ing of important people. When walking through another’s village, one should obtain permission and check along the way to determine if there are any tabgul areas along the path where some members of the group should take alternate paths. Taro patches are private property and some are restricted to younger people or to women. In some patches it is forbidden to use metal implements.
Beyond the village area are the melie areas where gardens are made. These areas are used intensively for a while and then left to go fallow. Gardens are kept out of view and often pro-tected by certain plants from being harmed by the view of certain people. People do not trespass on the gardens of others. Large trees are often left undamaged to serve as boundary markers.
The next zone of lands in terms of intensity of usage are areas of secondary vegetation. These are somewhat weedy areas with small trees that were probably used as gardens and then left to go fallow.
Finally, there are lands that are not intensively used. Fewer restrictions apply on these lands, except for areas where there are graveyards or shrines. Some areas have groves of trees which have been planted as materials for canoes, etc. Materials from such areas are generally used for community construction such as community houses and permission is required to harvest from such areas.
USDA Forest Service Gen. Tech. Rep. PSW-GTR-140. 1993. 59

Design and Analysis of Mixed Cropping Experiments for Indigenous Pacific Island Agroforestry1
Mareko P. Tofinga2
Abstract: Mixed cropping (including agroforestry) often gives yield advan-tages as opposed to monocropping. Many criteria have been used to assess yield advantage in crop mixtures. Some of these are presented. In addition, the relative merits of replacement, additive and bivariate factorial designs are discussed. The concepts of analysis of mixed cropping are applied to an example of an alley cropping (a type of agroforestry) experiment, and a basic agroforestry research guide is described.
Mixed cropping is the growing of two or more crops simul-taneously on the same land, either with or without distinct row arrangement (Andrews and Kassam 1976), and includes the practice of agroforestry. Mixed cropping was probably the first type of organized crop production (Francis 1986, Plucknett and Smith 1986) and is still widely practiced in the developing world (Osiru and Willey 1972). The fact that intercropping is still widely used in developing countries indicates that the advan-tages of mixed cropping commonly outweigh the disadvantages in regions where mechanization is rare, inputs are low, and stability of yield is important (Andrews and Kassam 1976, Harwood and Price 1976, Okigbo and Greenland 1976, Francis and others 1976). The fact that mixed cropping is also being seriously considered for certain conditions in developed coun-tries further indicates that this strategy may also be applicable to some forms of mechanized agriculture.
Measuring Yield Advantages Nazer and others (1987) have commented on the confus-
ingly large number of indices for assessing the yield advan-tage of crop mixtures compared to pure stands. The large number of indices partly reflects the differences in criteria used to appraise “advantages,” often encompassing aspects of quality or value as well as yield, but also reflect the different reasons for which an assessment is made, i.e., an ecological vs. an agronomic assessment.
Ecological Criteria Probably the oldest established measure of the yield advan-
tage of crop mixtures is the Relative Yield Total (RYT), intro-duced by de Wit (1960) and explained more fully by de Wit and van den Bergh (1965). The RYT index was designed as a measure of the extent to which various crop components shared
1 An abbreviated version of this paper was presented at the Workshop on Research Methodologies and Applications for Pacific Island Agroforestry, July 16-20, 1990, Kolonia, Pohnpei, Federated States of Micronesia.
2 Lecturer (Crop Science), School of Agriculture, University of the South Pacific, Alafua Campus, Apia, Western Samoa.
60
common resources, rather than as a direct measure of yield advantage. RYT is measured by the expression:
(1.1) Relative Yield Total (RYT) = Yij +
Yji K
Yii Yjj
where Yii and Yjj are the biomass yields per unit area of compo-nents I and J in pure stands, and Yij and Yji are their respective yields in mixtures with each other. The mixtures
Yij and Yji Yii Yjj
are termed the relative biomass yields of I and J respectively. A RYT of 1.0 is said to indicate that the components of the mixture fully share the same limiting resources, i.e., they are fully in competition with each other (de Wit 1960, Trenbath 1974). Values of RYT = 1.0 would also occur in the total absence of competition, e.g., if the density of the monocultures and mix-tures were sufficiently low (e.g., Harper 1977, Snaydon and Satorre 1989). A RYT value of 2.0 would indicate that the components did not share limiting resources at all, i.e., they did not compete at all for limiting resources. Values between 1.0 and 2.0 would indicate that the components were only in partial competition with each other. RYT values of less than 1.0 would indicate that the crop components suppressed each other more than could be accounted for by competition alone, e.g., by allelopathy (Rice 1974). RYT values of greater than 2.0 would mean that at least one component actually stimulated the growth of the other, but such values have rarely, if ever, been observed. Values close to 1.0 or between 1.0 and 1.5 are most common (Trenbath 1976).
Agronomic Criteria The most commonly used index of agronomic yield advan-
tage is the Land Equivalent Ratio (LER), first proposed by Willey and Osiru (1972). This index is in fact identical to RYT, since it is obtained by the expression:
(1.2)LER = Yij + Yji K
Yii + Yjj
where the symbols are defined as in equation 1.1, except that Y represents grain yields per unit or economic yield rather than biomass yield. The main difference between the two indices is in interpretation, rather than expression, since LER is considered a measure of the efficiency of grain or economic yield production of the crop mixture, compared with sole crops, and based on land use. An LER value of 1.0 indicated that the same amount of land would be required to obtain a given amount of economic yield of each component, regard-
USDA Forest Service Gen. Tech. Rep. PSW-GTR-140. 1993.

less of whether the two components were grown in mixtures or pure stands. An LER value of 1.2, for example, would indicate that 20 percent more land would be needed to produce a given amount of each of the two crop components in pure stands as in mixtures. The main disadvantage of this index is that it assumes that the proportion of components harvested in the mixture is the required proportion. Several suggestions on assessment of yield advantages have been proposed where a pre-determined amount of one component is required, e.g., a given yield of a staple crop (Willey 1979).
Design and Analysis of Mixed Cropping Experiments
Both replacement and additive experimental techniques have been used in studies of plant competition and mixed cropping (Snaydon and Satorre 1989), though replacement techniques have been more widely used, probably because of the impetus given by de Wit (1960) and the criticisms of the
additive technique made by Harper (1977). However, recent work suggests that the replacement technique may be inad-equate to assess competitive interactions and can give mis-leading results (Firbank and Watkinson 1985, Connolly 1986, Snaydon and Satorre 1989), since the conclusions depend on the density used in monocultures.
The basic problem with the replacement technique is that it confounds intercomponent and intracomponent competition, i.e., whenever the density of component I is increased, that of com-ponent J is decreased accordingly, and vice versa. This is equiva-lent to carrying out an experiment with, say, N and P fertilizer and whenever more N is applied, less P is applied. Clearly, if the separate effects of I and J on each other are to be identified, the densities of the components must be varied independently, i.e., an additive design used. Other designs will be considered in more detail later.
The hypothetical examples shown in figure 1.1 indicate that replacement designs confuse the interpretation of RYT (or LER). When the components compete with one another, RYT (or LER)
Figure 1.1a-1.1d
USDA Forest Service Gen. Tech. Rep. PSW-GTR-140. 1993. 61

values can vary between 1.0 and >2.0, depending on the density of the monocultures and the nature of the yield-density relation-ship. Assuming that the density-yield response is asymptotic, and that the components do not compete with each other, the RYT values of a 50:50 replacement mixture would be 2.0 as long as the monoculture was equal (or greater than) twice the asymptotic density (fig. 1.1 c). However, the RYT value would be less than 2.0 when the monoculture density was less than twice the asymptotic density (fig. 1.1b), and would 1.0 if the monoculture density was so low that no competition occurred between plants in each component (fig. 1.1 a). Conversely, RYT values of >2.0 would be obtained (fig. 1.1d) when monoculture density was twice the asymptotic density, and where the yield declined at high density, as often happens with grain crops (Willey and Heath 1969). In contrast to this, the RYT values of 1:1 additive mixtures would always be 2.0, regardless of mo-noculture density or density response, since the yield of each component in mixture is always compared with the yield at an identical density in monoculture.
Both replacement and additive designs can be thought of as limited samples of a bivariate array based on densities of compo-
nents I and J (fig. 1.2). Replacement series constitute a linear sample running diagonally across the array and normally ending with identical densities for the two components (fig. 1.2), though the pure stand densities of the two components need not be identical. Additive series constitute horizontal and vertical lines, in which the density of one component is held constant, while that of the other is increased (fig. 1.2); a 1:1 mixture therefore occurs when the density of both components in the mixture is the same as that in its pure stand (fig. 1.2). Both replacement and additive series can be used at a wide range of overall densities. By presenting density combinations as bivariate arrays (fig. 1.2), it becomes apparent that, by including two pure stand densities for each component in an experiment, where one density is double the other, than the experiment can be analyzed as both a replacement and an additive design. However, it is also clear that such restricted sampling of bivariate array gives only a limited interpretation of the whole response pattern, and that ideally it would be better to use a bivariate factorial design, in which all possible combinations of several densities of each of the compo-nent is included.
Figure 1.2-A bivariate array of the densities of two components (I and J) grown in monocultures and various mixture combinations. The diagram shows how replacement and additive series are limited samples of a much wider bivariate factorial array, and how a single mixture A can be seen either as a 50:50 replacement mixture or a 1:1 additive mixture.
62 USDA Forest Service Gen. Tech. Rep. PSW-GTR-140. 1993.

Mixed Cropping Design and Analysis for Pacific Island Agroforestry
Agroforestry in the Pacific Islands may be classified as the simultaneous cropping of perennial and annual crops along with animals (Raynor 1987) or without animals (Finlay 1987). A modified form of an experiment involving the growing of taro (Colocasia esculenta) between alleys of trees (Gliricidia sepium and Calliandra callothyrsus) and using mulch from the trees to mulch taro (Clements and others 1987) is presented as an ex-ample of an agroforestry experiment, where use of designs and analysis in mixed cropping studies may be applied. Modification of the experiment is necessary since agroforestry in the Pacific normally involves many crops grown between perennials.
The modified form consists of the addition of maize to the experiment, alternating with the rows of taro. The experiment is a 2 x 3 factorial in Randomized Block Design replicated three times. The treatments consist of a) 2 tree species (Gliricidia and Calliandra), b) 3 tree spacings (4, 5, and 6 m between rows), c) one crop stand (taro and maize). In addition, a pure stand of taro and a pure stand of maize were included. The densities of the crops (taro and maize) in mixtures is the same as their densities in pure stands, i.e., an additive design.
Analysis of variance can be performed separately for each crop (taro and maize) on all measures, log transformation can be used where necessary to homogenize the variance. Analysis of variance (ANOVA) can also be carried out on derived measures, such as Relative Total Yield (RYT) and Land Equivalent Ratio (LER) on data from taro and maize. ANOVA can be computed using the methods of Snedecor and Cochran (1980). Yield ad-vantages of mixtures (taro and maize) can be expressed as Relative Yield Total for biomass (de Wit 1960, de Wit and van den Bergh 1965) or Land Equivalent Ratio for economic yield (Willey and Osiru 1972, Trenbath 1976.)
Since the function of the tree species in the experiment is to provide mulch for the crops through regular pruning, ANOVA can be carried out on the amount of mulch produced. ANOVA of the nutrient contents of the mulch, e.g., N, P, K, would also be useful to assess the performance of the trees for alley cropping and other types of agroforestry.
A Research Guide for Pacific Island Agroforestry
Since tree crop components of agroforestry have already been established in many cases, and yields may not be easy to assess, it seems sensible to concentrate on the annual or semi-perennial components of the system to be studied. Two crop species could be grown between tree crops which should prefer-ably be in rows. Having both tree crops and annual or semi-perennial crops in rows will facilitate some mechanization.
In selecting the annual or semi-perennial species compo-nent of the system, crops of contrasting growth habits should be selected, e.g., contrasting canopy types, morphology, and root systems. These contrasting types often give yield advantages when grown together (Tofinga 1990). A range of cultivars of each species may then be grown together in two crop mixtures at
optimum plant densities for each crop. Pure stands of the culti-vars of each crop should be included for comparative purposes and for the assessment of yield advantages of mixtures com-pared with pure stands. The densities of crops in mixtures should be the same as their densities in pure stands, i.e., an additive design should be used.
The crops should be grown in alternate rows. Analysis of this “screening trial” using indices mentioned earlier should indicate the best mixture of the crop species. The selected crop mixture can then be grown in different planting patterns, e.g., both crops can be grown in the same row, in alternate rows, in alternating double rows, and so on. Planting patterns have been known to influence the performance of crops in mixtures (Mar-tin 1979, Tofinga 1990).
Having identified the best planting pattern for each crop, the effects of several densities of both crops and several fertilizer levels could be investigated together or in separate experiments. These various trials should cover the basic research necessary to establish an agroforestry system based on scientific methodol-ogy. Such agroforestry systems should give larger yield advan-tages compared with growing the crops in monocultures. Grow-ing crops in monocultures is an introduced practice which has generally been found to be unsuitable for the Pacific islands, mainly because it gives less overall yield compared to growing crops in mixtures (Tofinga 1990). The basic research method described in this paper may be adapted to include three or more crop combinations with perennial trees. The effect of the inter-crops on the trees could be assessed by comparing the yield of trees in agroforestry mixtures with yield in pure stands.
Conclusions Agroforestry will play a major role in the Pacific islands as
population continues to increase and the challenge for more efficient food production systems becomes a reality. More re-search will have to be carried out to improve traditional agroforestry. Improved research depends on the use of improved designs and analysis methods. The use of additive designs is recommended since replacement design can give misleading results. The bivariate design may be too large and complex to manage. Agroforestry experiments should include two or more crops grown between perennial trees (which may or may not be a crop) instead of just one crop grown between non-crop trees This is because agroforestry in the Pacific involves many crops in mixtures.
Relative Yield Total (RYT) may be a useful index to use in agroforestry experiments since it measures resource use by the mixture. Land Equivalent Ratio (LER) is also useful from an agronomic point of view. Separate analysis of variance of yield and yield-related characteristics for each crop may give an idea of the effect of one crop on another and the time of competition during crop growth. These are useful in deciding which mixtures; complement each other in an agroforestry situation and when to reduce competition between the crop components through ap-propriate management. The development of basic research meth-odologies for Pacific island agroforestry is an essential frame-work for future improvement of these systems.
USDA Forest Service Gen. Tech. Rep. PSW-GTR-140. 1993. 63

Acknowledgments I thank Ray Snaydon for useful discussion on analysis and
experimental designs presented in this paper, R. Morton for statistical advice, and Silaumua Aloali’i for typing this paper.
References Andrews, D.J.; Kassam, A.H. 1976. The importance of multiple cropping in
increasing world food supplies. In: Papendick, R.I.; Sanchez, P.A.; Triplett, G.B., eds. Multiple cropping. Amer. Soc. Agron. Spec. Pub. 27; 1-10. Clements, R.; Ashgar, M.; Tuivavalagi, N. 1987. personal communications. Connolly, J. 1986. On difficulties with replacement series methodology in
mixture experiments. Jour. Appl. Ecology. 23: 125-137. de Wit, C.T. 1960. On competition. Verslag Landbouwkundige Onderzoek 66:
1-81. de Wit, C.T.; van den Bergh, J.P. 1965. Netherlands. Jour. of Agric. Sci. 13:
212-221. Finlay, J. 1987. Agroforestry, an agricultural land-use system on atolls. Un-
published. Firbank, L.G.; Watkinson, A.R. 1985. On the analysis of competition. Jour.
Appl. Ecology. 22: 503-517. Francis, C.A. 1986. Distribution and importance of multiple cropping. In:
Francis, C.A., ed. Multiple cropping systems. New York, NY: MacMillan Pub. Co.; 1-19.
Francis, C.A.; Flora, C.A.; Temple, S.R. 1976. Adapting varieties for inter-cropping in the tropics. In: Papendick, R.I.; Sanchez, P.A.; Triplett, G.B., eds. Multiple cropping. Amer. Soc. Agron. Spec. Pub. 27: 235-253.
Harper, J.L. 1977. Population biology of plants. London: Academic Press. Harwood, R.R.; Price, E.C. 1976. Multiple cropping in tropical Asia. In:
Papendick, R.I.; Sanchez, P.A.; Triplett, G.B., eds. Multiple cropping. Amer. Soc. Agron. Spec. Pub. 27: 11-40.
Martin, M.P.L.D. 1979. Studies on mixtures of barley and field beans. PhD thesis. University of Reading, U.K.
Nazer, M.C.; Gliddon, C.J.; Choudhry, M.A. 1987. Assessment of advantages of wheat-pea intercropping through response models. Jour. Appl. Ecology. (in press).
Okigbo, B.N.; Greenland, D.J. 1976. Intercropping systems in tropical Africa. In: Papendick, R.I.; Sanchez, P.A.; Triplett, G.B., eds. Multiple cropping. Amer. Soc. Agron. Spec. Pub. 27: 11-40.
Osiru, D.S.O.; Willey, R.W. 1972. Studies on mixtures of dwarf sorghum and beans (Phaseolis vulgaris) with particular reference to plant population. Jour. of Agric. Sci. Cambridge. 79: 531-540.
Plucknett, D.L.; Smith, N.J.H. 1986. Historical perspectives on multiple crop-ping. In: Francis, C.A., ed. Multiple cropping systems. New York, NY: MacMillan Pub. Co.; 20-39.
Raynor, B. 1987. Agroforestry in Pohnpei, Federated States of Micronesia. Paper presented at the "Agroforestry in Tropical Islands" workshop, Feb. 23-27, 1987, at USP-Alafua, Western Samoa.
Rice, E.L. 1974. Allelopathy. New York, NY: Academic Press. Snaydon, R.W.; Satorre, E.H. 1989. Bivariate diagrams for plant competition
data: modifications and interpretation. Jour. Appl. Ecology. 26: 1043-1057.
Snedecor, W.G.; Cochran, W.G. 1980. Statistical methods. Fourth edition, Iowa: Iowa State Univ. Press.
Tofinga, M.P. 1990. Studies on mixtures of cereals and peas. PhD thesis. University of Reading, U.K.
Trenbath, B.R. 1974. Biomass productivity of mixtures. Advance in Agronomy 26: 177-210.
Trenbath, B.R. 1976. Plant interactions in mixed crop communities. In: Papendick, R.I.; Sanchez, P.A.; Triplett, G.B., eds. Multiple cropping. Amer. Soc. Agron. Spec. Pub. 27: 11-40.
Willey, R.W.; Osiru, D.S.O. 1972. Studies on mixtures of maize and beans (Phaseolis vulgaris) with particular reference to plant population. Jour. of Agric. Sci. Cambridge. 79: 519-529.
Willey, R.W. 1979. Intercropping - its importance and research needs. Part II. Agronomy and Research Approaches. Field Crop Abstracts 32(2): 73-85.
64 USDA Forest Service Gen. Tech. Rep. PSW-GTR-140. 1993.

General Considerations in Testing and Evaluating Crop Varieties for Agroforestry Systems1
Lolita N. Ragus2
Abstract: Introduction of new crops in agroforestry is often suggested as a way to improve productivity. This paper provides general guidelines in select-ing companion plant combinations and general considerations in evaluating, testing, naming, maintaining genetic purity and distributing crop varieties to farmers.
Agroforestry systems in the American Pacific range from subsistence to commercial levels. At the subsistence level, farm-ing activity is focused on production for the family, including distant relatives and friends. A minimum level of selling to neighbors, friends, etc. of produce possibly occurs. Common subsistence crops include breadfruit, banana and root crops such as taro and yam. This system is very common in American Samoa and Federated States of Micronesia. Hawaii, Guam and the Commonwealth of the Northern Marian Islands, on the other hand, have proceeded to the level of commercial fanning. The integration of production, processing, distribution and con-sumption of produce is well pronounced, particularly in Hawaii. Added values for produce are made through processing, which also lessens the problem of post-harvest losses from glut of production. In effect, farming is profit-oriented from the farm to the point of final end-users under commercial agroforestry sys-tems. Whatever system is involved, selection of appropriate crop varieties is an important decision producers have to make for their farming endeavor. This paper provides general consider-ations in selecting suitable crops and, particularly, factors impor-tant in testing and evaluating varieties with specific emphasis on agroforestry systems.
Crop Combinations Multi-storied cropping is typical in tropical agroforestry
systems. Full-grown trees of coconut or forest trees usually form the top canopy layer. Breadfruit, banana, and root crops such as taro and yam are at the lower canopy layers. Once cash crops such as vegetables are included in the system, the following factors must be considered:
a) shade-tolerance b) provision of good crop nutrition c) compatible crop combinations based on occurrence
of pests and diseases and yield. Below is a list of plants that grow well in companion plant
combinations:
1 An abbreviated version of this paper was presented at the Workshop on Research Methodologies and Applications for Pacific Island Agroforestry, July 16-20, 1990, Kolonia, Pohnpei, Federated States of Micronesia.
2 Agronomist, School of Agriculture and Life Sciences, Northern Marianas College, Saipan, MP 96950.
Sweet potato Okra, eggplant, tomato, yard long bean, winged bean, lima bean, maize
Cassava Sweet potato, swamp cabbage, pechay, let-tuce, garlic, squash, peanut
Taro Sweet potato, swamp cabbage and underneath any crop grown on trellis if canopy is not too thick
Yam On fruit trees or trellis
Development of New Crop Varieties To develop a sound crop breeding program, the needs of
concerned groups such as farmer/producers, traders, processors, and consumers must be considered. What crop traits are impor-tant to them? Duration and method of crop improvement would depends on breeding objectives. For example, to improve a commercial tomato grown in a certain community, problems encountered by the growers, and processors and the likes and dislikes of the consumers need to be evaluated. The next logical step is to determine what germplasm (whether local or foreign) is available and appropriate for the breeding objectives.
Options in breeding methods include introduction, selec-tion, and hybridization:
1. Introduction- This is the quickest and most convenient way of producing a new crop variety, especially if all traits present in the introduction are superior over the presently grown commercial crop varieties. The introduction could also be a parent in the breeding program for certain traits absent in the locally available commercial varieties. Guide-lines in using introductions in breeding programs are:
a. Proper recording of introductions - A record book detailing the Plant Introduction number, country of ori-gin, date received, and special characteristics is a must. b. Preliminary evaluations of introductions - The in-troductions are planted in short rows (lm) unreplicated in the experiment stations. Check varieties are included in the evaluation as reference. Characteristics such as reactions to certain pests and diseases, climate condi-tions, quality attributes potential/promising end-prod-ucts, and other traits are recorded and made available to public agencies and private sector. It is the responsi-bility of the requesting breeder to report to the donor institution the results of evaluation in his/her location. Instances when the originating source of introduced materials have to be acknowledged publicly by the recipients of these materials:
i. When materials are increased or distributed in their original form; ii. When distributing unique or novel line by modify-ing the genetic make-up of the original PI through
USDA Forest Service Gen. Tech. Rep. PSW-GTR-140. 1993. 65

conventional (inbreeding selection) or unconventional (fusion, DNA); iii. Specifying what specific traits are derived from the plant introductions.
2. Selection - Two primary sources of selections are the introduction of improved or relatively unimproved strains and varieties of crops from domestic or foreign sources, and well-adapted local varieties that are found to be variable. 3. Hybridization - This is an expensive and long-term en-deavor but results are rewarding. Important considerations in pursuing this program are available financial support, facilities including land, cold storage room, special equip-ment for special traits such as high amino acid contents, available germplasm, and trained manpower.
Evaluation and Testing Procedures Whatever forms of varieties are used (introduction, selec-
tions, or hybrids), they should undergo preliminary and ad-vanced trials prior to public use.
Preliminary Testing In preliminary testings of promising elite lines of crop
varieties, short rows (2m-5m), unreplicated and situated in ex-perimental stations are utilized. Two preliminary tests, such as during wet and dry seasons, are conducted to select the entries for further testings. Information obtained from preliminary test data (yield, number of days from emergence to maturity, pest and disease reactions and plant height) are important consider-ations in selecting entries to be included in multi-location trials. Enough seeds are produced for distribution to the prospective cooperators in the sites (usually farmers’ fields).
Multi-Location Testing or Advanced Testings In each testing site, a local coordinator committed to set-up
the experiment is needed. These coordinators from the different sites should meet once or twice a year to discuss problems and developments in the testings.
The following are the essential components of testing and evaluating crop varieties: selection of experimental sites, layout of the experiment, care and management of crops; data collec-tion, and analyses.
1. Selection of experimental sites- Criteria for site selec-tion are:
a. Accessibility to road to facilitate transport of agricul-tural supplies and hauling of produce; b. Representativeness of the area to soil and growing conditions in the community; c. Level or of uniform slope; d. Soil texture, depth, and type homogeneous over site; e. Irrigation water and drainage available when needed; f. Free from wind damage; g. Other considerations, e.g., willingness of the farmer cooperator to share land and perhaps labor, and local government willingness to promote the experiment
2. Layout of experiment- The following are the general considerations in layout of experiments: experimental de-sign, plot size and shape, block size and shape, number of replications, and arrangement of blocks and plots.
a. Experimental Design - Two commonly used experi-mental designs in variety trials are simple lattice and randomized complete block designs. The simple lattice design is very useful when handling a large number of varieties/lines during preliminary trials. It also reduces soil variation within the experiment. Furthermore, it al-lows the block size to be small. The block size is equal to the square roots of the total number of varieties tested. Two replications are acceptable in this design.
The randomized complete block design is used if entries are less than 20 for multi-location or regional testing. The experimental error is reduced by the block-ing which will account for soil heterogeneity caused by soil fertility gradients, soil slopes, etc. b. Blocking - Blocking is influenced by two factors―selection of the source of variability to be used, which is based on large and highly predictable source of variationsuch as soil heterogeneity, direction of insect migration and slope of the field; and selection of the block shapeand direction. The guidelines for selecting the appropri-ate block shape and direction are: - When there is only one gradient, use long and narrowblocks. The blocks are oriented perpendicular to thedirection of the gradient- When fertility gradient exists in two directions with one gradient much stronger than the other, consider the stronger gradient and follow the aforementioned guidelines. - When fertility gradient occurs in two directions with both gradient equally strong and perpendicular to each other, use any of these options:
i. Use square blocks as much as possible; ii. Use long and narrow blocks with their length perpendicular to the direction of one gradient and use the covariance technique for the other gradient; iii. Use latin square design with two-way blocking. - If the pattern of variability is not predictable, blocks should be as square as possible. The idea is to maxi-mize the variability of the block but to decrease variability between plots in each block.
3. Number of replications- The number of replications is influenced by:
a. Inherent variability of the experimental material; b. Experimental design used; c. Number of treatments to be tested; d. Degree of precision desired.
In general, the number of replications suitable for a variety trial is from four to eight.
Release of Germplasm After a new variety has been found acceptable through
evaluation and testing, the next step is to release it to the public. In the United States, the State of Agricultural Experiment Sta-
66 USDA Forest Service Gen. Tech. Rep. PSW-GTR-140. 1993.

tions (SAES) are responsible for the development and releases of improved varieties to their own states (ESCOP 1988). The following outlines the guidelines for the release of the new germplasm in the United States, which also may be useful for developing countries:
1. Availability and use of basic genetic materials a. Germplasm from the SAES’s programs are to be made available to foster research and cooperation by public and private scientists; b. Basic genetic materials (referring to plant materials possessing one or more potentially desirable characters useful for breeding work) will be released to all plant breeders who request them; c. Periodical releases of information will be made on the limitations of use and amount of materials for distribu-tion; d. No monopoly of use of genetic materials is to be held by any interests. Inbreeds, experimental lines and basic genetic materials should not be released prior to their release in the US;
2. Release of finished genetic materials a. Variety should not be released if not yet proven dis-tinctly superior to existing varieties in one or more char-acteristics or in performance in areas where adapted.
3. Policy Committee or Board of Review for Variety Release a. SAES Director should decide on what varieties to release to the public; b. SAES should form a policy committee or board of review responsible for reviewing the release of new varieties based on information such as performances, area of adaptation, specific use values, seed stocks, pro-posed methods of varietal maintenance, increase and distribution.
4. Interstate or Inter-agency Release Procedures a. If and when interstates test simultaneously the newly released variety, regional advisory committee may set guidelines for sharing of foundation seed stocks among states; b. If no interstate testing is done prior to variety release by the state, the state that develops the variety should offer seeds to all interested states for testing and in-crease; c. If the development of a variety is a cooperative effort from a state or states and a federal agency (USDA/ARS or USDA/SCS), there should be an opportunity for joint release by the concerned agencies. To determine the novelty and cataloguing of new varieties, the Services of the Association of Official Seed Certifying Agencies, US Plant Variety Protection Office, and the U.S. Patent and Trademark Office are tapped.
5. Protection and Restricted Release-The individual sta-tions may elect to protect and restrict release of certain germplasm for enhancing and supporting research through two ways, such as Plant Variety Protection (PVP) and utility patents. Unlike PVP Protection, utility patents do not allow automatically for the use of patented materials in research or plant improvement without approval or com-
pensation to the patent holder. The following are recom-mended to facilitate use of restricted germplasm:
a. Research clause stating exemption from seeking ap-proval for research use; b. Waiver of certain dominance rights of a patent over future patents on materials derived from the initial patent. Holders of patents on marketed materials derived from an earlier patent should be required to compensate the holder of that earlier patent only during the first five years of the life of that patent rather than the 17 years stipulated in the law. In both cases, users of patented materials should acknowledge the source of germplasm.
6. Preservation of Genetic Identity-The genetic identity (or parents) of all genetic materials should be known to the users. The genetic identity is established through such tech-niques as analyses of seed proteins, isozyme, and nuclear restriction fragment length polymorphism. 7. Naming and Registration of Varieties
a. Designation - The International Code of Nomencla-ture of cultivated plants is recommended for use in nam-ing new varieties. Designation should be brief. If a desig-nation is a name, one or two short words are acceptable. Meaningful number designations or combinations of words, letters, and numbers consistent with accepted procedures are also acceptable. b. Use of Names - The Federal Seed Act (53 Stat 1275) has provisions for use of varietal names. Identical germplasm should not be distributed or sold under dif-ferent names, varieties or brands. Using a variety name more than once in a given crop and giving similar names are to be avoided. As to the proposed names for the variety, check with Seed Branch, Check Grain Division, Agricultural Marketing Service, for clearance to avoid possible confusion, etc. c. Registering Varieties- After release of the crop vari-ety as recommended by the review board, contact Crop Science Society of American (CSSA) or American Soci-ety for Horticultural Science (ASHS). Procedures for the registration of varieties are available from CSSA and procedures for listing of varieties are available at ASHS. Materials registered at CSSA become part of the Na-tional Plant Germplasm System and small amounts of seeds are distributed to bona fide researchers.
Classes of Certified Seeds and Certification Standards
The “Certification Handbook,” published by the Associa-tion of Official Seed Certifying Agencies, defines the various classes of certified seeds and certification standards and pro-cedures.
Increase and Maintenance of Seeds 1. Breeder Seed
a. Responsibility of Maintenance - The originating sta-tion has to prepare a statement of plans and procedures
USDA Forest Service Gen. Tech. Rep. PSW-GTR-140. 1993. 67

for maintenance of breeder and foundation seeds. If it ceases to maintain breeder seed of a variety, the originat-ing state should notify in advance the interested states. A satisfactory plan has to be formulated between the origi-nating state and the interested states concerning the above situation or when the variety is distributed in several states. b. Supplying Sample of Seed to National Seed Storage Laboratory - The originating state needs to provide a sample of breeder seed of all newly released varieties to the National Seed Laboratory (NSL), Fort Collins, Colo-rado. This deposit is also required by CSSA for registra-tion of said new varieties.
2. Foundation Seed a. Multiplication of foundation seed - Authorized par-ties will be designated to multiply foundation seeds. b. Foundation Seed Program - Foundation seed program should recognize the following:
i. Qualified seed growers and seedsmen should have an opportunity to obtain appropriate planting stocks at equitable costs. However, selective allocations may be necessary to achieve quality increases to meet the needs of potential users. ii. When limited release is anticipated, federal and state agencies and private growers or seedsmen should be notified and given an opportunity to bid for that release. iii. Planting stocks of varieties developed coopera-tively with the agencies of USDA ordinarily will be made available through or with the concurrence of the seed stocks or certifying agency of the cooperat-ing state(s) at an equitable cost of qualified growers and seedsmen. Under condition #2, consideration may be given to applying for certificates of variety protec-tion under the Plant Variety Protection Act or some other form of protection.
Preparation and Release of Information 1. Coordination of publicity among states and agencies The following information should be prepared by the foster-ing state(s) and agency(ies) for information to the seed producers, distributors, and users:
a. Pertinent information such as basic facts of origin, variety characteristics, and data justifying the increase and release of a new variety;b. Information used in deciding upon release of a new variety;
c. Regional adaptation for National or Regional Adap-tations; d. Uniform date of release; e. Actions concerning patent, PVP including certifica-tion requirements.
2. Matching seed production and demand for varieties Promotional publicity in advance of the release of a new
variety or before seed is available or incomplete publicity fol-lowing its release are not desirable.
Recommendations With the fast developments observed now on some of the
American Pacific Islands, the possibility of extinction of rare species of crops is high. Clearing of forests or portions of them will certainly disturb the ecosystem and possibly cause losses of some species of crops due to cutting or burning. Hence, it is time to organize a regional collection of exotic and wild species of crops, especially indigenous varieties. For efficiency of collec-tion and maintenance, it is recommended that regional and national germplasm centers for priority crops in the American Pacific be established.
Acknowledgments I thank Belinda A. Pagcu for typing this manuscript.
References Asian Vegetable Research and Development Center. 1979. International
cooperator’s guide - Procedures for tomato and chinese cabbage evaluation traits. Taiwan, ROC.
ASPAC - Food and Fertilizer Technology Center. 1971. Extension Bulletin No. 11.
Briggs, F.N.; Knowles, P.F. 1977. Introduction to plant breeding. Reinhold Publishing Corporation; 426 p.
ESCOP. 1988. A statement of responsibilities and guidelines relating to devel-opment, release and multiplication of publicly developed germplasm and varieties of seed-propagated crops (Draft). USA.
Gomez A.K.; Gomez, A.A. 1984. Statistical procedures for agricultural re-search. John Wiley and Sons, Inc; 68 p.
Philippine Council for Agriculture and Resources Research and Development. 1985. Research techniques in crops. Book Series No. 35. Philippines; 512 p.
Poehlman, J.M. 1977. Breeding field crops. Westport, CT: The AVT Publish-ing Co.: 427 p.
Sommers, P. 1983. Low cost farming in the humid tropics; an illustrated handbook. Manila, Philippines: Island Publishing House, Inc. 38 p.
UPLB - NFAC Countryside Action Program. n.d. Guidelines for upland crops testing and evaluation; Laguna, Philippines.
68 USDA Forest Service Gen. Tech. Rep. PSW-GTR-140. 1993.

Documentation of Indigenous Pacific Agroforestry Systems: A Review of Methodologies1
Bill Raynor2
Abstract: Recent interest in indigenous agroforestry has led to a need for documentation of these systems. However, previous work is very limited, and few methodologies are well-known or widely accepted. This paper outlines various methodologies (including sampling methods, data to be collected, and considerations in analysis) for documenting structure and productivity of indigenous agroforestry systems, using references to previous documentation studies carried out in other parts of the world.
Interest in indigenous agricultural systems has grown enor-mously in the past decade or so, largely as the result of the shortcomings of the “green revolution.” The realization that many traditional systems are well integrated ecologically, eco-nomically, and socially at the local level has given a new impe-tus to research. Also, these systems offer valuable insights into adaptations to local environmental and cultural constraints. There is also a strong possibility that research into these agroforestry systems will lead to their improvement in terms of production and other development needs of the respective islands, and that information gained will be valuable in finding solutions to agri-cultural research problems in other areas. As a result, many scientists now see indigenous agriculture as dynamic systems which can serve as foundations for development efforts rather than as static obstacles to agricultural intensification.
Unfortunately, due to largely being ignored in the past, research methods for studying indigenous agriculture have only just begun to be developed. The inherent difficulty in studying indigenous agriculture systems is the relative complexity of traditional mixed cropping systems compared to “western” agri-cultural practices. Indigenous agroforestry systems are the prod-uct of both natural and anthropogenic influences, so they are different than either natural ecosystems or modem agricultural ecosystems. Current research methods developed in various disciplines such as vegetation ecology, forestry, and agronomy need to be combined in their study. Collection of data from indigenous agroforestry systems is further complicated due to the lack of existing data on many indigenous crops and animals, the long-term nature of the perennial components, the subsis-tence nature of many agroforestry products, and the variation within and between farms and regions. Cultural practices and restrictions can also hinder research work in some areas. Finally, the lack of trained manpower and financial constraints must also be considered in any research project in developing countries.
In the Pacific, most work, with a few exceptions (e.g., Handy 1940; Barrau 1958, 1961) has been in the form of general descriptions, with agriculture serving only as a component of the
1 An abbreviated version of this paper was presented at the Workshop on Research Methodologies and Applications for Pacific Island Agroforestry, July 16-20, 1990, Kolonia, Pohnpei, Federated States of Micronesia.
2 Researcher, College of Micronesia Land Grant Programs, Kolonia, Pohnpei, Federated States of Micronesia 96941.
more general social or economic systems. Other work has fo-cused on strictly botanical studies of natural or cultural vegeta-tion (e.g., Fosberg 1959). It is not until quite recently that a concerted effort has been made to systematically and quantita-tively analyze traditional Pacific island agriculture (e.g., Thaman 1975, Manner 1976, Raynor 1989).
The goal of initial research should be to develop a general quantitative overview of the local indigenous agroforestry sys-tem. Among the data desired are floristic composition, vertical and horizontal structure, and phenology of agroforests, as well as information on production, seasonality, and yields of major products. Often, related information on farmer and farm family demographics, land use and tenure, and labor input and alloca-tion is also desired.
Methods for Characterizing Structure of Agroforestry Systems
The initial focus of studies of indigenous agroforestry sys-tems should be to characterize basic agroforest structure. Eco-systems have three basic structural components―vertical, hori-zontal, and temporal (Whittaker 1975). Vertical structure is the height and stratification of plants in the system, depending much on the floristic composition and light relations within and be-tween species. Horizontal structure is the vegetation organiza-tion on the ground, affected by the environment, species inter-relationships, and human management. Temporal or time rela-tions include the phenology, age, and long-term development of the agroforest stand.
Sampling is a key consideration in collecting indigenous agroforest structural data. It is usually impossible to measure the entire area where a system is practiced, so data must be recorded for samples of the agroforest, and then extrapolated to the larger area. Sample size also affects the precision of estimates obtained by sampling. A larger sample size gives greater precision, but often constraints of time and money limit the number of actual sampling sites.
Selecting an unbiased sample is also important, especially if results are to be extrapolated to the general population. One way to generate a random, unbiased sample is the selection of sam-pling points (farms) on a map using a coordinate grid and random numbers. If areas to be studied are large, farms can be selected first using this method, then a systematic sub-sampling lay-out of smaller plots can be employed at each farm.
Sampling Systems Sampling methods are numerous, and can be categorized
into plot or plotless methods (Mueller-Dombois and Ellenberg 1974). Plot methods involve the use of a releve, quadrat, circle,
USDA Forest Service Gen. Tech. Rep. PSW-GTR-140. 1993. 69

or other type of two-dimensional sampling area. Plot size de-pends on the type of vegetation to be sampled and the spacing between them. Larger vegetation needs larger plots. Plots are randomly or systematically placed in several places within the sample area. In some cases, the “plot” might be the entire farm. Transects are a type of plot with greater length, usually placed across a gradient (i.e., elevation) to get some type of measure of vegetation changes over the gradient being considered.
Plots have been used to measure agroforest in some studies. Manner (1981) used small 5 x 5m quadrats to measure biomass productivity of gardens in the Solomon Islands. Thaman (1975) used the whole farm as a plot and counted tree species occur-rences on 101 Tongan farms. Jacob and Alles (1987) did the same on 30 farms in Sri Lanka. Advantages are that many different measurements can be done on plots, they can be easily remeasured (if permanently marked), and lend themselves well to long-term studies. Disadvantages are that plots can be time-consuming in laying out and measuring.
Plotless methods have been developed more recently. These consist of line and point methods. The line-intercept method was developed as a measure of cover, to eliminate the subjectivity of visual methods of estimation. A line, wire, or measuring tape is placed randomly within the agroforest, stretched and held tightly along the ground, or at some selected height above the ground. The distance along this line overlapped by each plant is recorded as cover for that plant. Individual cover measurements are summed to estimate total cover. Advantages for this method is that it is relatively simple and quick. Disadvantages are that it is not always accurate due to overestimation due to inclusion of foliage interstices, or underestimation due to over-looking of multiple vegetation layers.
Several point methods have been developed. Perhaps the point-intercept method, developed by Curtis (1959), is the most well-known. This method is characterized by the use of point samples, rather than fixed areas. It is used to determine space/ plant, rather than plants/unit area, as in plot methods. First, the sampling area is assessed for homogeneity, then the first point is determined randomly. A compass line is laid out, and points are laid out along that line at a fixed distance. Data is then recorded at each point. Data can consist of cover, stratification, and distance measurements. Several methods have been developed, the most reliable being the point-centered quarter method (Mueller-Dombois and Ellenberg 1974:109-112). Basically, four quarters are established by two lines, one, the compass line, and the other a perpendicular line through the point. Then the distance from the point to the nearest individual tree in each quarter is mea-sured. These distances are summed and divided by four times the number of points. This will give the average distance (D) be-tween trees and D2 = mean area/tree.
In forest surveys, a more common method, known as vari-able probability sampling or the Bitterlich method (Mueller-Dombois and Ellenberg 1974:101-106, Dilworth and Bell 1977), is used. Points are laid out in much the same way as in other point sampling techniques, but a prism is used to decide what trees will be sampled and which will not. This results in a variable plot size, trees of a larger diameter being more likely to be part of the sample at distances further from the point. This
method not only allows quick determination of sampling trees, but it also allows for a calculation of tree basal area per unit land area. This is very useful in volumetric surveys, and basal area can serve as a measure of species dominance. With additional equipment, DBH of sampling trees can be measured (with a diameter tape) and height (using a relaskope or similar instru-ment). Other observations can be recorded during the survey. The point intercept methods are quick and easy in the field, and thus larger areas can be surveyed than with plot methods. Their disadvantage is that they are not always as accurate as plot samples.
Choice of sampling methods depends on types of data desired, the morphology of the vegetation, its pattern, and the time available (Moore and Chapman 1985). For agroforest, sampling techniques must take into account both perennial tree and shrub species and annual undergrowth species. For this reason, combined methods will tend to give the best results. Foresters often combine point intercept sampling for trees with plot sampling for undergrowth. Curtis (1959) used a point inter-cept method combined with the point-centered quarter method in his landmark survey of the vegetation of Wisconsin. Thaman (1975) used whole farm plots for trees and small quadrats for annual crops on Tongan farms.
Types of Agroforest Structure Data Species presence is the most basic and most-often collected
data on indigenous agroforest systems. This involves a species inventory, in which all species present in a defined area are recorded. This is a relatively easy variable to measure, and does not require plots or other techniques. Species presence gives a measure of frequency of occurrence of plant species over all farms. Generally, species presence has been the first step in nearly all traditional agroforestry studies (Thaman 1975, O’kting’ah and others 1984, Balasubramanian and Egli 1986).
Cover, defined as the vertical projection of crown or shoot area of a species to the ground surface, expressed as a percent of the reference area (Mueller-Dombois and Ellenberg 1974:80), is another often used measure. The amount of cover provided by a species is directly related to its ability to compete for and convert various resources (nutrients, water, and sunlight) into above and below-ground biomass (Conant and others 1983:365). As such, cover is of greater significance than species number, since it expresses major light/stand effects. Cover is often estimated by visual methods on releves, plots, or transects. Generally, percent cover is expressed in classes, as in the Braun-Blanquet Cover Abundance Scale (Mueller-Dombois and Ellenberg 1974:59-60):
5 - >75 percent of reference area 4 - any number, with 50-75 percent cover 3 - any number, with 25-50 percent cover 2 - any number, with 5-25 percent cover 1 - numerous, <5 percent cover + - pronounced few, with small cover r - solitary, with small cover
These classes add accuracy to sampling as it is relatively easy to differentiate between them. The short-coming of the
70 USDA Forest Service Gen. Tech. Rep. PSW-GTR-140. 1993.

Braun Blanquet method is that it does not take into account different canopy levels. In agroforests with complex species mixes, it is also necessary to stratify species by cover, for example:
T = tree layer >5 m high S = shrub layer S1 - 2-5 m
S2 - 50 cm-2 m H = herb layer H1 - 30-50 cm
H2 - 10-30 cm H3-<10cm
These categories can be rearranged or changed depending on the goals of the researcher. Michon and others (1983) col-lected cover and strata data from 20 x 40 m transects to do an architectural analysis of two Java homegardens. In agroforest studies, it may be useful to classify species or individuals by height, i.e., canopy spp. (>10 m), subcanopy spp. (5-10 m), and understory spp. (<5 m), as Haun (1984) did in a study of Pohnpei vegetation. Cover and strata classes can be decided during initial reconnaissance, then estimated by visual and height measure-ments.
Species density is another important measure, and is the count of individuals of species within a sampling area. It is the measure of relative abundance of different species. Counts of large species are most easily done on large plots (i.e., a whole farm), but counts of small abundant species become very diffi-cult on large plots. Density measurements can also be calculated from plotless sampling techniques as indicated above, with fairly good accuracy. For agroforests, species density can be used to estimate the relative importance of different species to the over-all crop mix. Species counts are often done on the farm-level (i.e., Thaman 1975, in Tonga; Jacob and Alles 1987, in Sri Lanka.)
Frequency is defined as the number of times a species is recorded in a given number of plots or at a given number of sample points. It is generally expressed as a percent, and is easily calculated. Waddell (1972) in New Guinea, Thaman (1975) in Tonga, and many other investigators have used frequency as a measure of the relative importance of various crop species to the local agricultural system.
Dominance is measured from the stem cover or tree basal areas of the tree species in the sample stand. Basal area is the area outline of the plant near the ground surface. It can be determined by the formula:
Basal Area = (1/2d)2 x pi, where d stands for diameter. Basal area is easily calculated by the Bitterlich method. Height is also used as a measure of dominance, especially in forestry surveys.
DBH (diameter breast height), which is a measure of tree diameter at 1.4 m height, and tree height, which can be mea-sured with instruments or by trigonometric calculation are other measurements that are useful in agroforest structural invento-ries. These can be useful in later analyses, and can form impor-tant variables in allometric equations relating them to tree growth or yields.
Temporal Patterns Temporal structure exists in indigenous agroforestry sys-
tems in both short-term (phenological or seasonal aspects) and long-term (development or successional aspects). Seasonality (or phenology) can be characterized by observation during field visits and/or periodic market surveys. Such data as time of flowering, fruit development, and time of harvest provide valu-able information on the short-term temporal aspects of the agroforestry system. For important species, recording of season-ality for individual plants can be carried out by several cooperat-ing farmers. An effort to note seasonal differences between cultivars should also be made on crops for which numerous cultivars exist.
Long-term development or successional aspects are more difficult to characterize, since they generally occur over periods much greater than a single year. One example is the swidden/ fallow cycle in slash and burn systems. Temporal changes also occur in more permanent agroforestry systems as a type of “farmer-controlled succession” (Michon and others 1986). Char-acterizing these long-term temporal patterns is often important in indigenous agroforest studies. It is usually not possible to observe individual plots over long periods of time, so individual farms or plots can be categorized into various age groups and then compared and analyzed.
Related Information Traditional agroforestry systems are often times highly vari-
able not only in terms of species and structure, but also in terms of the environment in which they are found. These environmen-tal gradients affect structure of the agroforest as well as manage-ment and production. They affect the determination of the sam-pling unit size in that the gradients should be relatively homoge-neous within a single sampling unit. Some related site informa-tion that should be collected include:
Climatic factors - rainfall, temperature, and insolation are important variables, and often change over gradients, especially elevation.
Topography - Slope, slope exposure, and elevation can have major effects on agroforest structure and yields. Slope partially determines the erosion risk as well as other limitations on cropping. Slope exposure can affect incoming solar radiation and thus productivity. Elevation and climatic effects have al-ready been discussed. Slope gradients can be measured using a simple clinometer and classed as follows: 0-10 percent, 10-25 percent, 25-50 percent, and over 50 percent. On individual farms, the slope also assists in separating homogeneous sample units. Slope exposure can be recorded with a compass, and elevation can be recorded from good topographical maps, if available.
Soils - structure, type, pH, and fertility are important soil variables that will affect agroforestry. Soil surveys have been completed for many areas and can be used as the main guide to soils in the sampling areas. Farm maps can be superimposed on the soil map to get general soil types. Generation of detailed soil information is often hampered by time constraints and lack of
USDA Forest Service Gen. Tech. Rep. PSW-GTR-140. 1993. 71

laboratory facilities. If possible, probably the most useful and economical (in terms of effort) soil measurement to collect is pH, either measured with a field kit or from samples collected in the field and sent to a soil testing laboratory.
Management - the human factor is the key variable in managed agroforestry systems. Management consists of all the inputs into the agroforest in order to maintain or increase pro-duction. In most traditional agroforestry systems, the main input will be family labor, especially during key planting and harvest-ing times. Weed control (generally by bushing with a machete) and regular harvesting make up the remainder. Management in traditional agroforestry can be measured as a function of labor input, as determined by measurement and observation, and weed pressure, in the form of weed cover and height, measured visu-ally in sample areas. Notes can also be made on animal grazing pressure, disease or pest presence, and distance of plot from main house.
Related information on farmer and farm family demo-graphics, land use and tenure, and labor input and allocation can be recorded by interviewing the farmer informally before the actual field survey. This not only gives the researcher a better overall view of the local farming system, but also pro-vides some time for the farmer and researcher(s) to get com-fortable with each other.
Cultural Considerations Researchers of indigenous agroforestry systems often also
face certain cultural constraints. These must be carefully consid-ered along with the technical aspects discussed above, and re-search methods should be designed accordingly. Farms selected can be visited in advance, and the research project explained thoroughly to the farmer and his family. Plot surveys can be designed to be fast and simple, so that only a few people are needed to carry out the field work. Having local agricultural and forestry staff assist in field work not only assures that survey results will have a greater impact, but also can lead local officials to a new appreciation of indigenous agriculture.
Animal Component Equally important, but often overlooked in studies of tradi-
tional agroforestry systems is the animal component. Animals interact with the agroforest in many ways, especially through the recycling of excess yield and plant parts into organic manures. Free-run livestock allowed to graze interact more strongly, but even penned livestock consume agroforestry products. Waddell (1972), in his study of the Enga of Papua New Guinea, made counts of livestock at the farm level, and also kept track of food consumption of the most important animal, pigs. Other impor-tant information to be collected includes animal management (penned, fenced, or free-run) and some assessment of beneficial or negative interactions of animals with the agroforest.
Methods for Determining Input-Output Relations
Characterizing the structural dynamics of an indigenous agroforestry system is only a part of understanding and evaluat-ing that system. A measure of the relative efficiency of that system as a production method must also be developed. In order to do so, inputs (in terms of labor, management, and capital) and outputs (yield of products) must be measured. This is difficult in many of these systems because farmers do not keep records, unpaid family labor is often the main input, and few products reach the market. Often, these traditional systems are character-ized by elaborate distribution systems. It is thus understandable that few researchers can meet the time and expense involved in accurately quantifying these important variables. The following discussion centers on possible methodologies for overcoming these constraints.
Measuring Input One of the most popular methods of measuring input into
agroforestry systems has been the use of farmer surveys. These surveys are made at regular intervals, and farmers report to the researcher on their activities (as well as crop production and marketing). A variation on this has been the use of record sheets, given to the farmers and collected at regular intervals, on which the farmer records his activities and production. The problem with both of these methods is that they can be very unreliable, and depend on both the farmers cooperation and honesty. Jacob and Alles (1987) have attempted to overcome these inaccuracies by reporting time spent in various activities as a percent of total time, rather than an absolute hour value. The added problem of seasonal variability further complicates this process. Most re-searchers have been satisfied with assuming that all family members are fully employed, and then computing labor avail-ability as a function of household members and their abilities.
A second more precise way is by the use of Time Allocation (TA) studies. This is a tool developed by anthropologists to study the use of time in different cultures (Kronick 1984.) The methodology has recently been reviewed by Gross (1984). He stresses the importance of defining the sampling universe (popu-lation), unit (i.e., household, individual), duration, and frequency. These depend much on the goals and time available to the researcher. Presently, a random spot-check method is the most widely used, in which a researcher visits the farm at random times and then records the activity of each family member upon his arrival. Studies generally last for at least a year, and fre-quency of checks determines the precision of the final product. If some information is already known about seasonality of labor requirements, more frequent visits can be made at peak times, with less frequent visits made in the off-season.
In some studies, certain undertakings have been timed, such as clearing, planting, and harvesting, and then these related to unit area to get an estimate of total labor expended in various tasks. This data can be used by itself or in conjunction with surveys or TA studies to complement and check data.
72 USDA Forest Service Gen. Tech. Rep. PSW-GTR-140. 1993.

Measuring Output Yield in traditional agroforestry systems is difficult to mea-
sure for reasons already discussed. As such, it is relatively rare to find indigenous agroforestry yield data in the literature. A few recent studies have made estimates of yield using various meth-ods, and these will be discussed.
Several researchers have used farmer surveys and record sheets in yield studies (e.g., Lagemann and Heuveldop (1983) on 68 farms in Costa Rica for one year, Fernandes and others (1984) for 30 farms in Tanzania, Balasubramanian and Egli (1983) in Rwanda). These surveys are relatively easy to do and are inex-pensive. The disadvantage is that they depend heavily on farmer memory, which is prone to error. To overcome this, other re-searchers have lived in an area and weighed produce as farmers come in from the farm each day, or have paid an assistant to do so (e.g., Waddell (1972) in New Guinea, Fairbairn (1979) in Western Samoa, and Michon and others (1986) in Sumatra). While this method gives more reliable data, it is limited by time and expense to smaller sample size (i.e., one or two villages). It is also difficult to use this method in areas where people live in scattered homesteads, rather than villages.
Market studies have been used in some studies to measure production, but in subsistence agroforestry systems they are not reliable since most produce does not reach the market. These studies can, however, be used to check seasonality of various crops on the assumption that at least some farmer will always be bringing in some of the produce they have available.
Plots have been used in several studies, where random plots are set out on farmer’s land, and then all species are harvested, measured, and weighed during the study period (Manner 1976 & 1981, Beer and Sommariba 1984). These types of measurements are very reliable, and lend themselves extremely well to produc-tivity (biomass) studies. They can be expensive and time con-suming, however, and it is often hard to get data from tree crops which tend to bear over an extended period. Manner (1976 & 1981) employed allometric equations to measure productivity of larger species.
Individual species measurements can also be used, and were the basis of a recent detailed study of breadfruit produc-tion on Pohnpei (Raynor 1989). Representative numbers of individual plants or trees are tagged, and then harvest weighed and recorded throughout the study period. This method could be especially useful in comparing different varieties of a crop species, as well as giving the added benefit of phenological data. It is also relatively easy to compare physical measure-ments, i.e., d.b.h., height, and canopy size, with yield through regression analysis. Some questions of sample size and repre-sentativeness need to be answered, although 20 individuals is suggested as a minimum.
Besides predictions based on allometrics, there are possibly other methods that could be used to measure yield. It may be possible to count immature fruits on trees and relate it to yield, or to relate individual species densities to yield (as is done in monocropping). There is also little doubt that indigenous people have their own systems of yield prediction, based on weather, phenological characteristics, or other such observations. Since
an important part of many studies is yield measurement, collec-tion of traditional knowledge in this respect should be an integral part of the project.
The last consideration with yield is annual fluctuation. There is no doubt that annual fluctuations in yield do occur in tree crops. Very little is known about the physiological basis for this yield fluctuation in many traditional crops, but it is most cer-tainly affected to a great extent by weather. Unfortunately, most research projects are undertaken for periods of a year or less, and as such, yield data can be somewhat misleading. The random selection of farm sites and the distribution around the island will minimize local abnormalities, but only continuous data collected over several years can give accurate estimations of yield for most crops.
Conclusions Documentation is an important first step in researching
indigenous agroforestry systems. Through increased study of these systems, they can act as a foundation for future agricultural development, and technologies and crops developed over thou-sands of years can continue to serve people into the future.
References Balasubramanian, V.; Egli, A. 1986. The role of agroforestry in the farming
systems in Rwanda with special reference to the Bugesera-Gisaka-Migongo (BGM) region. Agroforestry Systems 4:271-289.
Barrau, J. 1961. Subsistence agriculture in Polynesia and Micronesia. Bishop Museum Bulletin #223, Honolulu; 94 p.
Conant, F., and others, eds. 1983. Resource inventory and baseline study methods for developing countries. American Association for the Advance-ment of Science Pub. NO. 83-3, Wash., D.C.; 539 p.
Curtis, J. 1959. The vegetation of Wisconsin: an ordination of plant communi-ties. Madison, WI: Univ. of Wisconsin Press, 69-83.
Dilworth, J.; Bell, J. 1977. Variable probability sampling- variable plot and 3-P. Oregon State Univ. Book Stores, Inc., Corvallis; 130 p.
Fairbairn, I. 1979. Village economics in Western Samoa. Jour. of Polynesian Society; 54-70.
Fernandes, E.; O’kting’ati, A.; Maghembe, J. 1984. The Chagga homegardens: a multi-storied agroforestry cropping system on Mt. Kilimanjaro (Northern Tanzania). Agroforestry Systems 2:73-86.
Fosberg, F.R. 1959. The vegetation of Micronesia. Scientific investigations of Micronesia, Report No. 25, NAS-Pacific Science Board, Washington, D.C.
Gross, D. 1984. Time allocation: A tool for the study of cultural behavior. Ann. Rev. Anthropology 13: 519-58.
Handy, E.; Handy, E. 1940. Planters of old Hawaii: Their life, lore, and environment. Bishop Museum Bulletin No. 233.
Jacob, V.; Alles, W. 1987. Kandyan gardens of Sri Lanka. Agroforestry Systems 5: 123-137.
Kronick, J. 1984. Temporal analysis of agroforestry systems for rural develop-ment. Agroforestry Systems 2: 165-176.
Lagemann, J.; Heuveldop, J. 1983. Characterization and evaluation of agroforestry systems: the case of Acosta-Puriscal, Costa Rica. Agroforestry Systems 1: 101-115.
Manner, H. 1981. Ecological succession in new and old swiddens of montane Papua New Guinea. Human Ecology 9(3): 359-377.
Manner, H.1976. The effects of shifting cultivation and fire on vegetation and soils in the montane tropics of New Guinea. PhD thesis, Univ. of Hawaii; 353 p.
McCutcheon, M. 1985. Reading the taro cards: Explaining agricultural change in Palau. In: Cattle, D.; Schwerin, K., eds. Food Energy in Tropical
USDA Forest Service Gen. Tech. Rep. PSW-GTR-140. 1993. 73

Systems. New York, NY: Gordon and Breach Science Publishers; 167-188.
Michon, G.; Bombard, J.; Hecketsweiler, P.; Ducatillion, C. 1983. Tropical forest architectural analysis as applied to agroforests in the humid tropics: the example of traditional village agroforests in West Java. Agroforestry Systems 1:117-129.
Michon, Mary F.; Bombard, J. 1986. Multi-storied agroforestry garden system in West Sumatra, Indonesia. Agroforestry Systems 4:315-338.
Moore, P.D.; Chapman, S.B. 1985. Methods in plant ecology. Mueller-Dombois, D.; Ellenberg, H. 1974. The aims and methods of vegeta-
tion ecology. New York, NY: John Wiley and Sons 547 p.
Ok’ting’ati, A.; Maghembe, J.; Fernandes, E.; Weaver, G. 1984. Plant species in the Kilimanjaro agroforestry system. Agroforestry Systems 2:177-186.
Raynor, W. 1989. Structure, production, and seasonality in an indigenous Pacific island agroforestry system: A case study on Pohnpei Island, F.S.M. M.S. thesis, Univ. of Hawaii at Manoa, Honolulu; 121 p.
Thaman, R. 1975. The Tongan agricultural system: with special emphasis on plant assemblies. PhD dissertation, UCLA; 433 p.
Waddell, E. 1972. The mound builders: agricultural practices, environment, and society in the central highlands of New Guinea. Seattle, WA: Univ. of Washington Press; 253 p.
Whittaker, R. 1975. Communities and ecosystems. New York, NY: MacMillan Pub. Co., Inc., 61-103.
74 USDA Forest Service Gen. Tech. Rep. PSW-GTR-140. 1993.

Knowledge Systems in Agroforestry1
Wieland Kunzel2
Abstract: Pacific Islands agroforestry has evolved into sustainable, diverse and productive a land use systems in many areas. We marvel at these systems, and the scientific world is trying to catch up with the traditional knowledge. At the same time, Pacific Islands farmers are abandoning their agroforestry systems in great numbers. It is mainly intensified agriculture for cash crop production that follows. Soil erosion and soil fertility deficiencies are close companions of this intensification. Why do land use systems that have been operative for centuries disappear so easily? Can “modern” agroforestry sys-tems lead to the destruction of “traditional” ones? The paper explores the importance of knowledge systems in agroforestry innovations.
Taro, yams, cassava and four other annuals, pandanus, ba-nanas and vanilla, all expertly intercropped. Over 360 coconut palms on 3.3 ha of land, together with 85 more trees of 16 species, providing food, fuel, income and medicine. My ecologi-cal senses were fully alert, trying to grasp an understanding of the marvelous agroforestry system I was looking at. It would be a delight to interview this farmer!
Two weeks later, a third of the system was gone, pulled apart by a hired tractor. A monocrop of cabbage. would only survive with heavy doses of agrochemicals, while the missing tree cover would allow the sun to dry out the soil and the wind to blow it away. The farmer had spent hours explaining the inner workings of his traditional system to me, how crops work to-gether to ensure successive and good yields. He did not see the ecological implications of his cabbage plot.
The observation that farmers can turn overnight from ex-perts on traditional sustainable agriculture to land abusers under intensified agriculture is not new. Technology that is alien to a culture requires its own, new set of information and understand-ing, and to buy a tractor does not mean that the owner will be able to use it successfully on his land without further informa-tion. But how does it work in agroforestry? Can we rely on the store of knowledge farmers have collected in their traditional systems once they implement innovations like hedgerows, or will we face a breakdown of ecological understanding as “mod-ern” agroforestry techniques are introduced? In this paper, I would like to examine some concepts relevant to this question.
Traditional Land-Use Systems Are Based on Detailed Environmental Knowledge
Our view of peasant farmers has changed considerably over the last ten or so years. Before that, rural societies were consid-ered as static, governed by traditions rooted in the past, unable to adapt to changing circumstances without a major restructuring. Farmers were regarded as having little information and control
1 An abbreviated version of this paper was presented at the Workshop on Research Methodologies and Applications for Pacific Island Agroforestry, Julyl6-20, 1990, Kolonia, Pohnpei, Federated States of Micronesia.
2 Fiji-German Forestry Project, P.O. Box 14041, Suva, Fiji
over their agricultural systems, precluding them from indepen-dent experimentation and innovation. Only social anthropolo-gists believed otherwise.
Today, by contrast, scholars from all fields accept that the peasant farmer is an independent, rational decision maker, who strives constantly to maximize the returns from his farming enterprise. The values attached to the various utilities that can be maximized (income, leisure, social status, etc.) may change from place to place, but ultimately each farming system reflects the purposeful allocation of resources by its managers, achieving the best possible satisfaction of their needs under given circum-stances. When dealing with farmers, we are dealing with experts in resource allocation. This view is so established that today it forms the base of many aid agency project planning procedures (Hoben 1980:343).
There is no question that rational resource management necessitates a detailed knowledge of the environment. Tradi-tional knowledge is based on long-term observation. Recurrent events and their consequences are known, regardless of whether they are regular, like the seasons, or unpredictable, like cy-clones. Spatial variations in soils and microclimates have been observed and incorporated into the pattern of land use. In tradi-tional agricultural systems, the body of knowledge about the environment is immense.
Traditional Land-Use Systems Are Environmentally Stable
Even among scientific circles it is not uncommon to believe in myths. That traditional societies live in harmony with nature is one of them. Of the many examples of ecological degradation caused by traditional land use practices that have been reported, quite a number are in the Pacific region. The most common impact has been deforestation, with the cleared forests often being replaced by fire-maintained fern/grassland savannas on infertile, eroded soils. This distinctive plant-soil complex is known as toafa in several Polynesian islands and as talasiga in Fiji (Clarke 1990:235). Although farmers may closely monitor the present state of such degraded land, they are largely unaware of the dynamics that led to their creation. Bolabola (1989:22) reports from Fiji that there are no vernacular terms to categorize the various degrees of slopes, and no vocabulary to differentiate a 12 degree slope from one of 30 degrees:
Community leaders and members consulted were unaware of the relationship between farm husbandry and soil erosion nor the ratio-nale in soil conservation measures. Likewise, women were not aware nor informed on soil erosion, soil conservation and its rela-tionship with agricultural production and income.
While it is evident that most traditional agricultural systems have been able to achieve production under sustained resource protection for centuries, there are also sufficient examples to show that this is not automatically so.
USDA Forest Service Gen. Tech. Rep. PSW-GTR-140. 1993. 75

Traditional Land-Use Systems are Aimed at Environmental Stability
It is sometimes argued that even if traditional agriculture at times may fail to be environmentally sound, it is still geared towards resource protection in principal. The argument goes that, because traditional farmers know their environment inti-mately, they are aware of its limitations and have a natural interest in sustaining its vitality. This is largely another myth, except for some habitats which are extremely harsh and simple. According to Leach (1972:39, cited in Chapman 1985:218):
... it is only in the most extreme kinds of environment, such as those found in Australian deserts or Greenland icefields, that the simpler peoples have become in any way aware of the possibility of ecosystem balance. It is only in such extreme circumstances that human beings of the past have been in any way motivated to achieve balance between their society and the environment.
In the South Pacific context, the use of taboos is often seen as a regulator of exploitive food gathering, aimed at ensuring the protection of a resource. In Tonga, the small population of flying foxes is still protected by a taboo, as were common resources like banana and pigs in the advent of major feasts or wars. As Chapman (1985) points out in her paper, however, environment-tal conservation may not have been the original motive for the establishment of taboos―but, rather, greed, political power, prestige, resource allocation, or conflict resolution. The detailed ecological knowledge obtained by traditional societies does not necessarily induce the desire to protect their environment. Tongan farmers have developed impressive agroforestry systems that are environmentally sustainable―but the reason for their cre-ation is the desire to minimize work loads, rather than any concern for the environment. If machines are available to assist in clearing, Tongan farmers are quite happy to do away with their agroforestry (Kunzel 1990). If traditional agricultural prac-tices are environmentally sound, we can not automatically as-sume that they were developed with this goal in mind.
Traditional Land-Use Systems Are Based on Scientific Concepts of Ecology
To hear a seminar in a university about modes of production in the morning, and then attend a meeting in a government office about agricultural extension in the afternoon, leaves a schizoid feeling; one might not know that both referred to the same small farmers, and might doubt whether either discussion had anything to contribute to the other (Chambers 1983:29).
Communication breakdowns among professionals are common, even when the individuals are compatible in terms of language, years of scientific training, race, and social background. Let a social anthropologist and a forester discuss the management plan of a communal forest―they may start shouting at each other within minutes.
It should therefore be expected that the problems of com-munication between scientifically trained personnel and farmers are of equal, if not greater proportions. Yet this is a concept often disregarded in the field. I am not talking here about technical problems like translation―these can be solved by careful double checking. Conceptual differences in language begin to be more
tricky. Terms (and concepts) for things like “slope” or “contour” may simply not be present in the local language and culture. The most difficult aspect of communication barriers, however, lies at the level of knowledge systems.
Knowledge systems are the structures that govern the inter-pretation of information by the individual. If my world view is based on science, and therefore structured by logic, the informa-tion that a given area was covered by rainforest fifty years ago and is now bare and badly eroded sets off a train of thought evolving around land-use, rainfall and the greenhouse effect. None of this may be relevant to the local farmer. His indigenous knowledge system may prompt him instead to explore recent cultural misbehavior, wrong choice of ceremony, or the mar-riage patterns of past land users, in order to explain the dramatic ecological events he witnesses. Separating out and describing different knowledge systems is bound to do violence to the subtleties and overlaps of realities. Nevertheless, trying to be brief and clear, I will describe two contrasting ways of explain-ing reality, concentrating on the extremes. It should be clear that no values are attached to either approach. To believe in objectiv-ity is in no way superior to believing in miracles.
Structured knowledge systems, which are the foundation of scientific explanations of events, rely on fixed rules. Steeper slopes will always lead to more erosion, all other factors being equal. Observations can be replicated, regardless of the social or spiritual surrounding. Modification of techniques leads to im-provement, and innovation is seen as progress. Observed events can be explained, and in order to achieve a better understanding we are happy to discuss, and argue our ideas.
Indigenous knowledge systems tend to explain results of actions rather than the rules that govern them. Each place is unique, and certain behavior will lead to a certain result only there. The reasons for this are often contained in secret knowl-edge, held by precisely defined groups of individuals. A change of behavior may lead to unexpected results, and is therefore discouraged. Disasters indicate that some rule has been vio-lated. The location of the violation and the resulting effects can be widely separated in space and time. Table 1 summa-rizes some of the characteristics of structured and indigenous knowledge systems.
Table 1-Comparison of indigenous and structured knowledge systems
Knowledge Systems Indigenous tured Results are fixed
Each place is unique
Routines are given
Customs are specific
Reasons are secret
Failure is punishment
Change is destabilizing
To argue is to criticize
Rules are fixed
Replication is possible
Habits can change
Modification is success
Reasons are logic
Failures are part of progress
Innovation is development
Arguing is understanding
Struc
76 USDA Forest Service Gen. Tech. Rep. PSW-GTR-140. 1993.

What does this mean for agroforestry? The famous phrase that it is “a new science, but an age-old practice” also means that we have farmers with indigenous knowledge systems talking to scientists with structured ones. It means that the potential is great for communication breakdowns between the two groups.
A more extended example suggests how even ordinary interaction between two individuals requires the ability to think in each other’s terms, a process Gladwin and Murtaugh (1980) call “preattention.” On one occasion, a farmer was working in the field when a second farmer approached him and said simply, “How sad.” The other farmer replied, “I don't care how it looks, it rots to save me money.” The visiting farmer had noticed that the legumes in this field had been pruned vigorously - a “sad” look for a tree. Since the owner of the field shared the basic knowledge system of the visitor, he was able to understand the remark, and to answer appropriately. His own remark implied that he had pruned the trees for mulch, which was now decom-posing on the ground. The visiting farmer could also infer that the other mulched to add organic fertilizer to the site, that the rate of application of commercial fertilizer would later be reduced because of this, and that this method was used to minimize cash expenditures for fertilization.
A thorough understanding of farming systems is only pos-sible if the corresponding knowledge system is understood as well. Many of the methods of agroforestry, like planting on contours and pruning for mulch, are based on scientific prin-ciples, whose understanding requires competence in structured knowledge systems. This means that farmers will have to learn some scientific principles if they want to incorporate “new” agroforestry techniques into their farms successfully - even if they have practiced “traditional” agroforestry for centuries, and can rightfully be called experts in managing their environment.
Unless practices are rooted into a system of knowledge and meaning which supports and justifies them, those practices will not be maintained in the way that an ecologist would like: there would be no cultural ballast keeping the practice steady in the face of changing circumstances (Chapman 1985:227). Agricultural extension requires a sender of a message, a
message, and a receiver of that message. It must originate from an area of common knowledge if it is to be understood. Areas of common knowledge in agroforestry can be established by dis-cussion of basic questions like “What is erosion?”, or “Why do certain trees grow faster than others?” If the fanner and the extension agent agree on such basic facts, talk about agroforestry techniques can begin. If not, it will be necessary for both to learn. It needs to be stressed that both sides need to learn. It is not enough if only the extension worker understands the local scene.
As agroforestry techniques are based on scientific principles, the adopting farmer will have to know (and agree to) some of the underlying ecological concepts. In other words, he will have to acquire some structured knowledge. Evening classes for farmers are a way to provide the necessary information. At the same time, agroforesters should be very aware of their role as agents of change.
Conclusion A knowledge of basic ecological principals is present among
all agriculturalists. Only when this information can be called up within structured knowledge systems, however, will many of the principals of agroforestry make sense to the farmer. Basic envi-ronmental training will enable him to make an informed choice between reliance on proven methods of the past and promising techniques of the future. Indigenous and modern knowledge can indeed be combined, and the cabbage farmer mentioned at the beginning of this paper would not need to do away with his traditional agroforestry system just because a tractor was hired.
Advances in agroforestry, taking knowledge systems into account, hold the promise that the indigenous technologies can be preserved, at the same time that equally sustainable “modern” land use practices make their way into the minds and onto the fields of the farmers.
References Bolabola, C. 1989. Rewa/Ba Rivers Watershed Management Project, Volume
5, Sociological Impact. Ministry of Primary Industries, Suva. Chambers, R. 1983. Rural development - putting the last first. London. Chapman, M.D. 1985. Environmental influences on the development of tradi-
tional conservation in the South Pacific region. Environmental Conserva-tion 12(3): 217-230.
Clarke, W.C. 1990. Learning from the past: traditional knowledge and sustain-able development. The Contemporary Pacific 2(2): 233-253.
Gladwin, H.; Murtaugh, M. 1980. The attentive-preattentive distinction in agricultural decision making. In: Barlett, P.F., ed. Agricultural Decision Making: Anthropological Contributions to Rural Development. New York, NY.
Hoben, A. 1980. Agricultural decision making in foreign assistance: An an-thropological analysis. In: Barlett, P.F., ed. Agricultural Decision Making: Anthropological Contributions to Rural Development. New York, NY.
Kunzel, W. 1990. Die Bedeutung der Agroforstwirtschaft in Tonga - Dynamik and Chancen einer traditionellen Landnutzung. Schriftenreihe des Instituts fuer Landespflege der Universitaet Freiburg. Heft 16.
Leach, E.R. 1972. Anthropological aspects: Conclusion. In: Cox, P.R.; Peel, J., eds. Population and Pollution. London: Academic Press.
USDA Forest Service Gen. Tech. Rep. PSW-GTR-140. 1993. 77

Potentials of Integrating Spice Crops With Forestry in the Pacific Islands1
John K. Gnanaratnam2
Abstract: The forest is an integral part of the island ecosystem, and any indiscriminate destruction is bound to cause a shift in the climatic conditions, increased soil erosion, and other effects. The conservation of existing forestry is of great importance. Future patterns of agricultural development in the Pacific Islands should aim to integrate with the forest cover rather than eliminate it. Climatically, Pohnpei is regarded as one of the best sites in the world for the cultivation of a range of high value spice crops. One spice crop that will thrive well in the existing forests above 1500 m is cardamom (Elletaria cardamomum), a potential crop for the Pacific. Initially, it will be necessary to carry out research relating to 1) adaptability at different elevations, 2) intro-duction of high yielding varieties, 3) resistance to pests and diseases, and 4) soils and shade management. Research is also necessary to identify suitable processing techniques for the spice crops currently cultivated on Pohnpei, including black pepper (Piper nigrum) and cloves (Eugenia carophyllus).
Forests are the wealth of any nation, and they play a major role in maintaining the balance of nature. In the past, forests were maintained for the purposes of supporting wildlife and providing timber for construction and fuelwood. These can be referred to as tangible or monetary benefits. Non-tangible ben-efits accruing from forests include 1) recharge of soil moisture, 2) reduction of solar radiation, 3) increase of soil organic matter content, 4) recycling of leached out bases (especially Ca and Mg), 5) maintenance of desirable agro-climatic conditions, and 6) lessening of cyclonic effects.
In recent years, indiscriminate felling of forests has been occurring faster than afforestation/reforestation, particularly in the tropics. Of all the damages caused by deforestation, the most serious appears to be the increase of the “greenhouse effect.” Despite warnings by meteorologists, deforestation continues, apparently without concern of a worldwide change in climatic conditions. Trees act as a vast storehouse of excess carbon dioxide. In the absence of forests, carbon dioxide remains in the atmosphere, forming a blanket over the surface of the earth. The sun rays penetrate this cover but back radiation is prevented. This has led to a rise in the temperature of the earth. The World Meteorological Organization (WMO) has warned that a further rise in the temperature of about 1.5°C will melt the ice in the polar regions leading to a rise in sea level. A rise in ocean levels can inundate low-lying islands.
Thus the need is to conserve our forests rather than to eliminate them. Furthermore, the terrain on Pohnpei does not lend itself to deforestation for commercial agriculture ventures. Consequently, any agricultural development should be inte-grated with the existing forestry. Mixing crops with forestry for commercial purposes is of a recent origin, although some combi-
1 An abbreviated version of this paper was presented at the Workshop on Research Methodologies and Applications for Pacific Island Agroforestry, July 16-20, 1990, Kolonia, Pohnpei, Federated States of Micronesia.
2 Spice Consultant, Pohnpei Division of Agriculture, Kolonia, Pohnpei, Federated States of Micronesia 96941.
nation of shade trees with plantation crops and illegal cultivation of some crops in the forest to avoid detection took place earlier. In 1930, the British Government of India allowed landless vil-lagers to cultivate food crops on Crown Land along with newly established forest plantations (the Taungya System). Even to-day, this type of communal forestry can be seen in and around Delhi.
Cardamom: Mixed Cropping with Forestry The microclimate produced under forest cover can be har-
nessed to grow several crops, depending on crop compatibility, intensity of shade, soil fertility, and elevation. The cultivation of cardamom (Elletaria cardamomum), a high value spice crop, under forests has proven to be a most successful combination. This form of mixed cropping is widely practiced in countries like India (70 percent of the world production), Sri Lanka, Guate-mala, Vietnam, Laos, and more recently, Papua New Guinea. Cardamom is valued for its essential oil, in high demand in the middle east countries. Saudi Arabia alone consumes nearly 200 tons/year, where it is used to prepare a ceremonial drink known as ghawa, or Arab coffee. Cardamom also has a variety of uses as confectioneries, pastries, baked foods, curry powder, ham and sausage additives, toothpaste, and drugs.
Cardamom is a shade and moisture-loving herbaceous shrub. The optimum parameters for successful cultivation are:
- Fertile soil; - Annual rainfall of 100-200 inches without extended
dry periods; - Average humidity of 70-80 percent - Average temperature of 65-80°F.
In forest/cardamom combination, cardamom constitutes the major component, the forest trees providing 1) filtered light, 2) recycling of bases like Ca and Mg (self-liming), and 3) rich organic matter encouraging microbial activity.
Cardamom is generally established under forestry in shal-low pits 2 ft x 2 ft x 1 ft at a spacing of 6 ft to 8 ft, depending on variety. Cardamom is not a soil exhausting crop, and substantial amounts of nutrients are returned to the soil at the time of thrashing (cutting of spent leaves, empty tillers, and broken stems). Mulching around clumps to prevent clump walking and earthing up to cover exposed roots are vital operations carried out annually. Application of dolomite lime once in 3 years helps to maintain satisfactory pH levels, as forest soils are often acidic. Annual fertilizer application is carried out in two applications at the rate of 30 kg N, 60 kg P20, and 30 kg potash per hectare.
In the cultivation of cardamom under forest cover, a certain amount of shade regulation is necessary. Some trees shed their leaves and thereby afford natural shade regulation. Sometimes large gaps occur due to the death of a tree or windblow, thus
78 USDA Forest Service Gen. Tech. Rep. PSW-GTR-140. 1993.

exposing cardamom to direct sunlight, which reduces yield. Thus it is important to maintain a forest stand of mixed ages to fill in these types of gaps.
Other Spices The other spice crops in order of possible economic impor-
tance for Pohnpei are cloves, nutmeg, and vanilla, all of which have been found to grow extremely well under local conditions. Secondary forest areas are ideal for the cultivation of cloves and nutmeg at a spacing of 20-24 ft apart. Upland forests areas
provide the ideal climatic conditions for the cultivation of va-nilla. Earlier introductions to Pohnpei have not done well due to low elevation. Before large-scale cultivation is undertaken, sus-tained research efforts are necessary in the following areas: 1) assessment of market potential, 2) adaptability of crops at differ-ent elevation levels, 3) introduction of high yielding varieties, 4) introduction of disease-resistant strains, 5) field trials, and 6) post-harvest technology.
Introduction and cultivation of spice crops should be under-taken as a project so as to exploit available market potential and to make Pohnpei a true “spice island.”
USDA Forest Service Gen. Tech. Rep. PSW-GTR-140. 1993. 79

Agroforestry Programs and Issues in the Northern Marianas Islands1
Anthony Paul Tudela2
Abstract: Agroforestry is an important land-use in the Commonwealth of the Northern Marianas (CNMI) and provides many benefits. Various agencies are involved in forestry and agroforestry, and their programs are summarized in this paper. Major issues involving agroforestry in the CNMI are also discussed.
Agroforestry in the CNMI (Commonwealth of the Northern Marianas Islands) plays a key role in the lives of the island people. It provides wood products, shelter, medicines, recreation and seasonal hunting, and food. Agroforestry also adds to the beauty of the islands of the CNMI and protects the upland soils from erosion. It provides clean water and protects the near-shore fisheries from excess sediment.
The CNMI is now becoming aware that it needs to protect the forest from abuse of new development, fire hazards, and other disturbances. Hence the government and some environ-mentally-oriented private groups are working to conserve the forests, soil, water, and wildlife.
Agencies and Programs Various programs in agriculture and forestry are promoted
throughout the islands making up the CNMI through the coop-eration and involvement of locally and federally funded govern-ment agencies. The following are the major government agen-cies involved in forestry/agriculture related activities and their respective roles:
1. Northern Marianas College- Land Grant Program - This institution is one of the member institutions in the ADAP Agroforestry Task Force. At present, the NMC library is building its reference collection in regards to agroforestry and forestry for its students. NMC Land Grant is also working on integrating agriculture and forestry in its re-search and extension programs. Land Grant is also working closely with the Department of Natural Resources and the Department of Environmental Quality in promoting soil and water conservation in the Commonwealth. 2. Department of Natural Resources- under the um-brella of this Department, several bureaus/offices per-form functions related to agroforestry:
a. Division of Agriculture- establishes forest tree seed lings through its nurseries on Saipan, Rota, and Tinian.
1 An abbreviated version of this paper was presented at the Workshop on Research Methodologies and Applications for Pacific Island Agroforestry, July 16-20, 1990, Kolonia, Pohnpei, Federated States of Micronesia.
2 Northern Marianas College Land Grant Program, Saipan, Commonwealth of the Northern Marianas Islands 96950.
Tangan-tangan (Leucaena leucocephala) areas are be-ing cleared on these islands to plant these forest tree seedlings. b. Division of Fish and Wildlife- establishes forest trees to serve as nesting sites for birds. To protect fruits bats and some indigenous species of fish, mollusks and other sea life-forms, the DOFAW creates and enforces regulations on hunting, fishing, and gathering of these species. c. Bureau of Plant Industry - works with the Northern Marianas College Land Grant Program in agriculture education programs. The main activities of these two agencies include the annual Agricultural Fairs on each island and the co-sponsoring of worthwhile seminars and workshops that attend to the educational needs of farmers regarding new technologies to improve profit ability of farming ventures under the very limited land, water, and capital resources of the CNMI. d. Quarantine Office - handles quarantine of imported plants and animals to prevent introduction and/or the spread of epidemics to existing crops and livestock in the CNMI. e. Soil and Water Conservation Office - this federally-funded office extends some financial assistance to farm-ers to reduce soils erosion and improve ground water quality.
3. Department of Environmental Quality - protects the environment from pollution by contaminants. The DEQ analyzes bacteria levels in drinking water and assists in the safe disposal of hazardous wastes. With the North-ern Marianas College Land Grant Program, it co-spon-sors annual pesticide workshops for small pesticide users and commercial applicators for the purpose of license renewal for handling restricted pesticides for crop and industrial applications, such as termite con-trol. 4. Coastal Resources Management - is actively in-volved in protecting and beautifying the coastal areas in support of the tourism industry. 5. Marianas Visitors Bureau - contributes to the main-tenance and beautification of scenic spots such as beaches, parks, and memorials for tourists and local citizens.
80 USDA Forest Service Gen. Tech. Rep. PSW-GTR-140. 1993.

Issues and Concerns Conflicts in the management of agroforestry resources do
exist in the CNMI. One example is the conflict between con-cerned individuals and government entities about the disposition of public land at Kagman, Saipan for development of a golf course. This project would cover the Kagman Watershed Project that was to initiate engineering work in 1991. This watershed project is very valuable to the CNMI since it will assist in the solution of soil erosion, flooding, and irrigation―common prob-lems on Saipan.
Due to rapid development leading to the conversion of agricultural and residential land to commercial purposes, e.g., garment factories, zoning of agricultural and residential use
lands has been proposed. However, so far this effort has not been successful due to the resistance of various affected groups.
Fire causes many problems in the maintenance of forests for natural habitat for birds and other wildlife. It also contributes to erosion and the degradation of soil fertility. Also, indigenous plants utilized as medicine by local people are destroyed.
Recommendations Increased educational efforts need to be made to create
public awareness about their responsibilities and contributions to the beautification and maintenance of stable agroforestry systems in this small chain of islands in the American Pacific.
USDA Forest Service Gen. Tech. Rep. PSW-GTR-140. 1993. 81

Agroforestry in Palau1
Ebals Sadang2
Abstract: Agroforestry was an important land use in Palau, located in the western Caroline Islands. However, as a result of land restrictions and concen-tration on cash crops, the incorporation of trees in agriculture has declined.
The Palau islands lie at 7°20' N latitude and 134°28' E longitude, on the western edge of the Caroline Islands. Palau lies approximately 800 km north of the equator, 800 km east of the Philippines, and 6000 km southwest of Hawaii. The archipelago consists of high volcanic islands and low, raised and atoll coral-line islands totaling [SIC] 350 islands, the heavily forested island of Babelthuap being the largest. The other three volcanic islands are Koror, Malakal, and Ngerkebesang. Limestone islands con-sist of Peleliu, Angaur, and the numerous rock islands, while Kayangel in the north and the southwest islands are atolls. The famous coralline limestone Rock Islands occupy the area south of Koror Island to Peleliu Island. This includes a group of 70 islands known as Ngerukewid or Seventy Islands Reserve, a cluster of islands, including a one mile surrounding marine area reserved as a marine and bird sanctuary, off-limits to both tour-ists and local people.
Being tropical, the Palau Islands are hot and humid, with a mean annual temperature of 27°C and a mean annual rainfall of 3,730 mm. There are nine months of heavy rainfall and three months of moderate rainfall. July is the wettest month. The driest months are from February to April with rainfall of about 881 to 1175 mm each month.
Agroforestry Systems Agroforestry was traditionally practiced on Palau in a more
intensive form than at present. The traditional agroforestry sys-tem was important in terms of soil conservation, protection (windbreak), and production of wood and food. Agroforests in Palau are usually located along the coastal areas and near dwell-
1 An abbreviated version of this paper was presented at the Workshop on Research Methodologies and Applications for Pacific Island Agroforestry, July 16-20, 1990, Kolonia, Pohnpei, Federated States of Micronesia.
2 Forester, Division of Agriculture and Forestry, Koror, Republic of Palau.
ings or on abandoned village sites. They are characterized by fruit trees, forest trees, and ornamental plants. In the local sys-tem, which has survived to the present, timber trees and other larger fruit trees like Terminalia, Malay apple, and breadfruit are interplanted with coconut and betel nut. Also associated with these trees are bananas and papaya. Smaller fruit trees such as lemon, guava, orange, Spondias, and others are inter-mixed with Xanthosoma taro, banana, and papaya. Colocasia and Cyrtosperma taros are also planted between rows of coconuts. Even the walk-ways around the taro swamps are planted to fruit trees such as mango, Eugenia, betel nut, lemon and other citrus, and other crops like papaya, banana, and sugar cane. The use of tree leaves as green manure, mulch, and compost has been and is still common in cassava gardens and taro patches.
The agroforest in Palau seems to be declining in size. This is probably due to tighter land holding restrictions than in the past and to the fact that people are concentrating their efforts on the production of mainly cash crops. Aside from the vegetable farms, cash crop farms of cassava, Colocasia taro, and a limited amount of sweet potato are increasing steadily. Usage of farm tractors and commercial fertilizers have become common prac-tices in modern Palau.
Research Possibilities The Division of Agriculture and Forestry is currently sup-
porting an agroforestry program. Being a relatively new research area, there is a lack of detailed data. The only information available at this time is the estimated acreage for agroforest and agroforest with coconut, made available in the recent USDA Forest Service “Vegetation Survey of Palau.” According to this report, the total acreage of agroforest is 1 ha and agroforest with coconuts is 279 ha, demonstrating the current precarious state of agroforestry in Palau.
82 USDA Forest Service Gen. Tech. Rep. PSW-GTR-140. 1993.

Indigenous Agroforestry in American Samoa1
Malala (Mike) Misa Agnes M. Vargo2
Abstract: Agroforestry exists in American Samoa as a system where indig-enous trees and natural vegetation used for food, fuelwood, crafts and medi-cine are incorporated with traditional staple crops and livestock on a set piece of land, usually a mountainous slope. Most agroforests are taro-based (Colocasia esculenta). While nutritional, cultural, social, economic and ecological ben-efits are realized from the agroforest, sufficient quantitative and qualitative documentation and widespread knowledge of the importance of agroforestry is lacking. Other problems include a shift toward monocropping, the land tenure system, illegal watershed intrusion, and the threat of pesticide misuse. To promote this highly sustainable and culturally important system, a holistic approach including detailed documentation, setting up of demonstration plots, and an active education program are suggested.
American Samoa, an unincorporated territory of the United States, is composed of five volcanic islands in the South Pa-cific―Tutuila, Tau, Ofu, Olosega and Aunuu; and two coral atolls: Rose and Swain’s Island. Total land area is 19,200 ha. American Samoa is about 3,680 km southwest of Hawaii and 6,640 mi southwest of San Francisco. The population of Ameri-can Samoa as of April 1991 was 46,638. The five volcanic islands are characterized by rugged mountainsides, small valleys and a narrow coastal fringe. The highest elevation is 926 m on Tau Island. Lush vegetation grows throughout the islands be-cause of high rainfall, the tropical climate, and fertile soil. The economy is heavily dependent on two tuna canneries and the Government of American Samoa, who together employ more than half the labor force.
American Samoa enjoys a tropical climate with an average rainfall between 5000 to 6350 cm per year. The driest period is between June and September and the average annual tempera-ture is 27°C. Hurricanes occasionally hit the island with the most recent, Hurricane Ofa, striking in February 1990.
The agricultural system is based mainly on subsistence farming. Crops are produced for the immediate needs of the family or for use as gifts. Most families grow at least some of their staple foods which include taro, bananas, breadfruit, yams, and coconuts. Other crops commonly grown are cassava, giant taro, papaya, pineapple, and citrus. In most places the crops are interplanted. A few small commercial farms specialize in cu-cumbers, cabbage, green pepper, onion, tomato, and eggplant. These farms supply the local markets and the fishing fleet that supports the canneries. In recent years, the economy of Ameri-can Samoa has become more cash-dependent. Consequently, some crops are sold at the local market.
Land in American Samoa is owned jointly by family mem-bers. The matai or chief assigns land to be worked by family members in the village. Implements of traditional agriculture include hand tools, such as the oso, a long, pointed digging stick
1 An abbreviated version of this paper was presented at the Workshop on Research Methodologies and Applications for Pacific Island Agroforestry, July 16-20, 1990, Kolonia, Pohnpei, Federated States of Micronesia.
2 Land Grant Program, American Samoa Community College, Pago Pago, American Samoa 96799.
used in the planting of taro. Hand weeding or slashing of weeds with a machete is a common week end task for the family. Fertilizers and pesticides are used in small amounts, mainly due to the unreliable supply of these items on island. Backpack sprayers are used for pesticide application. Rototillers and small tractors are sometimes used for plowing. Some American Samo-ans have brought in relatives from Western Samoa or hired Tongan or Oriental farmers to work their land full time, while they pursue wage jobs.
Traditional Agroforestry Agroforestry has existed in American Samoa for centuries.
It is a system where indigenous trees and natural vegetation are incorporated with traditional crops, vegetables, and sometimes livestock on a piece of land to serve as a basis for meeting the needs of the family and community. The importance of agroforestry to the Samoan people can be categorized in the following ways:
Nutritional Importance Indigenous agroforestry provides the basic staples of the
Samoan diet. Traditional agroforestry food crops include taro, giant taro (“ta’amu”), coconut, banana, breadfruit, yam, papaya, mango, oranges/citrus, and other assorted fruits and vegetables. Livestock such as pigs and chickens are also incorporated into the agroforest setting. The traditional diet is considered more nutritious than imported foods, which are often high in fat and sugar content. Taro, banana, breadfruit, and yam are excellent carbohydrate sources. Livestock and fish provide protein. Fruits such as mango, guava, papaya, soursop, avocado, coconut, and breadfruit are very good sources of fiber, vitamins C, A, and B-complex and micronutrients.
Cultural/Social Importance
Plants of the Samoan agroforest are critical cultural re-sources. Certain plants are used medicinally by traditional heal-ers while the agroforest and surrounding rainforest are potential pharmacological reservoirs. Other plants supply the raw materi-als for special occasions (e.g., Piper methysticum in the “kava” ceremony) and provide for the raw materials to build, bind, and decorate traditional crafts, housing (fale), and canoes.
Agroforestry food products and farming practices are also important in a social sense. Taro, breadfruit, banana, and pigs, for example, play an important part in the Samoan tradition of “fa’alavelave” where family members are called on to support each other in times of celebration or mourning.
The planting and maintenance of a family’s agroforest plots also strengthens family ties and promotes social bonding. Mem-bers of different generations work together, teach each other,
USDA Forest Service Gen. Tech. Rep. PSW-GTR-140. 1993. 83

exchange stories, sing songs, joke around, and reinforce the value systems that make Samoan culture so unique. Health benefits are also derived from the exercise involved in preparing the land, planting, weeding, and harvesting of crops, especially on the steep slopes.
Ecological Importance The diversity of the Samoan agroforestry system promotes
stability and protection against natural disasters and pest infesta-tions. For example, taro pests are infrequent in an agroforest for several reasons. First, the physical separation of like crops in the intercropped planting scheme characteristic of agroforests inter-feres with the insect’s detection of and spread to crops of the same species. Since insect tastes are very specific, this prevents outbreak situations from occurring. Similarly, chemical odors emitted from the various plants confuse the insect’s sense of smell, which is also crucial in host detection. Finally, weeds and other non-crop components of the agroforest often act as a nectar source for biological controls, which generally are nectar-feed-ing wasps or flies that parasitize insect pests.
Trees of the Samoan agroforest are ecologically important in many ways. They serve as windbreaks, provide shade, recycle soil nutrients and prevent soil erosion. Trees such as the Erythrina and Sesbania are important in nitrogen fixation. The agroforest also provides the habitat and food sources for the fruit bats that pollinate up to 70 percent of the native rainforest. Similarly, it helps maintain doves, pigeons, and other birds of traditional importance.
Economic Importance A tremendous economic advantage is realized through the
growing of one’s own food and the collecting of firewood from one’s own land. Most Samoan households grow some portion of their staple food, usually taro, banana, and breadfruit. The culti-vation of non-food trees also provides considerable economic benefit. Pandanus, for example, is important in the production of woven crafts and fine mats. These items are an important unit of exchange in Samoan culture and a source of income for the makers. Likewise, the paper mulberry (Broussonetia papyrifera) is important in the production of tapa cloth, which is a highly valued Samoan art form. Other plants and trees are sources of dyes for making tapa. Samoan agroforest trees also serve as sources of carving, building, and fence-making materials.
Components of Agroforestry Systems Most agroforestry systems in American Samoa include
taro. An initial documentation of these taro-based systems was made in November 1989 by an interdisciplinary team as part of a Low-Input. Sustainable Agriculture (LISA) project. The survey tool used was a Rapid Rural Appraisal (RRA). Table 1 lists the various components of these taro-based systems and the percentage of farmers planting that crop in association with taro. Over 50 percent of farmers surveyed grew taro with the following: banana (86 percent), coconut (73 percent), gi-
ant taro (Alocasia macrorrhiza) (68 percent), papaya (64 per-cent), Erythrina variegata (“gatie”)(59 percent), and yam (50 percent) in a multicropped system with taro. Twenty-one vari-eties of Colocasia esculenta were documented with over 50 percent of the farmers growing Niue, Manua, and Pa’epa’e varieties. This survey provides a starting point for agroforest documentation that can be supplemented with additional de-tails of other representative systems.
An initial categorization of agroforestry systems in Ameri-can Samoa is suggested below:
Village/Small Plantation Systems -taro (Colocasia esculenta) -ta’amu (Alocasia macrorrhiza) -banana (Musa spp.) -papaya -coconut -livestock (pigs, chickens)
Upland Systems -coconut -breadfruit (Artocarpus altilis) -ta’amu -taro -taro palagi (Xanthosoma sagittifolium) -cocoa (Theobroma cacao) -pineapple -fuelwood trees (“toi” -Alphotonia zizyphoides, “lopa”-
Adenanthera pavovnina) -livestock (pigs)
Village/Large Plantation Systems -taro -banana -ta’amu -yams (Dioscorea alata) -cassava (Manihot esculenta) -pineapple -fruit trees: mango, Citrus spp.; Avocado (Persea
americana)
Table 1-Crops grown with Colocasia taro (1989 RRA LISA Taro Survey)
Crops grown with taro Percent of farmers
Banana 6 Coconut 3 Ta’amu (Alocasia macrorrhiza) 68 Papaya 64 Gatie (Erythrina variegata) 59 Yam 50 Breadfruit 5 Cassava 6 Ti 36 Vegetables 2 Plantain 7 Sugarcane 3 Citrus 8 Cocoa 8 Pineapple 8 Pele (Hibiscus manihot) 14 Kava (Piper methysticum) 14
87
43
322111
84 USDA Forest Service Gen. Tech. Rep. PSW-GTR-140. 1993.

-flower trees: Hibiscus spp., Plumeria sp. -vegetables: pele (Hibiscus manihot), green pepper (Cap-
sicum frutescens), tomato, and Brassica spp. -livestock (pigs, chickens)
Threats to Agroforestry American Samoan society is constantly being exposed to
ideas of Westernization, modernization, and mechanization. As a result, traditional practices are continually being challenged or modified. Likewise, the practice of agroforestry also may be threatened in several ways:
Importance of Agroforestry Not Realized Agroforestry, as is anything that is commonplace, is often
taken for granted and not openly valued or esteemed. Without adequate documentation, discussion and reaffirmation of their merits, many agroforestry practices may disappear. The lack of qualitative and quantitative data on the nature, extent, cultural and ecological value of agroforestry is a major problem.
Promotion of Monocropping
Some farmers have shifted to monocropping of taro and other crops, expecting high yields and profit from an intensely planted crop. While profits might increase initially, there are inherent disadvantages in the practice that may eventually cause a decline in profits. Pest outbreaks are more common in monocropped fields because of the ease of pest dispersal from plant to plant. Soil nutrients are depleted more rapidly under monocropped conditions. Additionally, soil erosion is more likely to occur in monocropped fields where a tractor has been used for plowing.
Land Tenure System Under the “Matai” system, land disputes are common. What
one “matai” has sold or assigned may not be honored by their successor. Often, boundaries of family land are not definite. As a result, proper use and maintenance of a given area of land is threatened.
Firewood Gathering Practices
Firewood is taken from the watershed indiscriminately or illegally at times. Besides causing land disputes, this practice may predispose the land toward landslides, soil runoff, and other soil erosion problems. Most plantations are located on slopes of 30 degrees or more.
Pesticides
Pesticide use is minimal on the island, according to the recent RRA survey (table 2). However, there is the threat of the misuse of pesticides near water runoff areas. This would serve as a possible source of pollution for groundwater, water catchment systems and the reef. These components of the agroforestry system need to be protected to insure the sustainability of the entire agroforestry system.
Future of Agroforestry in American Samoa The continuation and possible expansion of agroforestry
in American Samoa shows great potential. The approach to this should be holistic. Efforts must be made to base planning decisions regarding agroforestry on more than economic and political factors. Other criteria such as nutritional, medical, cultural, social, aesthetic, spiritual and ecological factors must be given greater consideration. The following suggestions are being made to address these considerations so that the future existence and improvement of agroforestry in American Sa-moa may be insured.
Documentation of Current Systems Collecting of quantitative and qualitative data on the exist-
ing agroforestry systems and associated practices must be made in order to serve as a record of traditional knowledge and values. With this information, aspects of the system can be scrutinized and supplemented with appropriate technological advancements. This documentation will also provide baseline data on which to base future comparisons.
Introduction of Desirable Species
Traditional systems can be modified by introducing new plant species that will enhance or vary the food-producing capa-bilities of the system, increase income for the family, or promote nutrient-recycling capabilities.
Table 2-Use of agrochemicals in American Samoa (1989 RRA Survey of 28 farmers)
Name of agrochemical Type armers
Paraquat
(pct.)
Herbicide Malathion cticide 27 Round-up bicide 14 Ambush nsecticide 5 Benlate 5 Dicidex nsecticide 5 Commercial Fertilizer Fertilizer 5
F
50 InseHerIFungicide I
USDA Forest Service Gen. Tech. Rep. PSW-GTR-140. 1993. 85

Establishment of “On” and “Off” Station Demonstration Sites
In order to promote the idea of agroforestry in American Samoa, demonstration sites are needed to illustrate to the public the workability and sustainability of the system. Variations of the current systems also can be presented so that educated comparisons can be made.
Educational Program
An active environmental education program must be initi-ated to inform policy makers, government planners, extension agents, children, and the public about agroforestry. Through education, aforementioned problems of land tenure, monocropping, firewood gathering practices, and pesticide mis-use can be addressed. Education of the youth through 4-H or other organized groups would be of beneficial, long-lasting investment. Special workshops for Extension workers would help agents in explaining and furthering the concept of agroforestry to their clients as well as prepare them for questions. Advantages and disadvantages of the system must be openly discussed.
To supplement documentation and provide a further basis for educational programs, research and experimental confirma-tion of various attributes of the agroforestry system is needed. Cooperative research with the staff of the local Land Grant college would assist in this regard.
Conclusions The future of agroforestry appears bright in American Sa-
moa because recognition of the problems associated with its possible disappearance have already been recognized. However, as the above approaches suggest, active promotion of the system to government planners and the public must be made in order to insure the maintenance of this highly sustainable and culturally important system.
Acknowledgments We thank Pemerika Tauili’ili, Director of the Land Grant
Program, for his support and encouragement of the Agroforestry Project in American Samoa; Michael Harrington, Van Adkins, and the Land Grant Forestry Crew (Lamese Tavae and Sione Mata’u) for their efforts in establishing and maintaining an active agroforestry demonstration project in American Samoa; and Don Vargo for his assistance in reviewing this manuscript.
References Nakamura, S. 1983. Soil survey of American Samoa. Soil Conservation Ser-
vice. Vargo, A.; Ferentinos, L. 1991. A rapid rural appraisal of taro production
systems in Micronesia, Hawaii, and American Samoa. University of Ha-waii, Honolulu.
86 USDA Forest Service Gen. Tech. Rep. PSW-GTR-140. 1993.

The Forest Service, US. Department of Agriculture, is responsible for Federal leadership in forestry. It carries out this role through four main activities:
• Protection and management of resources on 191 million acres of National Forest System lands • Cooperation with State and local governments, forest industries, and private landowners to help
protect and manage non-Federal forest and associated range and watershed lands • Participation with other agencies in human resource and community assistance programs to
improve living conditions in rural areas • Research on all aspects of forestry, rangeland management, and forest resources utilization.
The Pacific Southwest Research Station • Represents the research branch of the Forest Service in California, Hawaii, American Samoa
and the western Pacific.
Persons of any race, color, national origin, sex, age, religion, or with any handicapping conditions are welcome to use and enjoy all facilities, programs, and services of the U.S. Department of Agriculture. Discrimination in any form is strictly against agency policy, and should be reported to the Secretary of Agriculture, Washington, DC 20250.

Proceedings of the Workshop on Research Methodologies and ApplicationsForest Service
for Pacific Island Agroforestry Pacific Southwest Research Station
General Technical Report PSW-GTR-140