
ENLG 2015 Proceedings of the 15th European Workshop on ...
187
ENLG 2015 Proceedings of the 15th European Workshop on Natural Language Generation 10-11 September 2015 University of Brighton Brighton, UK
-
Upload
khangminh22 -
Category
Documents
-
view
0 -
download
0
Transcript of ENLG 2015 Proceedings of the 15th European Workshop on ...

ENLG 2015
Proceedings of the15th European Workshop
onNatural Language Generation
10-11 September 2015University of Brighton
Brighton, UK
Co-organised by:
COST Action IC1307, The European Network on Vision and Language (iV&L Net)
Endorsed by:
SIGGEN, the ACL Special Interest Group in Natural Language Generation
c©2015 The Association for Computational Linguistics
Order copies of this and other ACL proceedings from:
Association for Computational Linguistics (ACL)209 N. Eighth StreetStroudsburg, PA 18360USATel: +1-570-476-8006Fax: [email protected]
ISBN: 978-1-941643-78-5
ii

iii

Introduction
We are pleased to present the papers accepted for presentation at the 15th European Workshop on NaturalLanguage Generation (ENLG 2015), to be held on 10th and 11th September in Brighton, UK.
ENLG is a biennial series, which started with a workshop in Royaumont, France in 1987 and was mostrecently held in Sofia, Bulgaria in 2013. Together with the International Conference on Natural LanguageGeneration (INLG), held in alternate years, ENLG is the main forum for research on all aspects of thegeneration of natural language.
This year, ENLG has a special theme on Image and Video Description. Vision and Language moregenerally has, over the past five years, become a research field in its own right, a development reflectedfor example in the recently introduced Vision and Language areas at ACL and EMNLP. Image and videodescription is the obvious vision and language application for NLG and with this special theme we areaiming both to provide a forum for existing work and to stimulate new research. We are delighted to havetwo invited speakers addressing the special theme in different ways. Mirella Lapata reports her workinvestigating how best to interpret and verbalise visual information, while Pinar Duygulu-Sahin providesa broader overview of image and video description work with a focus on weakly labelled images.
We received a total of 41 submissions for the workshop, from all over the world — not only Europe, butNorth and South America, Asia and Australasia — and accepted 11 as long papers for oral presentation,13 as short papers for poster presentation, and 3 as demos. This volume contains all the accepted papers,as well as the abstracts by the two invited speakers.
We would like to thank all the authors who submitted papers, and the members of our programcommittee, for helping to ensure the high standard and continuing health of ENLG 2015 and of NLGresearch in general.
Anja Belz, Albert Gatt, Francois Portet and Matthew Purver
iv

Organising Committee
Organisers:
Anya Belz (University of Brighton, UK)Albert Gatt (University of Malta, Malta)Francois Portet (Univ. Grenoble Alpes, France)Matthew Purver (Queen Mary University of London, UK)
Program Committee:
Anya Belz (University of Brighton, UK)Bernd Bohnet (Google, Germany)Aoife Cahill (Educational Testing Service, USA)Pinar Duygulu-Sahin (Hacettepe University, Turkey)Marc Dymetman (Xerox Research Centre Europe, France)Desmond Elliott (Centrum Wiskunde & Informatica, Netherlands)Claire Gardent (CNRS/LORIA Nancy, France)Albert Gatt (University of Malta, Malta)Pablo Gervas (Universidad Complutense de Madrid, Spain)Dimitra Gkatzia (Heriot-Watt University, UK)Jordi Gonzalez (Computer Vision Center, Spain)Markus Guhe (University of Edinburgh, UK)Helen Hastie (Heriot-Watt University, UK)Raquel Hervas (Universidad Complutense de Madrid, Spain)Julia Hockenmaier (University of Illinois, USA)Julian Hough (Bielefeld University, Germany)Marina Ivasic-Kos (University of Rijeka, Croatia)John Kelleher (Dublin Institute of Technology, Ireland)Alexander Koller (University of Potsdam, Germany)Guy Lapalme (RALI-DIRO, Universite de Montral, Canada)Kathleen Mccoy (University of Delaware, USA)Margaret Mitchell (Johns Hopkins University, USA)Neil O’Hare (Yahoo! Research, Spain)Patrizia Paggio (University of Malta and University of Copenhagen)Francois Portet (Univ. Grenoble Alpes, France)Matthew Purver (Queen Mary University of London, UK)Ehud Reiter (University of Aberdeen, UK)Horacio Saggion (Universitat Pompeu Fabra, Spain)Advaith Siddharthan (University of Aberdeen, UK)Mariet Theune (University of Twente, Netherlands)Juan-Manuel Torres-Moreno (Laboratoire Informatique d’Avignon / UAPV, France)Kees Van Deemter (University of Aberdeen, UK)Leo Wanner (ICREA and University Pompeu Fabra, Spain)Michael White (The Ohio State University, USA)
v

Invited Speakers
Pinar Duygulu-Sahin (Hacettepe University, Turkey):
Words and Pictures: Mining Weakly Labeled Web Images and Videos for Automatic Concept Learning
The increasing number of images and videos resulted in new challenges for computer vision com-munity. The requirement for manual labeling continues to be one of the most important limitationsin large scale recognition. Alternatively, massive amount of images and videos with annotatedmetadata or descriptions are available on the Web. Although incomplete and errorful,availabilityof these annotations recently attracted many researchers to build (semi-)automatic methods to learnfrom weakly labeled data. However, images on the web are “in the wild” resulting in challengesthat makes the data collections gathered from web different from the hand crafted datasets.
In this talk, first I will discuss the challenges in learning from weakly labeled images, Then, I willdescribe our recent efforts on recognition of visual attributes, as well as objects, scenes and faceson the large scale using weakly labeled images. Going beyond images, finally I will briefly discussthe issues in videos.
Mirella Lapata (University of Edinburgh, UK):
Learning to Interpret and Describe Abstract Scenes
Given a (static) scene, a human can effortlessly describe what is going on (who is doing what towhom, how, and why). The process requires knowledge about the world, how it is perceived, anddescribed. In this talk I will focus on the problem of interpreting and verbalizing visual informationusing abstract scenes created from collections of clip art images. I will introduce a model inspiredby machine translation (where the task is to transform a source sentence into its target translation)and argue that generating descriptions for scenes is quite similar, but with a twist: the translationprocess is very loose and selective; there will always be objects in a scene not worth mentioning,and words in a description that will have no visual counterpart.
Our key insight is to represent scenes via visual dependency relations corresponding to senten-tial descriptions. This allows us to create a large parallel corpus for training a statistical machinetranslation system, which we interface with a content selection component guiding the transla-tion toward interesting or important scene content. Advantageously, our model can be used in thereverse direction, i.e., to generate scenes, without additional engineering effort. Our approach out-performs a number of competitive alternatives, when evaluated both automatically and by humans.
Joint work with Luis Gilberto Mateos Ortiz, Carina Silberer, and Clemens Wolff.
vi
Table of Contents
A Simple Surface Realization Engine for TeluguSasi Raja Sekhar Dokkara, Suresh Verma Penumathsa and Somayajulu Gowri Sripada . . . . . . . . . . . 1
Input Seed Features for Guiding the Generation Process: A Statistical Approach for SpanishCristina Barros and Elena Lloret . . . . . . . . . . . . . . . . . . . . . . . . . . . . . . . . . . . . . . . . . . . . . . . . . . . . . . . . . . . . 9
A Domain Agnostic Approach to Verbalizing n-ary Events without Parallel CorporaBikash Gyawali, Claire Gardent and Christophe Cerisara . . . . . . . . . . . . . . . . . . . . . . . . . . . . . . . . . . . . .18
Inducing Clause-Combining Rules: A Case Study with the SPaRKy Restaurant CorpusMichael White and David M. Howcroft . . . . . . . . . . . . . . . . . . . . . . . . . . . . . . . . . . . . . . . . . . . . . . . . . . . . 28
Reading Times Predict the Quality of Generated Text Above and Beyond Human RatingsSina Zarrieß, Sebastian Loth and David Schlangen . . . . . . . . . . . . . . . . . . . . . . . . . . . . . . . . . . . . . . . . . . 38
Moving Targets: Human References to Unstable LandmarksAdriana Baltaretu, Emiel Krahmer and Alfons Maes . . . . . . . . . . . . . . . . . . . . . . . . . . . . . . . . . . . . . . . . . 48
A Framework for the Generation of Computer System Diagnostics in Natural Language using FiniteState Methods
Rachel Farrell, Gordon Pace and M Rosner . . . . . . . . . . . . . . . . . . . . . . . . . . . . . . . . . . . . . . . . . . . . . . . . . 52
A Snapshot of NLG Evaluation Practices 2005 - 2014Dimitra Gkatzia and Saad Mahamood . . . . . . . . . . . . . . . . . . . . . . . . . . . . . . . . . . . . . . . . . . . . . . . . . . . . . . 57
Japanese Word Reordering Executed Concurrently with Dependency Parsing and Its EvaluationTomohiro Ohno, Kazushi Yoshida, Yoshihide Kato and Shigeki Matsubara . . . . . . . . . . . . . . . . . . . . 61
Sentence Ordering in Electronic Navigational Chart Companion Text GenerationJulie Sauvage-Vincent, Yannis Haralambous and John Puentes . . . . . . . . . . . . . . . . . . . . . . . . . . . . . . . 66
Natural Language Generation from PictographsLeen Sevens, Vincent Vandeghinste, Ineke Schuurman and Frank Van Eynde . . . . . . . . . . . . . . . . . . 71
Translating Italian to LIS in the Rail StationsAlessandro Mazzei . . . . . . . . . . . . . . . . . . . . . . . . . . . . . . . . . . . . . . . . . . . . . . . . . . . . . . . . . . . . . . . . . . . . . . . 76
Response Generation in Dialogue Using a Tailored PCFG ParserCaixia Yuan, Xiaojie Wang and Qianhui He . . . . . . . . . . . . . . . . . . . . . . . . . . . . . . . . . . . . . . . . . . . . . . . . 81
Generating Recit from Sensor Data: Evaluation of a Task Model for Story Planning and PreliminaryExperiments with GPS Data
Belen A. Baez Miranda, Sybille Caffiau, Catherine Garbay and Francois Portet . . . . . . . . . . . . . . . . 86
Generating and Evaluating Landmark-Based Navigation Instructions in Virtual EnvironmentsAmanda Cercas Curry, Dimitra Gkatzia and Verena Rieser . . . . . . . . . . . . . . . . . . . . . . . . . . . . . . . . . . . 90
Summarising Unreliable DataStephanie Inglis . . . . . . . . . . . . . . . . . . . . . . . . . . . . . . . . . . . . . . . . . . . . . . . . . . . . . . . . . . . . . . . . . . . . . . . . . 95
Generating Descriptions of Spatial Relations between Objects in ImagesAdrian Muscat and Anja Belz . . . . . . . . . . . . . . . . . . . . . . . . . . . . . . . . . . . . . . . . . . . . . . . . . . . . . . . . . . . . 100
vii

Towards Flexible, Small-Domain Surface Generation: Combining Data-Driven and Grammatical Ap-proaches
Andrea Fischer, Vera Demberg and Dietrich Klakow . . . . . . . . . . . . . . . . . . . . . . . . . . . . . . . . . . . . . . . 105
JSrealB: A Bilingual Text Realizer for Web ProgrammingPaul Molins and Guy Lapalme . . . . . . . . . . . . . . . . . . . . . . . . . . . . . . . . . . . . . . . . . . . . . . . . . . . . . . . . . . . 109
A Game-Based Setup for Data Collection and Task-Based Evaluation of Uncertain Information Presen-tation
Dimitra Gkatzia, Amanda Cercas Curry, Verena Rieser and Oliver Lemon . . . . . . . . . . . . . . . . . . . . 112
Generating Referential Descriptions Involving Relations by a Best-First Searching Procedure – A SystemDemo
Florin Haque and Helmut Horacek . . . . . . . . . . . . . . . . . . . . . . . . . . . . . . . . . . . . . . . . . . . . . . . . . . . . . . . 114
Generating Image Descriptions with Gold Standard Visual Inputs: Motivation, Evaluation and BaselinesJosiah Wang and Robert Gaizauskas . . . . . . . . . . . . . . . . . . . . . . . . . . . . . . . . . . . . . . . . . . . . . . . . . . . . . . 117
Designing an Algorithm for Generating Named Spatial ReferencesRodrigo de Oliveira, Yaji Sripada and Ehud Reiter . . . . . . . . . . . . . . . . . . . . . . . . . . . . . . . . . . . . . . . . . 127
Narrative Generation from Extracted AssociationsPierre-Luc Vaudry and Guy Lapalme . . . . . . . . . . . . . . . . . . . . . . . . . . . . . . . . . . . . . . . . . . . . . . . . . . . . . 136
Topic Transition Strategies for an Information-Giving AgentNadine Glas and Catherine Pelachaud . . . . . . . . . . . . . . . . . . . . . . . . . . . . . . . . . . . . . . . . . . . . . . . . . . . . . 146
Creating Textual Driver Feedback from Telemetric DataDaniel Braun, Ehud Reiter and Advaith Siddharthan . . . . . . . . . . . . . . . . . . . . . . . . . . . . . . . . . . . . . . . . 156
A Personal Storytelling about Your Favorite DataCyril Labbe, Claudia Roncancio and Damien Bras . . . . . . . . . . . . . . . . . . . . . . . . . . . . . . . . . . . . . . . . . 166
viii

ix

Conference Programme
Day 1: Thursday, 10th September 2015
8:00–9:15 Registration
9:15–9:30 Introduction
Session 1: Surface Realisation (Chair: Michael White)
9:30–10:00 A Simple Surface Realization Engine for TeluguSasi Raja Sekhar Dokkara, Suresh Verma Penumathsa and Somayajulu Gowri Sripada
10:00–10:30 Input Seed Features for Guiding the Generation Process: A Statistical Approach forSpanishCristina Barros and Elena Lloret
10:30–11:00 Coffee
Session 2: Sentence Planning and Evaluation (Chair: Ehud Reiter)
11:00–11:30 A Domain Agnostic Approach to Verbalizing n-ary Events without Parallel CorporaBikash Gyawali, Claire Gardent and Christophe Cerisara
11:30–12:00 Inducing Clause-Combining Rules: A Case Study with the SPaRKy Restaurant CorpusMichael White and David M. Howcroft
12:00–12:30 Reading Times Predict the Quality of Generated Text Above and Beyond Human Rat-ingsSina Zarrieß, Sebastian Loth and David Schlangen
12:30–1:30 Lunch
1:30–2:30 Invited Talk: Mirella Lapata (Chair: Matthew Purver)Learning to Interpret and Describe Abstract Scenes
2:30–5:00 Poster and Demo Session (with coffee 3:00-3:30)
Posters
Moving Targets: Human References to Unstable LandmarksAdriana Baltaretu, Emiel Krahmer and Alfons Maes
A Framework for the Generation of Computer System Diagnostics in Natural Languageusing Finite State MethodsRachel Farrell, Gordon Pace and M Rosner
A Snapshot of NLG Evaluation Practices 2005 - 2014Dimitra Gkatzia and Saad Mahamood
Japanese Word Reordering Executed Concurrently with Dependency Parsing and ItsEvaluationTomohiro Ohno, Kazushi Yoshida, Yoshihide Kato and Shigeki Matsubara
x
Day 1: Thursday, 10th September 2015 (continued)
Sentence Ordering in Electronic Navigational Chart Companion Text GenerationJulie Sauvage-Vincent, Yannis Haralambous and John Puentes
Natural Language Generation from PictographsLeen Sevens, Vincent Vandeghinste, Ineke Schuurman and Frank Van Eynde
Translating Italian to LIS in the Rail StationsAlessandro Mazzei
Response Generation in Dialogue Using a Tailored PCFG ParserCaixia Yuan, Xiaojie Wang and Qianhui He
Generating Recit from Sensor Data: Evaluation of a Task Model for Story Planningand Preliminary Experiments with GPS DataBelen A. Baez Miranda, Sybille Caffiau, Catherine Garbay and Francois Portet
Generating and Evaluating Landmark-Based Navigation Instructions in Virtual Envi-ronmentsAmanda Cercas Curry, Dimitra Gkatzia and Verena Rieser
Summarising Unreliable DataStephanie Inglis
Generating Descriptions of Spatial Relations between Objects in ImagesAdrian Muscat and Anja Belz
Towards Flexible, Small-Domain Surface Generation: Combining Data-Driven andGrammatical ApproachesAndrea Fischer, Vera Demberg and Dietrich Klakow
Demos
JSrealB: A Bilingual Text Realizer for Web ProgrammingPaul Molins and Guy Lapalme
A Game-Based Setup for Data Collection and Task-Based Evaluation of UncertainInformation PresentationDimitra Gkatzia, Amanda Cercas Curry, Verena Rieser and Oliver Lemon
Generating Referential Descriptions Involving Relations by a Best-First Searching Pro-cedure – A System DemoFlorin Haque and Helmut Horacek
5:00 End of Day 1
xi

Day 2: Friday, 11th September 2015
9:00–10:00 Invited Talk: Pinar Duygulu-SahinWords and Pictures: Mining Weakly Labeled Web Images and Videos for AutomaticConcept Learning
Session 3: Generation from Visual and Geographic Input (Chair: Amy Isard)
10:00–10:30 Generating Image Descriptions with Gold Standard Visual Inputs: Motivation, Evalu-ation and BaselinesJosiah Wang and Robert Gaizauskas
10:30–11:00 Designing an Algorithm for Generating Named Spatial ReferencesRodrigo de Oliveira, Yaji Sripada and Ehud Reiter
11:00–11:30 Coffee
Session 4: Narrative and Discourse (Chair: Francois Portet)
11:30–12:00 Narrative Generation from Extracted AssociationsPierre-Luc Vaudry and Guy Lapalme
12:00–12:30 Topic Transition Strategies for an Information-Giving AgentNadine Glas and Catherine Pelachaud
12:30–1:30 Lunch
Session 5: Data to Text (Chair: Claire Gardent)
1:30–2:00 Creating Textual Driver Feedback from Telemetric DataDaniel Braun, Ehud Reiter and Advaith Siddharthan
2:00–2:30 A Personal Storytelling about Your Favorite DataCyril Labbe, Claudia Roncancio and Damien Bras
2:30–3:00 Closing Session
3:00-3:30 Coffee
3:30-4:30 Discussion Session on Generation Challenges Initiative(Chairs: Anya Belz, Albert Gatt)
4:30 End of ENLG 2015
xii

Proceedings of the 15th European Workshop on Natural Language Generation (ENLG), pages 1–8,Brighton, September 2015. c©2015 Association for Computational Linguistics
A Simple Surface Realization Engine for Telugu
Sasi Raja Sekhar Dokkara, Suresh Verma Penumathsa
Dept. of Computer Science Adikavi Nannayya University, India
[email protected],[email protected]
Somayajulu G. Sripada Dept. of Computing Science University of Aberdeen, UK
Abstract
Telugu is a Dravidian language with nearly 85 million first language speakers. In this paper we report a realization en-gine for Telugu that automates the task of building grammatically well-formed Tel-ugu sentences from an input specification consisting of lexicalized grammatical constituents and associated features. Our realization engine adapts the design ap-proach of SimpleNLG family of surface realizers.
1 Introduction
Telugu is a Dravidian language with nearly 85 million first language speakers. It is a morpho-logically rich language (MRL) with a simple syntax where the sentence constituents can be ordered freely without impacting the primary meaning of the sentence. In this paper we de-scribe a surface realization engine for Telugu. Surface realization is the final subtask of an NLG pipeline (Reiter and Dale, 2000) that is responsi-ble for mechanically applying all the linguistic choices made by upstream subtasks (such as mi-croplanning) to generate a grammatically valid surface form. Our Telugu realization engine is designed following the SimpleNLG (Gatt and Reiter, 2009) approach which recently has been used to build surface realizers for German (Boll-mann, 2011), Filipino (Ethel Ong et al., 2011), French (Vaudry and Lapalme, 2013) and Brazili-an Portuguese (de Oliveira and Sripada, 2014). Figure 1 shows an example input specification in XML corresponding to the Telugu sentence (1). vAlYlYu aMxamEna wotalo
neVmmaxigA naduswunnAru. (They are walking slowly in a
beautiful garden.) (1)
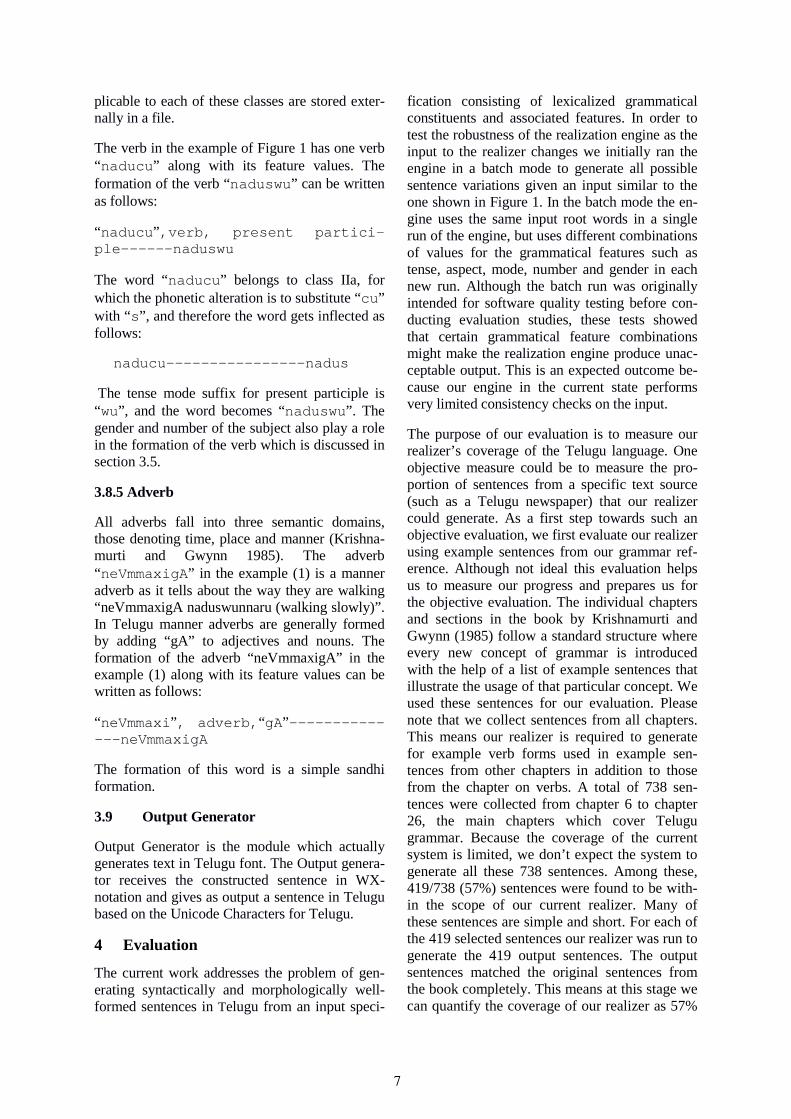
<?xml version=”1.0”encoding=”UTF-8”standalone=”no”> <document> <sentence type=” ” predicate-type=”verbal” respect=”no”> <nounphrase role=”subject”> <head pos=”pronoun” gender=”human” number=”plural” person=”third” case-marker=” ” stem=”basic”> vAdu</head> </nounphrase> <nounphrase role=”complement”> <modifier pos=”adjective” type=”descriptive” suffix=”aEna”> aMxamu</modifier> <head pos=”noun” gen-der=”nonmasculine” number=”singular” person=”third” casemarker=”lo” stem=”basic”> wota</head> </nounphrase> <verbphrase type=” ”> <modifier pos=”adverb” suffix=”gA”> neVmmaxi</modifier> <head pos=”verb” tense-mode=”presentparticiple”> naducu</head> </verbphrase> </sentence> </document>
Figure 1. XML Input Specification
2 Related Work
Several realizers are available for English and other European languages (Gatt and Reiter, 2009; Vaudry and Lapalme, 2013; Bollmann, 2011; Elhadad and Robin, 1996). Some general purpose realizers (as opposed to realizers built as part of an MT system) have started appearing for Indian languages as well. Smriti Singh et al. (2007) re-port a Hindi realizer that includes functionality for choosing post-position markers based on se-mantic information in the input. This is in con-trast to the realization engine reported in the cur-rent paper which assumes that choices of constit-
1

uents, root words and grammatical features are all preselected before realization engine is called. There are no realization engines for Telugu to the best of our knowledge. However, a rich body of work exists for Telugu language processing in the context of machine translation (MT). In this con-text, earlier work reported Telugu morphological processors that perform both analysis and genera-tion (Badri et al., 2009; Rao and Mala, 2011; Ganapathiraju and Levin, 2006).
2.1 The SimpleNLG Framework
A realization engine is an automaton that gener-ates well-formed sentences according to a gram-mar. Therefore, while building a realizer the grammatical knowledge (syntactic and morpho-logical) of the target language is an important resource. Realizers are classified based on the source of grammatical knowledge. There are real-izers such as FUF/SURGE that employ grammat-ical knowledge grounded in a linguistic theory (Elhadad and Robin, 1996). There have also been realizers that use statistical language models such as Nitrogen (Knight and Hatzivassiloglou, 1995) and Oxygen (Habash, 2000). While linguistic theory based grammars are attractive, authoring these grammars can be a significant endeavor (Mann and Matthiessen, 1985). Besides, non-linguists (most application developers) may find working with such theory heavy realizers difficult because of the initial steep learning curve. Simi-larly building wide coverage statistical models of language too is labor intensive requiring collec-tion and analysis of large quantities of corpora. It is this initial cost of building grammatical re-sources (formal or statistical) that becomes a sig-nificant barrier in building realization engines for new languages. Therefore, it is necessary to adopt grammar engineering strategies that have low initial costs. The surface realizers belonging to the SimpleNLG family incorporate grammatical knowledge corresponding to only the most fre-quently used phrases and clauses and therefore involve low cost grammar engineering. The main features of a realization engine following the SimpleNLG framework are:
1. A wide coverage morphology module inde-
pendent of the syntax module 2. A light syntax module that offers functionality
to build frequently used phrases and clauses without any commitment to a linguistic theo-ry. The large uptake of the SimpleNLG real-izer both in the academia and in the industry
shows that the light weight approach to syn-tax is not a limitation.
3. Using ‘canned’ text elements to be directly dropped into the generation process achiev-ing wider syntax coverage without actually extending the syntactic knowledge in the re-alizer.
4. A rich set of lexical and grammatical features that guide the morphological and syntactic operations locally in the morphology and syntax modules respectively. In addition, fea-tures enforce agreement amongst sentence constituents more globally at the sentence level.
3 Telugu Realization Engine
The current work follows the SimpleNLG framework. However, because of the known dif-ferences between Telugu and English Sim-pleNLG codebase could not be reused for build-ing Telugu realizer. Instead our Telugu realizer was built from scratch adapting several features of the SimpleNLG framework for the context of Telugu.
There are significant variations in spoken and written usage of Telugu. There are also signifi-cant dialectical variations, most prominent ones correspond to the four regions of the state of An-dhra Pradesh, India – Northern, Southern, East-ern and Central (Brown, 1991). In addition, Tel-ugu absorbed vocabulary (Telugised) from other Indian languages such as Urdu and Hindi. As a result, a design choice for Telugu realization en-gine is to decide the specific variety of Telugu whose grammar and vocabulary needs to be rep-resented in the system. In our work, we use the grammar of modern Telugu developed by (Krish-namurti and Gwynn, 1985). We have decided to include only a small lexicon in our realization engine. Currently, it contains the words required for the evaluation described in section 4. This is because host NLG systems that use our engine could use their own application specific lexicons. More over modern Telugu has been absorbing large amounts of English vocabulary particularly in the fields of science and technology whose morphology is unknown. Thus specialized lexi-cons could be required to model the morphologi-cal behavior of such vocabulary. In the rest of this section we present the design of our Telugu real-izer. As stated in section 2.1, a critical step in building a realization engine for a new language is to re-view its grammatical knowledge to understand
2

the linguistic means offered by the language to express meaning. We reviewed Telugu grammar as presented in our chosen grammar reference by Krishnamurti and Gwynn (1985). From a realizer design perspective the following observations proved useful:
1. Primary meaning in Telugu sentences is main-ly expressed using inflected forms of content words and case markers or postpositions than by position of words/phrases in the sentence. This means morpho-phonology plays bigger role in sentence creation than syntax.
2. Because sentence constituents in Telugu can be ordered freely without impacting the pri-mary meaning of a sentence, sophisticated grammar knowledge is not required to order sentence level constituents. It is possible, for instance, to order constituents of a declarative sentence using a standard predefined se-quence (e.g. Subject + Object + Verb).
3. Telugu, like many other Indian languages, is not governed by a phrase structure grammar, instead fits better into a Paninian Grammar Formalism (Bharati et al., 1995) which uses dependency grammar. This means, depend-ency trees represent the structure of phrases and sentences. At the sentence level verb phrase is the head and all the other constitu-ents have a dependency link to the head. At the phrase level too, head-modifier depend-ency structures are a better fit.
4. Agreement amongst sentence constituents can get quite complicated in Telugu. Several grammatical and semantic features are used to define agreement rules. Well-formed Telu-gu sentences are the result of applying agreement rules at the sentence level on sen-tence constituents constructed at the lower level processes.
Based on the above observations we found that the SimpleNLG framework with its features listed in section 2.1 is a good fit for guiding the design of our Telugu realization engine. Thus our reali-zation engine is designed with a wide coverage morphology module and a light-weight syntax module where features play a major role in per-forming sentence construction operations.
Having decided the SimpleNLG framework for representing and operationalizing the grammati-cal knowledge, the following design decisions
were made while building our Telugu realizer (we believe that these decisions might drive de-sign of realizers for any other Indian Language as well):
1. Use wx-notation for representing Indian lan-guage orthography (see section 3.1 for more details)
2. Define the tag names and the feature names used in the input XML file (example shown in Figure 1) adapted from SimpleNLG and (Krishnamurti and Gwynn, 1985) for specify-ing input to the realization engine. It is hoped that using English terminology for specifying input to our Telugu realizer simplifies creat-ing input by application developers who usu-ally know English well and possess at least a basic knowledge of English grammar. (see section 3.2 for more details)
3. In order to offer flexibility to application de-velopers our realization engine orders sen-tence level constituents (except verb which is always placed at the end) using the same or-der in which they are specified in the input XML file. This allows application developers to control ordering based on discourse level requirements such as focus.
4. The grammar terminology used in our engine does not directly correspond to the Karaka re-lations (Bharati et al., 1995) from the Panin-ian framework because we use the grammar terminology specified by Krishnamurti and Gwynn (1985) which is lot closer to the ter-minology used in SimpleNLG. We are cur-rently investigating opportunities to align our design lot closer to the Paninian framework. We expect such approach to help us while ex-tending our framework to generate other In-dian languages as well.
3.1 WX-Notation
WX notation (See appendix B in Bharati et al, 1995) is a very popular transliteration scheme for representing Indian languages in the ASCII char-acter set. This scheme is widely used in Natural Language Processing in India. In WX notation the small case letters are used for un-aspirated consonants and short vowels while the capital case letters are used for aspirated consonants and long vowels. The retroflexed voiced and voice-less consonants are mapped to ‘t, T, d and D’. The dentals are mapped to ‘w, W, x and X’. Hence the name of the scheme “WX”, referring to the idiosyncratic mapping.
3

3.2 The Input Specification Scheme
The input to the current work is a tree structure specified in XML, an example is shown in Figure 1. The root node is the sentence and the nodes at the next level are the constituent phrases that have a role feature representing the grammatical functions such as subject, verb and complement performed by the phrase. Each of the lower level nodes could in turn have their own head and modifier children. Each node also can take attrib-utes which represent grammatical or lexical fea-tures such as number and tense. For example the subject node in Figure 1 can be understood as follows:
<nounphrase role=”subject”> <head pos=”pronoun”gender=”human”number=”plural”person=”third”casemarker=” ” stem=”basic”> vAdu</head> </nounphrase> This node represents the noun phrase that plays the role of subject in the sentence. There is only one feature, the head to the subject node whose type is nominative. The lexical features of the head “vAdu” are part-of-speech (pos) which is pronoun, person which is third person, number which is plural, gender which is human, and case marker which is null.
3.3 System Architecture
The sentence construction for Telugu involves the following three steps:
1. Construct word forms by applying morpho-phonological rules selected based on features associated with a word (word level morphol-ogy)
2. Combine word forms to construct phrases us-ing ‘sandhi’ (a morpho-phonological fusion operation) if required (phrase building)
3. Apply sentence level agreement by applying agreement rules selected based on relevant features. Order sentence constituents follow-ing a standard predefined sequence. (sentence building)
Our system architecture is shown in Figure 2 which involves morphology engine, phrase build-er and sentence builder corresponding to these three steps. The rest of the section presents how
the example sentence (1) is generated from the input specification in Figure 1.
Figure 2. System Architecture
3.4 Input Reader
The Input Reader is the module which acts as an interface between the sentence builder and the input. Currently the input reader accepts only our XML input specification but in the future we would like to extend it to accept other input spec-ifications such as SSF (Bharati et al., 2007). This module ensures that the rest of the engine re-ceives input in the required form.
3.5 Sentence Builder
The Sentence Builder is the main module of the current system which has a centralized control over all the other modules. It performs four sub-tasks:
1. Sentence Builder first checks for predefined grammatical functions such as subject, object, complement, and verb which are defined as features of the respective phrases in the input. It then calls the appropriate element builder for each of these to create element objects which store all the information extracted from the XML node.
2. These element objects are then passed to ap-propriate phrase builder to receive back a string which is the phrase that is being con-structed according to the requirements of the input.
3. After receiving all the phrases from the appro-priate phrase builders the Sentence Builder applies the agreement rules. Since Telugu is nominative-accusative language the verb agrees with the argument in the nominative case. Therefore the predicate inflects based on the gender, person and number of the noun in the nominative case. There are three features at the sentence level namely type, predicate-type, and respect. The feature type refers to the type of the sentence. The current work handles only simple sentences therefore
4

it is not set to any value. The feature predi-cate-type can have any one of the three val-ues namely verbal, nominative, and abstract. The feature respect can have values yes or no. The agreement also depends on the features predicate-type, and respect.
4. Finally, the sentence builder orders the phrases in the same order they are specified in the input.
In the case of the example in Figure 1 the sen-tence builder finds three grammatical functions - one finite verb, one locative complement, and one nominative subject. In the example input (1) the values for the feature predicate-type is “verbal” and for respect is “no”. The Sentence Builder retrieves appropriate rule from an externally stored agreement rule base. In the example input (1) where predicate-type is set to verbal, the number of the subject is plural and the gender is human the Sentence Builder retrieves the appro-priate suffix “nnAru”. This suffix is then agglu-tinated to the verb “naduswu” which is returned by the morphology engine to generate the final verb form, “naduswunnAru” with the required agreement with subject.
“naduswu”+ “nnAru”---- “naduswunnAru”
After the construction of the sentence the Sen-tence Builder passes it to the Output Generator which prints the output.
3.6 Element Builder
The element builder of each grammatical function checks for lower level functions like head and modifier and calls the appropriate element builder for the head and modifier which converts the lex-icalized input into element objects with the grammatical constituents as their instance varia-bles and returns the element objects back to the Sentence Builder. Our realizer creates four types of element objects namely SOCElement, VAEl-ement, AdjectiveElement, and AdverbElement. The SOCElement represents the grammatical functions subject, object and complement. The subject in the example of (1) is “vAdu” for which a SOCElement is created with the speci-fied features. Similarly a SOCElement is created for the complement “wota” and its modifier “aMxamu” which is an AdjectiveElement. Final-ly a VAElement is created for the verb “na-ducu” and the modifier “neVmmaxi” which is an AdverbElement.
3.7 Phrase Builder
Telugu sentences express most of the primary meaning in terms of morphologically well-formed phrases or word groups. In Telugu the main and auxiliary verbs occur together as a sin-gle word. Therefore their generation is done by the morphology engine. Telugu sentences are mainly made up of four types of phrases - Noun Phrase, Verb Phrase, Adjective Phrase, and Ad-verb Phrase. Noun phrases and verb phrases are the main constituents in a sentence while the Ad-jective Phrase and the Adverb Phrase only play the role of a modifier in a noun or verb phrase. There is one feature at the Noun Phrase level “role” which specifies the role of the Noun Phrase in the sentence. The phrase builder passes the elements constructed by the element builder to the morphology engine and gets back the re-spective phrases with appropriately inflected words. In the example input in (1), there are three constituent phrases, viz, two noun phrases for subject and complement and a verb phrase. One of the noun phrases also contains an adjective phrase which is an optional modifying element of noun heads in head-modifier noun phrases. The adjective phrase may be a single element or sometimes composed of more than one element. The verb phrase also contains an adverb phrase which is generally considered as a modifier of the verb. The phrase builder passes five objects i.e., two SOCElement objects, one AdjectiveElement object, one VAElement object, and one Adver-bElement object to the morphology engine and gets back five inflected words which finally be-come three phrases, viz, two noun phrases “vAlYlYu”, “aMxamEna wotalo”, and one verb phrase “neVmmaxigA naduswu”.
3.8 Morphology Engine
The morphology engine is the most important module in the Telugu realization engine. It is re-sponsible for the inflection and agglutination of the words and phrases. The morphology engine behaves differently for different words based on their part of speech (pos). The morphology en-gine takes the element object as the input, and returns to the phrase builder the inflected or ag-glutinated word forms based on the rules of the language. In the current work morphology engine is a rule based engine with the lexicon to account for exceptions to the rules. The rules used by the morphology engine are stored in external files to allow changes to be made externally.
5
3.8.1 Noun
Noun is the head of the noun phrase. Telugu nouns are divided into three classes namely (i) proper nouns and common nouns, (ii) pronouns, and (iii) special types of nouns (e.g. numerals) (Krishnamurti and Gwynn, 1985). All nouns ex-cept few special type nouns have gender, number, and person. Noun morphology involves mainly plural formation and case inflection. All the plu-ral formation rules from sections 6.11 to 6.13 of our grammar reference have been implemented in our engine.
The head of the complement in the example (1) has one noun “wotalo”. The word “wota” along with its feature values can be written as follows:
“wota”, noun, nonmasculine, sin-gular, third, basic, “lo”--- wotalo
The formation of this word is very simple be-cause the word “wota” in its singular form and the case marker “lo” get agglutinated through a sandhi (a morpho-phonological fusion operation) formation as follows:
‘wota’+lo----- wotalo
3.8.2 Pronoun
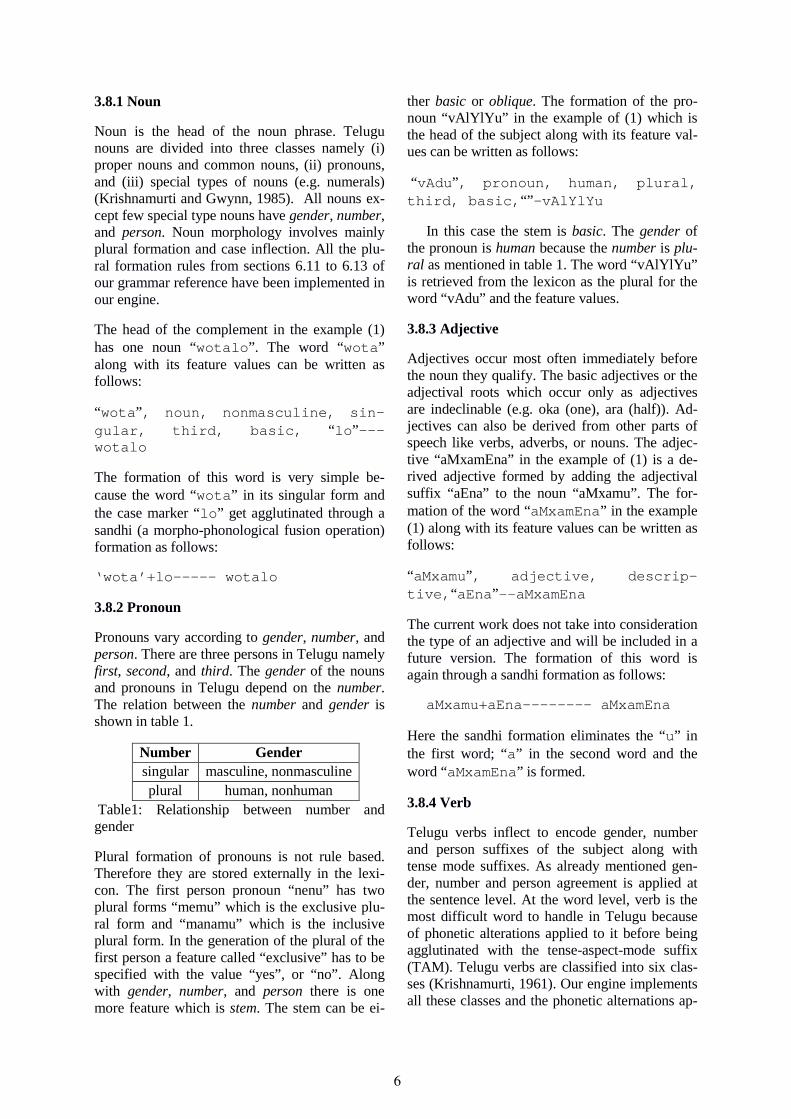
Pronouns vary according to gender, number, and person. There are three persons in Telugu namely first, second, and third. The gender of the nouns and pronouns in Telugu depend on the number. The relation between the number and gender is shown in table 1.
Number Gender singular masculine, nonmasculine plural human, nonhuman
Table1: Relationship between number and gender
Plural formation of pronouns is not rule based. Therefore they are stored externally in the lexi-con. The first person pronoun “nenu” has two plural forms “memu” which is the exclusive plu-ral form and “manamu” which is the inclusive plural form. In the generation of the plural of the first person a feature called “exclusive” has to be specified with the value “yes”, or “no”. Along with gender, number, and person there is one more feature which is stem. The stem can be ei-
ther basic or oblique. The formation of the pro-noun “vAlYlYu” in the example of (1) which is the head of the subject along with its feature val-ues can be written as follows:
“vAdu”, pronoun, human, plural, third, basic,“”-vAlYlYu
In this case the stem is basic. The gender of the pronoun is human because the number is plu-ral as mentioned in table 1. The word “vAlYlYu” is retrieved from the lexicon as the plural for the word “vAdu” and the feature values.
3.8.3 Adjective
Adjectives occur most often immediately before the noun they qualify. The basic adjectives or the adjectival roots which occur only as adjectives are indeclinable (e.g. oka (one), ara (half)). Ad-jectives can also be derived from other parts of speech like verbs, adverbs, or nouns. The adjec-tive “aMxamEna” in the example of (1) is a de-rived adjective formed by adding the adjectival suffix “aEna” to the noun “aMxamu”. The for-mation of the word “aMxamEna” in the example (1) along with its feature values can be written as follows:
“aMxamu”, adjective, descrip-tive,“aEna”--aMxamEna
The current work does not take into consideration the type of an adjective and will be included in a future version. The formation of this word is again through a sandhi formation as follows:
aMxamu+aEna-------- aMxamEna
Here the sandhi formation eliminates the “u” in the first word; “a” in the second word and the word “aMxamEna” is formed.
3.8.4 Verb
Telugu verbs inflect to encode gender, number and person suffixes of the subject along with tense mode suffixes. As already mentioned gen-der, number and person agreement is applied at the sentence level. At the word level, verb is the most difficult word to handle in Telugu because of phonetic alterations applied to it before being agglutinated with the tense-aspect-mode suffix (TAM). Telugu verbs are classified into six clas-ses (Krishnamurti, 1961). Our engine implements all these classes and the phonetic alternations ap-
6
plicable to each of these classes are stored exter-nally in a file.
The verb in the example of Figure 1 has one verb “naducu” along with its feature values. The formation of the verb “naduswu” can be written as follows:
“naducu”,verb, present partici-ple------naduswu
The word “naducu” belongs to class IIa, for which the phonetic alteration is to substitute “cu” with “s”, and therefore the word gets inflected as follows:
naducu----------------nadus
The tense mode suffix for present participle is “wu”, and the word becomes “naduswu”. The gender and number of the subject also play a role in the formation of the verb which is discussed in section 3.5.
3.8.5 Adverb
All adverbs fall into three semantic domains, those denoting time, place and manner (Krishna-murti and Gwynn 1985). The adverb “neVmmaxigA” in the example (1) is a manner adverb as it tells about the way they are walking “neVmmaxigA naduswunnaru (walking slowly)”. In Telugu manner adverbs are generally formed by adding “gA” to adjectives and nouns. The formation of the adverb “neVmmaxigA” in the example (1) along with its feature values can be written as follows:
“neVmmaxi”, adverb,“gA”--------------neVmmaxigA
The formation of this word is a simple sandhi formation.
3.9 Output Generator
Output Generator is the module which actually generates text in Telugu font. The Output genera-tor receives the constructed sentence in WX-notation and gives as output a sentence in Telugu based on the Unicode Characters for Telugu.
4 Evaluation
The current work addresses the problem of gen-erating syntactically and morphologically well-formed sentences in Telugu from an input speci-
fication consisting of lexicalized grammatical constituents and associated features. In order to test the robustness of the realization engine as the input to the realizer changes we initially ran the engine in a batch mode to generate all possible sentence variations given an input similar to the one shown in Figure 1. In the batch mode the en-gine uses the same input root words in a single run of the engine, but uses different combinations of values for the grammatical features such as tense, aspect, mode, number and gender in each new run. Although the batch run was originally intended for software quality testing before con-ducting evaluation studies, these tests showed that certain grammatical feature combinations might make the realization engine produce unac-ceptable output. This is an expected outcome be-cause our engine in the current state performs very limited consistency checks on the input.
The purpose of our evaluation is to measure our realizer’s coverage of the Telugu language. One objective measure could be to measure the pro-portion of sentences from a specific text source (such as a Telugu newspaper) that our realizer could generate. As a first step towards such an objective evaluation, we first evaluate our realizer using example sentences from our grammar ref-erence. Although not ideal this evaluation helps us to measure our progress and prepares us for the objective evaluation. The individual chapters and sections in the book by Krishnamurti and Gwynn (1985) follow a standard structure where every new concept of grammar is introduced with the help of a list of example sentences that illustrate the usage of that particular concept. We used these sentences for our evaluation. Please note that we collect sentences from all chapters. This means our realizer is required to generate for example verb forms used in example sen-tences from other chapters in addition to those from the chapter on verbs. A total of 738 sen-tences were collected from chapter 6 to chapter 26, the main chapters which cover Telugu grammar. Because the coverage of the current system is limited, we don’t expect the system to generate all these 738 sentences. Among these, 419/738 (57%) sentences were found to be with-in the scope of our current realizer. Many of these sentences are simple and short. For each of the 419 selected sentences our realizer was run to generate the 419 output sentences. The output sentences matched the original sentences from the book completely. This means at this stage we can quantify the coverage of our realizer as 57%
7

(419/738) against our own grammar source. A more objective measure of coverage will be es-timated in the future.
Having built the functionality for the main sen-tence construction tasks, we are now in a good position to widen the coverage. Majority of the remaining 319 sentences (=738-419) involve verb forms such as participles and compound verbs and medium to complex sentence types. As stated above, we intend to use this evaluation to drive our development. This means every time we extend the coverage of the realizer we will rerun the evaluation to quantify the extended coverage of our realizer. The idea is not to achieve 100% coverage. Our strategy has always been to select each new sentence or phrase type to be included in the realizer based on its utility to express meanings in some of the popular NLG application domains such as medicine, weather, sports and finance.
5 Conclusion
In this paper, we described a surface realizer for Telugu which was designed by adapting the SimpleNLG framework for free word order lan-guages. We intend to extend the current work further as stated below: 1. Extend the coverage of our realizer and
perform another evaluation to characterize the coverage of the realizer more objectively.
2. Create a generalized framework for free word order language generation (specifically for Indian languages). The existing frame-work could be used to generate simple sen-tences from other Indian languages by plug-ging in the required morphology engine for the new language.
Reference Albert Gatt and Ehud Reiter “SimpleNLG: A realiza-
tion engine for practical applications”, Proceed-ings of ENLG 2009, pages 90-93, 2009.
AksharaBharati, Vineet Chaitanya, Rajeev Sangal “Natural Language Processing A Paninian Per-spective” Prentice-Hall of India, New Delhi, 1995.
Akshara Bharati, Rajeev Sangal, Dipti M Sharma “SSF: Shakti Standard Format Guide” LTRC, IIIT, Hyderabad, Report No: TR-LTRC-33, 2007.
Benoit Lavoie and Owen Rambow “A Fast and Port-able Realizer for Text Generation Systems” Pro-ceedings of the Fifth Conference on Applied Natu-
ral Language Processing (ANLP97), Washington, 1997.
BH. Krishnamurti and J P L Gwynn, “A Grammar of Modern Telugu” Oxford University Press, 1985.
BH. Krishnamurti “Telugu Verbal Bases a compara-tive and Descriptive Study” University of Califor-nia Press Berkley & Los Angeles, 1961.
Brown, C.P., “The Grammar of the Telugu Lan-guage”. New Delhi: Laurier Books Ltd, 1991.
Elhadad M. & Robin J. (1996). “A reusable compre-hensive syntactic realization component”. Paper presented at Demonstrations and Posters of the 1996 International Workshop on Natural Language Generation (INLG '96), Herstmonceux, England.
Ethel Ong, Stephanie Abella, Lawrence Santos, and Dennis Tiu “A Simple Surface Realizer for Filipino ” 25th Pacific Asia Conference on Language, In-formation and Computation, pages 51–59, 2011.
HabashN. (2000). OxyGen: “A Language Independ-ent Linearization”Engine. Paper presented at AM-TA. London: Ablex. Available as USC/ISI Re-search Report RR-83-105.
Knight K. and V. Hatzivassiloglou. NITROGEN: “Two-Level, Many-Paths Generation”. Proceed-ings of the ACL-95 conference. Cambridge, MA 1995.
MadhaviGanapathiraju and Lori Levin “TelMore: Morphological Generator for Telugu Nouns and Verbs”, 2006.
Mann, W.C. and C.M.I.M. Matthiessen. Nigel: “A Systemic Grammar for Text Generation”. In R. Benson and J. Greaves (eds), Systemic perspec-tives on Discourse: Proceedings of 9th Internation-al Systemics workshop 1985.
Marcel Bollmann, “Adapting SimpleNLG to German” Proceedings of the 13th European Workshop on Natural Language Generation (ENLG), pages 133–138, Nancy, France, September 2011.
Pierre-Luc Vaudry and Guy Lapalme “Adapting Sim-pleNLG for bilingual English-French realisation” Proceedings of the 14th European Workshop on Natural Language Generation, pages 183–187, Sofia, Bulgaria, August 8-9 2013.
Rodrigo de Oliveira, Somayajulu Sripada “Adapting SimpleNLG for Brazilian Portuguese realisation”, 2014.
Smriti Singh, MrugankDalal, Vishal Vachhani, Push-pak Bhattacharyya, Om P. Damani “Hindi Genera-tion from Interlingua (UNL)” in Proceedings of MT summit, 2007.
Sri BadriNarayanan.R, Saravanan.S, Soman K.P “Da-ta Driven Suffix List and Concatenation Algorithm for Telugu Morphological Generator” International Journal of Engineering Science and Technology (IJEST), 2009.
Uma MaheshwarRao, G. and Christopher Mala “TELUGU WORD SYNTHESIZER” International Telugu Internet Conference Proceedings, Milpitas, California, USA 28th -30th September, 2011.
8
Proceedings of the 15th European Workshop on Natural Language Generation (ENLG), pages 9–17,Brighton, September 2015. c©2015 Association for Computational Linguistics
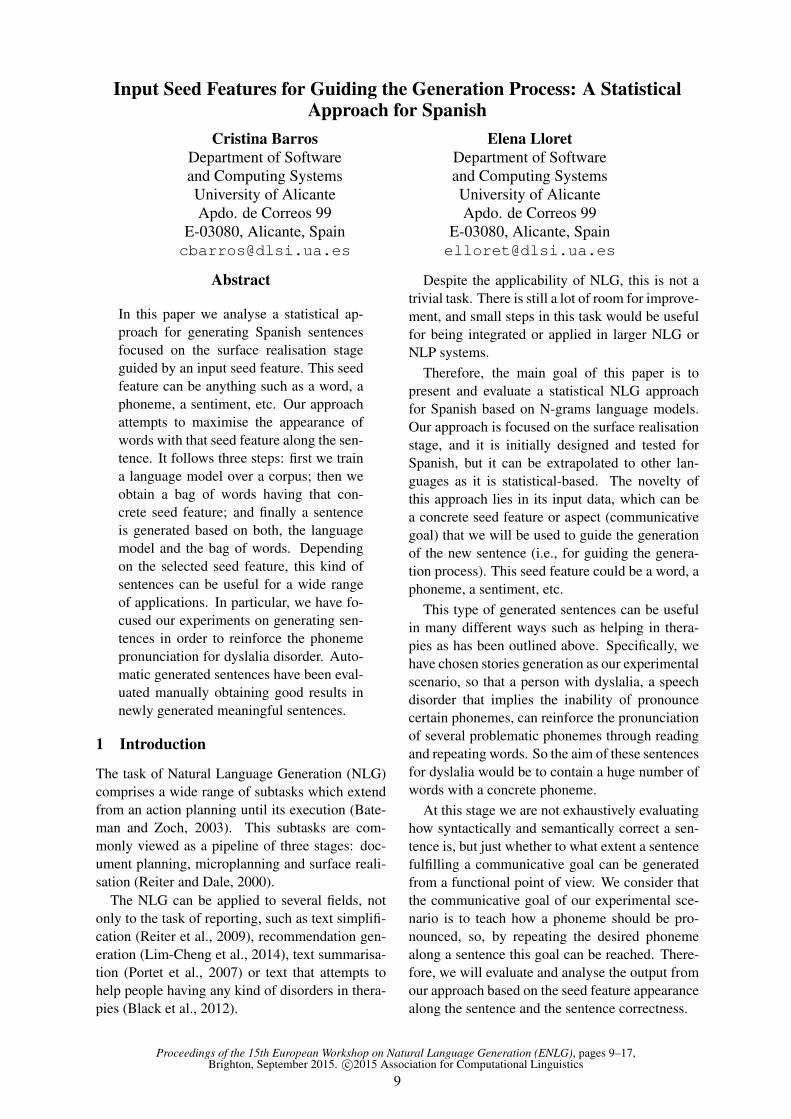
Input Seed Features for Guiding the Generation Process: A StatisticalApproach for Spanish
Cristina BarrosDepartment of Softwareand Computing SystemsUniversity of AlicanteApdo. de Correos 99
E-03080, Alicante, [email protected]
Elena LloretDepartment of Softwareand Computing SystemsUniversity of AlicanteApdo. de Correos 99
E-03080, Alicante, [email protected]
Abstract
In this paper we analyse a statistical ap-proach for generating Spanish sentencesfocused on the surface realisation stageguided by an input seed feature. This seedfeature can be anything such as a word, aphoneme, a sentiment, etc. Our approachattempts to maximise the appearance ofwords with that seed feature along the sen-tence. It follows three steps: first we traina language model over a corpus; then weobtain a bag of words having that con-crete seed feature; and finally a sentenceis generated based on both, the languagemodel and the bag of words. Dependingon the selected seed feature, this kind ofsentences can be useful for a wide rangeof applications. In particular, we have fo-cused our experiments on generating sen-tences in order to reinforce the phonemepronunciation for dyslalia disorder. Auto-matic generated sentences have been eval-uated manually obtaining good results innewly generated meaningful sentences.
1 Introduction
The task of Natural Language Generation (NLG)comprises a wide range of subtasks which extendfrom an action planning until its execution (Bate-man and Zoch, 2003). This subtasks are com-monly viewed as a pipeline of three stages: doc-ument planning, microplanning and surface reali-sation (Reiter and Dale, 2000).
The NLG can be applied to several fields, notonly to the task of reporting, such as text simplifi-cation (Reiter et al., 2009), recommendation gen-eration (Lim-Cheng et al., 2014), text summarisa-tion (Portet et al., 2007) or text that attempts tohelp people having any kind of disorders in thera-pies (Black et al., 2012).
Despite the applicability of NLG, this is not atrivial task. There is still a lot of room for improve-ment, and small steps in this task would be usefulfor being integrated or applied in larger NLG orNLP systems.
Therefore, the main goal of this paper is topresent and evaluate a statistical NLG approachfor Spanish based on N-grams language models.Our approach is focused on the surface realisationstage, and it is initially designed and tested forSpanish, but it can be extrapolated to other lan-guages as it is statistical-based. The novelty ofthis approach lies in its input data, which can bea concrete seed feature or aspect (communicativegoal) that we will be used to guide the generationof the new sentence (i.e., for guiding the genera-tion process). This seed feature could be a word, aphoneme, a sentiment, etc.
This type of generated sentences can be usefulin many different ways such as helping in thera-pies as has been outlined above. Specifically, wehave chosen stories generation as our experimentalscenario, so that a person with dyslalia, a speechdisorder that implies the inability of pronouncecertain phonemes, can reinforce the pronunciationof several problematic phonemes through readingand repeating words. So the aim of these sentencesfor dyslalia would be to contain a huge number ofwords with a concrete phoneme.
At this stage we are not exhaustively evaluatinghow syntactically and semantically correct a sen-tence is, but just whether to what extent a sentencefulfilling a communicative goal can be generatedfrom a functional point of view. We consider thatthe communicative goal of our experimental sce-nario is to teach how a phoneme should be pro-nounced, so, by repeating the desired phonemealong a sentence this goal can be reached. There-fore, we will evaluate and analyse the output fromour approach based on the seed feature appearancealong the sentence and the sentence correctness.
9
The remainder of this paper is as follows. Sec-tion 2 discusses some related work concerned withsurface realisation statistical systems. Section 3presents our statistical approach for NLG based onseed features. Section 4 shows the experimenta-tion carried out over the approach. In Section 5 theevaluation and the results obtained is discussed.Section 6 presents the potentials and limitations ofour approach. Finally, section 7 draws some con-clusions and outlines ideas for future work.
2 Related Work
The use of statistical techniques in NLG have beenwidely spread since Langkilde and Knight (1998)used them for the first time, where they used lan-guage models (LM) to choose words transforma-tions after applying generation rules. Most ofthese techniques use language models, such asn-grams, or stochastic grammars. An exampleof these statistical techniques are given in (Kon-dadadi et al., 2013) that presents a statistical NLGsystem which consolidates macro and micro plan-ning, as well as surface realisation stages intoone statistical learning process. Moreover, manyother statistical examples can be found in (Lemon,2008), where a new model for adaptive NLG indialog, showing how NLG problems can be ap-proached as statistical planning problems using re-inforcement learning, is presented. In the BAGELsystem (Mairesse et al., 2010), a statistical lan-guage generator which uses dynamic Bayesiannetworks to learn from semantically-aligned datais integrated.
These statistical LM have been employed withseveral languages including Chinese, English,German and Spanish (Bohnet et al., 2010), wherethey take advantage of multilevel annotated cor-pora and propose a multilingual deep stochasticsentence realiser.
On the other hand, regarding to the applicationof NLG in order to help people having any typeof problem or disorder there are several systems.For instance, STOP (Reiter et al., 2003) that gen-erates letters to dissuade users from smoking, orsystems to reduce anxiety of patients with cancerby providing them with information (Cawsey etal., 2000). These two systems employ templatesthat are filled with information from a data base ora knowledge base selected from user profiles.
There are approaches, such as the one in(Fernandez et al., 2008) that generates sentences
in Spanish containing words related to a specificrestricted scenario, but, to the best of our knowl-edge, there is not a research in NLG focused ongenerating sentences in Spanish with the restric-tion of containing words with a specific seed fea-ture. Moreover, since we use probabilistic tech-niques, these are language independent allowingits application to others languages adapting thenecessary resources (e.g., semantic features) forthe language-specific part.
3 Our Seed Feature Guided LanguageGeneration Process
We propose a statistical approach using n-gramLM guided by an input seed feature. This ap-proach is focused on generating a sentence withthe highest number of words containing a certainseed feature. This seed feature, used to guide allthe generation process, can be anything, such asletters, phonemes, POS tag, sentiments, etc.
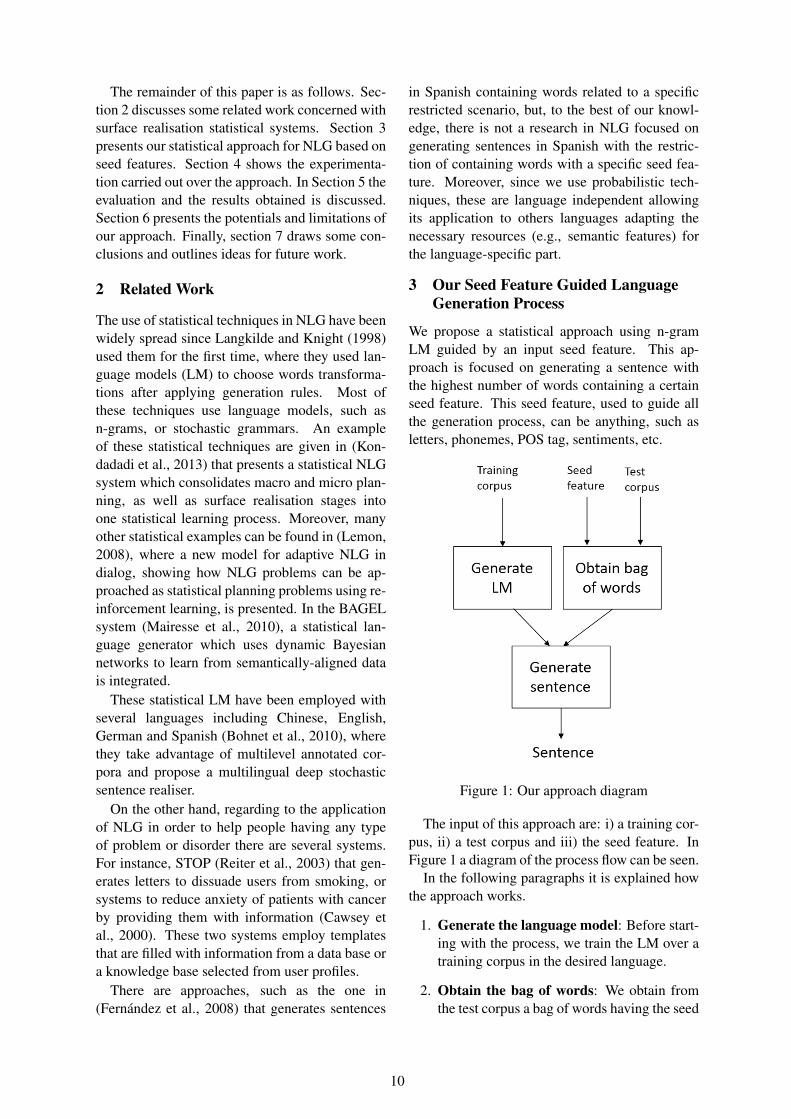
Figure 1: Our approach diagram
The input of this approach are: i) a training cor-pus, ii) a test corpus and iii) the seed feature. InFigure 1 a diagram of the process flow can be seen.
In the following paragraphs it is explained howthe approach works.
1. Generate the language model: Before start-ing with the process, we train the LM over atraining corpus in the desired language.
2. Obtain the bag of words: We obtain fromthe test corpus a bag of words having the seed
10

feature which is going to be used for the gen-eration. This bag of words includes the worditself and its frequency of occurrence in thetest corpus.
3. Generate the sentence:
This step of the process can be executedwith two different configurations. The de-fault configuration only generates one sen-tence based on the seed feature; and, withthe overgeneration configuration, the systemgenerates several sentences based on the seedfeature. Next, we will explain the overallfunctioning of the process.The approach is an iterative process in whichthis stage is repeated until either the desiredlength, or the special token end of sentence(</s>) are reached.Assuming that there is a word that has beenobtained from the previous iteration, we firstsearch in the bag of words if there is a wordin it that follows the word from the previousiteration. If so, we check which one has thehighest probability based on the LM depend-ing on that word, and in case of a draw be-tween two or more words, then the word cho-sen is the one with a higher frequency in thetest corpus.Otherwise, we look for the word which hasthe highest probability of appearance withthe word selected from the previous iterationin our LM, and if there are more than oneword in our LM with the same probability,we check if any of them contains the seedfeature. In that case, we pick the word withthe seed feature; in another case, we choosethe first appearance of the word with high-est probability. As we said before, the pro-cess runs, prioritising the selection of wordscontaining the seed feature, until the desiredlength or the token (</s>) are reached.We took several issues into consideration dur-ing the implementation of our approach. Forthe first iteration, we initially set the spe-cial token start of the sentence (<s>) as ourstarting word. Moreover, when we choosethe words it is taken into account that, ifthe chosen word is a stopword, then the pro-cess returns the stopword accompanied withthe most probable next word. Another issuetaken into account is that a stopword is notselected as the next word on the last iteration,
to prevent sentences ending inappropriately.Finally, a word cannot be chosen if it hasbeen chosen before. This is to avoid words orword’s sequences repetitions along the sen-tence.The main difference between our two config-urations lies on the first iteration of the gener-ation process. With the default configuration,we only choose one initial word, so a singlesentence is generated. With the overgenera-tion configuration, for an input seed feature,a list of words is chosen. This list containsthe words that i) have the same probabilityas the one with the highest probability of ap-pearance with the token (<s>), and ii) arewithin a range of less than a 0.5% of proba-bility with respect to the words with the high-est probability of appearance with the token(<s>) (this was empirically determined). Inthe remainder iterations, for each word con-tained in the list, the process runs likewise thedefault configuration.
4 Experimental setup
In this section we are going to discuss both thescenario, resources and tests performed to the ap-proach.
4.1 Scenario
We place our research in the context of generat-ing text to help people with a any kind of disor-der. In particular, generating stories in order tohelp children with dyslalia could be one of theapplications encapsulated within this applicationarea (Barros and LLoret, 2015). Dyslalia is a dis-order in phoneme articulation which implies theinability to correctly pronounce certain phonemesor groups of phonemes (in Spanish some of thisphonemes are: /ch/, /ll/, /rr/ or in English are:/zh/, /ng/, /j/). This disorder is estimated to havea 5-10% incidence among the child population(Conde-Guzon et al., 2014).
Consequently, and based on the dyslalia disor-der, the seed feature selected in order to generatethe sentences is a problematic phoneme. There-fore, our main objective is to generate Spanishsentences containing a large number of words witha concrete phoneme, so that a child with dys-lalia can reinforce the phoneme’s pronunciationthrough reading and repeating words. In Figure 2an illustrative example in Spanish for the phoneme
11

/a/ obtained from a real story1, being part of aneducational project of the Spanish Government,can be seen. This type of sentences can be use-ful for dyslalia disorder because they reinforce thephoneme pronunciation of the child by constantlyrepeating that concrete phoneme.
Figure 2: Illustrative example sentence. (Trans-lation: Everyone was so happy after dinner thatbegan to sing.)
4.2 Corpus and ResourcesSince, as seen in the previous section, the scenarioproposed is focused on generating stories whichwould improve the pronunciation of phonemes inchildren with dyslalia, the chosen corpus selectedto perform the test is a collection of Hans ChristianAndersen2 stories in Spanish.
This collection consists of 158 children’s stories(containing 21,085 sentences in total) of which25% has been used as the test corpus from wherethe bag of words is obtained. For training the LMwe have used the 75% of the corpus, in our case,we have trained a bigram LM and a trigram LM,being these models the most commonly used in
1http://redined.mecd.gob.es/xmlui/bitstream/handle/11162/30643/00920082002857.pdf?sequence=1
2http://www.ciudadseva.com/textos/cuentos/euro/andersen/hca.htm
n-gram language model (Rosenfeld, 2000). If wehad chosen any higher n, we will have to confrontwith data sparseness problems, where most possi-ble grammatical n-grams would never appear evenin huge training corpora.
These LMs have been trained using the SRILM(Stolcke, 2002) software that is a toolkit for build-ing and applying statistical language models. Wehave chosen this software for its usability andbecause factored languages models (Bilmes andKirchhoff, 2003) are implemented in it, and, in thefuture, we want to introduce them to the approach.
Obtaining words containing a concretephoneme was performed according to the cor-respondence between phonemes and letters,employing some of the phonetic restrictionsexposed in Morales (1992).
Furthermore, the stopword’s file used in the ex-perimentation has been obtained from the NLTKsoftware data3.
4.3 Experiments
We have performed several experiments dividingthem in two groups that will be explained in moredetail in the following paragraphs:
• Preliminary experiments
• Overgeneration experiments
To determine the length of the sentences to begenerated, the average sentence length of the cor-pus was computed (16 words), using also thisvalue for our experiments.
4.3.1 Preliminary experiments.This type of experiments were conducted inorder to check if it was worthy to carry onwith this statistical-based approach, employing bi-grams and trigrams LM, and to what extent the ap-proach’s behavior could be affected by the inclu-sion (or not) of stopwords. In addition, these ex-periments were carried out with the default config-uration of the approach and testing all the Spanishphonemes. In this sense, we performed three typesof experiments:
• First experiment: we removed the stopwordsfrom the generation approach but we did notremove them from the training corpus.
3http://www.nltk.org/nltk_data/4English translation is shown in brackets.
12

Figure 3: Preliminary experiments output4
• Second experiment: we trained both LMswithout stopwords, and consequently thegeneration was made without stopwords.
• Third experiment: we trained both LMs withstopwords and we also removed the wordsrepetitions on the final sentence. Further-more, the stopwords were included in the fi-nal sentence.
4.3.2 Overgeneration experiments.This experiment was performed after checking theresults from the preliminary experiments. Themain objective of this experiment was to test theovergeneration configuration of the approach withall the Spanish phonemes, and, check if it gen-erates some meaningful sentences, as well as themost common types of errors.
5 Evaluation and Discussion
In this section we report the results from our twotypes of experiments: preliminary and overgener-ation experiments. Furthermore, for the resultinggenerated sentences we made a manual analysisand evaluation. With this evaluation we needed tocheck if there was any meaningful sentence, ensur-ing that the sentence contained at least one wordwith the concrete phoneme.
5.1 Preliminary experiments evaluation.
As previously explained in section 4.3.1, withinthese preliminary experiments we performed threetypes of tests regarding the approach behavior and
the utilisation or not of stopwords. Some sen-tences obtained from this test can be seen in theFigure 3.
Concerning our first experiment, in many casesthe approach did not find the next word and thegeneration ended before reaching the limit lengthof the sentence using both LMs, bigram and tri-gram. This was due to the fact that there are verbsor words that only appears next to stopwords. Wealso tested in this experiment that, when a stop-word was found, the next function word returnedthe stopword accompanied with its next word, butthe stopword was not included in the final sentenceand it was only used for the next word prediction.Yet still, most generated sentence were meaning-less and presented quite a lot repetition.
As a result of our second experiment, the gen-erated sentences tend to be a sequence of nouns,verbs and adjectives without any relation betweenthem.
Finally, in our third experiment we observedthat the generated sentences with trigrams endedwith the special token end of sentence (</s>),containing at least one word with the phoneme,and some of them where meaningful sentences.Regarding the bigrams generated ones, most ofthem contained a huge number of words with thephoneme but the words itself did not have any con-nection with each other.
Thanks to these results we found that our ap-proach worked well in some cases and because ofthat we decided to try the overgeneration configu-ration of the approach.
13

Sentences
Local per-centage(based on 95sent.)
Global per-centage (basedon 208 sent.)
Generated sent. from bigram LM with (</s>) 46.32% 21.15%Generated sent. from trigram LM with (</s>) 78.95% 36.06%Newly generated not included in the corpus 73.68% 33.65%Meaningful total sentences 56.84% 25.96%
Meaningful sentences included in the corpus 25.26% 11.54%Newly meaningful generated sent. not included in the corpus 31.58% 14.42%
Newly meaningful generated sent. from bigram LM 9.47% 4.33%Newly meaningful generated sent. from trigram LM 22.11% 10.10%
Table 2: Statistics of the generated sentences ended with (</s>)
5.2 Overgeneration experiments evaluation.Based on the results of the preliminary experi-ments, we further test the overgeneration config-uration (section 4.3.2).
In this case, the approach generated 208 sen-tences, which 119 of them contains the special to-ken end of sentence (</s>). All these sentenceswere generated from the bigram and trigram LMs,so it can occur that the same sentence could begenerated by both LMs. These sentences endedwith the token (</s>) are important because theycan be comparable to a complete sentence. Ofthe 119 sentences generated containing the token(</s>), 95 of them are different. This can be seenon Table 1.
Sentences
Numberof gen-eratedsen-tences
Percentage
Total 208 100%Not ended with(</s>)
89 42.79%
Ended with (</s>) 119 57.21%Ended with (</s>)without repetition
95 45.67%
Table 1: Statistics of the generated sentences fromthe overgeneration configuration
We then focused the evaluation and analysis ofour results on the sentences ending with the to-ken (</s>). This is because we consider thesesentences as complete sentences being this tokencomparable to a full stop. The statistics of Table2 were calculated according to the total number of
different generated sentences ended with the to-ken (</s>), 95 sentences. In this Table we alsoinclude the comparative percentage regarding thetotal number of generated sentences, that is 208sentences. As we can see in this Table, the statis-tics of meaningful sentences are really encourag-ing.
These meaningful sentences do not includepunctuation marks so, although some sentencesat first glance do not seem coherent, with the in-clusion of some punctuation marks they becomemeaningful.
Figure 4: Newly meaningful generated sentences.P: phoneme, L: letters and T: translation in brack-ets
Meaningful sentences cover almost the halfof the different sentences ended with the token(</s>), and those newly sentences that not explic-itly exist on the training corpus are about 30% of
14

Error types Number of sentences Local percentage (95 sent.)
Grammatical concordanceNominal 2 4.88%Verbal 7 17.07%
Non words semantic relations 36 87.80%Missing main verb 7 17.07%Incorrect syntactic order 38 92.68%
Table 3: Common types of generated sentences errors
the 95 different sentences with the token. Theseresult are quite positive considering that we areonly focusing on the appearance of words withthe phoneme within the sentence. Moreover, tri-gram LM is more suitable than bigram LM sinceit generates a higher number of newly meaning-ful sentences. Some of these newly generated sen-tences, that have been created employing differentphonemes, can be seen in the Figure 4.
5.2.1 Error Types and Analysis
After analysing the generated sentences endingwith the special token end of sentence (</s>),they may have some common errors along themeaningless sentences. These errors affects thecoherence and cohesion of the sentence leading tomake the sentence meaningless.
We manually analysed all the generated sen-tences and classified these errors attending to fre-quent grammatical errors5 and frequent draftingerrors6. In this classification we do not take intoaccount punctuation marks errors because, whenwe train the language models we remove the punc-tuation marks from the corpus and, consequently,when we generate the sentences we do not intro-duce them.
We have found morphosyntactic errors of con-cordance. We subdivided concordance into twolevels: nominal and verbal. Errors in nominalconcordance refers to errors regarding with genderand number of the words, and, on the other hand,errors in verbal concordance refers to discordancebetween verb and subject in number. We alsofound errors regarding semantics relation betweenwords, that is, the meaning of the words are un-related to each other. Furthermore, we also foundsentences not having a main verb conjugated. The
5https://ciervalengua.files.wordpress.com/2011/11/errores-gramaticales-frecuentes.pdf
6http://blog.pucp.edu.pe/blog/blogderedaccion/2013/04/18/errores-m-s-comunes-en-la-redacci-n/
most common error was found in the order of thewords, having an incorrect order leading to non-sense sequences of words.
Because not all the sentences presents onlyone type of errors, in Table 3 we have countedeach type of error independently, for the mean-ingless sentences ended with (</s>) that havethat error. As it can be seen in the table, andit was already noted, the most common errorsamong the sentences are syntactic errors andnon semantic relation between words. We willsee some examples below with its translation inbrackets. For example, a sentence with a missingmain verb conjugated is:
<s>ahora hacer </s>(now do)
An example sentence having only nominalconcordance error is:
<s>aquello era demasiado fina (</s>) (thiswas too thin)
Where aquello and demasiado are masculineand fina is feminine. And finally, an examplesentence with ordering errors, non semantic wordsrelations and verb concordance error:
<s>allı orgullo y aquella belleza brillan enaquellos pajarillos de ello </s>(there pride andbeauty that shine in those birds of it)
These errors can be corrected employinggrammars for generating a sentences with acorrect syntactic order or using some kind ofsemantic information in order to select wordsrelated semantically to one another.
6 Potentials and Limitations of theapproach
Considering this approach as our research startingpoint we have to take into account some key as-
15
pects from where we can improve the approachuntil we can achieve a fully correct generation ofcorrect syntactic and semantically generated sen-tences based on a seed feature.
This approach has a great potential since it is astatistical approach, that means that these type oftechniques are language independent, so we onlyneed to adapt the language-specific approach’s in-put, resulting this adaptation cost not really high.Moreover, an advantage of our approach is thatwe can make a more flexible generation adaptedto different scenarios and applications guided forthe input seed feature, being our surface realisa-tion approach flexible and adaptive.
There is much information to consider in orderto form a correct sentence. On the one hand weneed syntactic information in order to get a correctsyntactic structure of the sentence. This syntacticstructure information can be achieved via gram-mars or trees. We will check existing Spanish re-sources in order to decide if we use one of themor develop our own. For the other hand, we needsemantic information to make the generated sen-tences coherent. There are several linguistic the-ories that refers to discourse coherence such asthe rhetorical structure theory (Mann and Thomp-son, 1988) or the systemic functional linguistic(Matthiessen and Halliday, 1997), that could befurther exploited and integrated in the approach.
7 Conclusions and Future Work
We have presented a statistical NLG approach forSpanish guided by a seed feature. This approachallow us to create sentences containing a largenumber of words with a concrete seed feature. Wealso outlined a possible NLG scenario where thesesentences can be helpful in speech therapies. Forexample, if the selected seed feature is a phoneme,this kind of sentences can be used in order to im-prove phoneme pronunciation.
Furthermore, we have shown that the approachobtains good results generating meaningful sen-tences not contained in the training corpus, takinginto account that we are only focusing on the ap-pearance of words with the concrete seed feature.Although the results obtained are promising, wemust improve them because we do not generatemeaningful sentences in all cases.
In the future, the approach will be modified toinclude both semantic and syntactic information toensure that the generated sentences will be syn-
tactic and semantically correct. We also want totest and subsequently include to the approach fac-tored language models. In this model enunciatedby Bilmes and Kirchhoff (2003) a word is viewedas a vector of factors that can be anything, includ-ing morphological classes, stems, roots, semanticinformation, etc. The main goal of this model isto produce a language model taking into accountthese factors. So, this type of model can serveus as a way of combine different information at aword level with our seed feature-based approach.In addition, once we have consolidated this modelwith our approach, we will test it with an Englishcorpus in order to compare its results with the onesobtained from employing a Spanish corpus.
Finally, we need to investigate diverse ways ofevaluating the generated sentences instead of man-ually evaluate this sentences. This will allow us inthe future to have an homogeneous way of eval-uating the generated sentences from an objectivepoint of view.
Acknowledgments
This research work has been partially fundedby the University of Alicante, Generalitat Va-lenciana, Spanish Government and the EuropeanCommission through the projects, “Explotaciony tratamiento de la informacion disponible enInternet para la anotacion y generacion de tex-tos adaptados al usuario” (GRE13-15), DIIM2.0(PROMETEOII/2014/001), ATTOS (TIN2012-38536-C03-03), “LEGOLANG-UAGE (Tecnicasde Deconstruccion en la Tecnologıas del LenguajeHumano)” (TIN2012-31224), and SAM (FP7-611312), respectively.
ReferencesCristina Barros and Elena LLoret. 2015. Proposal of
a data-to-text natural language generation approachto create stories for dyslalic children. In 1st Interna-tional Workshop on Data-to-text Generation, Edin-burgh.
John Bateman and Michael Zoch. 2003. Natural Lan-guage Generation. Oxford University Press.
Jeff A. Bilmes and Katrin Kirchhoff. 2003. Factoredlanguage models and generalized parallel backoff.In Proceedings of the 2003 Conference of the NorthAmerican Chapter of the Association for Computa-tional Linguistics on Human Language Technology,pages 4–6. Association for Computational Linguis-tics.
16

Rolf Black, Annalu Waller, Ross Turner, and Ehud Re-iter. 2012. Supporting personal narrative for chil-dren with complex communication needs. ACMTrans. Comput.-Hum. Interact., 19(2):15:1–15:35.
Bernd Bohnet, Leo Wanner, Simon Mille, and Ali-cia Burga. 2010. Broad coverage multilingualdeep sentence generation with a stochastic multi-level realizer. In Proceedings of the 23rd Inter-national Conference on Computational Linguistics,pages 98–106. Association for Computational Lin-guistics.
Alison J. Cawsey, Ray B. Jones, and Janne Pearson.2000. The evaluation of a personalised health infor-mation system for patients with cancer. User Mod-eling and User-Adapted Interaction, 10(1):47–72.
Pablo Conde-Guzon, Pilar Quiros-Exposito,Marıa Jesus Conde-Guzon, and Marıa TeresaBartolome-Albistegui. 2014. Perfil neurop-sicologico de ninos con dislalias: alteracionesmnesicas y atencionales. Anales de Psicologıa,30:1105 – 1114.
Carles Fernandez, Xavier Roca, and Jordi Gonzalez.2008. Providing automatic multilingual text gener-ation to artificial cognitive systems. Vigo Interna-tional Journal of Applied Linguistics, 5:37–62.
Ravi Kondadadi, Blake Howald, and Frank Schilder.2013. A statistical nlg framework for aggregatedplanning and realization. pages 1406–1415. The As-sociation for Computer Linguistics.
Irene Langkilde and Kevin Knight. 1998. Gener-ation that exploits corpus-based statistical knowl-edge. In Proceedings of the 36th Annual Meet-ing of the Association for Computational Linguis-tics and 17th International Conference on Compu-tational Linguistics-Volume 1, pages 704–710. As-sociation for Computational Linguistics.
Oliver Lemon. 2008. Adaptive natural language gen-eration in dialogue using reinforcement learning.Proc. SEM-dial, pages 141–148.
Natalie R. Lim-Cheng, Gabriel Isidro G. Fabia, MarcoEmil G. Quebral, and Miguelito T. Yu. 2014. Shed:An online diet counselling system. In DLSU Re-search Congress 2014.
Francois Mairesse, Milica Gasic, Filip Jurcıcek, SimonKeizer, Blaise Thomson, Kai Yu, and Steve Young.2010. Phrase-based statistical language generationusing graphical models and active learning. In Pro-ceedings of the 48th Annual Meeting of the Asso-ciation for Computational Linguistics, pages 1552–1561. Association for Computational Linguistics.
William C. Mann and Sandra A. Thompson. 1988.Rhetorical structure theory: Toward a functional the-ory of text organization. Text - InterdisciplinaryJournal for the Study of Discourse, 8(3):243–281.
C.M.I.M. Matthiessen and M.A.K. Halliday. 1997.Systemic Functional Grammar: A First Step Into theTheory.
Juan Luis Onieva Morales. 1992. Nuevo metodo deortografıa. Coleccion Cervantes. Verbum.
Francois Portet, Ehud Reiter, Jim Hunter, and Somaya-julu Sripada. 2007. Automatic generation of tex-tual summaries from neonatal intensive care data. InArtificial Intelligence in Medicine, pages 227–236.Springer.
Ehud Reiter and Robert Dale. 2000. Building NaturalLanguage Generation Systems. Cambridge Univer-sity Press.
Ehud Reiter, Roma Robertson, and Liesl M Osman.2003. Lessons from a failure: Generating tailoredsmoking cessation letters. Artificial Intelligence,144(1):41–58.
Ehud Reiter, Ross Turner, Norman Alm, Rolf Black,Martin Dempster, and Annalu Waller. 2009. UsingNLG to help language-impaired users tell stories andparticipate in social dialogues. In Proceedings ofthe 12th European Workshop on Natural LanguageGeneration, pages 1–8. Association for Computa-tional Linguistics.
Ronald Rosenfeld. 2000. Two decades of statisticallanguage modeling: Where do we go from here? InProceedings of the IEEE, pages 1270–1278.
Andreas Stolcke. 2002. Srilm - an extensible lan-guage modeling toolkit. In Proceedings Interna-tional Conference on Spoken Language Processing,vol 2., pages 901–904.
17

Proceedings of the 15th European Workshop on Natural Language Generation (ENLG), pages 18–27,Brighton, September 2015. c©2015 Association for Computational Linguistics
A Domain Agnostic Approach to Verbalizing n-ary Events withoutParallel Corpora
Bikash GyawaliUniversite de Lorraine/LORIA
Nancy, Francebikash.gyawali
@loria.fr
Claire GardentCNRS/LORIANancy, France
Christophe CerisaraCNRS/LORIANancy, France
Abstract
We present a method for automati-cally generating descriptions of biologicalevents encoded in the KB BIO 101 Knowl-edge base. We evaluate our approach ona corpus of 336 event descriptions, pro-vide a qualitative and quantitative analysisof the results obtained and discuss possibledirections for further work.
1 Introduction
While earlier work on data-to-text generationheavily relied on handcrafted linguistic resources,more recent data-driven approaches have focusedon learning a generation system from parallel cor-pora of data and text. Thus, (Angeli et al., 2010;Chen and Mooney, 2008; Wong and Mooney,2007; Konstas and Lapata, 2012b; Konstas andLapata, 2012a) trained and developed data-to-textgenerators on datasets from various domains in-cluding the air travel domain (Dahl et al., 1994),weather forecasts (Liang et al., 2009; Belz, 2008)and sportscasting (Chen and Mooney, 2008). Inboth cases, considerable time and expertise mustbe spent on developing the required linguistic re-sources. In the handcrafted, symbolic approach,appropriate grammars and lexicons must be speci-fied while in the parallel corpus based learning ap-proach, an aligned data-text corpus must be builtfor each new domain. Here, we explore an al-ternative approach using non-parallel corpora forsurface realisation from knowledge bases that canbe used for any knowledge base for which thereexists large textual corpora.
A more specific, linguistic issue which has re-ceived relatively little attention is the unsupervisedverbalisation of n-ary relations and the task of ap-propriately mapping KB roles to syntactic func-tions. In recent work on verbalising RDF triples,relations are restricted to binary relations (called
“property” in the RDF language) and the issue istherefore intrinsically simpler. In symbolic ap-proaches dealing with n-ary relations, the map-ping between syntactic and semantic arguments isdetermined by the lexicon and must be manuallyspecified. In data-driven approaches, the mappingis learned from the alignment between text anddata and is restricted by cases seen in the train-ing data. Instead, we learn a probabilistic modeldesigned to select the most probable mapping. Inthis way, we provide a domain independent, fullyautomatic, means of verbalising n-ary relations.
The paper is structured as follows. In Section 2,we discuss related work. In Section 3, we presentthe method used to verbalise KB events and theirparticipants. In Section 4, we evaluate our ap-proach on a corpus of 336 test cases, provide aqualitative and quantitative analysis of the resultsobtained and discuss possible directions for fur-ther work. Section 5 concludes.
2 Related Work
There has been much research in recent years ondeveloping natural language generation systemswhich support verbalisation from knowledge anddata bases.
Many of the existing KB Verbalising tools relyon generating so-called Controlled Natural Lan-guages (CNL) i.e., a language engineered to beread and written almost like a natural language butwhose syntax and lexicon is restricted to preventambiguity. For instance, the OWL verbaliser in-tegrated in the Protege tool is a CNL based gen-eration tool, (Kaljurand and Fuchs, 2007) whichprovides a verbalisation of every axiom presentin the ontology under consideration. Similarly,(Wilcock, 2003) describes an ontology verbaliserusing XML-based generation. Finally, recentwork by the SWAT project1 has focused on pro-
1http://crc.open.ac.uk/Projects/SWAT
18
ducing descriptions of ontologies that are both co-herent and efficient (Williams and Power, 2010).In these approaches, the mapping between rela-tions and verbs is determined either manually orthrough string matching and KB relations are as-sumed to map to binary verbs.
More complex NLG systems have also been de-veloped to generate text (rather than simple sen-tences) from knowledge bases. Thus, the MI-AKT project (Bontcheva and Wilks., 2004) andthe ONTOGENERATION project (Aguado et al.,1998) use symbolic NLG techniques to producetextual descriptions from some semantic informa-tion contained in a knowledge base. Both systemsrequire some manual input (lexicons and domainschemas). More sophisticated NLG systems suchas TAILOR (Paris, 1988), MIGRAINE (Mittal etal., 1994), and STOP (Reiter et al., 2003) offer tai-lored output based on user/patient models. Whileoffering more flexibility and expressiveness, thesesystems are difficult to adapt by non-NLG expertsbecause they require the user to understand thearchitecture of the NLG systems (Bontcheva andWilks., 2004). Similarly, the NaturalOWL system(Galanis et al., 2009) has been proposed to gen-erate fluent descriptions of museum exhibits froman OWL ontology. These approaches however relyon extensive manual annotation of the input data.
Related to the work discussed in this paper isthe task of learning subcategorization informationfrom textual corpora. Automatic methods for sub-categorization frame acquisition have been pro-posed from general text corpora, e.g., (Briscoe andCarroll, 1997), (Korhonen, 2002), (Sarkar and Ze-man, 2000) and specific biomedical domain cor-pora as well (Rimell et al., 2013). Such works arelimited to the extraction of syntactic frames rep-resenting subcategorization information. Instead,we focus on relating the syntactic and semanticframe and, in particular, on the linking betweensyntactic and semantic arguments.
Another trend of work relevant to this paper isgeneration from databases using parallel corporaof data and text. (Angeli et al., 2010) train a se-quence of discriminative models to predict dataselection, ordering and realisation. (Wong andMooney, 2007) uses techniques from statisticalmachine translation to model the generation taskand (Konstas and Lapata, 2012b; Konstas and La-pata, 2012a) learns a probabilistic Context-FreeGrammar modelling the structure of the database
and of the associated text. Various systems fromthe KBGEN shared task (Banik et al., 2013) – (But-ler et al., 2013), (Gyawali and Gardent, 2013) and(Zarrieβ and Richardson, 2013) perform genera-tion from the same input data source as ours’ anduse parallel text for supervision. Our approach dif-fers from all these approaches in that it does notrequire parallel text/data corpora. Also in contrastto the template extraction approaches described in(Kondadadi et al., 2013), (Ell and Harth, 2014)and (Duma and Klein, 2013), we do not succeed indirectly matching the input data to surface text inthe sentences obtained from non-parallel biomed-ical texts. Instead, we must extract the subcate-gorization frame and learn the linking between se-mantic and syntactic arguments.
3 Methodology
Our goal is to automatically generate natural lan-guage verbalisations of the biological event de-scriptions encoded in KB BIO 101 (Chaudhri etal., 2013) whereby an event description is as-sumed to consist of an event, its arguments andthe roles relating each argument to the event. Inthe KB BIO 101 knowledge base, events are con-cepts of type EVENT (e.g., RELEASE), argumentsare concepts of type ENTITY (e.g., GATED-CHANNEL,
VASCULAR-TISSUE, IRON) and roles are relations be-tween events and entities (e.g., AGENT, PATIENT,
PATH, INSTRUMENT).We propose a probabilistic method which ex-
tracts possible verbalisation frames from large bi-ology specific domain corpora and uses probabili-ties both to select an appropriate frame given anevent description and to determine the mappingbetween syntactic and semantic arguments. Thatis, probabilities are used to determine which eventargument fills which syntactic function (e.g., sub-ject, object) in the produced verbalisation.
We start by giving a brief overview of the con-tent and the structure of KB BIO 101(Section 3.1).We then describe the steps involved in building ourgeneration system.
3.1 KB Bio 101
The foundational component of the KB is theComponent Library (CLIB), an upper ontologywhich is linguistically motivated and designed tosupport the representation of knowledge for au-tomated reasoning (Gunning et al., 2010). CLIBadopts four simple top level distinctions: (1) enti-
19

SubClassOf ( : Hydrophobic−Compound : E n t i t y )SubClassOf ( : Plasma−Membrane : E n t i t y )SubClassOf ( : Block
O b j e c t I n t e r s e c t i o n O f ( : EventObjectSomeValuesFrom ( : i n s t r u m e n t : Plasma−Membrane )ObjectSomeValuesFrom ( : o b j e c t : Hydrophobic−Compound ) ) )
Figure 1: Example Event Representation in KBBIO 101
ties (things that are); (2) events (things that hap-pen); (3) relations (associations between things);and (4) roles (ways in which entities participate inevents).
Figure 1 shows an example representation fora blocking event between a plasma membraneand hydrophobic compounds which could be ver-balised as The plasma membrane blocks hydrophobic com-
pounds. In this representation, Block is a subclassof the event class. Plasma-Menbrane and Hydrophobic-
Compound are subclasses of the entity class. ThePlasma-Menbrane and the Hydrophobic-Compound con-cepts stand respectively in an instrument and in anobject role relation with the Block event.
KB BIO 101 is organized into a set of conceptmaps, where each concept map corresponds to abiological entity or process. It was encoded bybiology teachers and contains around 5,000 con-cept maps. KB BIO 101 is available for downloadfor academic purposes in various formats includ-ing OWL2 .
To test and evaluate our approach, we focus onthe subpart of KB BIO 101 isolated for the KBGEN
surface realisation shared task by (Banik et al.,2013). In this dataset, content units were semi-automatically selected from KB BIO 101 in such away that (i) the set of relations in each content unitforms a connected graph; (ii) each content unit canbe verbalised by a single, possibly complex sen-tence which is grammatical and meaningful and(iii) the set of content units contain as many dif-ferent relations and concepts of different semantictypes (events, entities, properties, etc) as possible.
That is, the KB content extracted for KBGEN iso-late event descriptions which can be verbalised bya single, coherent sentence. To evaluate the abilityof our generator to generate event descriptions, wefurther process this dataset to produce all KB frag-ments which represent a single event with roles toentities only. The statistics for the resulting dataset(dubbed KBGEN+) are shown in Table 1.
2http://www.ai.sri.com/halo/halobook2010/exported-kb/biokb.html
Items CountTotal nb of Event Descriptions 336Avg (min/max) nb of roles inan Event Description 2.93/1.8Total nb of events 126 (336)Total nb of entities 271 (929)Total nb of roles 14 (929)
Table 1: Test Set. The numbers in brackets indi-cate the number of tokens in KBGEN+
3.2 Corpus Collection
We begin by gathering sentences from severalof the publicly available biomedical domain cor-pora.3 This includes the BioCause (Mihil et al.,2013), BioDef4, BioInfer (Pyysalo et al., 2007),Grec (Thompson et al., 2009), Genia (Kim et al.,2003) and PubMedCentral (PMC)5 corpus. Wealso include the sentences available in annota-tions of named concepts in the KB BIO 101 ontol-ogy. This custom collection of sentences will bethe corpus upon which our learning approach willbuild on. Table 2 lists the count of sentences avail-able in each corpus and in total.
#SentencesBioCause 3,187BioDef 8,426BioInfer 1,100Genia 37,092,000Grec 2,035PMC 7,018,743KBBio101 3,393Total 44,128,884
Table 2: Corpus Size
3.3 Lexicon Creation
To identify corpus sentences which might containverbalisations of KBGEN+ events and entities,we build a lexicon mapping events and enti-ties contained in KBGEN+ to natural languagewords or phrases using existing resources. First,we take the lexicon provided by the KBGEN
3Ideally, since KB BIO 101 was developed based on atextbook, we would use this textbook as a corpus. Unfortu-nately, the textbook, previously licensed from Pearson, is nolonger available.
4Obtained by parsing the 〈Supplement〉 section of htmlpages crawled from http://www.biology-online.org/dictionary/
5ftp://ftp.ncbi.nlm.nih.gov/pub/pmc
20

challenge. The KBGEN lexicon is composed ofentries that provide inflected forms and nominal-izations for the event variables and singular andplural noun forms for the entity variables, such as :
Block, blocks, block, blocked, blocking
Earthworm, earthworm, earthworms
To this, we add the synset entries of Mesh6 andthe BioDef7 vocabularies containing the KBGEN+
events and entities . Some example synsetsobtained from Mesh and BioDef are shown below:
Block, prevent, stop
Neoplasm,Tumors,Neoplasia,Cancer
Finally, for generalisation purposes, we auto-matically extract the direct parent and siblings ofthe KBGEN+ events and entities in the KB BIO 101
ontology and add them as a lexical entries for thecorresponding KBGEN+ event/entity. For example,for the KBGEN+ event “Block”, the direct parentand siblings extracted from the KB BIO 101 are,respectively:
make inaccessible
conceal, deactivate, obstruct
Our lexicon is then a merge of all entries ex-tracted from either a lexicon or the ontology forthe KBGEN+ events and entities. In Table 3, wepresent the size of lexicon available from eachsource (Total Entries) and the count of KBGEN+
event and entity types (Intersecting Entries) forwhich one or more entry was found in that source.Table 4 shows the proportion of KBGEN+ event andentity types for which a lexical entry was foundas well as the maximum, minimum and averagenumber of lexical items associated with event andentities in the merged lexicon.
3.4 Frame Extraction
Events in KBGEN+ take an arbitrary number of par-ticipants ranging from 1 to 8. Knowing the lexical-isation of an event name is therefore not sufficient.For each event lexicalisation, information aboutsyntactic subcategorisation and syntactic/semantic
6http://www.nlm.nih.gov/mesh/filelist.html
7Obtained by parsing the entries in 〈Synonyms〉section of html pages crawled from http://www.biology-online.org/dictionary/
Total Entries Intersecting EntriesKBGen 469 397Mesh 26795 65BioDef 14934 99KBBio101 6972 397
Table 3: Lexical Entries and Number of KBGEN+
event and entities for which one or more entry wasfound (Intersecting Entries)
linking is also required. Consider for instance, thefollowing event representation:SubClassOf ( : PC / EBP b e t a : E n t i t y )SubClassOf ( : TNF−a c t i v a t i o n : E n t i t y )SubClassOf ( : Myeloid−C e l l s : E n t i t y )SubClassOf ( : Block
O b j e c t I n t e r s e c t i o n O f ( : EventObjectSomeValuesFrom ( : i n s t r u m e n t : C / EBP b e t a )ObjectSomeValuesFrom ( : o b j e c t : TNF−a c t i v a t i o n ) ) )Objec tSomeValuesFrom ( : bas e : Myeloid−C e l l s ) ) )
Knowing that a possible lexicalisation of a Block
event is the finite verb form blocked is not sufficientto produce an appropriate verbalisation of the KBevent e.g.,
(1) C/EBP beta blocked TNF activation in myeloid cells.
In addition, one must know that this verb (i)takes a subject, an object and an optional prepo-sitional argument introduced by a locative prepo-sition (subcategorisation information) and (ii) thatthe INSTRUMENT role is realised by the subject slot,the OBJECT role by the DOBJ slot and the BASE roleby the PREP-LOC slot (syntax/semantics linking in-formation). That is, we need to know, for eachKB event e and its associated roles (i.e., event-to-entity relations), first, what are the syntactic argu-ments of each possible lexicalisations of e and sec-ond, for each possible lexicalisation, which rolemaps to which syntactic function.
To address this issue, we extract syntacticframes from our constructed corpus and use thecollected data to learn the mapping between KBand syntactic arguments.
Frame extraction proceeds as follows. For eachevent name in the KBGEN+event set, we look forsentences in the corpus that mention this eventname or one of its several verbalisations availablein the merged lexicon (ALL in Table 4).
We then parse these sentences using the Stan-ford dependency parser8 for collapsed dependencystructures and extract frames from the resulting
8http://nlp.stanford.edu/software/lex-parser.shtml
21

KBGen Mesh BioDef KBBio101 ALL Min/MAx/AvgEvent 100% 10.31% 25.39% 100% 100% 5/97/22Entity 100% 19.18% 24.72% 100% 100% 3/91/16.18All 100% 16.37% 24.93% 100% 100% 3/97/18.03
Table 4: Proportion of Event and Entity Names for which a Lexical Entry was found. Min, max andaverage number of lexical items associated with event and entities
parse trees. A frame is a sequence of dependencyrelations labelling the local subtree originating ata node labelled with an event name (or one of itsvariants). For instance, given the sentence and thedependency tree shown in Figure 2, the extractedframe for the event Block will be :
nsubj,VB,dobj
indicating that the verb form block requires asubject and an object.
That is, a syntactic frame describes the argu-ments required by the lexicalisations of an eventand the syntactic function they realise.
When extracting the frames, we only considera subset of the dependency relations producedby the Stanford parser to avoid including in theframe adjuncts such as temporal or spatial phraseswhich are optional rather than required arguments.Specifically, the dependency relations consideredfor frame construction are:
agent, amod, dobj, nsubj, nsubjpass, prep across,
prep along, prep at, prep away from, prep down,
prep for, prep from, prep in, prep inside, prep into,
prep of, prep out of, prep through, prep to, prep toward,
prep towards, prep via, prep with, vmod creating,
vmod forming, vmod producing, vmod resulting,
vmod using, xcomp using, auxpass.9
A total of 718 distinct event frames were ob-served whereby 97.63% of the KBGEN+eventswere assigned at least one frame and each eventwas assigned an average of 82.01 distinct frames.Each event can be lexicalised by several naturallanguage words or phrases and each natural lan-guage expressions may occur in several syntacticenvironments.
9vmod creating, vmod forming, vmod producing,vmod resulting, vmod using, xcomp using are not directlygiven by the Stanford parser but reconstructed from a vmodor an xcomp dependency “collapsed” with the lemmasproducing or using much in the same way as the prep P col-lapsed dependency relation provided by the Stanford Parser.These added dependencies are often used in biomedical textto express e.g., RESULT or RAW-MATERIAL role relations.
3.5 Probabilistic ModelsGiven F a set of syntactic frames, E a set ofKB event names, D a set of syntactic dependencynames and R, a set of KB roles, we next describethree probabilistic models that will be used to gen-erate natural language sentences.
• The model P (f |e) with f ∈ F and e ∈E, which encodes the probability of a framegiven an event.
• The model P (f |r) with f ∈ F and r ∈R, which encodes the probability of a framegiven a role.
• The model P (d|r) with d ∈ D and r ∈ R,which encodes the probability of a syntacticdependency given a role.
We have chosen generative models for framesand dependencies given events and roles, and notthe other way around, because such models intu-itively match the generation process at test time.Each of the three models P (f |e), P (f |r) andP (d|r) is assumed multinomial with maximumlikelihood estimates determined by the labelleddata built as described in Algorithm 1. Intuitively,Ce is the corpus consisting of all frames foundin the corpus to be associated with a lexicalisa-tion of e. Similarly, Cr nd Cd gathers all pairs of(frame,role) and (dependency relation, role) thatcould be identified given the KBGEN+ KB, the cor-pus described in Section 3.2 and the lexicon de-scribed in Section 3.3. A Symmetric Dirichletprior with hyperparameter α = 0.1 is further usedin order to favor sparse distributions. Training thusgives:
P (f |e) =counts ((f, e) ∈ Ce) + 0.1∑
f ′ (counts ((f ′, e) ∈ Ce) + 0.1)
This first model allows to choose a syntactic framethat will be used to verbalize a given event.
For the second distribution:
P (f |r) =counts ((f, r) ∈ Cr) + 0.1∑
f ′ (counts ((f ′, r) ∈ Cr) + 0.1)
22

New immunosuppressive drug pnu156804 blocks IL-2-dependent proliferationJJ JJ NN NNS VBZ JJ JJ
AMOD
AMOD
NN NSUBJ
DOBJ
AMOD
Figure 2: Example Dependency Parse Tree
This second model also ranks the frames, but thistime based on the given set of roles.
The third model is trained in a similar way:
P (d|r) =counts ((d, r) ∈ Cd) + 0.1∑
d′ (counts ((d′, r) ∈ Cd) + 0.1)
It is used to choose which dependency in f shallrepresent the role r.
3.6 Surface Realisation
In our approach, surface realisation takes as in-put an even description. To verbalize an inputevent description containing an event e and n rolesr1. . . . . . rn, we first identify the event and the rolespresent in the input. The arity of the event is thendefined as the count of distinct role types presentin the input (to favor aggregation, in case of re-peating roles)10. Among all the frames seen forthis event during training, we select only those thathave the same arity (same number of syntactic de-pendents) as the input event. All such frames arecandidate frames for generation.
We consider two alternative scoring functionsfor choosing the n-best frames11. In the first case,we select the frame which maximises the score(M1):
P (f |e)×n∏
i=1
P (f |ri) (M1)
To determine the mapping between roles andsyntactic dependencies, we then look for the bestpermutation of the roles for every winning framef = (d1, · · · , dn):
(rf1 , . . . , rf
n) = arg max(r1,...,rn)∈P({r1,...,rn})
n∏
i=1
P (di|ri)
10Thus if the input event description contains e.g., 2 objectroles and an instrument role, its arity will be 2 rather than3. This accounts for the fact that the two object roles will beverbalised as a coordinated NP filling in a single dependencyfunction rather than two distinct syntactic arguments.
11n=5 in our experiments
where P({r1, . . . , rn}) is the set of all permuta-tions of the roles12.
In the second model (M2), we first compute theoptimal mapping (rf
1 , . . . , rfn) for every possible
frame and then use this information to select then-best frames for generation:
P (f |e)×n∏
i=1
P (f |ri)×n∏
i=1
P (di|rfi ) (M2)
Note that (M1) (and (M2)) can be viewed as aproduct of experts, but with independently trainedexperts and without any normalization factor. It isthus not a probability, but this is fine because thenormalization term does not impact the choice ofthe winning frame.
Both (M1) and (M2) alternatives output a win-ning f , i.e., a sequence of dependencies that shallbe used to generate the sentence, as well as theirmapping with roles (rf
1 , . . . , rfn). Thus, genera-
tion boils down to filling every dependency slotin sequence with its optional preposition (e.g., fordi = prep to or di = prep at) and the lexical en-try of the entity bound to the corresponding role.For repeating roles of the input, we aggregate theirbound entities via the conjunction “and” and fillthe corresponding dependency slot.
The results obtained by verbalising the n-bestframes given by models (M1 & M2) are separatelystored and we present their analysis in Section 4.
4 Results and Discussion
We evaluate our approach on the 336 event rep-resentations included in the KBGEN+ dataset. Foreach event representation, we generate the 5 bestnatural language verbalisations using the methoddescribed in the preceding section. We then evalu-ate the results both qualitatively and quantitatively.
12Here, we assume the order of dependencies in f is fixed,and we permute the roles; this is of course equivalent to per-muting the dependencies with fixed roles sequences.
23
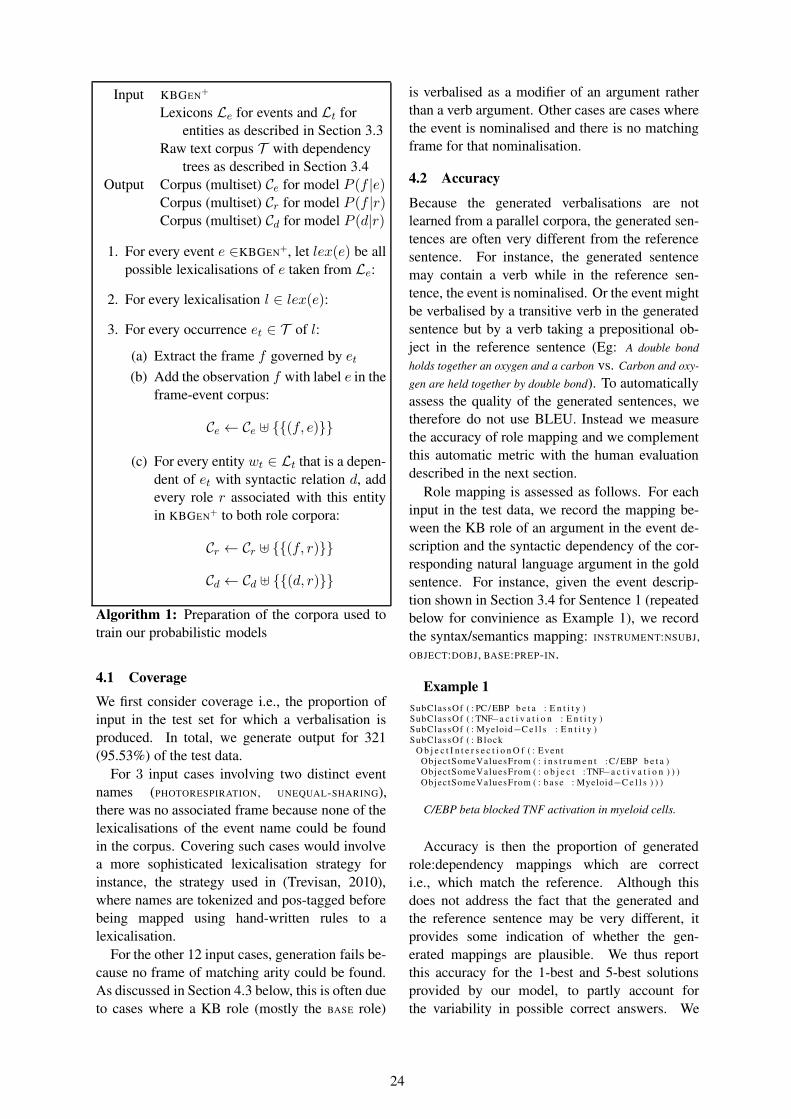
Input KBGEN+
Lexicons Le for events and Lt forentities as described in Section 3.3
Raw text corpus T with dependencytrees as described in Section 3.4
Output Corpus (multiset) Ce for model P (f |e)Corpus (multiset) Cr for model P (f |r)Corpus (multiset) Cd for model P (d|r)
1. For every event e ∈KBGEN+, let lex(e) be allpossible lexicalisations of e taken from Le:
2. For every lexicalisation l ∈ lex(e):
3. For every occurrence et ∈ T of l:
(a) Extract the frame f governed by et
(b) Add the observation f with label e in theframe-event corpus:
Ce ← Ce ⊎ {{(f, e)}}
(c) For every entity wt ∈ Lt that is a depen-dent of et with syntactic relation d, addevery role r associated with this entityin KBGEN+ to both role corpora:
Cr ← Cr ⊎ {{(f, r)}}
Cd ← Cd ⊎ {{(d, r)}}
Algorithm 1: Preparation of the corpora used totrain our probabilistic models
4.1 Coverage
We first consider coverage i.e., the proportion ofinput in the test set for which a verbalisation isproduced. In total, we generate output for 321(95.53%) of the test data.
For 3 input cases involving two distinct eventnames (PHOTORESPIRATION, UNEQUAL-SHARING),there was no associated frame because none of thelexicalisations of the event name could be foundin the corpus. Covering such cases would involvea more sophisticated lexicalisation strategy forinstance, the strategy used in (Trevisan, 2010),where names are tokenized and pos-tagged beforebeing mapped using hand-written rules to alexicalisation.
For the other 12 input cases, generation fails be-cause no frame of matching arity could be found.As discussed in Section 4.3 below, this is often dueto cases where a KB role (mostly the BASE role)
is verbalised as a modifier of an argument ratherthan a verb argument. Other cases are cases wherethe event is nominalised and there is no matchingframe for that nominalisation.
4.2 Accuracy
Because the generated verbalisations are notlearned from a parallel corpora, the generated sen-tences are often very different from the referencesentence. For instance, the generated sentencemay contain a verb while in the reference sen-tence, the event is nominalised. Or the event mightbe verbalised by a transitive verb in the generatedsentence but by a verb taking a prepositional ob-ject in the reference sentence (Eg: A double bond
holds together an oxygen and a carbon vs. Carbon and oxy-
gen are held together by double bond). To automaticallyassess the quality of the generated sentences, wetherefore do not use BLEU. Instead we measurethe accuracy of role mapping and we complementthis automatic metric with the human evaluationdescribed in the next section.
Role mapping is assessed as follows. For eachinput in the test data, we record the mapping be-ween the KB role of an argument in the event de-scription and the syntactic dependency of the cor-responding natural language argument in the goldsentence. For instance, given the event descrip-tion shown in Section 3.4 for Sentence 1 (repeatedbelow for convinience as Example 1), we recordthe syntax/semantics mapping: INSTRUMENT:NSUBJ,
OBJECT:DOBJ, BASE:PREP-IN.
Example 1SubClassOf ( : PC / EBP b e t a : E n t i t y )SubClassOf ( : TNF−a c t i v a t i o n : E n t i t y )SubClassOf ( : Myeloid−C e l l s : E n t i t y )SubClassOf ( : Block
O b j e c t I n t e r s e c t i o n O f ( : EventObjectSomeValuesFrom ( : i n s t r u m e n t : C / EBP b e t a )ObjectSomeValuesFrom ( : o b j e c t : TNF−a c t i v a t i o n ) ) )Objec tSomeValuesFrom ( : bas e : Myeloid−C e l l s ) ) )
C/EBP beta blocked TNF activation in myeloid cells.
Accuracy is then the proportion of generatedrole:dependency mappings which are correcti.e., which match the reference. Although thisdoes not address the fact that the generated andthe reference sentence may be very different, itprovides some indication of whether the gen-erated mappings are plausible. We thus reportthis accuracy for the 1-best and 5-best solutionsprovided by our model, to partly account forthe variability in possible correct answers. We
24

compare our results to two baselines. The firstbaseline (BL-LING) is obtained using a defaultrole/dependency assignment which is manuallydefined using linguistic introspection. The second(BL-GOLD) is a strong, informed baseline whichhas access to the frequency of the role/depen-dency mapping in the gold corpus. That is,this second baseline assigns to each role in theinput event description, the syntactic dependencymost frequently assigned to this role in the goldcorpus. The default mapping used for BL-GOLDis as follows: toward/prep towards, site/prep in,
result/dobj, recipient/prep to, raw material/dobj,
path/prep through, origin/prep from, object/dobj, in-
strument/nsubj, donor/prep from, destination/prep into,
base/prep in, away-from/prep away from, agent/nsubj. Themanually defined mapping used for BL-LINGdiffers on three mappings namely raw material/prep-
from, instrument-with,destination-to.On the 336 event descriptions (929 roles occur-
rences) contained in the test set, we obtain the fol-lowing results:
Scoring 5-best acc 1-best accBL-Ling 42%BL-GOLD 49%M1 48% 30%M2 49% 31%M2-BL-LING 57% 43%
As expected, the difference between BL-LINGand BL-GOLD shows that using information fromthe GOLD strongly improves accuracy.
While M1 and M2 do not improve on the base-line, an important drawback of these baselines isthat they may map two or more roles in an eventdescription to the same dependency (e.g., RAW-
MATERIAL and RESULT to dobj). Worse, they maymap a role to a dependency which is absent fromthe selected frame (if the dependency mapped ontoby a role in the input does not exist in that frame).In contrast, the probabilistic approach is linguis-tically more promising as it guarantees that eachrole is mapped to a distinct dependency relation.We therefore take advantage of both the linguisti-cally inspired baseline (BL-LING) and the proba-bilistic approach by combining both into a model(M2-BL-LING) which simply replaces the map-ping proposed by the M2 model by that proposedby the BL-LING baseline whenever the proba-bility of the M2 model is below a given thresh-old13. Because it predicts role/dependency map-
13We have empirically chosen a threshold that retains 40%
pings that are consistent with the selected frames,this new model is linguistically sound. And be-cause it makes use of the strong prior informationcontained in the BL-LING baseline, it has a goodaccuracy.
4.3 Human EvaluationTaking a sample of 264 inputs from the KBGEN+
dataset, we evaluate the mappings of roles to syn-tax in the output. The sample contains inputs with1 to 2 roles (40%), 3 roles (30%) and more than 3roles (30%). For each sampled input, we considerthe 5 best outputs and manually grade the outputas follows:
1. Correct: both the syntax/semantic linking ofthe arguments and the lexicalisation of theevent and of its arguments is correct.
2. Almost Corrrect: the lexicalisation of theevent and of its arguments is correct and thelinking of core semantic arguments is correct.The core arguments are the most frequentones in the test data namely AGENT, BASE, OB-
JECT.
3. Incorrect: all other cases.
Three judges independently graded 264 inputsusing the above criteria. The inter-annotatoragreement, as measured with the Fleiss Kappa ina preliminary experiment in these conditions, wasκ = 0.76 which is considered as “good agree-ment” in the literature. 29% of the ouput werefound to be correct, 20% to be almost correct and51% to be incorrect.
One main factor negatively affecting results isthe number of roles contained in an event descrip-tion. Unsurprisingly, the greater the number ofroles the lower the accuracy. That is, for eventdescriptions with 3 or less roles, the scores arehigher (40%, 23%, 37% respectively for correct,almost correct and incorrect) as there are less pos-sibilities to be considered. Another, related issue,is data sparsity. Unsurprisingly, roles that are lessfrequent often score lower (i.e., are more often in-correctly mapped to syntax) than roles which oc-cur more frequently. Thus, the three most frequentroles (AGENT,OBJECT, BASE) have a 5-best role map-ping accuracy that ranges from 43% to 77%, whilemost other roles have much lower accuracy. These
of our model’s outputs; this is the only threshold value thatwe have tried, and we have not tuned this threshold at all
25

two issues suggest that results could be improvedby using either more data or a more sophisticatedsmoothing or learning strategy. However linguis-tic factors are also at play here.
First, some semantic roles are often verbalisedas verbs rather than thematic roles. For in-stance, in Sentence (2), the event (INTRACELLULAR-
DIGESTION) is verbalised as a nominalisation andthe OBJECT role as a verb (produces). More gener-ally, a role in the KB is not necessarily realised bya thematic role.
(2) Intracellular digestion of polymers andsolid substances in the lysosome producesmonomers.
Second, in some cases, entities which are argu-ments of the event in the input are verbalised asprepositional modifiers of an argument of the verbverbalising the event rather than as an argument ofthe verb itself. This is frequently the case for theBASE relation. For instance, Example (3) shows thegold sentence for an input containing EUKARYOTIC-
CELL as a BASE argument. As can be seen, in thiscase, the EUKARYOTIC-CELL entity is verbalised by aprepositional phrase modifying an NP rather thanby an argument of the verb.
(3) Lysosomal enzymes digest nucleic acids andproteins in the lysosome of eukaryotic cells.
5 Conclusion
We have presented an approach for verbalising bi-ological event representations which differs fromprevious work in that (i) it uses a non-parallel cor-pora and (ii) it focuses on n-ary relations and onthe issue of how to automatically map natural lan-guage and KB arguments. A first evaluation givesencouraging results and identifies three main openquestions for further research. How best to dealwith data sparsity to account for event descriptionsinvolving a high number of roles or roles that areinfrequent? How to handle semantic roles that areverbalised as modifiers rather than as syntactic ar-guments? How to account for cases where KBroles are verbalised by verbs rather than by syn-tactic dependencies?
ReferencesG. Aguado, A. Banon, J. Bateman, S. Bernardos,
M. Fernandez, A. Gomez-Perez, E. Nieto, A. Olalla,R. Plaza, and A. Sanchez. 1998. Ontogeneration:
Reusing domain and linguistic ontologies for span-ish text generation. In Workshop on Applicationsof Ontologies and Problem Solving Methods, ECAI,volume 98.
Gabor Angeli, Percy Liang, and Dan Klein. 2010. Asimple domain-independent probabilistic approachto generation. In Proceedings of the 2010 Confer-ence on Empirical Methods in Natural LanguageProcessing, pages 502–512. Association for Com-putational Linguistics.
Eva Banik, Claire Gardent, and Eric Kow. 2013. Thekbgen challenge. In the 14th European Workshop onNatural Language Generation (ENLG), pages 94–97.
Anja Belz. 2008. Automatic generation of weatherforecast texts using comprehensive probabilisticgeneration-space models. Natural Language Engi-neering, 14(4):431–455.
K. Bontcheva and Y. Wilks. 2004. Automatic re-port generation from ontologies: the miakt ap-proach. In Ninth International Conference on Appli-cations of Natural Language to Information Systems(NLDB’2004). Lecture Notes in Computer Science3136, Springer, Manchester, UK.
Ted Briscoe and John Carroll. 1997. Automatic extrac-tion of subcategorization from corpora. In Proceed-ings of the fifth conference on Applied natural lan-guage processing, pages 356–363. Association forComputational Linguistics.
Keith Butler, Priscilla Moraes, Ian Tabolt, and KathyMcCoy. 2013. Team udel kbgen 2013 challenge. InProceedings of the 14th European Workshop on Nat-ural Language Generation, pages 206–207, Sofia,Bulgaria, August. Association for ComputationalLinguistics.
Vinay K Chaudhri, Michael A Wessel, and Stijn Hey-mans. 2013. Kb bio 101: A challenge for owl rea-soners. In ORE, pages 114–120. Citeseer.
David L Chen and Raymond J Mooney. 2008. Learn-ing to sportscast: a test of grounded language acqui-sition. In Proceedings of the 25th international con-ference on Machine learning, pages 128–135. ACM.
Deborah A Dahl, Madeleine Bates, Michael Brown,William Fisher, Kate Hunicke-Smith, David Pallett,Christine Pao, Alexander Rudnicky, and ElizabethShriberg. 1994. Expanding the scope of the atistask: The atis-3 corpus. In Proceedings of the work-shop on Human Language Technology, pages 43–48.Association for Computational Linguistics.
Daniel Duma and Ewan Klein, 2013. Generating Natu-ral Language from Linked Data: Unsupervised Tem-plate Extraction, pages 83–94. ASSOC COMPU-TATIONAL LINGUISTICS-ACL.
Basil Ell and Andreas Harth. 2014. A language-independent method for the extraction of rdf verbal-ization templates. INLG 2014, page 26.
26

D. Galanis, G. Karakatsiotis, G. Lampouras, and I. An-droutsopoulos. 2009. An open-source natural lan-guage generator for owl ontologies and its use inprotege and second life. In Proceedings of the 12thConference of the European Chapter of the Asso-ciation for Computational Linguistics: Demonstra-tions Session, pages 17–20. Association for Compu-tational Linguistics.
David Gunning, Vinay K Chaudhri, Peter E Clark, KenBarker, Shaw-Yi Chaw, Mark Greaves, BenjaminGrosof, Alice Leung, David D McDonald, SunilMishra, et al. 2010. Project halo updateprogresstoward digital aristotle. AI Magazine, 31(3):33–58.
Bikash Gyawali and Claire Gardent. 2013. Lor-kbgen,a hybrid approach to generating from the kbgenknowledge-base. In Proceedings of the 14th Euro-pean Workshop on Natural Language Generation,pages 204–205, Sofia, Bulgaria, August. Associa-tion for Computational Linguistics.
K. Kaljurand and N.E. Fuchs. 2007. Verbalizingowl in attempto controlled english. Proceedings ofOWLED07.
J.-D. Kim, T. Ohta, Y. Tateisi, and J. Tsujii. 2003. Ge-nia corpusa semantically annotated corpus for bio-textmining. Bioinformatics, 19(suppl 1):i180–i182.
Ravi Kondadadi, Blake Howald, and Frank Schilder.2013. A statistical nlg framework for aggregatedplanning and realization.
Ioannis Konstas and Mirella Lapata. 2012a. Concept-to-text generation via discriminative reranking. InProceedings of the 50th Annual Meeting of theAssociation for Computational Linguistics: LongPapers-Volume 1, pages 369–378. Association forComputational Linguistics.
Ioannis Konstas and Mirella Lapata. 2012b. Unsuper-vised concept-to-text generation with hypergraphs.In Proceedings of the 2012 Conference of the NorthAmerican Chapter of the Association for Computa-tional Linguistics: Human Language Technologies,pages 752–761. Association for Computational Lin-guistics.
Anna Korhonen. 2002. Semantically motivated sub-categorization acquisition. In Proceedings of theACL-02 Workshop on Unsupervised Lexical Acqui-sition - Volume 9, ULA ’02, pages 51–58, Strouds-burg, PA, USA. Association for Computational Lin-guistics.
Percy Liang, Michael I Jordan, and Dan Klein. 2009.Learning semantic correspondences with less super-vision. In Proceedings of the Joint Conference of the47th Annual Meeting of the ACL and the 4th Interna-tional Joint Conference on Natural Language Pro-cessing of the AFNLP: Volume 1-Volume 1, pages91–99. Association for Computational Linguistics.
C. Mihil, T. Ohta, S. Pyysalo, and S. Ananiadou. 2013.Biocause: Annotating and analysing causality in thebiomedical domain. BMC BioInformatics.
VO Mittal, G. Carenini, and JD Moore. 1994. Gen-erating patient specific explanations in migraine. InProceedings of the eighteenth annual symposium oncomputer applications in medical care. McGraw-Hill Inc.
C.L. Paris. 1988. Tailoring object descriptions to auser’s level of expertise. Computational Linguistics,14(3):64–78.
Sampo Pyysalo, Filip Ginter, Juho Heimonen, JariBjrne, Jorma Boberg, Jouni Jrvinen, and TapioSalakoski. 2007. Bioinfer: A corpus for infor-mation extraction in the biomedical domain. BMCBioinformatics.
E. Reiter, R. Robertson, and L.M. Osman. 2003.Lessons from a failure: Generating tailored smokingcessation letters. Artificial Intelligence, 144(1):41–58.
Laura Rimell, Thomas Lippincott, Karin Verspoor, He-len L Johnson, and Anna Korhonen. 2013. Acqui-sition and evaluation of verb subcategorization re-sources for biomedicine. Journal of biomedical in-formatics, 46(2):228–237.
Anoop Sarkar and Daniel Zeman. 2000. Automaticextraction of subcategorization frames for czech. InProceedings of the 18th conference on Computa-tional linguistics-Volume 2, pages 691–697. Asso-ciation for Computational Linguistics.
P. Thompson, S. A. Iqbal, J. McNaught, and S. Ana-niadou. 2009. Construction of an annotated corpusto support biomedical information extraction. BMCBioinformatics.
Marco Trevisan. 2010. A portable menuguided naturallanguage interface to knowledge bases for querytool.Master’s thesis, Free University of Bozen-Bolzano(Italy) and University of Groningen (Netherlands).
G. Wilcock. 2003. Talking owls: Towards an ontologyverbalizer. Human Language Technology for the Se-mantic Web and Web Services, ISWC, 3:109–112.
Sandra Williams and Richard Power. 2010. Groupingaxioms for more coherent ontology descriptions. InProceedings of the 6th International Natural Lan-guage Generation Conference (INLG 2010), pages197–202, Dublin.
Yuk Wah Wong and Raymond J Mooney. 2007. Gen-eration by inverting a semantic parser that uses sta-tistical machine translation. In HLT-NAACL, pages172–179.
Sina Zarrieβ and Kyle Richardson. 2013. An auto-matic method for building a data-to-text generator.In Proceedings of the 14th European Workshop onNatural Language Generation, Sofia, Bulgaria, Au-gust.
27

Proceedings of the 15th European Workshop on Natural Language Generation (ENLG), pages 28–37,Brighton, September 2015. c©2015 Association for Computational Linguistics
Inducing Clause-Combining Rules:A Case Study with the SPaRKy Restaurant Corpus
Michael WhiteDepartment of LinguisticsThe Ohio State University
Columbus, Ohio 43210, [email protected]
David M. HowcroftComputational Linguistics and Phonetics
Saarland University66123 Saarbrucken, Germany
Abstract
We describe an algorithm for inducingclause-combining rules for use in a tradi-tional natural language generation archi-tecture. An experiment pairing lexical-ized text plans from the SPaRKy Restau-rant Corpus with logical forms obtainedby parsing the corresponding sentencesdemonstrates that the approach is able tolearn clause-combining operations whichhave essentially the same coverage asthose used in the SPaRKy Restaurant Cor-pus. This paper fills a gap in the litera-ture, showing that it is possible to learn mi-croplanning rules for both aggregation anddiscourse connective insertion, an impor-tant step towards ameliorating the knowl-edge acquisition bottleneck for NLG sys-tems that produce texts with rich discoursestructures using traditional architectures.
1 Introduction
In a traditional natural language generation (NLG)system (Reiter and Dale, 2000), a pipeline ofhand-crafted components is used to generate highquality text, albeit at considerable knowledge-engineering expense. While there has beenprogress on using machine learning to amelio-rate this issue in content planning (Duboue andMcKeown, 2001; Barzilay and Lapata, 2005) andbroad coverage surface realization (Reiter, 2010;Rajkumar and White, 2014), the central stage ofsentence planning (or microplanning) has provedmore difficult to automate. More recently, Angeliet al. (2010) and Konstas and Lapata (2013), interalia, have developed end-to-end learning methodsfor NLG systems; however, as discussed further inthe next section, these systems assume quite lim-ited discourse structures in comparison to thosewith more traditional architectures.
In this paper, we describe a method of inducingclause-combining rules of the kind used in tradi-tional sentence planners. In particular, we base ourapproach on the architecture used in the SPaRKyrestaurant recommendation system (Walker et al.,2007), where a sentence plan generator is used tomap a text plan to a range of possible sentenceplans, from which one is selected for output bya sentence plan ranker.1 To demonstrate the vi-ability of our method, we present an experimentdemonstrating that rules corresponding to all ofthe hand-crafted operators for aggregation and dis-course connective insertion used in the SPaRKyRestaurant Corpus can be effectively learned fromexamples of their use. To our knowledge, theseinduced rules for the first time incorporate theconstraints necessary to be functionally equiva-lent to the hand-crafted clause-combining opera-tors; in particular, our method goes beyond theone Stent and Molina (2009) develop for learningclause-combining rules, which focuses on learn-ing domain-independent rules for discourse con-nective insertion, ignoring aggregation rules andany potentially domain-dependent aspects of therules. As such, our approach promises to be of im-mediate benefit to NLG system developers, whilealso taking an important step towards reducing theknowledge acquisition bottleneck for developingNLG systems requiring rich discourse structuresin their outputs.
2 Related Work
Angeli et al. (2010) present an end-to-end train-able NLG system that generates by selecting a
1The sentence plan ranker uses machine learning to ranksentence plans based on features derived from the sentenceplan and its realization, together with accompanying humanratings for the realizations in the training data. As such, theSPaRKy architecture differs from traditional ones in usingmachine learning to rank potential outputs, but it follows thetraditional architecture in making use of lexicalization, ag-gregation and referring expression rules in a distinct sentenceplanning stage.
28

sequence of database records to describe, a se-quence of fields on those records to mention, andfinally a sequence of words for expressing the val-ues of those fields. Though Konstas and Lapata(2013) generalize Angeli et al.’s approach, theyacknowledge that handling discourse-level docu-ment structure remains for future work. Given thislimitation, under their approach there is no need toexplicitly perform aggregation: instead, it sufficesto “pre-aggregate” propositions about the same en-tity onto the same record. However, in the generalcase aggregation should be subject to discoursestructure; for example, when contrasting the posi-tive and negative attributes of an entity accordingto a given user model, it makes sense to aggre-gate the positive and negative attributes separately,rather than lumping them together (White et al.,2010). Consequently, we aim to learn aggregationrules that are sensitive to discourse structure, aswith the SPaRKy architecture.
Other notable recent approaches (Lu et al.,2009; Dethlefs et al., 2013; Mairesse and Young,2014) are similar in that they learn to map se-mantic representations to texts using conditionalrandom fields or factored language models withno explicit model of syntactic structure, but thecontent to be expressed is assumed to be pre-aggregated in the input. Kondadadi et al. (2013)develop a rather different approach where large-scale templates are learned that can encapsulatetypical aggregation patterns, but the templatescannot be dynamically combined in a way that issensitive to discourse structure
Previous work on aggregation in NLG, e.g. withSPaRKy itself or earlier work by Pan and Shaw(2004), focuses on learning when to apply aggre-gation rules, which are themselves hand-craftedrather than learned. The clause-combining rulesour system learns—based on lexico-semantic de-pendency edits—are closely related to the lexico-syntactic rewrite rules learned by Angrosh andSiddharthan’s (2014) system for text simplifica-tion. However, our learned rules go beyond theirsin imposing (non-)equivalence constraints crucialfor accurate aggregation. Finally, work on textcompression (Woodsend and Lapata, 2011; Cohnand Lapata, 2013) is also related, but focuses onsimple constituent deletion, and to our knowledgedoes not implement aggregation constraints suchas those here.
3 SPaRKy Restaurant Corpus
Walker et al. (2007) developed SPaRKy (a Sen-tence Planner with Rhetorical Knowledge) to ex-tend the MATCH system (Walker et al., 2004) forrestaurant recommendations. In the course of theirstudy they produced the SPaRKy Restaurant Cor-pus (SRC), a collection of content plans, text plansand the surface realizations of those plans evalu-ated by users.2
While the restaurant recommendation domainis fairly narrow in terms of the kinds of propo-sitions represented, it requires careful applicationof aggregation operations to make concise, natu-ral realizations. This is evident both in the caretaken in incorporating clause-combining rules intoSPaRKy and in subsequent work on the expres-sion of contrast which used this domain to mo-tivate extensions of CCG to the discourse level(Nakatsu and White, 2010; Howcroft et al., 2013).Five kinds of clause-combining operations are in-cluded in SPaRKy, most of which involve lex-ically specific constraints. These are illustratedin Table 2, using propositions corresponding tosentences (1)–(4) from Table 1 as input (com-bined with either a CONTRAST or INFER relation).MERGE combines two clauses if they have thesame verb with the same arguments and adjunctsexcept for one. WITH-REDUCTION replaces an in-stance of have plus an object X with the phrasewith X. REL-CLAUSE subordinates one clauseto another when they have a common subject.CUE-WORD-CONJUNCTION combines clauses us-ing the conjunctions and, but, and while, whileCUE-WORD-INSERTION combines clauses by in-serting however or on the other hand into thesecond clause. Table 2 also shows two opera-tions, VP-COORDINATION and NP-APPOSITION,which go beyond those in SPaRKy; these are dis-cussed further in Section 5.5. Finally, it’s also pos-sible to leave sentences as they are, simply juxta-posing them in sequence.
For the experiments reported in this paper,we have reimplemented SPaRKy to work withOpenCCG’s broad coverage English grammar forparsing and realization (Espinosa et al., 2008;White and Rajkumar, 2009; White and Rajkumar,
2Available from http://users.soe.ucsc.edu/˜maw/downloads.html under the textplans/utterances.To our knowledge, the SRC remains the only publicly avail-able corpus of input–output pairs for an NLG system usingdiscourse structures with rhetorical relations.
29

Operator Sents ResultMERGE 1, 2 Sonia Rose has good decor and good service.WITH-REDUCTION 1, 2 Sonia Rose has good decor, with good service.REL-CLAUSE 1, 2 Sonia Rose, which has good service, has good decor.CUE-WORD-CONJUNCTION 1, 3 Sonia Rose has good service, but Bienvenue has very good service.CUE-WORD-INSERTION 1, 3 Sonia Rose has good service. However, Bienvenue has very good service.VP-COORDINATION 3, 4 Bienvenue is a French restaurant and has very good service.NP-APPOSITION 3, 4 Bienvenue, a French restaurant, has very good service.
Table 2: SRC clause-combining operations plus two additional operations we examined.
(1) Sonia Rose has good decor.(2) Sonia Rose has good service.(3) Bienvenue has very good service.(4) Bienvenue is a French restaurant.
Table 1: Example sentences from the SRC do-main.
2012).3 As in the original SPaRKy, the sentenceplanner takes as input a text plan, which encodesthe propositions to be expressed at the leaves of atree whose internal nodes are marked with rhetor-ical relations. The sentence planner then rewritesthe text-plan tree using a sequence of lexicaliza-tion, clause-combining and referring expressionrules. The obligatory lexicalization rules straight-forwardly rewrite the domain-specific proposi-tions into a domain-general OpenCCG lexico-semantic dependency graph, or logical form (re-ferred to as a TPLF in Section 5.1). After lexi-calization, the clause-combining and referring ex-pression rules optionally apply to rewrite the log-ical form into a set of alternative logical forms,among which is ideally one or more options thatwill express the content concisely and fluently af-ter each sentence is realized; if none of the clause-combining and referring expression rules apply,the text will be realized as a sequence of very sim-ple one-clause sentences, with proper names usedfor all restaurant references.
As noted earlier, the task of choosing a particu-lar logical form alternative belongs to the sentenceplan ranker; since its task is largely independentof the task of generating alternative logical forms,we do not address it in this paper. Indeed, to theextent that our sentence planner produces logicalforms that are functionally equivalent to the alter-native sentence plans in the SRC, we can expectthe output quality of the reimplemented systemwith a suitably trained sentence plan ranker to be
3The lexicon is extended by the addition of the restaurantnames as proper nouns to avoid spurious bad parses resultingfrom unknown words.
essentially unchanged, and thus an evaluation ofthis kind would be uninformative.
An example aggregation rule for the OpenCCG-based system (going beyond the options in theSRC) appears in Figure 1, and an example input–output pair for this rule appears in Figure 2. Asthe latter figure shows, a dependency graph con-sists of a set of nodes and relations between them,where sibling nodes are taken to be unordered.Nodes themselves comprise an identifier, a pred-icate label and an unordered list of attribute-valuepairs. The graphs have a primary tree structure;the graphs in Figure 2 are in fact trees, but in thegeneral case, node references can be used to rep-resent nodes with multiple parents or even cycles(in the case of relative clauses). The alignmentsbetween nodes in the input and output graphs areshown in the figure by using the same identifier forcorresponding nodes.
Clause-combining rules such as the one in Fig-ure 1 are applied by unifying the left hand side ofthe rule against an input dependency graph, return-ing the graph specified by the right hand side of therule if unification succeeds and any further speci-fied constraints are satisfied. The rules are imple-mented in Prolog using an enhanced unificationroutine that allows sibling nodes to be treated asunordered, and which allows list variables (shownbetween dots in the figure) to unify with the tail(i.e., remainder) of a list of child nodes or a list ofattributes. In the example at hand, the variables G,C, E and I are unified with node identifiers n(1),n(2), n(7) and n(8), respectively. The listvariables ...D... and ...F... unify withthe empty list since the nodes for Bienvenue haveno child nodes, while ...L... unifies with a listconsisting of the relation Arg1 together with thesubgraph headed by n(3), and ...K... unifieswith a list consisting of the relations Det and Modtogether with their respective subgraphs headedby n(9) and n(10). The list variables over at-tributes unify trivially. Finally, after checking the
30
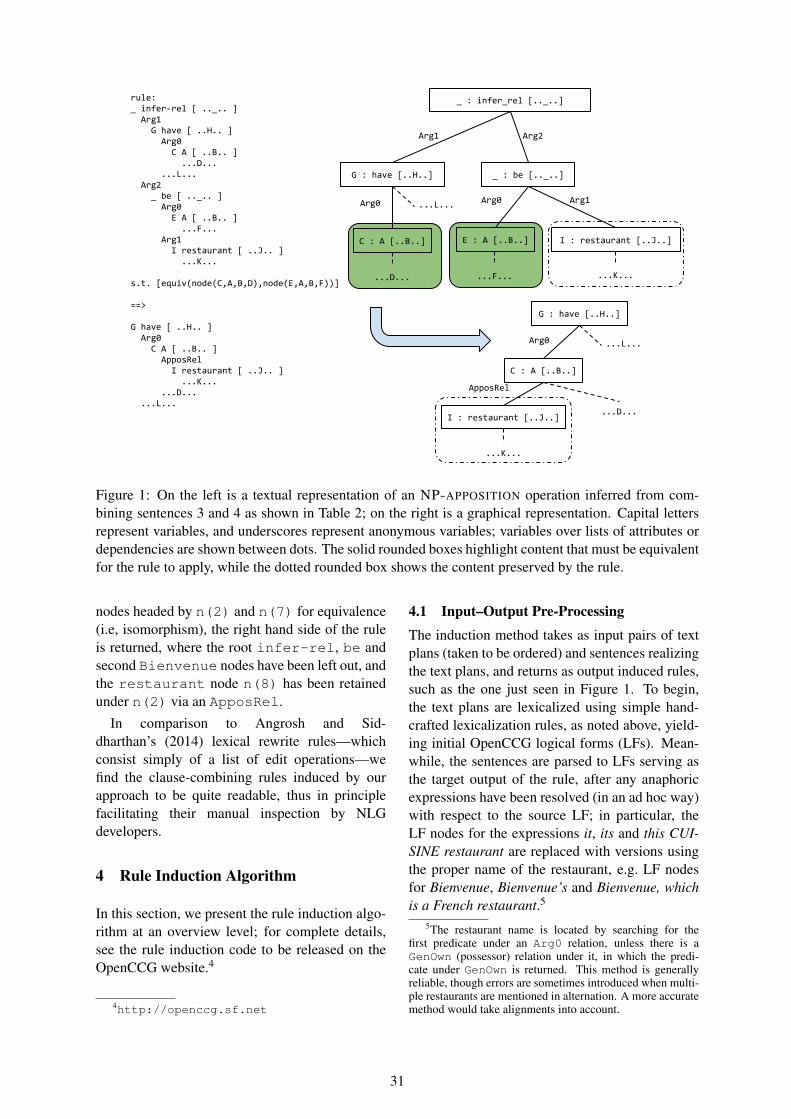
...L...
rule:_ infer-rel [ .._.. ] Arg1 G have [ ..H.. ] Arg0 C A [ ..B.. ] ...D... ...L... Arg2 _ be [ .._.. ] Arg0 E A [ ..B.. ] ...F... Arg1 I restaurant [ ..J.. ] ...K...
s.t. [equiv(node(C,A,B,D),node(E,A,B,F))]
==>
G have [ ..H.. ] Arg0 C A [ ..B.. ] ApposRel I restaurant [ ..J.. ] ...K... ...D... ...L...
_ : infer_rel [.._..]
G : have [..H..] _ : be [.._..]
C : A [..B..] E : A [..B..]
Arg1
Arg0 Arg0
Arg2
...D... ...F...
I : restaurant [..J..]
...K...
...L...
G : have [..H..]
C : A [..B..]
Arg0
...D...I : restaurant [..J..]
...K...
Arg1
ApposRel
Figure 1: On the left is a textual representation of an NP-APPOSITION operation inferred from com-bining sentences 3 and 4 as shown in Table 2; on the right is a graphical representation. Capital lettersrepresent variables, and underscores represent anonymous variables; variables over lists of attributes ordependencies are shown between dots. The solid rounded boxes highlight content that must be equivalentfor the rule to apply, while the dotted rounded box shows the content preserved by the rule.
nodes headed by n(2) and n(7) for equivalence(i.e, isomorphism), the right hand side of the ruleis returned, where the root infer-rel, be andsecond Bienvenue nodes have been left out, andthe restaurant node n(8) has been retainedunder n(2) via an ApposRel.
In comparison to Angrosh and Sid-dharthan’s (2014) lexical rewrite rules—whichconsist simply of a list of edit operations—wefind the clause-combining rules induced by ourapproach to be quite readable, thus in principlefacilitating their manual inspection by NLGdevelopers.
4 Rule Induction Algorithm
In this section, we present the rule induction algo-rithm at an overview level; for complete details,see the rule induction code to be released on theOpenCCG website.4
4http://openccg.sf.net
4.1 Input–Output Pre-Processing
The induction method takes as input pairs of textplans (taken to be ordered) and sentences realizingthe text plans, and returns as output induced rules,such as the one just seen in Figure 1. To begin,the text plans are lexicalized using simple hand-crafted lexicalization rules, as noted above, yield-ing initial OpenCCG logical forms (LFs). Mean-while, the sentences are parsed to LFs serving asthe target output of the rule, after any anaphoricexpressions have been resolved (in an ad hoc way)with respect to the source LF; in particular, theLF nodes for the expressions it, its and this CUI-SINE restaurant are replaced with versions usingthe proper name of the restaurant, e.g. LF nodesfor Bienvenue, Bienvenue’s and Bienvenue, whichis a French restaurant.5
5The restaurant name is located by searching for thefirst predicate under an Arg0 relation, unless there is aGenOwn (possessor) relation under it, in which the predi-cate under GenOwn is returned. This method is generallyreliable, though errors are sometimes introduced when multi-ple restaurants are mentioned in alternation. A more accuratemethod would take alignments into account.
31

Input dependency graph for Bienvenue has verygood service. Bienvenue is a French restaurant.n(0) infer-rel
Arg1n(1) have [ mood=dcl tense=pres ]
Arg0n(2) Bienvenue [ num=sg ]
Arg1n(3) service [ det=nil num=sg ]
Modn(4) goodMod
n(5) veryArg2n(6) be [ mood=dcl tense=pres ]
Arg0n(7) Bienvenue [ num=sg ]
Arg1n(8) restaurant [ num=sg ]
Detn(9) a
Modn(10) French [ num=sg ]
Output dependency graph for Bienvenue, a Frenchrestaurant, has very good service.n(1) have [ mood=dcl tense=pres ]
Arg0n(2) Bienvenue [ num=sg ]
ApposReln(8) restaurant [ num=sg ]
Detn(9) a
Modn(10) French [ num=sg ]
Arg1n(3) service [ det=nil num=sg ]
Modn(4) good
Modn(5) very
Figure 2: Example input–ouput dependencygraphs for NP-APPOSITION clause-combiningrule
The next step is to align the nodes of the in-put and output LFs. We have found that a sim-ple greedy alignment routine works reliably withthe SRC, where nodes with unique lexical matchesare aligned first, and then the remaining nodes aregreedily aligned according to the number of par-ent and child nodes already aligned. After align-ment, the parts of the output LF corresponding toeach sentence are rebracketed to better match thegrouping in the input LF (revising an initial right-branching structure). To rebracket the sentence-level LFs, the adjacent pair of LFs whose alignednodes in the source LF have the minimum pathdistance is iteratively grouped together under anINFER relation until the structure has a single root.
4.2 Edit Analysis and Rule Construction
Following alignment and sentence-level rebrack-eting, the difference between the input and out-put dependency graphs is calculated, in terms of
Input dependency graph for Mangia has very goodfood quality. Mangia has decent decor.n(0) infer-relArg1n(1) have [ mood=dcl tense=pres ]Arg0n(2) Mangia [ num=sg ]
Arg1n(3) quality [ det=nil num=sg ]Modn(4) food [ num=sg ]
Modn(5) goodModn(6) very
Arg2n(7) have [ mood=dcl tense=pres ]Arg0n(8) Mangia [ num=sg ]
Arg1n(9) decor [ det=nil num=sg ]Modn(10) decent
Output dependency graph for Mangia has verygood food quality, with decent decor.n(1) have [ mood=dcl tense=pres ]Arg0n(2) Mangia [ num=sg ]
Arg1n(3) quality [ det=nil num=sg ]Modn(4) food [ num=sg ]
Modn(5) goodModn(6) very
Modn(11) with [ emph-final=+ ]Arg1n(9) decor [ det=nil num=sg ]Modn(10) decent
Figure 3: Example input–ouput dependencygraphs for WITH-REDUCTION clause-combiningrule
inserted/deleted nodes, relations and attributes.Next, these edits are analyzed to determinewhether any equivalent nodes have been factoredout—that is, whether a node that is isomorphic toanother one in the input has been removed. For ex-ample, in Figure 1, nodes C and E are derived fromthe isomorphic nodes for the restaurant name NPs,with node E left out of the output.
Based on the edit analysis, one of four gen-eral kinds of clause-combining rules may be in-ferred: two kinds of aggregation rules, one involv-ing a shared argument and one a shared predica-tion, as well as two kinds of rules for adding dis-course connectives based on discourse relations,one where clausal LFs are combined, and anotherwhere a connective is inserted into the second LF.The kinds of rules for discourse connectives cor-respond directly to those in SPaRKy; for aggrega-tion, shared predication rules correspond to oper-
32

rule:_ one_of(_,[infer-rel,justify-rel]) [ .._.. ]
Arg1G H [ ..I.. ]
Arg0C A [ ..B.. ]
...D......N...
Arg2_ have [ .._.. ]
Arg0E A [ ..B.. ]
...F...Arg1J K [ ..L.. ]
...M...
s.t. [equiv(node(C,A,B,D),node(E,A,B,F))]
==>
G H [ ..I.. ]Arg0C A [ ..B.. ]
...D...Mod_ with [ emph-final=+ ]
Arg1J K [ ..L.. ]
...M......N...
Figure 4: Inferred WITH-REDUCTION clause-combining rule with generalized lexical con-straints
ations of the MERGE kind, with shared argumentrules accounting for the rest.
To keep the rule induction straightforward, ex-actly one node is required to have been factoredout with the aggregation rules, while with the dis-course connective rules, the edits must be local-ized to the level directly below the triggering dis-course relation. When these conditions are satis-fied, an induced rule is constructed based on theedits and any applicable constraints. First, theleft hand side of the rule is constructed so thatit matches any deleted nodes, attributes and rela-tions, as well as the path to both the factored outnode (if any), the one it is equivalent to, and theparents of any inserted nodes. Along the way, lexi-cal predicates are included as requirements for therule to match, except in the case of factored outnodes, where it is assumed that the lexical predi-cate does not matter. Next, the right hand side ofthe rule is constructed, leaving out any matchednodes, attributes or relations to be deleted, whileadding any nodes, attributes or relations to beinserted. Finally, any applicable constraints areadded to the rule. (Though both kinds of aggrega-tion rules are triggered off of factored out nodes,shared predication rules actually involve a strongerconstraint, namely that all but one argument of apredicate be equivalent.)
4.3 Constraints and Generalization
The constraints included in the aggregation rulesare essential for their accurate application, asnoted earlier. For example, in the absence ofthe shared argument constraint for an inferredRELATIVE-CLAUSE rule, adjacent clauses for So-nia Rose has good service and Bienvenue hasvery good service could be mistakenly com-bined into Sonia Rose, which has very good ser-vice, has good service, as nothing would checkwhether Sonia Rose and Bienvenue were equiv-alent. The lexical predicate constraints are alsoessential, for example to ensure that only have-predications are reduced to with-phrases, and thatonly be-predications are eligible to become NP-appositives.
After a first pass of rule induction, the rules aregeneralized by combining rules that differ only ina lexical predicate, and if a sufficient number oflexical items has been observed (three in our ex-periments here), the lexical constraint is removed,much as in Angrosh and Siddharthan’s (2014)approach. For example, the rule in Figure 4—induced from the input–output pair in Figure 3 andothers like it—has been generalized to work witheither the infer-rel or contrast-rel rela-tions, and the predication for the first argument ofthe relation (H) has been generalized to apply toany predicate.
4.4 Rule Interaction During Learning
Since evidence for a rule may not always be di-rectly available in an input–output pair that illus-trates the effect of that rule alone, rule induction isalso attempted from all subgraphs of the input andoutput that are in an appropriate configuration—namely, where either the roots of the source andtarget subgraphs are aligned, or where at least onechild node of the root of the source subgraph isaligned with the root of the target subgraph or oneof its children.
Inducing rules from subgraphs in this way is anoisy process that can yield bad rules, that is, onesthat mistakenly delete or insert nodes for words:nodes can be mistakenly deleted when the tar-get subgraph is missing nodes supplying propo-sitional content in the source, while nodes can bemistakenly inserted if they supply extra proposi-tional content not present in the source rather thandiscourse connectives or function words, as in-tended. An example bad deletion rule appears in
33

rule:_ quality [ .._.. ]
DetE A [ ..B.. ]
...F...ModG among [ ..H.. ]
Arg1I restaurant [ ..J.. ]
DetC A [ ..B.. ]...D...
...K......L...
Mod_ best [ .._.. ]
Mod_ overall [ .._.. ]
s.t. [equiv(node(C,A,B,D),node(E,A,B,F))]
==>
G among [ ..H.. ]Arg1I restaurant [ ..J.. ]
DetC A [ ..B.. ]
...D......K...
...L...
Figure 5: An undesirable rule that mistakenly re-duces the best overall quality among the selectedrestaurants to among the selected restaurants, in-duced from LF subgraphs for these phrases
Figure 5. Another common cause of bad rulesis errors in parsing the target sentences, espe-cially longer ones. To lessen the prevalence ofbad induced rules, we take inspiration from workon learning semantic parsers (Kwiatkowksi et al.,2010; Artzi and Zettlemoyer, 2013) and embed theprocess of inducing clause-combining rules withina process of learning a model of preferred deriva-tions that use the induced rules. The model islearned using the structured averaged perceptronalgorithm (Collins, 2002), with indicator featuresfor each rule used in deriving an output LF fromand input LF. With each input–output pair, the cur-rent model is used to generate the highest-scoringoutput LF using a bottom-up beam search. If thehighest-scoring output LF is not equal to the tar-get LF, then the search is run again to find thehighest-scoring derivation of the target LF, usingthe distance to the target to help guide the search.When the target LF can be successfully derived,a perceptron update is performed, adjusting theweights of the current model by adding the fea-tures from the target LF derivation and subtractingthe ones from the highest-scoring non-target LF.At the end of all training epochs, the parametersfrom the final model and all the intermediate mod-els are averaged, which approximates the margin-
For input–output pairs satisfying increasing sizelimits:
1. Direct Epoch Starting with an empty model,clause-combining rules are induced directlyfrom input–output pairs.
2. Generalization The current set of rules isgeneralized and the training examples are re-visited to update the weights for the newlyadded rules. Subsumed rules are removed,and the initial weight of the generalized ruleis set to the maximum weight of the sub-sumed rules.
3. Subgraphs Epoch Rules are induced fromall applicable subgraphs of the input–outputpairs.
4. Generalization As above.
5. Partial Epoch For any examples where thetarget LF cannot be generated with the cur-rent ruleset, rules are induced from an n-bestlist of partially completed outputs paired withthe target LF.
6. Generalization As above.
7. Pruning After switching to the final aver-aged model, any rules not used in the highest-scoring derivation of an example are pruned.
Figure 6: Algorithm Summary
maximizing voted perceptron algorithm.It is often the case that desired rules cannot be
induced either directly from an input–output pairor from their subgraphs: instead, other learnedrules need to be applied to the input before the ex-ample illustrates the desired step.6 Accordingly,for input–output pairs that cannot be derived withthe current set of rules, we generate an n-best listof outputs and then attempt to induce a rule bypairing each partially complete output with the tar-get LF as an input–output pair.
6Consider a text realizing the same content as (1) and (2)in addition to the content in Sonia Rose is an Italian restau-rant. A single sentence realization of this content is SoniaRose, an Italian restaurant, has good decor and good ser-vice. In order to learn NP-APPOSITION from this input–output pair, the system must first have learned and applieda MERGE rule to (1) and (2) so that the structures are suffi-ciently parallel for inference to proceed.
34

4.5 Staged LearningA summary of the rule induction algorithm ap-pears in Figure 6. In the outermost loop, the al-gorithm is run over input–output pairs that meet agiven size limit on the output LF, with this limitincreasing with each iteration. Since during devel-opment we found that rules induced (i) directly,(ii) from subgraphs and (iii) from partially com-pleted inputs were of decreasing reliability, suchrules are induced in separate training epochs inthat order. A final pruning step removes any rulesnot used in the highest-scoring derivation of aninput–output pair, using the averaged model. Thepruning step is expected to remove most of thebad rules involving undesirable node insertions ordeletions, as they are typically downweighted bythe perceptron updates.
5 Evaluation
5.1 Data preparationWe convert the text plans used in Walker et al.(2007) to a more concise logical representation asdescribed in Section 3.
Using OpenCCG’s broad-coverage grammar,we then parse the SRC realizations correspond-ing to these text plans, resulting in one LF foreach sentence in the SRC. Since nearly all realiza-tions in the SRC include multiple sentences, thisresults in multiple LFs for each. In order to com-bine these sentence-level LFs into a single sen-tence plan LF (SENTLF), we impose an initial bi-nary right-branching structure over the LFs andlabel the resulting superstructure nodes with theinfer-rel predicate. As noted in Section 4, theinitial right-branching structure is subsequently re-bracketed to better match the rhetorical structurein the of the text plan LF (TPLF).
5.2 Dev, Training, and Test SplitsWe limit our attention to realizations in the SRCcontaining 5 or fewer sentences and only one sub-ject per sentence.7 Of the 1,760 sparky pairs in theSRC, we used a set of 73 sparky pairs for develop-ment, defining a sparky pair as the TPLF–SENTLFpair corresponding to a single sparky alternative.These pairs were used primarily for debugging andtesting and are not used further in the evaluation.
7The only multi-subject sentences in the SRC are of theform, “Restaurant A, (Restaurant B, ...,) and Restaurant Noffer exceptional value among the selected restaurants” anddo not add to the variety of clause-combining operations ofinterest to us.
0
5
10
15
20
1 2 3 4 5 6 7 8 9 10Increment
Cou
nt
Quality
good
over
bad
Figure 7: Manual evaluation of the quality of thetop 20 rules as good, overspecified (but still valid)or bad, for training increments of increasing size
We use 700 sparky pairs for the training and testsets and reserve the remaining sparky pairs for fu-ture work. The training set consists of 200 sparkypairs used for rule induction, where we incremen-tally add 20 pairs at a time to the training set toevaluate how much training data is necessary forour approach to work. The test set consists of 500sparky pairs for use in evaluating the coverage ofthe rules inferred during training.
5.3 Quality of Learned Rules
In our first evaluation we evaluate the rate of ruleacquisition. We present the algorithm first with20 sparky pairs and then add an additional 20sparky pairs in each iteration, resulting in 10 setsof learned rules to compare to each other. Thisallows us to see how well new data allows the al-gorithm to generalize the induced rules.
To evaluate the quality of the learned rules, weconducted a manual evaluation of the top 20 rulesas ranked by the perceptron model. We report theproportion of these rules rated as good, overspeci-fied (more specific than desired, but still valid) orbad in Figure 7. As the figure shows, the propor-tion of good rules increases relative to the over-specified ones, with the proportion of bad rules re-maining low. With the full training set, a total of46 rules are learned, almost equally split betweengood, overspecified and bad (15/17/14, resp.).
In examining the learned rules, we observe thatthe learning algorithm manages to diminish thenumber of highly-ranked bad rules with spuriouscontent changes, as these only infrequently con-tribute towards deriving a target LF. However, thepresence of bad rules owing to parse errors per-sists, as certain parse errors occur with some reg-ularity. As such, in future work we plan to investi-
35
gate whether learning from n-best parses can man-age to better work around erroneous parses.
5.4 CoverageThe first question of coverage is straighforward:do the rules we learn recover all of the typesof clause-combining operations used by SPaRKy?Manual evaluation reveals good coverage forall five kinds of clause-combining operations inthe top 20 rules of the final model. WITH-REDUCTION, MERGE, CUE-WORD-INSERTION,and CUE-WORD-CONJUNCTION (for all connec-tives in the corpus) are covered by good rules,i.e. ones that are comparable in quality to thekind we might write by hand. In addition tothese good rules, WITH-REDUCTION and CUE-WORD-CONJUNCTION are also represented in sev-eral overspecified rules. RELATIVE-CLAUSE isonly represented by overspecified rules.8
Additionally, in order to assess the extent towhich the learned rules cover the contexts wherethe SPaRKy clause-combining operations can beapplied in the SRC, we also applied the final setof learned rules to all of the input TPLFs in thetest set. The test set contained 453 usable inputpairs,9 of which we were able to exactly repro-duce 229 using the inferred rules. Naturally, we donot expect 100% coverage here as the test set willalso contain some LFs suffering from parse errors,though this coverage level suggests our methodwould benefit from a larger training set. Impor-tantly, applying the learned rules to the test set in-put generated 19,058 possible sentLFs (or 40 out-put LFs per input LF, on average), a sufficientlylarge number for a sentence plan ranker to learnfrom.
5.5 Experimenting with otherclause-combining operations
Using a single-stage version of the algorithm,we also examined its capabilities with respect tolearning clause-combining operations not presentin the SRC. To create training examples, we cre-ated 167 input pairs based on TPLFS from the SRC
8Naturally elements of these rules are also present in someof the genuinely bad rules that remain in the final model.Even in these bad rules, however, the operations are appro-priately constrained: WITH- REDUCTION is predicated on theuse of have and CUE-WORD-INSERTION of on the other handon the use of contrast-rels and of since on the use ofjustify-rels.
9Of the original 500 pairs, we excluded 29 pairs largerthan the maximum size used in our staged learning, as wellas 18 pairs where the target realization could not be parsed.
using set of 16 hand-crafted rules including all theclause-combining operations pictured in Table 2.From these 167 pairs the algorithm induced 22clause-combining operations, fully covering the16 hand-crafted rules with some overspecification.Importantly, this preliminary finding suggests thatdevelopers can use this system to acquire a largervariety of clause-combining operations than thoserepresented in the SRC with less need for exten-sive knowledge engineering.
6 Conclusions and Future Work
We have presented a clause-combining rule in-duction method that learns how to rewrite lexico-semantic dependency graphs in ways that go be-yond current end-to-end NLG learning methods(Angeli et al., 2010; Konstas and Lapata, 2013),an important step towards ameliorating the knowl-edge acquisition bottleneck for NLG systems thatproduce texts with rich discourse structures. Fu-ture work will evaluate the system on multipledomains and push into the realm of robust, si-multaneous induction of lexicalization, clause-combining and referring expression rules.
Acknowledgments
We thank the anonymous reviewers and the OSUClippers Group for their helpful feedback and dis-cussion. Supported in part by NSF grants IIS-1143635 and IIS-1319318 and by DFG SFB 1102.
ReferencesGabor Angeli, Percy Liang, and Dan Klein. 2010. A
simple domain-independent probabilistic approachto generation. In Proc. of the 2010 Conference onEmpirical Methods in Natural Language Process-ing, pages 502–512, Cambridge, MA, October.
Mandya Angrosh and Advaith Siddharthan. 2014.Text simplification using synchronous dependencygrammars: Generalising automatically harvestedrules. In Proc. of the 8th International Natu-ral Language Generation Conference, pages 16–25,Philadelphia, Pennsylvania, USA, June.
Yoav Artzi and Luke Zettlemoyer. 2013. Weakly su-pervised learning of semantic parsers for mappinginstructions to actions. TACL, 1:49–62.
Regina Barzilay and Mirella Lapata. 2005. Collectivecontent selection for concept-to-text generation. InProc. of Human Language Technology Conferenceand Conference on Empirical Methods in NaturalLanguage Processing (HLT/EMNLP), pages 331–338, Vancouver.
36

Trevor Cohn and Mirella Lapata. 2013. An abstractiveapproach to sentence compression. ACM Transac-tions on Intelligent Systems and Technology, 4(3):1–35.
Michael Collins. 2002. Discriminative training meth-ods for hidden Markov models: theory and experi-ments with perceptron algorithms. In Proc. of the2002 Conference on Empirical Methods in NaturalLanguage Processing.
Nina Dethlefs, Helen Hastie, Heriberto Cuayahuitl, andOliver Lemon. 2013. Conditional random fields forresponsive surface realisation using global features.In Proc. of the 51st Annual Meeting of the Associa-tion for Computational Linguistics, volume 1, pages1254–1263, Sofia, Bulgaria.
Pablo A. Duboue and Kathleen R. McKeown. 2001.Empirically estimating order constraints for contentplanning in generation. In Proc. of 39th AnnualMeeting of the Association for Computational Lin-guistics, pages 172–179, Toulouse, France, July.
Dominic Espinosa, Michael White, and Dennis Mehay.2008. Hypertagging: Supertagging for surface real-ization with CCG. In Proc. of the 46th Annual Meet-ing of the Association for Computational Linguis-tics: Human Language Technologies, pages 183–191, Columbus, Ohio, June.
David M Howcroft, Crystal Nakatsu, and MichaelWhite. 2013. Enhancing the expression of con-trast in the SPaRKy Restaurant Corpus. In Proc. ofthe 14th European Workshop on Natural LanguageGeneration.
Ravi Kondadadi, Blake Howald, and Frank Schilder.2013. A statistical nlg framework for aggregatedplanning and realization. In Proc. of the 51st An-nual Meeting of the Association for ComputationalLinguistics, volume 1, pages 1406–1415, Sofia, Bul-garia.
Ioannis Konstas and Mirella Lapata. 2013. A globalmodel for concept-to-text generation. Journal of Ar-tificial Intelligence Research, 48:305–346.
Tom Kwiatkowksi, Luke Zettlemoyer, Sharon Goldwa-ter, and Mark Steedman. 2010. Inducing probabilis-tic CCG grammars from logical form with higher-order unification. In Proc. of the 2010 Conferenceon Empirical Methods in Natural Language Pro-cessing.
Wei Lu, Hwee Tou Ng, and Wee Sun Lee. 2009. Nat-ural language generation with tree conditional ran-dom fields. In Proc. of the 2009 Conference on Em-pirical Methods in Natural Language Processing,pages 400–409, Singapore.
Francois Mairesse and Steve Young. 2014. Stochas-tic language generation in dialogue using fac-tored language models. Computational Linguistics,40(4):763–799.
Crystal Nakatsu and Michael White. 2010. Generat-ing with discourse combinatory categorial grammar.Language Issues in Language Technology, 4(1):1–62.
Shimei Pan and James Shaw. 2004. Segue: A hybridcase-based surface natural language generator. InProc. of the 3rd International Conference of Natu-ral Language Generation, pages 130–140, Brocken-hurst, UK.
Rajakrishnan Rajkumar and Michael White. 2014.Better surface realization through psycholinguistics.Language and Linguistics Compass, 8(10):428–448.
Ehud Reiter and Robert Dale. 2000. Building natu-ral generation systems. Studies in Natural LanguageProcessing. Cambridge University Press.
Ehud Reiter. 2010. Natural language generation. InAlexander Clark, Chris Fox, and Shalom Lappin,editors, The Handbook of Computational Linguisticsand Natural Language Processing, Blackwell Hand-books in Linguistics, chapter 20. Wiley-Blackwell.
Amanda Stent and Martin Molina. 2009. Evaluatingautomatic extraction of rules for sentence plan con-struction. In Proc. of the SIGDIAL 2009 Confer-ence, pages 290–297, London, UK.
Marilyn A. Walker, S. Whittaker, Amanda Stent,P. Maloor, J. Moore, M. Johnston, and G. Vasireddy.2004. Generation and evaluation of user tailored re-sponses in multimodal dialogue. Cognitive Science,28(5):811–840, October.
Marilyn Walker, Amanda Stent, Francois Mairesse, andRashmi Prasad. 2007. Individual and domain adap-tation in sentence planning for dialogue. Journal ofArtificial Intelligence Research, 30:413–456.
Michael White and Rajakrishnan Rajkumar. 2009.Perceptron reranking for CCG realization. In Proc.of the 2009 Conference on Empirical Methods inNatural Language Processing, pages 410–419, Sin-gapore, August.
Michael White and Rajakrishnan Rajkumar. 2012.Minimal dependency length in realization ranking.In Proc. of the 2012 Joint Conference on EmpiricalMethods in Natural Language Processing and Com-putational Natural Language Learning, pages 244–255, Jeju Island, Korea, July.
Michael White, Robert AJ Clark, and Johanna DMoore. 2010. Generating tailored, comparative de-scriptions with contextually appropriate intonation.Computational Linguistics, 36(2):159–201.
Kristian Woodsend and Mirella Lapata. 2011. Learn-ing to simplify sentences with quasi-synchronousgrammar and integer programming. In Proc. of the2011 Conference on Empirical Methods in NaturalLanguage Processing, pages 409–420, Edinburgh,Scotland, UK.
37
Proceedings of the 15th European Workshop on Natural Language Generation (ENLG), pages 38–47,Brighton, September 2015. c©2015 Association for Computational Linguistics
Reading Times Predict the Quality of Generated Text Above and BeyondHuman Ratings
Sina Zarrieß Sebastian Loth David SchlangenBielefeld UniversityUniversitatsstraße 25
33615 Bielefeld, Germany{sina.zarriess,sebastian.loth,david.schlangen}@uni-bielefeld.de
AbstractTypically, human evaluation of NLG output isbased on user ratings. We collected ratings andreading time data in a simple, low-cost exper-imental paradigm for text generation. Partic-ipants were presented corpus texts, automati-cally linearised texts, and texts containing pre-dicted referring expressions and automatic lin-earisation. We demonstrate that the readingtime metrics outperform the ratings in classi-fying texts according to their quality. Regres-sion analyses showed that self-reported rat-ings discriminated poorly between the kindsof manipulation, especially between defects inword order and text coherence. In contrast,a combination of objective measures from thelow-cost mouse contingent reading paradigmprovided very high classification accuracy andthus, greater insight into the actual quality ofan automatically generated text.
1 IntroductionEvaluating and comparing systems that produce naturallanguage text as output, such as natural language gen-eration (NLG) systems, is notoriously difficult. Manyaspects of linguistic well-formedness and naturalnessplay a role for assessing the quality of an automati-cally generated text. On the sentence-level, this in-cludes grammatical and morpho-syntactic correctness,lexical meaning, fluency, and stylistic appropriateness.On the text-level, further criteria related to coherence,text structure, and content should be considered. Oneof the most widely applied and least controversial NLGevaluation methods is to collect human ratings. Hu-man ratings have been used for system comparison ina number of NLG shared tasks (Gatt and Belz, 2010;Belz et al., 2011), for validating other automatic evalu-ation methods in NLG (Reiter and Belz, 2009; Cahill,2009; Elliott and Keller, 2014), and for training statis-tical components of NLG systems (Stent et al., 2004;Mairesse and Walker, 2011; Howcroft et al., 2013).
When no extrinsic tasks or factors for evaluating anNLG system are available, human judges are typicallyasked to rate the quality of texts or sentences accord-ing to several linguistic criteria, such as ‘A: how fluentis the text?’ and ‘B: how clear and understandable is
the text?’ (e.g. (Belz et al., 2011)). This is a hard andunnatural task for most naive users, and can be non-trivial even for experts: raters have to reflect on anddifferentiate between detailed, linguistic aspects of textquality, and assign scores precisely and systematicallyacross a set of generated outputs that potentially con-tain various types of linguistic defects. The rating taskturns increasingly difficult if they have to compare textswith multiple sentences and multiple types of linguisticdefects, e.g. fluency on the sentence level, clarity andcoherence on the text level. Consequently, low agree-ment between raters, and even inconsistencies betweenratings of the same human judge have been found inprevious studies (Belz and Kow, 2010; Cahill and Forst,2010; Dethlefs et al., 2014). Standard evaluation meth-ods for, e.g. text summarisation tend to avoid possibleinteractions between local sentence-level and globaltext-level defects. Instead, they focus on coherence andcontent (Nenkova, 2006; Owczarzak et al., 2012). Inparticular, this is due to the fact that independently rat-ing coherence and clarity locally for each sentence andglobally for an entire text is tedious, unnatural, tiringand hardly achievable for human judges.
In other disciplines of linguistic research, a rangeof experimental paradigms have been established thatprovide more systematic and objective means to assesshuman text reading. In particular, psycholinguistic ap-proaches typically use objective measures such as read-ing times and eye movements to quantify how well hu-man readers can process a sentence. The advantageof these measures is that humans typically focus onreading the text. Importantly, they do not consciouslycontrol their eye movements. Longer reading times orcertain patterns of eye movements have been well as-sociated with difficulties that humans encounter whenreading text, e.g. apparent inconsistencies as gardenpath sentences (Christianson et al., 2001), and complexgrammatical constructs (Traxler et al., 2002).
This paper investigates whether more objective read-ing measures can be exploited for evaluating NLG sys-tems and systematically measuring text quality. How-ever, using eye tracking for evaluation purposes is morecostly than relying on ratings. Furthermore, most eyetracking studies used carefully designed stimuli to testa specific effect at a particular known position in a sen-tence. In sum, eye tracking is highly sensitive to pro-
38

cessing difficulties. But due the costly devices and ex-periments, it was - to the best of our knowledge - notapplied for evaluating comparably uncontrolled textsthat are typical in NLG.
Thus, we have developed and tested mouse con-tingent reading (MCR) for evaluating generated texts.This method combines the sensitivity of eye trackingwith the cost effectiveness of a rating study. The auto-matically generated texts are presented to human ratersin a sentence-by-sentence, mouse-contingent way suchthat a number of parameters of the reading process arerecorded, e.g. the time that people spent looking at sin-gle sentences and an entire text. We hypothesized thatthese parameters are more informative for the qualityof a text than the user ratings of clarity and fluency.
As objective criteria for text quality are hardly avail-able in NLG (Dale and Mellish, 1998; Hardcastle andScott, 2008), we did not compare reading times andratings on manual, potentially flawed annotations oftext quality. Instead, we selected experimental materialfrom a corpus-based generation framework that com-bines sentence-level linearisation and text-level refer-ring expression generation (Zarrieß and Kuhn, 2013).We based our study on a set of texts that were avail-able in 3 versions: (i) the “gold standard” corpus text,(ii) automatically linearised texts where word order de-viated from the original corpus and contained poten-tial fluency-related defects, (iii) texts with potential de-fects in referring expressions and linearisation whichare likely to deteriorate clarity or coherence on thediscourse level. We controlled the broad type of lin-guistic defects but not the details of each sentence ortext. We argue that an objective evaluation method forNLG should clearly distinguish coherence and surface-related aspects of text quality.
In our data, there is a single human-authored ver-sion of each text which is free of errors. We do notknow whether a deviation of the other versions is anerror or an acceptable alternative realisation. Thus, incontrast to typical eye tracking studies we do not aim atdetecting the effect of a particular type of error. Our as-sumption is more conservative: we expect that a set ofautomatically generated texts that deviates significantlyfrom a set of corpus texts on several levels of linguis-tic realisation (referring expressions and linearisation)has lower quality than texts that only deviate from thecorpus on a single level (linearisation). To further ac-commodate for the fact that we do not control the ex-act degree of acceptability of the potential defects, weadd a set of filler texts that we manually manipulated tocontain severe errors in coherence.
Based on the human ratings and MCR data collectedfor a set of automatically generated texts, we investi-gated whether a regression model can predict whichtypes of linguistic defects were present in the text readby the participant, i.e. which generation componentswere used to generate it. We find that it is possible toachieve a good prediction accuracy for text quality, de-
spite the fact that there is uncertainty with respect to theexact number and types of errors in the texts. However,the accuracy of the regression models varies consider-ably according to the type of predictors: Human rat-ings can hardly discriminate incoherent automaticallygenerated texts from original corpus texts and textscontaining defects in word order. A regression modelbased on reading time predictors achieved a very goodfit and largely outperformed the rating model in sepa-rating different levels of quality in NLG output. Thissuggests that some effects were not reliably reflectedin the subjective ratings that are consciously controlledand calculated by the participants. However, these ef-fects were accounted for by the objective reading mea-sures that are (mostly) outside of conscious control.
Section 2 provides background on research in NLGevaluation. Section 3 introduces our MCR paradigm.The generation framework we used to collect our ex-perimental material is presented in Section 4. Section5 describes the experimental design. The models arediscussed in Section 6.
2 Background on NLG Evaluation
In recent years, the NLG community has becomeincreasingly interested in comparative evaluation be-tween NLG systems (Gatt and Belz, 2010; Koller et al.,2010; Belz et al., 2011; Banik et al., 2013; Hastie andBelz, 2014). Generally, evaluation methods for assess-ing NLG systems fall into three main categories: 1) au-tomatic evaluation methods that compare system out-put against one or multiple reference texts, 2) humanevaluation methods where human readers are asked tojudge a text, typically with respect to several criteria. Ifthe NLG component is embedded in an end-to-end sys-tem, such as a dialogue system, 3) extrinsic factors oftask success and usefulness of the NLG output can bemeasured. For corpus-based NLG components such assurface realisers or referring expression generators, ex-trinsic factors cannot be assessed, but in this case, ref-erence or gold text outputs are often available. Langk-ilde (2002) first suggested to use automatic evaluationmeasures inspired from methods in machine transla-tion, such as BLEU (Papineni et al., 2002) or NIST(Doddington, 2002), that measure the n-gram overlapbetween the system and some reference text, sentenceor phrase. The advantage of such automatic and cheapevaluation methods can be enormous. If tightly inte-grated in the development cycle of an NLG system,they allow fast and empirically optimised implemen-tation decisions. In turn, a lot of research on NLG eval-uation focussed on defining and validating automaticevaluation measures. Such a metric is typically consid-ered valid if it correlates well with human judgementsof text quality (Stent et al., 2005; Foster, 2008; Reiterand Belz, 2009; Cahill, 2009; Elliott and Keller, 2014).However, automatic evaluation measures in NLG stillhave a range of known conceptual deficits, i.e. they donot reflect appropriateness of content (Reiter and Belz,
39
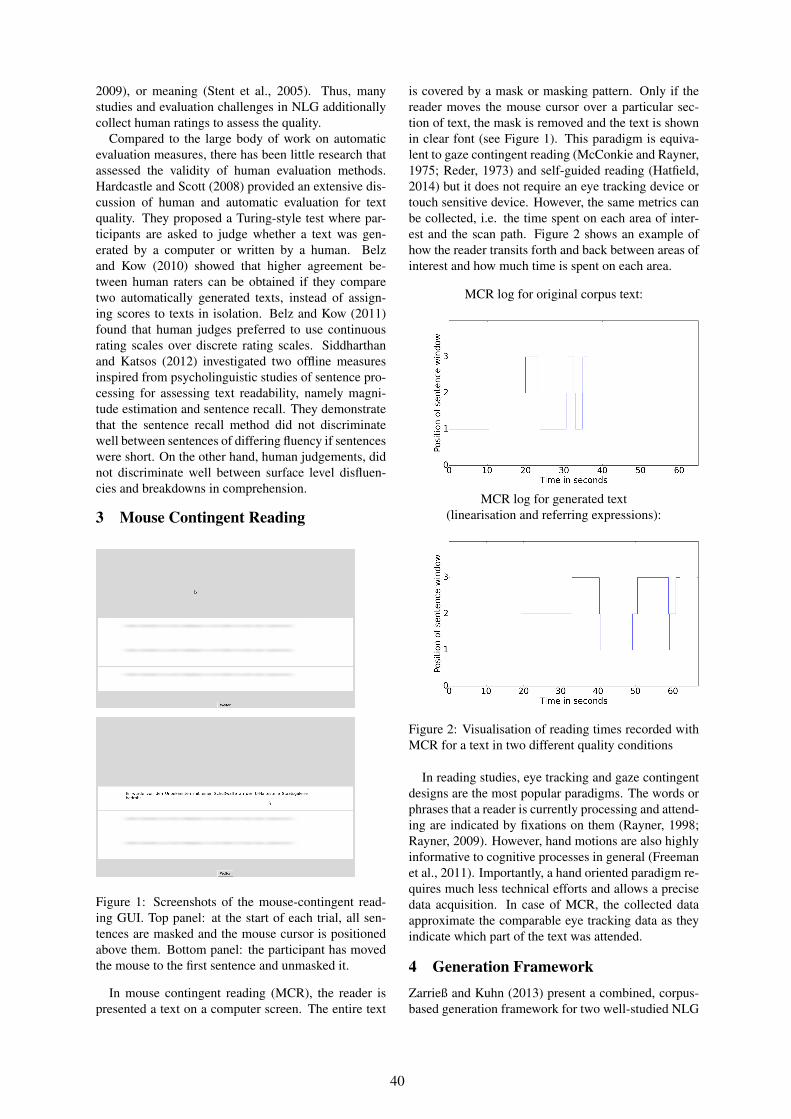
2009), or meaning (Stent et al., 2005). Thus, manystudies and evaluation challenges in NLG additionallycollect human ratings to assess the quality.
Compared to the large body of work on automaticevaluation measures, there has been little research thatassessed the validity of human evaluation methods.Hardcastle and Scott (2008) provided an extensive dis-cussion of human and automatic evaluation for textquality. They proposed a Turing-style test where par-ticipants are asked to judge whether a text was gen-erated by a computer or written by a human. Belzand Kow (2010) showed that higher agreement be-tween human raters can be obtained if they comparetwo automatically generated texts, instead of assign-ing scores to texts in isolation. Belz and Kow (2011)found that human judges preferred to use continuousrating scales over discrete rating scales. Siddharthanand Katsos (2012) investigated two offline measuresinspired from psycholinguistic studies of sentence pro-cessing for assessing text readability, namely magni-tude estimation and sentence recall. They demonstratethat the sentence recall method did not discriminatewell between sentences of differing fluency if sentenceswere short. On the other hand, human judgements, didnot discriminate well between surface level disfluen-cies and breakdowns in comprehension.
3 Mouse Contingent Reading
Figure 1: Screenshots of the mouse-contingent read-ing GUI. Top panel: at the start of each trial, all sen-tences are masked and the mouse cursor is positionedabove them. Bottom panel: the participant has movedthe mouse to the first sentence and unmasked it.
In mouse contingent reading (MCR), the reader ispresented a text on a computer screen. The entire text
is covered by a mask or masking pattern. Only if thereader moves the mouse cursor over a particular sec-tion of text, the mask is removed and the text is shownin clear font (see Figure 1). This paradigm is equiva-lent to gaze contingent reading (McConkie and Rayner,1975; Reder, 1973) and self-guided reading (Hatfield,2014) but it does not require an eye tracking device ortouch sensitive device. However, the same metrics canbe collected, i.e. the time spent on each area of inter-est and the scan path. Figure 2 shows an example ofhow the reader transits forth and back between areas ofinterest and how much time is spent on each area.
MCR log for original corpus text:
MCR log for generated text(linearisation and referring expressions):
Figure 2: Visualisation of reading times recorded withMCR for a text in two different quality conditions
In reading studies, eye tracking and gaze contingentdesigns are the most popular paradigms. The words orphrases that a reader is currently processing and attend-ing are indicated by fixations on them (Rayner, 1998;Rayner, 2009). However, hand motions are also highlyinformative to cognitive processes in general (Freemanet al., 2011). Importantly, a hand oriented paradigm re-quires much less technical efforts and allows a precisedata acquisition. In case of MCR, the collected dataapproximate the comparable eye tracking data as theyindicate which part of the text was attended.
4 Generation FrameworkZarrieß and Kuhn (2013) present a combined, corpus-based generation framework for two well-studied NLG
40

(Sentence) be
agentperp
modon
pobjtrial
modbecause
subattack
agentperp
themevictim
perp italians
two
men
the two
they <empty>
victim man
a young
victim
the
he <empty>
Figure 3: Example NLG input from (Zarrieß and Kuhn,2013): a non-linearised dependency structure with slotsfor REs and lists for candidate RE realisations
sub-tasks: referring expression generation in context(REG) and surface realisation (linearisation). Theirsystem generates texts from dependency-based inputsthat can be more or less specified. Figure 3 illustratesan example for a dependency-based input with under-specified referring expressions. The linearisation com-ponent of the system predicts the order of words, i.e.nodes in the dependency tree. The REG componentcomputes a ranking over candidate realisations for eachRE slot and inserts the top-ranked expression into thetree. Additionally, these NLG inputs are available ina more specified version, i.e. as non-linearised depen-dency trees containing the referring expressions fromthe original corpus text. In this case, the NLG task con-sists of linearisation only.
Compared to other text generation tasks, such as e.g.text summarisation, this NLG framework is more re-stricted. The order of sentences, lexical choice and ba-sic sentence structure are defined by the corpus-basedinput annotations. Our setting has two NLG compo-nents that can be switched on and off on demand. Weexploit this for obtaining automatically generated textthat differ in their quality. Thus, we use texts that havebeen generated from different components of the sys-tem. This approach is very similar to the idea of evalu-ating an NLG system in a architectural ablation mode,demonstrated in Callaway and Lester (2001).
The NLG inputs in Zarrieß and Kuhn (2013) wereobtained from manual RE annotations and automaticdependency annotations for a corpus of 200 Germannewspaper articles. The texts are short reports on rob-beries as they can be found in the local newspaper.Thus, they all describe similar events between two ref-erents (a victim and a perpetrator). The RE annotationsalso contain implicit mentions of victim and perpetratorreferents in particular syntactic contexts (such as pas-sives, or coordinations). Therefore, the RE component
can delete REs that were realised in the original text, orintroduce REs that were originally implicit.
Table 1 shows an example from the original corpustext and an automatically generated version by the sys-tem. Please note that neither gold nor generated textscontain punctuation. Since the system does not predictpunctuation, this was removed from the original texts.Furthermore, the automatically generated text deviatesfrom the original corpus text in a range of linearisationand REG decisions. These deviations are not necessar-ily ungrammatical or incoherent (as e.g. the predictedRE in the second sentence which is still understand-able and does not degrade coherence). On the otherhand, there can be sentences that are clearly miscon-strued such as the third sentence where ungrammaticalword order and incoherent or superfluous REs result inan unclear meaning of the sentence.
Thus, we controlled for the broad, expected level oftext quality, rather than applying a costly manual an-notation of error types present in the generated texts.As the focus of our study is on predicting defects intext quality that are due to clarity and fluency, we se-lected texts from Zarrieß and Kuhn (2013)’s data setwhere the linearisation and REs deviated from the orig-inal corpus texts. As a sanity check for our evaluationmetrics, we included the original corpus texts and fur-ther manipulated some of the generated texts such thattheir referring expressions would be very hard to re-solve and obscure the relation between two sentences.These texts were treated as fillers. Each generated textis available in two versions: a) generated by the lineari-sation and referring expression component containingdefects in the realisation of reference and word order,and b) generated by the linearisation component con-taining perfect referring expressions and potential de-fects in word order. This provided us a hierarchy oflevels of text quality. Linearisation mostly affects thefluency (and sometimes the grammaticality) on the sen-tence level, whereas wrong predictions of referring ex-pressions can result in incoherent transitions betweensentences which affects clarity on the text level.
5 ExperimentThis study tested human evaluation methods for textgeneration. We focussed on the problem of evaluatingNLG output formed of multiple sentences and detect-ing whether the user experienced difficulties in readingand understanding the text.
5.1 HypothesisIn evaluations of text generation, the quality of a texthas to be assessed on different levels of linguistic well-formedness including grammatical correctness, flu-ency, and intelligibility or clarity. Cases of miscon-strued texts are not just right or wrong but they vary ona scale from well-formed through understandable butyet difficult to read to unintelligible. Often, it is dif-ficult to pinpoint which components and decisions of
41

Original corpus text Automatically generated textAuf dem Weg von der U-Bahn-Haltestelle Dornbusch zuseiner Wohnung in Ginnheim ist ein 27jahriger in der Nachtzum Samstag uberfallen und ausgeraubt worden
Auf dem Weg von der U-Bahn-Haltestelle Dornbuschzu seiner Wohnung in Ginnheim in der Nacht zu Samstaguberfallen und ausgeraubt worden ist ein 27jahriger
On the way from the metro station Dornbusch to his apartment in Ginnheim, a 27-year-old has been attacked and robbedSaturday’s night
Der Tater hatte sein Opfer gegen 1.30 Uhr zunachst scheinbarharmlos nach der nachsten Telefonzelle gefragt
Der Tater hatte den 27jahrigen gegen 1.30 Uhr zunachstscheinbar harmlos nach der nachsten Telefonzelle gefragt
Around 1:30 o’clock, the perpetrator had asked his victim (the 27-year-old) for the next phone box in a seemingly harmlessway
Nachdem ihm diese an der Ecke Ernst-Schwendler-StraßePlatenstraße gezeigt worden war machte er kehrt und verfol-gte den 27jahrigen
Nachdem Platenstraße diese an der Ecke Ernst-Schwendler-Straße gezeigt ihm worden war er machte kehrt und verfolgteder Tater sein Opfer
After it had been shown to him on the corner Ernst-Schwendler street Platen street, he returned and (the perpetrator)followed the 27-year-old (the victim)
Table 1: Example corpus text and corresponding NLG output. Word order defects are underlined, generated REsthat differ from corpus REs are in bold face. The English translations do not show word order problems, butpredicted REs are given in brackets and bold face.
the NLG contributed to the well-formedness. In partic-ular, a single component can affect all levels of well-formedness, e.g. the realisation of word order can im-pair the readability and intelligibility of a text.
We expected that naıve participants would have diffi-culties in independently rating different aspects of textquality, e.g. clarity and fluency. We assumed that therating task would be even more tedious on the sentence-level such that we collected global user ratings for flu-ency and clarity. We hypothesised that the parametersof the reading process such as the time spent on indi-vidual sentences, and the transitions between sentenceswould be more objective, local measures and can atleast complement ratings of perceived quality. Thus,we recorded the reading parameters in our study andaimed to identify the links between ratings, reading pa-rameters and levels of text quality.
Suboptimal NLG decisions affect an entire sentenceor text. Thus, the MCR study was designed to assessthe well-formedness of larger units. We used threecomparably large areas of interest formed by each sen-tence of the texts. In contrast to typical reading studiesat the level of single sentence processing, the cursormotions were selectively recorded for transitions be-tween sentences. These transitions are most likely re-lated to measures at the text level that we were inter-ested in, i.e. clarity and fluency. Furthermore, the rat-ings of clarity and fluency were collected with regardsto the entire text.
5.2 Experimental SettingParticipants Thirty-three participants were recruitedfrom the department’s participant pool (including stu-dents and staff). They received e5 as well as candysweets in exchange for their time and effort.
Apparatus The participants were seated in front ofa typical office computer screen. A dedicated Pythonprogramme controlled the presentation of the stimuli,
recorded the reading times1 and mouse transitions, andcollected the ratings. The participants interacted withthe programme through a standard mouse and key-board.
Materials and Conditions From the set of NLG out-puts with potential defects in clarity and fluency, as de-scribed in Section 4, we randomly selected 16 texts. Asubset of twelve texts were presented in three condi-tions: a) the original corpus text without any defects(gold), b) automatically linearised texts that could in-clude defects in word order (lin), and c) automaticallylinearised texts with automatically generated referringexpressions, i.e. these texts could include defects inword order and referring expressions (sem). The re-maining four sentences were hand manipulated suchthey would be clearly distorted in terms of syntax, ref-erence and intelligibility (filler).
The critical texts were assigned to one of three listssuch that all lists contained four texts per condition andeach text occurred once per list. Additionally, all listsincluded the four filler items.
Procedure The participants were welcomed to thelab and handed a written consent form. If they agreedto take part in the study, the participants were handedwritten instructions asking them to read the texts dis-played on screen using the mouse and to rate them forclarity and fluency afterwards.
The session started with an additionally selectedpractice item to familiarise the participants with thedesign of the study. In the experimental session, the16 items were presented in random order. Each trialstarted as soon as the participant confirmed the ratingsto the previous item. The mouse cursor was positioned
1The reading times were approximated by measuring thedwell time of the mouse cursor on a sentence. This is equiv-alent to measuring the dwell time of the point of gaze in gazecontingent reading.
42
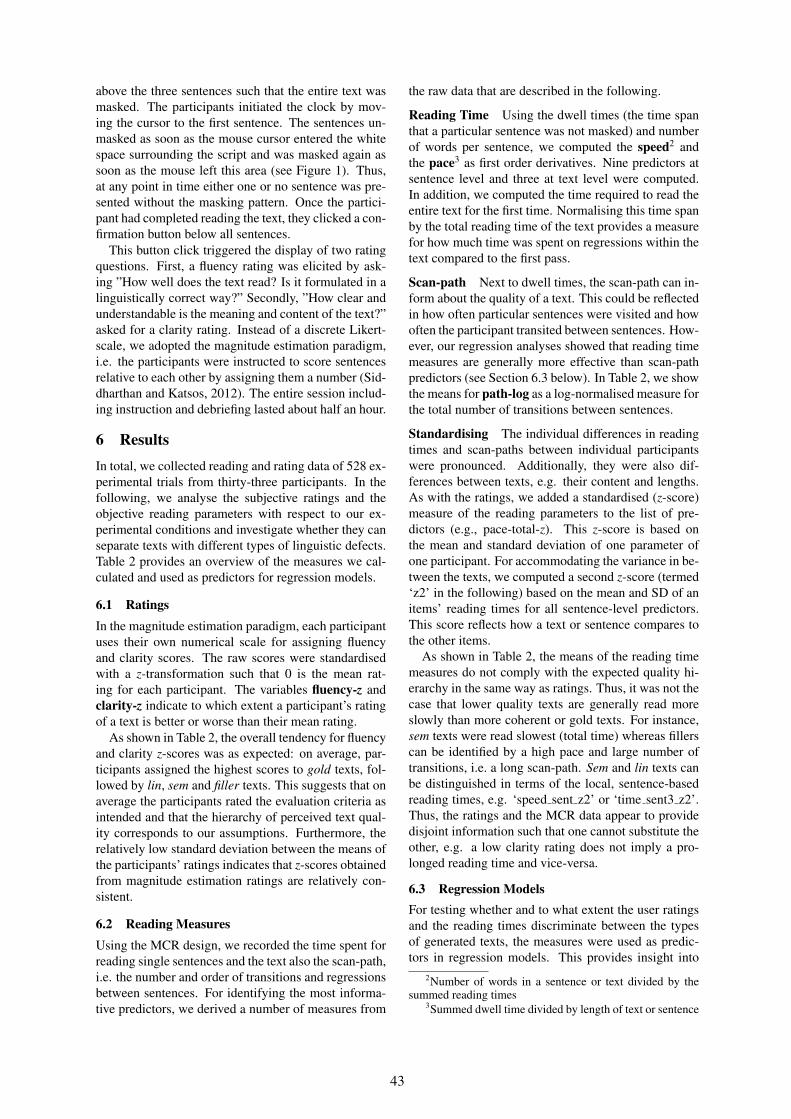
above the three sentences such that the entire text wasmasked. The participants initiated the clock by mov-ing the cursor to the first sentence. The sentences un-masked as soon as the mouse cursor entered the whitespace surrounding the script and was masked again assoon as the mouse left this area (see Figure 1). Thus,at any point in time either one or no sentence was pre-sented without the masking pattern. Once the partici-pant had completed reading the text, they clicked a con-firmation button below all sentences.
This button click triggered the display of two ratingquestions. First, a fluency rating was elicited by ask-ing ”How well does the text read? Is it formulated in alinguistically correct way?” Secondly, ”How clear andunderstandable is the meaning and content of the text?”asked for a clarity rating. Instead of a discrete Likert-scale, we adopted the magnitude estimation paradigm,i.e. the participants were instructed to score sentencesrelative to each other by assigning them a number (Sid-dharthan and Katsos, 2012). The entire session includ-ing instruction and debriefing lasted about half an hour.
6 ResultsIn total, we collected reading and rating data of 528 ex-perimental trials from thirty-three participants. In thefollowing, we analyse the subjective ratings and theobjective reading parameters with respect to our ex-perimental conditions and investigate whether they canseparate texts with different types of linguistic defects.Table 2 provides an overview of the measures we cal-culated and used as predictors for regression models.
6.1 RatingsIn the magnitude estimation paradigm, each participantuses their own numerical scale for assigning fluencyand clarity scores. The raw scores were standardisedwith a z-transformation such that 0 is the mean rat-ing for each participant. The variables fluency-z andclarity-z indicate to which extent a participant’s ratingof a text is better or worse than their mean rating.
As shown in Table 2, the overall tendency for fluencyand clarity z-scores was as expected: on average, par-ticipants assigned the highest scores to gold texts, fol-lowed by lin, sem and filler texts. This suggests that onaverage the participants rated the evaluation criteria asintended and that the hierarchy of perceived text qual-ity corresponds to our assumptions. Furthermore, therelatively low standard deviation between the means ofthe participants’ ratings indicates that z-scores obtainedfrom magnitude estimation ratings are relatively con-sistent.
6.2 Reading MeasuresUsing the MCR design, we recorded the time spent forreading single sentences and the text also the scan-path,i.e. the number and order of transitions and regressionsbetween sentences. For identifying the most informa-tive predictors, we derived a number of measures from
the raw data that are described in the following.
Reading Time Using the dwell times (the time spanthat a particular sentence was not masked) and numberof words per sentence, we computed the speed2 andthe pace3 as first order derivatives. Nine predictors atsentence level and three at text level were computed.In addition, we computed the time required to read theentire text for the first time. Normalising this time spanby the total reading time of the text provides a measurefor how much time was spent on regressions within thetext compared to the first pass.
Scan-path Next to dwell times, the scan-path can in-form about the quality of a text. This could be reflectedin how often particular sentences were visited and howoften the participant transited between sentences. How-ever, our regression analyses showed that reading timemeasures are generally more effective than scan-pathpredictors (see Section 6.3 below). In Table 2, we showthe means for path-log as a log-normalised measure forthe total number of transitions between sentences.
Standardising The individual differences in readingtimes and scan-paths between individual participantswere pronounced. Additionally, they were also dif-ferences between texts, e.g. their content and lengths.As with the ratings, we added a standardised (z-score)measure of the reading parameters to the list of pre-dictors (e.g., pace-total-z). This z-score is based onthe mean and standard deviation of one parameter ofone participant. For accommodating the variance in be-tween the texts, we computed a second z-score (termed‘z2’ in the following) based on the mean and SD of anitems’ reading times for all sentence-level predictors.This score reflects how a text or sentence compares tothe other items.
As shown in Table 2, the means of the reading timemeasures do not comply with the expected quality hi-erarchy in the same way as ratings. Thus, it was not thecase that lower quality texts are generally read moreslowly than more coherent or gold texts. For instance,sem texts were read slowest (total time) whereas fillerscan be identified by a high pace and large number oftransitions, i.e. a long scan-path. Sem and lin texts canbe distinguished in terms of the local, sentence-basedreading times, e.g. ‘speed sent z2’ or ‘time sent3 z2’.Thus, the ratings and the MCR data appear to providedisjoint information such that one cannot substitute theother, e.g. a low clarity rating does not imply a pro-longed reading time and vice-versa.
6.3 Regression ModelsFor testing whether and to what extent the user ratingsand the reading times discriminate between the typesof generated texts, the measures were used as predic-tors in regression models. This provides insight into
2Number of words in a sentence or text divided by thesummed reading times
3Summed dwell time divided by length of text or sentence
43

Filler Sem Lin Goldmean sd mean sd mean sd mean sd
Ratings fluency z -0.41 0.38 -0.32 0.50 -0.04 0.36 0.77 0.47clarity z -0.53 0.40 -0.18 0.49 0.17 0.36 0.54 0.51
Text RTs
pace total z 0.79 0.33 -0.22 0.64 -0.17 0.59 -0.40 0.65path log 2.29 0.42 2.04 0.41 2.10 0.37 2.14 0.43speed total z -0.44 0.12 0.22 0.79 0.07 0.81 0.15 0.87time total z 0.04 0.37 0.15 0.46 -0.09 0.49 -0.10 0.62time 1stpass z -0.29 0.36 0.30 0.49 0.09 0.48 -0.11 0.47
Sentence RTs
pace 1sent z2 0.00 0.79 -0.04 0.83 -0.02 0.75 0.06 0.75pace 2sent z2 -0.00 0.70 0.02 0.74 -0.01 0.64 -0.00 0.71pace 3sent z2 0.00 0.72 0.08 0.65 0.07 0.78 -0.15 0.60speed 1sent z2 -0.00 0.79 0.12 0.86 -0.10 0.71 -0.02 0.72speed 2sent z2 0.00 0.70 0.21 0.79 -0.10 0.64 -0.11 0.62speed 3sent z2 -0.00 0.72 0.19 0.63 0.01 0.72 -0.20 0.55time 1sent z2 -0.00 0.79 0.04 0.85 -0.06 0.73 0.02 0.74time 2sent z2 -0.00 0.70 0.12 0.77 -0.06 0.64 -0.06 0.67time 3sent z2 -0.00 0.72 0.15 0.65 0.03 0.76 -0.18 0.58
Table 2: Means and SD for ratings, text-based and sentence-based reading times. SD is computed on mean valuesper participant and indicates agreement/consistency between participants.
the type of relation between the text quality conditionson the one hand, and multiple evaluation metrics onthe other hand. The dependent variable of our mod-els was the text condition, with four possible values -filler, sem, lin or gold. We used hierarchical binary re-gression4 and we fitted three binary regression modelsthat iteratively distinguish a particular text type from aset of remaining texts. The hierarchy of the models cor-responds to the types of errors and to the level of textquality: First, we applied a filler model that should sep-arate filler texts (25%) from all other texts. These itemswere manually distorted and thus, contained a greatestnumber of defects. In the next step, we excluded thefillers items and build a model that separates sem texts(33%) from the remaining lin and gold texts. The semtexts were automatically linearised and included gen-erated referring expressions, thus the remaining itemswere expected to entertain less defects. Finally, we de-signed a model that separates lin (50%) from gold texts.
We were interested in how well different sets of pre-dictors perform in the regression analysis. For eachstep (filler, sem, lin) of the text quality hierarchy, weevaluated the following models: a) Ratings based onfluency and clarity z-scores, b) Text RTs based ontext-level time, space, speed, time-1stpass and their z-scores, c) All RTs based on Text RTs and sentence-level time, pace, speed and corresponding z-scores(computed over texts), d) Combined based on a com-bination of Ratings and All RTs.
We excluded non-significant predictors using step-wise backward regression. Therefore, each model in-
4Ordinal or multinomial regression can handle multiplevalues in the dependent variable, but uses more complexstatistics and the resulting models are harder to interpret.
Predictors % Fit % Acc. # Coef. R2
Filler vs. other (Sem, Lin ,Gold)Majority BL: 75%
Ratings 76.33 76.14 1 0.133Text RTs 81.06 81.06 2 0.359All RTs 100.0 96.78 11 0.885Combined 100.0 96.02 11 0.905
Sem vs. other (Lin, Gold)Majority BL: 66.66%
Ratings 67.91 67.93 2 0.143Text RTs 66.92 64.89 5 0.113All RTs 100.0 94.19 14 0.926Combined 100.0 94.94 15 0.943
Lin vs. other (Gold)Majority BL: 50%
Ratings 66.66 66.29 2 0.26Text RTs 68.18 65.15 9 0.23All RTs 75.75 67.42 18 0.412Combined 77.65 74.62 17 0.521
Table 3: Hierarchical binary regression for text qual-ity conditions, using different sets of predictors (‘RTs’stands for reading times, ‘All RTs’ include text and sen-tence reading measures).
44

cludes a different number of coefficients. In Table 3,we report the performance of the final models obtainedfrom backward regression in terms of the goodness offit (% Fit), the prediction accuracy in ten-fold cross val-idation (% Acc.), the number of significant predictors(# Coef.) and Nagelkerke’s R2.
Table 2 shows that that the clarity and fluency ratingsof filler and sem texts are lower on average. But thedata in Table 3 indicate these ratings hardly achievedany error reduction compared to the majority baseline,i.e. these ratings were not informative with regards toidentifying these texts. This is particularly remarkablein the case of fillers as they are clearly erroneous andshould be identified by any reliable metric. The ratingmodel performs slightly better in the last step of the hi-erarchical regression, i.e. for distinguishing linearisedtexts and original corpus texts. We attribute this effectto the pronounced difference between fluency ratingsof gold texts as compared to other texts (see Table 2).
The global text-level predictors Text RTs performslightly better in the case of fillers, and comparablyworse in the sem and lin conditions. However, whenwe add sentence-level reading times to the set of pre-dictors, the model achieves an accuracy of 96% fordiscriminating sem texts and 94% for fillers which isabove and beyond the rating model. The high accuracyshows that mouse contingent reading data are very in-formative with regards to the quality of automaticallygenerated texts.
We note that combining the reading parameters andthe ratings in the filler and sem model did not improvethe accuracy compared to only using the reading pa-rameters (see Table 3). Thus, we attribute most of thepredictive power of the combined model to the readingmeasures. In the filler model, the clarity rating scorewas statistically significant, but did not add to the pre-diction accuracy of the model. In the sem model, thefluency rating is significant. When distinguishing goldand lin texts, the reading parameters were less effec-tive predictors compared to the filler and sem models.This affected the model’s accuracy such that the fluencyratings contributed significantly to the model. How-ever, including the reading parameters still improvedthe model’s accuracy substantially. This suggests thatthe measures we recorded with sentence-by-sentencereading are especially informative for predicting qual-ity defects on the level of text clarity and coherence.
6.4 Predictors
In Table 4, we present the plain coefficients for the fi-nal filler, sem and lin models that we obtained fromcombining sentence-level and text-level reading mea-sures and ratings. The stepwise backward regressionprocedure excludes different subsets of predictors fromthe initial models. For instance, the text-level readingtimes, such as total speed and pace, are not signifi-cant for identifying filler and sem texts. On the otherhand, they discriminate between lin and gold texts. The
Predictor Filler Sem Lin
(Intercept) -13.457 8.704 0.271pace-1sent-z2 8.122 -52.90 -pace-2sent 22.033 -21.38 9.188pace-3sent - 76.32 8.067pace-3sent-z2 - -66.76 -speed-1sent-z2 - 213.2 -speed-2sent 0.035 0.023 0.021speed-2sent-z2 9.683 12.65 -speed-3sent -0.084 0.097 0.009speed-3sent-z2 - - 0.732time-1sent -1.17 -0.7345 0.607time-1sent-z2 - -259.4 -time-2sent-z2 -21.5 -120.5 -1.223time-3sent 2.047 -5.399 -time-3sent-z2 -2.55 62.61 -
pace-total - - -31.852pace-total-z - - 4.298display-3sent-log - - 1.331time-1stpass-z - - 2.04speed-total - - -0.003speed-total-z - - 3.062time-1stpass-z - - -1.23time-total-z - - -2.283
fluency-z - -1.629 -1.068clarity-z -1.352 - -
Table 4: Sentence-level, text-level, rating-based pre-dictors and their coefficients in final filler, sem and linmodels from Table 3
filler and sem models used sentence-level predictors fortime, pace and speed of particular sentences. This pat-tern suggests that defects in referring expression real-istion, which are present in filler and sem texts but notin lin and gold texts, deteriorate the clarity and coher-ence of NLG output which is reflected in longer readingtimes on particular sentences in a text.
6.5 Discussion
Generally, our results corroborate the common claimthat quality of generated text is a multi-faceted andgraded phenomenon which cannot be reduced to asmall number of quality criteria that can be easily as-sessed in a rating task. Despite the fact that averagedratings seem to correspond roughly to the expected hi-erarchy of text quality, a regression analysis of indi-vidual ratings for text instances shows a more detailedpicture. A combination of reading time metrics identi-fies generated texts that contain defects in word orderand referring expressions with high accuracy, while therating predictors could hardly discriminate between in-stances of different text quality conditions. We foundthat objective sentence-level and text-level reading timemeasures can complement each other and account forcomplex interactions between aspects of text quality.This result has implications for standard human evalu-ation set-ups in NLG, summarization and possibly Ma-chine Translation which are often based on several self-reported rating criteria.
45

We showed that an experimental paradigm such asMCR provides low-cost and natural means for record-ing objective reading measures while sidestepping thetechnical and practical requirements of an eye-trackingstudy. Our MCR set-up is based on a simple GUI thatpresents pieces of text in a mouse-contigent way andcan be deployed on crowd-sourcing platforms.
Further research is needed to understand how pre-dictors generalise and how the metrics can be appliedto a reliable comparison of NLG systems. The fact thatstandardising across participants and across texts waseffective, implies that prior knowledge about individ-ual reading behavior of a participant is needed to accu-rately identify texts where understanding and readingdifficulties occurred. Such parameters could be col-lected by introducing additional error-free and clearlyerroneous texts into the experiment. The acquired datawould reflect a burn-in phase for the predictors and pro-vide the data for standardising the metrics.
A surprising result is that is that (error-free) goldtexts were not associated with faster reading times. It ispossible that the fact that users had to rate each text af-ter reading it might have impaired their natural readingbehavior. On the other hand, users might spend lesstime on clearly defictive texts as they were unable tointegrate them syntactically and/or semantically. Thiseffect will be investigated in future work.
7 ConclusionEvaluating automatically generated texts is a complextask and involves dealing with a range of interactinglevels of linguistic realisation. While many users caneasily and naturally read texts, they cannot be expectedto provide detailed, objective and systematic assess-ments of the linguistic quality of a text. This studysuggests that there is a lot to be gained from exploringpsycholinguistically plausible methods and paradigmsfor human evaluation in NLG. We adopted a simpleand low-cost mouse contingent reading paradigm foran evaluation study in text generation. We showed thatparameters of the reading process recorded with MCR,such as reading time for texts and sentences, providevery effective predictors for discriminating betweengenerated texts of different quality levels, whereas self-reported quality ratings do not.
ReferencesEva Banik, Claire Gardent, and Eric Kow. 2013. The
KBGen challenge. In Proceedings of the 14th Eu-ropean Workshop on Natural Language Generation(ENLG), pages 94–97.
Anja Belz and Eric Kow. 2010. Comparing ratingscales and preference judgements in language eval-uation. In Proceedings of the 6th International Nat-ural Language Generation Conference, INLG ’10,pages 7–15, Stroudsburg, PA, USA. Association forComputational Linguistics.
Anja Belz and Eric Kow. 2011. Discrete vs. continu-ous rating scales for language evaluation in nlp. InProceedings of the 49th Annual Meeting of the Asso-ciation for Computational Linguistics: Human Lan-guage Technologies: short papers-Volume 2, pages230–235. Association for Computational Linguis-tics.
Anja Belz, Michael White, Dominic Espinosa, EricKow, Deirdre Hogan, and Amanda Stent. 2011. Thefirst surface realisation shared task: Overview andevaluation results. In Proceedings of the 13th Eu-ropean workshop on natural language generation,pages 217–226. Association for Computational Lin-guistics.
Aoife Cahill and Martin Forst. 2010. Human eval-uation of a german surface realisation ranker. InEmpirical methods in natural language generation,pages 201–221. Springer.
Aoife Cahill. 2009. Correlating human and automaticevaluation of a german surface realiser. In Proceed-ings of the ACL-IJCNLP 2009 Conference Short Pa-pers, pages 97–100. Association for ComputationalLinguistics.
Charles Callaway and James Lester. 2001. Evaluatingthe effects of natural language generation techniqueson reader satisfaction. In Proceedings of the 23rdAnnual Conference of the Cognitive Science Society,pages 164–169.
Kiel Christianson, Andrew Hollingworth, John F Halli-well, and Fernanda Ferreira. 2001. Thematic RolesAssigned along the Garden Path Linger. CognitivePsychology, 42(4):368–407, June.
Robert Dale and Chris Mellish. 1998. Towards evalua-tion in natural language generation. In Proceedingsof the First International Conference on LanguageResources and Evaluation, volume 562.
Nina Dethlefs, Heriberto Cuayahuitl, Helen Hastie,Verena Rieser, and Oliver Lemon. 2014. Cluster-based prediction of user ratings for stylistic surfacerealisation. In Proceedings of EACL 2014.
George Doddington. 2002. Automatic evaluationof machine translation quality using n-gram co-occurrence statistics. In Proceedings of the secondinternational conference on Human Language Tech-nology Research, pages 138–145. Morgan Kauf-mann Publishers Inc.
Desmond Elliott and Frank Keller. 2014. Comparingautomatic evaluation measures for image descrip-tion. In Proceedings of the 52nd Annual Meetingof the Association for Computational Linguistics:Short Papers, volume 452, page 457.
Mary Ellen Foster. 2008. Automated metrics thatagree with human judgements on generated outputfor an embodied conversational agent. In Proceed-ings of the Fifth International Natural LanguageGeneration Conference, pages 95–103. Associationfor Computational Linguistics.
46

Jonathan B. Freeman, Rick Dale, and Thomas A.Farmer. 2011. Hand in Motion Reveals Mind inMotion. Frontiers in Psychology, 2.
Albert Gatt and Anja Belz. 2010. Introducing sharedtasks to nlg: The tuna shared task evaluation chal-lenges. In Empirical methods in natural languagegeneration, pages 264–293. Springer.
David Hardcastle and Donia Scott. 2008. Can we eval-uate the quality of generated text? In Proceedings ofLREC.
Helen Hastie and Anja Belz. 2014. A comparativeevaluation methodology for nlg in interactive sys-tems. In Proceedings of LREC’14.
Hunter Hatfield. 2014. Self-Guided Reading: Touch-Based Measures of Syntactic Processing. Journal ofPsycholinguistic Research, October.
David Howcroft, Crystal Nakatsu, and Michael White.2013. Enhancing the expression of contrast in thesparky restaurant corpus. In Proceedings of the 14thEuropean Workshop on Natural Language Genera-tion, pages 30–39, Sofia, Bulgaria, August. Associa-tion for Computational Linguistics.
Alexander Koller, Kristina Striegnitz, Donna Byron,Justine Cassell, Robert Dale, Johanna Moore, andJon Oberlander. 2010. The first challenge on gener-ating instructions in virtual environments. In Em-pirical Methods in Natural Language Generation,pages 328–352. Springer.
Irene Langkilde-Geary. 2002. An empirical verifi-cation of coverage and correctness for a general-purpose sentence generator. In Proceedings of the12th International Natural Language GenerationWorkshop, pages 17–24.
Francois Mairesse and Marilyn A Walker. 2011. Con-trolling user perceptions of linguistic style: Train-able generation of personality traits. ComputationalLinguistics, 37(3):455–488.
George W. McConkie and Keith Rayner. 1975. Thespan of the effective stimulus during a fixation inreading. Perception & Psychophysics, 17(6):578–586, November.
Ani Nenkova. 2006. Summarization evaluation fortext and speech: issues and approaches. In Proceed-ings of INTERSPEECH.
Karolina Owczarzak, John M Conroy, Hoa TrangDang, and Ani Nenkova. 2012. An assessmentof the accuracy of automatic evaluation in summa-rization. In Proceedings of Workshop on Evalua-tion Metrics and System Comparison for AutomaticSummarization, pages 1–9. Association for Compu-tational Linguistics.
Kishore Papineni, Salim Roukos, Todd Ward, and Wei-Jing Zhu. 2002. Bleu: a method for automaticevaluation of machine translation. In Proceedings ofthe 40th annual meeting on association for compu-tational linguistics, pages 311–318. Association forComputational Linguistics.
Keith Rayner. 1998. Eye movements in reading andinformation processing: 20 years of research. Psy-chological Bulletin, 124(3):372–422.
Keith Rayner. 2009. Eye movements in reading: Mod-els and data. Journal of Eye Movement Research,2(5):1–10.
Stephen M. Reder. 1973. On-line monitoring ofeye-position signals in contingent and noncontingentparadigms. Behavior Research Methods & Instru-mentation, 5(2):218–228, March.
Ehud Reiter and Anja Belz. 2009. An investiga-tion into the validity of some metrics for automat-ically evaluating natural language generation sys-tems. Computational Linguistics, 35(4):529–558.
Advaith Siddharthan and Napoleon Katsos. 2012. Of-fline sentence processing measures for testing read-ability with users. In Proceedings of the First Work-shop on Predicting and Improving Text Readabilityfor target reader populations, pages 17–24. Associ-ation for Computational Linguistics.
Amanda Stent, Rashmi Prasad, and Marilyn Walker.2004. Trainable sentence planning for complex in-formation presentation in spoken dialog systems. InProceedings of the 42Nd Annual Meeting on As-sociation for Computational Linguistics, ACL ’04,Stroudsburg, PA, USA. Association for Computa-tional Linguistics.
Amanda Stent, Matthew Marge, and Mohit Singhai.2005. Evaluating evaluation methods for generationin the presence of variation. In Computational Lin-guistics and Intelligent Text Processing, pages 341–351. Springer.
Matthew J Traxler, Robin K Morris, and Rachel ESeely. 2002. Processing Subject and Object RelativeClauses: Evidence from Eye Movements. Journal ofMemory and Language, 47(1):69–90, July.
Sina Zarrieß and Jonas Kuhn. 2013. Combining refer-ring expression generation and surface realization: Acorpus-based investigation of architectures. In ACL(1), pages 1547–1557.
47

Proceedings of the 15th European Workshop on Natural Language Generation (ENLG), pages 48–51,Brighton, September 2015. c©2015 Association for Computational Linguistics
Moving targets: human references to unstable landmarks
Adriana BaltaretuTiCC
Tilburg [email protected]
Emiel KrahmerTiCC
Tilburg [email protected]
Alfons MaesTiCC
Tilburg [email protected]
Abstract
In the present study, we investigate ifspeakers refer to moving entities in routedirections (RDs) and how listeners eval-uate these references. There is a generalagreement that landmarks should be per-ceptually salient and stable objects. Ani-mated movement attracts visual attention,making entities salient. We ask speakers towatch videos of crossroads and give RDsto listeners, who in turn have to choose astreet on which to continue (Experiment 1)or choose the best instruction among threeRDs (Experiment 2). Our results showthat speakers mention moving entities, es-pecially when their movement is informa-tive for the navigation task (Experiment 1).Listeners understand and use moving land-marks (Experiment 1), yet appreciate sta-ble landmarks more (Experiment 2).
1 Introduction
One of the applications of Natural Language Gen-eration (Reiter et al., 2000) is the automatic gen-eration of route directions, e.g., Roth and Frank(2009); Dale et al., (2005). These instruction typ-ically involve Referring Expressions Generation(REG), (Krahmer and Van Deemter, 2012), forthe generation of references to landmarks. Untilrecently, REG for landmarks and studies on hu-man navigation have focussed exclusively on ref-erences to stable entities; in fact, to the best of ourknowledge moving targets have never been studiedbefore. Emerging technology (e.g., Google Glass)allows systems to include all relevant visual infor-mation in RDs. This raises the question whetherreferences to moving landmarks actually occur.
With support from wearable technology, navi-gation systems could become spatially aware. Forexample, navigation systems could produce more
human-like instructions by making use of the vi-sual information captured by devices that incor-porate video cameras. A navigation system couldground actions in space by referring to both sta-ble (“the tall building”) and moving (“the cyclistgoing left”) information. However, we know littleabout how the dynamic character of the environ-ment influences referential behaviour. We addressthis issue by analysing if moving entities in the en-vironment affect route direction (RD) productionand evaluation.
RDs are instructions guiding a user on howto incrementally go from one location to another(Richter and Klippel, 2005). These instructionscontain numerous references to entities in the en-vironment ( henceforth landmarks). Traditionally,landmarks have been defined as route-relevant sta-ble entities (such as buildings) that function aspoints of reference (Allen, 2000). One likelyreason for which unstable entities are underrep-resented in most standard navigation studies, isthat the set-up of these studies often implies somekind of (temporal and / or spatial) asymmetrybetween the speaker and addressee perspectives,which makes moving entities unreliable referencepoints. For example, instructions are commu-nicated over distance (e.g., telephone) or asyn-chronously (e.g., after travelling the route or onthe basis of maps). In contrast, in this study wesynchronize the two perspectives and focus on in-situ turn-by-turn RDs, where the request for as-sistance is formulated and followed on the spot.While having access to a shared dynamic environ-ment, speakers can refer to any entity that couldimprove the instruction. We analyse if speakersrefer to moving entities in RDs and asses listenerspreference for such references.
Among other aspects, perceptual salience hasbeen theorized to be an important quality of land-marks (Sorrows and Hirtle, 1999) and movementis known to contribute to the perceptual salience
48

of objects. Movement is processed effortlessly bythe visual system and attracts attention when in-formative about the location of a target (Hillstromand Yantis, 1994). In this study, we focus on an-imated motion. In general, animate entities in-fluence visual attention and reference production(Downing et al., 2004); (Prat-Sala and Branigan,2000). Moreover, animated movement in itself(automatically) captures visual attention (Pratt etal., 2010). We hypothesize that if entities grabattention, then speakers would mention them andthat listeners would prefer these RDs positively,especially when their motion is task-informative.
2 Experiment 1 - Production
2.1 Methods
2.1.1 Participants56 dyads of native Dutch-speaking students ofTilburg University (50 women, 21.2 mean age)participated in exchange for partial course cred-its. Participants were randomly assigned to thespeaker role (35 women). All participants gaveconsent to the use of their data.
2.1.2 Materials144 street view HD videos were recorded in 72 in-tersections of Rotterdam. The experimental videosdepicted 36 low traffic, +- shaped intersections.Each intersection was recorded three times illus-trating a different movement manipulation (seeFigure1): (a) no pedestrians / cyclists moving inthe intersection (no movement condition (NM), 36videos); (b) a person walking / cycling towards theintersection (irrelevant movement condition (IM),36 videos); (c) the same person recorded someseconds later, while taking a turn in the requireddirection (relevant movement condition (RM), 36videos). The people recorded were naive pedes-trians casually walking / cycling down the street,without paying attention to the camera. In ad-dition, each intersection had other stable objectthat could be referred to. The filler videos (36videos) depict a different set of crowded and com-plex shaped intersections. In addition, two paperbooklets with line drawing maps of the intersec-tions were prepared (the speaker booklet includedan arrow showing the direction to be taken).
2.1.3 ProcedureThe speaker’s task was to provide route instruc-tions based on the map and on the video. The
Figure 1: Experimental trials: an intersection withno movement, with a cyclist going towards the in-tersection, and with a cyclist taking a turn.
listener had to mark in his booklet the indicatedstreet. The listener was allowed to ask questionsonly if the instructions were unclear. Each videolasted about three seconds and was projected ona white wall (size: 170 x 120 cm). The videoscould not be replayed, but the last frame was dis-played until the listener announced he is finished.Pointing was discouraged by installing a screenbetween participants up to shoulder level. Eachintersection was shown only once to each dyad.Participants were randomly assigned to one of thethree presentation lists. The task started with twowarm-up trials followed by 72 video trials (36 ex-perimental trials). There were no time constraints.
2.1.4 Design and statistical analysis
This study had Movement Type (levels: no move-ment, irrelevant movement, relevant movement)as within participants factor and Presentation List(levels: 1, 2 and 3) as between participants factor.We analysed the type of landmark mentioned bythe producer in the first instruction (moving man/ stable objects) using logit mixed model analy-sis with Movement Type and Presentation List asfixed factors; participants and item pictures as ran-
49

Figure 2: For each condition, number of route di-rections with different types of landmarks
dom factors; p–values were estimated via para-metric bootstrapping. The factors were centred toreduce colinearity. The first converging model isreported. This included random intercepts for par-ticipants and videos and random slope for Move-ment Type in videos. Only significant results arereported. Next we analysed if moving entities arementioned together with stable ones, clarificationquestions and listener error rates.
3 Results
2016 RDs (56 speakers * 36 videos) were pro-duced in this experiment. Across the three con-ditions, participants mentioned both stable (N =752) and moving entities (N = 361) (see Figure2).
In the NM condition, participants rarely referredto moving people (M = 0.03). Statistical analysiswas performed only on the data from the IM andRM conditions. There was no significant effectof Presentation List (p > .05). There was a maineffect of Movement Type (β = 1.913; SE = 0.27; p< .001). In the RM condition participants referredmore often to the moving person taking a turn (M= 0.37), than in the IM condition (M = 0.13).
Few cases (0.02 %) of RDs included both themoving and the stable landmarks (3 cases in NM;18 cases in IM, and 22 cases in RM).
In general, the task was easy: there were 80questions asked by listeners and no signals of ma-jor communication breakdowns. The questionswere asked when the speaker did not refer to land-marks in his initial instruction (55%), when thespeaker referred to a stable landmark (31.25%),when the speaker referred to a moving landmark(13.75%). The most frequent type of question wasthe one in which listeners introduced (new) stablelandmarks.
When choosing the street, listeners made few
errors (11 cases of incorrectly marked streets and8 cases in which the first choice was corrected).
4 Experiment 2 - RD evaluation
4.1 Participants32 native Dutch-speaking students of Tilburg Uni-versity (12 women, 20.7 mean age) participatedin exchange for partial course credits. All partici-pants gave consent to the use of their data.
4.2 MaterialsThe materials consisted of 72 videos (the experi-mental trials from the IM and RM condition usedin Experiment 1). Overlaid on the videos, a semi-transparent red arrow depicted the route and thedirection to be followed.
Based on the production data, for each video aset of three route directions was created as fol-lows: a route direction without landmarks (e.g.,turn left); a route direction with a stable landmark(e.g., turn left at Hema); a route direction with amoving landmark (e.g., turn left where that man /woman / cyclist is going). The stable landmarksused in these RDs were the most often mentionedobjects in Experiment 1. The moving landmarkswere referred to as the man / woman / cyclist.
4.3 ProcedureThe participants’ task was to watch the videos,read the RDs and choose the one that they likedmost. Participants saw 36 trials as follows: first afixation cross was displayed for 500ms, followedby the video and the three instructions placed be-low the video. The position on screen of theRDs was counterbalanced. Each intersection wasshown only once, and participants were randomlyassigned to one of the two presentation lists.
4.4 Design and statistical analysisThis study had Movement Type (levels: irrelevantmovement, relevant movement) as within partici-pants factor and Presentation List (levels: 1, 2) asbetween participants factor. The dependent vari-able was the type of RD chosen. Statistical analy-sis was performed as in Experiment 1. The modelhad Movement Type and Presentation List as fixedfactors; subjects and videos as random factors.
5 Results
Out of 1152 cases (36 scenes x 32 participants),RDs with landmarks were chosen more often
50

Figure 3: For each condition, types of landmarkschosen
(73% of the cases) than RDs without landmarks(see Figure3). To see if movement influenced thechoice for a specific type of landmark, the statis-tical analysis was done on a data set consisting ofthe RDs with landmarks.
In general, participants chose more often sta-ble landmarks (77.06% of the cases) than mov-ing landmarks. There was a main effect of Move-ment Type (β = 1.211; SE = .265; p < .001). Thismodel included random intercepts for subjects andfor videos.
For videos depicting irrelevant movement, par-ticipants chose more often instructions with sta-ble landmarks (M = 0.85) than with moving land-marks (M = 0.15). For videos depicting relevantmovement, the same pattern is observed thoughthere was a slight increase in the preference formoving landmarks (stable landmarks M = 0.75;moving landmarks M = 0.25). There was no sig-nificant effect of Presentation List (p > .05).
6 Conclusions
In conclusion, human speakers do use referencesto moving landmarks. Speakers referred to mov-ing objects especially when their movement wasinformative. Listeners did not encounter difficul-ties understanding these instructions. Yet, theypreferred instructions with stable landmarks. Inthe light of technological developments our resultshighlight that navigation systems should not onlyadd landmarks to the instructions, but also adjustthe type of landmarks. Speakers naturally refer toitems with a relevant movement trajectory. Furtherwork is needed to investigate if moving entitieswere mentioned because they were more salientthan their stable counterparts and second, to vali-date the efficiency of such RDs for listeners. In fu-ture research, we hope to address the question howcurrent REG algorithms can be adapted to gener-
ate references to moving targets.
ReferencesGary L Allen. 2000. Principles and practices for
communicating route knowledge. Applied Cogni-tive Psychology, 14(4):333–359.
Robert Dale, Sabine Geldof, and Jean-Philippe Prost.2005. Using natural language generation in auto-matic route. Journal of Research and practice inInformation Technology, 37(1):89.
Paul E Downing, David Bray, Jack Rogers, and ClaireChilds. 2004. Bodies capture attention when noth-ing is expected. Cognition, 93(1):27–38.
Anne P Hillstrom and Steven Yantis. 1994. Visualmotion and attentional capture. Perception & Psy-chophysics, 55(4):399–411.
Emiel Krahmer and Kees Van Deemter. 2012. Compu-tational generation of referring expressions: A sur-vey. Computational Linguistics, 38(1):173–218.
Merce Prat-Sala and Holly P Branigan. 2000. Dis-course constraints on syntactic processing in lan-guage production: A cross-linguistic study in en-glish and spanish. Journal of Memory and Lan-guage, 42(2):168–182.
Jay Pratt, Petre V Radulescu, Ruo Mu Guo, andRichard A Abrams. 2010. Its alive! animate mo-tion captures visual attention. Psychological Sci-ence, 21(11):1724–1730.
Ehud Reiter, Robert Dale, and Zhiwei Feng. 2000.Building natural language generation systems, vol-ume 33. Cambridge University Press, Cambridge.
Kai-Florian Richter and Alexander Klippel. 2005.A model for context-specific route directions. InSpatial cognition IV. Reasoning, action, interaction,pages 58–78. Springer, Berlin.
Michael Roth and Anette Frank. 2009. A NLG-basedapplication for walking directions. In Proceedingsof the 47th Annual Meeting of the Association forComputational Linguistics, pages 37–40, Singapore.
Molly E Sorrows and Stephen C Hirtle. 1999. Thenature of landmarks for real and electronic spaces.In Spatial information theory. Cognitive and compu-tational foundations of geographic information sci-ence, pages 37–50. Springer, Berlin.
Acknowledgements
The first author received financial support fromthe Netherlands Organization for Scientific Re-search, via NWO Promoties in de Geestesweten-schappen (322-89-008), which is greatly acknowl-edged. Partial results of this study have been pre-sented in CogSci 2015.
51
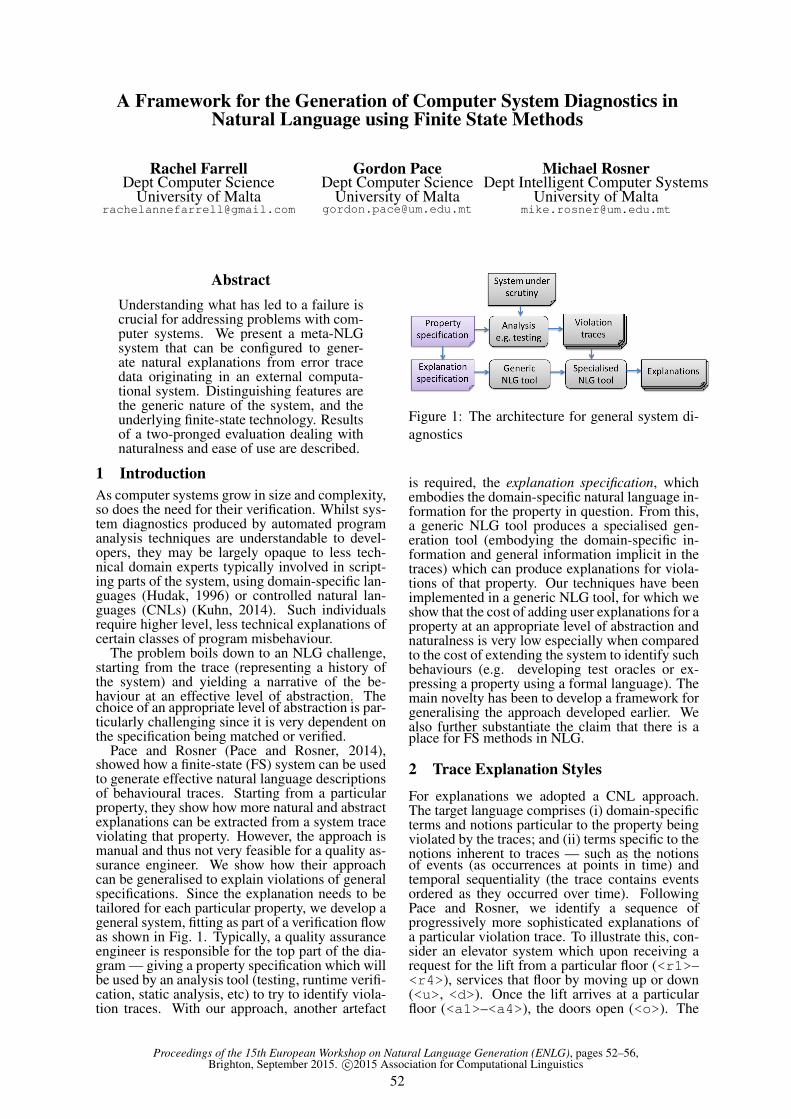
Proceedings of the 15th European Workshop on Natural Language Generation (ENLG), pages 52–56,Brighton, September 2015. c©2015 Association for Computational Linguistics
A Framework for the Generation of Computer System Diagnostics inNatural Language using Finite State Methods
Rachel FarrellDept Computer Science
University of [email protected]
Gordon PaceDept Computer Science
University of [email protected]
Michael RosnerDept Intelligent Computer Systems
University of [email protected]
AbstractUnderstanding what has led to a failure iscrucial for addressing problems with com-puter systems. We present a meta-NLGsystem that can be configured to gener-ate natural explanations from error tracedata originating in an external computa-tional system. Distinguishing features arethe generic nature of the system, and theunderlying finite-state technology. Resultsof a two-pronged evaluation dealing withnaturalness and ease of use are described.
1 IntroductionAs computer systems grow in size and complexity,so does the need for their verification. Whilst sys-tem diagnostics produced by automated programanalysis techniques are understandable to devel-opers, they may be largely opaque to less tech-nical domain experts typically involved in script-ing parts of the system, using domain-specific lan-guages (Hudak, 1996) or controlled natural lan-guages (CNLs) (Kuhn, 2014). Such individualsrequire higher level, less technical explanations ofcertain classes of program misbehaviour.
The problem boils down to an NLG challenge,starting from the trace (representing a history ofthe system) and yielding a narrative of the be-haviour at an effective level of abstraction. Thechoice of an appropriate level of abstraction is par-ticularly challenging since it is very dependent onthe specification being matched or verified.
Pace and Rosner (Pace and Rosner, 2014),showed how a finite-state (FS) system can be usedto generate effective natural language descriptionsof behavioural traces. Starting from a particularproperty, they show how more natural and abstractexplanations can be extracted from a system traceviolating that property. However, the approach ismanual and thus not very feasible for a quality as-surance engineer. We show how their approachcan be generalised to explain violations of generalspecifications. Since the explanation needs to betailored for each particular property, we develop ageneral system, fitting as part of a verification flowas shown in Fig. 1. Typically, a quality assuranceengineer is responsible for the top part of the dia-gram — giving a property specification which willbe used by an analysis tool (testing, runtime verifi-cation, static analysis, etc) to try to identify viola-tion traces. With our approach, another artefact
Figure 1: The architecture for general system di-agnostics
is required, the explanation specification, whichembodies the domain-specific natural language in-formation for the property in question. From this,a generic NLG tool produces a specialised gen-eration tool (embodying the domain-specific in-formation and general information implicit in thetraces) which can produce explanations for viola-tions of that property. Our techniques have beenimplemented in a generic NLG tool, for which weshow that the cost of adding user explanations for aproperty at an appropriate level of abstraction andnaturalness is very low especially when comparedto the cost of extending the system to identify suchbehaviours (e.g. developing test oracles or ex-pressing a property using a formal language). Themain novelty has been to develop a framework forgeneralising the approach developed earlier. Wealso further substantiate the claim that there is aplace for FS methods in NLG.
2 Trace Explanation Styles
For explanations we adopted a CNL approach.The target language comprises (i) domain-specificterms and notions particular to the property beingviolated by the traces; and (ii) terms specific to thenotions inherent to traces — such as the notionsof events (as occurrences at points in time) andtemporal sequentiality (the trace contains eventsordered as they occurred over time). FollowingPace and Rosner, we identify a sequence ofprogressively more sophisticated explanations ofa particular violation trace. To illustrate this, con-sider an elevator system which upon receiving arequest for the lift from a particular floor (<r1>–<r4>), services that floor by moving up or down(<u>, <d>). Once the lift arrives at a particularfloor (<a1>–<a4>), the doors open (<o>). The
52

doors can then either close (<c>) automatically,or after a floor request. Monitoring the prop-erty that the lift should not move with an opendoor, we will illustrate explanations with differ-ent degrees of sophistication of the violation trace:<a4,o,r4,a4,r2,c,d,a3,d,a2,o,r3,u>.
The simplest explanation is achieved in CNL0,where every symbol is transformed into a separatesentence, with an additional sentence at the endgiving the reason why a violation occurred.
CNL0The lift arrived at floor 4. The doors opened. Auser requested to go to floor 4. The lift arrived atfloor 4. A user requested to go to floor 2. The doorsclosed. The lift moved down. The lift arrived atfloor 3. The lift moved down. The lift arrived atfloor 2. The doors opened. A user requested to goto floor 3. The lift moved up. However this lastaction should not have been allowed because thelift cannot move with open doors.
In CNL1, the text is split into paragraphs con-sisting of sequences of sentence:
CNL11. The lift arrived at floor 4.2. The doors opened. A user requested to go to
floor 4. The lift arrived at floor 4.3. A user requested to go to floor 2. The doors
closed. The lift moved down. The lift arrivedat floor 3. The lift moved down. The liftarrived at floor 2.
4. The doors opened. A user requested to go tofloor 3. The lift moved up. However this lastaction should not have been allowed becausethe lift cannot move with open doors.
In CNL2, aggregation (Dalianis, 1999) tech-niques combine the single clause sentences fromthe previous two realisations to build multi-clausesentences, thus eliminating redundancy achievedthrough (i) the use of commas and words such as‘and’, ‘then’, ‘but’ or ‘yet’, and (ii) the grouping ofsimilar events, for example by stating the numberof occurrences (e.g. ‘moved down two floors’).
CNL21. The lift arrived at floor 4.2. The doors opened and a user requested to go
to floor 4, yet the lift was already at floor 4.3. A user requested to go to floor 2, then the
doors closed. The lift moved down twofloors and arrived at floor 2.
4. The doors opened, a user requested to go tofloor 3, and the lift moved up. However thislast action should not have been allowed be-cause the lift cannot move with open doors.
Since the explanation contains detail which maybe unnecessary or can be expressed more con-cisely, CNL3 uses summarisation — for instance,the first sentence in the explanation below sum-marises the contents of what were previously para-graphs 1–3. The last paragraph is left unchanged,since every sentence included there is required toproperly understand the cause of the error.
CNL31. The lift arrived at floor 4, serviced floor 4,
then serviced floor 2.2. The doors opened, a user requested to go to
floor 3, and the lift moved up. However thislast action should not have been allowed be-cause the lift cannot move with open doors.
For Pace and Rosner the explanation languageis a CNL, whose basis, described in the XeroxFinite State Toolkit (XFST) (Beesley and Kart-tunen, 2003) by a human author, states how sys-tem trace actions should be expressed. The natu-ral language explanation is obtained by composingFS transducers in a pipeline. FS technologies arebest-known for the representation of certain kindsof linguistic knowledge, most notably morphol-ogy (Wintner, 2008). In contrast, we used XFSTto implement linguistic techniques such as struc-turing the text into paragraphs, aggregation, con-textuality — as previously illustrated.
3 Generalised Explanations
Given a particular property, one can design a NLGtool capable of explaining its violation traces.Some of the explanation improvements presentedin the previous section are common to most prop-erties. We thus chose to address the more gen-eral problem of trace violation explanations, suchthat, although domain-specific concepts (e.g. themeaning of individual events and ways of sum-marising them) need to be specified, much of theunderlying machinery pertaining to the implied se-mantics of the event traces (e.g. the fact that atrace is a temporally ordered sequence of events,and that the events are independent of each other)will be derived automatically. The resulting ap-proach, as shown in Fig. 1, in which we focuson the Generic NLG component uses the domain-specific information about a particular property(the Explanation Specification script provided bya QA engineer) to produce an explanation genera-tor for a whole class of traces (all those violatingthat property). A specification language was cre-ated to facilitate the creation of a specification bynon-specialist users. A script in the general trace-explanation language is used to automatically con-struct a specific explanation generator in XFST,going beyond a NLG system by developing a gen-erator of trace explanation generators.
4 Specifying Trace Explanations
Scripts for our framework allow the user to spec-ify the domain-specific parts of the explanationsfor a particular property, leaving other genericlanguage features to be deduced automatically.The core features of the scripting language are:Explaining events: Rather than give a com-plete sentence for each event represented by asymbol, we split the information into the subjectand predicate, enabling us to derive automaticallywhen sequential actions share a subject (thusallowing their combination in a more readableform). For example, the EXPLAIN section of thescript is used to supply such event definitions:
EXPLAIN {<a4>: {
subject: "the lift";predicate: "arrived at level four";
}...}
53
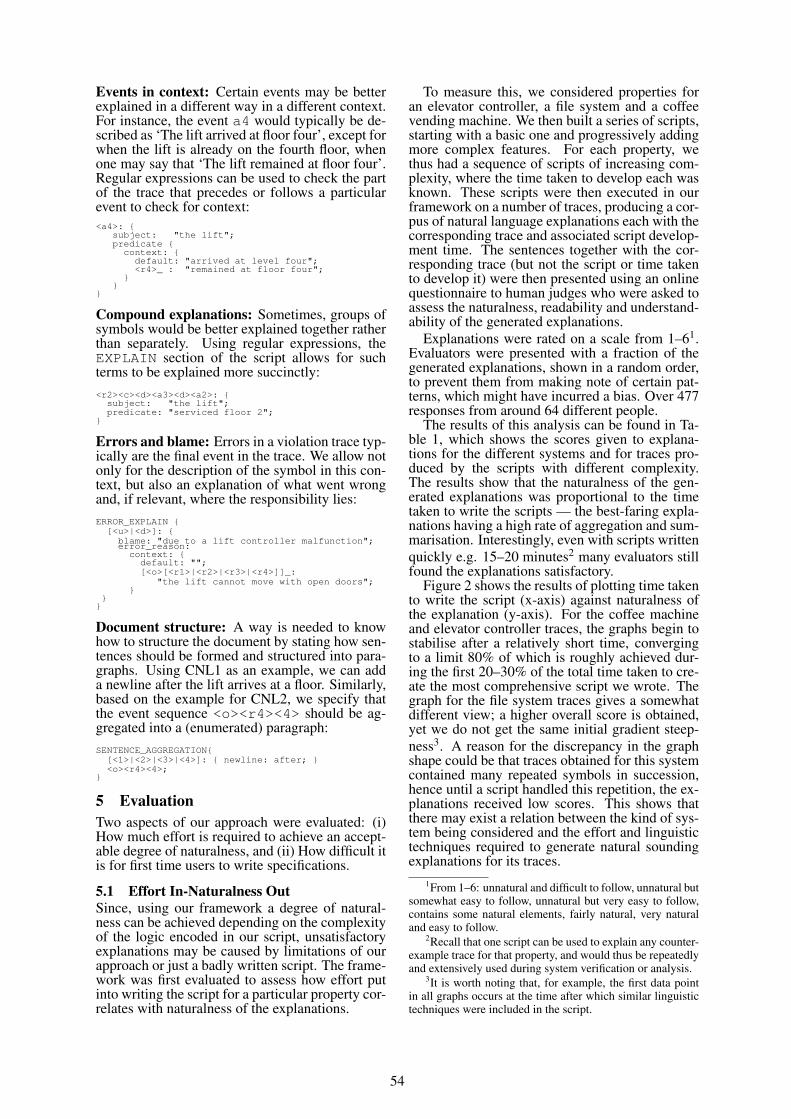
Events in context: Certain events may be betterexplained in a different way in a different context.For instance, the event a4 would typically be de-scribed as ‘The lift arrived at floor four’, except forwhen the lift is already on the fourth floor, whenone may say that ‘The lift remained at floor four’.Regular expressions can be used to check the partof the trace that precedes or follows a particularevent to check for context:<a4>: {
subject: "the lift";predicate {
context: {default: "arrived at level four";<r4>_ : "remained at floor four";
}}
}
Compound explanations: Sometimes, groups ofsymbols would be better explained together ratherthan separately. Using regular expressions, theEXPLAIN section of the script allows for suchterms to be explained more succinctly:<r2><c><d><a3><d><a2>: {
subject: "the lift";predicate: "serviced floor 2";
}
Errors and blame: Errors in a violation trace typ-ically are the final event in the trace. We allow notonly for the description of the symbol in this con-text, but also an explanation of what went wrongand, if relevant, where the responsibility lies:ERROR_EXPLAIN {
[<u>|<d>]: {blame: "due to a lift controller malfunction";error_reason:
context: {default: "";[<o>[<r1>|<r2>|<r3>|<r4>]]_:
"the lift cannot move with open doors";}
}}
Document structure: A way is needed to knowhow to structure the document by stating how sen-tences should be formed and structured into para-graphs. Using CNL1 as an example, we can adda newline after the lift arrives at a floor. Similarly,based on the example for CNL2, we specify thatthe event sequence <o><r4><4> should be ag-gregated into a (enumerated) paragraph:SENTENCE_AGGREGATION{
[<1>|<2>|<3>|<4>]: { newline: after; }<o><r4><4>;
}
5 EvaluationTwo aspects of our approach were evaluated: (i)How much effort is required to achieve an accept-able degree of naturalness, and (ii) How difficult itis for first time users to write specifications.
5.1 Effort In-Naturalness OutSince, using our framework a degree of natural-ness can be achieved depending on the complexityof the logic encoded in our script, unsatisfactoryexplanations may be caused by limitations of ourapproach or just a badly written script. The frame-work was first evaluated to assess how effort putinto writing the script for a particular property cor-relates with naturalness of the explanations.
To measure this, we considered properties foran elevator controller, a file system and a coffeevending machine. We then built a series of scripts,starting with a basic one and progressively addingmore complex features. For each property, wethus had a sequence of scripts of increasing com-plexity, where the time taken to develop each wasknown. These scripts were then executed in ourframework on a number of traces, producing a cor-pus of natural language explanations each with thecorresponding trace and associated script develop-ment time. The sentences together with the cor-responding trace (but not the script or time takento develop it) were then presented using an onlinequestionnaire to human judges who were asked toassess the naturalness, readability and understand-ability of the generated explanations.
Explanations were rated on a scale from 1–61.Evaluators were presented with a fraction of thegenerated explanations, shown in a random order,to prevent them from making note of certain pat-terns, which might have incurred a bias. Over 477responses from around 64 different people.
The results of this analysis can be found in Ta-ble 1, which shows the scores given to explana-tions for the different systems and for traces pro-duced by the scripts with different complexity.The results show that the naturalness of the gen-erated explanations was proportional to the timetaken to write the scripts — the best-faring expla-nations having a high rate of aggregation and sum-marisation. Interestingly, even with scripts writtenquickly e.g. 15–20 minutes2 many evaluators stillfound the explanations satisfactory.
Figure 2 shows the results of plotting time takento write the script (x-axis) against naturalness ofthe explanation (y-axis). For the coffee machineand elevator controller traces, the graphs begin tostabilise after a relatively short time, convergingto a limit 80% of which is roughly achieved dur-ing the first 20–30% of the total time taken to cre-ate the most comprehensive script we wrote. Thegraph for the file system traces gives a somewhatdifferent view; a higher overall score is obtained,yet we do not get the same initial gradient steep-ness3. A reason for the discrepancy in the graphshape could be that traces obtained for this systemcontained many repeated symbols in succession,hence until a script handled this repetition, the ex-planations received low scores. This shows thatthere may exist a relation between the kind of sys-tem being considered and the effort and linguistictechniques required to generate natural soundingexplanations for its traces.
1From 1–6: unnatural and difficult to follow, unnatural butsomewhat easy to follow, unnatural but very easy to follow,contains some natural elements, fairly natural, very naturaland easy to follow.
2Recall that one script can be used to explain any counter-example trace for that property, and would thus be repeatedlyand extensively used during system verification or analysis.
3It is worth noting that, for example, the first data pointin all graphs occurs at the time after which similar linguistictechniques were included in the script.
54

Table 1: Overall scores given to generated explanations
System Time Score/mins 1 2 3 4 5 6 Mean Mode Median
10 1 8 10 9 2 10 3.83 3,6 4Elevator 16 2 4 4 9 15 9 4.35 5 5system 24 1 2 2 4 15 6 4.6 5 5
39 1 0 3 8 8 11 4.77 6 512 5 7 11 3 3 1 2.83 3 3
File 19 5 8 7 7 8 7 3.62 2,5 4system 22 2 5 13 5 6 3 3.5 3 3
32 0 2 4 5 14 18 4.98 6 5
Coffeema-chine
10 3 4 4 12 5 8 4 4 415 3 6 4 8 14 4 3.92 5 425 1 3 5 3 9 8 4.38 5 528 1 1 3 10 10 11 4.67 6 538 2 1 2 4 18 17 4.95 5 5
We can thus conclude that whilst a certain inher-ent limit exists, natural-sounding explanations canbe well achieved using this system. Effort howeveris rather important, and usually, the more time in-vested in building a script, the better the qualityof the output. Nevertheless, even with minimal ef-fort, a script author highly familiar with the inputlanguage can obtain a rather satisfactory output.
5.2 User Acceptance TestTo assess the framework’s accessibility, we ran afour-hour experiment with four new users familiarwith concepts such as regular expressions. Theywere requested to produce scripts to explain dif-ferent properties unaided and were then asked torate the ease of use and expressivity of the inputlanguage, their satisfaction with the output gener-ated, and whether it matched their expectations.Given the low number of participants, the resultsare only indicative, and assessing the quality of thescripts they produced would not have given statis-tically meaningful results.
Overall, these users characterised the script-ing language between somewhat difficult to easyto use. Dealing with contextual explanation ofevents presented the greatest challenges, althoughall managed to produce an error explanation whichrequired using this concept. Apart from simply ex-plaining every symbol as a complete sentence, theusers also managed to create scripts involving ag-gregation and summarisation. The users expressedsatisfaction with the explanations produced, al-though one of the subjects commented that scriptssometimes had to be executed to understand ex-actly the effect of a particular line of code.
The fact that all users managed to produce suc-cessful scripts within four hours indicates that itis not excessively difficult to use. That the over-all idea was easily understood and the input lan-guage quickly learnt suggests that this kind of sys-tem could minimise the overheads associated withthe task of automated explanation generation forsystems more complex than those illustrated here.
6 Related WorkBabyTalk BT-45 (Reiter et al., 2008) generatestextual summaries of low-level clinical data from
a Neonatal Intensive Care Unit. Summaries arecreated for different audiences, such as doctorsand nurses, to help them in making treatmentdecisions. Generated summaries were found tobe useful, but lacking in narrative structure com-pared to those created by humans. Further inves-tigation is needed to determine where the trade-offs lie between acceptable explanations, underly-ing data complexity, and computational efficiency.Power (Power, 2012) describes OWL-SimplifiedEnglish, a CNL for non-specialists used to editsemantic web ontologies in OWL, notably em-ploying FS techniques for the definition of a user-oriented communication language. See also (Gal-ley et al., 2001) whose NLG system combinesFS) grammars with corpus-based language mod-els. These works are limited to producing gener-ators for any trace, rather than creating a higher-order framework which is used to write scriptswhich produce the generators.
7 ConclusionsUnderstanding why a violation occurred has manybenefits for end-users of verification techniquesand can save time when designing complex sys-tems. The solution presented has the advantage ofnot being difficult to use by people with a com-puter science background, and can generate natu-ral, easily understandable explanations despite in-herent limitations of FS technologies. Should theconstraints of regular languages prove to be suchthat this system would not be applicable in manyareas, there is the possibility of not using FS tech-niques without any major changes in the frame-work’s general architecture. Another possibilitywould be examining how the techniques discussedcould be applied to provide dynamic explanationsof online systems.
55

Figure 2: Graphs of the naturalness score given against the time after which the corresponding inputscript was created
ReferencesKenneth R Beesley and Lauri Karttunen. 2003. Finite-
state morphology, volume 3 of Studies in computa-tional linguistics. CSLI Publications.
Hercules Dalianis. 1999. Aggregation in nalturallanguage generation. Computational Intelligence,15(04).
Michel Galley, Eric Fosler-lussier, and Ros Potami-anos. 2001. Hybrid natural language generationfor spoken dialogue systems. In In Proceedings ofthe 7th European Conference on Speech Communi-cation and Technology, pages 1735–1738.
Paul Hudak. 1996. Building domain-specific embed-ded languages. ACM Computing Surveys, 28:196.
Tobias Kuhn. 2014. A survey and classification of con-trolled natural languages. Computational Linguis-tics, 40(1):121–170, March.
Gordon J. Pace and Michael Rosner. 2014. Explain-ing violation traces with finite state natural languagegeneration models. In Brian Davis, Kaarel Kalju-rand, and Tobias Kuhn, editors, Controlled Natu-ral Language, volume 8625 of Lecture Notes inComputer Science, pages 179–189. Springer Inter-national Publishing.
Richard Power. 2012. Owl simplified english: Afinite-state language for ontology editing. In To-bias Kuhn and Norbert E. Fuchs, editors, ControlledNatural Language, volume 7427 of Lecture Notesin Computer Science, pages 44–60. Springer BerlinHeidelberg.
Ehud Reiter, Albert Gatt, Francois Portet, and Marianvan der Meulen. 2008. The importance of narra-tive and other lessons from an evaluation of an nlgsystem that summarises clinical data. In Proceed-ings of the Fifth International Natural LanguageGeneration Conference, INLG ’08, pages 147–156,Stroudsburg, PA, USA. Association for Computa-tional Linguistics.
Shuly Wintner. 2008. Strengths and weaknesses offinite-state technology: a case study in morphologi-cal grammar development. Natural Language Engi-neering, 14(04):457–469.
56

Proceedings of the 15th European Workshop on Natural Language Generation (ENLG), pages 57–60,Brighton, September 2015. c©2015 Association for Computational Linguistics
A Snapshot of NLG Evaluation Practices 2005 - 2014
Dimitra GkatziaDepartment of Computer Science
Heriot-Watt UniversityEH14 4AS Edinburgh, [email protected]
Saad MahamoodDepartment of Computing Science
University of AberdeenScotland, United Kingdom
AbstractIn this paper we present a snapshot of end-to-end NLG system evaluations as pre-sented in conference and journal papers1
over the last ten years in order to better un-derstand the nature and type of evaluationsthat have been undertaken. We find thatresearchers tend to favour specific evalua-tion methods, and that their evaluation ap-proaches are also correlated with the pub-lication venue. We further discuss whatfactors may influence the types of evalu-ation used for a given NLG system.
1 IntroductionEvaluation plays a crucial role in helping to under-stand whether a given approach for a text generat-ing Natural Language Generation (NLG) systemhas expressed particular properties (such as qual-ity, speed, etc.) or whether it has met a partic-ular potential (domain utility). Past work withinthe NLG community has looked at the issues ofevaluating NLG techniques and systems, the chal-lenges unique to the NLG context in comparisonto Natural Language Analysis (Dale and Mellish,1998), and the comparisons between evaluationapproaches (Belz and Reiter, 2006). Whilst therehas been a better understanding of the types ofevaluations that can be conducted for a given NLGtechnique or system (Hastie and Belz, 2014) thereis little understanding on the frequency or types ofevaluation that is typically conducted for a givensystem within the NLG community.
In this paper, we shed some light on the fre-quency of the types of evaluations conducted forNLG systems. In particular, we have focused onlyon end-to-end complete NLG system as opposedto NLG components (referring expression gener-ation, surface realisers, etc.) in our meta-analysis
1Dataset available from here: https://github.com/Saad-Mahamood/ENLG2015
of published NLG systems from a variety of con-ferences, workshops, and journals for the last tenyears since 2005. For the purpose of this re-search, we created a corpus consisting of these pa-pers (Section 3). We then investigated three ques-tions 4: (1) which is the most preferred evaluationmethod; (2) how does the method use change overtime; and (3) whether the publication venue influ-ences the evaluation type. In Section 5, we dis-cuss the results of the meta analysis and finally inSection 6 we conclude the paper and we discussdirections for future work.
2 BackgroundNLG evaluation methodology has developed con-siderably over the last several years. Work by Daleand Mellish (1998) initially focused on the rolethat evaluation methods should play for a givenNLG system and how they are different from thekind of evaluations undertaken by the natural lan-guage understanding community.
Traditional NLG evaluations have typically fellinto one of two types: intrinsic or extrinsic (Belzand Reiter, 2006). Intrinsic evaluations of NLGsystems seek to evaluate properties of the system.Past NLG systems have typically been evaluatedusing human subjects (Dale and Mellish, 1998).Humans have been involved in either reading andrating texts and comparing the ratings for NLGgenerated texts against human written texts formetrics such as quality, correctness, naturalness,understandability, etc. Extrinsic evaluations, onthe other hand, have typically consisted of eval-uating the impact of a given system such as its ef-fectiveness for a given application (Belz and Re-iter, 2006). These can include measuring correct-ness of decisions made in a task based evaluation,measuring the number of post-edits by experts, ormeasuring usage/utility of a given system.
The intrinsic evaluation of text output qualityfor NLG systems has seen different evaluation ap-proaches. Recently, NLG systems have evaluated
57
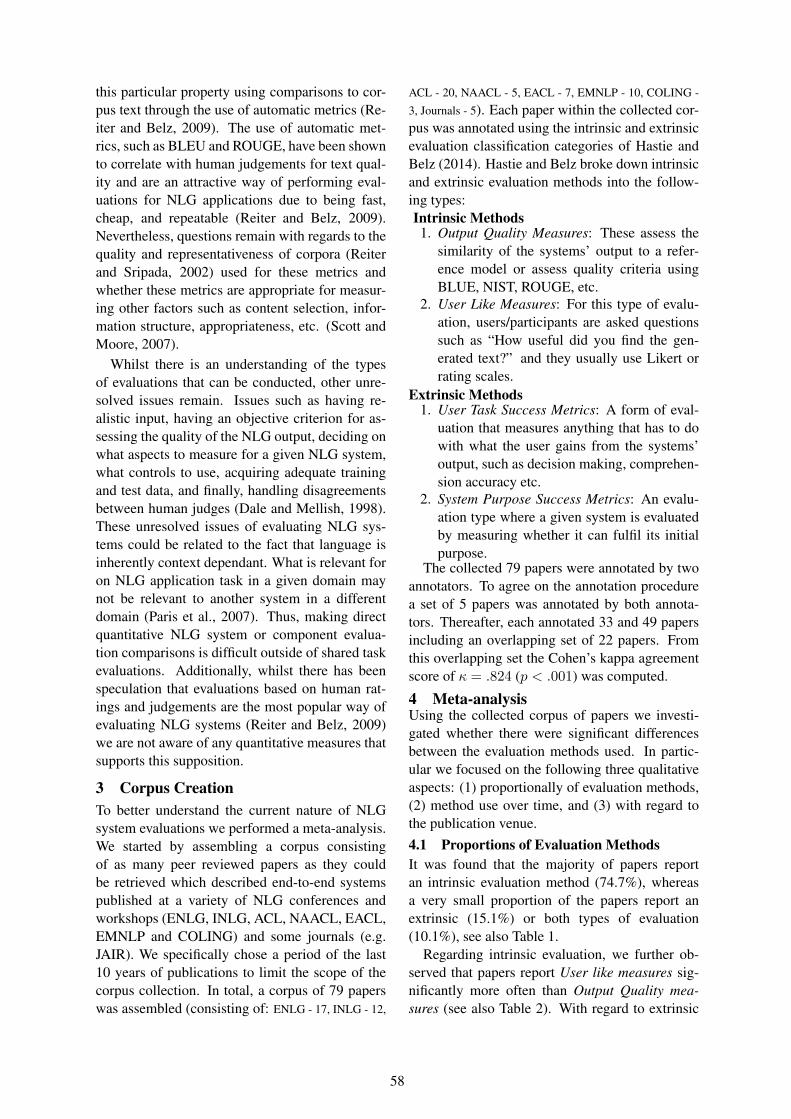
this particular property using comparisons to cor-pus text through the use of automatic metrics (Re-iter and Belz, 2009). The use of automatic met-rics, such as BLEU and ROUGE, have been shownto correlate with human judgements for text qual-ity and are an attractive way of performing eval-uations for NLG applications due to being fast,cheap, and repeatable (Reiter and Belz, 2009).Nevertheless, questions remain with regards to thequality and representativeness of corpora (Reiterand Sripada, 2002) used for these metrics andwhether these metrics are appropriate for measur-ing other factors such as content selection, infor-mation structure, appropriateness, etc. (Scott andMoore, 2007).
Whilst there is an understanding of the typesof evaluations that can be conducted, other unre-solved issues remain. Issues such as having re-alistic input, having an objective criterion for as-sessing the quality of the NLG output, deciding onwhat aspects to measure for a given NLG system,what controls to use, acquiring adequate trainingand test data, and finally, handling disagreementsbetween human judges (Dale and Mellish, 1998).These unresolved issues of evaluating NLG sys-tems could be related to the fact that language isinherently context dependant. What is relevant foron NLG application task in a given domain maynot be relevant to another system in a differentdomain (Paris et al., 2007). Thus, making directquantitative NLG system or component evalua-tion comparisons is difficult outside of shared taskevaluations. Additionally, whilst there has beenspeculation that evaluations based on human rat-ings and judgements are the most popular way ofevaluating NLG systems (Reiter and Belz, 2009)we are not aware of any quantitative measures thatsupports this supposition.
3 Corpus CreationTo better understand the current nature of NLGsystem evaluations we performed a meta-analysis.We started by assembling a corpus consistingof as many peer reviewed papers as they couldbe retrieved which described end-to-end systemspublished at a variety of NLG conferences andworkshops (ENLG, INLG, ACL, NAACL, EACL,EMNLP and COLING) and some journals (e.g.JAIR). We specifically chose a period of the last10 years of publications to limit the scope of thecorpus collection. In total, a corpus of 79 paperswas assembled (consisting of: ENLG - 17, INLG - 12,
ACL - 20, NAACL - 5, EACL - 7, EMNLP - 10, COLING -
3, Journals - 5). Each paper within the collected cor-pus was annotated using the intrinsic and extrinsicevaluation classification categories of Hastie andBelz (2014). Hastie and Belz broke down intrinsicand extrinsic evaluation methods into the follow-ing types:Intrinsic Methods1. Output Quality Measures: These assess the
similarity of the systems’ output to a refer-ence model or assess quality criteria usingBLUE, NIST, ROUGE, etc.
2. User Like Measures: For this type of evalu-ation, users/participants are asked questionssuch as “How useful did you find the gen-erated text?” and they usually use Likert orrating scales.
Extrinsic Methods1. User Task Success Metrics: A form of eval-
uation that measures anything that has to dowith what the user gains from the systems’output, such as decision making, comprehen-sion accuracy etc.
2. System Purpose Success Metrics: An evalu-ation type where a given system is evaluatedby measuring whether it can fulfil its initialpurpose.
The collected 79 papers were annotated by twoannotators. To agree on the annotation procedurea set of 5 papers was annotated by both annota-tors. Thereafter, each annotated 33 and 49 papersincluding an overlapping set of 22 papers. Fromthis overlapping set the Cohen’s kappa agreementscore of κ = .824 (p < .001) was computed.
4 Meta-analysisUsing the collected corpus of papers we investi-gated whether there were significant differencesbetween the evaluation methods used. In partic-ular we focused on the following three qualitativeaspects: (1) proportionally of evaluation methods,(2) method use over time, and (3) with regard tothe publication venue.4.1 Proportions of Evaluation MethodsIt was found that the majority of papers reportan intrinsic evaluation method (74.7%), whereasa very small proportion of the papers report anextrinsic (15.1%) or both types of evaluation(10.1%), see also Table 1.
Regarding intrinsic evaluation, we further ob-served that papers report User like measures sig-nificantly more often than Output Quality mea-sures (see also Table 2). With regard to extrinsic
58
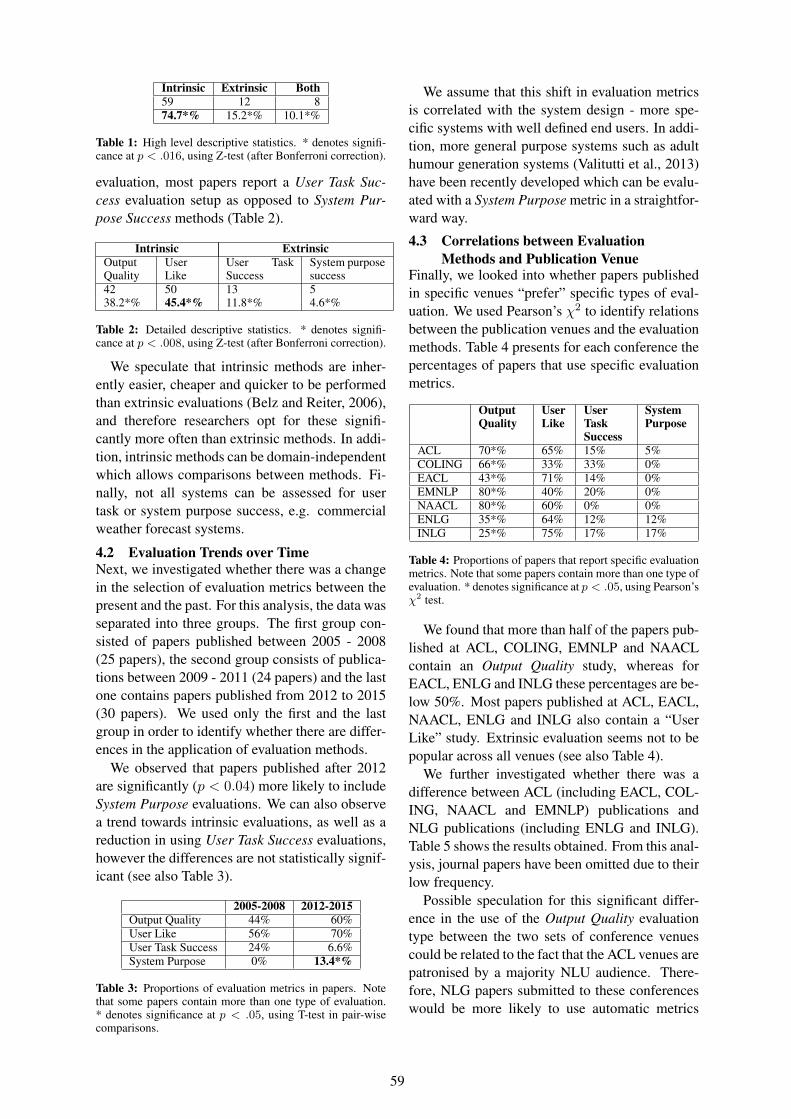
Intrinsic Extrinsic Both59 12 874.7*% 15.2*% 10.1*%
Table 1: High level descriptive statistics. * denotes signifi-cance at p < .016, using Z-test (after Bonferroni correction).
evaluation, most papers report a User Task Suc-cess evaluation setup as opposed to System Pur-pose Success methods (Table 2).
Intrinsic ExtrinsicOutputQuality
UserLike
User TaskSuccess
System purposesuccess
42 50 13 538.2*% 45.4*% 11.8*% 4.6*%
Table 2: Detailed descriptive statistics. * denotes signifi-cance at p < .008, using Z-test (after Bonferroni correction).
We speculate that intrinsic methods are inher-ently easier, cheaper and quicker to be performedthan extrinsic evaluations (Belz and Reiter, 2006),and therefore researchers opt for these signifi-cantly more often than extrinsic methods. In addi-tion, intrinsic methods can be domain-independentwhich allows comparisons between methods. Fi-nally, not all systems can be assessed for usertask or system purpose success, e.g. commercialweather forecast systems.
4.2 Evaluation Trends over TimeNext, we investigated whether there was a changein the selection of evaluation metrics between thepresent and the past. For this analysis, the data wasseparated into three groups. The first group con-sisted of papers published between 2005 - 2008(25 papers), the second group consists of publica-tions between 2009 - 2011 (24 papers) and the lastone contains papers published from 2012 to 2015(30 papers). We used only the first and the lastgroup in order to identify whether there are differ-ences in the application of evaluation methods.
We observed that papers published after 2012are significantly (p < 0.04) more likely to includeSystem Purpose evaluations. We can also observea trend towards intrinsic evaluations, as well as areduction in using User Task Success evaluations,however the differences are not statistically signif-icant (see also Table 3).
2005-2008 2012-2015Output Quality 44% 60%User Like 56% 70%User Task Success 24% 6.6%System Purpose 0% 13.4*%
Table 3: Proportions of evaluation metrics in papers. Notethat some papers contain more than one type of evaluation.* denotes significance at p < .05, using T-test in pair-wisecomparisons.
We assume that this shift in evaluation metricsis correlated with the system design - more spe-cific systems with well defined end users. In addi-tion, more general purpose systems such as adulthumour generation systems (Valitutti et al., 2013)have been recently developed which can be evalu-ated with a System Purpose metric in a straightfor-ward way.
4.3 Correlations between EvaluationMethods and Publication Venue
Finally, we looked into whether papers publishedin specific venues “prefer” specific types of eval-uation. We used Pearson’s χ2 to identify relationsbetween the publication venues and the evaluationmethods. Table 4 presents for each conference thepercentages of papers that use specific evaluationmetrics.
OutputQuality
UserLike
UserTaskSuccess
SystemPurpose
ACL 70*% 65% 15% 5%COLING 66*% 33% 33% 0%EACL 43*% 71% 14% 0%EMNLP 80*% 40% 20% 0%NAACL 80*% 60% 0% 0%ENLG 35*% 64% 12% 12%INLG 25*% 75% 17% 17%
Table 4: Proportions of papers that report specific evaluationmetrics. Note that some papers contain more than one type ofevaluation. * denotes significance at p < .05, using Pearson’sχ2 test.
We found that more than half of the papers pub-lished at ACL, COLING, EMNLP and NAACLcontain an Output Quality study, whereas forEACL, ENLG and INLG these percentages are be-low 50%. Most papers published at ACL, EACL,NAACL, ENLG and INLG also contain a “UserLike” study. Extrinsic evaluation seems not to bepopular across all venues (see also Table 4).
We further investigated whether there was adifference between ACL (including EACL, COL-ING, NAACL and EMNLP) publications andNLG publications (including ENLG and INLG).Table 5 shows the results obtained. From this anal-ysis, journal papers have been omitted due to theirlow frequency.
Possible speculation for this significant differ-ence in the use of the Output Quality evaluationtype between the two sets of conference venuescould be related to the fact that the ACL venues arepatronised by a majority NLU audience. There-fore, NLG papers submitted to these conferenceswould be more likely to use automatic metrics
59

OutputQuality
UserLike
UserTaskSuccess
SystemPurpose
ACL 68*% 57% 15% 2%NLG 31*% 68% 13% 13%
Table 5: Proportions of ACL vs NLG papers that reportspecific evaluation metrics. Note that some papers containmore than one type of evaluation. * denotes significance atp < .05, using Pearson’s χ2 test.
(such as BLEU or ROUGE) as these measures arewidely used by the NLU community as well.
5 DiscussionOutput quality evaluations using automatic met-rics can be repeatable (Belz and Reiter, 2006).However, automatic evaluations require largealigned corpora (input and output data), which arenot always available for NLG. In such cases, othertypes of evaluations are preferred. In addition, Re-iter and Sripada (2002) argue that the informationpresented in aligned corpora might not be alwaystrue, due to the fact that text from experts can beerroneous. Output quality metrics are sensitive tothis, therefore, the research community often usesautomatic metrics paired with other types of eval-uations (55%) in order to overcome this barrier.
User like metrics are straightforward and eas-ily applicable, therefore it is not surprising thatthese are the most popular measures among re-searchers. These metrics can evaluate an NLGsystem quickly and thus can be incorporated inany stage of a system’s design. User likeness isone indication of whether a system is going to beused, as users will not use a system that they donot like. However, success on user like metricsdoes not equate with system purpose success anduser task success. Although there are studies dis-cussing the relation between output quality met-rics and user like metrics e.g. (Foster, 2008; Belzand Reiter, 2006), to our knowledge there are notany studies discussing the relation between userlike metrics and extrinsic metrics.
Finally, extrinsic metrics have been the leastpopular among researchers, due to their time-consuming nature and their complication to beorganised. In addition, extrinsic metrics can bealso expensive. For instance, the STOP evalua-tion cost £75,000 over 20 months; the SKILL-SUM and BT45 evaluations cost about £20,000over six months (Reiter and Belz, 2009).
6 ConclusionAt present NLG evaluation does not include astandardised approach for evaluating systems. Al-
though papers tend to use automatic methodsto overcome this limitation (especially papers atACL conferences), extrinsic methods are morethorough than intrinsic and they can provide usefulinsights of the domains’ needs, and thus they pro-vide better indications of the systems’ usefulnessand utility. However, quicker and less resource in-tensive means are needed to allow for more sys-tems to be evaluated with extrinsic methods.
In future, we will expand the scope of the surveyby adding a greater number of journal papers foranalysis and secondly and by looking at the quan-titative evaluation differences between NLG sys-tems and components. In addition, we will lookinto whether specific organisation and/or groupsof researchers have influenced the evaluation ap-proaches. Finally, it would be interesting to inves-tigate whether the influential papers (for instancepapers with high number of citations) have playeda role in the selection of the evaluation methods.
ReferencesAnja Belz and Ehud Reiter. 2006. Comparing automatic and
human evaluation of nlg systems. In EACL.
Robert Dale and Chris Mellish. 1998. Towards the Eval-uation of Natural Language Generation. In Proceedingsof the First International Conference on Language Re-sources and Evaluation, volume 562.
Mary Ellen Foster. 2008. Automated Metrics That AgreeWith Human Judgements On Generated Output for an Em-bodied Conversational Agent. In Proceedings of the FifthInternational Natural Language Generation Conference,pages 95–103.
Helen Hastie and Anja Belz. 2014. A Comparative Eval-uation Methodology for NLG in Interactive Systems. InProceedings of the Language Resources and EvaluationConference.
Cecile Paris, Donia Scott, Nancy Green, Kathy McCoy, andDavid McDonald. 2007. Desiderata for Evaluation ofNatural Language Generation. In Shared Tasks and Com-parative Evaluation on Natural Language Generation -Workshop Report, pages 9–15.
Ehud Reiter and Anja Belz. 2009. An Investigation into theValidity of Some Metrics for Automatically EvaluatingNatural Language Generation Systems. ComputationalLinguistics, 35(4):529–558.
Ehud Reiter and Somayajulu Sripada. 2002. Should corporatexts be gold standards for NLG? In INLG, pages 97–104,Harriman, NY.
Donia Scott and Johanna Moore. 2007. An NLG evaluationcompetition? Eight reasons to be cautious. In Workshopon Shared Tasks and Comparative Evaluation in NaturalLanguage Generation, pages 22–23, Arlington, VA.
Alessandro Valitutti, Hannu Toivonen, Antoine Doucet, andJukka M. Toivanen. 2013. ”Let Everything Turn Well inYour Wife”: Generation of Adult Humor Using LexicalConstraints. In ACL.
60

Proceedings of the 15th European Workshop on Natural Language Generation (ENLG), pages 61–65,Brighton, September 2015. c©2015 Association for Computational Linguistics
Japanese Word Reordering Executed Concurrently withDependency Parsing and Its Evaluation
Tomohiro Ohno1,a) Kazushi Yoshida2) Yoshihide Kato3,b) Shigeki Matsubara2,c)
1Information Technology Center, Nagoya University, Japan2Graduate School of Information Science, Nagoya University, Japan
3Information & Communications, Nagoya University, Japana)[email protected] b)[email protected]
Abstract
This paper proposes a method for re-ordering words in a Japanese sentencebased on concurrent execution with de-pendency parsing so that the sentence be-comes more readable. Our contributionsare summarized as follows: (1) we ex-tend a probablistic model used in the pre-vious work which concurrently performsword reordering and dependency parsing;(2) we conducted an evaluation experi-ment using our semi-automatically con-structed evaluation data so that sentencesin the data are more likely to be spon-taneously written by natives than the au-tomatically constructed evaluation data inthe previous work.
1 Introduction
Although Japanese has relatively free word order,Japanese word order is not completely arbitraryand has some sort of preference. Since such pref-erence is incompletely understood, even Japanesenatives often write Japanese sentences which aregrammatically well-formed but not easy to read.For example, in Figure 1, the word order of S1is less readable than that of S2 because the dis-tance between the bunsetsu “Suzuki-san-ga (Mr.Suzuki)” and its modified bunsetsu “toi-te-shimat-ta (solved)” is large and thus the loads on workingmemory become large (Nihongo Kijutsu BunpoKenkyukai, 2009; Uchimoto et al., 2000)
There have been some conventional researchesfor reordering words in a sentence so that the sen-tence becomes easier to read (Belz et al., 2011;Filippova and Strube, 2007; Harbusch et al., 2006;Kruijff et al., 2001; Ringger et al., 2004; Shaw andHatzivassiloglou, 1999; Uchimoto et al., 2000;Yokobayashi et al., 2004). Most of the conven-tional researches used syntactic information by as-suming that an input sentence for word reordering
�����
������
��������
����� �
���� ���
�������������
���������
����
�������
����
����������
�������
����
������
����
� ��������
��������������������������
�������
�� �����
������
���������������������
�����
������
��������
����� �
���� ���
�������������
���������
����
�������
����
����������
�������
����
������
����
� ��������
�������
�� �����
������
Note: A box and an arrow express a bunsetsu1 and a dependency relation,respectively. Both the sentences S1 and S2 have the same meaning which istranslated as “Mr. Suzuki instantly solved the problem that Mr. Sato could notpossibly solve.” in English. The difference between S1 and S2 is just in theirword orders in Japanese.
Figure 1: Example of less-readable/readable wordorder
has been already parsed. There is a problem thatthe errors of dependency parsing increase whenan input sentence is less-readable, and the parsingerrors cause negative effects on word reordering.To solve the problem, we previously proposed amethod for concurrently performing word reorder-ing and dependency parsing and confirmed the ef-fectiveness of their proposed method using evalu-ation data created by randomly changing the wordorder in newspaper article sentences (Yoshida etal., 2014). However, since some of the just au-tomatically created sentences are unlikely to bespontaneously written by a native, the evaluationis thought to be not enough. In addition, the prob-ablistic model has room for improvement in target-ing at sentences which a native is likely to sponta-neously write.
This paper proposes a new method on Japaneseword reordering based on concurrent executionwith dependency parsing by extending the prob-ablistic model proposed by Yoshida et al. (2014),and describes an evaluation experiment using our
1Bunsetsu is a linguistic unit in Japanese that roughly cor-responds to a basic phrase in English. A bunsetsu consists ofone independent word and zero or more ancillary words. Adependency relation in Japanese is a modification relation inwhich a modifier bunsetsu depends on a modified bunsetsu.That is, the modifier bunsetsu and the modified bunsetsu workas modifier and modifyee, respectively.
61
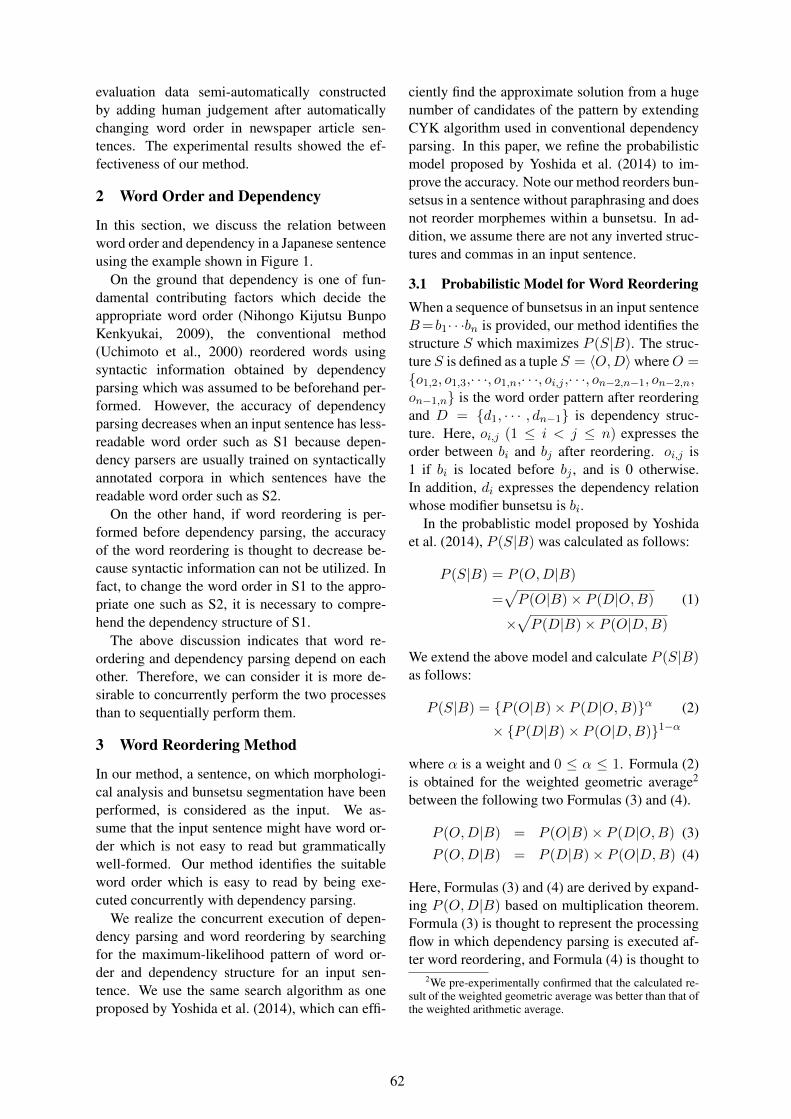
evaluation data semi-automatically constructedby adding human judgement after automaticallychanging word order in newspaper article sen-tences. The experimental results showed the ef-fectiveness of our method.
2 Word Order and Dependency
In this section, we discuss the relation betweenword order and dependency in a Japanese sentenceusing the example shown in Figure 1.
On the ground that dependency is one of fun-damental contributing factors which decide theappropriate word order (Nihongo Kijutsu BunpoKenkyukai, 2009), the conventional method(Uchimoto et al., 2000) reordered words usingsyntactic information obtained by dependencyparsing which was assumed to be beforehand per-formed. However, the accuracy of dependencyparsing decreases when an input sentence has less-readable word order such as S1 because depen-dency parsers are usually trained on syntacticallyannotated corpora in which sentences have thereadable word order such as S2.
On the other hand, if word reordering is per-formed before dependency parsing, the accuracyof the word reordering is thought to decrease be-cause syntactic information can not be utilized. Infact, to change the word order in S1 to the appro-priate one such as S2, it is necessary to compre-hend the dependency structure of S1.
The above discussion indicates that word re-ordering and dependency parsing depend on eachother. Therefore, we can consider it is more de-sirable to concurrently perform the two processesthan to sequentially perform them.
3 Word Reordering Method
In our method, a sentence, on which morphologi-cal analysis and bunsetsu segmentation have beenperformed, is considered as the input. We as-sume that the input sentence might have word or-der which is not easy to read but grammaticallywell-formed. Our method identifies the suitableword order which is easy to read by being exe-cuted concurrently with dependency parsing.
We realize the concurrent execution of depen-dency parsing and word reordering by searchingfor the maximum-likelihood pattern of word or-der and dependency structure for an input sen-tence. We use the same search algorithm as oneproposed by Yoshida et al. (2014), which can effi-
ciently find the approximate solution from a hugenumber of candidates of the pattern by extendingCYK algorithm used in conventional dependencyparsing. In this paper, we refine the probabilisticmodel proposed by Yoshida et al. (2014) to im-prove the accuracy. Note our method reorders bun-setsus in a sentence without paraphrasing and doesnot reorder morphemes within a bunsetsu. In ad-dition, we assume there are not any inverted struc-tures and commas in an input sentence.
3.1 Probabilistic Model for Word ReorderingWhen a sequence of bunsetsus in an input sentenceB =b1· · ·bn is provided, our method identifies thestructure S which maximizes P (S|B). The struc-ture S is defined as a tuple S = ⟨O,D⟩ where O ={o1,2, o1,3,· · ·, o1,n,· · ·, oi,j ,· · ·, on−2,n−1, on−2,n,on−1,n} is the word order pattern after reorderingand D = {d1, · · · , dn−1} is dependency struc-ture. Here, oi,j (1 ≤ i < j ≤ n) expresses theorder between bi and bj after reordering. oi,j is1 if bi is located before bj , and is 0 otherwise.In addition, di expresses the dependency relationwhose modifier bunsetsu is bi.
In the probablistic model proposed by Yoshidaet al. (2014), P (S|B) was calculated as follows:
P (S|B) = P (O, D|B)
=√
P (O|B) × P (D|O, B) (1)
×√
P (D|B) × P (O|D,B)
We extend the above model and calculate P (S|B)as follows:
P (S|B) = {P (O|B) × P (D|O, B)}α (2)
× {P (D|B) × P (O|D,B)}1−α
where α is a weight and 0 ≤ α ≤ 1. Formula (2)is obtained for the weighted geometric average2
between the following two Formulas (3) and (4).
P (O, D|B) = P (O|B) × P (D|O,B) (3)
P (O, D|B) = P (D|B) × P (O|D, B) (4)
Here, Formulas (3) and (4) are derived by expand-ing P (O, D|B) based on multiplication theorem.Formula (3) is thought to represent the processingflow in which dependency parsing is executed af-ter word reordering, and Formula (4) is thought to
2We pre-experimentally confirmed that the calculated re-sult of the weighted geometric average was better than that ofthe weighted arithmetic average.
62

��������������
���������� �����
���������� �����
��������������
����� ����������
���� ��������
������ ���������� ����
��� �������� �����������������������������
������ ����
Figure 2: Relationships among Formulas (2) – (4).
represent the inverse flow. According to the prob-ability theory, the calculated result of Formula (2)is equal to those of Formulas (3) and (4). How-ever, in practice, since each factor in the formulasis estimated based on a training corpus, the resultsof these formulas are different from each other.
Figure 2 shows a conceptual diagram whichrepresents relations among Fomulas (2) – (4). Ifan input sentence has low adequacy of word order,it is thought that performing word reordering be-fore dependency parsing enables S = ⟨O, D⟩ tobe identified with higher accuracy, and thus, wecan conceive an idea of calculating P (O, D|B)by Fomula (3). Conversely, if an input sentencehas high adequacy of word order, it is probablybetter to perform word reordering after depen-dency parsing, and thus, we can think of calcu-lating P (O, D|B) by Fomula (4). Therefore, wemix Formulas (3) and (4) by adjusting the weightα depending on the adequacy of word order in aninput sentence, instead of using the constant 0.5in the previous model proposed by Yoshida et al.(2014).
Each factor in Formula (2) is estimated by themaximum entropy method in the same approxima-tion procedure as that of Yoshida et al. (2014).
4 Experiment
To evaluate the effectiveness of our method, weapplied our method to less-readable sentences ar-tificially created by changing the word order ofJapanese newspaper article sentences, and evalu-ated how much our method could reproduce theword order of the original sentences.
4.1 Construction of Evaluation DataFrom a viewpoint of utilizing our method for sup-port revision, it is desirable to use less-readablesentences spontaneously written by Japanese na-tives in the experiment. However, it is not easy tocollect a large amount of pairs composed of sucha sentence and the corresponding sentence whichwas modified by hand so that the word order be-comes readable, and also, such data is unavailable.In addition, since spontaneously written sentenceshave many factors other than word order which de-crease the readability, it is difficult to conduct theevaluation with a focus solely on word order.
Therefore, our previous work (Yoshida et al.,2014) artificially generated sentences which werenot easy to read, by just automatically chang-ing the word order of newspaper article sentencesin Kyoto Text Corpus3 based on the dependencystructure. However, just automatically changingthe word order may create sentences which are un-likely to be written by a native. To solve the prob-lem, we semi-automatically constructed the evalu-ation data by adding human judgement. That is, ifa subject judges that a sentence generated by auto-matically changing the word order in the same wayas the previous work (Yoshida et al., 2014) mayhave spontaneously written by a native. Our con-structed data has 552 sentences including 4,906bunsetsus.
4.2 Outline of ExperimentSince our method needs to decide the weight α inFormula (2) in advance, we conducted 5-fold crossvalidation using the evaluation data constructed inSection 4.1. Concretely, we divided 552 sentencesinto 5 sets, and then, we repeated an experiment5 times, in which we used one set from among 5sets as the test data and the others as the held-outdata to decide α. As the training data to estimateeach probability in Formula (2), we used 7,976sentences in Kyoto Text Corpus, which were dif-ferent from the 552 sentences. Here, we used theMaximum Entropy Modeling Toolkit for Pythonand C++4 with the default options except “-i (iter-ation) 1000.”
In the evaluation of word reordering, we ob-tained the complete agreement (the percentageof the sentences in which all words’ order com-pletely agrees with that of the original sentence)
3http://nlp.ist.i.kyoto-u.ac.jp/EN/
4http://homepages.inf.ed.ac.uk/lzhang10/maxent_
toolkit.html
63
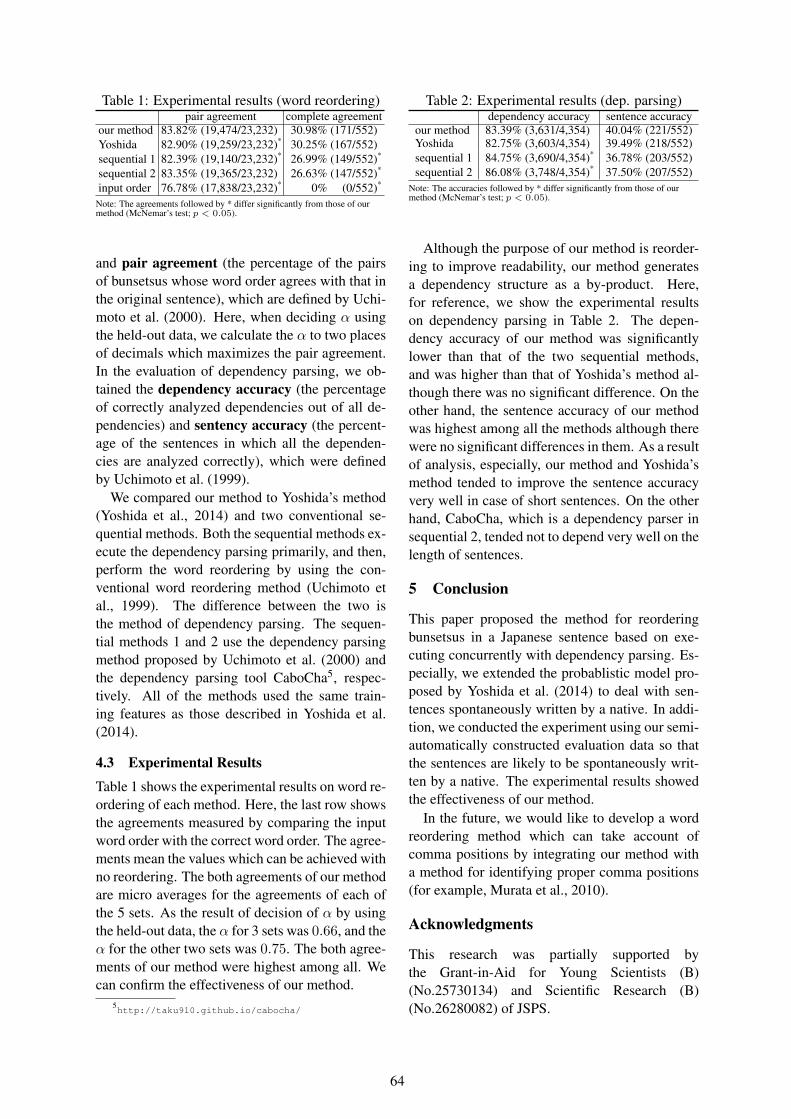
Table 1: Experimental results (word reordering)pair agreement complete agreement
our method 83.82% (19,474/23,232) 30.98% (171/552)Yoshida 82.90% (19,259/23,232)* 30.25% (167/552)sequential 1 82.39% (19,140/23,232)* 26.99% (149/552)*
sequential 2 83.35% (19,365/23,232) 26.63% (147/552)*
input order 76.78% (17,838/23,232)* 0% (0/552)*
Note: The agreements followed by * differ significantly from those of ourmethod (McNemar’s test; p < 0.05).
and pair agreement (the percentage of the pairsof bunsetsus whose word order agrees with that inthe original sentence), which are defined by Uchi-moto et al. (2000). Here, when deciding α usingthe held-out data, we calculate the α to two placesof decimals which maximizes the pair agreement.In the evaluation of dependency parsing, we ob-tained the dependency accuracy (the percentageof correctly analyzed dependencies out of all de-pendencies) and sentency accuracy (the percent-age of the sentences in which all the dependen-cies are analyzed correctly), which were definedby Uchimoto et al. (1999).
We compared our method to Yoshida’s method(Yoshida et al., 2014) and two conventional se-quential methods. Both the sequential methods ex-ecute the dependency parsing primarily, and then,perform the word reordering by using the con-ventional word reordering method (Uchimoto etal., 1999). The difference between the two isthe method of dependency parsing. The sequen-tial methods 1 and 2 use the dependency parsingmethod proposed by Uchimoto et al. (2000) andthe dependency parsing tool CaboCha5, respec-tively. All of the methods used the same train-ing features as those described in Yoshida et al.(2014).
4.3 Experimental Results
Table 1 shows the experimental results on word re-ordering of each method. Here, the last row showsthe agreements measured by comparing the inputword order with the correct word order. The agree-ments mean the values which can be achieved withno reordering. The both agreements of our methodare micro averages for the agreements of each ofthe 5 sets. As the result of decision of α by usingthe held-out data, the α for 3 sets was 0.66, and theα for the other two sets was 0.75. The both agree-ments of our method were highest among all. Wecan confirm the effectiveness of our method.
5http://taku910.github.io/cabocha/
Table 2: Experimental results (dep. parsing)dependency accuracy sentence accuracy
our method 83.39% (3,631/4,354) 40.04% (221/552)Yoshida 82.75% (3,603/4,354) 39.49% (218/552)sequential 1 84.75% (3,690/4,354)* 36.78% (203/552)sequential 2 86.08% (3,748/4,354)* 37.50% (207/552)
Note: The accuracies followed by * differ significantly from those of ourmethod (McNemar’s test; p < 0.05).
Although the purpose of our method is reorder-ing to improve readability, our method generatesa dependency structure as a by-product. Here,for reference, we show the experimental resultson dependency parsing in Table 2. The depen-dency accuracy of our method was significantlylower than that of the two sequential methods,and was higher than that of Yoshida’s method al-though there was no significant difference. On theother hand, the sentence accuracy of our methodwas highest among all the methods although therewere no significant differences in them. As a resultof analysis, especially, our method and Yoshida’smethod tended to improve the sentence accuracyvery well in case of short sentences. On the otherhand, CaboCha, which is a dependency parser insequential 2, tended not to depend very well on thelength of sentences.
5 Conclusion
This paper proposed the method for reorderingbunsetsus in a Japanese sentence based on exe-cuting concurrently with dependency parsing. Es-pecially, we extended the probablistic model pro-posed by Yoshida et al. (2014) to deal with sen-tences spontaneously written by a native. In addi-tion, we conducted the experiment using our semi-automatically constructed evaluation data so thatthe sentences are likely to be spontaneously writ-ten by a native. The experimental results showedthe effectiveness of our method.
In the future, we would like to develop a wordreordering method which can take account ofcomma positions by integrating our method witha method for identifying proper comma positions(for example, Murata et al., 2010).
Acknowledgments
This research was partially supported bythe Grant-in-Aid for Young Scientists (B)(No.25730134) and Scientific Research (B)(No.26280082) of JSPS.
64

ReferencesAnja Belz, Michael White, Dominic Espinosa, Eric
Kow, Deirdre Hogan, and Amanda Stent. 2011. Thefirst surface realisation shared task: Overview andevaluation results. In Proceedings of the 13th Eu-ropean Workshop on Natural Language Generation(ENLG2011), pages 217–226.
Katja Filippova and Michael Strube. 2007. Generatingconstituent order in German clauses. In Proceedingsof the 45th Annual Meeting of the Association forComputational Linguistics (ACL2007), pages 320–327.
Karin Harbusch, Gerard Kempen, Camiel van Breugel,and Ulrich Koch. 2006. A generation-orientedworkbench for performance grammar: Capturinglinear order variability in German and Dutch. InProceedings of the 4th International Natural Lan-guage Generation Conference (INLG2006), pages9–11.
Geert-Jan M. Kruijff, Ivana Kruijff-Korbayova, JohnBateman, and Elke Teich. 2001. Linear orderas higher-level decision: Information structure instrategic and tactical generation. In Proceedings ofthe 8th European Workshop on Natural LanguageGeneration (ENLG2001), pages 74–83.
Nihongo Kijutsu Bunpo Kenkyukai, editor, 2009.Gendai nihongo bunpo 7 (Contemporary JapaneseGrammar 7), pages 165–182. Kuroshio Shuppan.(In Japanese).
Eric Ringger, Michael Gamon, Robert C. Moore,David Rojas, Martine Smets, and Simon Corston-Oliver. 2004. Linguistically informed statisticalmodels of constituent structure for ordering in sen-tence realization. In Proceedings of the 20th In-ternational Conference on Computational Linguis-tics (COLING2004), pages 673–679.
James Shaw and Vasileios Hatzivassiloglou. 1999. Or-dering among premodifiers. In Proceedings of the37th Annual Meeting of the Association for Compu-tational Linguistics (ACL ’99), pages 135–143.
Kiyotaka Uchimoto, Satoshi Sekine, and Hitoshi Isa-hara. 1999. Japanese dependency structure analysisbased on maximum entropy models. In Proceed-ings of the 9th Conference of the European Chap-ter of the Association for Computational Linguis-tics (EACL ’99), pages 196–203.
Kiyotaka Uchimoto, Masaki Murata, Qing Ma, SatoshiSekine, and Hitoshi Isahara. 2000. Word or-der acquisition from corpora. In Proceedings ofthe 18th International Conference on ComputationalLinguistics (COLING2000), volume 2, pages 871–877.
Hiroshi Yokobayashi, Akira Suganuma, and Rin-ichiroTaniguchi. 2004. Generating candidates for rewrit-ing based on an indicator of complex dependency
and it’s application to a writing tool. Journal of In-formation Processing Society of Japan, 45(5):1451–1459. (In Japanese).
Kazushi Yoshida, Tomohiro Ohno, Yoshihide Kato,and Shigeki Matsubara. 2014. Japanese word re-ordering integrated with dependency parsing. InProceedings of the 25th International Conference onComputational Linguistics (COLING2014), pages1186–1196.
65

Proceedings of the 15th European Workshop on Natural Language Generation (ENLG), pages 66–70,Brighton, September 2015. c©2015 Association for Computational Linguistics
Sentence Ordering in Electronic Navigational ChartCompanion Text Generation
Julie Sauvage-VincentInstitut Mines-Télécom
Télécom BretagneTechnopôle Brest Iroise
CS 8381829238 Brest Cedex 3, [email protected]
Yannis HaralambousInstitut Mines-Télécom
Télécom BretagneTechnopôle Brest Iroise
CS 8381829238 Brest Cedex 3, France
John PuentesInstitut Mines-Télécom
Télécom BretagneTechnopôle Brest Iroise
CS 8381829238 Brest Cedex 3, France
Abstract
We present the sentence ordering part of anatural language generation module, usedin the framework of a knowledge base ofelectronic navigation charts and sailing di-rections. The particularity of the knowl-edge base is that it is based on a controlledhybrid language, that is the combination ofa controlled natural language and a con-trolled visual language. The sentence or-dering process is able to take into accounthybrid (textual and visual) information, in-volving cartographic data, as well as land-scape “read” by the navigator.
1 Introduction
The French Marine Hydrographic and Oceano-graphic Service (SHOM, Service Hydrographiqueet Océanographique de la Marine) issues, on aquadrennial basis, Instructions nautiques, a seriesof nautical books providing navigators of coastaland intracoastal waters with useful information.
Instructions nautiques are intended as a com-plement to Electronic Navigational Charts (ENCs)and add a wide variety of essential information notprovided in the ENCs for maritime navigation. Inthis sense they are considered as companion textsof ENCs.
Information found in Instructions nautiques arein some cases subject to real-time updates. Tomake this possible, an ongoing SHOM project is tobuild a knowledge base (KB) covering both ENCsand nautical instructions. This KB is intended tocommunicate with ENCs and more globally withany compatible Electronic Charts Display Infor-mation System.
Updates are planned to be operated mainly bySHOM domain experts, who may not be neces-sarily proficient in ontology formalism or in lan-guage technology. Therefore, it has been decided
to use a controlled natural language for exchangesbetween experts and the KB (Haralambous et al.,2014). On the other hand, information containedin the KB covers not only (textual) Instructionsnautiques but also (visual) ENCs. These twomodalities are tightly bound, coreferential andcomplementary: each modality covers informa-tion that the other is unable to transmit.
In order to establish intermodal coreferential-ity and complementarity, a new type of controlledlanguage has been defined (Haralambous et al.,2015), called controlled hybrid language (CHL),which is intended to be based on hybrid sentences,like for instance:
êMorania #130
LAKE ERIE
[The wreck of Morania 130]lies at the bottom of [lakeErie].
In Fig. 1 (on the next page), the reader can see this(multimodal) sentence analyzed. On the bottom ofthe figure one can see the two visual and textualmodalities; and above them, the correspondingsyntactic trees: on the right, the usual constituencysyntax tree of the textual sentence (georeferencednamed entities, placed in brackets, are consideredas indivisible noun phrases); on the left, the syn-tax tree of a small part of the map, considered as asentence in a visual language, using the Symbol-Relation formalism (Ferrucci et al., 1996; Ferrucciet al., 1998). In both cases, the formal grammarshave synthesized attributes (in the sense of Knuth(1968)) carrying semantics: using a bottom-upsynthesis approach we obtain their semantics, rep-resented as First-Order Logic graphs (predicatesare hexagons, connectors are circles, functions arerounded rectangles, and constants are rectangles).Once the two graphs are established, and after acoreference resolution step, they are transformedand merged into the KB graph, at the top.
When starting from the KB, operators V andT filter their input into information that is repre-sented visually and information that is represented
66

#1 #2 #1 #2 #1 #2#1
#2
#1
D0
B2
B3 B4NTPP(B3,B4)
B5 s2
λ( ,"Morania 130")
λ(B5,s2)
"Morania 130"
B6 λ(B6,s3)s3
λ( ,"lake Erie")"lake Erie"
NTPP(B5,B4)
NTPP(B5,B6)
NTPP( , )
S
NP
NN
VP
V PP
P NP
NP PP
DET N P NP
NN
[The wreck of Morania 130] lies
at
the bottom of
[lake Erie][The wreck of Morania 130] lies at the bottom of [lake Erie]
lies(#1,#2)
bottom(#1)
@type=Wreck@coord=(42.83978,-78.93453)
@name="Morania 130"
lies(#1,#2)
bottom(#1)NTPP(#1,#2) λ(#1,#2) λ(#1,#2)
@type=Lake@coord=(42.135,81.170)
@name="Lake Erie"
"Lake Erie" "[the wreck of Morania 130]" "[Lake Erie]"
#1
#1
#2
"Morania 130"
MergeMerge
VLG NLGSemantics Semantics
Semantics of controlled visual language
Semantics of controlled natural language
Semantics of controlled hybrid language
Figure 1: An example of sentence in the CHL INAUT (taken from Haralambous et al. (2015)).
textually (with some redundancy in order to es-tablish coreferential entities). Their outputs aregraphs corresponding to FOL formulas. To obtaintext, we use NLG and VLG (visual language gen-eration) to obtain a part of the map.
The goal of the INAUT NLG module—whichwe are currently developing—is to produce themost fluent1 multi-sentence texts possible. Thispaper addresses the stage of sentence ordering (aspart of discourse planning), which plays a centralrole in the achievement of this goal.
2 Related work
Ordering sentences to create a natural and under-standable paragraph for the reader is part of whatReiter and Dale (2000) call discourse planning.
A widely used approach to discourse planningis based on rhetorical structure theory (Mann andThompson, 1988), which requires writing a rulefor each textual structure. Although this solu-tion has been proved efficient in various contexts(cf. Taboada and Mann (2006)), this is not the casefor the Instructions nautiques corpus, written bydifferent authors who do not necessarily share thesame rhetorical structures and processes.
The NaturalOWL (Androutsopoulos et al.(2013)) system per se could be used for INAUT
1In the sense of criteria S1–S5 of Androutsopoulos et al.(2013, p. 703).
automatic text generation, if there were not forsome major differences. NaturalOWL is essen-tially based on Centering Theory, i.e., it respectsthematic intersentential coherence. In our casethere are some additional issues, related to the factthat INAUT is build upon a hybrid language: in-formation contained in text is not the only inputanymore, and we must guarantee conformance tothe itinerary of a vessel, to the geographic “guid-ing path” of each Instructions nautiques volumeand, last but not least, to the visual characteristicsof the landscape. Indeed, Instructions nautiquesare, inter alia, textual interpretations of the realworld as seen by the navigator, and for this reasonsentence order must respect the order navigators“read” the landscape. Another major differencein our system is real-time interaction with users.The latter necessarily has an impact on the struc-ture of generated text: when content determinationmay be relaunched on different data every few mil-liseconds, the stability of generated text becomesa major issue.
3 Data and pre-processing
The corpus consists of 462 INAUT controlled hy-brid language sentences manually translated fromthe legacy Instructions nautiques.
Let us consider the first step of NLG, namelycontent determination.
2
67

3.1 Content determination
Among the attributes of nodes in the KB we havecoordinates for all geolocalized objects. There-fore, hybrid language structure provides a link be-tween geolocalization and (textual) sentence en-tities. Content determination can be initiated byboth (1) textual criteria (selecting a paragraph inthe document tree structure), and (2) visual crite-ria (selecting an area on an ENC).
In case (1), one obtains immediately a sub-graph of the KB by taking the nodes hierarchi-cally located under the chosen paragraph node. Incase (2), a query sent to the KB server returns allgeoreferenced nodes located entirely or partiallyin the selected area of the map.In both cases oneobtains a (not necessarily connected) subgraph ofthe KB.
By the nature of the data, two further steps areneeded, both obtained by inference, but on differ-ent kinds of data, namely spatial data and tempo-ral/meteorological context.
The first inference step concerns cases where in-formation about a geolocalized object can be in-ferred from the map. More generally, one can ex-tract knowledge from the map data, which willcomplement, enhance, or contradict the textualdata.
As for temporal and meteorological context,tide and weather conditions obviously have an im-pact on navigation. This is also the case for reg-ulations based on a schedule. Inference based onthese data may act as a filter on the subgraph ob-tained either hierarchically or by area selection.
Finally, an important feature of the INAUT sys-tem is to inform navigators on potentially danger-ous situations. By attaching—either manually orby applying inference to geography and context—a dangerousness coefficient to specific nodes un-der given conditions, the system may introducespecific warnings in the generated text.
4 Modelling the domain experts sentenceordering process
We consider the discourse planner as a multicrite-ria decision process based on frequent patterns ofthe writing process. Therefore, our main task is tomodel the implicit knowledge of authors concern-ing the description of a maritime environment.
4.1 Domain experts sentence orderingprocess
We detected common patterns in the way authorsdescribe the maritime environment, and will try todiscuss them from a cognitive and linguistic pointof view.
These patterns are constrained by several crite-ria: our approach is to assign score to each crite-rion found in a sentence, in order to calculate theglobal sentence score in our “bag” of sentences,and reorganize the latter by sorting it in decreasingorder of score. The greater the score, the greaterthe likelihood for the sentence to appear at the be-ginning of a paragraph. The computation of thescore is done by the sum f(s) =
∑ni=1 ci · wi
where s is a sentence, ci is a criterion value andwi is the corresponding score. Given a set S of nsentences si, if f(s1) > f(s2), then the sentences1 is more likely to precede s2.
To assign score to objects, we must understandwhich features domain experts use to describe anatural environment in general.
Let us consider the different features used in ourordering sentences module.
Landmarks When dealing with (a) authors tend touse landmarks as much as possible. Selection ofelements useful in assisting human navigation inan open space has been addressed in the context ofurban orientation. Michon and Denis (2001) attestthe landmark usage preference in order to identifyareas where difficulties in term of way finding arelikely to occur.
We find this preference in our corpus as well:Instructions nautiques authors often prefer man-made landmarks —that facilitate the environmentreading— over natural objects.
Geometric primitives Objects occurring in the de-scription of a map or of a landscape can be ofthree different topological natures: areas, linesand points. We observed that SHOM domain ex-perts describe objects in this order: polygonalshapes before lines, before points. According toBrosset et al. (2008) this can be explained by thefact that, from the point of view of observers, natu-ral environment is seen as a spatial network: linearobjects structure the network with edges and links,polygonal shapes act as a partition of the space,and finally points act as visual landmarks.
3
68

Name and size Two other features are directlyconnected to individual objects: their size andname. Indeed, named objects appear more fre-quently in the corpus than unnamed ones andlarger objects more frequently than smaller ones.
Proximity spaces Another feature taking part inthe multicriteria decision process is geographicposition relative to the vessel.
When receiving directions, users tend to createby anticipation a mental representation of the route—whether they are standard or problematic routes.Unlike pedestrian navigation, maritime navigationrequires a most precise representation of the sur-rounding and forthcoming environment.
According to Tversky (2003) humans struc-ture environment in various mental spaces.Le Yaouanc et al. (2010) extended Tversky’sspaces to proximity spaces. These structure thevisual perception of the landscape and therefore,logically, also its description. Proximity spacesare defined by actions users are able to performwithin them. We distinguish four different prox-imity spaces (from the closest to the observer tothe furthest away): (a) the space of the body,(b) the experienced space, (c) the distant space(d) and, finally, the space at the horizon. In theirpaper, Le Yaouanc et al. (2010) state that the dif-ferent subjects of their study have used an orderfollowing these proximity spaces when describingan environmental scene.
It is interesting to note that in the SHOM cor-pus the order assigned by domain experts is the re-verse of the one stated above in 93% of the cases.This difference relates to the fact that Le Yaouancet al. (2010) used terrestrial environmental scenedescriptions while the SHOM corpus deals exclu-sively with offshore environmental scene descrip-tions.
Thus, the further away objects are, the greaterthe score assigned to them. Proximity spaces area typical example of an hybrid feature: the textualpart alone would be clearly insufficient in provid-ing information about size and position of objects.
Cardinal directions In the same spirit, we add yetanother feature, namely cardinal directions. In-deed the latter provide an additional hint on theorder of sentences in a paragraph since an environ-mental scene is usually observed in the reading di-rection of the observer (Nachson and Hatta, 2001;Fuhrman and Boroditsky, 2010), in our case from
left to right for 84.8% of the paragraphs wherethe description of objects is done in a longitudinalway.
Using the various features mentioned in thissection, we have built a SVM classifier for rankingsentences. The classifier provides a lattice struc-ture of ranked sentence pairs. Out of this latticewe obtain a best possible global order of sentencesby a standard lattice-traversal algorithm.
4.2 The Stability Issue
Content determination, as part of the NLG pro-cess, depends on several parameters (the area se-lection, the temporal and meteorological context,etc.) which operate on three different temporalscales affecting NLG: slow landscape changes im-ply very few KB updates but temporal and meteo-rological context changes may need to be updatedseveral times daily. Finally, selection updates doneon the GUI with a mouse may be only millisec-onds apart.
All three temporal scales, and the last one at thehighest degree, raise the problem of NLG stability:a text should not change while the user is readingit or while the reader is using the mouse to changethe selection area.
The issue of stability is a general NLG issue,and as such also affects sentence ordering. Chang-ing the sentence order of a paragraph can be ex-tremely disturbing for the reader.
In fact, user interaction with the GUI causes notonly visual changes, but also simultaneous multi-level linguistic structure changes. To overcomethis issue we introduce the method of smooth textgeneration, as follows:
We consider the function T that maps the val-ues of the various text generation parameters tothe text generated. This discrete function is“smoothed” in the following way:
1. When the mouse crosses a boundary betweentwo areas covering the same nodes but differentsentence orders, then the same sentence order iskept, until some nodes disappear or new nodesappear.
2. When the mouse enters a zone covering newnodes, then the sentences generated out of thesenodes are—as much as possible—added at theend of the generated paragraph.
3. Generated text updates are slightly delayed sothat a quick mouse move will not alter the gen-
4
69

erated text until the mouse is still for a time du-ration longer than a given threshold.
5 Conclusion and Future Work
We presented in this paper the sentence orderingpart of the natural language generation moduleof the INAUT system. The particularity of thissystem is that it is based on a controlled hybridlanguage and hence covers simultaneously textualand visual knowledge.
We have shown that hybrid features (textual andvisual) can be used to build a classifier that orderssentences in a paragraph.
Future work in the project involves a two-partsevaluation —(1) an automatic method based oncomparison with the legacy corpus, and (2) ahuman-centered evaluation— and the explorationof other hybrid features impacting on sentence or-der, in particular by using the domain experts feed-back of the second evaluation phase.
Furthermore, we will also consider hybrid lan-guage generation, i.e., having the system choosewhich information will be represented in visual orin textual modality, and insure coreferential redun-dancy among the modalities.
ReferencesIon Androutsopoulos, Gerasimos Lampouras, and
Dimitrios Galanis. 2013. Generating naturallanguage descriptions from OWL ontologies: theNaturalOWL system. J. Artif. Int. Res., 48:671–715.
David Brosset, Christophe Claramunt, and Éric Saux.2008. Wayfinding in natural and urban envi-ronments: a comparative study. Cartographica,43(1):21–30.
Filomena Ferrucci, Giuliano Pacini, Giorgio Satta,Maria I. Sessa, Genoveffa Tortora, Maurizio Tucci,and Giuliana Vitiello. 1996. Symbol-RelationGrammars: A Formalism for Graphical Languages.Information and Computation, 131:1–46.
Filomena Ferrucci, Genny Tortora, Maurizio Tucci,and Giuliana Vitiello. 1998. Relation Grammars:A Formalism for Syntactic and Semantic Analysisof Visual Languages. In Kim Marriott and BerndMeyer, editors, Visual Language Theory, pages 219–243. Springer.
Orly Fuhrman and Lera Boroditsky. 2010. Cross-cultural differences in mental representations oftime: Evidence from an implicit nonlinguistic task.Cognitive Science, 34(8):1430–1451.
Yannis Haralambous, Julie Sauvage-Vincent, and JohnPuentes. 2014. INAUT, a Controlled Language for
the French Coast Pilot Books Instructions nautiques.In Brian Davis, Kaarel Kaljurand, and Tobias Kuhn,editors, Controlled Natural Language, volume 8625of Lecture Notes in Computer Science, pages 102–111. Springer.
Yannis Haralambous, Julie Sauvage-Vincent, and JohnPuentes. 2015. A hybrid (visual/natural) controlledlanguage. Submitted.
Donald E. Knuth. 1968. Semantics of context-free lan-guages. Math. Syst. Theor., 2:127–145.
Jean-Marie Le Yaouanc, Éric Saux, and ChristopheClaramunt. 2010. A semantic and language-basedrepresentation of an environmental scene. Geoinfor-matica, 14(3):333–352.
William C. Mann and Sandra A. Thompson. 1988.Rhetorical structure theory: Toward a functional the-ory of text organization. Text, 8(3):243–281.
Pierre-Emmanuel Michon and Michel Denis. 2001.When and why are visual landmarks used in givingdirections? In Daniel R. Montello, editor, SpatialInformation Theory, volume 2205 of Lecture Notesin Computer Science, pages 292–305. Springer.
Israel Nachson and Takeshi Hatta. 2001. Directionaltendencies of Hebrew, Japanese, and English read-ers. Perceptual and Motor Skills, 93:178–180.
Ehud Reiter and Robert Dale. 2000. Building NaturalLanguage Generation Systems. Studies in NaturalLanguage Processing. Cambridge University Press,Cambridge, U.K.
Maite Taboada and William C. Mann. 2006. Applica-tions of rhetorical structure theory. Discourse stud-ies, 8(4):567–588.
Barbara Tversky. 2003. Structures of mental spaces.how people think about space. Environment and be-havior, 35(1):66–80.
5
70

Proceedings of the 15th European Workshop on Natural Language Generation (ENLG), pages 71–75,Brighton, September 2015. c©2015 Association for Computational Linguistics
Natural Language Generation from Pictographs
Leen Sevens, Vincent Vandeghinste, Ineke Schuurman, Frank Van EyndeCentre for Computational Linguistics
KU Leuven, [email protected]
Abstract
We present a Pictograph-to-Text transla-tion system for people with Intellectualor Developmental Disabilities (IDD). Thesystem translates pictograph messages,consisting of one or more pictographs, intoDutch text using WordNet links and an n-gram language model. We also provideseveral pictograph input methods assistingthe users in selecting the appropriate pic-tographs.
1 Introduction
Being unable to access ICT is a major form of so-cial exclusion. For people with IDD, the use ofsocial media or applications that require the userto be able to read or write, such as email clients, isa huge stumbling block if no personal assistanceis given. There is a need for digital communica-tion interfaces that enable written contact for peo-ple with IDD.
Augmentative and Alternative Communication(AAC) assists people with communication disabil-ities to be socially active in the digital world. Pic-tographically augmented text is a specific form ofAAC that is often used in schools, institutions, andsheltered workshops to allow accessible commu-nication. Between two and five million people inthe European Union could benefit from symbolsor symbol-related text as a means of written com-munication (Keskinen et al., 2012).
Within the Able to Include framework,1 a EUproject aiming to improve the living conditions ofpeople with IDD, we developed a Pictograph-to-Text translation system. It provides help in con-structing Dutch textual messages by allowing theuser to input a series of pictographs and translatesthese messages into NL. English and Spanish ver-sions of the tool are currently in development. It
1http://abletoinclude.eu/
can be considered as the inverse translation engineof the Text-to-Pictograph system as described byVandeghinste et al. (Accepted), which is primar-ily conceived to improve comprehension of textualcontent.
The system converts Sclera2 and Beta3 inputmessages into Dutch text, using WordNet synsetsand a trigram language model. After a discus-sion of related work (section 2), we describe somecharacteristics of pictograph languages (section3), followed by an overview of the different pic-tograph input methods (section 4). The next part(section 5) is dedicated to the architecture. Wepresent our preliminary results for Pictograph-to-Dutch translation in section 6. Finally, we con-clude and discuss future work in section 7.
2 Related work
Our task shares elements with regular machinetranslation between natural languages and withNatural Language Generation (NLG). Jing (1998)retrieves the semantic concepts from WordNetand maps them to appropriate words to producelarge amounts of lexical paraphrases for a spe-cific application domain. Similar to our approach,Liu (2003) uses statistical language models as asolution to the word inflection problem, as theremay exist multiple forms for a concept constituent.The language model re-scores all inflection formsin order to generate the best hypothesis in the out-put. Our solution is specifically tailored towardstranslation from pictographs into text.
A number of pictograph-based input interfacescan be found in the literature. Finch et al. (2011)developed picoTrans, a mobile application whichallows users to build a source text by combiningpictures or common phrases, but their applicationis not intended for people with cognitive disabili-ties. The Prothese Vocale Intelligente (PVI) sys-
2http://www.sclera.be/3https://www.betasymbols.com/
71

tem by Vaillant (1998) offers a limited vocabularyof pictographs, each one corresponding to a sin-gle word. PVI searches for predicative elements,such as verbs, and attempts to fill its semanticslots, after which a tree structure is created anda grammatical sentence is generated. Fitrianie andRothkrantz (2009) apply a similar method, requir-ing the user to first select the pictograph represen-tation of a verb and fill in the role slots that aremade available by that verb. Their system does nottake into account people with cognitive disabili-ties. Various pictograph chat applications, such asMessenger Visual (Tuset et al., 1995) and Picto-graph Chat Communicator III (Munemori et al.,2010), allow the user to insert pictographs, butthey do not generate NL.
The Pictograph-to-Text translation engine dif-fers from these applications in that it is specificallydesigned for people with cognitive disabilities,does not impose any limits on the way in whichpictograph messages are composed and generatesNL output where possible. Furthermore, the sys-tem’s architecture is as language-independent aspossible, making it very easy to add new targetlanguages.
3 Pictograph languages
Many pictograph systems are in place. Althoughdifferences exist across pictograph sets, some fea-tures are shared among them. A pictograph ofan entity (noun) can stand for one or multiple in-stances of that entity. Pictographs depicting ac-tions (verbs) are deprived of aspect, tense, andinflection information. Auxiliaries and articlesusually have no pictograph counterpart. Pic-tograph languages are simplified languages, of-ten specifically designed for people with IDD.The Pictograph-to-Text translation system cur-rently gives access to two pictograph sets, Scleraand Beta (see Figure 1).
Sclera pictographs4 are mainly black-and-whitepictographs. They often represent complex con-cepts, such as a verb and its object (such as to feedthe dog) or compound words (such as carrot soup).There are hardly any pictographs for adverbs orprepositions.
The Beta set5 is characterized by its overall con-sistency. Beta hardly contains any complex pic-
4Freely available under Creative Commons License 2.0.5The coloured pictographs can be obtained at reasonable
prices. Their black-and-white equivalents are available forfree.
tographs. Most of the pictographs represent sim-plex concepts.
Figure 1: Example of a Beta and a Sclera se-quence. Pictographs can correspond to differentwords and word forms in a NL, as shown for En-glish in this example. The Sclera sequence con-tains a complex pictograph, namely the jumpingdog.
4 Pictograph input methods
The Pictograph-to-Text translation engine relieson pictograph input and the user should be able toefficiently select the desired pictographs. We havedeveloped two different input methods. The firstapproach offers a static hierarchy of pictographs,while the second option scans the user input anddynamically adapts itself in order to suggest ap-propriate pictographs. Usability tests will have tobe performed with the target audience.
The static hierarchy of pictographs consists ofthree levels. The structure of the hierarchy is basedon topic detection and frequency counts applied to69,636 email messages sent by users of the WAI-NOT communication platform.6
The second method is a dynamic pictographprediction tool, the first of its kind. Two differ-ent prototypes have been developed, which willeventually be merged. The first model relies onn-gram information. The WAI-NOT email corpuswas translated into pictographs (285,372 Sclerapictographs and 284,658 Beta pictographs) in or-der to enable building a language model using the
6http://www.wai-not.be/ uses the Text-to-Pictograph en-gine to augment emails with sequences of Sclera or Beta pic-tographs, allowing people with communicative disabilities tofamiliarize themselves with information technology.
72

SRILM toolkit (Stolcke, 2002). The second modelrelies on word associations within a broader con-text: The system identifies the most frequent lem-mas in the synset (see section 5.1) of each enteredpictograph and retrieves a list of semantically sim-ilar words from DISCO,7 an application that al-lows to retrieve the semantic similarity betweenarbitrary words and phrases, along with their sim-ilarity scores. Pictographs that are connected tothese words are presented to the user.
5 Natural Language Generation fromPictographs
The main challenge in translating from pictographlanguages to NL is the fact that a pictograph-for-word correspondence will almost never providean acceptable output. Pictograph languages of-ten lack pictographs for function words. A singlepictograph often encodes information correspond-ing to multiple words with multiple inflected wordforms in NL.
Section 5.1 describes how the bridge betweenSclera and Beta pictographs and natural languagetext was built. The system’s general architectureis outlined in section 5.2. It introduces a set ofparameters, which were tuned on a training corpus(section 5.3). Finally, as explained in section 5.4,an optimal NL string is selected.
5.1 Linking pictographs to natural languagetext
Pictographs are connected to NL words through asemantic route and a direct route.
The semantic route concerns the use of Word-Nets, which are a core component of both the Text-to-Pictograph and the Pictograph-to-Text trans-lation systems. For Dutch, we used the Cor-netto (Vossen et al., 2008) database. Vandeghin-ste and Schuurman (2014) manually linked 5710Sclera and 2746 Beta pictographs to Dutch synsets(groupings of synonymous words) in Cornetto.
The direct route contains specific rules for ap-propriately dealing with pronouns (as pictographsfor pronouns exist in Sclera and Beta) and containsone-on-one mappings between pictographs and in-dividual lemmas in a dictionary.
5.2 Architecture of the system
When a pictograph is selected, its synset is re-trieved, and from this synset we retrieve all the
7http://www.linguatools.de/disco/
synonyms it contains. For each of these synonyms,we apply reverse lemmatization, i.e. we retrievethe full linguistic paradigm of the lemma, togetherwith its part-of-speech tags. For Dutch, we createda reverse lemmatizer based on the SoNaR corpus.8
Each of these surface forms is a hypothesis forthe language model, as described in section 5.4.For nouns, we generate additional alternative hy-potheses which include an article, based on part-of-speech information.
5.3 Tuning the parameters
The Pictograph-to-Text translation system con-tains a number of decoding parameters. Thresholdpruning determines whether a new path should beadded to the existing beam, based on the probabil-ity of that path compared to the best path. His-togram pruning sets the beam width. The Costparameter estimates the cost of the pictographsthat still need processing (based on the amount ofpictographs that still needs processing). Eventu-ally, Reverse lemmatizer minimum frequency setsa threshold on the frequency of a token/part-of-speech/lemma combination in the corpus, limitingthe amount of possible linguistic realizations for aparticular pictograph. For Dutch, frequencies arebased on occurrence within the SoNaR corpus.
These parameters have to be tuned for every pic-tograph language/NL pair. For Dutch, our tun-ing set consists of 50 manually translated mes-sages from the WAI-NOT corpus. We ran five tri-als of local hill climbing on the parameter searchspace, with random initialization values, in orderto maximize BLEU (Papineni et al., 2002). BLEUis a commonly used metric in Statistical MachineTranslation. We did this until BLEU convergedonto a fixed score. From these trials, we took theoptimal parameter settings.
5.4 Decoding
We performed Viterbi-decoding based on a tri-gram language model, trained with the SRILMtoolkit on a very large corpus. The Dutch train-ing corpus consists of Europarl (Koehn, 2005),CGN (Oostdijk et al., 2003), CLEF (Peters andBraschler, 2001), DGT-TM (Steinberger et al.,2012) and Wikipedia.9
8http://tst-centrale.org/producten/corpora/sonar-corpus/9http://en.wikipedia.org/wiki/
73
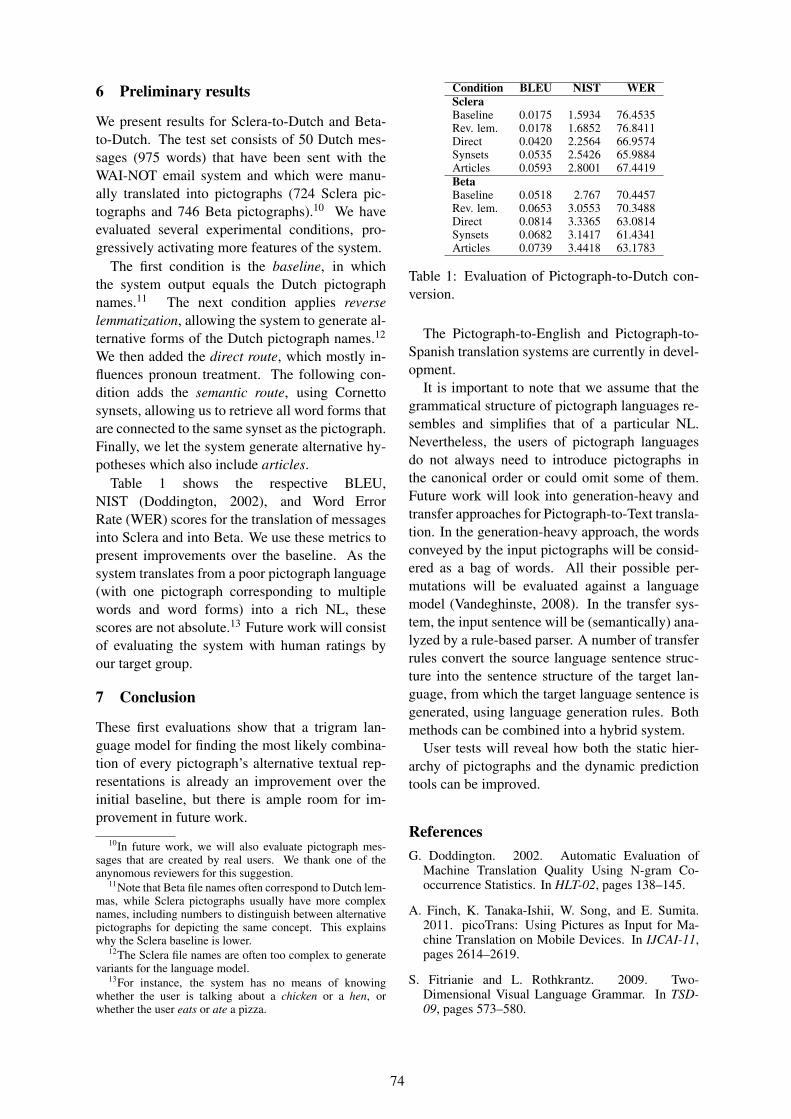
6 Preliminary results
We present results for Sclera-to-Dutch and Beta-to-Dutch. The test set consists of 50 Dutch mes-sages (975 words) that have been sent with theWAI-NOT email system and which were manu-ally translated into pictographs (724 Sclera pic-tographs and 746 Beta pictographs).10 We haveevaluated several experimental conditions, pro-gressively activating more features of the system.
The first condition is the baseline, in whichthe system output equals the Dutch pictographnames.11 The next condition applies reverselemmatization, allowing the system to generate al-ternative forms of the Dutch pictograph names.12
We then added the direct route, which mostly in-fluences pronoun treatment. The following con-dition adds the semantic route, using Cornettosynsets, allowing us to retrieve all word forms thatare connected to the same synset as the pictograph.Finally, we let the system generate alternative hy-potheses which also include articles.
Table 1 shows the respective BLEU,NIST (Doddington, 2002), and Word ErrorRate (WER) scores for the translation of messagesinto Sclera and into Beta. We use these metrics topresent improvements over the baseline. As thesystem translates from a poor pictograph language(with one pictograph corresponding to multiplewords and word forms) into a rich NL, thesescores are not absolute.13 Future work will consistof evaluating the system with human ratings byour target group.
7 Conclusion
These first evaluations show that a trigram lan-guage model for finding the most likely combina-tion of every pictograph’s alternative textual rep-resentations is already an improvement over theinitial baseline, but there is ample room for im-provement in future work.
10In future work, we will also evaluate pictograph mes-sages that are created by real users. We thank one of theanynomous reviewers for this suggestion.
11Note that Beta file names often correspond to Dutch lem-mas, while Sclera pictographs usually have more complexnames, including numbers to distinguish between alternativepictographs for depicting the same concept. This explainswhy the Sclera baseline is lower.
12The Sclera file names are often too complex to generatevariants for the language model.
13For instance, the system has no means of knowingwhether the user is talking about a chicken or a hen, orwhether the user eats or ate a pizza.
Condition BLEU NIST WERScleraBaseline 0.0175 1.5934 76.4535Rev. lem. 0.0178 1.6852 76.8411Direct 0.0420 2.2564 66.9574Synsets 0.0535 2.5426 65.9884Articles 0.0593 2.8001 67.4419BetaBaseline 0.0518 2.767 70.4457Rev. lem. 0.0653 3.0553 70.3488Direct 0.0814 3.3365 63.0814Synsets 0.0682 3.1417 61.4341Articles 0.0739 3.4418 63.1783
Table 1: Evaluation of Pictograph-to-Dutch con-version.
The Pictograph-to-English and Pictograph-to-Spanish translation systems are currently in devel-opment.
It is important to note that we assume that thegrammatical structure of pictograph languages re-sembles and simplifies that of a particular NL.Nevertheless, the users of pictograph languagesdo not always need to introduce pictographs inthe canonical order or could omit some of them.Future work will look into generation-heavy andtransfer approaches for Pictograph-to-Text transla-tion. In the generation-heavy approach, the wordsconveyed by the input pictographs will be consid-ered as a bag of words. All their possible per-mutations will be evaluated against a languagemodel (Vandeghinste, 2008). In the transfer sys-tem, the input sentence will be (semantically) ana-lyzed by a rule-based parser. A number of transferrules convert the source language sentence struc-ture into the sentence structure of the target lan-guage, from which the target language sentence isgenerated, using language generation rules. Bothmethods can be combined into a hybrid system.
User tests will reveal how both the static hier-archy of pictographs and the dynamic predictiontools can be improved.
ReferencesG. Doddington. 2002. Automatic Evaluation of
Machine Translation Quality Using N-gram Co-occurrence Statistics. In HLT-02, pages 138–145.
A. Finch, K. Tanaka-Ishii, W. Song, and E. Sumita.2011. picoTrans: Using Pictures as Input for Ma-chine Translation on Mobile Devices. In IJCAI-11,pages 2614–2619.
S. Fitrianie and L. Rothkrantz. 2009. Two-Dimensional Visual Language Grammar. In TSD-09, pages 573–580.
74

H. Jing. 1998. Usage of WordNet in Natural LanguageGeneration. In COLING-ACL-98.
T. Keskinen, T. Heimonen, M. Turunen, J.P. Rajaniemi,and S. Kauppinen. 2012. SymbolChat: A FlexiblePicture-based Communication Platform for Userswith Intellectual Disabilities. Interacting with Com-puters, 24(5):374–386.
P. Koehn. 2005. Europarl: A Parallel Corpus forStatistical Machine Translation. In MT Summit-05,pages 79–86.
F.-H. Liu, L. Gu, Y. Gao, and M. Picheny. 2003. Useof statistical N-gram models in Natural LanguageGeneration for Machine Translation. In ICASSP-03,pages 636–639.
J. Munemori, T. Fukada, M. Yatid, T. Nishide, andJ. Itou. 2010. Pictograph Chat Communicator III:a Chat System that Embodies Cross-Cultural Com-munication. In KES-10, pages 473–482.
N. Oostdijk, W. Goedertier, F. Van Eynde, L. Boves,J. P. Martens, M. Moortgat, and H. Baayen. 2003.Experiences from the Spoken Dutch Corpus Project.In LREC-02, pages 340–347.
K. Papineni, S. Roukos, T. Ward, and W. Zhu. 2002.Evaluation of Machine Translation. In ACL-02,pages 311–318.
C. Peters and M. Braschler. 2001. European Re-search letter: Cross-language System Evaluation:the CLEF Campaigns. Journal of the AmericanSociety for Information Science and Technology,52(12):1067–1072.
R. Steinberger, A. Eisele, S. Klocek, S. Pilos, andP. Schluter. 2012. DGT-TM: A Freely AvailableTranslation Memory in 22 Languages. In LREC-12,pages 454–459.
A. Stolcke. 2002. SRIL: An Extensible LanguageModeling Toolkit. In ICSLP-02.
P. Tuset, J.M. Barbern, P. Cervell-Pastor, and C. Janer.1995. Designing Messenger Visual, an Instant Mes-senging Service for Individuals with Cognitive Dis-ability. In IWAAL-95, pages 57–64.
P. Vaillant. 1998. Interpretation of Iconic UtterancesBased on Contents Representation: Semantic Anal-ysis in the PVI System. Natural Language Engi-neering, 4(1):17–40.
V. Vandeghinste and I. Schuurman. 2014. Linking Pic-tographs to Synsets: Sclera2Cornetto. In LREC-14,pages 3404–3410.
V. Vandeghinste, I. Schuurman, L. Sevens, and F. VanEynde. Accepted. Translating Text into Pic-tographs. Natural Language Engineering.
V. Vandeghinste. 2008. A Hybrid Modular MachineTranslation System. LoRe-MT: Low Resources Ma-chine Translation. LOT, Utrecht.
P. Vossen, I. Maks, R. Segers, and H. van der Vliet.2008. Integrating Lexical Units, Synsets, and On-tology in the Cornetto Database. In LREC-08.
75

Proceedings of the 15th European Workshop on Natural Language Generation (ENLG), pages 76–80,Brighton, September 2015. c©2015 Association for Computational Linguistics
Translating Italian to LIS in the rail stations
Alessandro MazzeiDipartimento di Informatica, Universita degli Studi di Torino
Via Pessinetto 12, 10149, Torino, [email protected]
Abstract
This paper presents an ongoing projectabout the symbolic translation from Italianto Italian Signed Language (LIS) in the railstations domain. We describe some tech-nical issues in the generation side of thetranslation, i.e. the use of XML templatesfor microplanning, the implementation ofsome LIS linguistic features in the gram-mar.
1 Introduction
Several commercial and research projects useavatars for automatic translation into signed lan-guages (SLs) and most of these projects investi-gate on relatively small domains in which transla-tion may perform quite well. Among them: postoffice announcements (Cox et al., 2002), weatherforecasting (Verlinden et al., 2001; Mazzei et al.,2013), driver’s license renewal (San-Segundo etal., 2012), and train announcements (Segouat andBraffort, 2009; Ebling, 2013). However, SLs stillpose many challenges related to the specific lin-guistic features (e.g. no function words and ar-ticles) as well as to the specific communicationchannels (e.g. the characteristic use of the space).
LIS4ALL is a project for the automatic trans-lation from Italian to LIS in the Italian rail sta-tions domain. The domain is completely specifiedby the Rete Ferroviaria Italiana (RFI), which pro-duced the manual MAS (Manuale degli AnnunciSonori), that describes the details of each specificmessage (RFI, 2011). MAS specifies 39 classes:13 for arriving trains, 15 for leaving trains, 11 forspecial situations (e.g. strikes). The classes havebeen designed by a group of linguists to produceconcise Italian messages. Full relative clauses, co-ordination and complex structures are avoided. Asa consequence, the Italian rail stations domain is acontrolled plain language. Note that the vocal rail
station messages are produced in real-time by us-ing text-to-speech, and the textual input messageis produced by a proprietary closed source soft-ware that uses raw data extracted from a database.In the project we had access only to the textualmessages but we do not have access to raw data.As a consequence, LIS4ALL concerns automatictranslation with NLG rather than uniquely NLG.
An initial study of the domain (5014 messagesform 24 hours messages produced at the TorinoPorta Nuova Station) has showed that four classesaccount for∼85% of total messages: these are A1:simple arrive, P1: simple leave, A2: arrive on adifferent rail, A3: delayed arrive. In this paper wediscuss a symbolic translator designed to accountfor these four classes of messages.1
ItalianRegular
Grammar
SentenceTemplates
CCG forLIS
Signary
Railway stationannouncement inItalian
AW-LISTemplate
Microplanner+
OpenCCGRealizer
RegExpAnalyzer
Filler/SlotSemanticInterpreter
AnimationInterpreter
Railway stationannouncement inLIS
Figure 1: The architecture of the Italian to LIStraslator.
Figure 1 illustrates the current architecture, thusa pipeline which includes five modules: (1) a reg-ular expression parser for Italian; (2) a filler/slot
1We plan to account for the remaining classes in the fu-ture.
76
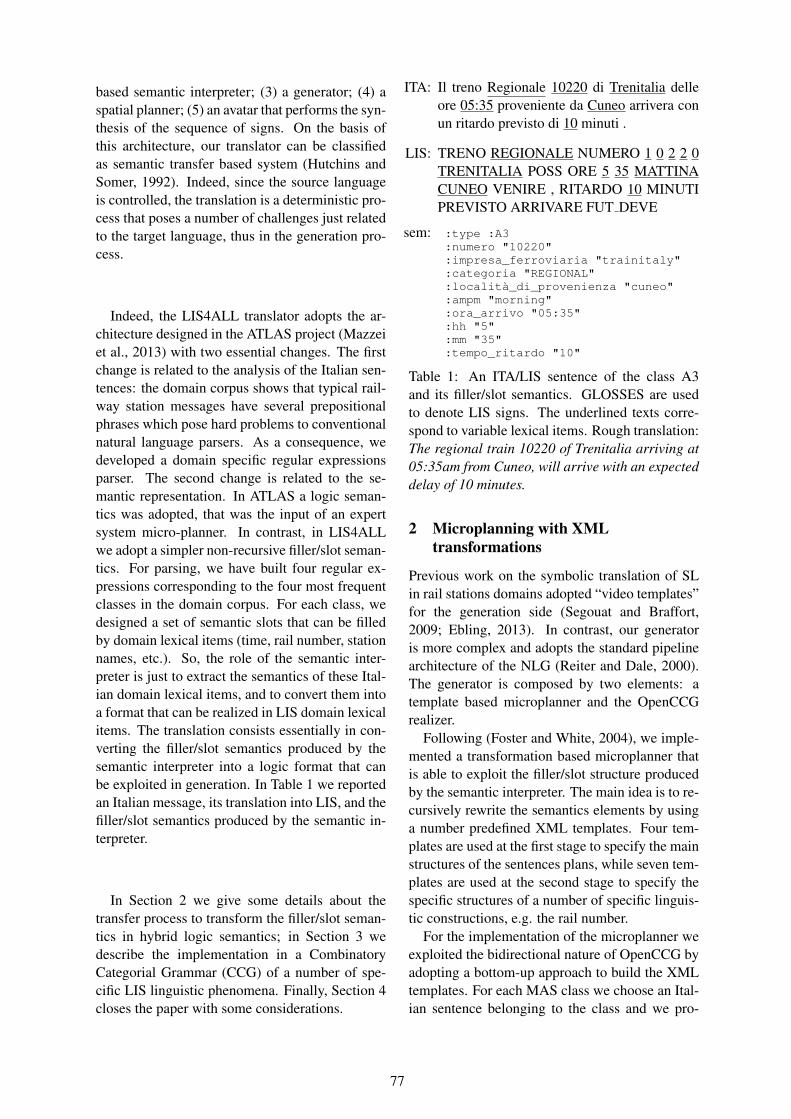
based semantic interpreter; (3) a generator; (4) aspatial planner; (5) an avatar that performs the syn-thesis of the sequence of signs. On the basis ofthis architecture, our translator can be classifiedas semantic transfer based system (Hutchins andSomer, 1992). Indeed, since the source languageis controlled, the translation is a deterministic pro-cess that poses a number of challenges just relatedto the target language, thus in the generation pro-cess.
Indeed, the LIS4ALL translator adopts the ar-chitecture designed in the ATLAS project (Mazzeiet al., 2013) with two essential changes. The firstchange is related to the analysis of the Italian sen-tences: the domain corpus shows that typical rail-way station messages have several prepositionalphrases which pose hard problems to conventionalnatural language parsers. As a consequence, wedeveloped a domain specific regular expressionsparser. The second change is related to the se-mantic representation. In ATLAS a logic seman-tics was adopted, that was the input of an expertsystem micro-planner. In contrast, in LIS4ALLwe adopt a simpler non-recursive filler/slot seman-tics. For parsing, we have built four regular ex-pressions corresponding to the four most frequentclasses in the domain corpus. For each class, wedesigned a set of semantic slots that can be filledby domain lexical items (time, rail number, stationnames, etc.). So, the role of the semantic inter-preter is just to extract the semantics of these Ital-ian domain lexical items, and to convert them intoa format that can be realized in LIS domain lexicalitems. The translation consists essentially in con-verting the filler/slot semantics produced by thesemantic interpreter into a logic format that canbe exploited in generation. In Table 1 we reportedan Italian message, its translation into LIS, and thefiller/slot semantics produced by the semantic in-terpreter.
In Section 2 we give some details about thetransfer process to transform the filler/slot seman-tics in hybrid logic semantics; in Section 3 wedescribe the implementation in a CombinatoryCategorial Grammar (CCG) of a number of spe-cific LIS linguistic phenomena. Finally, Section 4closes the paper with some considerations.
ITA: Il treno Regionale 10220 di Trenitalia delleore 05:35 proveniente da Cuneo arrivera conun ritardo previsto di 10 minuti .
LIS: TRENO REGIONALE NUMERO 1 0 2 2 0TRENITALIA POSS ORE 5 35 MATTINACUNEO VENIRE , RITARDO 10 MINUTIPREVISTO ARRIVARE FUT DEVE
sem: :type :A3:numero "10220":impresa_ferroviaria "trainitaly":categoria "REGIONAL":localita_di_provenienza "cuneo":ampm "morning":ora_arrivo "05:35":hh "5":mm "35":tempo_ritardo "10"
Table 1: An ITA/LIS sentence of the class A3and its filler/slot semantics. GLOSSES are usedto denote LIS signs. The underlined texts corre-spond to variable lexical items. Rough translation:The regional train 10220 of Trenitalia arriving at05:35am from Cuneo, will arrive with an expecteddelay of 10 minutes.
2 Microplanning with XMLtransformations
Previous work on the symbolic translation of SLin rail stations domains adopted “video templates”for the generation side (Segouat and Braffort,2009; Ebling, 2013). In contrast, our generatoris more complex and adopts the standard pipelinearchitecture of the NLG (Reiter and Dale, 2000).The generator is composed by two elements: atemplate based microplanner and the OpenCCGrealizer.
Following (Foster and White, 2004), we imple-mented a transformation based microplanner thatis able to exploit the filler/slot structure producedby the semantic interpreter. The main idea is to re-cursively rewrite the semantics elements by usinga number predefined XML templates. Four tem-plates are used at the first stage to specify the mainstructures of the sentences plans, while seven tem-plates are used at the second stage to specify thespecific structures of a number of specific linguis-tic constructions, e.g. the rail number.
For the implementation of the microplanner weexploited the bidirectional nature of OpenCCG byadopting a bottom-up approach to build the XMLtemplates. For each MAS class we choose an Ital-ian sentence belonging to the class and we pro-
77
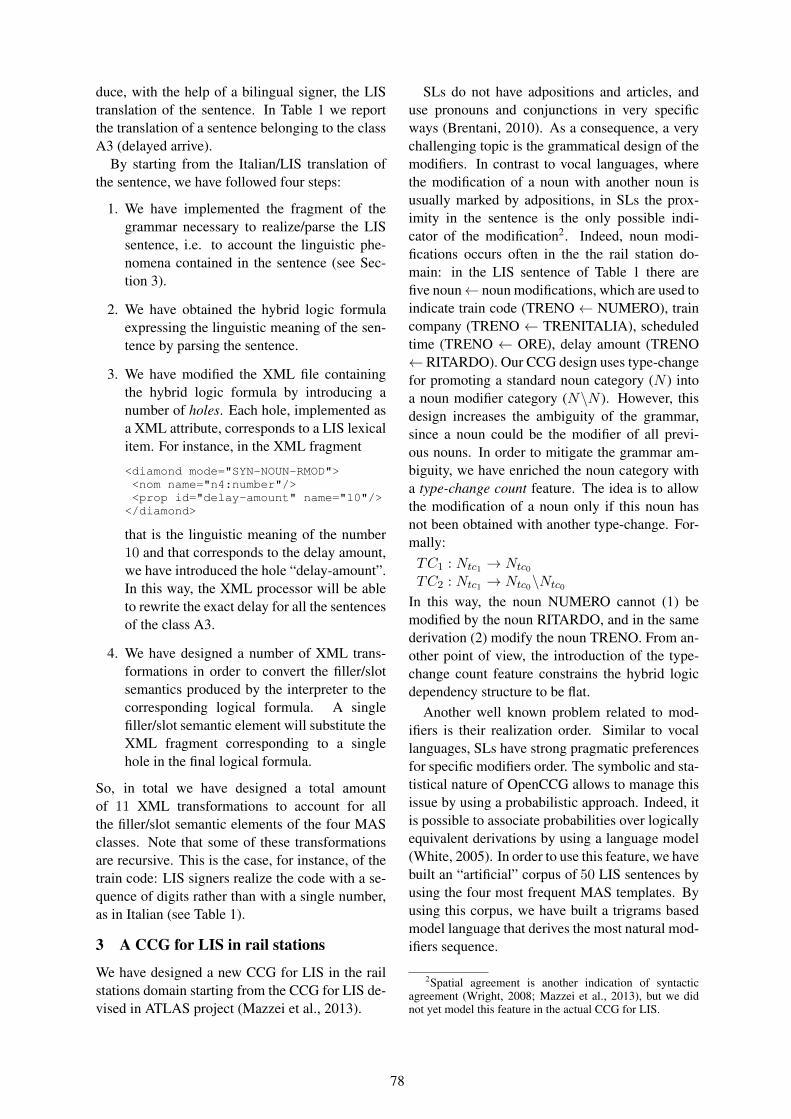
duce, with the help of a bilingual signer, the LIStranslation of the sentence. In Table 1 we reportthe translation of a sentence belonging to the classA3 (delayed arrive).
By starting from the Italian/LIS translation ofthe sentence, we have followed four steps:
1. We have implemented the fragment of thegrammar necessary to realize/parse the LISsentence, i.e. to account the linguistic phe-nomena contained in the sentence (see Sec-tion 3).
2. We have obtained the hybrid logic formulaexpressing the linguistic meaning of the sen-tence by parsing the sentence.
3. We have modified the XML file containingthe hybrid logic formula by introducing anumber of holes. Each hole, implemented asa XML attribute, corresponds to a LIS lexicalitem. For instance, in the XML fragment
<diamond mode="SYN-NOUN-RMOD"><nom name="n4:number"/><prop id="delay-amount" name="10"/>
</diamond>
that is the linguistic meaning of the number10 and that corresponds to the delay amount,we have introduced the hole “delay-amount”.In this way, the XML processor will be ableto rewrite the exact delay for all the sentencesof the class A3.
4. We have designed a number of XML trans-formations in order to convert the filler/slotsemantics produced by the interpreter to thecorresponding logical formula. A singlefiller/slot semantic element will substitute theXML fragment corresponding to a singlehole in the final logical formula.
So, in total we have designed a total amountof 11 XML transformations to account for allthe filler/slot semantic elements of the four MASclasses. Note that some of these transformationsare recursive. This is the case, for instance, of thetrain code: LIS signers realize the code with a se-quence of digits rather than with a single number,as in Italian (see Table 1).
3 A CCG for LIS in rail stations
We have designed a new CCG for LIS in the railstations domain starting from the CCG for LIS de-vised in ATLAS project (Mazzei et al., 2013).
SLs do not have adpositions and articles, anduse pronouns and conjunctions in very specificways (Brentani, 2010). As a consequence, a verychallenging topic is the grammatical design of themodifiers. In contrast to vocal languages, wherethe modification of a noun with another noun isusually marked by adpositions, in SLs the prox-imity in the sentence is the only possible indi-cator of the modification2. Indeed, noun modi-fications occurs often in the the rail station do-main: in the LIS sentence of Table 1 there arefive noun← noun modifications, which are used toindicate train code (TRENO← NUMERO), traincompany (TRENO ← TRENITALIA), scheduledtime (TRENO ← ORE), delay amount (TRENO← RITARDO). Our CCG design uses type-changefor promoting a standard noun category (N ) intoa noun modifier category (N\N ). However, thisdesign increases the ambiguity of the grammar,since a noun could be the modifier of all previ-ous nouns. In order to mitigate the grammar am-biguity, we have enriched the noun category witha type-change count feature. The idea is to allowthe modification of a noun only if this noun hasnot been obtained with another type-change. For-mally:TC1 : Ntc1 → Ntc0
TC2 : Ntc1 → Ntc0\Ntc0
In this way, the noun NUMERO cannot (1) bemodified by the noun RITARDO, and in the samederivation (2) modify the noun TRENO. From an-other point of view, the introduction of the type-change count feature constrains the hybrid logicdependency structure to be flat.
Another well known problem related to mod-ifiers is their realization order. Similar to vocallanguages, SLs have strong pragmatic preferencesfor specific modifiers order. The symbolic and sta-tistical nature of OpenCCG allows to manage thisissue by using a probabilistic approach. Indeed, itis possible to associate probabilities over logicallyequivalent derivations by using a language model(White, 2005). In order to use this feature, we havebuilt an “artificial” corpus of 50 LIS sentences byusing the four most frequent MAS templates. Byusing this corpus, we have built a trigrams basedmodel language that derives the most natural mod-ifiers sequence.
2Spatial agreement is another indication of syntacticagreement (Wright, 2008; Mazzei et al., 2013), but we didnot yet model this feature in the actual CCG for LIS.
78

Another grammar issue concerns the lexical se-mantics. OpenCCG organizes the lexical items inan ontological structure. In the implementation ofthe LIS grammar we have used the backbone ofthe DOLCE ontology (Masolo et al., 2002), i.e.the LIS lexical items (∼120 signs) have been clas-sified under the top level categories of DOLCE.For instance, the semantic category rail has beencollocated as a child of the DOLCE category nonagentive physical object.
Another specific feature of the LIS CCG lexiconconcerns the lexicalization of some station names.Previous approaches to SL translation in the railstation domain propose to fingerspell the namesof the secondary stations (Segouat and Braffort,2009; Ebling, 2013), i.e. the station which donot have a well known name in the national Deafcommunity. In contrast, we propose to exploitthe virtual nature of the avatar by producing aclassifier sign that generate dynamically new lex-ical items. We distinguish two kinds of rail sta-tions: (1) In the case of a well-known station, theavatar uses the sign adopted by the Deaf commu-nity; (2) In contrast, in the case of less knownstation, the avatar realizes a classifier sign indi-cating a wide board while the name of the sta-tion will appear in written Italian “centered on theboard” (Figure 2). Note that we had to modifythe lexicalization mechanism of OpenCCG witha workaround in order to implement this feature.Indeed OpenCCG assumes a “closed lexicon”, i.e.assumes that the lexicon is a closed set completelyspecified in the grammar. We have introduced apost-processing lexical substitution procedure thatreplaces a generic sign for less known stationswith the board sign, modified in real time with thename of the station. More details on the linguisticimpact of the board sign are reported in (Geraciand Mazzei, 2013).
4 Summary and future work
We have described some issues related to the gen-eration module of the symbolic translator fromItalian to LIS designed in the LIS4ALL project.The main contribution of this paper is to show thatthe combination of a filler/slot semantics with aXML transformation-based microplanner is ade-quate to generate controlled domain languages.
A prototype of the translator has been imple-mented in Clojure3, that is a functional program-
3http://clojure.org
Figure 2: The sign for Rebaudengo Fossata, a lessknown station in Turin.
ming language that works on the Java virtual ma-chine. Clojure exploits the the widespread useof Java by allowing (1) to call efficiently exter-nal Java libraries, and (2) to deploy software ondifferent machines. Indeed, in order to implementthe template based microplanner, we have used theEnlive library4, i.e. a selector based system pri-mary designed for web templating. Moreover, theOpenCCG realizer has been natively called fromthe Clojure code.
In the next future we plan to introduce in thegenerator the linguistic management of signingspace since previous work have showed that CCGcan compactly model this linguist feature (Wright,2008; Mazzei et al., 2013).
Finally, we intend to evaluate the quality of ourtranslator by using both task-based human evalua-tion (Mazzei et al., 2013) as well as metric-basedautomatic evaluation (Battaglino et al., 2015).
Acknowledgments
This work has been partially supported by theproject LIS4ALL, partially funded by RegionePiemonte, Innovation Hub for ICT, 2011-2014,POR-FESR 07-13.
This work is dedicated to Leonardo Lesmo whosubstantially contributed to its realization.
ReferencesCristina Battaglino, Carlo Geraci, Vincenzo Lombardo,
and Alessandro Mazzei. 2015. Prototyping and pre-liminary evaluation of sign language translation sys-tem in the railway domain. In Universal Access in
4https://github.com/cgrand/enlive
79

Human-Computer Interaction. Access to Interaction- 9th International Conference, UAHCI 2015, Heldas Part of HCI International 2015, Los Angeles, CA,USA, August 2-7, 2015, Proceedings, Part II, pages339–350.
Dana Brentani, editor. 2010. Sign Languages. Cam-bridge University Press.
Stephen Cox, Michael Lincoln, Judy Tryggvason,Melanie Nakisa, Mark Wells, Marcus Tutt, andSanja Abbott. 2002. Tessa, a system to aid com-munication with deaf people. In Proceedings ofthe fifth international ACM conference on Assistivetechnologies, pages 205–212. ACM.
Sara Ebling. 2013. Evaluating a swiss german signlanguage avatar among the deaf community. InThird International Symposium on Sign LanguageTranslation and Avatar Technology, October.
Mary Ellen Foster and Michael White. 2004. Tech-niques for text planning with XSLT. In Proceed-ings of the Workshop on NLP and XML (NLPXML-2004): RDF/RDFS and OWL in Language Technol-ogy, pages 1–8. Association for Computational Lin-guistics.
Carlo Geraci and Alessandro Mazzei. 2013. Lasttrain to “rebaudengo fossano”: The case of somenames in avatar translation. In Proceedings of the6th Workshop on the Representation and Processingof Sign Languages, pages 63–66.
W.John Hutchins and Harold L. Somer. 1992. An In-troduction to Machine Translation. London: Aca-demic Press.
Carlo Masolo, Stefano Borgo, Aldo Gangemi, NicolaGuarino, Alessandro Oltramari, and Luc Schneider.2002. Wonder Web deliverable D17. The WonderWeb Library of Foundational Ontologies and theDOLCE Ontology. Technical Report D17, ISTC-CNR.
Alessandro Mazzei, Leonardo Lesmo, CristinaBattaglino, Mara Vendrame, and Monica Buccia-relli. 2013. Deep natural language processingfor italian sign language translation. In AI*IA2013: Advances in Artificial Intelligence - XIIIthInternational Conference of the Italian Associationfor Artificial Intelligence, Turin, Italy, December4-6, 2013. Proceedings, pages 193–204.
E. Reiter and R. Dale. 2000. Building Natural Lan-guage Generation Systems. Studies in Natural Lan-guage Processing. Cambridge University Press.
Rete Ferroviaria Italiana RFI. 2011. Man-uale Annunci Sonori - MAS (http://www.rfi.it/cms-file/allegati/rfi/MAS.pdf). Rete Ferroviaria Italiana(RFI).
Ruben San-Segundo, Juan Manuel Montero,R Cordoba, Valentin Sama, F Fernandez,LF D’Haro, Veronica Lopez-Ludena, D Sanchez,
and A Garcıa. 2012. Design, development and fieldevaluation of a spanish into sign language trans-lation system. Pattern Analysis and Applications,15(2):203–224.
Jeremie Segouat and Annelies Braffort. 2009. Towardmodeling sign language coarticulation. In Gesturein Embodied Communication and Human-ComputerInteraction, 8th International Gesture Workshop,GW 2009, Bielefeld, Germany, February 25-27,2009, Revised Selected Papers, pages 325–336.
Margriet Verlinden, Corrie Tijsseling, and HanFrowein. 2001. A signing avatar on the WWW. InGesture and Sign Languages in Human-ComputerInteraction, International Gesture Workshop, GW2001, London, UK, April 18-20, 2001, Revised Pa-pers, pages 169–172.
Michael White. 2005. Designing an Extensible APIfor Integrating Language Modeling and Realization.In Proceedings of the Workshop on Software, Soft-ware ’05, pages 47–64, Stroudsburg, PA, USA. As-sociation for Computational Linguistics.
Tony Wright. 2008. A combinatory categorial gram-mar of a fragment of american sign language. InProc. of the Texas Linguistics Society X Conference.CSLI Publications.
80

Proceedings of the 15th European Workshop on Natural Language Generation (ENLG), pages 81–85,Brighton, September 2015. c©2015 Association for Computational Linguistics
Response Generation in Dialogue using a Tailored PCFG Parser
Caixia Yuan Xiaojie Wang Qianhui HeSchool of Computer Science
Beijing University of Posts and Telecommunications{yuancx, xjwang}@[email protected]
Abstract
This paper presents a parsing paradigm fornatural language generation task, whichlearns a tailored probabilistic context-freegrammar for encoding meaning represen-tation (MR) and its corresponding naturallanguage (NL) expression, then decodesand yields natural language sentences atthe leaves of the optimal parsing tree fora target meaning representation. The ma-jor advantage of our method is that it doesnot require any prior knowledge of the M-R syntax for training. We deployed ourmethod in response generation for a Chi-nese spoken dialogue system, obtainingresults comparable to a strong baselineboth in terms of BLEU scores and humanevaluation.
1 Introduction
Grammar based natural language generation (NL-G) have received considerable attention over thepast decade. Prior work has mainly focused onhand-crafted generation grammar (Reiter et al.,2005; Belz, 2008), which is extensive, but also ex-pensive. Recent work automatically learns a prob-abilistic regular grammar describing Markov de-pendency among fields and word strings (Konstasand Lapata, 2012a, Konstas and Lapata, 2013),or extracts a tree adjoining grammar provided analignment lexicon is available which projects theinput semantic variables up the syntactic tree oftheir natural language expression (Gyawali andGardent, 2014). Although it is a consensus that ata rather abstract level natural language generationcan benefit a lot from its counterpart natural lan-guage understanding (NLU), the problem of lever-aging NLU resources for NLG still leaves muchroom for investigation.
In this paper, we propose a purely data-drivennatural language generation model which exploits
a probabilistic context-free grammar (PCFG) pars-er to assist natural language generation. The ba-sic idea underlying our method is that the generat-ed sentence is licensed by a context-free-grammar,and thus can be deduced from a parsing tree whichencodes hidden structural associations betweenmeaning representation and its sentence expres-sion. A tailored PCFG, i.e., a PCFG easily tailoredto application-specific concepts, is learned frompairs of structured meaning representation and itsnatural language sentence and then used to guidegeneration processes for other previously unseenmeaning representations. Table 1 exemplifies arecord from the application under consideration.
Our model is closest to (Konstas and Lapata,2012a) and (Konstas and Lapata, 2013) who re-formulate the Markov structure between a mean-ing representation and a string of text depictedin (Liang, et al., 2009) into a set of CFG rewriterules, and then deduce the best derivation tree fora database record. Although this Markov structurecan capture a few elements of rudimentary syntax,it is essentially not linguistic grammars. Thus thesentences produced by this model are usually un-grammatically informed (for instance, its 1-BESTmodel produces grammatically illegal sentenceslike “Milwaukee Phoenix on Saturday on Satur-day on Saturday on Saturday”). (Konstas and La-pata, 2013) claims that long range dependency isan efficient complementary to CFG grammar, andincorporates syntactic dependency between wordsinto the reranking procedure to enhance the perfor-mance. Although conceptually similar, our mod-el directly learns more grammatical rewrite rulesfrom hybrid syntactic trees whose nonterminal n-odes are comprised of phrasal nodes inheritingfrom a common syntactic parser, and conceptualnodes designed for encoding target meaning rep-resentation. Therefore, the learning aspect of twomodels is fundamentally different. We have a sin-gle CFG grammar that applies throughout, where-
81

Table 1: Examples of meaning representation input as a structured database and its corresponding naturallanguage expression. Each meaning representation has several fields, each field has a value.
Meaning action1 object1 value11 value12 action2 object2 value21 value22representation confirm person 100 120 request date null null
Text�¬<ê3100<�200<�m§�¯s3=Um¬º(The number of partici-pants is between 100 and 200. When is the meeting scheduled?)
as they train different CFG grammar and depen-dency grammar respectively.
The major advantage of our approach is thatit learns a tailored PCFGs directly from MR andNL pairs, without the need to manually defineCFG derivations, which is one of the most im-portant prerequisites in (Belz and Kow, 2009) and(Konstas and Lapata, 2013), and thus porting ourmethod to another applications is relatively easy.We demonstrate the versatility and effectiveness ofour method on response generation for a Chinesespoken dialogue system (SDS)1.
2 Problem Formulation
2.1 The grammarFollowing most previous works in this area (Liang,et al., 2009; Konstas and Lapata, 2013), we usethe term record r to refer to a (m, w) pair. Eachmeaning representation m is described as severalfields f , each field has a value f.v. As exemplifiedin Table 1, each m in the referred SDS system haseight fields (e.g., action, object1, value11), eachfield has a specific value. The value can be a string(e.g., confirm, person), or a numeric quantity (e.g.,100, 120), or null. The text is simply a sequenceof words w = (w1, ..., w|w|).
Our goal is to learn a PCFG for interpretinga MR using NL expression. In order to gener-ate more coherent sentence, the established gram-mar should capture recursive structure of phrases.Meanwhile, in order to generate sentence express-ing target meanings, the grammar should also cap-ture concept embeddings corresponding to desiredmeaning fields. Under this framework, a tailoredPCFG grammar we used for generation can be de-scribed as a 6-tuple:
G = 〈Np, Nc, T, S, L, λ〉 (1)
where Np is a finite set of non-terminal symbolsproduced by a common parser, Nc is a finite set of
1A demo can be found athttp://www.aidc.org.cn:8008/WebContent/
concept symbols related to specific record fields,T is a finite set of NL terminal symbols (words),S ∈ Np is a distinguished start symbol, L is alexicon which consists of a finite set of productionrules, and λ is a set of parameters that defines aprobability distribution over derivations under G.
2.2 Grammar Induction
In this section, we present a learning procedurefor the grammar described above. The input tothe learning algorithm is a set of training sen-tences paired with their correct meaning represen-tations (as illustrated in Table 1). The output fromthe learning algorithm is a PCFG describing bothphrase and concept embeddings. The learning al-gorithm assumes that a common phrase structureparser is available, but it does not require any pri-or knowledge of the MR syntax.
As a concrete example, consider the record inTable 1. We first analyze its sentence expres-sion using the Stanford parser (Chen and Man-ning, 2014) whose nonterminals are syntactic cat-egories (e.g., NP, VP, JJ, NN). Figure 1(a) out-lines the partial parser tree of sentence in Table1. The meaning of the sentence is then integratedby adding conceptual symbols of its subparts intothe parser tree. Figure 1(b) shows a hybrid parsetree of Figure 1(a). Here the nonterminal symbol-s in bold, PERSON, VAL1 and VAL2, representdomain-specific concepts corresponding to fieldsperson, value1 and value2.
To get the hybrid parse tree, we first align phras-es in the NL with the actual MR fields mentionedusing the model of (Liang, et al., 2009) which islearned in an unsupervised manner using EM toproduce which words in the text were spanned bythe fields. The aligned pairs are recorded in a tem-porary table. Then for each phrase in the table,we find the minimal subtree spanning it, and mod-ify its ancestor node attached directly below thesubtree’s root node to the conceptual symbol of itsaligned field. All ancestor nodes keep unchangedfor phrases not in the alignment table. The cen-
82

(a) (b)
Figure 1: Example of (a) a syntactic tree and (b) itscorresponding hybrid tree from which the tailoredPCFG defined in Formula (1) is constructed. Thesubtree circled by dotted line contains conceptualnode and its terminal derivations.
tral characteristic of a tree structured representa-tion is that component concept appears as a nodein a tree, with its word realizations as terminal n-odes derived by it. For example, the concept PER-SON has a terminal node “<ê”, and VALUE1“100<”, these could then form part of the rep-resentation for the sentence “�¬<ê3100 <�200 <�m"(The number of participants isbetween 100 and 200.)” The use of a recursive hy-brid syntactic and conceptual structure is one char-acteristic that distinguishes the proposed grammarfrom earlier work in which meaning is representedby logical forms or regular grammars (Lu and Ng,2011; and Konstas and Lapata, 2013).
Given hybrid trees, Np, Nc, T , S and the setof derivations that are possible are fixed, we onlyneed to learn a probabilistic model parameterizedby λ. Since the “correct” correspondence betweenNL words and MR fields is fully accessible, i.e.,there is a single deterministic derivation associat-ed with each training instance, model parameterλ can be directly estimated from the training cor-pus by counting. Because the derived trees outputby parser can be noisy, we need to process them toobtain cleaner PCFG rules. We compare the 3-besttrees produced by the Stanford Parser, and pruneoff the inconsistent components voted by majori-ties when extracting and counting rules.
2.3 DecodingOur goal in decoding is to find the most probablesentence s for a given meaning expression m:
s = g( argmaxD s.t. m(D)=m
P (D|G) · ln(|D|+ 1)) (2)
where g is a function that takes as input a deriva-tion tree D and returns s, m(D) refers to the
meaning representation of a derivation D, andP (D|G) is product of weights of the PCFG rulesused in a derivation D, the factor ln(|D| + 1),offers a way to compensate the output sentencelength |D|. We use a decoding paradigm intro-duced in (Konstas and Lapata, 2013) which isessentially a bottom-up chart-parsing algorithmwithout forcing the input to exhibit linear struc-ture. It first fills the diagonal cell of the chart withterminal words with the top scoring words emittedby the unary rules of the type A → α, where A isa non-terminal symbol, and α is a terminal word.
In order to search among exponentially manypossible tree structures for a given MR, a k-bestdecoder is achieved by adding to the chart a list ofthe top k words and production rules, then an ex-ternal language model is used to rerank the derivedpartial trees in a timely manner with cube pruning(Huang and Chiang, 2005).
3 Empirical Evaluation
We conducted experiments on a Chinese spokendialogue system (SDS) for booking meeting room.Our NLG module receives structured input fromdialogue management (DM) module and gener-ates natural language response to user. The struc-tured input includes dialogue actions (e.g., greet,request, confirm), objects (e.g., date, budget, loca-tion) and object values which can be a null. TheSDS corpus consists of 1,406 formal meaning rep-resentations, along with their Chinese NL expres-sions written by 3 Chinese native speakers. Theaverage sentence length for the example data is15.7 Chinese words. We randomly select 1,000record pairs as training data, and the remaining406 is used as testing data.
To evaluate the quality of the generated sen-tences, the BLEU score (Papineni et al., 2002)is computed by comparing system-generated sen-tences with human-written sentences. In addition,we evaluated the generated text via a human judg-ment as designed in (Angeli et al., 2010). The sub-jects were presented with a MR and were askedto rate its corresponding NL expression along t-wo dimensions: grammatical fluency and seman-tic correctness. A five point rating scale is de-signed where a higher number indicates better per-formance. The averaged score of three human e-valuators was computed.
In order to compare our work with previous re-lated work, Table 2 summarizes results achieved
83

Table 2: BLEU scores, and human ratings for syn-tactic fluency (SF) and semantic correctness (SC)of different systems.
system BLEU SF SC
1-BEST-Konstas 9.32 2.29 1.94k-BEST-Konstas 21.85 3.91 3.121-BEST-Our 30.88 4.36 3.95k-BEST-Our 31.96 4.34 4.33HUMAN – 4.76 4.89
using the proposed tailored PCFGs with that us-ing the grammar described in (Konstas and La-pata, 2013). 1-BEST signifies results obtainedfrom the basic decoder described in Section 2.3,and k-BEST is results of the k-best decoder r-eranked with a bigram language model. Here weset k = 20 without more fine-tuning work.
To make intensive comparisons, the length ofthe generated sentence is not restricted as a fixednumber, while varying from 1 to a length of thelongest sentence in the training data. The sen-tences with different length are overall sorted toobtain the 1-BEST and the k-BEST.
From Table 2, we find that differences in BLEUscores between 1-BEST-Konstas and 1-BEST-Ourare statistically significant (9.32 vs. 30.88). S-ince the only difference between these two result-s is the grammar used, we have reason to justifythat the tailored grammar learnt from the hybridphrase-concept trees is superior for modeling NLand MR correspondence to that used in (Konstasand Lapata, 2013). It is interesting to notice thatk-BEST-Konstas observes substantial increase inperformance compared to 1-BEST-Konstas, whilek-BEST-Our only achieves a slight increase com-pared to 1-BEST-Our. Statistical language modeloffers potentially significant advantages for the se-quential Markov grammar as reported in (Konstasand Lapata, 2013), but it contributes little to thetailored PCFGs. This also verifies the robustnessof the proposed method.
Table 2 also summarizes the human ratingsfor each system and the gold-standard human-authored sentences. From Table 2 we can observethat our method consistently produce good Chi-nese sentences in terms of both grammatical co-herence and semantic soundness, which is consis-tent with the results of automatic evaluation. An-other major advantage of our method over method
Figure 2: An example of generations produced byeach of the four models.
of (Konstas and Lapata, 2013) is that it does notrequire any prior knowledge of the MR syntax fortraining. Therefore, transplanting our method toother NLG application is relatively easy.
Figure 2 shows the generations of the four mod-els on an example. 1-BEST-Konstas is only able toform Markov but not grammatical associations. k-BEST-Konstas improves it by accounting for morepossible associations, but errors are still made dueto the lack of syntactic structure. 1-BEST-Ourand k-BEST-Our remedies this. However, unex-pected sentences are still produced in the cases oflong rang correlation. For example, k-BEST-Ourproduced a sentence “ ¬ÆFÏ�o�ÿÞ1Qº(When is the meeting date held?)” which is agrammatically well-formed sentence but has poorfluency and meaning. As perceived in the work ofsyntactic parsing, PCFG is very difficult to capturelong range dependency of word strings.
4 Conclusions
We have presented a PCFG-based natural lan-guage generation method. In particular, themethod learns tailored PCFG rules from hy-brid phrase-concept trees automatically augment-ed from the output of a common syntactic parser.A compelling advantage of the proposed methodis that it does not rely on prior knowledge of theMR syntax for training. We have shown the com-petitive results in a Chinese spoken dialogue sys-tem. Future extensions include deploying more ef-ficient decoding algorithms, and richer structuralfeatures to rerank the derivations.
Acknowledgments
This work was partially supported by Natural Sci-ence Foundation of China (No. 61202248, No.61273365), Discipline Building Planing 111 BaseFund (No. B08004).
84

ReferencesGabor Angeli, Percy Liang, and Dan Klein. 2010.
A Simple Domain-Independent Probabilistic Ap-proach to Generation. In Proceedings of the Con-ference on Empirical Methods in Natural LanguageProcessing, pp. 502-512, Cambridge, MA.
Ioannis Konstas and Mirella Lapata. 2013. A GlobalModel for Concept-to-Text Generation. Journal ofArtificial Intelligence Research, 48(2013): 305-346.
Ioannis Konstas and Mirella Lapata. 2012a. Concept-to-Text Generation via Discriminative Reranking. InProceedings of the 50th Annual Meeting of the Asso-ciation for Computational Linguistics: Human Lan-guage Technologies, pp. 369-378, Jeju, South Korea.
Ioannis Konstas and Mirella Lapata. 2012b. Unsuper-vised Concept-to-text Generation with Hypergraph-s. In Proceedings of 2012 Conference of the NorthAmerican Chapter of the of the ACL: Human Lan-guage Technologies, pp.752-761, Montreal, Canada.
Liang Huang and David Chiang. 2005. Better K-bestParsing. In Proceedings of the 9th Interna-tionalWorkshop on Parsing Technology, pp. 53-64, Van-couver, British Columbia.
David Chiang. 2007. Hierarchical Phrase-BasedTranslation. Computational Linguistics, 33(2): 201-228.
Percy Liang, Michael I. Jordan, and Dan Klein. 2009.Learning Semantic Correspondences with Less Su-pervision. In Proceedings of the Joint Conference ofthe 47th Annual Meeting of the ACL and the 4th In-ternational Joint Conference on Natural LanguageProcessing of the AFNLP, pp. 91-99, Suntec, Singa-pore.
Wei Lu and Hwee Tou Ng. 2011. A Probabilis-tic Forest-to-String Model for Language Genera-tion from Typed Lambda Calculus Expressions. InProceedings of the 2011 Conference on EmpiricalMethods in Natural Language Processing, pp. 1611-1622, Edinburgh, Scotland, UK.
Anja Belz. 2008. Automatic Generation of WeatherForecast Texts Using Comprehensive ProbabilisticGeneration-space Models. Natural Language Engi-neering, 14(4):431-455.
Anja Belz and Eric Kow. 2009. System BuildingCost vs. Output Quality in Data-to-text Generation.In Proceedings of the 12th European Workshop onNatural Language Generation, pp. 16-24, Athens,Greece.
Danqi Chen and Christopher D. Manning. 2014. AFast and Accurate Dependency Parser using NeuralNetworks. In Proceedings of the 2014 Conferenceon Empirical Methods in Natural Language Pro-cessing, pp. 740-750, Doha, Qatar.
Nathan McKinley and Soumya Ray. 2014. ADecision-Theoretic Approach to Natural LanguageGeneration. In Proceedings of the 52nd AnnualMeeting of the Association for Computational Lin-guistics, pp. 552-561, Baltimore, Maryland, USA.
Kishore Papineni, Salim Roukos, Todd Ward, and Wei-Jing Zhu 2002. BLEU: a Method for AutomaticEvaluation of Machine Translation In Proceedingsof the 40th Annual Meeting of the Association forComputational Linguistics, pp. 311-318. Philadel-phia, PA.
Bikash Gyawali and Claire Gardent 2014. SurfaceRealisation from Knowledge-base. In Proceedingsof the 52nd Annual Meeting of the Association forComputational Linguistics, pp. 424-434. Baltimore,Maryland.
Miguel Ballesteros, Bernd Bohnet, Simon Mille, andLeo Wanner. 2015. Data-driven Sentence Genera-tion with Non-isomorphic Trees. In Proceedings ofthe 2015 Annual Conference of the North AmericanChapter of the ACL, pp. 387-397, Denver, Colorado.
Verena Rieser and Oliver Lemon. 2009. Natural Lan-guage Generation as Planning Under Uncertainty forSpoken Dialogue Systems. In Proceedings of the12th Conference of the European Chapter of the A-CL, pp. 683-691, Athens, Greece
Yuk Wah Wong and Raymond J. Mooney. 2007. Gen-eration by Inverting a Semantic Parser That Uses S-tatistical Machine Translation. In Proceedings of theHuman Language Technology and the Conference ofthe North American Chapter of the Association forComputational Linguis-tics, pp. 172-179, Rochester,NY.
Ondrej Dusek and Filip Jurcicek. 2015. Training aNatural Language Generator from Unaligned Data.In Proceedings of the 53rd Annual Meeting of theAssociation for Computational Linguistics and the7th International Joint Conference on Natural Lan-guage Processing, pp.410-419, Beijing, China.
Michael White and Rajakrishnan Rajkumar. 2009.Perceptron Reranking for CCG Realization. In Pro-ceedings of the 2009 Conference on EmpiricalMeth-ods in Natural Language Processing, pp.451-461,Suntec, Singapore.
85
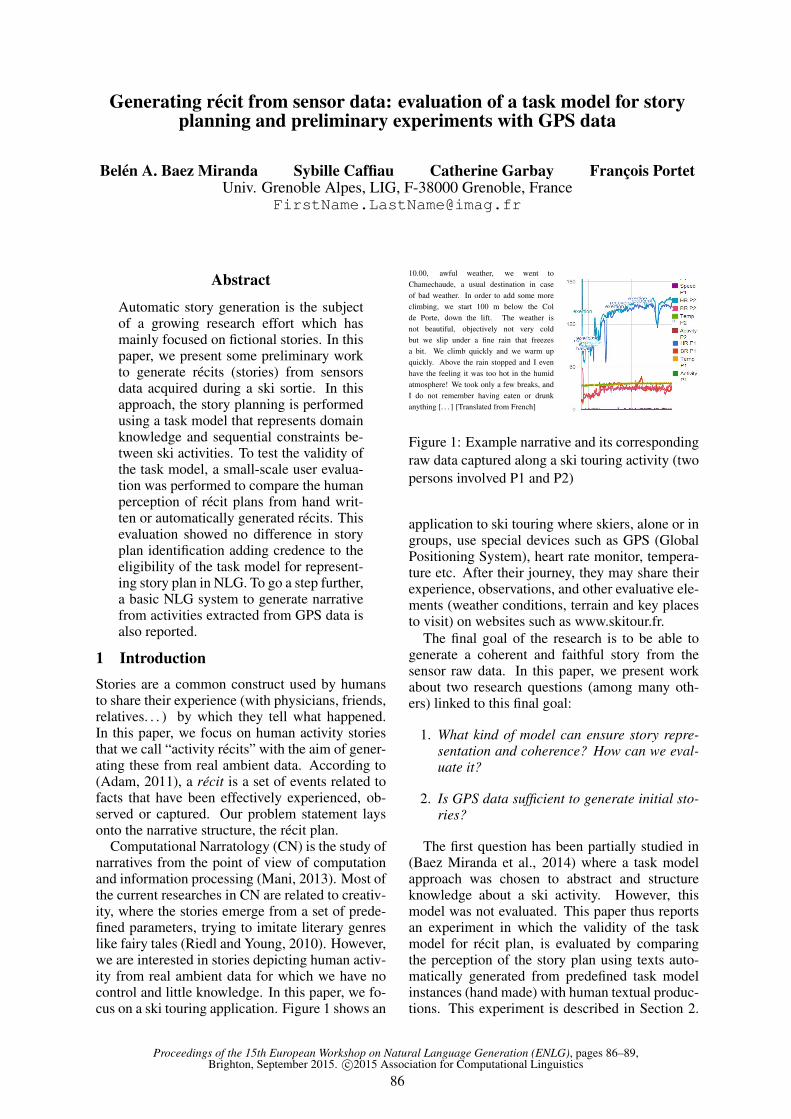
Proceedings of the 15th European Workshop on Natural Language Generation (ENLG), pages 86–89,Brighton, September 2015. c©2015 Association for Computational Linguistics
Generating recit from sensor data: evaluation of a task model for storyplanning and preliminary experiments with GPS data
Belen A. Baez Miranda Sybille Caffiau Catherine Garbay Francois PortetUniv. Grenoble Alpes, LIG, F-38000 Grenoble, France
Abstract
Automatic story generation is the subjectof a growing research effort which hasmainly focused on fictional stories. In thispaper, we present some preliminary workto generate recits (stories) from sensorsdata acquired during a ski sortie. In thisapproach, the story planning is performedusing a task model that represents domainknowledge and sequential constraints be-tween ski activities. To test the validity ofthe task model, a small-scale user evalua-tion was performed to compare the humanperception of recit plans from hand writ-ten or automatically generated recits. Thisevaluation showed no difference in storyplan identification adding credence to theeligibility of the task model for represent-ing story plan in NLG. To go a step further,a basic NLG system to generate narrativefrom activities extracted from GPS data isalso reported.
1 IntroductionStories are a common construct used by humansto share their experience (with physicians, friends,relatives. . . ) by which they tell what happened.In this paper, we focus on human activity storiesthat we call “activity recits” with the aim of gener-ating these from real ambient data. According to(Adam, 2011), a recit is a set of events related tofacts that have been effectively experienced, ob-served or captured. Our problem statement laysonto the narrative structure, the recit plan.
Computational Narratology (CN) is the study ofnarratives from the point of view of computationand information processing (Mani, 2013). Most ofthe current researches in CN are related to creativ-ity, where the stories emerge from a set of prede-fined parameters, trying to imitate literary genreslike fairy tales (Riedl and Young, 2010). However,we are interested in stories depicting human activ-ity from real ambient data for which we have nocontrol and little knowledge. In this paper, we fo-cus on a ski touring application. Figure 1 shows an
10.00, awful weather, we went toChamechaude, a usual destination in caseof bad weather. In order to add some moreclimbing, we start 100 m below the Colde Porte, down the lift. The weather isnot beautiful, objectively not very coldbut we slip under a fine rain that freezesa bit. We climb quickly and we warm upquickly. Above the rain stopped and I evenhave the feeling it was too hot in the humidatmosphere! We took only a few breaks, andI do not remember having eaten or drunkanything [. . . ] [Translated from French]
Figure 1: Example narrative and its correspondingraw data captured along a ski touring activity (twopersons involved P1 and P2)
application to ski touring where skiers, alone or ingroups, use special devices such as GPS (GlobalPositioning System), heart rate monitor, tempera-ture etc. After their journey, they may share theirexperience, observations, and other evaluative ele-ments (weather conditions, terrain and key placesto visit) on websites such as www.skitour.fr.
The final goal of the research is to be able togenerate a coherent and faithful story from thesensor raw data. In this paper, we present workabout two research questions (among many oth-ers) linked to this final goal:
1. What kind of model can ensure story repre-sentation and coherence? How can we eval-uate it?
2. Is GPS data sufficient to generate initial sto-ries?
The first question has been partially studied in(Baez Miranda et al., 2014) where a task modelapproach was chosen to abstract and structureknowledge about a ski activity. However, thismodel was not evaluated. This paper thus reportsan experiment in which the validity of the taskmodel for recit plan, is evaluated by comparingthe perception of the story plan using texts auto-matically generated from predefined task modelinstances (hand made) with human textual produc-tions. This experiment is described in Section 2.
86

Figure 2: Steps for the recit generation for the task model evaluation.
The second question, though on a completely dif-ferent aspect than the first one, is linked to an in-herent problem in any system based on sensors.What kind of information can be inferred fromthem? Is this information sufficient? Since, skitouring corpus texts are mainly structured by theroute, we report an initial basic data-to-text systemthat generates texts from GPS data in Section 3.
2 Evaluation of recit plan
To represent the story plan and cope with the pre-cise case of human activity, we propose to use thenotion of task model (Caffiau et al., 2010), whichhas been used previously by (Cavazza et al., 2002)for fictional but interactive stories. As presentedin (Baez Miranda et al., 2014), this task model iscore to our approach to story generation. In theapproach, raw data is firstly captured and inter-preted. The resulting interpretations are structuredand linked together in a second step, according tothe task model. One sequence of the task model isthen identified as the story plan and used to drivethe generation stage. This aim to result in an ac-tivity recit that emerges directly from the sensordata but is organised according to the task modelexpressing the human activity.
To evaluate the temporal perception of therecit, we followed the steps depicted in Figure 2.Several ski tour recits from www.skitour.fr werecollected and annotated by the authors using aschema based on the task model. Then, the an-notations were used as input to the task model.This story plan was then linearised into text usingchronological order. Note, that to evaluate onlythe task model and to avoid side effect due to dataprocessing, no raw data was used in this process.For more detail about the process, the reader is re-ferred to (Baez Miranda et al., 2014).
18 French speakers (12 men and 6 women) agedbetween 19 and 38 were asked to rebuild chrono-logical sequences of ski touring activities afterreading separately three recits. The text selectionwas performed based on the text size, complex-ity of the ski touring sortie; clarity of the descrip-
tion of the sortie, linguistic quality, and finally thenumber of protagonists of the sortie and the levelof expertise shown in the narration of the sortie.The duration of the experiment was 25 min in av-erage. Each text was presented to each partici-pant (within participants design) in either two ver-sions, (i) the original human written one from thecollected corpus of ski touring recits and (ii) thegenerated text based on the task model. The ex-periment consisted in sorting cards of basic ac-tivity into the sequence of the actual sortie usingadhesive tape and a paper-made timeline. Oncethe reading was finished, the reader choose thecards corresponding to the events encountered inthe text. Then, all the cards were arranged on thetimeline according to the chronological order per-ceived during the lecture. The participants did notknow whether the text presented was generated au-tomatically or not.
The distance between the participant’s answersand the reference story plan was computed usingan edit distance similar to the Word Error Rate(WER). An ANOVA performed on the distancevalue showed a significant effect of text (humanvs. computer) (F(1,18) = 7.583, p=0.0131). Aparticipant effect was also found (F(17,18)=2.281,p=0.0457). Regarding the size of the partici-pant’s sequences, a difference between the humantexts and the generated ones was found (F(1,48) =5.604, p = 0.022) and a text effect (F(1,18)=3.666,p=0.033), that appears significant when the textis taken as factor. It seems thus that the gener-ated texts induce significantly less errors duringthe activity identification than the original ones(F(1,18)=8.993, p=0.00771).
Regarding the distance, the generated textspresent a chronological order more explicit andthat may explain why participants were able toperceive easier the structure of the events sequenceand to reconstruct the path. In human texts, thechronological order is more implicit because of thetext configuration, which can include many satel-lite details or events omissions, like ellipses.
However, it could be possible to find that someactivities were identified in the human texts but not
87

Figure 3: The basic GPS-to-recit system.
in the generated ones. This could be explained bymany reasons, such as a possible lack of cover-age during the task model construction; activitiesnot identified during the corpus analysis or the factthat, due to the presence of ambiguity in humantexts, the participants did not distinguish the activ-ities correctly. Improvements in the task modeland in the collection and analysis of the corpuswould thus be needed in order to make the ap-proach more robust.
These results show that task model is an eligi-ble support to abstract activity events and structurethen. In our approach, instances of task model(recit plan) emerge from ambient sensor data, inthe next section, we present a preliminary exper-iment to extract human activities events (concretetasks in task model) from GPS data.
3 Generating Recits from real data: Thecase of the GPS traces
In ski touring, the most important component ofthe story is the progress of the tour in the followedtrack. As a matter of fact, the goal of the sor-tie (e.g., peak, lake, col, etc.) is very often alsothe goal of the story, although other goals can befound in the human authored corpus (e.g., doingthe sortie in the shortest time). The first step isthus to extract the movement and break activities.
To do so, a basic system sketched in Figure 3,has been designed to process the successive geo-graphic localisations provided by a GPS device.First, GPS data from one sortie is temporally seg-mented based on the altitude. Then, these seg-ments are abstracted into activities. The selectionof activities is then performed using the task modelso as to obtain a sequence of activities which isvalid with respect to the model1. Then each activ-ity of the sequence is lexicalised and a simple GREis performed. Sentence planning is performed us-ing rigid syntactic patterns which are unified withthe lexicalised tasks and then realised as text.
3.1 Corpus collectionA small “parallel corpus” was formed throughvoluntary skiers, involving (i) acquired numerical
1Note that this selection is very crude at the moment sincenot all types of activity can be retrieved from the GPS data.
data and (ii) narratives written by the skiers af-ter their sortie. Physiological and actimetric datawere specifically collected for this sortie usinga smartphone running the RecordMe application(Blachon et al., 2014) and physiological sensors.These data involve time, location, altitude, heartand breath rate, etc. Extracts of numerical andtextual data are shown in Figure 1. This corpusis composed of 5 records (three of which are ofcouple of skiers) but will grow in the near future.
3.2 ProcessingThe GPS segmentation consists in aggregatingaltitude points into segments of points that canbe approximated by a straight line with a lowamount of error. The Douglas-Peucker algo-rithm (Douglas and Peucker, 1973) was used forits simplicity. At the end of the process, a listof segments is obtained each of them being la-belled as having either a positive, null ornegative denivelee2. All successive segmentswith the same denivelee label are then merged.
Then, the segments are classified based onthe average speed of the segment into ‘ascend-ing’, ‘moving forward’, ‘descending’ or ‘break’3.These segments populate an ontology (Baez Mi-randa et al., 2014) and are then enriched with linksto the next and previous activities, the start and endtime, the denivelee, the average speed as well asthe set of participants performing them.
Other important information is Point of Inter-est. These are encountered along the way (e.g.,the Achard lake, the chairlift). These provide:first, an alternative description since ski tour sor-tie are rarely described by latitude and longitudebut by using natural geographical description (See(Turner et al., 2010) for reference) ; second, sub-goals to the recit structure since some POIs aremain steps to reach the final goal. POI can beextracted using services such as OpenStreetMapwhich collects information about POI all over theworld. For instance a query about the area ofthe ‘Croix de Chamrousse’ 4 gives the results pre-sented in Figure 4. From this, every natural ele-ments can be retrieved and associated to the tasksthrough co-occurrence links.
The abstraction of segments into tasks is for themoment very crude as it consists only of classifi-cation based on speed and slope (e.g., a speed of15km/h in a descending segment is a ‘descent’ skiactivity). Activity selection is then performed fol-lowing the chronological order and the task model.
2a denivelee is a difference in altitude between the startingpoint and the ending point
3‘ascending’, ‘moving forward’, ‘descending’ are specificcases of the task ‘moving forward’
4Chamrousse is a famous ski resort in the French Alps
88

<osm version="0.6" ><node lat="45.1258501" lon="5.9025905"><tag k="ele" v="2253"/><tag k="name" v="Croix de Chamrousse"/><tag k="natural" v="peak"/></node>
<node lat="45.1255687" lon="5.9001744"><tag k="aerialway" v="pylon"/></node>...
cat sactor {P1,P2}activity descentlocomotion_mode skigoal {station}source {Chamrousse_Peak}time {10:21}duration {22:32}
Figure 4: OpenStreetMap description and seman-tic representation
For each activity, if the addition of this activity tothe set of selected activities makes a valid scenariowrt the model, the activity is added. In any case,the segments containing the main goal of the sortieand the start and end ones should be included intothe set of selected activities.
Each activity is translated into a semantic frame.For instance, a descending activity for participantP1 can be represented by the structure in Fig-ure 4. This structure is then matched to prede-fined set of syntactic structures which constrainlexical choices. The sentence could then be re-alised as “Departing from Chamrousse. At 08:16P1 mounts to Col des 3 Fontaines during 1:52. At10:08 he has a break to Croix de Chamrousse dur-ing 0:13 [...]”. The realisation is performed usingsimpleNLG (Gatt and Reiter, 2009).
4 Future work
The project is at its initial phase and there aremany improvements to perform. One of the mostimportant task for the text generation part is toadopt a more structured approach to microplanni-fication. We are working on re-implementing themicro-planner used in the BabyTalk project (Portetet al., 2009). On the macro-planner side, the rea-soning must be more integrated so that a dynamicplanning is performed and missing data is takeninto account. An important challenge is to han-dle several narrative threads since several skierscan participate to the sortie. Regarding the dataprocessing, the next step will be to include moresignals such as physiological ones that can informabout the physiological state of the skier along thetrack (tired, resting, etc.). This will permit moreadaptation of the output toward either sport-likerecit (focusing on performance) or leisure one (fo-cusing on where skiers have been).
On the coherence side, to improve and to pro-duce a more natural text, we need to explore otheraspects such as temporality. Currently, the storyplan from the task model can produce a sequenceof events linked in causal way by establishing pre-conditions and effects during the task model con-struction. However, this is not reflected in the gen-
erated texts. So, we need to add discourse con-nectors that indicate this causal links. Renderingsimultaneous tasks is also an important feature toadd to the model. The task model can express this,but it is not yet reflected in the generated text.
Finally, generating an activity recit from sensordata raises specific issues, in particular regardingthe paucity of data. Inferencing and reasoning pro-cesses are then needed to cope with this lack ofinformation and keep the recit consistent.
ReferencesJean-Michel Adam. 2011. Genre de recits. Narrativite
et genericite des textes. Academia.
Belen A. Baez Miranda, Sybille Caffiau, CatherineGarbay, and Francois Portet. 2014. Task basedmodel for recit generation from sensor data: an earlyexperiment. In 5th International Workshop on Com-putational Models of Narrative, pages 1–10.
David Blachon, Francois Portet, Laurent Besacier, andStephan Tassart. 2014. RecordMe: A SmartphoneApplication for Experimental Collections of LargeAmount of Data Respecting Volunteer’s Privacy. InUCAmI 2014, pages 345–348, Belfast, UK.
S Caffiau, D L Scapin, P Girard, M Baron, and F Jam-bon. 2010. Increasing the expressive power of taskanalysis: Systematic comparison and empirical as-sessment of tool-supported task models. Interactingwith Computers, 22(6):569–593.
Marc Cavazza, Fred Charles, and Steven J. Mead.2002. Character-based interactive storytelling.IEEE Intelligent Systems, 17(4):17–24.
David H Douglas and Thomas K Peucker. 1973. Algo-rithms for the reduction of the number of points re-quired to represent a digitized line or its caricature.Cartographica, 10(2):112–122.
Albert Gatt and Ehud Reiter. 2009. Simplenlg: A re-alisation engine for practical applications. In Pro-ceedings of ENLG-2009.
Inderjeet Mani. 2013. Computational Modeling ofNarrative, volume 18. Morgan & Claypool.
Francois Portet, Ehud Reiter, Albert Gatt, Jim Hunter,Somayajulu Sripada, Yvonne Freer, and CindySykes. 2009. Automatic generation of textual sum-maries from neonatal intensive care data. ArtificialIntelligence, 173(7-8):789–816.
M. O. Riedl and R. M. Young. 2010. Narrative plan-ning: Balancing plot and character. Journal of Arti-ficial Intelligence Research, 39:217–268.
Ross Turner, Somayajulu Sripada, and Ehud Reiter.2010. Generating approximate geographic descrip-tions. In Empirical Methods in Natural LanguageGeneration: Data-oriented Methods and EmpiricalEvaluation, pages 121–140.
89
Proceedings of the 15th European Workshop on Natural Language Generation (ENLG), pages 90–94,Brighton, September 2015. c©2015 Association for Computational Linguistics
Generating and Evaluating Landmark-based Navigation Instructions inVirtual Environments
Amanda Cercas CurrySchool of Mathematical and
Computer SciencesHeriot-Watt University
Dimitra GkatziaSchool of Mathematical and
Computer SciencesHeriot-Watt University
Verena RieserSchool of Mathematical and
Computer SciencesHeriot-Watt University
Abstract
Referring to landmarks has been identi-fied to lead to improved navigation in-structions. However, a previous corpusstudy suggests that human “wizards” alsochoose to refer to street names and gener-ate user-centric instructions. In this paper,we conduct a task-based evaluation of twosystems reflecting the wizards’ behavioursand compare them against an improvedversion of previous landmark-based sys-tems, which resorts to user-centric de-scriptions if the landmark is estimated tobe invisible. We use the GRUVE vir-tual interactive environment for evalua-tion. We find that the improved system,which takes visibility into account, outper-forms the corpus-based wizard strategies,however not significantly. We also show asignificant effect of prior user knowledge,which suggests the usefulness of a usermodelling approach.
1 Introduction
The task of generating successful navigation in-structions has recently attracted increased atten-tion from the dialogue and Natural LanguageGeneration (NLG) communities, e.g. (Byron etal., 2007; Dethlefs and Cuayahuitl, 2011; Ja-narthanam et al., 2012; Drager and Koller, 2012)etc. Previous research suggests that landmark-based route instructions (e.g. “Walk towards theCastle”) are in general preferable because they areeasy to understand, e.g. (Millonig and Schechtner,2007; Chan et al., 2012; Elias and Brenner, 2004;Hansen et al., 2006; Drager and Koller, 2012).However, landmarks might not always be visibleto the user. A recent corpus study by Cercas andRieser (2014) on the MapTask and two Wizard-of-
Oz corpora, Spacebook1 and Spacebook2,1 empir-ically investigated the type of reference objects hu-man instruction givers tend to choose under differ-ent viewpoints. It was found that human “wizards”do not always generate instructions based on land-marks, but also choose to refer to street names orgenerate user-centric instructions, such as “Con-tinue straight”.
This paper compares three alternative genera-tion strategies for choosing possible reference ob-jects: one system reflecting an improved versionof a landmark-based policy, which will resort to auser-centric description if the landmark is not vis-ible; and two systems reflecting the wizards’ be-haviours in Spacebook1 and Spacebook2. We hy-pothesise the first system will outperform the othertwo in terms of human-likeness and naturalness, asdefined in Section 3. We use the GRUVE (GivingRoute Instructions in Uncertain Virtual Environ-ments) system (Janarthanam et al., 2012) to evalu-ate these alternatives.
2 Methodology
We designed two corpus-based strategies (Sys-tem B, C) and one rule-based system based on aheuristic landmark selection algorithm (A). Alsosee examples in Table 1. Strategies for systems Band C aim to emulate the wizards’ strategies de-pendent on different viewpoints: System B usesdata from Spacebook1, where the wizard followsthe user around, and thus, shares the viewpoint ofthe user. System C uses data from Spacebook2,where the wizard follows the user remotely onGoogleMaps via GPS tracking, and thus, streetnames are visible to the wizard, but only the ap-proximate location is known.
• System A: Landmark and User-centricstrategy reflects an improved version over
1The Spacebook data is freely available here:http://www.macs.hw.ac.uk/ilabarchive/spacebook/login.php
90
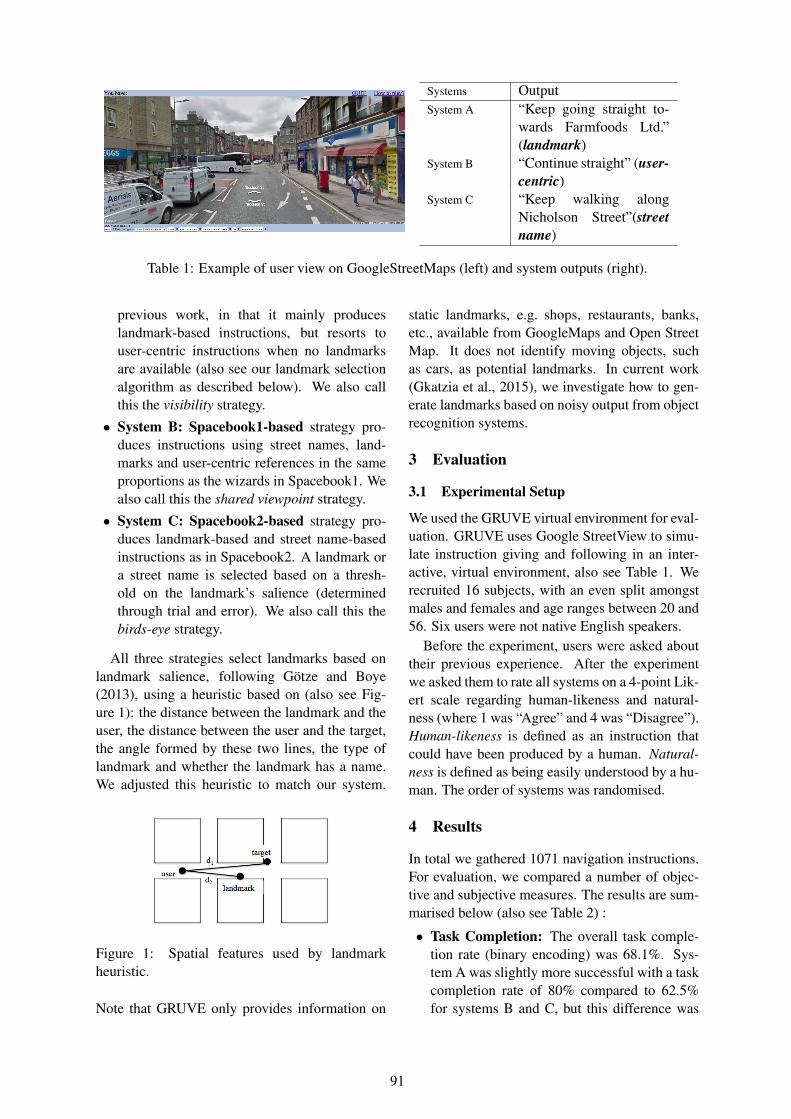
Systems OutputSystem A “Keep going straight to-
wards Farmfoods Ltd.”(landmark)
System B “Continue straight” (user-centric)
System C “Keep walking alongNicholson Street”(streetname)
Table 1: Example of user view on GoogleStreetMaps (left) and system outputs (right).
previous work, in that it mainly produceslandmark-based instructions, but resorts touser-centric instructions when no landmarksare available (also see our landmark selectionalgorithm as described below). We also callthis the visibility strategy.
• System B: Spacebook1-based strategy pro-duces instructions using street names, land-marks and user-centric references in the sameproportions as the wizards in Spacebook1. Wealso call this the shared viewpoint strategy.
• System C: Spacebook2-based strategy pro-duces landmark-based and street name-basedinstructions as in Spacebook2. A landmark ora street name is selected based on a thresh-old on the landmark’s salience (determinedthrough trial and error). We also call this thebirds-eye strategy.
All three strategies select landmarks based onlandmark salience, following Gotze and Boye(2013), using a heuristic based on (also see Fig-ure 1): the distance between the landmark and theuser, the distance between the user and the target,the angle formed by these two lines, the type oflandmark and whether the landmark has a name.We adjusted this heuristic to match our system.
Figure 1: Spatial features used by landmarkheuristic.
Note that GRUVE only provides information on
static landmarks, e.g. shops, restaurants, banks,etc., available from GoogleMaps and Open StreetMap. It does not identify moving objects, suchas cars, as potential landmarks. In current work(Gkatzia et al., 2015), we investigate how to gen-erate landmarks based on noisy output from objectrecognition systems.
3 Evaluation
3.1 Experimental Setup
We used the GRUVE virtual environment for eval-uation. GRUVE uses Google StreetView to simu-late instruction giving and following in an inter-active, virtual environment, also see Table 1. Werecruited 16 subjects, with an even split amongstmales and females and age ranges between 20 and56. Six users were not native English speakers.
Before the experiment, users were asked abouttheir previous experience. After the experimentwe asked them to rate all systems on a 4-point Lik-ert scale regarding human-likeness and natural-ness (where 1 was “Agree” and 4 was “Disagree”).Human-likeness is defined as an instruction thatcould have been produced by a human. Natural-ness is defined as being easily understood by a hu-man. The order of systems was randomised.
4 Results
In total we gathered 1071 navigation instructions.For evaluation, we compared a number of objec-tive and subjective measures. The results are sum-marised below (also see Table 2) :
• Task Completion: The overall task comple-tion rate (binary encoding) was 68.1%. Sys-tem A was slightly more successful with a taskcompletion rate of 80% compared to 62.5%for systems B and C, but this difference was
91
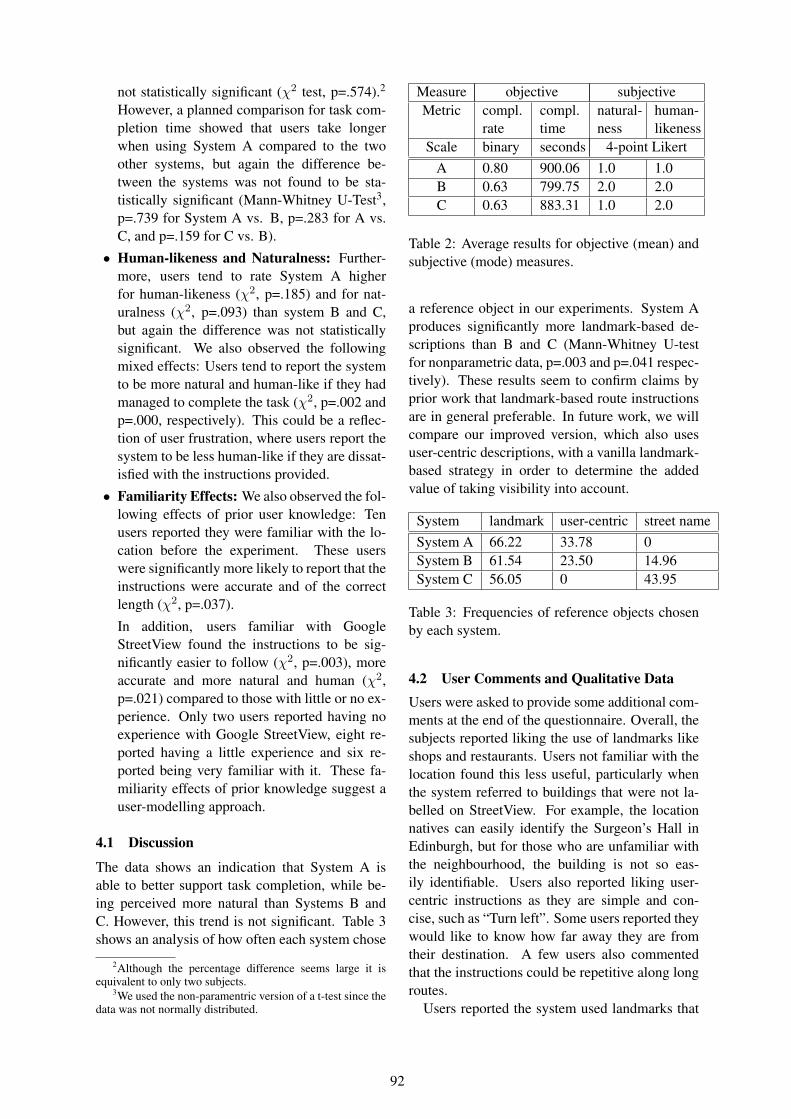
not statistically significant (χ2 test, p=.574).2
However, a planned comparison for task com-pletion time showed that users take longerwhen using System A compared to the twoother systems, but again the difference be-tween the systems was not found to be sta-tistically significant (Mann-Whitney U-Test3,p=.739 for System A vs. B, p=.283 for A vs.C, and p=.159 for C vs. B).
• Human-likeness and Naturalness: Further-more, users tend to rate System A higherfor human-likeness (χ2, p=.185) and for nat-uralness (χ2, p=.093) than system B and C,but again the difference was not statisticallysignificant. We also observed the followingmixed effects: Users tend to report the systemto be more natural and human-like if they hadmanaged to complete the task (χ2, p=.002 andp=.000, respectively). This could be a reflec-tion of user frustration, where users report thesystem to be less human-like if they are dissat-isfied with the instructions provided.
• Familiarity Effects: We also observed the fol-lowing effects of prior user knowledge: Tenusers reported they were familiar with the lo-cation before the experiment. These userswere significantly more likely to report that theinstructions were accurate and of the correctlength (χ2, p=.037).
In addition, users familiar with GoogleStreetView found the instructions to be sig-nificantly easier to follow (χ2, p=.003), moreaccurate and more natural and human (χ2,p=.021) compared to those with little or no ex-perience. Only two users reported having noexperience with Google StreetView, eight re-ported having a little experience and six re-ported being very familiar with it. These fa-miliarity effects of prior knowledge suggest auser-modelling approach.
4.1 Discussion
The data shows an indication that System A isable to better support task completion, while be-ing perceived more natural than Systems B andC. However, this trend is not significant. Table 3shows an analysis of how often each system chose
2Although the percentage difference seems large it isequivalent to only two subjects.
3We used the non-paramentric version of a t-test since thedata was not normally distributed.
Measure objective subjectiveMetric compl.
ratecompl.time
natural-ness
human-likeness
Scale binary seconds 4-point LikertA 0.80 900.06 1.0 1.0B 0.63 799.75 2.0 2.0C 0.63 883.31 1.0 2.0
Table 2: Average results for objective (mean) andsubjective (mode) measures.
a reference object in our experiments. System Aproduces significantly more landmark-based de-scriptions than B and C (Mann-Whitney U-testfor nonparametric data, p=.003 and p=.041 respec-tively). These results seem to confirm claims byprior work that landmark-based route instructionsare in general preferable. In future work, we willcompare our improved version, which also usesuser-centric descriptions, with a vanilla landmark-based strategy in order to determine the addedvalue of taking visibility into account.
System landmark user-centric street nameSystem A 66.22 33.78 0System B 61.54 23.50 14.96System C 56.05 0 43.95
Table 3: Frequencies of reference objects chosenby each system.
4.2 User Comments and Qualitative DataUsers were asked to provide some additional com-ments at the end of the questionnaire. Overall, thesubjects reported liking the use of landmarks likeshops and restaurants. Users not familiar with thelocation found this less useful, particularly whenthe system referred to buildings that were not la-belled on StreetView. For example, the locationnatives can easily identify the Surgeon’s Hall inEdinburgh, but for those who are unfamiliar withthe neighbourhood, the building is not so eas-ily identifiable. Users also reported liking user-centric instructions as they are simple and con-cise, such as “Turn left”. Some users reported theywould like to know how far away they are fromtheir destination. A few users also commentedthat the instructions could be repetitive along longroutes.
Users reported the system used landmarks that
92
were not visible, whether because they were toofar away or they were hidden by another building.There was no difference in the number of usersreporting this for each system. This suggests thelandmark-selection heuristic will require furtheradjustments, e.g adjusting the weights or limitingthe search area. Users that were familiar with thelocation reported that although some of the land-marks presented were not visible, they were stillhelpful as the users knew where these landmarkswere and could make their way to them. Theuse of landmarks that are not necessarily visiblebut are known to the instruction follower is com-mon amongst human direction givers, using theselandmarks as a starting point for further directions(Golledge, 1999). Again, these findings suggestthe usefulness of a user modelling approach tolandmark selection.
5 Conclusions and Future Work
This paper presented a task-driven evaluation ofcontext-adaptive navigation instructions based onWizard-of-Oz data. We found that a heuristic-based system, which uses landmarks and user-centric instructions dependent on estimated visi-bility, outperforms two corpus-based systems interms of naturalness and task completion, how-ever, these results were not significant. In futurework, we hope to recruit more subjects in orderto show statistical significance of this trend. Ourresults also show that there are significant famil-iarity effects based on prior user knowledge. Thissuggests a user modelling approach will be usefulwhen it comes generating navigation instructions,e.g. following previous work on user modellingfor NLG in interactive systems (Janarthanam andLemon, 2014; Dethlefs et al., 2014). Finally, wehope to repeat this experiment under real-worldconditions, rather than in a virtual setup in order toeliminate artefacts, such as the influence of tech-nical problems.
Acknowledgements
This research received funding from the EPSRCGUI project - “Generation for Uncertain Infor-mation” (EP/L026775/1) and EPSRC DILiGENt- “Domain-Independent Language Generation”(EP/M005429/1).We would like to thank Oliver Lemon for his help-ful comments.
ReferencesDonna Byron, Alexander Koller, Jon Oberlander, Laura
Stoia, and Kristina Striegnitz. 2007. Generating In-structions in Virtual Environments ( GIVE ): A Chal-lenge and an Evaluation Testbed for NLG. In Work-shop on Shared Tasks and Comparative Evaluationin Natural Language Generation.
Edgar Chan, Oliver Baumann, Mark a Bellgrove, andJason B Mattingley. 2012. From objects to land-marks: the function of visual location information inspatial navigation. Frontiers in psychology, 3:304,January.
Nina Dethlefs and Heriberto Cuayahuitl. 2011.Combining hierarchical reinforcement learning andbayesian networks for natural language generationin situated dialogue. In Proceedings of the 13th Eu-ropean Workshop on Natural Language Generation(ENLG).
Nina Dethlefs, Heriberto Cuayahuitl, Helen Hastie,Verena Rieser, and Oliver Lemon. 2014. Cluster-based prediction of user ratings for stylistic surfacerealisation. In Proceedings of the 14th Conferenceof the European Chapter of the Association for Com-putational Linguistics, pages 702–711. Associationfor Computational Linguistics.
Markus Drager and Alexander Koller. 2012. Genera-tion of landmark-based navigation instructions fromopen-source data. In Proceedings of the ThirteenthConference of the European Chapter of the ACL(EACL), Avignon.
Birgit Elias and Claus Brenner. 2004. Automatic Gen-eration and Application of Landmarks in NavigationData Sets. Developments in Spatial Data Handling,pages 469–480.
Dimitra Gkatzia, Verena Rieser, Phil Bartie, andWilliam Mackaness. 2015. From the virtual tothe real world: Referring to objects in spatial real-world images. In Conference on Empirical Methodsin Natural Language Processing (EMNLP), Lisbon.Forthcoming.
Reginald G Golledge. 1999. Wayfinding behavior:cognitive mapping and other spatial processes, vol-ume 41.
Jana Gotze and Johan Boye. 2013. Deriving SalienceModels from Human Route Directions. In Proceed-ings of the IWCS 2013 Workshop on ComputationalModels of Spatial Language Interpretation and Gen-eration (CoSLI-3), pages 7–12, Potsdam, Germany.Association for Computational Linguistics.
Stefan Hansen, Kai-florian Richter, and AlexanderKlippel. 2006. Landmarks in OpenLS - A DataStructure for Cognitive Ergonomic Route Direc-tions. In GIScience, pages 128–144. Springer-Verlag, Berlin Heidelberg.
93

Srinivasan Janarthanam and Oliver Lemon. 2014.Adaptive Generation in Dialogue Systems UsingDynamic User Modeling. Computational Linguis-tics, 40(4):883–920.
Srinivasan Janarthanam, Oliver Lemon, and XingkunLiu. 2012. A web-based evaluation framework forspatial instruction-giving systems. In 50th AnnualMeeting of the Association for Computational Lin-guistics (ACL).
Alexandra Millonig and Katja Schechtner. 2007.Developing Landmark-Based Pedestrian-NavigationSystems. IEEE Transactions on Intelligent Trans-portation Systems, 8(1):43–49, March.
Verena Rieser and Amanda Cercas Curry. 2014. To-wards Generating Route Instructions Uncer Uncer-tainty: A Corpus Study. In SemDial’14, Edinburgh.
94

Proceedings of the 15th European Workshop on Natural Language Generation (ENLG), pages 95–99,Brighton, September 2015. c©2015 Association for Computational Linguistics
Summarising Unreliable Data
Stephanie Inglis
Department of Computing Science
University of Aberdeen
Abstract
Unreliable data is present in datasets, and
is either ignored, acknowledged ad hoc, or
undetected. This paper discusses data quality issues with a potential framework
in mind to deal with them. Such a frame-
work should be applied within data-to-text systems at the generation of text rather
than being an afterthought. This paper
also shows ways to express uncertainty
through language and World Health Or-ganisation (WHO) corpus studies, and an
experiment which analyses how subjects
approached summarising data with data quality issues. This work is still ongoing.
1 Introduction
Databases are used in multiple fields for various
purposes. While gathering and using this data, is-sues arise regarding the quality of the data. These
problems take multiple forms, and identifying
them within a dataset can sometimes prove chal-lenging or impossible (Daniel et al. 2008). Once
identified, action needs to be taken. In a large da-
tabase, amending all problem entries could be a
costly task prone to human error, potentially cre-ating more issues. Alternatively, it may not be
possible to resolve the error. Either way, the user
of the data must be informed of these errors if they are to use this data accurately.
Currently when companies use data to generate
text, data quality issues are resolved ad hoc rather
than during the generation phase. Instead, a framework should be created to deal with these is-
sues at the point of generation, rather than amend-
ing the document if required. First, we cover a discussion of related work fol-
lowed by a corpus study of Ebola and Global
Road Traffic reports provided by the WHO. An experiment is used to investigate further in Sec-
tion 4. Finally we outline future steps.
2 Related Work
2.1 Data Quality
The quality of data impacts the amount of confi-
dence we can have in our conclusions. By being aware of the issues within the data, we can begin
to attempt resolution.
Daniel et al. (2008) discusses a system which aggregates reports in an attempt to improve the
quality of reports hampered by poor quality data
(see Figure 1). The data is acquired after summer
from various sources such as hospitals, laborato-ries and emergency rooms. These reports are for
the Italian Department of Health to predict the
number drugs required over a winter period to treat flu, to prepare for outbreaks or to negotiate
prices with manufacturers. Incorrect conclusions
could result in overspending and the health de-
partment losing money, or not having enough drugs readily available for those who require
them. The key problems are categorised as com-
pleteness, consistency and confidence issues. These are some issues likely to be missed by data
cleaning tools.
Completeness covers missing data, which in-cludes empty cells as well as entirely lost entries.
This system ignores rows with the diagnosis field
missing as these could result in false drug quantity
estimations. Consistency covers data that is not classified
together but has the same meaning. The example
entries in the paper show “influenza” and “flu” to be different diagnoses however they should be
represented as the same. This can also occur
through human error by mistypes which will also create a new, unwanted diagnosis e.g. “flu” being
mistyped as “flyu”. The precision of the diagnosis
may result in additional entries such as including
the type of flu of a patient. When ordering “influ-enza” drugs, underestimation may occur as “flu”,
“flyu” and “flu type A” may not be included in the
count. Thirdly, confidence shows how accurate data
is. Rows may be fraudulent or erroneous leading
to more incorrect estimations. Misinterpretations
95

of variable meanings also present issues. The example shown in the paper is “cost” of the drug
differing for the same diagnosis. This could be
interpreted by some as with tax added, while oth-ers omitted it.
While this is more of a consistency issue, its in-
terpretation impacts the confidence of the data. A
proposed solution is to replace an ambiguous var-iable with a more general variable, such as adjust-
ing cost to become maximum cost.
2.2 Vague Language
Another aspect to investigate is the language used when conveying unreliable data, such as nu-
merical data. When the author is writing a report
and is unsure of the data, language becomes vague
to allow for uncertainty. The reader will see these words and intuitively know that the author is not
certain about their conclusion.
Van Deemter (2010) claims something to be vague if “it allows borderline cases”, and subse-
quently defined categories of vague language.
Adjectives themselves are vague as they allow borderline. Vague quantifiers such as “many”,
“most” or “few also allow borderline cases. For
lack of specificity, the term is not vague by defi-
nition but a concrete value is not provided, such as “more than 5”. Comparatives use degrees of
adjectives such as “30 is greater than 28”. Finally,
hedges express uncertainties by using words such as “appears”, “suggests” or “may”. This allows
the author to make statements without committing
to them as fact such as “numbers appear to be in-
creasing”. This work looks at vagueness in the context of
data quality issues as described above. For exam-
ple, different vague language is used for missing data and inconsistent data.
2.3 Real World Applications
The use of vague language in low data quality
situations is present in industry applications. BT-Nurse is one application, generating hand-
overs for nurses caring for pre-term neonates and
1 World Health Organisation, Situation reports with
epidemiological data: archive,
sick babies (Hunter et al, 2012). The handover is generated at the end of a shift so the next nurse on
the ward knows the babies current conditions.
High data quality is important as the health of the babies depend on it. An example of incomplete
data is when a baby is intubated, but an accurate
time is not recorded. To try to correct this, the
ventilator mode data is checked. When an estima-tion is present in the text, phrases such as “around
19:45” and “by about 06:15” were used.
Sripada et al. (2014) discuss a system able to generate 50,000 high quality weather reports in
less than two minutes. This system is used by the
Met Office to generate reports for public use. As
these are predictions, the further away the fore-cast, the greater the uncertainty in the data. There-
fore the reports on day 3 have different language
compared to those reports on day 1. The paper shows this on practise where on day 3 the word
“expected” is included, whereas this would be
omitted if the forecast was for day 1. The use of vague language helps to convey this uncertainty.
3 WHO Ebola Reports
Information can be communicated through vari-ous mediums, ranging from visual graphs to sen-
tences. The WHO1 has followed the Ebola virus
disease outbreak and provided detailed weekly re-ports and frequent updates on the situation. The
reports used span from 29th August 2014 to 4th
February 2015, containing 24 main weekly re-
ports and 12 additional update reports. These re-ports contain a variety of tables, maps, graphs and
sentences describing the number of suspected,
probable and confirmed cases and deaths that have occurred in various countries as a result of
the outbreak. The focus was primarily on the
three most affected countries – Guinea, Liberia
and Sierra Leone. An attempt was made to use the figures given in the tables to replicate sentences
using the SimpleNLG (Gatt and Reiter, 2009) li-
brary. While doing so, the issues mentioned in section 2.1 arose.
http://www.who.int/csr/disease/ebola/situation-re-
ports/archive/en/ . Last accessed 23rd June 2015.
ID Diagnosis Hospital Province … Problem Action
1 Flu San Raffaele Milano … Refers to same therapy Treat similarly
2 Influenza Santa Clara Trento …
3 Flyu San Raffaele Milano … Mistyped Interpret as “Flu”
Figure 1 – Examples of poor data quality and the action taken to deal with it.
96

Country Case definition
Cases Deaths
Liberia Confirmed 950 *
Probable 1923 *
Suspected 1376 *
All 4249 2458
“Data acquisition continues to be a challenge in Libe-ria. Evidence obtained from responders and labora-tory staff in the country suggests that the situation in Liberia is getting worse”
Figure 2- A data and textual example taken from the Situa-tion Report on the 15th October 2014. This shows an in-stance of missing data in deaths reported in Liberia.
3.1 Data Quality
Incompleteness was largely evident in Libe-
ria’s data (see Figure 2). No data was given from report 4 to 20, covering almost 2 months.
Throughout these reports, phrases such as “data
acquisition continues to be a challenge” in report
14 can be found to describe Liberia’s situation. Eventually, the data reached a quality so low that
the same report quotes “problems with data gath-
ering make it hard to draw any firm conclusions from recent data” whereas previously, WHO had
at least speculated on trends in the data.
Inconsistencies exist between the numbers in
the table and the text. Numbers were not men-tioned explicitly in the text until around report 20.
However, some vague statements appeared be-
forehand, such as “with over 200 new cases re-ported” on the 18th September. When numerical
data was mentioned, it almost exclusively referred
to the confirmed deaths. Data on Guinea was mostly inconsistent, with only 5 of the 26 reports
being consistent between the tabular data and the
textual data. One explanation is that reports were
updated after publishing when late lab results were produced, but only for one layout.
Finally, there is evidence of lack of confidence.
Data is incorrect in some situations, such as when the number of deaths exceeded the number of
cases. This can be seen in report 12 on the 8th Oc-
tober, occurring in both Liberia and Sierra Leone. Identifying data that is inaccurate will lower the
confidence.
2 World Health Organisation. (2009). Global status re-
port on road safety 2009. Available:
http://www.who.int/violence_injury_preven-
tion/road_safety_status/2009/en/. Last accessed 23rd
June 2015.
3.2 Vague Language
The reports on Ebola have numerous examples
of vague language being used.
Phrases such as “this is a genuine decline”, “there may not yet be full agreement”, and “based
on the best information available” appeared fre-
quently. The adjectives “genuine”, “full” and “best” allow borderline cases, and so are vague.
Therefore the phrases themselves are vague, and
suggest this is more an opinion of the writer rather than fact. Vague quantifiers such as “many of the
suspected cases”, “there appears to be some evi-
dence”, and “very few confirmed cases were re-
ported” also appeared often. Lack of specificity is rare but it does exist, for example “countries re-
port that more than 80%”. The main comparative
phrase in these reports is “it is too soon to say”. Finally, examples of hedges include phrases that
include the words “appears”, “suggests” or
“may”. These words are used in the majority of the reports such as “appears to have stabilised”,
“which suggests that many of the suspected
cases”, and “which may lead to a revision of the
numbers of cases and deaths”. Vague language was strongly used to describe
the data in the Ebola reports. To investigate this
further, an experiment was done using data from a different report, described in the next section.
4 Pilot Study
4.1 Set Up
To investigate human language in describing
unreliable data, subjects were asked to summarise
tables of data (see Figure 3). The experiment makes use of the Global Road Traffic reports for
20092 and 20133 provided by the WHO. A new
domain was selected to observe differences be-
tween this corpus and the Ebola corpus, though none are identified yet (see Future Work).
Subjects were asked to assume the role of a
news reporter on Twitter and report information to followers. Due to Twitter constraints, subjects
were restricted to only 140 characters per country.
This forced subjects to be concise and to prioritise the information given to them.
For 6 of the 183 possible countries, the number
of deaths reported by the police, the number of es-
timated deaths, and a 95% confidence interval
3 World Health Organisation. (2013). Global status re-
port on road safety 2013. Available:
http://www.who.int/violence_injury_preven-
tion/road_safety_status/2013/en/. Last accessed 4th
June 2015.
97
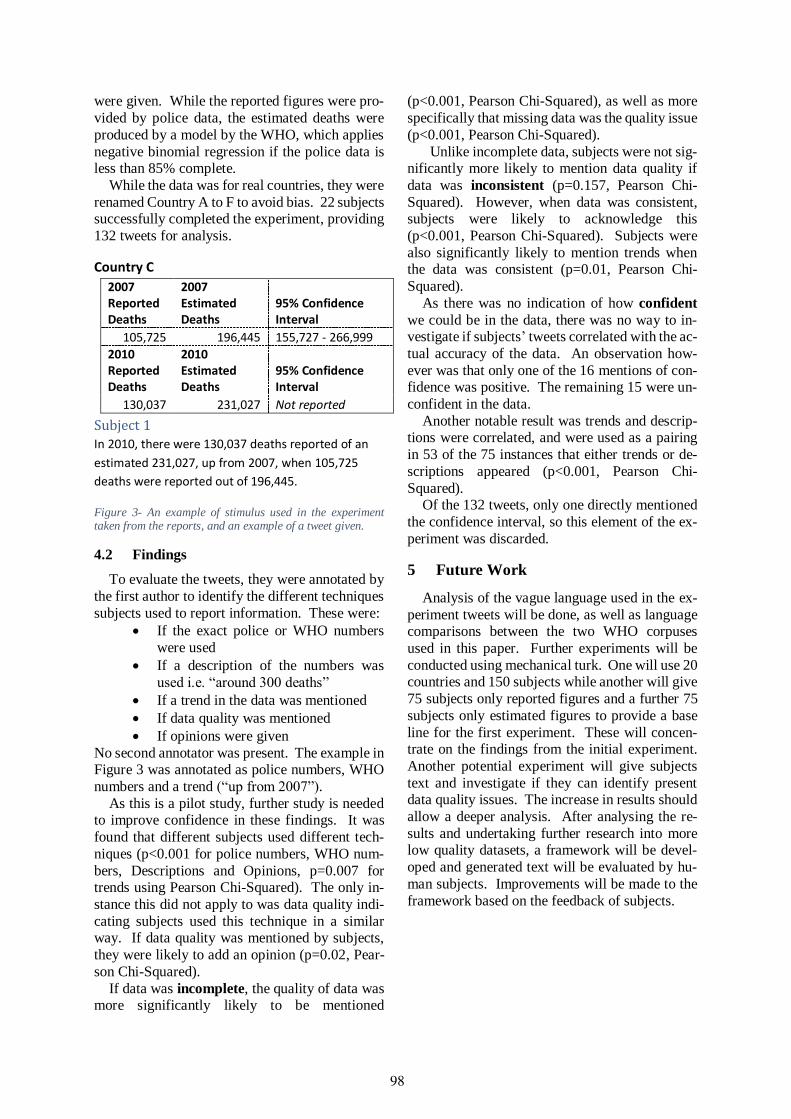
were given. While the reported figures were pro-
vided by police data, the estimated deaths were
produced by a model by the WHO, which applies
negative binomial regression if the police data is less than 85% complete.
While the data was for real countries, they were
renamed Country A to F to avoid bias. 22 subjects successfully completed the experiment, providing
132 tweets for analysis.
Country C
Subject 1 In 2010, there were 130,037 deaths reported of an
estimated 231,027, up from 2007, when 105,725
deaths were reported out of 196,445.
Figure 3- An example of stimulus used in the experiment taken from the reports, and an example of a tweet given.
4.2 Findings
To evaluate the tweets, they were annotated by
the first author to identify the different techniques
subjects used to report information. These were:
If the exact police or WHO numbers
were used
If a description of the numbers was
used i.e. “around 300 deaths”
If a trend in the data was mentioned
If data quality was mentioned
If opinions were given
No second annotator was present. The example in Figure 3 was annotated as police numbers, WHO
numbers and a trend (“up from 2007”).
As this is a pilot study, further study is needed to improve confidence in these findings. It was
found that different subjects used different tech-
niques (p<0.001 for police numbers, WHO num-
bers, Descriptions and Opinions, p=0.007 for trends using Pearson Chi-Squared). The only in-
stance this did not apply to was data quality indi-
cating subjects used this technique in a similar way. If data quality was mentioned by subjects,
they were likely to add an opinion (p=0.02, Pear-
son Chi-Squared).
If data was incomplete, the quality of data was more significantly likely to be mentioned
(p<0.001, Pearson Chi-Squared), as well as more
specifically that missing data was the quality issue
(p<0.001, Pearson Chi-Squared).
Unlike incomplete data, subjects were not sig-nificantly more likely to mention data quality if
data was inconsistent (p=0.157, Pearson Chi-
Squared). However, when data was consistent, subjects were likely to acknowledge this
(p<0.001, Pearson Chi-Squared). Subjects were
also significantly likely to mention trends when the data was consistent (p=0.01, Pearson Chi-
Squared).
As there was no indication of how confident
we could be in the data, there was no way to in-vestigate if subjects’ tweets correlated with the ac-
tual accuracy of the data. An observation how-
ever was that only one of the 16 mentions of con-fidence was positive. The remaining 15 were un-
confident in the data.
Another notable result was trends and descrip-tions were correlated, and were used as a pairing
in 53 of the 75 instances that either trends or de-
scriptions appeared (p<0.001, Pearson Chi-
Squared). Of the 132 tweets, only one directly mentioned
the confidence interval, so this element of the ex-
periment was discarded.
5 Future Work
Analysis of the vague language used in the ex-
periment tweets will be done, as well as language comparisons between the two WHO corpuses
used in this paper. Further experiments will be
conducted using mechanical turk. One will use 20 countries and 150 subjects while another will give
75 subjects only reported figures and a further 75
subjects only estimated figures to provide a base
line for the first experiment. These will concen-trate on the findings from the initial experiment.
Another potential experiment will give subjects
text and investigate if they can identify present data quality issues. The increase in results should
allow a deeper analysis. After analysing the re-
sults and undertaking further research into more low quality datasets, a framework will be devel-
oped and generated text will be evaluated by hu-
man subjects. Improvements will be made to the
framework based on the feedback of subjects.
2007 Reported Deaths
2007 Estimated Deaths
95% Confidence Interval
105,725 196,445 155,727 - 266,999
2010 Reported Deaths
2010 Estimated Deaths
95% Confidence Interval
130,037 231,027 Not reported
98

References
Daniel, F., Casati, F., Palpanas, T., Chayka, O. and
Cappiello, C. (2008). Enabling Better Decisions
Through Quality-Aware Reports In Business Intel-
ligence Applications.
Gatt, A. and Reiter, E. (2009). SimpleNLG: A realisa-tion engine for practical applications. Proceedings
of ENLG-2009
Hunter, J., Freer, Y., Gatt, A., Reiter, E., Sripada, S.
and Sykes, C. (2012). Automatic generation of nat-
ural language nursing shift summaries in neonatal
intensive care: BT-Nurse. Artificial Intelligence in
Medicine, 56(3), pp.157–172.
Sripada, S.G., Burnett, N., Turner, R., Mastin, J., and
Evans, D. (2014). A Case Study: NLG meeting
Weather Industry Demand for Quality and Quantity
of Textual Weather Forecasts. INLG 2014.p1-5.
Van Deemter, K. (2010), Not Exactly: In Praise of Vagueness, Oxford University Press, Oxford, GBR.
99

Proceedings of the 15th European Workshop on Natural Language Generation (ENLG), pages 100–104,Brighton, September 2015. c©2015 Association for Computational Linguistics
Generating Descriptions of Spatial Relationsbetween Objects in Images
Adrian MuscatCommunications & Computer Engineering
University of MaltaMsida MSD 2080, Malta
Anja BelzComputing, Engineering & Maths
University of BrightonLewes Road, Brighton BN2 4GJ, [email protected]
Abstract
We investigate the task of predictingprepositions that can be used to describethe spatial relationships between pairs ofobjects depicted in images. We explorethe extent to which such spatial preposi-tions can be predicted from (a) languageinformation, (b) visual information, and(c) combinations of the two. In this paperwe describe the dataset of object pairs andprepositions we have created, and reportfirst results for predicting prepositions forobject pairs, using a Naive Bayes frame-work. The features we use include objectclass labels and geometrical features com-puted from object bounding boxes. Weevaluate the results in terms of accuracyagainst human-selected prepositions.
1 Introduction
The task we investigate is predicting the preposi-tions that can be used to describe the spatial rela-tionships between pairs of objects in images. Thisis not the same as inferring the actual 3-D real-world spatial relationships between objects, buthas some similarities with that task. This is animportant subtask in automatic image description(which is important not just for assistive technol-ogy, but also for applications such as text-basedquerying of image databases), but it is rarely ad-dressed as a subtask in its own right. If an im-age description method produces spatial preposi-tions it tends to be as a side-effect of the over-all method (Mitchell et al., 2012; Kulkarni et al.,2013), or else relationships are not between ob-jects, but e.g. between objects and the ‘scene’(Yang et al., 2011). An example of prepositionselection as a separate sub-task is Elliott & Keller(2013) where the mapping is hard-wired manually.
Our main data source is a corpus of images (Ev-eringham et al., 2010) in which objects have been
annotated with rectangular bounding boxes andobject class labels. For a subset of 1,000 of theimages we also have five human-created descrip-tions of the whole image (Rashtchian et al., 2010).
We collected additional annotations for the im-ages (Section 2.3) which list, for each object pair,a set of prepositions that have been selected by hu-man annotators as correctly describing the spatialrelationship between the given object pair.
The aim is to create models for the mappingfrom image, bounding boxes and labels to spatialprepositions as indicated in Figure 1. In this weuse a range of features to represent object pairs,computed from image, bounding boxes and labels.We investigate the predictive power of differenttypes of features within a Naive Bayes framework(Section 3), and report first results in terms of twomeasures of accuracy (Section 4).
2 Data
2.1 VOC’08The PASCAL VOC 2008 Shared Task Competi-tion (VOC’08) data consists of 8,776 images and20,739 objects in 20 object classes (Everingham etal., 2010). In each image, every object belongingto one of the 20 VOC’08 object classes is anno-tated with its object class label and a bounding box(among other annotations):
1. class: one of: aeroplane, bird, bicycle, boat,bottle, bus, car, cat, chair, cow, dining table,dog, horse, motorbike, person, potted plant,sheep, sofa, train, tv/monitor.
2. bounding box: an axis-aligned bounding boxsurrounding the extent of the object visible inthe image.
2.2 VOC’08 1KUsing Mechanical Turk, Rashtchian et al. (2010)collected five descriptions each for 1,000 VOC’08images selected randomly but ensuring there were
100

beside(person(Obj1), person(Obj2));−→ beside(person(Obj2), dog(Obj3));
in front of(dog(Obj3), person(Obj1))
Figure 1: Image from PASCAL VOC 2008 with annotations, and prepositions representing spatial rela-tionships (objects numbered in descending order of size of area of bounding box).
50 images in each of the 20 VOC’08 objectclasses. Turkers had to have high hit rates andpass a language competence test before creatingdescriptions, leading to relatively high quality.
We obtained a set of candidate prepositionsfrom the VOC’08 1K dataset as follows. Weparsed the 5,000 descriptions with the StanfordParser version 3.5.21 with the PCFG model, ex-tracted the nmod:prep prepositional modifier rela-tions, and manually removed the non-spatial ones.This gave us the following set of 38 prepositions:
V = { about, above, across, against,along, alongside, around, at, atop, be-hind, below, beneath, beside, beyond,by, close to, far from, in, in front of,inside, inside of, near, next to, on,on top of, opposite, outside, outside of,over, past, through, toward, towards,under, underneath, up, upon, within }
2.3 Human-Selected Spatial PrepositionsWe are in the process of extending the VOC’08 an-notations with human-selected spatial prepositionsassociated with pairs of objects in images. So farwe have collected spatial prepositions for objectpairs in images that have exactly two objects an-notated (1,020). Annotators were presented withimages from the dataset where in each image pre-sentation the two objects, Obj1 and Obj2, wereshown with their bounding boxes and labels. Ifthere was more than one object of the same class,then the labels were shown with subscript indices(where objects are numbered in order of decreas-ing size of area of bounding box).
Next to the image was shown the template sen-tence “The Obj1 is the Obj2”, and the list ofpossible prepositions extracted from VOC 1K (see
1http://nlp.stanford.edu/software/lex-parser.shtml
preceding section). The option ‘NONE’ was alsoavailable in case none of the prepositions was suit-able (participants were discouraged from using it).
Each template sentence was presented twice,with the objects once in each order, “The Obj1 is
the Obj2” and “The Obj2 is the Obj1”.2 Par-ticipants were asked to select all correct preposi-tions for each pair.
The following table shows occurrence countsfor the 10 most frequent object labels:
pers
on
dog
car
chai
r
hors
e
cat
bird
bicy
cle
mot
orbi
ke
tv/m
onito
r
783 123 112 92 92 88 86 79 77 63
Some prepositions were selected far more fre-quently than others; the top nine are:
next
to
besi
de
near
clos
eto
infr
ont
of
behi
nd
on onto
pof
unde
rnea
th304 211 156 149 141 129 115 103 90
3 Predicting Prepositions
When looking at a 2-D image, people infer allkinds of information not present in the pixel gridon the basis of their practice mapping 2-D infor-mation to 3-D spaces, and their real-world knowl-edge about the properties of different types of ob-jects. In our research we are interested in the ex-tent to which prepositions can be predicted with-out any real-world knowledge, using just featuresthat can be computed from the objects’ boundingboxes and labels. In this section we explore thepredictive power of language and visual featureswithin a Naive Bayes framework:
2Showing objects in both orders is necessary to capturenon-reflexive prepositions such as under, in, on etc.
101
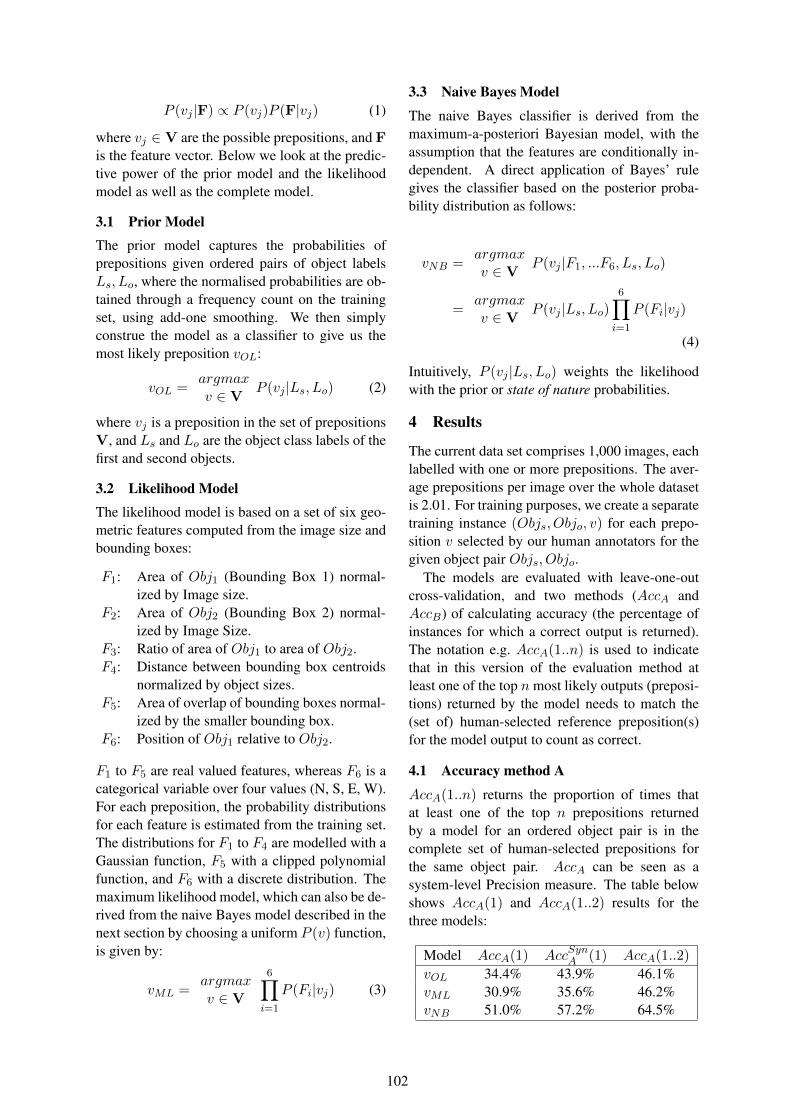
P (vj |F) ∝ P (vj)P (F|vj) (1)
where vj ∈ V are the possible prepositions, and Fis the feature vector. Below we look at the predic-tive power of the prior model and the likelihoodmodel as well as the complete model.
3.1 Prior ModelThe prior model captures the probabilities ofprepositions given ordered pairs of object labelsLs, Lo, where the normalised probabilities are ob-tained through a frequency count on the trainingset, using add-one smoothing. We then simplyconstrue the model as a classifier to give us themost likely preposition vOL:
vOL =argmaxv ∈ V
P (vj |Ls, Lo) (2)
where vj is a preposition in the set of prepositionsV, and Ls and Lo are the object class labels of thefirst and second objects.
3.2 Likelihood ModelThe likelihood model is based on a set of six geo-metric features computed from the image size andbounding boxes:
F1: Area of Obj1 (Bounding Box 1) normal-ized by Image size.
F2: Area of Obj2 (Bounding Box 2) normal-ized by Image Size.
F3: Ratio of area of Obj1 to area of Obj2.F4: Distance between bounding box centroids
normalized by object sizes.F5: Area of overlap of bounding boxes normal-
ized by the smaller bounding box.F6: Position of Obj1 relative to Obj2.
F1 to F5 are real valued features, whereas F6 is acategorical variable over four values (N, S, E, W).For each preposition, the probability distributionsfor each feature is estimated from the training set.The distributions for F1 to F4 are modelled with aGaussian function, F5 with a clipped polynomialfunction, and F6 with a discrete distribution. Themaximum likelihood model, which can also be de-rived from the naive Bayes model described in thenext section by choosing a uniform P (v) function,is given by:
vML =argmaxv ∈ V
6∏
i=1
P (Fi|vj) (3)
3.3 Naive Bayes Model
The naive Bayes classifier is derived from themaximum-a-posteriori Bayesian model, with theassumption that the features are conditionally in-dependent. A direct application of Bayes’ rulegives the classifier based on the posterior proba-bility distribution as follows:
vNB =argmaxv ∈ V
P (vj |F1, ...F6, Ls, Lo)
=argmaxv ∈ V
P (vj |Ls, Lo)6∏
i=1
P (Fi|vj)
(4)
Intuitively, P (vj |Ls, Lo) weights the likelihoodwith the prior or state of nature probabilities.
4 Results
The current data set comprises 1,000 images, eachlabelled with one or more prepositions. The aver-age prepositions per image over the whole datasetis 2.01. For training purposes, we create a separatetraining instance (Objs, Objo, v) for each prepo-sition v selected by our human annotators for thegiven object pair Objs, Objo.
The models are evaluated with leave-one-outcross-validation, and two methods (AccA andAccB) of calculating accuracy (the percentage ofinstances for which a correct output is returned).The notation e.g. AccA(1..n) is used to indicatethat in this version of the evaluation method atleast one of the top n most likely outputs (preposi-tions) returned by the model needs to match the(set of) human-selected reference preposition(s)for the model output to count as correct.
4.1 Accuracy method A
AccA(1..n) returns the proportion of times thatat least one of the top n prepositions returnedby a model for an ordered object pair is in thecomplete set of human-selected prepositions forthe same object pair. AccA can be seen as asystem-level Precision measure. The table belowshows AccA(1) and AccA(1..2) results for thethree models:
Model AccA(1) AccSynA (1) AccA(1..2)
vOL 34.4% 43.9% 46.1%vML 30.9% 35.6% 46.2%vNB 51.0% 57.2% 64.5%
102

Table 1: AccB(1..n) for vNB model and n ≤ 4.
Preposition n = 1 n = 2 n = 3 n = 4next to 23.0% 77.0% 89.8% 93.1%beside 58.3% 81.5% 85.8% 91.9%near 43.6% 55.1% 74.4% 82.7%close to 4.7% 14.8% 51.7% 87.9%in front of 29.1% 39.7% 48.2% 52.5%behind 31.0% 38.0% 50.4% 73.6%on 72.2% 83.5% 85.2% 86.1%on top of 10.7% 76.7% 81.6% 82.5%underneath 53.3% 68.9% 84.4% 86.7%beneath 15.5% 73.8% 79.8% 85.7%far from 44.6% 62.2% 66.2% 68.9%under 22.1% 27.9% 82.4% 83.8%NONE 34.4% 53.1% 67.2% 73.4%Mean 34.0% 57.9% 72.8% 80.7%Mean AccSyn
B 50.9% 66.4% 77.9% 83.1%
In addition, the middle column above showsAccA(1) results when sets of synonymous prepo-sitions are considered identical. The synonym setswe chose for this purpose are: {above, over},{along, alongside}, {atop, upon, on, on top of},{below, beneath}, {beside, by, next to}, {beyond,past}, {close to, near}, {in, inside, inside of,within} {outside, outside of}, {toward, towards},{under, underneath}.
4.2 Accuracy method B
AccB(1..n) computes the mean of preposition-level accuracies. Accuracy for each preposition vis the proportion of times that v is returned as oneof the top n prepositions out of those cases whenv is in the human-selected set of reference prepo-sitions. AccB can be seen as a preposition-levelRecall measure.
Table 1 lists the AccB(1..n) values for the vNB
model for each n up to 4; values are shown forthe 13 most frequent prepositions (in order of fre-quency) and for the mean of all preposition-levelaccuracies. The last row shows the means for aversion of AccB that takes synonyms into accountas described in the last section.
5 Discussion
Looking at the naive Bayes results in Table 1, ac-curacy for some prepositions (e.g. close to) im-proves dramatically from AccB(1) to AccB(1..4).This implies that where the target preposition isnot ranked first, it is often ranked second, thirdor fourth. There are synonym effects at work as
shown by the AccSyn results; but there also iscompetition between prepositions that are not nearsynonyms, as shown by the fact that AccA(1..2)results are better than AccSynA (1) results.
For some prepositions, accuracy remains loweven at n=4. This may reflect the general issuethat human annotators use two different perspec-tives in selecting prepositions: (i) that of a viewerlooking at the image, and (ii) that of one or bothof the objects involved in the spatial relationshipbeing described. Regarding (i), e.g. in the imagein Figure 1, the dog is ‘in front of’ the person be-cause it is between the viewer and the person. Re-garding (ii), in other examples, a person can be‘in front of’ a monitor, or one chair ‘opposite’ an-other, even when the viewer sees them both fromthe side.
The naive Bayes framework we have investi-gated here is a simple approach which is likelyto be outperformed by more sophisticated MLmethods. E.g. in calculating the likelihood termP (F |v), our approach assumes the features tobe independent; feature weighting per prepositionwas not carried out; and the data set is small rela-tive to what we are using it for.
6 Conclusion
We have described (i) a dataset we are devel-oping in which object pairs are annotated withprepositions that describe their spatial relation-ship, and (ii) methods for automatically predict-ing such prepositions on the basis of features com-puted from image and object geometry and ob-ject class labels. We have found that on the ba-sis of language information (object class labels)alone we can predict prepositions with 34.4% ac-curacy, rising to 43.9% if we count near synonymsas correct. Using both language and visual infor-mation we can predict prepositions with 51% ac-curacy, rising to 57.2% with near synonyms. Wehave also found that where the target prepositionis not ranked top, it is often ranked very near thetop, as can be seen from the AccB results.
The next step in this research will be to increaseour dataset and to apply machine learning meth-ods such as support vector machines and neuralnetworks to our learning task.
ReferencesDesmond Elliott and Frank Keller. 2013. Image de-
scription using visual dependency representations.In EMNLP’13, pages 1292–1302.
103

Mark Everingham, Luc Van Gool, Christopher KIWilliams, John Winn, and Andrew Zisserman.2010. The pascal visual object classes (voc) chal-lenge. International journal of computer vision,88(2):303–338.
Gaurav Kulkarni, Visruth Premraj, Vicente Ordonez,Sudipta Dhar, Siming Li, Yejin Choi, Alexander CBerg, and Tamara Berg. 2013. Babytalk: Under-standing and generating simple image descriptions.Pattern Analysis and Machine Intelligence, IEEETransactions on, 35(12):2891–2903.
Margaret Mitchell, Xufeng Han, Jesse Dodge, AlyssaMensch, Amit Goyal, Alex Berg, Kota Yamaguchi,Tamara Berg, Karl Stratos, and Hal Daum Iii. 2012.Midge: Generating image descriptions from com-puter vision detections. In Proceedings of EACL’12.
Cyrus Rashtchian, Peter Young, Micah Hodosh, andJulia Hockenmaier. 2010. Collecting image annota-tions using amazon’s mechanical turk. In Proceed-ings of the NAACL HLT 2010 Workshop on CreatingSpeech and Language Data with Amazon’s Mechan-ical Turk, pages 139–147. Association for Computa-tional Linguistics.
Yezhou Yang, Ching Lik Teo, Hal Daume III, and Yian-nis Aloimonos. 2011. Corpus-guided sentence gen-eration of natural images. In Proceedings of theConference on Empirical Methods in Natural Lan-guage Processing, pages 444–454. Association forComputational Linguistics.
104

Proceedings of the 15th European Workshop on Natural Language Generation (ENLG), pages 105–108,Brighton, September 2015. c©2015 Association for Computational Linguistics
Towards Flexible, Small-Domain Surface Generation: CombiningData-Driven and Grammatical Approaches
Andrea Fischer, †Vera Demberg, and Dietrich KlakowSpoken Language Systems / †MMCI Cluster of Excellence
Saarland UniversitySaarbrucken, Germany
[email protected] / [email protected]@lsv.uni-saarland.de
Abstract
As dialog systems are getting more and moreubiquitous, there is an increasing number ofapplication domains for natural language gen-eration, and generation objectives are gettingmore diverse (e.g., generating information-ally dense vs. less complex utterances, as afunction of target user and usage situation).Flexible generation is difficult and labour-intensive with traditional template-based gen-eration systems, while fully data-driven ap-proaches may lead to less grammatical output,particularly if the measures used for genera-tion objectives are correlated with measures ofgrammaticality. We here explore the combina-tion of a data-driven approach with two verysimple automatic grammar induction methods,basing its implementation on OpenCCG.
1 Introduction & Related Work
As language-operated interactive devices become in-creasingly ubiquitous, there is an increasing need fornot only generating utterances that are comprehensibleand convey the intended meaning, but language that isadaptive to different users as well as situations (see also(Dethlefs, 2014) for an overview). Adaptation can hap-pen at different levels, concerning content as well asthe formulation of generated sentences. We here focusonly on sentence formulation with the goal of beingable to automatically generate a large variety of dif-ferent realisations of a given semantic representation.Our study explores the combination of a data-drivenapproach (Mairesse et al., 2010) with a grammar-basedapproach using OpenCCG (White et al., 2007).The use of templates is a common and well-performingapproach to natural language generation. Usually, ei-ther the generation process consists of selecting ap-propriate fillers for manually-built patterns, or the se-mantic specification constrains the allowable surfaceconstructions so strongly that it effectively constitutesa form of template as well. While such approachesdo guarantee grammaticality when templates (or gram-mars, respectively) are well-designed, the amount offormulation variation that can be generated based ontemplates is either very low, or requires a huge manual
effort in template creation.One relevant objective in adapting to a user and a sit-uation is utterance complexity. (Demberg et al., 2011)show that a dialog system that generates more concise(but also more complex) utterances is preferred in a set-ting where the user can fully concentrate on the inter-action, while a system that generates less complex ut-terances is preferred in a dual tasking setting while theuser has to steer a car (in a simulator) at the same time.But how do we know which utterance is a “complex”one? We can draw on psycholinguistic models of hu-man sentence processing difficulty, such as dependencylocality theory (measuring dependency lengths withinthe sentence; longer dependencies are more difficult),information density (measuring surprisal – the amountof information conveyed in a certain time unit; a higherrate of information per time unit is more difficult) orwords-per-concept (how many words are used to con-vey a concept).In this paper, we focus on the measure of informationdensity, which uses the information-theoretic measureof surprisal (Hale, 2001; Levy, 2008), as well as theratio of concepts per words. Our aim is to flexibly gen-erate utterances that differ in information density, pro-ducing high-density and low-density formulations forthe same underlying semantic representation. We eval-uate different parametrisations of our approach by eval-uating how many different high vs. low density utter-ances can be generated. We additionally present judg-ments from human evaluators rating both grammatical-ity and meaningfulness.We collect a small corpus of utterances from the targetdomain and have them annotated by naive participantswith a very shallow notion of semantics, inspired by(Mairesse et al., 2010). We then parse the sentencesand automatically create typed templates. During gen-eration, these typed templates are then combined intonew unseen sentences, covering also previously unob-served semantic combinations. Generation flexibilityin this approach depends entirely on the crowd-sourceddomain corpus. Our approach is related to (DeVault etal., 2008), who automatically induce a tree-adjoining-grammar for the Doctor Perez domain.Our system is realised using OpenCCG. Currently, wedisallow cross composition and type raising and thusemploy Categorial Grammar as the underlying model.
105
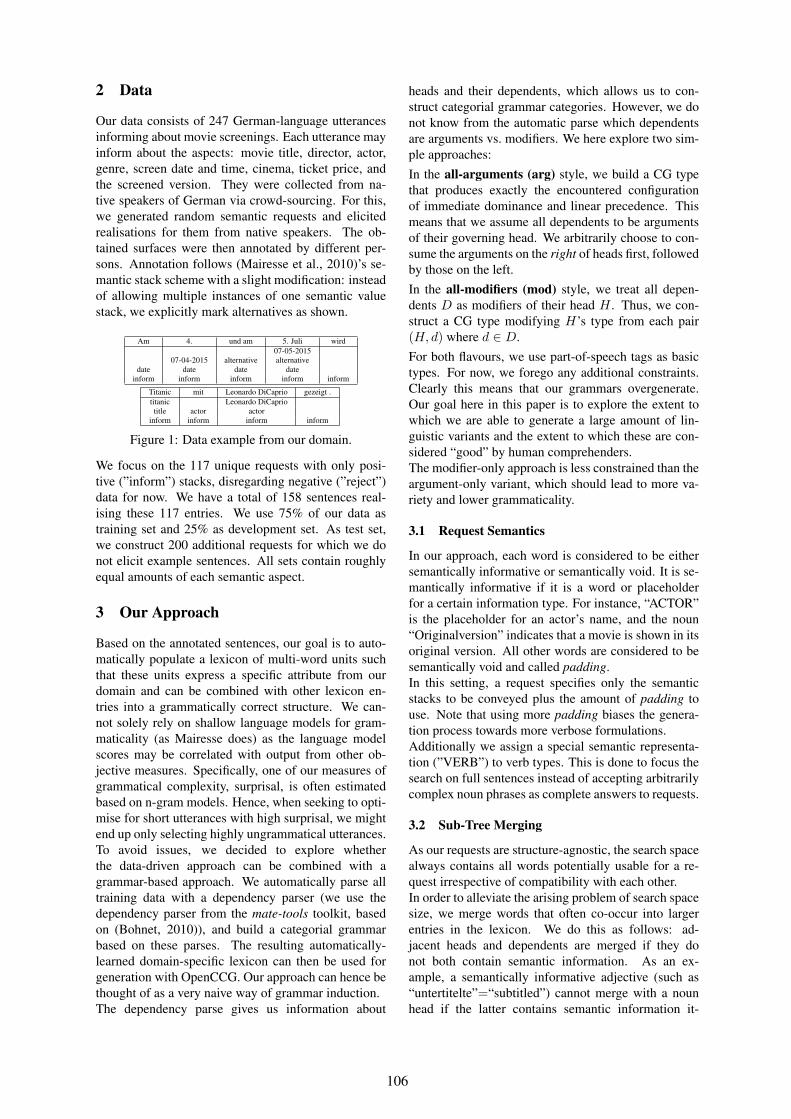
2 Data
Our data consists of 247 German-language utterancesinforming about movie screenings. Each utterance mayinform about the aspects: movie title, director, actor,genre, screen date and time, cinema, ticket price, andthe screened version. They were collected from na-tive speakers of German via crowd-sourcing. For this,we generated random semantic requests and elicitedrealisations for them from native speakers. The ob-tained surfaces were then annotated by different per-sons. Annotation follows (Mairesse et al., 2010)’s se-mantic stack scheme with a slight modification: insteadof allowing multiple instances of one semantic valuestack, we explicitly mark alternatives as shown.
Am 4. und am 5. Juli wird07-05-2015
07-04-2015 alternative alternativedate date date date
inform inform inform inform inform
Titanic mit Leonardo DiCaprio gezeigt .titanic Leonardo DiCapriotitle actor actor
inform inform inform inform
Figure 1: Data example from our domain.
We focus on the 117 unique requests with only posi-tive (”inform”) stacks, disregarding negative (”reject”)data for now. We have a total of 158 sentences real-ising these 117 entries. We use 75% of our data astraining set and 25% as development set. As test set,we construct 200 additional requests for which we donot elicit example sentences. All sets contain roughlyequal amounts of each semantic aspect.
3 Our Approach
Based on the annotated sentences, our goal is to auto-matically populate a lexicon of multi-word units suchthat these units express a specific attribute from ourdomain and can be combined with other lexicon en-tries into a grammatically correct structure. We can-not solely rely on shallow language models for gram-maticality (as Mairesse does) as the language modelscores may be correlated with output from other ob-jective measures. Specifically, one of our measures ofgrammatical complexity, surprisal, is often estimatedbased on n-gram models. Hence, when seeking to opti-mise for short utterances with high surprisal, we mightend up only selecting highly ungrammatical utterances.To avoid issues, we decided to explore whetherthe data-driven approach can be combined with agrammar-based approach. We automatically parse alltraining data with a dependency parser (we use thedependency parser from the mate-tools toolkit, basedon (Bohnet, 2010)), and build a categorial grammarbased on these parses. The resulting automatically-learned domain-specific lexicon can then be used forgeneration with OpenCCG. Our approach can hence bethought of as a very naive way of grammar induction.The dependency parse gives us information about
heads and their dependents, which allows us to con-struct categorial grammar categories. However, we donot know from the automatic parse which dependentsare arguments vs. modifiers. We here explore two sim-ple approaches:In the all-arguments (arg) style, we build a CG typethat produces exactly the encountered configurationof immediate dominance and linear precedence. Thismeans that we assume all dependents to be argumentsof their governing head. We arbitrarily choose to con-sume the arguments on the right of heads first, followedby those on the left.In the all-modifiers (mod) style, we treat all depen-dents D as modifiers of their head H . Thus, we con-struct a CG type modifying H’s type from each pair(H, d) where d ∈ D.For both flavours, we use part-of-speech tags as basictypes. For now, we forego any additional constraints.Clearly this means that our grammars overgenerate.Our goal here in this paper is to explore the extent towhich we are able to generate a large amount of lin-guistic variants and the extent to which these are con-sidered “good” by human comprehenders.The modifier-only approach is less constrained than theargument-only variant, which should lead to more va-riety and lower grammaticality.
3.1 Request Semantics
In our approach, each word is considered to be eithersemantically informative or semantically void. It is se-mantically informative if it is a word or placeholderfor a certain information type. For instance, “ACTOR”is the placeholder for an actor’s name, and the noun“Originalversion” indicates that a movie is shown in itsoriginal version. All other words are considered to besemantically void and called padding.In this setting, a request specifies only the semanticstacks to be conveyed plus the amount of padding touse. Note that using more padding biases the genera-tion process towards more verbose formulations.Additionally we assign a special semantic representa-tion (”VERB”) to verb types. This is done to focus thesearch on full sentences instead of accepting arbitrarilycomplex noun phrases as complete answers to requests.
3.2 Sub-Tree Merging
As our requests are structure-agnostic, the search spacealways contains all words potentially usable for a re-quest irrespective of compatibility with each other.In order to alleviate the arising problem of search spacesize, we merge words that often co-occur into largerentries in the lexicon. We do this as follows: ad-jacent heads and dependents are merged if they donot both contain semantic information. As an ex-ample, a semantically informative adjective (such as“untertitelte”=“subtitled”) cannot merge with a nounhead if the latter contains semantic information it-
106
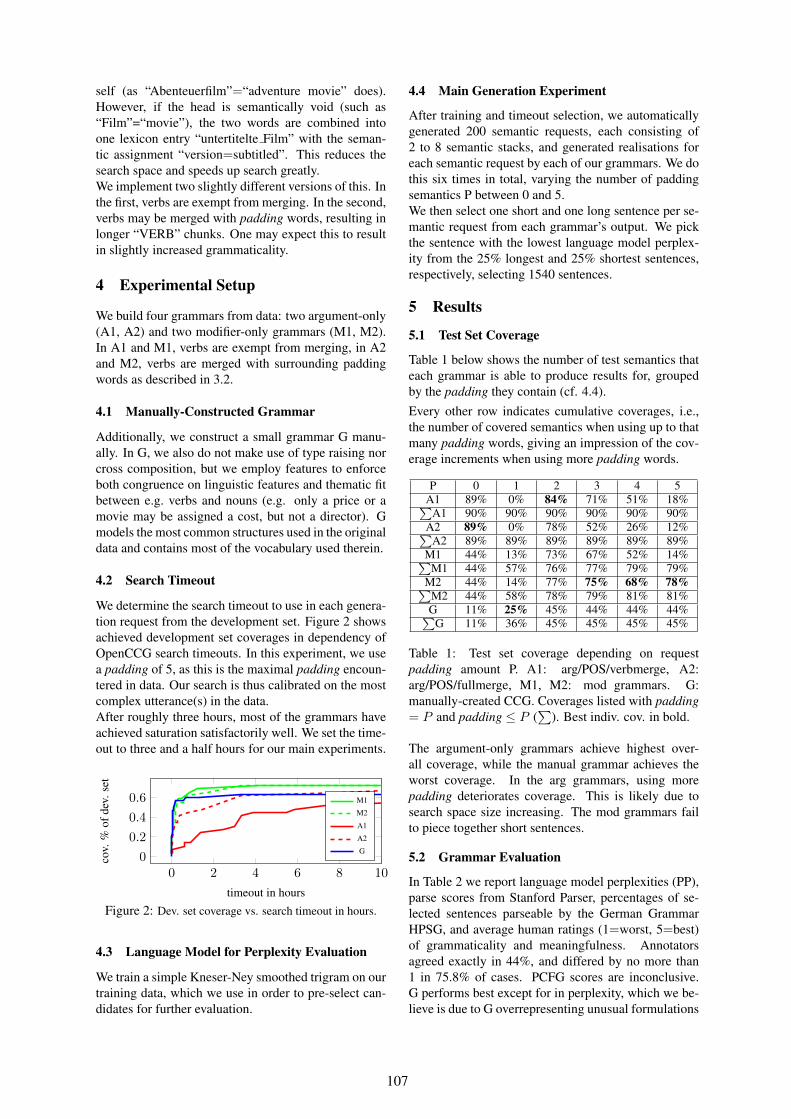
self (as “Abenteuerfilm”=“adventure movie” does).However, if the head is semantically void (such as“Film”=“movie”), the two words are combined intoone lexicon entry “untertitelte Film” with the seman-tic assignment “version=subtitled”. This reduces thesearch space and speeds up search greatly.We implement two slightly different versions of this. Inthe first, verbs are exempt from merging. In the second,verbs may be merged with padding words, resulting inlonger “VERB” chunks. One may expect this to resultin slightly increased grammaticality.
4 Experimental Setup
We build four grammars from data: two argument-only(A1, A2) and two modifier-only grammars (M1, M2).In A1 and M1, verbs are exempt from merging, in A2and M2, verbs are merged with surrounding paddingwords as described in 3.2.
4.1 Manually-Constructed Grammar
Additionally, we construct a small grammar G manu-ally. In G, we also do not make use of type raising norcross composition, but we employ features to enforceboth congruence on linguistic features and thematic fitbetween e.g. verbs and nouns (e.g. only a price or amovie may be assigned a cost, but not a director). Gmodels the most common structures used in the originaldata and contains most of the vocabulary used therein.
4.2 Search Timeout
We determine the search timeout to use in each genera-tion request from the development set. Figure 2 showsachieved development set coverages in dependency ofOpenCCG search timeouts. In this experiment, we usea padding of 5, as this is the maximal padding encoun-tered in data. Our search is thus calibrated on the mostcomplex utterance(s) in the data.After roughly three hours, most of the grammars haveachieved saturation satisfactorily well. We set the time-out to three and a half hours for our main experiments.
0 2 4 6 8 100
0.2
0.4
0.6
timeout in hours
cov.
%of
dev.
set
M1
M2
A1
A2
G
Figure 2: Dev. set coverage vs. search timeout in hours.
4.3 Language Model for Perplexity Evaluation
We train a simple Kneser-Ney smoothed trigram on ourtraining data, which we use in order to pre-select can-didates for further evaluation.
4.4 Main Generation Experiment
After training and timeout selection, we automaticallygenerated 200 semantic requests, each consisting of2 to 8 semantic stacks, and generated realisations foreach semantic request by each of our grammars. We dothis six times in total, varying the number of paddingsemantics P between 0 and 5.We then select one short and one long sentence per se-mantic request from each grammar’s output. We pickthe sentence with the lowest language model perplex-ity from the 25% longest and 25% shortest sentences,respectively, selecting 1540 sentences.
5 Results
5.1 Test Set Coverage
Table 1 below shows the number of test semantics thateach grammar is able to produce results for, groupedby the padding they contain (cf. 4.4).Every other row indicates cumulative coverages, i.e.,the number of covered semantics when using up to thatmany padding words, giving an impression of the cov-erage increments when using more padding words.
P 0 1 2 3 4 5A1 89% 0% 84% 71% 51% 18%∑
A1 90% 90% 90% 90% 90% 90%A2 89% 0% 78% 52% 26% 12%∑
A2 89% 89% 89% 89% 89% 89%M1 44% 13% 73% 67% 52% 14%∑
M1 44% 57% 76% 77% 79% 79%M2 44% 14% 77% 75% 68% 78%∑
M2 44% 58% 78% 79% 81% 81%G 11% 25% 45% 44% 44% 44%∑
G 11% 36% 45% 45% 45% 45%
Table 1: Test set coverage depending on requestpadding amount P. A1: arg/POS/verbmerge, A2:arg/POS/fullmerge, M1, M2: mod grammars. G:manually-created CCG. Coverages listed with padding= P and padding ≤ P (
∑). Best indiv. cov. in bold.
The argument-only grammars achieve highest over-all coverage, while the manual grammar achieves theworst coverage. In the arg grammars, using morepadding deteriorates coverage. This is likely due tosearch space size increasing. The mod grammars failto piece together short sentences.
5.2 Grammar Evaluation
In Table 2 we report language model perplexities (PP),parse scores from Stanford Parser, percentages of se-lected sentences parseable by the German GrammarHPSG, and average human ratings (1=worst, 5=best)of grammaticality and meaningfulness. Annotatorsagreed exactly in 44%, and differed by no more than1 in 75.8% of cases. PCFG scores are inconclusive.G performs best except for in perplexity, which we be-lieve is due to G overrepresenting unusual formulations
107
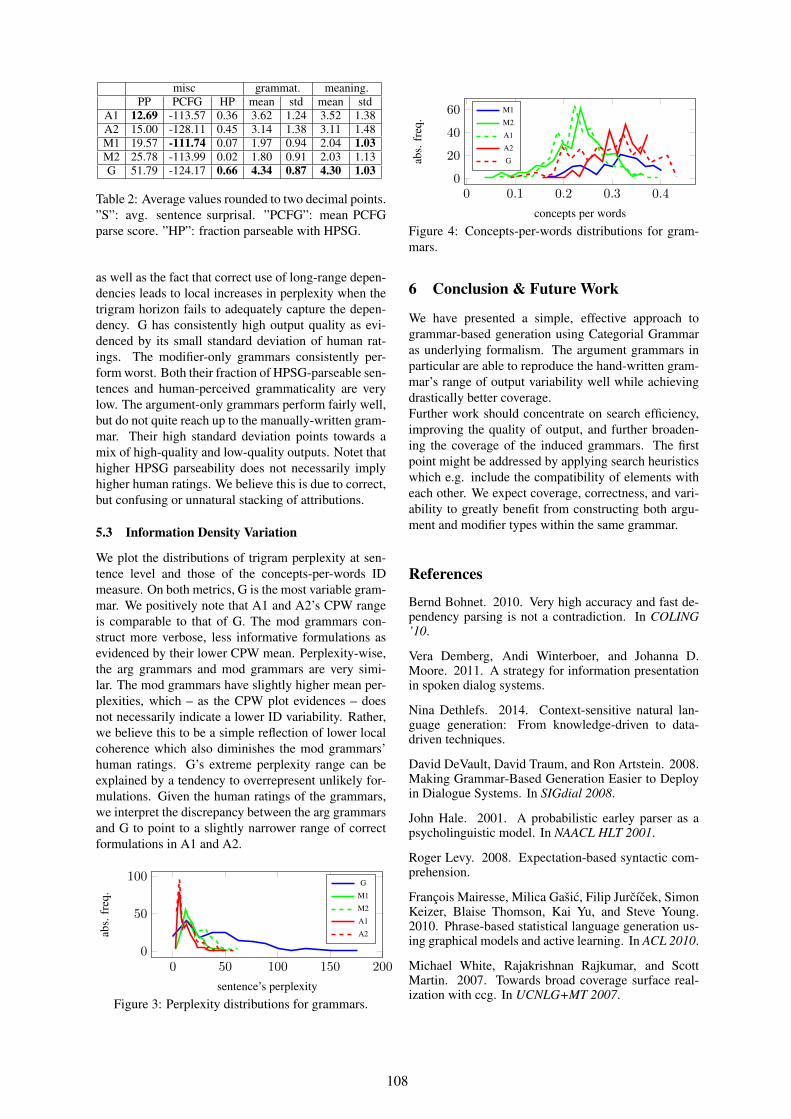
misc grammat. meaning.PP PCFG HP mean std mean std
A1 12.69 -113.57 0.36 3.62 1.24 3.52 1.38A2 15.00 -128.11 0.45 3.14 1.38 3.11 1.48M1 19.57 -111.74 0.07 1.97 0.94 2.04 1.03M2 25.78 -113.99 0.02 1.80 0.91 2.03 1.13G 51.79 -124.17 0.66 4.34 0.87 4.30 1.03
Table 2: Average values rounded to two decimal points.”S”: avg. sentence surprisal. ”PCFG”: mean PCFGparse score. ”HP”: fraction parseable with HPSG.
as well as the fact that correct use of long-range depen-dencies leads to local increases in perplexity when thetrigram horizon fails to adequately capture the depen-dency. G has consistently high output quality as evi-denced by its small standard deviation of human rat-ings. The modifier-only grammars consistently per-form worst. Both their fraction of HPSG-parseable sen-tences and human-perceived grammaticality are verylow. The argument-only grammars perform fairly well,but do not quite reach up to the manually-written gram-mar. Their high standard deviation points towards amix of high-quality and low-quality outputs. Notet thathigher HPSG parseability does not necessarily implyhigher human ratings. We believe this is due to correct,but confusing or unnatural stacking of attributions.
5.3 Information Density Variation
We plot the distributions of trigram perplexity at sen-tence level and those of the concepts-per-words IDmeasure. On both metrics, G is the most variable gram-mar. We positively note that A1 and A2’s CPW rangeis comparable to that of G. The mod grammars con-struct more verbose, less informative formulations asevidenced by their lower CPW mean. Perplexity-wise,the arg grammars and mod grammars are very simi-lar. The mod grammars have slightly higher mean per-plexities, which – as the CPW plot evidences – doesnot necessarily indicate a lower ID variability. Rather,we believe this to be a simple reflection of lower localcoherence which also diminishes the mod grammars’human ratings. G’s extreme perplexity range can beexplained by a tendency to overrepresent unlikely for-mulations. Given the human ratings of the grammars,we interpret the discrepancy between the arg grammarsand G to point to a slightly narrower range of correctformulations in A1 and A2.
0 50 100 150 2000
50
100
sentence’s perplexity
abs.
freq
.
G
M1
M2
A1
A2
Figure 3: Perplexity distributions for grammars.
0 0.1 0.2 0.3 0.40
20
40
60
concepts per words
abs.
freq
.
M1
M2
A1
A2
G
Figure 4: Concepts-per-words distributions for gram-mars.
6 Conclusion & Future Work
We have presented a simple, effective approach togrammar-based generation using Categorial Grammaras underlying formalism. The argument grammars inparticular are able to reproduce the hand-written gram-mar’s range of output variability well while achievingdrastically better coverage.Further work should concentrate on search efficiency,improving the quality of output, and further broaden-ing the coverage of the induced grammars. The firstpoint might be addressed by applying search heuristicswhich e.g. include the compatibility of elements witheach other. We expect coverage, correctness, and vari-ability to greatly benefit from constructing both argu-ment and modifier types within the same grammar.
References
Bernd Bohnet. 2010. Very high accuracy and fast de-pendency parsing is not a contradiction. In COLING’10.
Vera Demberg, Andi Winterboer, and Johanna D.Moore. 2011. A strategy for information presentationin spoken dialog systems.
Nina Dethlefs. 2014. Context-sensitive natural lan-guage generation: From knowledge-driven to data-driven techniques.
David DeVault, David Traum, and Ron Artstein. 2008.Making Grammar-Based Generation Easier to Deployin Dialogue Systems. In SIGdial 2008.
John Hale. 2001. A probabilistic earley parser as apsycholinguistic model. In NAACL HLT 2001.
Roger Levy. 2008. Expectation-based syntactic com-prehension.
Francois Mairesse, Milica Gasic, Filip Jurcıcek, SimonKeizer, Blaise Thomson, Kai Yu, and Steve Young.2010. Phrase-based statistical language generation us-ing graphical models and active learning. In ACL 2010.
Michael White, Rajakrishnan Rajkumar, and ScottMartin. 2007. Towards broad coverage surface real-ization with ccg. In UCNLG+MT 2007.
108

Proceedings of the 15th European Workshop on Natural Language Generation (ENLG), pages 109–111,Brighton, September 2015. c©2015 Association for Computational Linguistics 1
JSrealB: A bilingual text realizer for web programming
Paul Molins, Guy Lapalme
RALI Informatique et recherche opérationnelle
Université de Montréal CP 6128, Succ. Centre-Ville
Montréal, Québec, Canada H3C 3J7 [email protected], [email protected]
Abstract
JSrealB is an English and French text realizer written in JavaScript to ease its integration in web applications. The real-ization engine is mainly rule-based. Ta-ble driven rules are defined for inflection and algorithmic propagation rules, for agreements. It allows its user to build a variety of French and English expres-sions and sentences from a single specifi-cation to produce dynamic output de-pending on the content of a web page.
Natural language generation can automate a significant part of textual production, only re-quiring a human to supply some important as-pects and thus saving considerable time for pro-ducing consistent grammatically correct output. In recent years, tools such as SimpleNLG (Gatt and Reiter, 2009) facilitated text realization by a programmer provided they program their appli-cation in Java. This system was then extended with SimpleNLG-EnFr (Vaudry and Lapalme, 2013), a English-French version of SimpleNLG.
Another approach to text realization is JSreal (Daoust and Lapalme, 2014), a French Web real-izer written in JavaScript. This paper describes an attempt at combining the ideas of SimpleNLG-EnFr and JSreal to produce a bilingual realizer for French and English from a single specifica-tion. JSrealB generates well-formed expressions and sentences. It can be used standalone for lin-guistic demonstrations or be integrated into com-plex text generation projects. But like JSreal, it is aimed at web developers, from taking care of morphology, declension and conjugation to cre-ating well-formed texts. A web programmer who wishes to use JSrealB to produce flexible Eng-lish and/or French textual or HTML output only needs to add two lines in the page: one for im-
porting program and one for calling JSrealB loader to load the resources (i.e. lexicon and rules).
The principles underlying JSrealB are similar to those of SimpleNLG: programming language instructions create data structures corresponding to the constituents of the sentence to be pro-duced. Once the data structure (a tree) is built in memory, it is traversed to produce the list of to-kens of the sentence. This data structure is built by function calls whose names are the same as the symbols usually used for classical syntax trees: for example, N to create a noun structure, NP for a Noun Phrase, V for a Verb, D for a de-terminer, S for a Sentence and so on. Features added to the structures using the dot notation can modify the values according to what is intended.
JSrealB syntactic representation is patterned after classical constituent grammar notations. For example, S(NP(D("a"),N("woman")).n("p"), VP("eat").t("ps")) is the JSrealB specification for The women ate. Plural is indicated with feature n("p") where n indicates number and p plural. The verb is con-jugated to past tense indicated by the feature tense t and value ps. Agreement between NP and VP is performed automatically.
French and English are languages whose structures are similar. Both languages use the same alphabet, they are both fusional languages sharing a similar conjugation system and their word order follows the same basic Subject-Verb-Object paradigm (Shoebottom, 1996). But structural differences do exist: e.g. the position of adjectives differs and rules for gender and number agreement differ for nouns and pronoun between these languages.
These differences must be taken into account at many levels. First, syntactic differences and agreements (i.e. features propagation), must be handled at the phrase or sentence level by
109

2
algorithms. For French complex rules, we followed "Le bon usage, grammaire française" (Grevisse, 1980). For English, we relied on various sources from the web.
JSrealB lexicons are based on the ones found in SimpleNLG-EnFr (Vaudry and Lapalme, 2013). These lexicons can be completed by the user to add domain-specific vocabularies. In lexicons, words have grammatical properties (e.g. category, gender, etc.) and a link to an inflection table. Tables are defined for nouns, adjectives, verbs, determiners and pronouns in both English and French. These inflection rules are language specific and correspond to the information found in (Bescherelle, 2012) and (Delaunay and Laurent, 2013). These conjugation, declension or transformation tables are included with the lexicon in JSrealB, they are defined declaratively for each language and interpreted by a rule engine common to both languages. There are also rules for the proper localization of dates, numbers and punctuation in each language.
Our goal was to develop an English and French text realizer with minimal specific adaptations to each language. We have promoted the systematic application of rules hoping it is possible to support other languages at limited cost. This is contrast with SimpleNLG-EnFr and JSreal in which many irregular forms were included in the lexicon.
Text realization uses a syntactic hierarchical tree representation that creates a sentence by combining phrases and terminals. The relations between these lexical units determine the propa-gation of features between words for determining proper agreements. For example, in S(NP(D("le"), N("monsieur").n("p")), VP(V("avoir").t("i"), NP(D("un"),N("souris")))) grammatical categories of words are already specified in the syntactic representation. Word order usually follows the left to right order of the terminals in the tree except in some coordinated sentences where position of coordinate must be determined.
The relations between non-terminals specified in the input determine the grammatical functions of each element, which are roughly similar be-tween French and English. We can then compute the agreement between elements of the sentence in order to propagate appropriate features to the words according to the rules of the language.
Orthographic realization is performed after morphological realization. Sentence relays fea-tures, especially HTML tags, capitalization and full stop, to its children elements with the aim of formatting each phrase with proper elision.
JSrealB implements French and English grammatical categories: noun, pronoun, deter-miner, adjective, preposition, conjunction, and complement; the implemented phrases are: noun, verbal, adjectival, adverbial, prepositional, sub-ordinate, and coordinate. The sentence combines all these phrases.
Supported inflections are conjugation for sim-ple tenses, and declension in gender and number for every grammatical category. Noun phrase agrees in gender and number, while verbal phrase agrees with every type of subject (i.e. common or proper noun, or pronoun).
JSrealB currently realize sentences structured in the Subject-Verb-Object paradigm (e.g. It will rain tomorrow.), or noun phrases (e.g. Heavy snowfalls this night!).
But there is still much work in order to obtain a more complete coverage. For example negation is not yet handled: in French, negation is realized with two adverbs ne and pas (e.g. il ne parle pas), while in English there is only one: not (e.g. he does not speak). Moreover, the proper place-ment of the adverb is quite intricate.
There are also contractions (e.g. can not some-times contracts in cannot in English) and elision (e.g. it is become it's) which has only partial support in French.
We will proceed to add new rules and types of sentences. Nevertheless, the core of the program is well developed and tested, and various exten-sion mechanisms have been designed so that we can quickly achieve a better coverage.
Availability
Examples of the use of JSrealB, and a web-based development environment are available at:
http://rali.iro.umontreal.ca/rali/?q=en/jsrealb-bilingual-text-realiser
The javascript code of the realizer, the lexicon and tables are made available to the NLG com-munity at:
https://github.com/rali-udem/JSrealB
110

3
References
Bescherelle, Bescherelle La conjugaison pour tous, Hatier, 2012.
N. Daoust and G. Lapalme, "JSreal: A Text Realizer for Web Programming", Language Production, Cognition, and the Lexicon, Springer, 2014, pp. 363-378.
B. Delaunay and N. Laurent, Bescherelle La grammaire pour tous, Hatier, France, 2013.
B. Garner, Garner's Modern American Usage, Oxford University Press, 2009.
A. Gatt and E. Reiter, "SimpleNLG: A realisation engine for practical applications", in 12th European Workshop on Natural Language Generation, Athens, Greece, 2009, pp. 90-93.
M. Grevisse, Le bon usage, grammaire française, 11e édition, Duculot, Louvain-la-Neuve, Belgique, 1980.
P.-L. Vaudry and G. Lapalme, Adapting SimpleNLG for bilingual English - French realisation, 14th European Workshop on Natural Language Generation, Sofia, Bulgaria, 2013, pp. 183-187.
111

Proceedings of the 15th European Workshop on Natural Language Generation (ENLG), pages 112–113,Brighton, September 2015. c©2015 Association for Computational Linguistics
A game-based setup for data collection and task-based evaluation ofuncertain information presentation
Dimitra Gkatzia, Amanda Cercas Curry, Verena Rieser and Oliver LemonInteraction Lab
Heriot-Watt UniversityEH14 4AS, Edinburgh
{d.gkatzia,ac293,v.t.rieser,o.lemon}@hw.ac.uk
AbstractDecision-making is often dependent onuncertain data, e.g. data associated withconfidence scores, such as probabilities. Aconcrete example of such data is weatherdata. We will demo a game-based setupfor exploring the effectiveness of differentapproaches (graphics vs NLG) to commu-nicating uncertainty in rainfall and temper-ature predictions (www.macs.hw.ac.uk/InteractionLab/weathergame/ ). Thegame incorporates a natural language ex-tension of the MetOffice Weather game1.The extended version of the game can beused in three ways: (1) to compare theeffectiveness of different information pre-sentations of uncertain data; (2) to col-lect data for the development of effectivedata-driven approaches; and (3) to serve asa task-based evaluation setup for NaturalLanguage Generation (NLG).
1 IntroductionNLG technology achieves comparable results tocommonly used data visualisation techniques interms of supporting accurate human decision-making (Gatt et al., 2009). In this paper, wepresent a task-based setup to explore whetherNLG technology can also be used to supportdecision-making when the underlying data is un-certain. The Intergovernmental Panel on Cli-mate Change (IPCC) (Manning et al., 2004) andthe World Meteorological Organisation (WMO)(Kootval, 2008) list the following advantages ofcommunicating risk and uncertainty: informationon uncertainty has been shown to improve deci-sion making; helps to manage user expectations;promotes user confidence; and is reflective of thestate of science. Results by Stephens (2011) fur-ther show that, although people prefer reports us-
1http://www.metoffice.gov.uk/news/releases/archive/2011/weather-game
Figure 1: Screenshot of the Extended WeatherGame (graphs and text version).
ing percentages (e.g. 10% chance of rain), thisdoes not necessarily equate with understanding,i.e. making the right decision based on this infor-mation. One possible explanation is low “risk lit-eracy” (Cokely et al., 2012), i.e. a reduced abilityto accurately interpret and act on numerical infor-mation about risk and uncertainty.
In this research, we aim for a better understand-ing of how to effectively translate numerical riskand uncertainty measures into “laymen’s” termsusing natural language, following the recommen-dations of the WMO (Kootval, 2008). For exam-ple, the relative risk of 1 in 1000 could be de-scribed as exceptionally unlikely. We expect thatthrough the use of language we will improve un-derstanding and thus decision-making for userswith low risk literacy (as measured by the Berlinliteracy test2).
2 The Weather GameRecruiting users to perform evaluations is a la-borious task and many studies suffer from under-powered evaluations. Therefore, we use a crowd-sourcing technique known as “game with a pur-pose”, which has been shown to assist in recruit-
2http://www.riskliteracy.org/researchers/
112
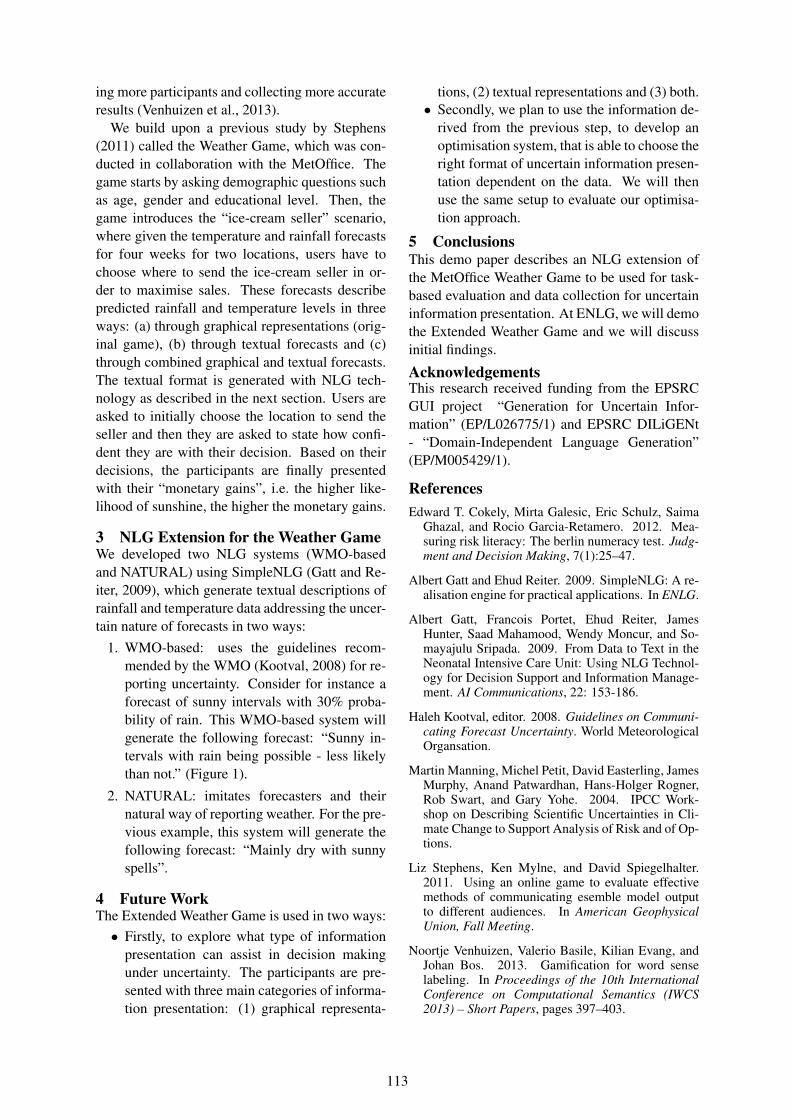
ing more participants and collecting more accurateresults (Venhuizen et al., 2013).
We build upon a previous study by Stephens(2011) called the Weather Game, which was con-ducted in collaboration with the MetOffice. Thegame starts by asking demographic questions suchas age, gender and educational level. Then, thegame introduces the “ice-cream seller” scenario,where given the temperature and rainfall forecastsfor four weeks for two locations, users have tochoose where to send the ice-cream seller in or-der to maximise sales. These forecasts describepredicted rainfall and temperature levels in threeways: (a) through graphical representations (orig-inal game), (b) through textual forecasts and (c)through combined graphical and textual forecasts.The textual format is generated with NLG tech-nology as described in the next section. Users areasked to initially choose the location to send theseller and then they are asked to state how confi-dent they are with their decision. Based on theirdecisions, the participants are finally presentedwith their “monetary gains”, i.e. the higher like-lihood of sunshine, the higher the monetary gains.
3 NLG Extension for the Weather GameWe developed two NLG systems (WMO-basedand NATURAL) using SimpleNLG (Gatt and Re-iter, 2009), which generate textual descriptions ofrainfall and temperature data addressing the uncer-tain nature of forecasts in two ways:
1. WMO-based: uses the guidelines recom-mended by the WMO (Kootval, 2008) for re-porting uncertainty. Consider for instance aforecast of sunny intervals with 30% proba-bility of rain. This WMO-based system willgenerate the following forecast: “Sunny in-tervals with rain being possible - less likelythan not.” (Figure 1).
2. NATURAL: imitates forecasters and theirnatural way of reporting weather. For the pre-vious example, this system will generate thefollowing forecast: “Mainly dry with sunnyspells”.
4 Future WorkThe Extended Weather Game is used in two ways:
• Firstly, to explore what type of informationpresentation can assist in decision makingunder uncertainty. The participants are pre-sented with three main categories of informa-tion presentation: (1) graphical representa-
tions, (2) textual representations and (3) both.• Secondly, we plan to use the information de-
rived from the previous step, to develop anoptimisation system, that is able to choose theright format of uncertain information presen-tation dependent on the data. We will thenuse the same setup to evaluate our optimisa-tion approach.
5 ConclusionsThis demo paper describes an NLG extension ofthe MetOffice Weather Game to be used for task-based evaluation and data collection for uncertaininformation presentation. At ENLG, we will demothe Extended Weather Game and we will discussinitial findings.
AcknowledgementsThis research received funding from the EPSRCGUI project “Generation for Uncertain Infor-mation” (EP/L026775/1) and EPSRC DILiGENt- “Domain-Independent Language Generation”(EP/M005429/1).
ReferencesEdward T. Cokely, Mirta Galesic, Eric Schulz, Saima
Ghazal, and Rocio Garcia-Retamero. 2012. Mea-suring risk literacy: The berlin numeracy test. Judg-ment and Decision Making, 7(1):25–47.
Albert Gatt and Ehud Reiter. 2009. SimpleNLG: A re-alisation engine for practical applications. In ENLG.
Albert Gatt, Francois Portet, Ehud Reiter, JamesHunter, Saad Mahamood, Wendy Moncur, and So-mayajulu Sripada. 2009. From Data to Text in theNeonatal Intensive Care Unit: Using NLG Technol-ogy for Decision Support and Information Manage-ment. AI Communications, 22: 153-186.
Haleh Kootval, editor. 2008. Guidelines on Communi-cating Forecast Uncertainty. World MeteorologicalOrgansation.
Martin Manning, Michel Petit, David Easterling, JamesMurphy, Anand Patwardhan, Hans-Holger Rogner,Rob Swart, and Gary Yohe. 2004. IPCC Work-shop on Describing Scientific Uncertainties in Cli-mate Change to Support Analysis of Risk and of Op-tions.
Liz Stephens, Ken Mylne, and David Spiegelhalter.2011. Using an online game to evaluate effectivemethods of communicating esemble model outputto different audiences. In American GeophysicalUnion, Fall Meeting.
Noortje Venhuizen, Valerio Basile, Kilian Evang, andJohan Bos. 2013. Gamification for word senselabeling. In Proceedings of the 10th InternationalConference on Computational Semantics (IWCS2013) – Short Papers, pages 397–403.
113

Proceedings of the 15th European Workshop on Natural Language Generation (ENLG), pages 114–116,Brighton, September 2015. c©2015 Association for Computational Linguistics
Generating Referential Descriptions Involving Relations by a Best-First Searching Procedure – A System Demo
Florin HaqueSaarland UniversityP.O. Box 151150
66041 Saarbrücken, [email protected]
Helmut HoracekGerman Research Center for AI
Stuhlsatzenhausweg 366123 Saarbrücken, GERMANY [email protected]
Abstract
Despite considerable research invested in the generation of referring expressions (GRE), there still exists no adequate gene-ric procedure for GRE involving relations. In this paper, we present a system for GRE that combines attributes and relations, using best-first search technique. Prelimi-nary evaluations show its effectiveness; the design enables the use of heuristics that meet linguistic preferences.
1 Motivation
Empirical evidence shows that humans use rela-tions in GRE more often than necessary [Vieth-en, Dale 2008]. Nevertheless, algorithms involv-ing relations, starting with [Dale, Haddock 1991] still have not reached a significant level of rigour and coverage (the method by [Krahmer, van Erk, Verleg 2003] does, to a certain extent). In parti-cular, the incremental algorithm [Dale, Reiter 1995] constitutes a severe commitment for GRE involving relations, because the choice among alternate referents related to the intended one leads to substantial differences at early phases.
In order to remedy this problem, we have applied best-first searching (A*) to the issue at hand, as already explored for references to sets of objects involving boolean combinations of attributes [Horacek 2003]. This method yields the expression considered best according to the evaluation function used, with a guarantee of optimality, provided an admissible heuristic is built on the basis of the evaluation function.
2 General Approach and Some Specificities
Our approach applies the best-first search para-digm (as in [Horacek 2003]) to the conceptual algorithm described in [Horacek 1996], so that known unwanted effects (endless loops, unneces-sary identification of objects) are avoided. Moti-vations, conceptualization and details of the im-plementation are described in [Haque 2015].
When searching for components of an ade-quate referring expression, a tree consisting of partial expressions describing the intended refer-ent, also in terms of the objects related to it, is successively built. Tree expansion is geared by the A*-specific function f, which is composed of the cost of a partial expression built so far (g) and the most optimistic estimate of reaching a goal state (h), i.e., in a single step. This process terminates once an identifying and provably best description has been found. It is speeded up by A* specific and local similarity-based cut-offs.
The sum of g and h reflects the relative qua-lity of competing partial descriptions. To impose a more fine-grained ordering over the candidates for the next descriptor to be tried out, we have used discriminatory power to resolve the ties.
1. Attributes and relations are treated in a uni-form way. Relations are tried out after attri-butes by assigning lower costs to attributes, as relations require a description of the object related (attributes may suffice alone).
2. A relation may be chosen even if it applies to all potential distractors, but only if all the objects possessing this relation are not related with the same object via this relation.
114

r = b2, g = 3, h = 1, f = 4,{ in(b2)}, {b1, b2}, {type
(bowl), color(white), on(t1)}
r = c2, g = 4, h = 2, f = 6,{ in(b2), type(cup)},
{c1, c2}, {color(white)}
r = c2, g = 5, h = 1, f = 6,{in(b2), color(white)}, {c1, c2}, {type(cup)}
r = c2, g = 3, h = 1, f = 4,{in(b2)}, {c1, c2},
{type(cup), color(white)}
r = c2, g = 0, h = 1, f = 1,{}, {c1, c2, c3, b1, b2, t1, t2, f1},{type(cup), color(white), in(b2)}
--
-
t1-
f1
f1
f1
-
dark grey
grey
whitewhite
white
floorf1
table
bowl
t1, t2
b2cup
cup
b1
c3-b1/b2whitecupc1, c2
on (3)in (3)color (2)type (1)ObjectProperty with cost
Figure 1. A small scenario and a fragment of the search tree
3 Implementation
The algorithm is implemented in C++, running on an Intel Core i5 processor with 1.6 GHz.
The functions g and h can be parameterized context-independently. For the test scenatios, we have used simple counts for each part, such as 1 for type, 2 for other attributes, and 3 for rela-tions, so that the shortest expression results.
At first, we have tested the system with a few scenarios similar to those discussed in the liter-ature – a room with tables, bowls, cups, etc., with some attributes (e.g., type, color) and relations (e.g., spatial containment – ‘in’, spatial support – ‘on’, left-of, and right-of). Figure 1 (top left) shows such a scenario (cup c2 being the intended referent), and a portion of the search tree that illustrates the expansion of a node via a relation (in the node structure ‘r’ is the local referent, and the last three sets include accumulated des-criptors, context set, and available properties, respectively). It finally leads to the identifying expression "the cup in the bowl on the table". To check how the system handles relatively complex situations, we have designed a scenario composed of 40 entities with 10 well-defined descriptors (4 attributes and 6 relations).
Table 1 summarizes the results for some small scenarios (2nd line for the scenario from [Hora-cek 1996] and 3rd linr for the scenario from [Dale, Haddock 1991]) and for the extended one (last line), in terms of tree size and running time (ranging from smallest to largest). For the extended scenario, easy identification tasks do not require extra resources in comparison to the small scenarios. In contrast, identification of a specific bottle needed the largest tree (269 no-
des) and longest run-time (298 msec) incorpor-ating four chained relations in the generated expression which can be glossed as 'the bottle in the bowl which is in a plate on the table under which there is a glass'.
The system is always able to find a reasonable expression without extra components, some in-cluding several attributes and relations. Since the evaluation functions used so far do not express subtle preferences, several ties may result. For ex-ample, “the metal bottle on the table", "the metal bottle right of a glass", "the white bottle right of a glass", "the bottle right of a glass with water" are produced as equivalent alternatives for identify-ing one specific bottle in the extended scenario.
4 Conclusion and Extensions
In this paper, we have presented an approach for generating referential descriptions involving rela-tions by a best-first searching procedure. The system is able to find the best expression (or multiple equally good expressions if exist) according to the evaluation function used. For the examples we have tested so far, the resulting expressions are reasonable and the computation times needed are very convincing.
In further developing the system, we envision conceptual extensions, such as the use of nega-tion ("the table on which there are no bottles", "the empty table"). Moreover, we need to make technical refinements, most importantly the use of context-sensitive evaluation functions for the resulting expressions, especially to cater for situation-dependent uses of descriptors redun-dant for identification purposes; the challenge here is to derive heuristic functions that are still admissible. In addition, we intend to test the system in larger and more diverse situations, pre-ferably backed-up by corpus data.
no. of entities no. of tree nodes time (msec)
4 4 to 7 1 to 46 4 to 24 1 to 188 4 to 7 1 to 540 4 to 269 2 to 298
Table 1. Summary of searches for a few small scenarios and an extended one
115
References
Dale, R., and Haddock, N. 1991. Generating Referring Expressions Involving Relations. Proceedings of the 27th Annual Meeting of the European Chapter of the ACL (EACL'91), pp. 161-166, Berlin, Germany.
Dale, R., and Reiter, E. 1995. Computational Interpreta-tions of the Gricean Maxims in the Generation of Referring Expressions. Cognitive Science 18, pp. 233-263.
Haque, F. 2015. Generating Referring Expressions Involving Relations by Best-First Searching. Master thesis, Saarland University, Department of Computer Science.
Horacek, H. 1996. A New Algorithm for Generating Referential Descriptions. In Proc. of 12th European Conference on Artificial Intelligence (ECAI-96), pp. 577-581, Budapest, Hungary.
Horacek, H. 2003. A Best-First Search Algorithm for Generating Referring Expressions. In Proc. of the European Chapter of the ACL (EACL'2003), pp. 206-213, Budapest, Hungary.
Krahmer, E., v. Erk S., and Verleg, A. 2003. Graph-based Generation of Referring Expressions. Compu-tational Linguistics, 29(1), pp. 53–72.
Viethen, J. and Dale, R. 2008. The Use of Spatial Relations in Referring Expressions. In Proceedings of the 5th International Natural Language Generation Conference (INLG), pp. 59–67, Salt Fork, OH.
116

Proceedings of the 15th European Workshop on Natural Language Generation (ENLG), pages 117–126,Brighton, September 2015. c©2015 Association for Computational Linguistics
Generating Image Descriptions with Gold Standard Visual Inputs:Motivation, Evaluation and Baselines
Josiah WangDepartment of Computer Science
University of SheffieldUnited Kingdom
Robert GaizauskasDepartment of Computer Science
University of SheffieldUnited Kingdom
Abstract
In this paper, we present the task of gen-erating image descriptions with gold stan-dard visual detections as input, rather thandirectly from an image. This allows theNatural Language Generation communityto focus on the text generation process,rather than dealing with the noise andcomplications arising from the visual de-tection process. We propose a fine-grainedevaluation metric specifically for evaluat-ing the content selection capabilities ofimage description generation systems. Todemonstrate the evaluation metric on thetask, several baselines are presented us-ing bounding box information and textualinformation as priors for content selec-tion. The baselines are evaluated usingthe proposed metric, showing that the fine-grained metric is useful for evaluating thecontent selection phase of an image de-scription generation system.
1 Introduction
There has been increased interest in the task ofautomatically generating full-sentence natural lan-guage image descriptions in recent years. Com-pared to earlier work that annotates images withisolated concept labels (Duygulu et al., 2002),such detailed annotations are much more informa-tive and discriminating, and are important for im-proved text and image retrieval. They also pose aninteresting and difficult challenge for natural lan-guage generation.
Previous work on generating image descriptionsconcentrates on solving the problem ‘end-to-end’,that is to generate a description given an image asinput (Yao et al., 2010; Kulkarni et al., 2011; Yanget al., 2011). Recent advances in large scale vi-sual object recognition, especially in deep learning
techniques, have reached a reasonably high levelof accuracy in the last few years. For the task ofclassifying an image into one of 1,000 object cat-egories (i.e. does the image contain an object ofcategory X, yes or no?) on the ImageNet LargeScale Visual Recognition Challenge (ILSVRC’14)dataset (Russakovsky et al., 2014), the state-of-the-art currently performs at a 4.82% top-5 errorrate (Ioffe and Szegedy, 2015) comparable to the5.1% error rate of a human annotator who trainedhimself to recognise the object categories (Rus-sakovsky et al., 2014). For the more challengingobject category detection task (i.e. draw a bound-ing box around each instance of objects of thegiven categories), the state-of-the-art achieved amean average precision of 43.9%. However, evenat this level of performance, the errors from thevisual output are still problematic when used asinput to an image description generation system,especially when considering a large pool of candi-date object categories to be mentioned in the de-scription.
What if we were to assume that visual objectrecognisers have already achieved close to perfectdetection rates, and that the object instances havealready been identified and localised in an image?This then raises many interesting questions withregards to generating a description for an image,including: (i) how do we decide which objects areto be mentioned? (ii) how should these objectsbe ordered in the description? (iii) how do weinfer and describe activities or actions? (iv) howto we describe spatial relations between objects?(v) how and when do we describe the object at-tributes? Many of these questions could be ex-plored if we had a ‘perfect’ visual input to our im-age description generator.
To be able to begin to answer these questions,we proposed a pilot task, which has formed part ofthe ImageCLEF 2015 Scalable Image Annotation,Localization and Sentence Generation task bench-
117

[5] painting.n.01[6] curtain.n.01
[1] cabinet.n.01[2] bed.n.01
[4] male child.n.01
[0] cabinet.n.01
[3] blanket.n.01
[7] book.n.01
Figure 1: We present the task of generating textualdescriptions given gold standard labelled bound-ing boxes as input. This allows researchers tofocus on the text generation aspects of the im-age description generation task, rather than deal-ing with the noise arising from visual detection.This task also allows us to evaluate specific phasesof the conventional generation pipeline, providinginsights into which specific phases of the genera-tion pipeline contribute to the performance of animage description generation system.
marking challenge (Villegas et al., 2015; Gilbertet al., 2015). More specifically, we assume thatperfectly labelled object instances and their local-isations are available to image description genera-tion systems, as done in Elliott and Keller (2013)and Yatskar et al. (2014). Given this knowledge,we would like to evaluate how well image descrip-tion generation systems perform through the vari-ous stages of Natural Language Generation (Reiterand Dale, 2000): content determination (what ob-jects to describe), microplanning (how to describeobjects) and realisation (generating the completesentence). This pilot task is an attempt at en-couraging fine-grained evaluation specifically forimage descriptions, compared to general-purposemetrics like METEOR (Denkowski and Lavie,2014) that evaluates text at a global, coarse-grained level. For our pilot, we concentrated onjust one fine-grained metric: a content selectionmeasure to evaluate how well a text generationsystem selects the correct object instances to bementioned in the resulting image description.
A dataset has been introduced for this partic-ular challenge. This paper will not discuss ingreat detail how the dataset has been collected andannotated; we instead refer readers to Gilbert etal. (2015) for more details about the challenge.
The main purpose of this paper, instead, is to: (i)present and discuss the task of generating imagedescriptions with a gold standard visual input; (ii)propose a fine-grained metric specifically for eval-uating the content selection capabilities of imagedescription generation systems; (iii) introduce sev-eral baselines for this task and evaluate the base-lines using the proposed fine-grained metric.
Overview. In section 2, we discuss the motiva-tions for introducing the pilot task and the fine-grained metric in the ImageCLEF 2015 challenge,positioning them in relation to existing work. Insection 3, we describe the task of generating im-age descriptions given gold standard visual inputs,along with a discussion on evaluating image de-scription generation systems with regards to theircontent selection abilities. Section 4 presents sev-eral baselines for this task, while section 5 eval-uates these baselines using the proposed contentselection metric. Finally, we discuss further chal-lenges with the proposed task, and introduce pos-sible fine-grained metrics to be considered in thefuture.
2 Motivation and Related Work
There are currently three main groups of ap-proaches to generating image descriptions. Themost common and intuitive paradigm is theknowledge-based, generative approach that takesan image as input, detects instances of pre-definedobject categories in the image using a visual recog-niser, and then reasons about the detected objectsto generate a novel textual description (Yao et al.,2010; Kulkarni et al., 2011; Yang et al., 2011;Li et al., 2011; Mitchell et al., 2012). However,these approaches are constrained to a limited num-ber of categories, for example 20 in Kulkarni et al.(2011). We found that these approaches are gener-ally sensitive to errors from visual input detection,as such errors tend to propagate and accumulatethrough the generation pipeline. The problem isaccentuated when scaling up to a larger numberof categories (e.g. 1000), where it becomes diffi-cult to reason about what to describe amongst thecandidate instances produced by the noisy visualdetectors. Thus, generating image descriptionswith gold standard visual input allows researchersto concentrate on the sentence generation aspectswithout being bogged down by the complicationsof the vision aspects of the task.
The second group of work revolves around de-
118

[4] hair.n.01[2] woman.n.01
[0] dress.n.01
[3] car.n.01
[6] signboard.n.01
[1] wheel.n.01[5] boot.n.01
A [woman]2 in a white [dress]0 and gold [boots]5 leaning on a [car]3 .
A [woman]2 poses along a [car]3 .
[woman]2 dressed in white with gold [boots]5 poses next to a police [car]3.
A [woman]2 dressed in white leans against a white [car]3 .
A [woman]2 is leaning against a [car]3.
A [woman]2 with gold [boots]5 leans against an Indy pace [car]3 .
A blonde [woman]2 wearing gold shiny [boots]5 , a white [top]0 and shortwhite skirt is leaning on a [car]3 .
Figure 2: An example image and its seven corresponding textual descriptions from the developmentdataset, with bounding box annotations labelled with WordNet concepts, and the correspondence ofbounding boxes to entity mentions in the descriptions. For example, [woman]2 in the first sentencerefers to bounding box ID [2] in the image, and [dress]0 corresponds to bounding box ID [0]. Correspon-dence is annotated at word level rather than at phrase level to avoid possible complications with multiplecorrespondences within the same phrase (woman in a white dress).
scription generation by retrieving existing textualdescriptions from similar images. A common ap-proach would be to map text and images to a com-mon meaning space (Farhadi et al., 2010; Ho-dosh et al., 2013; Socher et al., 2014) or by usingsome similarity measure (Ordonez et al., 2011).Although such methods produce descriptions thatare more expressive, they rely on a large amountof training data, and are unable to produce novelsentences. There have been attempts at retrievingonly text fragments and combining them to gen-erate novel descriptions (Kuznetsova et al., 2012;Kuznetsova et al., 2014) or by pruning irrelevantfragments for better generalisation (Kuznetsova etal., 2013). However, the resulting descriptionsmay still be pure ‘guesswork’ and may referencetext fragments that are irrelevant to image content.
Most recently, work using deep learningapproaches has produced state-of-the-art re-sults (Karpathy and Fei-Fei, 2015; Donahue et al.,2015; Vinyals et al., 2015), by utilising Convo-lutional Neural Networks (CNN) (Krizhevsky etal., 2012; Razavian et al., 2014) as image features,and a Recurrent Neural Network (RNN) (Mikolovet al., 2010) for language modelling, and learningto generate descriptions jointly from images andtheir descriptions. The advantages of such modelsare that they cope better with noisy visual detec-tions, and that the RNN language models are ca-
pable of modelling long range dependencies. Themain disadvantages are (i) it is difficult to inspectwhat has been learnt by the model and hence togain insight into what is working or not workingin the system; (ii) these methods are dependent onimage datasets aligned with sentences as learningis performed in a joint manner. The latter limita-tion means new datasets need to be produced evenfor small changes in the task, such as generatingdescriptions that are more or less detailed, or inmore or less simplified language (e.g. for chil-dren) or have a specific information focus (say, fo-cussing on buildings versus people in an image fora particular application). Thus, knowledge-based,generative approaches may have an advantage inthis respect, as there is no need for aligned image-text datasets, since visual detection and sentencegeneration are independent, allowing the languagemodel to be tuned at surface realisation stages.
Image description generation with gold stan-dard input. As discussed, knowledge-based,generative approaches are sensitive to visual de-tection input errors. Therefore, previous work hasproposed circumventing the problem by provid-ing gold standard annotations as input to descrip-tion generation systems. Elliott and Keller (2013)provide region annotations along with spatial re-lations between region instances. Yatskar et al.(2014) also provide gold standard region anno-
119

tations, as well as fine-grained region propertiessuch as attributes, parts, and activities. Zitnick andParikh (2013) take a unique approach of generat-ing scenes from clipart as an abstraction to realworld images to address the issue of noisy input.Our work takes a similar direction as Elliott andKeller (2013) and Yatskar et al. (2014), but withbounding boxes as gold standard input, and withan emphasis on fine-grained evaluation of imagedescription generation systems.
Evaluation of image description generationsystems. Existing image description generationsystems are most commonly evaluated using au-tomatic evaluation metrics such as BLEU (Pap-ineni et al., 2002), ROUGE (Lin, 2004), ME-TEOR (Denkowski and Lavie, 2014) and mostrecently CIDEr (Vedantam et al., 2015). How-ever, such global measures only allow evalua-tion of image description generation systems asa whole, without being able to ascertain whichparts of the generation process, or components ofthe generation system, are responsible for perfor-mance gains or losses. Although evaluations basedon human judgments could provide a more fine-grained metric (Yang et al., 2011; Mitchell et al.,2012; Kuznetsova et al., 2012), they are expensiveand difficult to scale. We propose instead to ex-ploit the pipeline of knowledge-based, generativeapproaches to generation, allowing us to inspectspecific capabilities of image generation systemsby means of evaluation with fine-grained metrics.Rather than just evaluating image description gen-eration extrinsically with a global evaluation mea-sure, we isolate evaluation of different phases ofdescription generation, and treat each phase as afirst-class citizen.
3 Task and Evaluation Measure
As mentioned above, we introduced as a bench-marking challenge the task of generating imagedescriptions for 450 test images given gold stan-dard, labelled bounding box annotations as input(Figure 1). The category labels were restricted to251 WordNet synsets selected specifically for thechallenge. To enable evaluation with our proposedfine-grained metric, participants were also askedto annotate, within their generated descriptions,the bounding box ID to which a term in the de-scription corresponds. A development dataset of500 images was provided with labelled boundingbox annotations and correspondence annotations
between textual terms and bounding boxes. Fig-ure 2 shows an example annotation of boundingboxes and the correspondences between bound-ing box instances and terms in the image descrip-tions. Note that correspondence was annotated atword level (unigram) rather than at phrase level(higher-order n-grams) to avoid possible compli-cations with multiple correspondences within thesame phrase (woman in a white dress).
3.1 Fine-grained Evaluation Metric
As a pilot, we propose a fine-grained metric toevaluate the content selection capabilities of animage description system. This content selectionmetric is the F1 score averaged across all 450 testimages, where each F1 score is computed from theprecision and recall averaged over all gold stan-dard descriptions for the image.
Formally, let I = {I1, I2, ...IN} be the set oftest images. Let GIi = {GIi
1 , GIi2 , ..., G
IiM} be
the set of gold standard descriptions for image Ii,where each GIi
m is the set of unique bounding boxinstances referenced in gold standard descriptionm of image Ii. Let SIi be the set of unique bound-ing box instances referenced by the participant’sgenerated sentence for image Ii. The precisionP Ii for test image Ii is computed as:
P Ii =1
M
M∑
m
|GIim ∩ SIi ||SIi | (1)
where |GIim ∩ SIi | is the number of unique
bounding box instances referenced in both thegold standard description and the generated sen-tence, and M is the number of gold standard de-scriptions for image Ii.
Similarly, the recall RIi for test image Ii is com-puted as:
RIi =1
M
M∑
m
|GIim ∩ SIi ||GIi
m|(2)
The content selection score for image Ii, F Ii , iscomputed as the harmonic mean of P Ii and RIi :
F Ii = 2× P Ii ×RIi
P Ii +RIi(3)
The final P , R and F scores are computed as themean P , R and F scores across all test images.
The advantage of the macro-averaging processin equations (1) and (2) is that it implicitly cap-tures the relative importance of the bounding box
120

instances based on how frequently they occuracross the gold standard descriptions. For exam-ple, in Figure 2, both woman and car are ref-erenced in all seven gold standard descriptions,while boot is mentioned four times and dresstwice. Thus, a generated description that refer-ences woman and car will naturally result in ahigher score than one that references only womanand dress.
Note that for this metric, we are only concernedwith evaluating the generation system’s contentselection capabilities, rather than its referring ex-pression generation. As such, systems are freeto generate any referring expression for each se-lected bounding box instance. We consider theevaluation of referring expressions as a potentiallyseparate fine-grained evaluation task to be intro-duced in the future. In addition, we do not evalu-ate terms outside those that refer to bounding boxinstances, and as for the pilot task of the challengeuse the global METEOR metric to cover evalua-tion of other aspects of image description genera-tion.
4 Generating Descriptions: Baselines
We propose a set of baselines for the image de-scription generation task, or more specifically thecontent selection task. These allow us to testthe proposed fine-grained content selection met-ric (Section 3.1) and to gain some insights intowhat features might inform content selection. Thebaselines use visual and textual cues to select thebounding box instances to be described in the textto be generated.
4.1 Generation based on Visual Cues
Stratos et al. (2012) found that the size and posi-tion of visual entities in an image, to a certain ex-tent, plays a part in determining what is mentionedin the corresponding description. As such, we con-sider two baselines based on different visual cues:(i) bounding box size (bigger objects have higherlikelihood of being mentioned); (ii) distance of thecentroid of the bounding box to the centre of theimage (central objects have higher likelihood ofbeing mentioned). For each test image, boundingboxes instances are sorted based on these visualcues, and a fixed threshold used to limit the num-ber of instances to be selected for sentence gener-ation. We will explore different thresholds in ourexperiments in Section 5.
1 2 3 4 5 6 7 8 9 10 11 12 13 14 15
k (maximum number of instances)
0.0
0.1
0.2
0.3
0.4
0.5
0.6
F
BigramUnigramBounding Box SizeBounding Box PositionRandom
Figure 3: The content selection score, F , evalu-ated on the proposed baselines at varying levels ofk (maximum number of instances per sentence).Standard deviations are omitted for clarity, but areincluded in Table 1.
4.2 Generation based on Textual Priors
We also consider baselines based on textual pri-ors, as Stratos et al. (2012) also showed that thecategory of the object play a role in determiningwhether it will be mentioned in the correspondingtextual description.
For the first baseline, we consider as a prior uni-gram counts of concepts that have been referencedto a bounding box in the gold standard descrip-tions from the development set. For each test im-age, bounding boxes are sorted by the frequencyof their concept labels in the development set, i.e.frequently mentioned concepts have higher prece-dence.
We also consider a more sophisticated baselinebased on bigram sequences, where a concept is se-lected based on how likely it is to be referencedimmediately after another concept, i.e. there areno other terms referencing a bounding box in be-tween. For instance, for the first sentence in Fig-ure 2, we consider woman to be followed by dress,dress followed by boot, and boot followed by car,but not woman followed by car or boot. Con-cept selection is performed in a greedy fashion,by choosing from the pool of bounding boxes foreach image, the concept that is most likely to occurfirst in a sentence, followed by the concept that ismost likely to occur given the previously selectedconcept. The selection process terminates whenno remaining concept from the candidate pool islikely to follow the previously selected concept.
121

1 2 3 4 5 6 7 8 9 10 11 12 13 14 15
k (maximum number of instances)
0.0
0.1
0.2
0.3
0.4
0.5
0.6
0.7
0.8
0.9
1.0
P (
solid
lin
e)
and R
(dash
ed lin
e)
BigramUnigramRandom
(a) Baselines based on textual priors
1 2 3 4 5 6 7 8 9 10 11 12 13 14 15
k (maximum number of instances)
0.0
0.1
0.2
0.3
0.4
0.5
0.6
0.7
0.8
0.9
1.0
P (
solid
lin
e)
and R
(dash
ed lin
e)
Bounding Box SizeBounding Box PositionRandom
(b) Baselines based on visual cues
Figure 4: The precision P (solid lines) and recall R (dashed lines), as evaluated on the proposed baselinesat varying levels of k. Again, error bars are omitted for clarity, but are included in Table 1.
For all baselines, we select the first term amongthe synonyms of the WordNet synset to generatethe referring expression for each concept.
4.3 Function Words
Our metric only evaluates the content selectionprocess and ignores everything else. However,for completeness and in the spirit of generatingcomplete descriptions, we attempt to connect se-lected concept terms with randomly selected func-tion words or phrases. The phrases are selected tobe a random word from a predefined list of prepo-sitions and conjunctions, followed by an optionalarticle the.
5 Experimental Results
The generation systems described in Section 4were evaluated using the proposed content selec-tion metric (Section 3.1). We also compared theproposed systems to a baseline that selects bound-ing boxes at random, up to a pre-defined thresh-old k of the maximum allowed number of bound-ing boxes per image. We explore different valuesof this threshold by varying k from 1 to 15. Wetake min(k,Nbox) for images with fewer than kbounding boxes, where Nbox is the total numberof bounding boxes for the image.
As an upper bound to how well humans performcontent selection, we evaluated the gold standarddescriptions by evaluating one description againstthe other descriptions of the image and repeatingthe process for all descriptions. The upper boundis computed to be F = 0.74 ± 0.12, with P =0.77± 0.11 and R = 0.77± 0.11.
Figure 3 shows the F -scores of our proposedgeneration systems. Firstly, we examine the ef-fects of varying the threshold k on the number ofinstances to be selected. The F -score peaks at kbetween 3 and 4 across all systems except the ran-dom baseline, and then drops or remains stagnantbeyond that. Figure 4 gives an insight about thisobservation when the precision P and recall R areexamined separately. As expected, P decreaseswhile R increases when k is increased. The twographs intersect at about k between 3 to 4, sug-gesting that these values are an optimal tradeoffbetween precision and recall (the mean number ofunique instances per description is 2.89 in the de-velopment dataset).
Comparing the baselines based on visual andtextual cues, the F -score in Figure 3 suggests thatbaselines using textual cues perform better whenk is small, and visual cues perform better withlarger k’s. However, Figure 4 gives a clearer pic-ture, where the bigram-based system obtained thebest precision regardless of k (Figure 4a), whilethe systems based on bounding box cues relied onthe increased recall when increasing k to obtain ahigh F -score (Figure 4b). Note that the bigram-based generation system is less sensitive to largerk’s as the model itself contains an internal stop-ping criterion when no suitable concept is likelyto follow a selected concept, resulting in a lowerbut stable recall rate compared to other systems,when k is increased. Figure 5 shows some exam-ple sentences generated by our baseline systems,for k=3.
We can infer from the results that (i) using prior
122

knowledge on the ordering of concepts (i.e. bi-grams) is helpful for concept selection; (ii) fre-quency of concepts (i.e. unigrams) are helpfulwhen there are only one or two instances to bedescribed, possibly because the remaining objectsare not mentioned as frequently as the main actors;(iii) visual cues are helpful for concept selection,although the precision is reduced as k increases.
5.1 Combining Textual and Visual Priors
We also explored combining textual priors andvisual cues, which could potentially produce astronger baseline. This is done by re-ranking thebounding boxes, for each image, by the averagerank from both systems. In the case of the bigram-based system, bounding boxes that are not selectedare all assigned an equal rank: 0.5 × ((Nbox +1) − Ns) + Ns, where Nbox is the number of allbounding boxes for the image and Ns the numberof bounding boxes selected by the bigram-basedsystem. For example, if only 3 out of 9 bound-ing boxes are selected (and assigned ranks 1, 2and 3 respectively), then the remaining 6 bound-ing boxes are all assigned equal rank 6.5. Fig-ure 6 compares the F -scores of systems combin-ing textual priors (unigram or bigram) and visualcues (bounding box position) at k=3 and k=4; weomitted bounding box size as the results are simi-lar to bounding box position. Combining unigramand bounding box position did not significantlyimprove the F -score compared to using bound-ing box position alone, at k=3 and k=4. As seenearlier, the performance of the unigram-based sys-tem at these k’s is much lower than systems basedon visual cues. The combination of bigram andbounding box position, however, seems to yieldslightly improved performance at these k’s. Thisis likely due to the bigram-based system providinghigher precision and the system based on visualcues providing better recall. This shows that com-bining textual and visual priors may be beneficialwhen they complement each other.
6 Discussion and Future Work
We presented the task of generating image de-scriptions from gold standard labelled boundingboxes as input to a text generation system. We alsoproposed a fine-grained evaluation metric specifi-cally to evaluate the content selection capabilitiesof the image description generation system, whichmeasures how well the system selects the concepts
unig
ram
(k=
3)
bbox
posi
tion (
k=3)
com
bin
ed (
k=3)
unig
ram
(k=
4)
bbox
posi
tion (
k=4)
com
bin
ed (
k=4)
big
ram
(k=
3)
bbox
posi
tion (
k=3)
com
bin
ed (
k=3)
big
ram
(k=
4)
bbox
posi
tion (
k=4)
com
bin
ed (
k=4)
model
0.3
0.4
0.5
0.6
0.7
0.8
F
Figure 6: The content selection score, F , whencombining textual priors and visual cues. For textpriors, we compare both unigram and bigram pri-ors. For visual cues, we show only the results forbounding box position as using bounding box sizeyields similar results. We compare the combinedbaselines at k=3 and k=4.
to be described compared against a set of human-authored reference descriptions. Several baselineswere proposed to demonstrate the proposed metricon the task. We found that selecting a maximum of3 to 4 instances is optimal for this dataset, and thatboth text and visual cues play a part in the contentselection process.
Further challenges can be observed for the pro-posed generation task based solely on gold stan-dard visual inputs:
Bounding boxes. Bounding boxes labelled withconcepts may be a good starting point for a ‘clean’input task, but may be somewhat uninformative asimportant visual information is discarded in theprocess that might prove useful for the genera-tion process. A possible solution would be to en-rich the bounding box inputs with more informa-tion, either as attributes (adjectives, verbs etc.) ordirectly using visual features. However, manu-ally annotating such fine-grained information is anonerous task.
Suitability of metrics. Another possible issuewith the proposed task is that it might be prob-lematic to assume that all image description gen-eration systems will be using a common pipeline.With the large variation in how image descriptiongeneration systems are constructed, it may be dif-ficult to constrain and expect systems to be usingthe same architecture that will enable us to evalu-
123

[8] hallway.n.01
[7] dog.n.01[6] dog.n.01
[5] dog.n.01
[4] vest.n.01
[3] wall.n.01
[2] floor.n.01
[1] necktie.n.01
[0] dog.n.01
random: [F=0.04] [Wall]3 among [necktie]1 underneath [floor]2 .bbox pos: [F=0.00] [Hallway]8 below the [wall]3 near the [floor]2 .bbox size: [F=0.39] [Hallway]8 behind the [dog]0 underneath the [wall]3 .unigram: [F=0.05] [Wall]3 near [floor]2 with the [dog]5 .bigram: [F=0.51] [Dog]5 against [dog]0 beside the [dog]6 .
[11] lighter.n.02
[10] window.n.01
[9] park.n.01
[8] temple.n.01
[7] wheel.n.01
[6] window.n.01
[5] river.n.01
[4] wheel.n.01
[3] tree.n.01
[2] flag.n.01
[1] car.n.01
[0] flag.n.01
random: [F=0.05] [Park]9 behind [wheel]7 underneath the [window]6 .bbox pos: [F=0.59] [Park]9 on the [car]1 below [river]5 .bbox size: [F=0.44] [Park]9 behind the [car]1 against the [tree]3 .unigram: [F=0.42] [Tree]3 beneath [car]1 by [window]6 .bigram: [F=0.71] [Car]1 inside [flag]0 underneath the [flag]2 .
[8] door.n.01
[7] table.n.02
[6] bottle.n.01
[5] bottle.n.01[4] wall.n.01
[3] door.n.01[2] wall.n.01
[1] floor.n.01
[0] bicycle.n.01random: [F=0.43] [Wall]4 inside [door]3 around the [bicycle]0 .bbox pos: [F=0.79] [Bicycle]0 in [floor]1 below [wall]2 .bbox size: [F=0.79] [Bicycle]0 on [floor]1 with [wall]2 .unigram: [F=0.34] [Table]7 in the [wall]4 around [wall]2 .bigram: [F=0.03] [Table]7 near [door]3 .
[4] mouse.n.01[3] field.n.01
[2] hand.n.01
[1] gun.n.01
[0] helmet.n.01
random: [F=0.66] [Mouse]4 inside [field]3 against [helmet]0 .bbox pos: [F=0.75] [Field]3 and [mouse]4 beside the [gun]1 .bbox size: [F=0.75] [Field]3 along [mouse]4 underneath [gun]1 .unigram: [F=0.31] [Field]3 inside [hand]2 below [helmet]0 .bigram: [F=0.00] [Hand]2 .
[7] picture.n.01
[6] vest.n.01 [5] scarf.n.01
[4] train.n.01
[3] hat.n.01
[2] man.n.01[1] face.n.01
[0] book.n.01
random: [F=0.39] [Vest]6 at [hat]3 behind the [picture]7 .bbox pos: [F=0.49] [Picture]7 on [man]2 beside the [train]4 .bbox size: [F=0.49] [Picture]7 among [man]2 on the [train]4 .unigram: [F=0.77] [Man]2 below the [hat]3 at [book]0 .bigram: [F=0.77] [Man]2 around the [hat]3 along the [book]0 .
Figure 5: Example image descriptions generated by our baselines (k = 3).
ate them with such fine-grained metrics.
Future work with fine-grained metrics. Al-though we only consider one metric to evalua-tion the content selection capabilities of genera-tion systems, further fine-grained metrics can beintroduced to evaluate different components ofthe generation pipeline. Some examples includecontent ordering, lexicalisation or referring ex-pression generation of concepts (and/or their at-tributes), evaluating the appropriateness of verbs,predicates and prepositions, and surface realisa-tion.
Future work on image description generation.In this paper, we presented several baselines basedon different textual and visual priors, and also ex-plored combining cues from both text and vision.Future work on image description generationcould involve stronger cues, for example fromco-occurrences and spatial relationships betweenmultiple objects.
We believe that the introduction of a fine-grained approach to evaluating image description
generation tasks can encourage further growth inthis area, linking further research between com-puter vision and natural language generation.
Acknowledgments
This work has been supported by the EU CHIST-ERA D2K 2011 Visual Sense project, EPSRCgrant reference: EP/K019082/1.
ReferencesMichael Denkowski and Alon Lavie. 2014. Meteor
universal: Language specific translation evaluationfor any target language. In Proceedings of the EACL2014 Workshop on Statistical Machine Translation.
Jeffrey Donahue, Lisa Anne Hendricks, Sergio Guadar-rama, Marcus Rohrbach, Subhashini Venugopalan,Kate Saenko, and Trevor Darrell. 2015. Long-termrecurrent convolutional networks for visual recogni-tion and description. In Proceedings of the IEEEConference on Computer Vision & Pattern Recogni-tion.
Pinar Duygulu, Kobus Barnard, Nando de Freitas, andDavid A. Forsyth. 2002. Object recognition as ma-chine translation: Learning a lexicon for a fixed im-
124

P R F
Upper bound 0.77± 0.11 0.77± 0.11 0.74± 0.12
Ran
dom
k = 1 0.19± 0.32 0.06± 0.12 0.08± 0.16k = 2 0.21± 0.24 0.12± 0.17 0.15± 0.19k = 3 0.20± 0.20 0.18± 0.22 0.18± 0.20k = 4 0.21± 0.18 0.26± 0.25 0.22± 0.20k = 5 0.20± 0.17 0.29± 0.27 0.23± 0.19k = 6 0.21± 0.17 0.36± 0.29 0.25± 0.19k = 7 0.21± 0.15 0.43± 0.31 0.27± 0.18k = 8 0.21± 0.15 0.48± 0.31 0.28± 0.18k = 9 0.21± 0.15 0.50± 0.32 0.28± 0.18k = 10 0.21± 0.14 0.56± 0.31 0.29± 0.17
Bou
ndin
gB
oxPo
sitio
n k = 1 0.57± 0.41 0.21± 0.19 0.30± 0.25k = 2 0.56± 0.27 0.40± 0.25 0.45± 0.25k = 3 0.53± 0.20 0.54± 0.26 0.52± 0.21k = 4 0.49± 0.16 0.65± 0.24 0.55± 0.17k = 5 0.46± 0.14 0.72± 0.23 0.54± 0.15k = 6 0.42± 0.13 0.77± 0.21 0.53± 0.14k = 7 0.39± 0.13 0.81± 0.19 0.51± 0.12k = 8 0.36± 0.12 0.84± 0.18 0.49± 0.12k = 9 0.34± 0.12 0.87± 0.16 0.47± 0.12k = 10 0.32± 0.12 0.89± 0.15 0.46± 0.12
Bou
ndin
gB
oxSi
ze
k = 1 0.56± 0.41 0.21± 0.19 0.30± 0.25k = 2 0.57± 0.27 0.41± 0.25 0.46± 0.25k = 3 0.53± 0.20 0.55± 0.26 0.53± 0.21k = 4 0.50± 0.16 0.66± 0.24 0.55± 0.17k = 5 0.46± 0.14 0.73± 0.22 0.55± 0.15k = 6 0.43± 0.14 0.78± 0.20 0.53± 0.13k = 7 0.39± 0.13 0.82± 0.19 0.51± 0.12k = 8 0.37± 0.13 0.85± 0.17 0.50± 0.12k = 9 0.34± 0.13 0.87± 0.16 0.48± 0.12k = 10 0.32± 0.12 0.89± 0.15 0.46± 0.12
Uni
gram
k = 1 0.69± 0.40 0.24± 0.18 0.34± 0.24k = 2 0.57± 0.29 0.36± 0.22 0.43± 0.23k = 3 0.48± 0.22 0.45± 0.23 0.45± 0.20k = 4 0.43± 0.19 0.53± 0.23 0.46± 0.17k = 5 0.40± 0.17 0.59± 0.22 0.45± 0.16k = 6 0.37± 0.16 0.65± 0.22 0.45± 0.15k = 7 0.35± 0.15 0.70± 0.22 0.44± 0.14k = 8 0.33± 0.14 0.74± 0.22 0.44± 0.14k = 9 0.31± 0.14 0.78± 0.21 0.43± 0.14k = 10 0.30± 0.13 0.82± 0.20 0.42± 0.13
Big
ram
k = 1 0.85± 0.29 0.31± 0.17 0.44± 0.21k = 2 0.65± 0.24 0.43± 0.21 0.50± 0.21k = 3 0.55± 0.21 0.50± 0.22 0.50± 0.19k = 4 0.50± 0.21 0.54± 0.23 0.50± 0.19k = 5 0.47± 0.21 0.57± 0.23 0.49± 0.19k = 6 0.46± 0.20 0.59± 0.23 0.49± 0.18k = 7 0.45± 0.20 0.59± 0.23 0.48± 0.18k = 8 0.44± 0.20 0.60± 0.23 0.48± 0.18k = 9 0.44± 0.20 0.60± 0.24 0.48± 0.18k = 10 0.44± 0.20 0.61± 0.23 0.48± 0.18
Table 1: P , R and F scores (with standard devia-tions) of the content selection metric, as evaluatedon different baselines at varying levels of k (1 to10).
age vocabulary. In Proceedings of the EuropeanConference on Computer Vision, pages 97–112.
Desmond Elliott and Frank Keller. 2013. Im-age description using visual dependency represen-tations. In Proceedings of the Conference on Em-pirical Methods in Natural Language Processing(EMNLP).
Ali Farhadi, Mohsen Hejrati, Amin Sadeghi, PeterYoung, Cyrus Rashtchian, Julia Hockenmaier, andDavid Forsyth. 2010. Every picture tells a story:Generating sentences for images. In Proceedings ofthe European Conference on Computer Vision.
Andrew Gilbert, Luca Piras, Josiah Wang, Fei Yan,Emmanuel Dellandrea, Robert Gaizauskas, Mauri-cio Villegas, and Krystian Mikolajczyk. 2015.Overview of the ImageCLEF 2015 Scalable ImageAnnotation, Localization and Sentence Generationtask. In CLEF2015 Working Notes, CEUR Work-shop Proceedings, Toulouse, France, September 8-11. CEUR-WS.org.
Micah Hodosh, Peter Young, and Julia Hockenmaier.2013. Framing image description as a ranking task:Data, models and evaluation metrics. Journal of Ar-tificial Intelligence Research (JAIR), 47(1):853–899,May.
Sergey Ioffe and Christian Szegedy. 2015. Batchnormalization: Accelerating deep network train-ing by reducing internal covariate shift. CoRR,abs/1502.03167.
Andrej Karpathy and Li Fei-Fei. 2015. Deep visual-semantic alignments for generating image descrip-tions. In Proceedings of the IEEE Conference onComputer Vision & Pattern Recognition.
Alex Krizhevsky, Ilya Sutskever, and Geoffrey E. Hin-ton. 2012. Imagenet classification with deep con-volutional neural networks. In F. Pereira, C.J.C.Burges, L. Bottou, and K.Q. Weinberger, editors,Advances in Neural Information Processing Systems25, pages 1097–1105. Curran Associates, Inc.
Girish Kulkarni, Visruth Premraj, Sagnik Dhar, SimingLi, Yejin Choi, Alexander C. Berg, and Tamara L.Berg. 2011. Baby talk: Understanding and generat-ing image descriptions. In Proceedings of the IEEEConference on Computer Vision & Pattern Recogni-tion.
Polina Kuznetsova, Vicente Ordonez, Alexander Berg,Tamara Berg, and Yejin Choi. 2012. Collective gen-eration of natural image descriptions. In Proceed-ings of the 50th Annual Meeting of the Associationfor Computational Linguistics (Volume 1: Long Pa-pers), pages 359–368, Jeju Island, Korea, July. As-sociation for Computational Linguistics.
Polina Kuznetsova, Vicente Ordonez, Alexander Berg,Tamara Berg, and Yejin Choi. 2013. General-izing image captions for image-text parallel cor-pus. In The 51st Annual Meeting of the Associa-tion for Computational Linguistics - Short Papers,
125

Sofia, Bulgaria, August. Association for Computa-tional Linguistics.
Polina Kuznetsova, Vicente Ordonez, Tamara L. Berg,and Yejin Choi. 2014. Treetalk: Composition andcompression of trees for image descriptions. In Pro-ceedings of the Conference on Empirical Methods inNatural Language Processing (EMNLP).
Siming Li, Girish Kulkarni, Tamara L. Berg, Alexan-der C. Berg, and Yejin Choi. 2011. Compos-ing simple image descriptions using web-scale n-grams. In Computational Natural Language Learn-ing (CoNLL).
Chin-Yew Lin. 2004. Rouge: A package for automaticevaluation of summaries. In Proc. ACL workshop onText Summarization Branches Out, page 10.
Tomas Mikolov, Martin Karafit, Luks Burget, Jan Cer-nock, and Sanjeev Khudanpur. 2010. Recurrentneural network based language model. In TakaoKobayashi, Keikichi Hirose, and Satoshi Nakamura,editors, INTERSPEECH, pages 1045–1048. ISCA.
Margaret Mitchell, Jesse Dodge, Amit Goyal, Kota Ya-maguchi, Karl Stratos, Xufeng Han, Alyssa Mensch,Alex Berg, Tamara Berg, and Hal Daume III. 2012.Midge: Generating image descriptions from com-puter vision detections. In Proceedings of the 13thConference of the European Chapter of the Associa-tion for Computational Linguistics, pages 747–756,Avignon, France, April. Association for Computa-tional Linguistics.
Vicente Ordonez, Girish Kulkarni, and Tamara L. Berg.2011. Im2text: Describing images using 1 millioncaptioned photographs. In Advances in Neural In-formation Processing Systems.
Kishore Papineni, Salim Roukos, Todd Ward, and Wei-Jing Zhu. 2002. Bleu: a method for automaticevaluation of machine translation. In Proceedingsof 40th Annual Meeting of the Association for Com-putational Linguistics, pages 311–318, Philadelphia,Pennsylvania, USA, July. Association for Computa-tional Linguistics.
Ali Sharif Razavian, Hossein Azizpour, Josephine Sul-livan, and Stefan Carlsson. 2014. CNN features off-the-shelf: An astounding baseline for recognition.In IEEE Conference on Computer Vision and Pat-tern Recognition, CVPR Workshops 2014, Colum-bus, OH, USA, June 23-28, 2014, pages 512–519.
Ehud Reiter and Robert Dale. 2000. Building NaturalLanguage Generation Systems. Cambridge Univer-sity Press, New York, NY, USA.
Olga Russakovsky, Jia Deng, Hao Su, Jonathan Krause,Sanjeev Satheesh, Sean Ma, Zhiheng Huang, An-drej Karpathy, Aditya Khosla, Michael S. Bernstein,Alexander C. Berg, and Fei-Fei Li. 2014. Imagenetlarge scale visual recognition challenge. CoRR,abs/1409.0575.
Richard Socher, Andrej Karpathy, Quoc Le, Christo-pher Manning, and Andrew Ng. 2014. Groundedcompositional semantics for finding and describingimages with sentences. Transactions of the Associa-tion for Computational Linguistics, 2:207–218.
Karl Stratos, Aneesh Sood, Alyssa Mensch, XufengHan, Margaret Mitchell, Kota Yamaguchi, JesseDodge, Amit Goyal, Hal Daume III, Alexander C.Berg, and Tamara L. Berg. 2012. Understandingand predicting importance in images. In Proceed-ings of the IEEE Conference on Computer Vision &Pattern Recognition.
Ramakrishna Vedantam, C. Lawrence Zitnick, andDevi Parikh. 2015. Cider: Consensus-based imagedescription evaluation. In The IEEE Conference onComputer Vision and Pattern Recognition (CVPR),June.
Mauricio Villegas, Henning Muller, Andrew Gilbert,Luca Piras, Josiah Wang, Krystian Mikolajczyk,Alba Garcıa Seco de Herrera, Stefano Bromuri,M. Ashraful Amin, Mahmood Kazi Mohammed,Burak Acar, Suzan Uskudarli, Neda B. Marvasti,Jose F. Aldana, and Marıa del Mar Roldan Garcıa.2015. General Overview of ImageCLEF at theCLEF2015 Labs. Lecture Notes in Computer Sci-ence. Springer International Publishing.
Oriol Vinyals, Alexander Toshev, Samy Bengio, andDumitru Erhan. 2015. Show and tell: A neural im-age caption generator. In Proceedings of the IEEEConference on Computer Vision & Pattern Recogni-tion.
Yezhou Yang, Ching Teo, Hal Daume III, and YiannisAloimonos. 2011. Corpus-guided sentence genera-tion of natural images. In Proceedings of the Con-ference on Empirical Methods in Natural LanguageProcessing (EMNLP), pages 444–454. Associationfor Computational Linguistics.
Benjamin Z. Yao, Xiong Yang, Liang Lin, Mun WaiLee, and Song Chun Zhu. 2010. I2t: Image pars-ing to text description. Proceedings of the IEEE,98(8):1485–1508.
Mark Yatskar, Michel Galley, Lucy Vanderwende, andLuke Zettlemoyer. 2014. See no evil, say no evil:Description generation from densely labeled images.In Proceedings of the Third Joint Conference onLexical and Computational Semantics (*SEM 2014),pages 110–120, Dublin, Ireland, August. Associa-tion for Computational Linguistics and Dublin CityUniversity.
C. Lawrence Zitnick and Devi Parikh. 2013. Bring-ing semantics into focus using visual abstraction. InProceedings of the IEEE Conference on ComputerVision & Pattern Recognition.
126
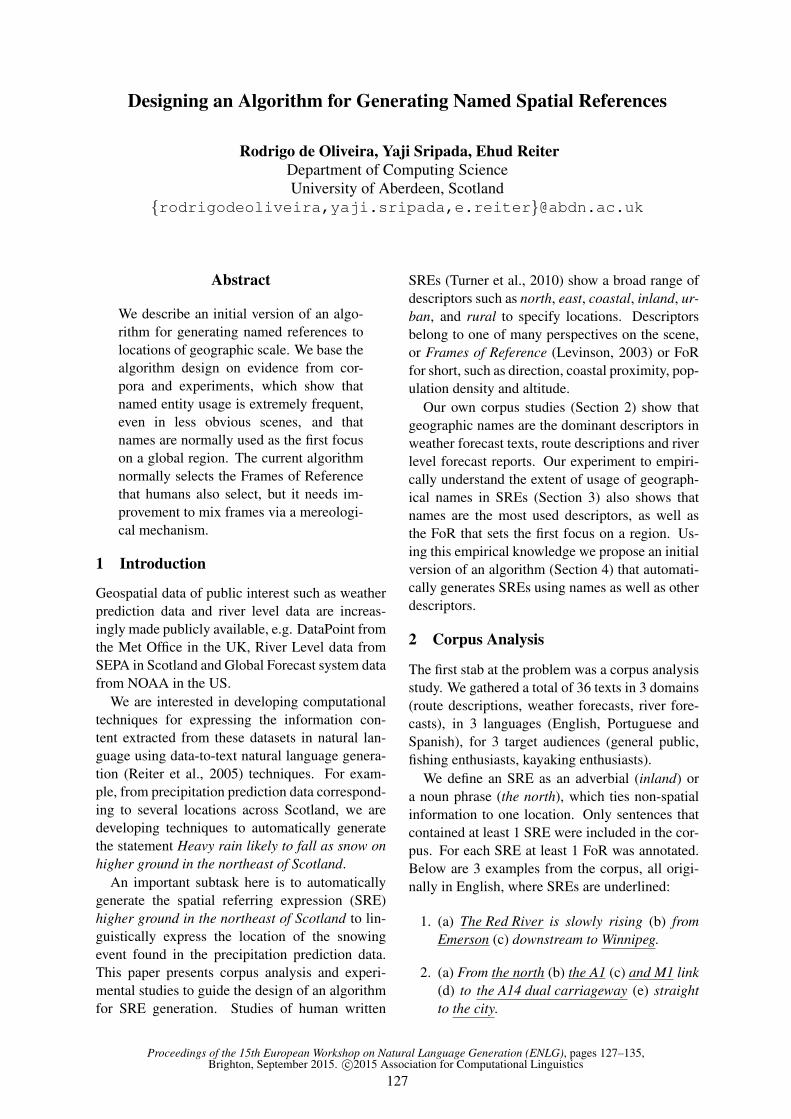
Proceedings of the 15th European Workshop on Natural Language Generation (ENLG), pages 127–135,Brighton, September 2015. c©2015 Association for Computational Linguistics
Designing an Algorithm for Generating Named Spatial References
Rodrigo de Oliveira, Yaji Sripada, Ehud ReiterDepartment of Computing ScienceUniversity of Aberdeen, Scotland
{rodrigodeoliveira,yaji.sripada,e.reiter}@abdn.ac.uk
Abstract
We describe an initial version of an algo-rithm for generating named references tolocations of geographic scale. We base thealgorithm design on evidence from cor-pora and experiments, which show thatnamed entity usage is extremely frequent,even in less obvious scenes, and thatnames are normally used as the first focuson a global region. The current algorithmnormally selects the Frames of Referencethat humans also select, but it needs im-provement to mix frames via a mereologi-cal mechanism.
1 Introduction
Geospatial data of public interest such as weatherprediction data and river level data are increas-ingly made publicly available, e.g. DataPoint fromthe Met Office in the UK, River Level data fromSEPA in Scotland and Global Forecast system datafrom NOAA in the US.
We are interested in developing computationaltechniques for expressing the information con-tent extracted from these datasets in natural lan-guage using data-to-text natural language genera-tion (Reiter et al., 2005) techniques. For exam-ple, from precipitation prediction data correspond-ing to several locations across Scotland, we aredeveloping techniques to automatically generatethe statement Heavy rain likely to fall as snow onhigher ground in the northeast of Scotland.
An important subtask here is to automaticallygenerate the spatial referring expression (SRE)higher ground in the northeast of Scotland to lin-guistically express the location of the snowingevent found in the precipitation prediction data.This paper presents corpus analysis and experi-mental studies to guide the design of an algorithmfor SRE generation. Studies of human written
SREs (Turner et al., 2010) show a broad range ofdescriptors such as north, east, coastal, inland, ur-ban, and rural to specify locations. Descriptorsbelong to one of many perspectives on the scene,or Frames of Reference (Levinson, 2003) or FoRfor short, such as direction, coastal proximity, pop-ulation density and altitude.
Our own corpus studies (Section 2) show thatgeographic names are the dominant descriptors inweather forecast texts, route descriptions and riverlevel forecast reports. Our experiment to empiri-cally understand the extent of usage of geograph-ical names in SREs (Section 3) also shows thatnames are the most used descriptors, as well asthe FoR that sets the first focus on a region. Us-ing this empirical knowledge we propose an initialversion of an algorithm (Section 4) that automati-cally generates SREs using names as well as otherdescriptors.
2 Corpus Analysis
The first stab at the problem was a corpus analysisstudy. We gathered a total of 36 texts in 3 domains(route descriptions, weather forecasts, river fore-casts), in 3 languages (English, Portuguese andSpanish), for 3 target audiences (general public,fishing enthusiasts, kayaking enthusiasts).
We define an SRE as an adverbial (inland) ora noun phrase (the north), which ties non-spatialinformation to one location. Only sentences thatcontained at least 1 SRE were included in the cor-pus. For each SRE at least 1 FoR was annotated.Below are 3 examples from the corpus, all origi-nally in English, where SREs are underlined:
1. (a) The Red River is slowly rising (b) fromEmerson (c) downstream to Winnipeg.
2. (a) From the north (b) the A1 (c) and M1 link(d) to the A14 dual carriageway (e) straightto the city.
127
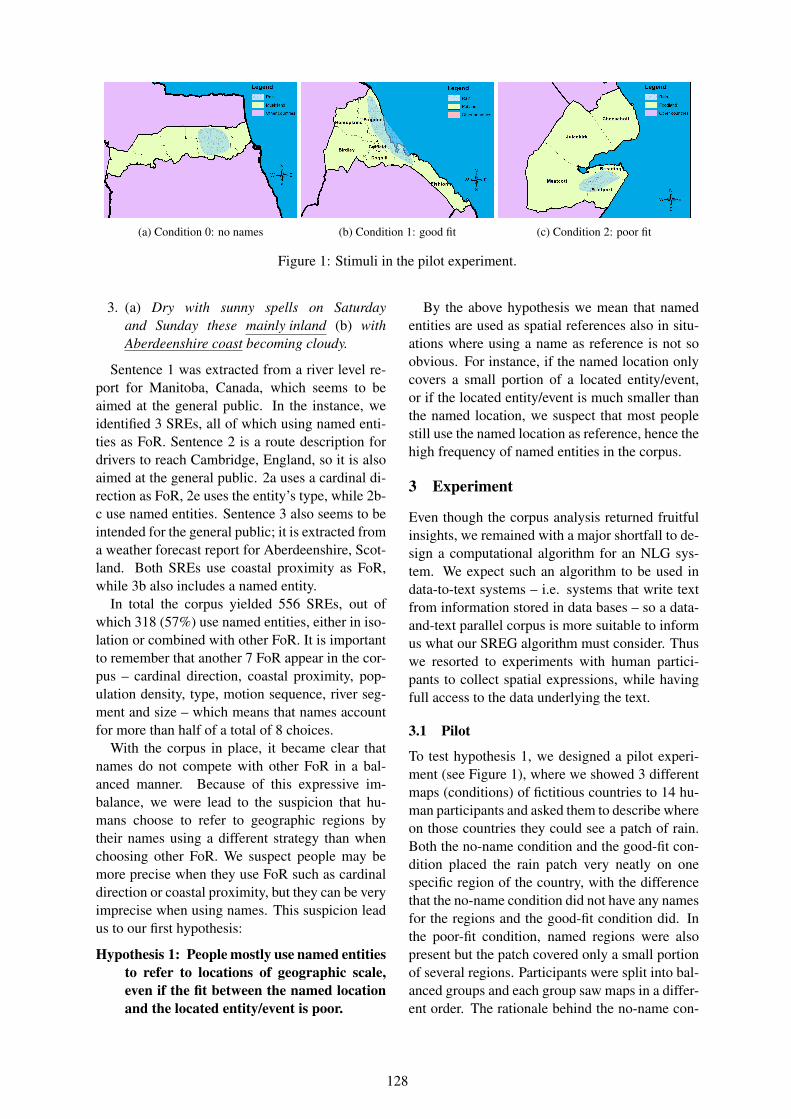
(a) Condition 0: no names (b) Condition 1: good fit (c) Condition 2: poor fit
Figure 1: Stimuli in the pilot experiment.
3. (a) Dry with sunny spells on Saturdayand Sunday these mainly inland (b) withAberdeenshire coast becoming cloudy.
Sentence 1 was extracted from a river level re-port for Manitoba, Canada, which seems to beaimed at the general public. In the instance, weidentified 3 SREs, all of which using named enti-ties as FoR. Sentence 2 is a route description fordrivers to reach Cambridge, England, so it is alsoaimed at the general public. 2a uses a cardinal di-rection as FoR, 2e uses the entity’s type, while 2b-c use named entities. Sentence 3 also seems to beintended for the general public; it is extracted froma weather forecast report for Aberdeenshire, Scot-land. Both SREs use coastal proximity as FoR,while 3b also includes a named entity.
In total the corpus yielded 556 SREs, out ofwhich 318 (57%) use named entities, either in iso-lation or combined with other FoR. It is importantto remember that another 7 FoR appear in the cor-pus – cardinal direction, coastal proximity, pop-ulation density, type, motion sequence, river seg-ment and size – which means that names accountfor more than half of a total of 8 choices.
With the corpus in place, it became clear thatnames do not compete with other FoR in a bal-anced manner. Because of this expressive im-balance, we were lead to the suspicion that hu-mans choose to refer to geographic regions bytheir names using a different strategy than whenchoosing other FoR. We suspect people may bemore precise when they use FoR such as cardinaldirection or coastal proximity, but they can be veryimprecise when using names. This suspicion leadus to our first hypothesis:
Hypothesis 1: People mostly use named entitiesto refer to locations of geographic scale,even if the fit between the named locationand the located entity/event is poor.
By the above hypothesis we mean that namedentities are used as spatial references also in situ-ations where using a name as reference is not soobvious. For instance, if the named location onlycovers a small portion of a located entity/event,or if the located entity/event is much smaller thanthe named location, we suspect that most peoplestill use the named location as reference, hence thehigh frequency of named entities in the corpus.
3 Experiment
Even though the corpus analysis returned fruitfulinsights, we remained with a major shortfall to de-sign a computational algorithm for an NLG sys-tem. We expect such an algorithm to be used indata-to-text systems – i.e. systems that write textfrom information stored in data bases – so a data-and-text parallel corpus is more suitable to informus what our SREG algorithm must consider. Thuswe resorted to experiments with human partici-pants to collect spatial expressions, while havingfull access to the data underlying the text.
3.1 Pilot
To test hypothesis 1, we designed a pilot experi-ment (see Figure 1), where we showed 3 differentmaps (conditions) of fictitious countries to 14 hu-man participants and asked them to describe whereon those countries they could see a patch of rain.Both the no-name condition and the good-fit con-dition placed the rain patch very neatly on onespecific region of the country, with the differencethat the no-name condition did not have any namesfor the regions and the good-fit condition did. Inthe poor-fit condition, named regions were alsopresent but the patch covered only a small portionof several regions. Participants were split into bal-anced groups and each group saw maps in a differ-ent order. The rationale behind the no-name con-
128

ConditionSRE Type
Σname-only other-only name-1st name-2nd both-1st none
no-name 2 86 0 0 0 5 93good-fit 43 3 41 5 1 0 93poor-fit 12 2 72 5 2 0 93
Σ 57 91 113 10 3 5 279
Table 1: Experimental results showing types of SREs per condition. SREs can contain only names, onlyother FoR, none, or mix names with other FoR. When mixed, names can be the first or second focus, or
both types can be first focus.
dition is to certify that people resort to other FoRwhen names are not available.
Curiously, names were not as dominant in thepilot experiment as they are in the corpus. TheFoR used by all participants were names, cardinaldirection (north, south, etc.) and some proximity(coast, border, etc.). In the vast majority of re-sponses (94%), people used multiple FoR to referto the location of the rain patch, which we believehelped balance the usage of FoR across responses.Names were used in 79% of responses in the good-fit condition – proximity 86% and direction 50% –and in the poor-fit condition names were used in64% of responses – direction 79% and proximity57%.
Even though names were not dominant, peoplestill used names in most cases, even in a scenariowhere using a name was not so obvious (the poor-fit condition), speaking in favour of hypothesis 1.After results from the pilot experiment, we couldsee that most responses use a first focus frame (ofreference) and a a second focus frame. Take theSRE coastal areas of Frogdon for instance. Frog-don (a name) indicates the first focus area, whilecoastal areas (proximity) sets a second focus onone particular portion of the first focus area. Wesuspect that most first-focus areas are named re-gions, which leads us to a second hypothesis:
Hypothesis 2: When mixing named entitieswith other FoR, people use named entitiesmostly for first-focus areas and other FoRfor second-focus.
3.2 The main experimentThe above results were not formally verified withstatistical tests because we believe our sample of14 participants was not representative. In orderto test our hypotheses with more statistical vigor,we ran a slightly modified version of the pilot ex-periment on Amazon Mechanical Turk, where 93
participants successfully completed the task. Thedifference from the pilot is that, instead of hav-ing only 1 image per condition, we prepared 2 im-ages for the control condition, 4 for the good-fitcondition and 4 for the poor-fit condition. As inthe pilot, participants saw only 1 image per con-dition, so the system randomly chose a single mapto display in each condition. With multiple imagesavailable in the experiment, we reduced the levelof specificity between stimuli and responses.
Responses varied from single clauses to sen-tences containing 2 or more clauses, or even fullparagraphs containing 2 or more sentences. Weconsidered the entire response as 1 SRE, but sincewe are now interested in names versus non-names,we combined all other FoR that are not named en-tities. We marked SREs with 1 of the 5 followingannotations:
name-only If the SRE only contained named en-tities as spatial references: It will rain inDoghill.
other-only If the SRE only contained non-named-entities as spatial references: Raincan be expected in the south-most region ofMusicland1. There is no other chance of rain.
name-2nd If both names and other FoR wereused, but named entities were used as secondfocus: Throughout the far south of Foodland,going through Meatcott and Fruitport, rain isto be expected.2
1Since we are interested in knowing where in Musiclandit is raining, the descriptor Musicland is tautological, thus notcounted as chosen descriptor to locate the event. Therefore,named entities are also ignored as contributing FoR in thisdescription.
2Here it is not a lexical item that informs us that the namedentities are used as second focus. It is the fact that the a direc-tion (the far south) is used to select a larger sub-region of theglobal region (the country), within which the named regions(Meatcott and Fruitport) exist.
129

name-1st If both names and other FoR were used,but named entities were used as first focus.
both-1st If names and other FoR don’t competefor first focus, but remain on the same level,so the resulting subregion is a union of multi-ple sub-regions. For example: northwesternFruitport... southwest of Breading... easternpart of Meatcott... not in the far northeastor southeast. Fruitport, Breading and Meat-cott are named regions but far north-east andsouth-east are directions. None is a part of theother, so the named areas and not far north-east and south-east complement each other atthe same focus level.
none If no FoR, but only vague descriptors wereused.
Finally we counted all possible combinationsof FoR usage and aligned those with experimen-tal conditions, as displayed in Table 1. The firstintriguing observation is that 5 responses did notuse any FoR, according to our annotation. 2 ofthem used only a quantifier (much, most), 2 onlythe name of the country (Musicland), and 1 usedboth (some parts of Musicland). Using only thename of the country does not successfully com-plete the task, because it does not answer the ques-tion “where in the country will it rain?”. Quan-tifiers were also not annotated as other FoR be-cause they are extremely vague. We were aimingat FoR that help a hearer more precisely identifyreferenced locations.
Even more interesting, 2 SREs created namedentities in the no-name condition, i.e. where noname was available as per task. One participantdecided to name an unnamed subregion of Musi-cland as Drum County and referred to it ‘by itsname’. Although odd, this suggests how peoplestrongly feel the necessity for named entities whendescribing geographies. This is very similar toanother response in the pilot experiment, wherethe participant described one unnamed subregionas the penultimate state before reaching the coast,and later stated in the comments that names shouldbe on the map.
Hypothesis 1 states that people use names witha high frequency in any condition where namesare available. If we exclude the no-name condi-tion from the count, this hypothesis is supportedwith 97% (90/93) of name usage in the good-fit
condition and 98% (91/93) in the poor-fit condi-tion . We did not observe a significant differencein name usage between good-fit and poor-fit con-ditions, χ2 (1,N=186) = 0.21, p = .65.
Hypothesis 2 was also supported, again exclud-ing the no-name condition. People very often(113/126 or 90%) use names as the first-focus areaand other FoR as the second focus-area.
After testing the above hypotheses, we observedthe same phenomenon as identified by Turner andcolleagues (2010): that people resort to other FoRmore often when the fit between (rain) patch andregion is poorer. In the good-fit condition 54%(50/93) of responses used other FoR, while 87%(81/93) of poor-fit responses contain other FoR.This means that there is a significant need for otherFoR when moving from a good-fit to a poor-fit sce-nario, χ2 (1,N=186) = 26.18, p < .001.
3.3 Preliminary conclusions
To date this project has shown evidence that:
• Humans use several FoR when referring togeographical locations.
• Regardless of scenario, named entities are al-most always used.
• Named areas mostly function as a first focusarea, wherein a descriptor of a second FoRcan still be selected.
4 Algorithm
We used the knowledge described above to in-form an algorithm that selects Frames of Refer-ence. The procedure is basically the ContentSe-lector algorithm of the RoadSafe project (Turner,2009), which looks at an event that takes place ina geography and selects one or more frames out ofan array of frames. The input to the algorithm, asfor many geographic information systems, is a setof points with latitude-longitude coordinates andsome other value denoting the status of the pointin some event. In Turner’s sense, a Frame of Ref-erence is a set of descriptors, and a descriptor isa non-overlapping partition of a geographic regionwhere each descriptor can be used to refer to a spe-cific partition. The frame contains all points of thedataset, but each descriptor encompasses a partic-ular subset of points.
For instance, take the US as our global geogra-phy, which contains several thousands of points.
130

The Frame of Reference StateNames contains 50descriptors, one for each US state, so each descrip-tor contains a couple of hundreds of points. Al-together StateNames contains all points that formthe US. Another frame could be CoastalProximity,which is composed of only 2 descriptors, Coastaland Inland, where most points belong to the In-land descriptor and the rest to Coastal. Note that inthis example, all points that belong to the descrip-tor Kansas of the frame StateNames also belongto the descriptor Inland of the frame CoastalProx-imity, but such overlaps are not always true. Outof the points that form the descriptor Texas, somebelong to Inland and others to Coastal.
Following the US example, the high-level goalof the algorithm is to select one or more descrip-tors that best locate a target subset of all the pointsin the US. For instance if our dataset contains a bi-nary variable for “rain” for each point, and we areinterested in describing the location of the “rainingpoints” – or simply answering the question “wherein the US is it raining?” – the algorithm’s taskis to return a set of descriptors that encompassesthe majority of points with rain=true values. Ifthe result is {Colorado, Coast}, the NLG systemwhere the algorithm lives should be able to pro-duce the sentence “it will rain on the Coast and inColorado”.
Turner describes the ContentSelection algo-rithm in detail (p. 122), so below we highlight itsmain steps:
1. Take as input a set of points representing anevent, along with meta-data for Frames ofReference.
2. Count the density of target points for each de-scriptor of each frame.
3. Remove a frame if all its descriptors havenon-zero densities.
4. Of the remaining frames, rank them by a pre-defined preference order.
5. Use the first frame with non-zero densities.
6. Try adding each subsequent frame, if this re-duces the number of false positives.
7. Use the descriptors with non-zero densities ofthe chosen frames.
We take the algorithm and include, first of all,a NamedAreas frame. This however is currently
done in the same fashion as all other frames inthe RoadSafe project. The true conceptual modifi-cation to the original algorithm was the thresholdof density (step 3). RoadSafe fixes this value at0, which means that if all descriptors of a Frameof Reference have at least 1 target point, then thisframe cannot be chosen. We suspect that humansare more lenient when computing density. We be-lieve that humans can choose frames where all de-scriptors have non-zero densities, by focussing ondescriptors with high densities and ignoring de-scriptors with low (yet non-zero) densities. There-fore our version of the algorithm selects a descrip-tor as candidate if it reaches a density threshold,and it ignores a FoR if all its descriptors are can-didates.
4.1 A small-scaled quantitative evaluation
To test how the algorithm currently performs, weran it using 7 weather forecast datasets providedby the UK’s meteorology agency: MetOffice. Thedata contained numerical predictions for a regionin the UK (Grampian), and each dataset also ac-companies a textual summary, against which weused to compare our algorithm. We chose DICEto evaluate how comparable each output was. Thismetrics has been widely used by the Referring Ex-pression community (Gatt et al., 2008; Belz andGatt, 2008). The results are displayed in Table 2.
To compare MetOffice’s FoR choices with thoseby our algorithm, we ran it using 6 different den-sity thresholds: 0.0, 0.2, 0.4, 0.6, 0.8 and 1.0.A density threshold is in this sense the minimumevent density a descriptor can have to be acceptedas a candidate. If you recall the explanation ofthe algorithm above, a Frame of Reference is re-jected if all its descriptors are rejected, but equallyif all its descriptors cannot be rejected. For ex-ample, it only makes sense to select Inland as adescriptor if Coastal is not a candidate; if both In-land and Coastal are equally valid, then we can saythe event (e.g. rain) is taking place in the entireregion, as far as coastal proximity is concerned.As explained above, the fixed density threshold inthe original algorithm was 0.0, which means that1 single point was enough to make a descriptorinvalid. By running the algorithm with differentdensity thresholds, we are able to have an idea ofsome optimal threshold, where non-zero-densitydescriptors still get rejected.
From this initial evaluation, we could verify
131

Dataset MO BL D DT=.0 D DT=.2 D DT=.4 D DT=.6 D DT=.8 D DT=1 DMay 21 nam, cst nam 0.7 * 0 dir 0 nam 0.7 nam 0.7 nam 0.7 nam 0.7May 25 nam 0 nam 0 nam 0 - 1 - 1 - 1 - 1May 27 nam nam 1 * 0 * 0 dir 0 dir 0 nam, dir 0.7 nam 1May 28 nam nam 1 * 0 * 0 nam 1 nam, dir 0.7 - 0 - 0Jun 01 nam, dir nam 0.7 * 0 dir 0.7 nam, dir 1 nam 0.7 nam 0.7 nam 0.7Jun 02 nam nam 1 nam 1 nam 1 nam 1 nam, dir 0.7 dir 0 - 0Jun 04 dir nam 0 nam 0 nam, dir 0.7 nam 0 nam, dir 0.7 - 0 - 0
Average 0.6 0.1 0.3 0.7 0.6 0.4 0.5
Table 2: Comparison of 1st-focus FoR choice between MetOffice texts and the algorithm running withdifferent density thresholds. Assigning 2 (or more) 1st-focus FoR to a dataset is very similar toassigning “both-1st” to experimental responses. Please refer to Section 3.2 for a more detailed
discussion on multiple 1st-focus FoR. Abbreviations: nam = NamedArea; dir = Directions; cst =CoastalProximity; MO = MetOffice; BL = Baseline; DT = Density Threshold; D = DICE score; * = all
descriptors reach the threshold, so no FoR is discriminative enough to be chosen; - = no descriptorreaches the threshold, so no FoR qualifies as candidate to be chosen.
that, at its current state, the algorithm is per-forming relatively well in choosing the ‘favourite’frame, which is NamedAreas. Another impor-tant observation is that the algorithm reached, atthis relatively small evaluation, its optimal densitythreshold at 0.4, as indicated by the DICE value of0.7, which is higher than the baseline of 0.6. Thebaseline is simply the most common FoR in thedataset, which is named entities. Surely a moresubstantial evaluation with a larger dataset willbe required before we are safe to make strongerclaims about thresholds and performance.
It is important to highlight how we annotatedour corpus texts. Frames were considered cho-sen if they were the first-focus FoR in the descrip-tion (see 3.1 for a discussion on first vs. second-focus FoR). For instance, if “in Aberdeen and inthe west” was the expression, both names and di-rection were annotated as first-focus frames; if “inwestern Aberdeen” was the case, then only namewas considered first-focus, with direction anno-tated as second-focus and therefore outside thecomparison with the algorithm. This is necessarybecause, although we gained valuable knowledgeabout first and second-focus with previous studies,the functionality for focus is not yet present in thealgorithm, thus we are not yet ready to evaluate itfor this mechanism.
4.2 An example
Below we provide an example of how the algo-rithm decides for Frames of Reference and de-scriptors. We take a dataset used in the evaluation
exercise, which contains rain forecast data for theGrampian region, in Scotland. The region has acoastal line at the North Sea and is composed of 3authority areas, namely: Aberdeen, Aberdeenshireand Moray.
As explained above, the data is provided byMetOffice, who also provides textual summariesfor the data. From an analysis of the summarieswe identified 3 Frames of Reference used with afrequency higher than 5% to describe rain events.These frames, their descriptors and frequenciesare:
NamedAreas (83%): Aberdeen, Aberdeenshireand Moray.
Directions (33%): NorthEast, SouthEast, South-West, NorthWest.
CoastalProximity (17%): Coastal, Inland.
In the Directions frame, we coded only theinter-cardinal directions as descriptors. This isnecessary because the algorithm needs to com-pute each descriptor as a non-overlapping atomicpartition. A North descriptor would overlap withan East descriptor, forming exactly the partitionNorth-East. For this reason, a description such as“the North” is achieved if the algorithm selects thedescriptors North-West and North-East, but notSouth-West and South-East.
The frequencies become the weights of eachframe in the algorithm, and the decision for adescriptor is based on the utility score of a de-scriptor. Utility is computed by multiplying the
132
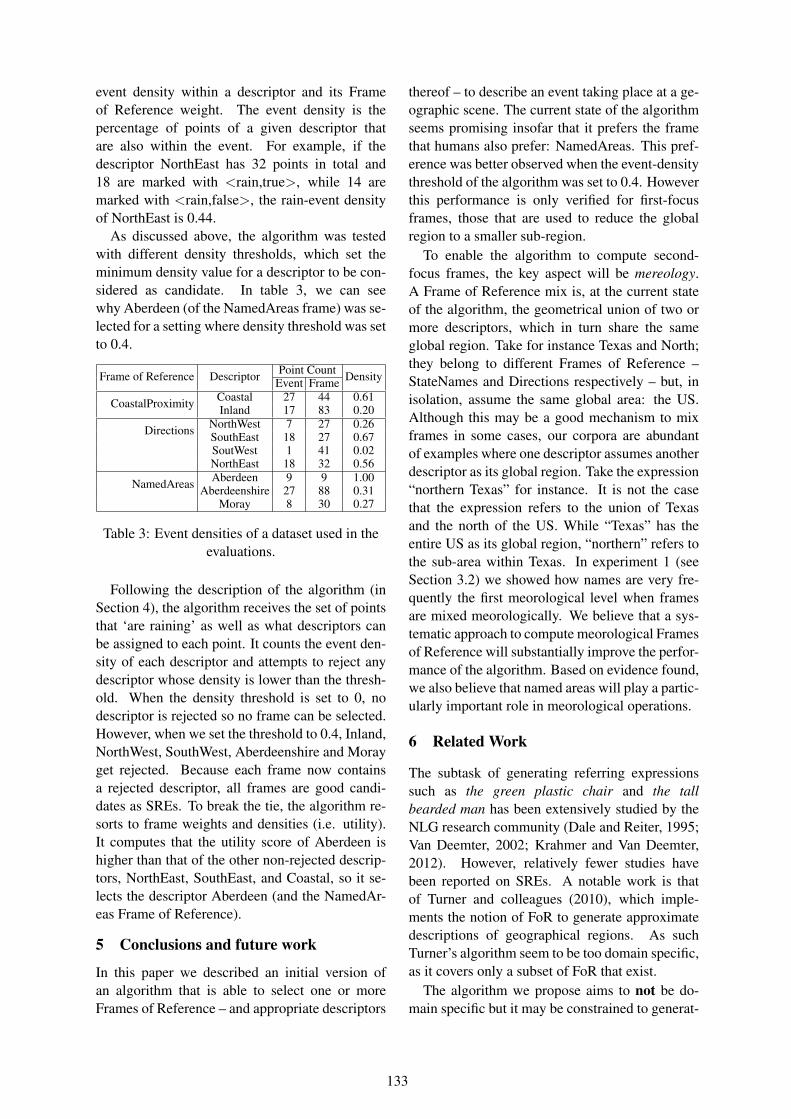
event density within a descriptor and its Frameof Reference weight. The event density is thepercentage of points of a given descriptor thatare also within the event. For example, if thedescriptor NorthEast has 32 points in total and18 are marked with <rain,true>, while 14 aremarked with <rain,false>, the rain-event densityof NorthEast is 0.44.
As discussed above, the algorithm was testedwith different density thresholds, which set theminimum density value for a descriptor to be con-sidered as candidate. In table 3, we can seewhy Aberdeen (of the NamedAreas frame) was se-lected for a setting where density threshold was setto 0.4.
Frame of Reference Descriptor Point Count DensityEvent Frame
CoastalProximity Coastal 27 44 0.61Inland 17 83 0.20
Directions NorthWest 7 27 0.26SouthEast 18 27 0.67SoutWest 1 41 0.02NorthEast 18 32 0.56
NamedAreas Aberdeen 9 9 1.00Aberdeenshire 27 88 0.31
Moray 8 30 0.27
Table 3: Event densities of a dataset used in theevaluations.
Following the description of the algorithm (inSection 4), the algorithm receives the set of pointsthat ‘are raining’ as well as what descriptors canbe assigned to each point. It counts the event den-sity of each descriptor and attempts to reject anydescriptor whose density is lower than the thresh-old. When the density threshold is set to 0, nodescriptor is rejected so no frame can be selected.However, when we set the threshold to 0.4, Inland,NorthWest, SouthWest, Aberdeenshire and Morayget rejected. Because each frame now containsa rejected descriptor, all frames are good candi-dates as SREs. To break the tie, the algorithm re-sorts to frame weights and densities (i.e. utility).It computes that the utility score of Aberdeen ishigher than that of the other non-rejected descrip-tors, NorthEast, SouthEast, and Coastal, so it se-lects the descriptor Aberdeen (and the NamedAr-eas Frame of Reference).
5 Conclusions and future work
In this paper we described an initial version ofan algorithm that is able to select one or moreFrames of Reference – and appropriate descriptors
thereof – to describe an event taking place at a ge-ographic scene. The current state of the algorithmseems promising insofar that it prefers the framethat humans also prefer: NamedAreas. This pref-erence was better observed when the event-densitythreshold of the algorithm was set to 0.4. Howeverthis performance is only verified for first-focusframes, those that are used to reduce the globalregion to a smaller sub-region.
To enable the algorithm to compute second-focus frames, the key aspect will be mereology.A Frame of Reference mix is, at the current stateof the algorithm, the geometrical union of two ormore descriptors, which in turn share the sameglobal region. Take for instance Texas and North;they belong to different Frames of Reference –StateNames and Directions respectively – but, inisolation, assume the same global area: the US.Although this may be a good mechanism to mixframes in some cases, our corpora are abundantof examples where one descriptor assumes anotherdescriptor as its global region. Take the expression“northern Texas” for instance. It is not the casethat the expression refers to the union of Texasand the north of the US. While “Texas” has theentire US as its global region, “northern” refers tothe sub-area within Texas. In experiment 1 (seeSection 3.2) we showed how names are very fre-quently the first meorological level when framesare mixed meorologically. We believe that a sys-tematic approach to compute meorological Framesof Reference will substantially improve the perfor-mance of the algorithm. Based on evidence found,we also believe that named areas will play a partic-ularly important role in meorological operations.
6 Related Work
The subtask of generating referring expressionssuch as the green plastic chair and the tallbearded man has been extensively studied by theNLG research community (Dale and Reiter, 1995;Van Deemter, 2002; Krahmer and Van Deemter,2012). However, relatively fewer studies havebeen reported on SREs. A notable work is thatof Turner and colleagues (2010), which imple-ments the notion of FoR to generate approximatedescriptions of geographical regions. As suchTurner’s algorithm seem to be too domain specific,as it covers only a subset of FoR that exist.
The algorithm we propose aims to not be do-main specific but it may be constrained to generat-
133

ing expression that refer to locations of geograph-ical scale such as regions of a country. Initially weare not concerned with describing the position ofsmall-scale scenes such as a cup on a table. Belowwe describe how these spaces can be significantlydifferent for our task. We also review the back-bone concept for the algorithm, that of FoR, andwe finally list some existing implementations forgenerating spatial referring expressions.
6.1 Spatial frames of referenceWhen choosing how to represent space withwords, we need to select not only spatial enti-ties but a spatial relation between them. Choos-ing a spatial relation depends largely on the per-spective with which one looks at (or imagines) ascene. In cognitive sciences, people have used theterm Frames of Reference (FoR) to refer to suchperspectives. Levinson (2003) classifies cognitiveFoR into 3 types:
Intrinsic Objects have spatial parts such as frontor top.
Relative The 3rd object position is taken into ac-count.
Absolute Fixed bearings such as latitude longi-tude coordinates.
In this work, we take the same position as(Turner et al., 2010), which perceives the absoluteFoR as the one employed by humans when survey-ing geographical spaces.
6.2 Generation of spatial referringexpressions
The first systems to use an SREG module dateback to the 1990s. FOG (Goldberg, 1995) was thefirst large scale commercial application of NLGand it generated weather forecasts in English andFrench.
Similar to FOG, many other systems focus ongenerating descriptions for weather data (Coch,1998; Reiter et al., 2005; Bohnet et al., 2007). Wecan expect the spatial language in the output ofsuch systems to employ the absolute FoR, giventhe geo-referenced input data. The other type ofsystems normally use SREG modules to describea medium-scale (e.g. street) or a small-scale (e.g.room) space (Ebert et al., 1996; Dale et al., 2005;Kelleher and Kruijff, 2006). In such systems, wecan expect intrinsic and relative frames.
RoadSafe (Turner et al., 2010), is to the bestof our knowledge the most recent system to im-plement an SREG module. Output spatial lan-guage employs absolute FoR and geo-referenceddata is processed using DE-9IM (Clementini etal., 1993). RoadSafe implements the most so-phisticated SREG module to describe geographi-cal scenes using non-named FoR. We need to en-able NLG systems to generate named spatial ref-erences as well.
ReferencesAnja Belz and Albert Gatt. 2008. Intrinsic vs. ex-
trinsic evaluation measures for referring expressiongeneration. In Proceedings of the 46th Annual Meet-ing of the Association for Computational Linguisticson Human Language Technologies: Short Papers,pages 197–200. Association for Computational Lin-guistics.
Bernd Bohnet, Francois Lareau, Leo Wanner, et al.2007. Automatic production of multilingual envi-ronmental information. In Proceedings of the 21stConference on Informatics for Environmental Pro-tection (EnviroInfo-07), Warsaw, Poland.
Eliseo Clementini, Paolino Di Felice, and Peter vanOosterom. 1993. A small set of formal topolog-ical relationships suitable for end-user interaction.In Advances in Spatial Databases, pages 277–295.Springer.
Jose Coch. 1998. Multimeteo: multilingual productionof weather forecasts. ELRA Newsletter, 3(2).
Robert Dale and Ehud Reiter. 1995. Computationalinterpretations of the gricean maxims in the gener-ation of referring expressions. Cognitive science,19(2):233–263.
Robert Dale, Sabine Geldof, and Jean-philippe Prost.2005. Using Natural Language Generation in Au-tomatic Route Description. Journal of Research &Practice in Information Technology, 37(1):89–105.
Christian Ebert, Ralf Meyer-klabunde, Daniel Glatz,Martin Jansche, and Robert Porzel. 1996. FromConceptualization to Formulation in GeneratingSpatial Descriptions. In Proceedings fo the 5th Eu-ropean Conference on Cognitive Modelling, pages235–241.
Albert Gatt, Anja Belz, and Eric Kow. 2008. The tunachallenge 2008: Overview and evaluation results. InProceedings of the Fifth International Natural Lan-guage Generation Conference, pages 198–206. As-sociation for Computational Linguistics.
Adele E Goldberg. 1995. Constructions: A construc-tion grammar approach to argument structure. Uni-versity of Chicago Press.
134

John Kelleher and Geert-Jan Kruijff. 2006. Incremen-tal generation of spatial referring expressions in situ-ated dialog. In Proceedings of the 21st InternationalConference on Computational Linguistics and the44th annual meeting of the Association for Compu-tational Linguistics, pages 1041–1048. Associationfor Computational Linguistics.
Emiel Krahmer and Kees Van Deemter. 2012. Compu-tational generation of referring expressions: A sur-vey. Computational Linguistics, 38(1):173–218.
Stephen C Levinson. 2003. Frames of reference. InSpace in Language and Cognition: Explorations inCognitive Diversity, chapter 2, pages 24–61. Cam-bridge University Press.
Ehud Reiter, Somayajulu Sripada, Jim Hunter, Jin Yu,and Ian Davy. 2005. Choosing words in computer-generated weather forecasts. Artificial Intelligence,167(1):137–169.
Ross Turner, Somayajulu Sripada, and Ehud Reiter.2010. Generating approximate geographic descrip-tions. In Empirical methods in natural languagegeneration, pages 121–140. Springer.
Ross Turner. 2009. Georeferenced data-to-text: tech-niques and application. Ph.D. thesis, University ofAberdeen.
Kees Van Deemter. 2002. Generating referring expres-sions: Boolean extensions of the incremental algo-rithm. Computational Linguistics, 28(1):37–52.
135
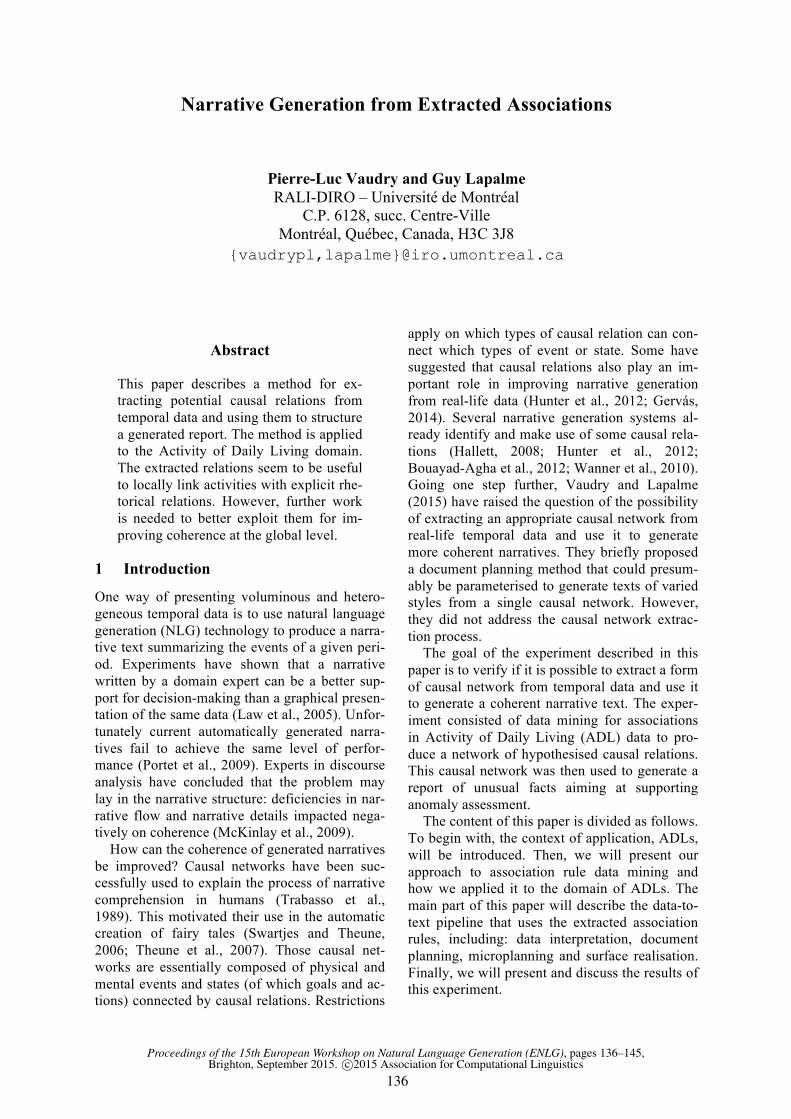
Proceedings of the 15th European Workshop on Natural Language Generation (ENLG), pages 136–145,Brighton, September 2015. c©2015 Association for Computational Linguistics
Narrative Generation from Extracted Associations
Pierre-Luc Vaudry and Guy Lapalme RALI-DIRO – Université de Montréal
C.P. 6128, succ. Centre-Ville Montréal, Québec, Canada, H3C 3J8
{vaudrypl,lapalme}@iro.umontreal.ca
Abstract
This paper describes a method for ex-tracting potential causal relations from temporal data and using them to structure a generated report. The method is applied to the Activity of Daily Living domain. The extracted relations seem to be useful to locally link activities with explicit rhe-torical relations. However, further work is needed to better exploit them for im-proving coherence at the global level.
1 Introduction
One way of presenting voluminous and hetero-geneous temporal data is to use natural language generation (NLG) technology to produce a narra-tive text summarizing the events of a given peri-od. Experiments have shown that a narrative written by a domain expert can be a better sup-port for decision-making than a graphical presen-tation of the same data (Law et al., 2005). Unfor-tunately current automatically generated narra-tives fail to achieve the same level of perfor-mance (Portet et al., 2009). Experts in discourse analysis have concluded that the problem may lay in the narrative structure: deficiencies in nar-rative flow and narrative details impacted nega-tively on coherence (McKinlay et al., 2009).
How can the coherence of generated narratives be improved? Causal networks have been suc-cessfully used to explain the process of narrative comprehension in humans (Trabasso et al., 1989). This motivated their use in the automatic creation of fairy tales (Swartjes and Theune, 2006; Theune et al., 2007). Those causal net-works are essentially composed of physical and mental events and states (of which goals and ac-tions) connected by causal relations. Restrictions
apply on which types of causal relation can con-nect which types of event or state. Some have suggested that causal relations also play an im-portant role in improving narrative generation from real-life data (Hunter et al., 2012; Gervás, 2014). Several narrative generation systems al-ready identify and make use of some causal rela-tions (Hallett, 2008; Hunter et al., 2012; Bouayad-Agha et al., 2012; Wanner et al., 2010). Going one step further, Vaudry and Lapalme (2015) have raised the question of the possibility of extracting an appropriate causal network from real-life temporal data and use it to generate more coherent narratives. They briefly proposed a document planning method that could presum-ably be parameterised to generate texts of varied styles from a single causal network. However, they did not address the causal network extrac-tion process.
The goal of the experiment described in this paper is to verify if it is possible to extract a form of causal network from temporal data and use it to generate a coherent narrative text. The exper-iment consisted of data mining for associations in Activity of Daily Living (ADL) data to pro-duce a network of hypothesised causal relations. This causal network was then used to generate a report of unusual facts aiming at supporting anomaly assessment.
The content of this paper is divided as follows. To begin with, the context of application, ADLs, will be introduced. Then, we will present our approach to association rule data mining and how we applied it to the domain of ADLs. The main part of this paper will describe the data-to-text pipeline that uses the extracted association rules, including: data interpretation, document planning, microplanning and surface realisation. Finally, we will present and discuss the results of this experiment.
136

2 Context of application
Ambient Assisted Living (AAL) technology can be used to help elderly people to live in their own house longer. Moreover, sensor equipment can be used to monitor an elderly person's Activities of Daily Living and detect anomalies associated with dementia early (Lalanda et al., 2010).
There are different ways of processing sensor data to detect and present possible anomalies. For example, Munstermann et al. (2012) achieve typical behaviour discovery by learning a transi-tion network from the ADL sequence data. They then use it to measure how normal a given day is and map this metric to traffic light colours.
However the normalcy of a given day is measured, health care professionals would still need to assess if there were indeed anomalies and what was their nature. For this, a more detailed access to the data is required. In our experiment, we explore a way of presenting unusual facts using NLG technology. For that we extract asso-ciation rules from the event data. We then use them to present a textual narrative summary of a given time interval that emphasises unusual facts. Health care professionals could then re-view this summary for potential anomalies with access to other sources of information. One ad-vantage of natural language is that it can com-pactly express not only events but also multiple relations between events. By selecting for the generated text only the most important events and relations, the reader should not have to pore over unnecessarily detailed usual behaviour.
Since this was our first experiment both with generating a narrative from extracted associa-tions and presenting unusual facts in ADLs, we wanted to work on as simple a dataset as possi-ble. For this reason we chose the publicly availa-ble UCI ADL Binary Dataset (Ordóñez et al., 2013). This dataset was assembled to train activi-ty classifiers that take as input raw sensor data. We do not address this task in this paper, relying instead on the reference annotations provided as our input (but see for example the paper just cit-ed or Fleury et al., 2010). Generating from real data and not reference annotations would pose problems that are out of the scope of this paper.
This dataset includes the ADLs of two users (A and B) in their own homes. The data was rec-orded for 14 and 21 consecutive days, respective-ly. Binary sensor events and the corresponding activity labels are given. We used only the latter in this experiment. For each sensor event or ac-tivity, the start and end time are given. There is
no overlap between sensor events and between activities (there was only one person per house).
The ADL label set is: Leaving, Toileting, Showering, Sleeping, Breakfast, Lunch, Dinner, Snack, Spare_Time/TV, Grooming. The ADL sequence for user A comprises 248 activities (average of 18 activities per day) and that for user B, 493 activities (average of 21 activities per day). As an example, Table 1 shows the 30 ADL labels for user B on 24 November 2012.
Sometimes the same label is repeated and one could think that it was just the same activity that continued. However, by looking at the sensor data we can understand why it was annotated in this way. For example, between the Grooming that finishes at 11:52 and the following activity, also Grooming, that begins at 11:59, the bed-room door was used twice. In any case, it is out of the scope of this paper to question the annota-tion process.
Start time End time Activity 00:33:00 10:02:59 Sleeping 10:04:00 10:12:59 Breakfast 10:17:00 10:18:59 Toileting 10:19:00 11:13:59 Spare_Time/TV 11:16:00 11:19:59 Snack 11:30:00 11:38:59 Showering 11:39:00 11:52:59 Grooming 11:59:00 12:00:59 Grooming 12:01:00 12:02:59 Toileting 12:09:00 12:23:59 Snack 12:31:00 13:18:59 Spare_Time/TV 13:50:00 14:31:59 Spare_Time/TV 14:32:00 14:32:59 Grooming 14:36:00 15:59:59 Leaving 16:00:00 16:00:59 Toileting 16:01:00 16:01:59 Grooming 16:02:00 16:02:59 Toileting 16:03:00 16:03:59 Grooming 16:04:00 19:57:59 Spare_Time/TV 19:58:00 19:59:59 Snack 20:08:00 20:31:59 Spare_Time/TV 22:01:00 22:01:59 Toileting 22:02:00 22:16:59 Spare_Time/TV 22:17:00 22:18:59 Dinner 22:19:00 23:20:59 Spare_Time/TV 23:21:00 23:22:59 Snack 23:23:00 00:44:59 Spare_Time/TV 00:45:00 00:47:59 Grooming 00:48:00 01:48:59 Spare_Time/TV 01:50:00 09:24:59 Sleeping
Table 1. The 30 ADL labels for user B on 24 November 2012.
137

3 Data mining for association rules
For finding significant association rules in the ADL data, we used the data mining techniques presented by Hamalainen and Nykanen (2008). This approach was selected because it has been successfully applied for the construction of a causal network from a video (Kwon and Lee, 2012). The video was first segmented spatially and temporally using only pixel information to form the nodes of the network. The causal net-work was then presented as a visual (non-textual) summary of the video.
Generating a textual video summary using a similar technique would be an interesting en-deavour. However, for that we would have first needed a reliable way of producing a sufficiently accurate textual description of an arbitrary spa-tio-temporal segment of a video. Generating text from ADL labels and time-stamps is easier as a first step to test our narrative planning method.
In this experiment we considered a limited number of simple types of association rules in the ADL data. To select them we assumed that temporal proximity and temporal precedence were indicators of potential causality. Alt-hough it is far from being a guaranty of causality, it is simple enough to apply as a first step. Also, the causal relation could very well be indirect or the relation may instead imply a common cause between the two events. Nevertheless, it does not necessarily make the relation less relevant to hint at in the generated text. The relations extracted from sensor data can only be imperfect, because sensor data contain only a fraction of the relevant information. However, the causal relations that count in the end are those the human reader re-constructs in his mind with the help of other sources of information, not the exact ones the machine identified.
The types of association rule considered are shown in Table 2. In the following, A and H are categorical variables and stand respectively for activity and hour of the day (hours 0-23, not con-sidering minutes). Ai,p stands for a particular type of activity i at position p in the event sequence. Association rule type 1 evaluates the influence of
the last activity on the choice of the current ac-tivity. Type 2 does the same for the penultimate activity and type 3 for the last two activities. Type 4 takes into account the influence of the current hour of the day on the choice of activity. Lastly, type 5 combines the current hour and the last activity to try to predict the current activity. Each rule is accompanied by an example with the first Toileting activity of Table 1.
To be able to describe the algorithm in more general terms, events and states will in this paper be called eventualities (after Bach, 1986). This includes activities and hours of the day.
For selecting significant association rules, we computed three properties for each candidate (Hamalainen and Nykanen, 2008):
• frequency: the probability of encountering an instance of the association rule in the da-ta; it is estimated from counts;
• confidence: the conditional probability of encountering an instance of the association, given that we just encountered an instance of the left part of the association rule;
• significance: the probability of obtaining the observed counts if the events on the right part of the rule were actually independent of the events on the left part of the rule. It is measured by computing the p-value accord-ing to the binomial distribution.
We computed two p-values: one to indicate positive association rules (significantly high counts) and the other to indicate negative associ-ation rules (significantly low counts). By the lat-ter we mean cases in which the presence of the events on the left part of the rule can be used as a predictor of the absence of the events on the right part of the rule. In other words, actual instances of these association rules are unexpected.
Those properties are formalised in Figure 1. To compute frequency, confidence and signif-
icance, we counted in the data 𝑚 𝐿! ,𝑅! and 𝑚 𝐿! for each value i,j for each association can-didate 𝐿! → 𝑅!. Those counts were made using all the data available for a given user.
Type Association rule Example association rule candidate 1 𝐴!,!!! → 𝐴!,! 𝐴!"#$%&$'(,!!! → 𝐴!"#$%&#'(,! 2 𝐴!,!!! → 𝐴!,! 𝐴!"##$%&',!!! → 𝐴!"#$%&#'(,! 3 𝐴!,!!! ⋀ 𝐴!,!!! → 𝐴!,! 𝐴!"##$%&',!!! ⋀ 𝐴!"#$%&$'(,!!! → 𝐴!"#$%&#'(,! 4 𝐻!,! → 𝐴!,! 𝐻!",! → 𝐴!"#$%&#'(,! 5 𝐴!,!!! ⋀ 𝐻!,! → 𝐴!,! 𝐴!"#$%&$'(,!!! ⋀ 𝐻!",! → 𝐴!"#$%&#'(,!
Table 2. Association rule types and examples.
138

Next, we filtered the association rule candi-dates using the following criteria. To get the ex-pected association rules, we retained only candi-dates 𝐿! → 𝑅! for which 𝑐𝑓 𝐿! → 𝑅! > 𝑐𝑓!"# and 𝑝!"#!$%!& 𝐿! → 𝑅! < 0.05. To get the un-expected association rules, we retained only can-didates 𝐿! → 𝑅! for which 𝑐𝑓 𝐿! → 𝑅! < 𝑐𝑓!"# and 𝑝!"#$%#&'#( 𝐿! → 𝑅! < 0.05. We tried dif-ferent values of 𝑐𝑓!"# and 𝑐𝑓!"# and settled for 𝑐𝑓!"# = 0.3 and 𝑐𝑓!"# = 0.07 . This seemed reasonable because there were 10 ADL labels, which would give an a priori probability of 0.1 for each without any knowledge about the data. This means that associations that have a condi-tional probability of having their right part hap-pen with a probability around 0.1 given their left part do not give much information. They are thus less relevant.
We also had to filter the candidates to elimi-nate redundancy: 𝐿!! → 𝑅! is considered more general than 𝐿!! → 𝑅! if and only if the events of 𝐿!! are included in the events of 𝐿!! . For example, the rule 𝐴!"#$%&$'(,!!! → 𝐴!"#$%&#'(,! is more general than 𝐴!"##$%&',!!! ⋀ 𝐴!"#$%&$'(,!!! →𝐴!"#$%&#'(,!. We considered a rule candidate non-redundant only if all more general rule candi-dates were less significant (had a higher p-value). We still kept a more general rule candidate too if it was significant enough (p-value < 0.05).
For example, among the five example rule candidates with Toileting given in Table 2, only 𝐻!",! → 𝐴!"#$%&#'(,! ( 𝑐𝑓 = 0.365, 𝑝!"#!$%!& =0.002) was selected as an expected association rule and none as an unexpected association rule. An example of a rule candidate that was selected as an unexpected rule is
𝐴!"#$%&#'(,!!! ⋀ 𝐻!",! → 𝐴!"#$%_!"#$/!",! ( 𝑐𝑓 = 0.044, 𝑝!"#$%#&'#( = 0.028 ). Those numbers come from the counting of all the 21 days of data available for user B.
4 The data-to-text pipeline
To generate a report from the ADL data for a given period, we roughly follow a standard data-to-text pipeline (Reiter, 2007). Since we take as input the ADL labels, we do not have to analyse the underlying sensor signals. Therefore we begin with data interpretation, which consists of finding instances of the previously selected asso-ciation rules in the input. For each of those, one or more logico-semantic relations are introduced as part of a hypothetic interpretation of the input data.
Following Bouayad-Agha et al. (2012), in this paper the term logico-semantic relation desig-nates very abstract semantic relations between eventualities that are independent from pragmat-ic factors. They are to be distinguished from rhe-torical relations in the sense of the Rhetorical Structure Theory (RST) (Mann and Thompson, 1987), which have an intentional load. According to Kosseim and Lapalme (2000), the many-to-many mapping between semantic relations and rhetorical relations requires placing them into separate representation levels in an NLG system.
Next the logico-semantic relations are used to plan the document as a whole in the document planning stage. The output is a rhetorical struc-ture featuring rhetorical relations. Follows the microplanning stage that plans the phrases and lexical units expressing the events and rhetorical relations. This produces a lexico-syntactic speci-
Count for value i of variable X: 𝑚(𝑋!) Total count for variable X: 𝑛(𝑋) = ∑ 𝑚(𝑋!)! Probability for value i of variable X: 𝑃(𝑋!) =
!(!!)!(!)
Joint count for values i,j of left (L) and right (R) parts of association rule 𝐿! → 𝑅!: 𝑚!𝐿! ,𝑅!! Total joint count for an association rule of type 𝐿 → 𝑅: 𝑛(𝐿,𝑅) = ∑ 𝑚!𝐿! ,𝑅!!!,!
Frequency of an association rule 𝐿! → 𝑅!: 𝑓𝑟!𝐿! → 𝑅!! = 𝑃!𝐿! ,𝑅!! =!!!!,!!!!(!,!)
Confidence of an association rule 𝐿! → 𝑅!: 𝑐𝑓!𝐿! → 𝑅!! = 𝑃!𝑅!|𝐿!! =!!!!,!!!!(!!)
Significance (p-value using the binomial distribution) of 𝐿! → 𝑅!:
𝑝!𝐿! → 𝑅!! = ! !𝑛(𝐿,𝑅)𝑙
! !𝑃(𝐿!)𝑃!𝑅!!!!!1 − 𝑃(𝐿!)𝑃!𝑅!!!
!(!,!)!!!!"#
!!!!"#
With 𝑙!"# = 𝑚!𝐿! ,𝑅!! and 𝑙!"# = 𝑚(𝐿!) for an expected association !𝑝!"#!$%!&! and 𝑙!"# = 0 and 𝑙!"# = 𝑚!𝐿! ,𝑅!! for an unexpected association !𝑝!"#$%#&'#(!.
Figure 1. Notation and formulas for counts, frequency, confidence and significance.
139

fication that is realised as natural language text in the last stage: surface realisation.
In our case there is one more operation, which takes place between document planning and mi-croplanning: summarisation. Here the rhetorical structure is pruned to keep only the most im-portant events and relations. This produces a summary of the initially planned text.
The five pipeline stages are thus in order: data interpretation, document planning, summarising, microplanning and surface realisation. The fol-lowing sections describe them in more detail.
5 Data interpretation
In data interpretation, each activity and its con-text in the input ADL sequence are examined to find instances of application of an association rule. When there is a match, the algorithm postu-lates one or more corresponding logico-semantic relations and adds them to the document content. When an expected association instance is found, a pseudo-causal relation is created between the left and right part of the rule. It is not necessary that the relation really be a direct causation. More precisely, the relation could be paraphrased as: It does not seem a coincidence that this event is followed by that event. The real explanation may be much more complex. For short, we will retain the terms cause and result. For example, in the example day of Table 1, the third activity matches the expected rule 𝐻!",! → 𝐴!"#$%&#'(,!. 1) Hour of Day 10 causes Toileting 10:17
When an unexpected association instance is found (including associations never encountered before), an unexpected result relation is created. For example, from Table 1 the following two relations are created from the unexpected rule 𝐴!"#$%&#'(,!!! ⋀ 𝐻!",! → 𝐴!"#$%_!"#$/!",!. 2) Toileting 10:17 unexpectedly results in
Spare_Time/TV 10:19 3) Hour of Day 10 unexpectedly results in
Spare_Time/TV 10:19 In addition, an instead relation is created with
the best available prediction of what activity would have been expected in the same context, according to the expected association rules: 4) Spare_Time/TV 10:19 instead of Grooming
When the left part of the association rule in-cludes the hour of the day variable and a match is found, a time mention is introduced and added to the document content. This time mention refer-ences the start time of the corresponding activity.
The algorithm also introduces a repetition re-lation when the activity type in the right part of a
matching association rule is included in its left part. For example, because of a match of ex-pected rule 𝐴!"##$%&',!!! → 𝐴!"##$%&',!, a rep-etition relation is created: 5) Grooming 16:03 is a repetition of Groom-
ing 16:01 To be able later to compare the importance of
activities, time mentions and relations, a proba-bility is assigned to each of them. The probabil-ity of a logico-semantic relation is the confidence of the corresponding matching association rule. For example, relation 1 is assigned as probability 𝑐𝑓 𝐻!",! → 𝐴!"#$%&!"#,! = 0.365. An activity at the right side of one or more matching associa-tion rules is assigned as probability the highest confidence of those association rules. This prob-ability is called posterior probability, in the sense that it takes into account the context (the left side of the rules). For example, Toileting 10:17 is assigned probability 0.365. For other activities, the prior probability is used, that is, the frequen-cy without looking at the context. For example, Showering 11:30 does not correspond to the right side of any matching association rules and so it is assigned as probability its frequency. Time men-tions use the frequency of the hour of the day.
6 Document planning
In this experiment, document planning and mi-croplanning are done in essentially the same way as proposed by Vaudry and Lapalme (2015). The main difference is that there are only two types of eventualities: activity and hour of the day. This leads to a lesser number of causal and un-expected result subtypes (those subtypes are dif-ferentiated by the type of their arguments). On the other hand, we use two logico-semantic rela-tions not mentioned in Vaudry and Lapalme (2015) : instead and repetition.
Document planning is done in four steps: deri-vation of additional logico-semantic relations, building of an unordered tree structure by clus-tering, logico-semantic to rhetorical relation mapping, and ordering of the tree. The following subsections describe each of them.
6.1 Deriving additional logico-semantic re-lations
Before building the rhetorical structure, Vaudry and Lapalme (2015) mention using rules to infer additional logico-semantic relations, such as vo-litional causation, contrast and conjunction. With only activities and hours of the day as eventuali-
140

ties, only the addition of conjunction relations was relevant for this experiment.
A conjunction relation applies to items that play a comparable role (Mann and Taboada, 2005). In the case of a logico-semantic network, this can be interpreted as the following: if two or more eventualities e1, e2, ..., en that are part of the same type of logico-semantic relation r with an-other eventuality e0, then they can be said to be in a relation of conjunction with each other. For example, if two activities are hypothesised to be caused by the same preceding activity, they are in a conjunction relation.
6.2 Clustering
The first step in document planning is to build an unordered tree structure by performing agglom-erative hierarchical clustering. This is parameter-ized by adjacency preferences. Those must be specified for the instead and repetition relations, as well as for the causal and unexpected result relation subtypes resulting from data interpreta-tion. Adjacency preferences are expressed in terms of how much a given relation prefers to have its arguments appear in the same sentence, the same paragraph or another paragraph.
The adjacency preferences used in the ADL report generation are presented in Table 3. They reflect the following choices. A time mention coming from a relation between the hour of the day and an activity must be mentioned very close to that activity so as not to generate ambiguity. Two related activities can be mentioned in sepa-rate sentences with the appropriate markers, ex-cept for the instead relation which calls for greater proximity. This makes for relatively short sentences. The conjunction relation must appear one level deeper in the tree than its related rela-
tion to avoid ambiguity. In our experiment, average linkage clustering
is used. The distance between two eventualities is computed from the average of the adjacency preferences of the logico-semantic relations holding between them. The more a relation pre-fers to have its arguments adjacent, the smaller the distance. When no logico-semantic relation holds between two eventualities, the sum of dis-tances on the shortest path between them is used. If no such path exists, then the maximal distance is assigned. The temporal distance relative to the total duration of the period to be narrated is also taken into account, although with a low weight. In this way temporal distance helps order even-tuality pairs that would have the same distance otherwise. For example, suppose activities A and B on one hand, and B and C on the other hand, have between them the same logico-semantic relation(s). If B is temporally closer to A than to C, this will tip the balance so that A and B will be clustered together first. At each iteration, the two closest clusters are merged to form a new cluster, until all clusters are merged into one. The resulting hierarchy forms the basis of the rhetori-cal structure.
Looking up the logico-semantic relations giv-en in section 5, relation 2 has a lower adjacency preference than relation 3. This means that Spare_Time/TV 10:19 will be clustered with Hour of Day 10 before being clustered with Toi-leting 10:17. Also, Toileting 10:17 will be in a different sentence than Spare_Time/TV 10:19.
6.3 Logico-semantic to rhetorical mapping
The second step is to map each logico-semantic relation to a rhetorical relation with respect to communicative constraints.
Logico-semantic relation Adjacency preference
Rhetorical relation(s)
Satellite
Activity causes activity 0.60 Sequence n/a (multinuclear) Hour of day causes activity 1.00 Circumstance first argument Activity unexpectedly results in activity 0.60 Sequence,
Concession n/a (multinuclear), first argument
Hour of day unexpectedly results in activity 0.90 Concession first argument Instead 0.95 Instead second argument Conjunction (with p the adjacency preference of the relation that the coordinates have in common)
1.50×p Conjunction n/a (multinuclear)
Repetition 0.60 Repetition first argument Table 3. Adjacency preferences and logico-semantic to rhetorical mapping for ADL report. 0.0 means as far as possible, 1.0 mean as close as possible and 0.5 means in the same paragraph, but not the same sentence. The actual adjacency preference for conjunction is a coefficient applied to the adjacency preference of the relation that the coordinates have in common. This has usually the effect of keeping each conjunction relation just one level deeper in the tree than the common relation.
141

Generating a factual report such as an ADL report requires caution. There is no guarantee that the extracted association rules translate di-rectly to causal relations. Therefore we judged it was appropriate to simply suggest a possible un-named relation between the arguments of logico-semantic causal or unexpected result relations. Bouayad-Agha et al. (2012, p. 3:9) observed that a neutral perspective could be obtained by using a rhetorical temporal circumstance instead of a rhetorical cause. We also used the rhetorical temporal sequence relation for the same reason. This is because the presence of a causal relation implies that the cause precedes the effect. Thus, when a temporal relation is explicitly mentioned, it can suggest a possible causal relation without it being logically implied.
Except in the case of multinuclear relations, the parameters specifying the logico-semantic to rhetorical mapping must include how to choose which logico-semantic argument will be the rhe-torical nucleus and which will be the satellite. According to RST, in a rhetorical argument pair, the nucleus is the one that is more essential to the writer’s purpose and the other is termed the satel-lite. For example, the logico-semantic relation hour of day causes activity is expressed implicit-ly by putting forward the activity and mentioning the hour of day as only a rhetorical circumstance. The activity is judged more important because the central character of the narrative accomplish-es it. Some relations such as contrast or sequence are considered multinuclear, which means that neither argument is more essential than the other (Mann and Thompson, 1987, pp. 31–38). Two observed activities are a priori no more im-portant than the other; therefore the sequence rhetorical relation is used as a temporal relation between activities.
The parameters used for the logico-semantic to rhetorical mapping for the generation of the ADL report are presented in Table 3.
6.4 Ordering
Ordering preferences are specified for each type of rhetorical relation in terms of which of the satellite or the nucleus tends to come first and how strong this tendency is. The ordering prefer-ences used in this experiment for the generation of the ADL report are presented in Table 4. In addition, a temporal ordering preference speci-fies to what extent chronological or reverse chronological order should be followed. In this experiment, chronological order was preferred.
During ordering, the ordering preferences as-sociated with the rhetorical and temporal rela-tions are treated similarly to the adjacency pref-erences in the clustering step. Sibling clusters in the hierarchy produced by the clustering are or-dered by averaging the ordering preferences of all the relations holding between them. For this purpose, a nucleus first preference has a value of 1.0 while a satellite first preference has a value of -1.0. The result of this step is an ordered tree.
7 Summarisation
To summarise the ADLs of a given period, we retain the most important facts from the rhetori-cal tree. At first we used the minimum tree depth at which a leaf is promoted as a criteria to gener-ate a partial ordering of the eventualities (Marcu, 2000). The promotion set of a text span is the union of the promotion sets of its nuclei, except if it is a leaf. The promotion set of a leaf is the singleton containing only the leaf itself. This method gave interesting results, but tended to eliminate potentially anomalous facts that were located deep in the tree. This happened often be-cause interesting logico-semantic relations tend-ed to occur between the firstly created clusters, which placed them deep in the resulting tree.
Since the goal is to produce a report of unusu-al facts, we suppose that less typical facts are more important. Following this hypothesis, we used the probability according to the extracted association rule set as a measure of importance. As mentioned in section 5, the probability of an eventuality that does not appear in the right part of an instance of an association rule is its prior probability. Otherwise, it is the best prediction (the highest probability) given by those associa-tion rules, i.e. the posterior probability. A satel-lite text span was included in the summary if the probability of its promoted eventuality or the minimum probability of its relations with the nucleus was below a certain threshold. Other-wise, only the nucleus was kept. This method had the benefit of pruning less important text spans regardless of their depth in the tree.
Rhetorical relation Ordering preference Sequence no preference Circumstance satellite first Concession no preference Instead nucleus first Conjunction no preference Repetition nucleus first
Table 4. Ordering preferences for ADL report. No preference means chronological order.
142

For example, with a threshold of 0.4, Groom-ing 11:39 will be pruned, because the relation Showering 11:30 causes Grooming 11:39 has probability 0.91. We can assume the reader can infer the grooming from the preceding showering if he is already familiar with user B's routine.
8 Microplanning and realisation
During microplanning, the rhetorical structure is translated into a lexico-syntactic specification. For this the microplanning algorithm traverses the document plan tree depth-first. When a leaf is visited, a specification of a description of the corresponding eventuality is produced from lexi-co-syntactic templates. When an internal node is visited, the rhetorical relations that link the two children nodes are expressed with appropriate discourse markers. The marker (or absence of marker) depends on the rhetorical relation and the aggregation level (same sentence, same para-graph or other paragraph). Those markers are then used to assemble the lexico-syntactic speci-fications obtained from the children nodes.
For now, only the rhetorical relations holding between the promoted leaves of the two children nodes are taken into account. When there are none, in the future we plan to take other relations between the two children nodes into account. Our hypothesis is that it could lead to more co-herent texts provided that anaphora is used judi-ciously to avoid adding ambiguity.
Sentence and paragraph segmentation are a function of clustering distance. The latter reflects adjacency preferences, which are defined in terms of sentences and paragraphs.
Surface realization was performed using the SimpleNLG-EnFr Java library (Vaudry and Lapalme, 2013). During surface realization, the syntactic and lexical specifications are combined with the output language grammar and lexicon to generate formatted natural language text. Be-cause SimpleNLG-EnFr can realise text in both English and French, we were able to generate a report in both languages. For that a version of the lexico-syntactic templates used in microplanning had to be written for each language.
9 Results
Table 5 presents some statistics on the perfor-mance of the data mining, data interpretation and document planning stages. Data interpretation and document planning were tested by generat-ing one report per 24-hour period in the ADL data for each user. We can note that not all mined association rules apply each day. Moreo-ver, not all logico-semantic relations were trans-lated to a rhetorical relation in the rhetorical structure. This leads to a number of text spans being clustered together without a linking rhetor-ical relation. Those correspond mostly to the tree nodes closest to the root of the tree.
The example report of Figure 2 was generated from the data of Table 1. The maximum proba-bility threshold used for summarisation was 0.4. At the top is displayed the start and end time of the period considered for the report. The dis-
Saturday, 24 November 2012 10:04 AM - Sunday, 25 November 2012 09:24 AM -------------------------------------------------------- At 10:04 AM he ate his breakfast.
13 minutes later at 10:17 AM he went to the toilet. Then, nevertheless he spent time in the living room although it was 10:19 AM.
1 hour later at 11:16 AM he had a snack. 14 minutes later he took a shower. 1 hour later he went to the toilet. 8 minutes later he had a snack. 2 hours later he left. 1 hour later at 4:00 PM he went to the toilet.
Then he groomed and at 4:02 PM went to the toilet. Then he groomed again.
1 minute later he spent time in the living room.
4 hours later he had a snack. 2 hours later he went to the toilet and at
10:02 PM spent time in the living room. Then at 10:17 PM he dined.
1 hour later he had a snack. 1 hour later he spent time in the living
room. Figure 2. ADL report generated from Table 1 with a maximum probability threshold of 0.4.
Stage Statistic User A User B Data mining Number of mined expected association rules 51 62
Number of mined unexpected association rules 2 11 Data interpretation Average number of logico-semantic relations 39.1 32.5 Document planning Average number of linking rhetorical relations 22.1 25.3
Av. num. of internal tree nodes without linking relations 7.8 12.9 Table 5. Statistics on the performance of data mining, data interpretation and document planning.
143

course markers (at, although, then, nevertheless, and, again) express the rhetorical relations that hold between sibling text spans in the rhetorical tree. The only exception is the default marker in the form of X time later that is used when no such relation exists between two text spans.
Out of 18 activities, 8 are mentioned singly in their own paragraph, without a discourse marker other than the default one. In other words, almost half of the mentioned activities are not connected closely to another part of the text. Paragraphs that do contain more than one activity have their content internally connected with discourse markers. However, they are not connected with the other paragraphs. This is consistent with the statistics of Table 5. From this we conclude that although the generated text expresses some rhe-torical relations locally, it fails to explicitly achieve global coherence. This may leave a heavy burden on the reader in forming a repre-sentation of what happened during that day. Ana-lysing the proposed data-to-text pipeline, there are several places where this may be improved.
Before generation itself, data mining could search for more diverse types of association rules so that more logico-semantic relations could be created during data interpretation. One possibil-ity is to mine for associations where the implica-tion goes backward in time, in order to indirectly capture underlying goals. For example: He went to the toilet before going to bed. (He went to the toilet because he wanted to go to bed.) Going to the toilet may not imply going to bed afterwards, but going to bed may imply having probably gone to the toilet beforehand. Moreover, associa-tions where the implication goes in both direc-tions should then be treated differently. They should probably be expressed as a conjunction.
A problem is that the summarisation stage has the effect of removing relations with a probabil-ity higher than the threshold. So the more we summarise, the less coherent the text may be-come. A possible solution to explore would be to select important relations and events based on logico-semantic relations alone, before document planning.
Maybe the key to achieve coherence at a high-er level would be to detect more abstract eventu-alities and relations in the data. Those more ab-stract eventualities, such as routines, would in-clude more concrete ones, like activities. This would create a hierarchy that could be used to build texts that are coherent at a higher level.
In a different vein, we did not concentrate our efforts on microplanning and it could certainly
be improved. For example, as the input data is in the form of temporal intervals, the text could possibly be improved if the ADLs were de-scribed in the same way instead of as specific points in time.
10 Conclusion
We designed and implemented a method that extracts association rules from ADL data and uses them for the data-to-text generation of unu-sual fact reports. The extracted association rules were used to locally to link eventualities with rhetorical relations. However, more work will be needed to see how they could be used to enhance the global coherence of generated texts.
Future work will consist first of systematically testing different values for the confidence and significance thresholds with different datasets. Richer, bigger and more varied datasets could lead to more interesting rules being learned and more real anomalies being found. Then we will explore possible improvements, such as mining for more diverse types of association rules and detecting more abstract eventualities in the data. We will also try shifting summarization before document planning.
In this work, we have focused on providing a summary of a single factual time interval, as op-posed to generating a summary of a typical (but necessarily fictitious) day. The latter is an inter-esting and complementary idea, but the extracted associations presented were not designed to do this kind of prediction. Moreover, the training data available may be insufficient to do this ac-curately enough. Incorporating recent work on activity prediction, such as Minor et al. (2015), is an avenue that should be explored.
A more thorough evaluation, including an ap-propriate baseline, will also be needed to see if the generated texts are perceived as more coher-ent and more useful for their intended role than with other generation methods.
References Emmon Bach. 1986. The algebra of events. Linguis-
tics and philosophy, 9(1):5–16.
Nadjet Bouayad-Agha, Gerard Casamayor, Simon Mille, and Leo Wanner. 2012. Perspective-oriented Generation of Football Match Summaries: Old Tasks, New Challenges. ACM Trans. Speech Lang. Process., 9(2):3:1–3:31, August.
A. Fleury, M. Vacher, and N. Noury. 2010. SVM-Based Multimodal Classification of Activities of Daily Living in Health Smart Homes: Sensors, Al-
144

gorithms, and First Experimental Results. IEEE Transactions on Information Technology in Bio-medicine, 14(2):274–283, March.
Pablo Gervás. 2014. Composing narrative discourse for stories of many characters: A case study over a chess game. Literary and Linguistic Computing, August.
Catalina Hallett. 2008. Multi-modal presentation of medical histories. In Proceedings of the 13th inter-national conference on Intelligent user interfaces, pages 80–89.
W. Hamalainen and M. Nykanen. 2008. Efficient Dis-covery of Statistically Significant Association Rules. In ICDM ’08 Proceedings of the 2008 Eighth IEEE International Conference on Data Mining, pages 203–212. December.
James Hunter, Yvonne Freer, Albert Gatt, Ehud Reiter, Somayajulu Sripada, and Cindy Sykes. 2012. Automatic generation of natural language nursing shift summaries in neonatal intensive care: BT-Nurse. Artificial intelligence in medicine.
Leila Kosseim and Guy Lapalme. 2000. Choosing Rhetorical Structures To Plan Instructional Texts. Computational Intelligence, 16(3):408–445.
Junseok Kwon and Kyoung Mu Lee. 2012. A unified framework for event summarization and rare event detection. In CVPR, pages 1266–1273.
P. Lalanda, J. Bourcier, J. Bardin, and S. Chollet. 2010. Smart Home Systems. Grenoble University, France.
Anna S Law, Yvonne Freer, Jim Hunter, Robert H Logie, Neil McIntosh, and John Quinn. 2005. A comparison of graphical and textual presentations of time series data to support medical decision making in the neonatal intensive care unit. Journal of clinical monitoring and computing, 19(3):183–194, June. PMID: 16244840.
William C. Mann and Maite Taboada. 2005. Rhetori-cal Structure Theory : Relation definitions. Re-trieved August 26, 2014, from http://www.sfu.ca/rst/01intro/definitions.html
William C. Mann and Sandra A. Thompson. 1987. Rhetorical structure theory: A theory of text organ-ization. University of Southern California, Infor-mation Sciences Institute.
Daniel Marcu. 2000. The theory and practice of dis-course parsing and summarization. MIT Press, Cambridge, Massachusetts, USA.
A. McKinlay, C. McVittie, E. Reiter, Y. Freer, C. Sykes, and R. Logie. 2009. Design Issues for So-cially Intelligent User Interfaces: A Discourse Analysis of a Data-to-text System for Summarizing Clinical Data. Methods of Information in Medicine, 49(4):379–387, December.
Bryan Minor, Janardhan Rao Doppa, and Diane J. Cook. 2015. Data-Driven Activity Prediction: Al-gorithms, Evaluation Methodology, and Applica-tions. In Proceedings of the 21th ACM SIGKDD International Conference on Knowledge Discovery and Data Mining, pages 805–814. ACM Press.
Marco Munstermann, Torsten Stevens, and Wolfram Luther. 2012. A Novel Human Autonomy Assess-ment System. Sensors, 12(6):7828–7854, June.
Fco Javier Ordóñez, Paula de Toledo, and Araceli Sanchis. 2013. Activity Recognition Using Hybrid Generative/Discriminative Models on Home Envi-ronments Using Binary Sensors. Sensors, 13(5):5460–5477, April.
François Portet, Ehud Reiter, Albert Gatt, Jim Hunter, Somayajulu Sripada, Yvonne Freer, and Cindy Sykes. 2009. Automatic generation of textual summaries from neonatal intensive care data. Arti-ficial Intelligence, 173(7):789–816.
Ehud Reiter. 2007. An Architecture for Data-to-text Systems. In Proceedings of the Eleventh European Workshop on Natural Language Generation, pages 97–104, Stroudsburg, PA, USA. Association for Computational Linguistics.
Ivo Swartjes and Mariët Theune. 2006. A fabula model for emergent narrative. In Technologies for Interactive Digital Storytelling and Entertainment, pages 49–60. Springer.
Mariët Theune, Nanda Slabbers, and Feikje Hielkema. 2007. The Narrator: NLG for digital storytelling. In Proceedings of the Eleventh European Workshop on Natural Language Generation, pages 109–112. Association for Computational Linguistics.
Tom Trabasso, Paul Van den Broek, and So Young Suh. 1989. Logical necessity and transitivity of causal relations in stories. Discourse Processes, 12(1):1–25.
Pierre-Luc Vaudry and Guy Lapalme. 2013. Adapting SimpleNLG for bilingual English-French realisa-tion. In Proceedings of the 14th European Work-shop on Natural Language Generation, pages 183–187, Sofia, Bulgaria, August. Association for Computational Linguistics.
Pierre-Luc Vaudry and Guy Lapalme. 2015. Causal networks as the backbone for temporal data-to-text. Presented at the First International Workshop on Data-to-Text Generation, Edinburgh, United-Kingdom, March.
Leo Wanner, Bernd Bohnet, Nadjet Bouayad-Agha, François Lareau, and Daniel Nicklaß. 2010. Mar-quis: Generation of User-Tailored Multilingual Air Quality Bulletins. Applied Artificial Intelligence, 24(10):914–952.
145

Proceedings of the 15th European Workshop on Natural Language Generation (ENLG), pages 146–155,Brighton, September 2015. c©2015 Association for Computational Linguistics
Topic Transition Strategies for an Information-Giving Agent
Nadine GlasInstitut Mines-Telecom, Telecom ParisTech,
CNRS, LTCI46 Rue Barrault, 75013 Paris, [email protected]
Catherine PelachaudCNRS, LTCI, Telecom ParisTech
46 Rue Barrault, 75013 Paris, Francepelachaud@
telecom-paristech.fr
AbstractWe have explored how a conversationalagent can introduce a selected topic in anongoing non-task oriented interaction witha user, where the selected topic has littleto do with the current topic. Based onthe reasoning process of the agent we haveconstructed a set of transition strategies tointroduce the new topic. We tested the ef-fects of each of these strategies on the per-ception of the dialogue and the agent.
1 Introduction
The choice of the dialogue topics that an agentinitiates in non-task oriented human-agent inter-action is important for several aspects of the in-teraction such as the coherence of the interaction(Macias-Galindo et al., 2012) and the user’s en-gagement (Glas and Pelachaud, 2015). Multipleefforts are oriented towards the selection of the ap-propriate topic at a specific point in the interaction.However, how the selected topic can or should beintroduced by the agent has not been given muchconsideration in non-task oriented dialogue.
In this work we will explore the latter aspectby looking at utterances that may be used to ini-tiate a transition from one topic to another. Weshall call these utterances transition strategies. Bycomparing a selection of transition strategies wetry to answer two questions: 1) What strategieshave the potential of keeping/making the dialoguecoherent? And 2) what effect do the use of thedifferent transition strategies have on the percep-tion of the conversational agent? The answers tothese questions will serve to automatically gener-ate agent strategies to connect one topic to anotherin non-task oriented dialogue.
2 Domain
This research is performed for the French project‘Avatar 1:1’ that aims at developing a human-sized
virtual agent in a museum. The goal of the agentis to engage human visitors in interaction aboutthe artworks of the museum. In this information-giving chat (Glas and Pelachaud, 2015) each art-work that is discussed is defined as a topic of theinteraction. The discussion of an artwork’s char-acteristic corresponds to a subtopic (Glas et al.,2015).
Previously, we found out that the topic of the in-teraction has an important influence on the user’slevel of engagement (Glas and Pelachaud, 2015).We had human users talk with a virtual agent thataddressed several topics, correponding to differ-ent artworks. The users indicated that they weremore engaged when the agent talked about art-works for which the users have a stronger prefer-ence (defined here as degree of liking) than whenthe agent talked about less preferred topics (Glasand Pelachaud, 2015). We are therefore work-ing on an engagement driven topic manager thatdynamically selects topics for the ongoing inter-action taking into account the user’s preferences(Glas et al., 2015). In the present work we areinterested in agent strategies that may be used toconnect the newly selected topic to the currenttopic of interaction. This is necessary as the top-ics are primarily selected according to their poten-tial of engaging the user instead of their coherencewith respect to the previous topic. Where other di-alogue systems look at what topic is coherent ata specific point in the interaction (e.g. Macial-Galindo et al., 2012; Breuing and Wachsmuth,2012; Wong et al., 2012), we are looking at possi-ble strategies to introduce a topic coherently.
3 Related Work
3.1 Transition Strategies in Theory
Literature about transition strategies outside task-oriented applications can be found in the do-mains of conversational analysis and social sci-
146

ences, where they are studied from an observa-tional (detection) point of view. Downing (2000)distinguishes two forms of introducing a topic: bymeans of an informative statement, and by ask-ing a question. By informing the speaker assignshim/herself the role of topic supplier, whereas byquestioning or eliciting a topic this role is offeredto an interlocutor in the discourse.
Similarly, Button and Casey (1985) define twoglobal ways of introducing a topic that is not re-lated to the prior topic in a conversation: by atopic initial elicitor that is used to elicit a candi-date topic from the next speaker while being mutewith respect to what that topic may be, and bytopic nominations that are oriented to particularnewsworthy items. Two sequence types that maybe used for topic nomination are itemised newsenquires and news announcements. An itemisednews inquiry is oriented to a recipient’s newswor-thy item where a news announcement is orientedto a speaker’s newsworthy item.
Maynard and Zimmerman (1984) identifiedfour topic initiation strategies in dyadic human-human conversations. For acquainted parties:displaying prior experience and using settingtalk, and for unacquainted parties: categorisationquestion-answer pairs (e.g. year in school, aca-demic major, etc.) and question-answer pairs in-volving activities that are related to the categories.
Hobbs (1990) focuses on three coherence rela-tions that he claims are responsible for most ofthe so-called topic drift in dialogue: parallelism,explanation and metatalk. Parallelism betweentwo segments occur when the two segments assertpropositions from which we can infer that identi-cal properties hold of similar entities, or that simi-lar properties hold for identical entities. An expla-nation occurs when one segment functions as theexplanation of a previous segment and metatalkasserts a relation between some segment and thegoals of the conversation.
3.2 Transition Strategies in Dialogue Systems
To our knowledge, existing dialogue systems thatexplicitly consider different strategies to introducea particular topic have been developed exclusivelyfor task oriented interaction, in particular in theform of task interruption strategies. In this contextMcFarlane (2002) defines four primary methods:immediate, negotiated, mediated, and scheduledinterruption. Yang et al. (2008) found out that
dialogue partners usually use discourse markersand prosody cues to signal task switching. Guidedby these works Heinroth et al. (2011) looked at 4different task switching strategies: unassisted im-mediate topic shift, discourse markers combinedwith prosody cues, and two full sentence initialis-ing topic shifts to produce a more natural dialogueflow and to increase the timespan the user has fortask switching: explanation and negotiation strate-gies. The explanation strategy explains what taskis about to be started and the negotiation strategyasks for permission to switch a task. They evalu-ated the use of these four strategies on several di-mensions and found that the explanation strategyshowed high scores regarding efficiency and user-friendless and supports the user to memorise thetasks. Other strategies showed advantages such asbeing less irritating.
3.3 Guidelines for Topic Transitions
The above mentioned research demonstrates thatthere does not exist one overall taxonomy of tran-sition strategies that can be used as a recipe fortransition strategy generation in non-task orienteddialogue. This lack shows the need of our own re-search towards transition strategies and makes usfall back to the following generally accepted ideasabout topic switching: According to Clark (1996)a topic can be described as a joint project as it isjointly established during ongoing conversations.Svennevig (2000) adds that every spoken contri-bution may raise new potential topics whose actualrealisation depends on the co-participant’s accep-tance by picking up one of these topics within hisor her reply. To conclude, Sacks (1971, April 5in: Levinson, 1983:313) made an overall remarkthat what seems to be preferred for a topic shift isthat if A has been talking about X, B should finda way to talk about Z (if Z is the subject he wantsto introduce) such that X and Z can be found to benatural fellow members of some category Y. In thecurrent work we try to collect more precise indi-cations about how to generate transition strategiesin non-task oriented dialogue.
4 Methodology
In order to find out what strategies a conversationalagent can use to initiate topic transitions in non-task oriented dialogue we follow Heinroth et al.(2011) (Section 3.2) by testing a set of potentialtransition strategies with respect to their effects on
147

Speaker Dialogue about ”Luncheon on the Grass” by Claude Monet Subtopic[...]
Agent: Claude Monet was a French painter. He lived his entire life at Giverny, a beautiful village northof Paris.
Artist
User: Yes I know. I visited Giverny last year.Agent: This painting was made around 1865. PeriodUser: Yes, I’ve read so too.
Table 1: An example of a dialogue fragment preceding a topic switch initiated by a transition strategy.In the experiment this dialogue fragment (translated) serves as the context of scenario 1 (Section 4.3).
the perception of the dialogue and the agent. Inthe subsections below we respectively discuss thesteps to achieve this: the specification of the con-text of the transition strategies (Section 4.1), thedesign of the transition strategies themselves (Sec-tion 4.2), the setup of the experiment to test the setof strategies (Section 4.3), and the questionnairethat will be used for this (Section 4.4).
4.1 Context of the Transition Strategies
The strategies that have been mentioned in previ-ous work vary with respect to the context. Somestrategies work for topics that are interesting forthe listener and others for those that are inter-esting for the speaker (Button and Casey, 1985).Some strategies are used by acquainted partiesand others by unacquainted parties (Maynard andZimmerman, 1984). Explanation strategies in thesense of Hobbs (1990), as well as metatalk onlywork for a specific set of topics.
These constraints imply that the strategies thatcan be used to introduce a topic in a conversationdepend on the relation between the current topicof the dialogue and the new topic that is to be in-troduced. The first step in generating transitionstrategies is thus to define this relation. In the con-text of project Avatar 1:1 (Section 2) we are look-ing at strategies that an agent can employ in inter-action with an unacquainted user to make the tran-sition between two discussion phases about twodifferent artworks. In the current work we will fo-cus on what seems the most extreme case, namelythe transition between discussion phases of twovery different artworks: Artworks that have noth-ing in common except from the fact that they areboth artworks in the same museum. In this way wetest if the agent’s topic manager can indeed be al-lowed the flexibility to select any given artwork ofthe museum as next topic of the discussion. Suchflexibility helps finding (initiating) the topic thatengages the user most (Glas et al., 2015).
To be more precise, in Table 1 we give an exam-ple of a dialogue fragment that proceeds the mo-ment at which the new topic, corresponding to avery different artwork than the one discussed, isto be introduced. As the timing of introducing anew topic may have an influence on the percep-tion of the topic switch (Clark, 1996) we limit thisresearch to a topic switch that occurs after the con-versation has addressed respectively the artist andthe period of the former discussed artwork.
4.2 Design of Potential Transition Strategies
Due to the nature of the context we are dealingwith, the potential transition strategies to introducea discussion phase of another artwork are limitedto the following categories from the literature: ex-planations in the sense of Heinroth et al. (2011),informative statements (Downing, 2000), itemisednews enquires and news announcements (Buttonand Casey, 1985), categorisation question-answerpairs and question-answer pairs involving activi-ties (Maynard and Zimmerman, 1984), and paral-lelism (Hobbs, 1990). It is however not prescribedhow we could generate formulations for each ofthese detection-based categories for the context weare looking at. We thus base the manual creationof a set of potential transition strategies that be-long to one or multiple of these categories, on thegeneral guideline by Sacks (1971, Section 3.3).
According to Sacks (1971) we need to find away to let the former (current) and the next (se-lected) topic be members of some category Y. Wetry to do this by (indirectly) referring to an ele-ment that is used in the agent’s reasoning processto talk about the next topic. The agent disposesof a knowledge base that holds information aboutcertain artworks from the museum. From this setof artworks it selects dynamically a new topic ofdiscussion with the goal of maximising the user’sengagement level, taking into account the charac-teristics of the artworks (e.g. period, artist), the
148

Nr. Strategy Element in Topic Man-ager
Orien-tation
1. Pol(PrefA(i)) == Pol(PrefA(j)) Preferences Agent (i, j) AgentE.g. I also like the Balloon Dog by Jeff Koons
2. (PrefA(j) > PrefA(i)) Preferences Agent (i, j) AgentE.g. Personally, I prefer the Balloon Dog by Jeff Koons
3. AssociationA(i, j) Associations Agent (i, j) AgentE.g. This work reminds me of the Balloon Dog by Jeff Koons
4. (Pol(PrefU(i)) == +)→ (Pol(PrefU(j)) == +) Preferences User (i, j) UserE.g. If you like this work, maybe you also like the Balloon Dog by JeffKoons
5. (PrefU(j) > PrefA(i))? Preferences User (i, j) UserE.g. Maybe you prefer the Balloon Dog by Jeff Koons.
6. ExperienceA(i) + ExperienceA(j) i, j in Knowledge Base AgentE.g. I’ve also seen the Balloon Dog by Jeff Koons
7. ExperienceU(i) + ExperienceU(j)? i, j in Knowledge Base UserE.g. Have you also seen the Balloon Dog by Jeff Koons?
8. ∃ (j) ∧ (j 6= i) i, j in Knowledge Base ObjectE.g. Another artwork is the Balloon Dog by Jeff Koons
9. ∃ (j) ∧ (Artist(j) 6= Artist(i)) Characteristics(i, j) in ObjectE.g. An artwork from another artist is the Balloon Dog by Jeff Koons Knowledge Base
10. ∃ (j) ∧ (Period(j) 6= Period(i)) Characteristics(i, j) in ObjectE.g. An artwork from another period is the Balloon Dog by Jeff Koons Knowledge Base
Table 2: Potential transition strategies to connect the discussion phases of two very different artworks(translated). i is the current topic of the interaction and j is the one to be introduced. A = Agent, U =User, Pol = Polarity, Pref = Preference.
preferences of the user and the agent for an art-work (degree of liking), and the agent’s associ-ations (Glas et al., 2015). The set of potentialtransition strategies that we created by referring tothese elements is listed in Table 2. For each ofthe strategies we formulated an agent utterance torealise the strategy.
Strategies 9 and 10 that insist on the (in thiscase contrasting) characteristics of the artworksare added as a reference to the strategies that wewould use for the transition between artworks thathave characteristics in common (the category Y).
4.3 Experimental Setup
Inspired by the existing literature we have createda set of potential transition strategies for the con-text we are looking at. In order to verify if each ofthese strategies is suitable to be generated by theagent to switch the topic in the information-givingchat with the user we perform an empirical study.By means of an online questionnaire we test theeffect that the different transition strategies haveon the perception of the dialogue and the agent.
To this end we present each participant with 2different dialogue fragments (i.e. contexts) con-sisting of agent utterances and simulated user in-
puts (as e.g. Macias-Galindo et al., 2012). Eachscenario is followed by 3 randomly assigned tran-sition strategies, displayed next to each other. Wedo not show the utterances that may follow thetransition strategies. In this way we do not showan acceptance or rejection of the topic by the user(Clark, 1996; Svennevig, 2000). Directly aftereach of the 3 transition strategies we ask the par-ticipants to answer several questions (Section 4.4).Appendix A shows a fragment of the website forthis experiment. We use a written setup to allowthe participants to consider multiple strategies atthe same time in the same context, enabling cross-comparison and rereading as much as desired. Be-sides, in this way the judgements are not disturbedby unnatural text-to-speech realisations.
As mentioned before, the dialogue fragmentthat represent the former topic in the context andthe topic that is addressed in the transition strate-gies (next topic) are about very different artworks.We test 2 topic pairs for each participant (i.e. 2different scenarios) to anticipate possible effectsthat are due to individual characteristics of a par-ticular context. Scenario 1 consists of the dis-cussion of a painting by Monet (shown in table1) followed by transition strategies introducing a
149
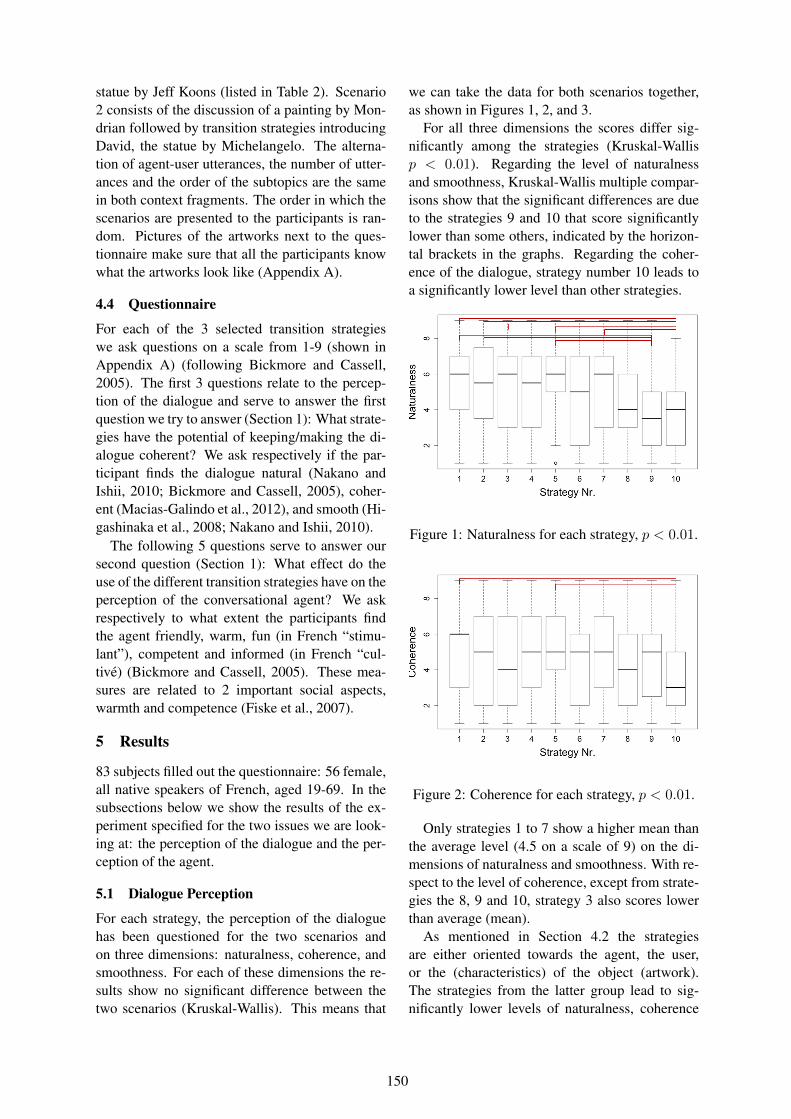
statue by Jeff Koons (listed in Table 2). Scenario2 consists of the discussion of a painting by Mon-drian followed by transition strategies introducingDavid, the statue by Michelangelo. The alterna-tion of agent-user utterances, the number of utter-ances and the order of the subtopics are the samein both context fragments. The order in which thescenarios are presented to the participants is ran-dom. Pictures of the artworks next to the ques-tionnaire make sure that all the participants knowwhat the artworks look like (Appendix A).
4.4 Questionnaire
For each of the 3 selected transition strategieswe ask questions on a scale from 1-9 (shown inAppendix A) (following Bickmore and Cassell,2005). The first 3 questions relate to the percep-tion of the dialogue and serve to answer the firstquestion we try to answer (Section 1): What strate-gies have the potential of keeping/making the di-alogue coherent? We ask respectively if the par-ticipant finds the dialogue natural (Nakano andIshii, 2010; Bickmore and Cassell, 2005), coher-ent (Macias-Galindo et al., 2012), and smooth (Hi-gashinaka et al., 2008; Nakano and Ishii, 2010).
The following 5 questions serve to answer oursecond question (Section 1): What effect do theuse of the different transition strategies have on theperception of the conversational agent? We askrespectively to what extent the participants findthe agent friendly, warm, fun (in French “stimu-lant”), competent and informed (in French “cul-tive) (Bickmore and Cassell, 2005). These mea-sures are related to 2 important social aspects,warmth and competence (Fiske et al., 2007).
5 Results
83 subjects filled out the questionnaire: 56 female,all native speakers of French, aged 19-69. In thesubsections below we show the results of the ex-periment specified for the two issues we are look-ing at: the perception of the dialogue and the per-ception of the agent.
5.1 Dialogue Perception
For each strategy, the perception of the dialoguehas been questioned for the two scenarios andon three dimensions: naturalness, coherence, andsmoothness. For each of these dimensions the re-sults show no significant difference between thetwo scenarios (Kruskal-Wallis). This means that
we can take the data for both scenarios together,as shown in Figures 1, 2, and 3.
For all three dimensions the scores differ sig-nificantly among the strategies (Kruskal-Wallisp < 0.01). Regarding the level of naturalnessand smoothness, Kruskal-Wallis multiple compar-isons show that the significant differences are dueto the strategies 9 and 10 that score significantlylower than some others, indicated by the horizon-tal brackets in the graphs. Regarding the coher-ence of the dialogue, strategy number 10 leads toa significantly lower level than other strategies.
Figure 1: Naturalness for each strategy, p < 0.01.
Figure 2: Coherence for each strategy, p < 0.01.
Only strategies 1 to 7 show a higher mean thanthe average level (4.5 on a scale of 9) on the di-mensions of naturalness and smoothness. With re-spect to the level of coherence, except from strate-gies the 8, 9 and 10, strategy 3 also scores lowerthan average (mean).
As mentioned in Section 4.2 the strategiesare either oriented towards the agent, the user,or the (characteristics) of the object (artwork).The strategies from the latter group lead to sig-nificantly lower levels of naturalness, coherence
150

Figure 3: Smoothness for each strategy, p < 0.01.
and smoothness in comparison to the strategieswith another orientation (both scenarios, Kruskal-Wallis p < 0.01). There is no significant differ-ence in the scoring of the strategies that are agentoriented versus the ones that are user oriented withrespect to the perception of the dialogue.
5.2 Agent Perception
Questions 4 to 8 are about the way the partici-pants of the experiment perceive the social com-petence (Fiske et al., 2007) of an agent that woulduse the transition strategies in the context in whichthey are presented. The results show that be-tween the two scenarios, the participants find theagent not significantly different with respect to itslevel of friendliness and knowledge (“informed”)(Kruskal-Wallis). For these dimensions we canthus analyse the data for both scenarios together.Figure 4 and 5 specify the distributions of thesedimensions for every strategy. The level of friend-liness differs significantly among the strategies(Kruskal-Wallis p < 0.01), which is due to strate-gies 8, 9, and 10 (Kruskal-Wallis multiple com-parisons). However, only strategy 10 scores belowaverage for the level of friendliness (mean < 4.5).For all strategies the agent is not perceived sig-nificantly different with respect to its knowledge(“informed”) and all of the strategies score aboveaverage on this dimension (mean < 4.5).
In contrast to the agent’s level of friendlinessand knowledge (“informed”), for the dimensionsof warmth, fun and competence, some strategiesare significantly differently judged among bothscenarios (Kruskal-Wallis p < 0.05). Figure 6, 7and 8 show the distribution of the results specifiedfor both scenarios. The circled numbers indicatethe strategies that are judged differently between
Figure 4: Friendliness for each strategy, p < 0.01.
Figure 5: Agent being informed for each strategy.
both scenarios. On the dimension of warmth, strat-egy number 8 scores significantly higher in thesecond scenario (Monet-Koons) than in the first(Mondian-Michelangeloo). Together with strategy6, strategy 8 also scores higher in the second sce-nario with respect to the level of fun that the partic-ipants perceived in the agent. Further, in the sec-ond scenario strategies 4 and 6 score higher on thedimension of competence than in the first scenario.
With respect to the agent’s perceived level ofwarmth as well as fun, in scenario 1, strategies 8, 9and 10 score significantly lower than other strate-gies (Kruskal-Wallis p < 0.01). In this scenariostrategies 6, 8 and 10 also score below average(mean < 4.5). For scenario 2 strategy 10 scoressignificantly lower than other strategies (Kruskal-Wallis p < 0.01) and falls below average.
Scenario 1 shows significant differences be-tween the scorings of the agent’s perceived levelof competence (Kruskal-Wallis p < 0.01). Multi-ple comparisons (Kruskal-Wallis) do not indicatea specific pair of strategies that is responsible forthis difference. Strategy 3 is the only strategy that
151

Figure 6: Warmth for each strategy, p < 0.01. Be-tween scenarios strategy 8 differs p < 0.05.
Figure 7: Fun for each strategy, p < 0.01. Be-tween scenarios strategies 6, p < 0.05, and 8,p < 0.01, differ.
scores below average (mean < 4.5). In scenario2 the strategies show no significant differences orscorings below average.
Comparing the strategies that are oriented to-wards the agent with those that oriented towardsthe user (Table 2) does not lead to a significant dif-ference with respect to the perception of the agent(both scenarios, Kruskal-Wallis). The strategiesthat are not oriented towards the agent or user, butrefer to the (characteristics) of the object (artwork)lead to significantly lower levels of friendliness,warmth and fun in comparison with the strategiesthat are oriented towards the interaction partici-pants (both scenarios, Kruskal-Wallis p < 0.01).
Within the group of strategies that are agent oruser oriented, we can make another grouping ac-cording to the element of the agent’s reasoningprocess that is referred to: preferences (1,2,4,5),associations (3) and the presence of an artwork inthe agent’s knowledge base (6,7). A comparisonbetween these groups leads to one significant re-
Figure 8: Competence for each strategy, p < 0.01for scenario 1. Between scenarios strategies 4, p <0.05, and 6, p < 0.01, differ.
sult: in scenario 1, strategies that use preferencesscore significantly higher on competence than thestrategies from the other groups (Kruskal-Wallisp < 0.01, Kruskal-Wallis multiple comparisons).
6 Discussion
The results show that the transition strategies thatinsist on contrasting characteristics of the artworkssuch as a different artist (strategy 9) or period(strategy 10) lead to scores below average (4.5 ona scale of 9) with respect to the level of natural-ness, coherence and smoothness. On the level ofnaturalness and smoothness the difference with theother strategies is significant. This demonstratesthat even when the artist and period of the formerartwork have been discussed just before the tran-sition strategies, making transition strategies thatare based on (referring back to) the earlier dis-cussed characteristics (subtopics), does not guar-antee a natural, coherent and smooth dialogue.
The fact that strategy 8, that presents anotherartwork as just being another artwork, scores be-low average on naturalness and coherence, showsthat ”being an artwork” is not a category thatcan sufficiently bind both topics (”category Y” bySacks, 1971 in Levinson, 1983). This can haveseveral reasons: The transition strategy may notsucceed in presenting the former and latter art-work in being natural fellow members of somecategory Y, in this case being an artwork. Cate-gory Y may need to be a more restrictive (distinc-tive) category than one to which all topics belong(all topics are artworks) in order to bind two spe-cific topics. Or, making both topics natural fellowmembers of some category Y may not be sufficient
152

in general to establish a natural and coherent dia-logue.
A reason why strategy 3 that is based on the as-sociations of the agent, scores bad on coherencebut well on naturalness and smoothness may bedue to the fact that the participants can find theassociation itself incoherent. Due to the contrast-ing characteristics of the artworks the participantsmay find it incoherent that the first artwork re-minds the agent of the second. However, giventhat the strategy is considered natural and smoothimplies that it might be a suitable strategy to con-nect the discussions of two similar artworks.
The same explanation can be given for the lowscoring of this strategy (3) with respect to the per-ception of the agent’s level of competence (sce-nario 1). When the agent associates two artworksthat do not seem alike the agent is perceived lesscompetent than average.
The strategies that lead to low scores on natu-ralness, coherence and smoothness of the dialogue(8, 9 and 10) also score relatively low with respectto the perception of friendliness, fun and warmthof the agent. This gives us reasons to suspect thatboth aspects are related: when a dialogue is notconsidered natural, coherent or smooth, the agentis not considered as very friendly, fun and warm.
The participants do not perceive the agent sig-nificantly more or less informed when it uses cer-tain transition strategies instead of others. Thisshows that referring explicitly to the characteris-tics of the artworks such as its artist (9) or period(10) does not make the agent look more informedthan when the strategies refer to more subjectiveaspects of the agent’s reasoning process, such asits preferences or associations.
On the contrary, strategies that refer to the pref-erences of the interaction participants score signif-icantly higher with respect to the agent’s level ofcompetence than the strategies that use other vari-ables from the agent’s reasoning process.
With respect to the consequences of the transi-tion strategies on the perception of the dialoguethe results have shown no significant differenceamong both scenarios. The effects on the percep-tion of the dialogue that are discussed in this Sec-tion seem thus generalisable for the domain weare looking at (Section 4.1). However, for sometransition strategies the perception of the agentis judged significantly differently among the twoscenarios. For example, strategy 6, a statement of
the fact that the agent has seen some other artwork,has in some contexts a negative influence on theagent’s level of fun and competence, where this isnot the case in other contexts. In the two scenariosthat were used for this experiment the type of in-formation, the utterance types, and the number ofutterances are equal. Therefore, further researchwill be needed to show what exactly the underly-ing reason is that the same strategies lead, in a dif-ferent scenario, to a difference in the perception ofthe agent.
7 Conclusion
In this work we have looked at how a selectedtopic of discussion can be introduced by an agentin an ongoing non-task oriented dialogue. In thecontext we are looking at, each topic consists ofthe discussion of an artwork from a museum. In-spired by social and conversational analytic litera-ture we first constructed a set of candidate transi-tion strategies. We then checked the consequencesof each of these transition strategies on the percep-tion of the dialogue and the agent.
We have found that the strategies that score wellon all dimensions and all tested circumstances arethose that ask for the experience of the user, andthose that refer to the preferences of the interactionparticipants. Whether the preference is the agent’sor the user’s, and whether or not the new topic ispreferred over the current one, transition strate-gies that integrate any type of preference main-tain the coherence of the dialogue while maintain-ing/establishing a positive perception of the agent.The fact that certain transition strategies can con-nect topics about very different artworks whilemaintaining positive perceptions of the dialogueand the agent, shows that the agent’s topic man-ager can indeed be allowed to select any topic re-quired to engage the user at any moment in theconversation (Glas et al., 2015).
We plan to use the observations we obtainedin this study by automatically generating appro-priate transition strategies for the conversationalagent whenever the topic manager initiates a topicswitch. The automatic generation of the transitionstrategies could be performed by means of tem-plates where the object names and characteristicscan be generated from the agent’s knowledge base.In the future we would like to explore the effectsof the timing of the topic switch on the percep-tion of the topic transition (Clark, 1996). Lastly,
153

we would like to consider the agent’s non-verbalbehaviour with respect to topic switching. Non-verbal behaviour plays an important role in topicswitching (Kendon, 1972) and in the perception ofverbal behaviour in general (Sidner et al., 2005).
Acknowledgements
We would like to thank Sophie Rosset and An-drew Kehler for valuable discussion, and BriceDonval and Caroline Langlet for technical sup-port. We would also like to thank all the partici-pants of the experiment. This research is partiallyfunded by the French project Avatar 1:1, ANRMOCA, and the Labex SMART (ANR-11-LABX-65) supported by French state funds managed bythe ANR, within the Investissements d’Avenir pro-gram under reference ANR-11-IDEX-0004-02.
References
Timothy Bickmore and Justine Cassell. 2005. Socialdialongue with embodied conversational agents. InAdvances in natural multimodal dialogue systems,pages 23–54. Springer.
Alexa Breuing and Ipke Wachsmuth. 2012. Let’stalk topically with artificial agents! providing agentswith humanlike topic awareness in everyday dia-log situations. In Proceedings of the 4th interna-tional conference on agents and artificial intelli-gence (ICAART), volume 2.
Graham Button and Neil Casey. 1985. Topic nomina-tion and topic pursuit. Human studies, 8(1):3–55.
Herbert H Clark. 1996. Using language, volume 1996.Cambridge university press Cambridge.
Angela Downing. 2000. Talking topically. CIRCLEof Linguistics Applied to Communication (CLAC),3:31–50.
Susan T Fiske, Amy JC Cuddy, and Peter Glick.2007. Universal dimensions of social cognition:Warmth and competence. Trends in cognitive sci-ences, 11(2):77–83.
Nadine Glas and Catherine Pelachaud. 2015. User en-gagement and preferences in information-given chatwith virtual agents. In Workshop on Engagement inSocial Intelligent Virtual Agents. Forthcoming.
Nadine Glas, Ken Prepin, and Catherine Pelachaud.2015. Engagement driven topic selection for aninformation-giving agent. In Workshop on the Se-mantics and Pragmatics of Dialogue (SemDial),pages 48–57.
Tobias Heinroth, Savina Koleva, and Wolfgang Minker.2011. Topic switching strategies for spoken dia-logue systems. In INTERSPEECH, pages 2077–2080.
Ryuichiro Higashinaka, Kohji Dohsaka, and HidekiIsozaki. 2008. Effects of self-disclosure and em-pathy in human-computer dialogue. In SpokenLanguage Technology Workshop, 2008. SLT 2008.IEEE, pages 109–112. IEEE.
Jerry R Hobbs. 1990. Topic drift. Conversational or-ganization and its development, 38:3–22.
Adam Kendon. 1972. Some relationships betweenbody motion and speech. Studies in dyadic commu-nication, 7:177.
Stephen C Levinson. 1983. Pragmatics (Cambridgetextbooks in linguistics). Cambridge UniversityPress.
Daniel Macias-Galindo, Wilson Wong, John Thangara-jah, and Lawrence Cavedon. 2012. Coherent topictransition in a conversational agent. In Proceedingsof the 13th Annual Conference of the InternationalSpeech Communication Association (InterSpeech),Oregon, USA.
Douglas W Maynard and Don H Zimmerman. 1984.Topical talk, ritual and the social organization ofrelationships. Social psychology quarterly, pages301–316.
Daniel McFarlane. 2002. Comparison of four primarymethods for coordinating the interruption of peoplein human-computer interaction. Human-ComputerInteraction, 17(1):63–139.
Yukiko I Nakano and Ryo Ishii. 2010. Estimat-ing user’s engagement from eye-gaze behaviors inhuman-agent conversations. In Proceedings of the15th international conference on Intelligent user in-terfaces, pages 139–148. ACM.
Candace L Sidner, Christopher Lee, Cory D Kidd, NealLesh, and Charles Rich. 2005. Explorations in en-gagement for humans and robots. Artificial Intelli-gence, 166(1):140–164.
Jan Svennevig. 2000. Getting acquainted in conversa-tion: a study of initial interactions, volume 64. JohnBenjamins Publishing.
Wilson Wong, Lawrence Cavedon, John Thangarajah,and Lin Padgham. 2012. Flexible conversationmanagement using a bdi agent approach. In Intel-ligent Virtual Agents, pages 464–470. Springer.
Fan Yang, Peter A Heeman, and Andrew Kun. 2008.Switching to real-time tasks in multi-tasking dia-logue. In Proceedings of the 22nd InternationalConference on Computational Linguistics-Volume 1,pages 1025–1032. Association for ComputationalLinguistics.
154

Appendix A. Website for the experiment
Figure 9: A screenshot of the website for the online experiment. The order of the scenarios and theselection of transition strategies differ among participants.
155

Proceedings of the 15th European Workshop on Natural Language Generation (ENLG), pages 156–165,Brighton, September 2015. c©2015 Association for Computational Linguistics
Creating Textual Driver Feedback from Telemetric Data
Daniel Braun Ehud Reiter Advaith SiddharthanDepartment of Computing Science
University of Aberdeen{r01db14, e.reiter, advaith}@abdn.ac.uk
Abstract
Usage based car insurances, which usesensors to track driver behaviour, are en-joying growing popularity. Although thedata collected by these insurances couldprovide detailed feedback about the driv-ing style, this information is usually keptaway from the driver and is used only tocalculate insurance premiums. In this pa-per, we explored the possibility of pro-viding drivers with textual feedback basedon telemetric data in order to improveindividual driving, but also general roadsafety. We report that textual feedbackgenerated through NLG was preferred tonon-textual summaries currently popularin the field and specifically was better atgiving users a concrete idea of how toadapt their driving.
1 Introduction
Although the number of road deaths in the UK issteadily decreasing, 1,713 people died in road ac-cidents in 2013 and 21,657 were seriously injuredaccording to the Department for Transport (2014).Nearly 35% of those who died were under the ageof 30. Modern cars are often equipped with nu-merous driving assistance systems that detect andresolve dangerous situations, but these systems arenot available in cheaper and older cars, which areparticularly popular among younger drivers. Inthis group so called “black box” or “telematic”car insurances are becoming more and more pop-ular and insurance companies expect that by 2020nearly 40% of all car insurances in the UK will betelemetric (Rose, 2013).
Telematic insurances use different sensors in-stalled in the car to track the individual drivingstyle of their customers. Instead of calculating in-surance premiums based on statistical risk groups,
insurance companies can use these data to cre-ate individual risk profiles and calculate insurancepremiums accordingly. This offers drivers who be-long to a high-risk group, like young male drivers,the opportunity to save money. Very detailed feed-back could be produced from these data whichcould be able to help drivers to improve their driv-ing and hence road safety. However the feedbackinsurance companies give to their customers, ifthey give any feedback at all, is often very sparse:The current state of the art of driver feedback, asused by insurance policies like AXA Drivesave1
and Aviva Drive2, are scores (e.g. from 0 to 100) ingeneral categories like “pace” and “smoothness”or maps where incidents are marked with pins, asused by Intelligent Marmalade3. As we show inSection 4, this feedback is not perceived as help-ful by drivers.
Drivers who use such an insurance have a par-ticularly high motivation (i.e. money) to changetheir behaviour. However a system which pro-vides helpful feedback could also be useful forother drivers, especially for example for learnersand young drivers. Therefore, in this paper, we ex-plored the possibility of providing drivers with in-dividual textual feedback based on telemetric data,in order to improve road safety. We evaluated theconcept of textual driver feedback against the cur-rent state of the art feedback mechanisms, to findout if a textual feedback system is perceived asmore helpful by drivers.
From an NLG point of view there are two mainchallenges in creating such a system: Driving onehour can create up to 300,000 data points, whichhave to be grouped and analysed in a way that al-lows us to describe important information within
1https://play.google.com/store/apps/details?id=com.mydrive.axa.drivesave
2https://play.google.com/store/apps/details?id=com.aviva.ukgi.avivadrive
3https://play.google.com/store/apps/details?id=com.wantstudios.marmalade
156
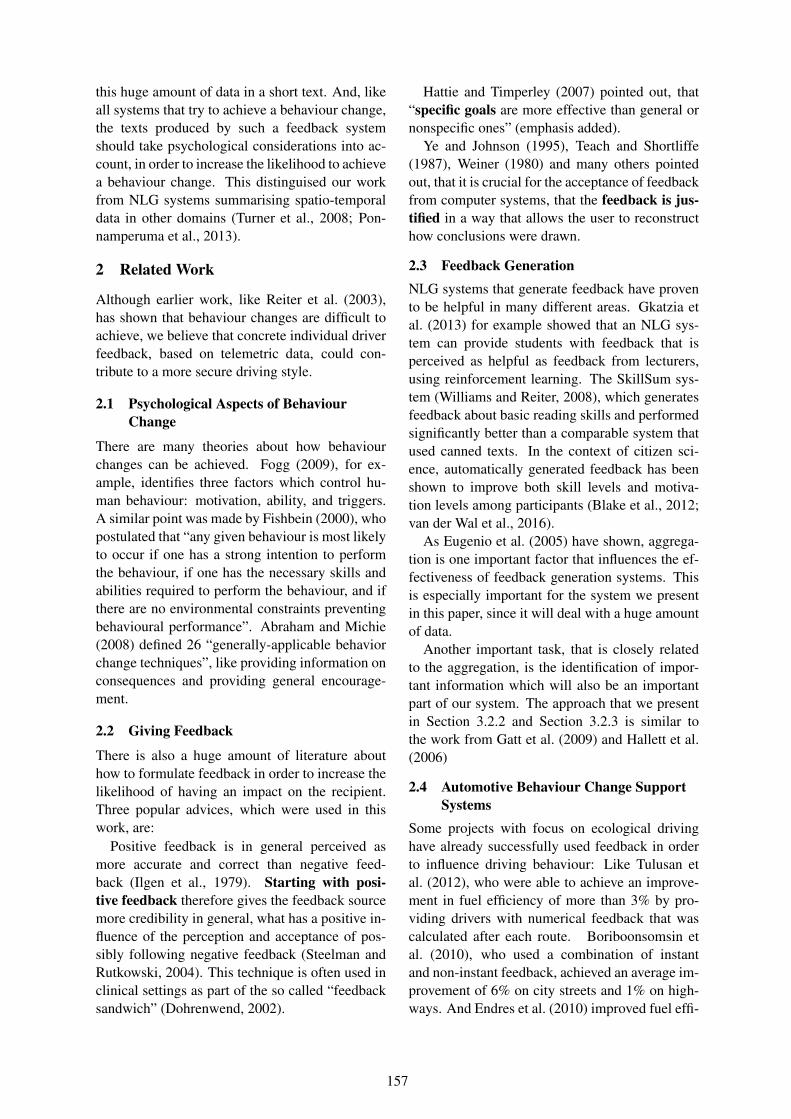
this huge amount of data in a short text. And, likeall systems that try to achieve a behaviour change,the texts produced by such a feedback systemshould take psychological considerations into ac-count, in order to increase the likelihood to achievea behaviour change. This distinguised our workfrom NLG systems summarising spatio-temporaldata in other domains (Turner et al., 2008; Pon-namperuma et al., 2013).
2 Related Work
Although earlier work, like Reiter et al. (2003),has shown that behaviour changes are difficult toachieve, we believe that concrete individual driverfeedback, based on telemetric data, could con-tribute to a more secure driving style.
2.1 Psychological Aspects of BehaviourChange
There are many theories about how behaviourchanges can be achieved. Fogg (2009), for ex-ample, identifies three factors which control hu-man behaviour: motivation, ability, and triggers.A similar point was made by Fishbein (2000), whopostulated that “any given behaviour is most likelyto occur if one has a strong intention to performthe behaviour, if one has the necessary skills andabilities required to perform the behaviour, and ifthere are no environmental constraints preventingbehavioural performance”. Abraham and Michie(2008) defined 26 “generally-applicable behaviorchange techniques”, like providing information onconsequences and providing general encourage-ment.
2.2 Giving Feedback
There is also a huge amount of literature abouthow to formulate feedback in order to increase thelikelihood of having an impact on the recipient.Three popular advices, which were used in thiswork, are:
Positive feedback is in general perceived asmore accurate and correct than negative feed-back (Ilgen et al., 1979). Starting with posi-tive feedback therefore gives the feedback sourcemore credibility in general, what has a positive in-fluence of the perception and acceptance of pos-sibly following negative feedback (Steelman andRutkowski, 2004). This technique is often used inclinical settings as part of the so called “feedbacksandwich” (Dohrenwend, 2002).
Hattie and Timperley (2007) pointed out, that“specific goals are more effective than general ornonspecific ones” (emphasis added).
Ye and Johnson (1995), Teach and Shortliffe(1987), Weiner (1980) and many others pointedout, that it is crucial for the acceptance of feedbackfrom computer systems, that the feedback is jus-tified in a way that allows the user to reconstructhow conclusions were drawn.
2.3 Feedback GenerationNLG systems that generate feedback have provento be helpful in many different areas. Gkatzia etal. (2013) for example showed that an NLG sys-tem can provide students with feedback that isperceived as helpful as feedback from lecturers,using reinforcement learning. The SkillSum sys-tem (Williams and Reiter, 2008), which generatesfeedback about basic reading skills and performedsignificantly better than a comparable system thatused canned texts. In the context of citizen sci-ence, automatically generated feedback has beenshown to improve both skill levels and motiva-tion levels among participants (Blake et al., 2012;van der Wal et al., 2016).
As Eugenio et al. (2005) have shown, aggrega-tion is one important factor that influences the ef-fectiveness of feedback generation systems. Thisis especially important for the system we presentin this paper, since it will deal with a huge amountof data.
Another important task, that is closely relatedto the aggregation, is the identification of impor-tant information which will also be an importantpart of our system. The approach that we presentin Section 3.2.2 and Section 3.2.3 is similar tothe work from Gatt et al. (2009) and Hallett et al.(2006)
2.4 Automotive Behaviour Change SupportSystems
Some projects with focus on ecological drivinghave already successfully used feedback in orderto influence driving behaviour: Like Tulusan etal. (2012), who were able to achieve an improve-ment in fuel efficiency of more than 3% by pro-viding drivers with numerical feedback that wascalculated after each route. Boriboonsomsin etal. (2010), who used a combination of instantand non-instant feedback, achieved an average im-provement of 6% on city streets and 1% on high-ways. And Endres et al. (2010) improved fuel effi-
157

ciency by using social networks and gamificationelements.
There are also systems which use instant feed-back, like the CarCoach project from Arroyo etal. (2006). CarCoach uses numerous sensors, likecameras and pressure sensors, to provide imme-diate feedback on incidents like not looking atthe road or being distracted by handling the ra-dio while driving. However, Sharon et al. (2005)showed that negative feedback from the system iseasily perceived as frustrating. And there is alsoalways a risk that the feedback itself is a furtherdistraction, when given immediately.
3 Methods
3.1 Data CollectionInsurance companies use mainly two different ap-proaches to collect their data: They either usepermanently installed sensors, often called “blackbox”, or smart phone applications. In both casesGPS timestamps and coordinates as well as accel-eration data are logged. Although especially smartphone solutions, but to a less extent also black boxsolutions, raise a lot of questions about data relia-bility and integrity, as pointed out by Handel et al.(2014) and others, according to Nol (2015) thesetwo approaches have together a worldwide marketshare of nearly 80% of all telematic insurances.
As our research is focused on data analysis andpresentation, rather than the collection, we de-cided to choose a smart phone based approach, asthis method is less intrusive for the car owner andcan be used by any driver interested in feedback,without going through an insurance company. Theapplication we used for the data collection wasbased on previous work by Braun et al. (2011).
The data corpus we used to develop our pro-totype consisted of about 600 road miles, drivenby five different drivers in four different countries.Table 1 shows an example of the data logged bythe acceleration sensor, Table 2 shows data loggedby the GPS receiver. The acceleration sensor logsthe date, the time and the acceleration in m
s2. The
GPS receiver logs the latitude and longitude co-ordinates, the accuracy of the localization in me-ters and the GPS timestamp. Additional informa-tion that is needed during the data analysis, likestreet names, street types and speed limits, are ob-tained from OpenStreetMap. In order to accessthese data, we used Nominatim4, to match GPS
4https://nominatim.openstreetmap.org
coordinates to streets in OpenStreetMap.
3.2 Data Analysis
In order to provide feedback, we first have todecide which behaviour should be classified as“right” and which as “wrong” and when wrongbehaviour is relevant or significant enough to betaken into account for the feedback generation.
3.2.1 Specification of Relevant BehaviourThe most obvious approach would probably beto expect law-abiding behaviour. However it isworth considering different points of view beforespecifying which behaviour should be regarded as“good” and which should be regarded as “bad”.From the police’s point of view the naive ap-proach of law-abidance may be sufficient, froma driving instructor’s point of view other thingsare also important, like energy-saving and smooth-ness. As our research is closely related to telem-atic insurances, particular attention should be paidto the point of view of insurance companies. Al-though their exact metrics are secret, we know thatthey take into account speeding, time of day, dayof week, acceleration, braking, elapsed distance,road type and other parameters (cf. Handel et al.(2014) for a more extensive list). On one hand weunderstandably wanted to stick close to the insur-ance metrics, on the other hand, from a motiva-tional point of view, it is strongly advised to anal-yse these parameters critically. It would be, forexample, very frustrating for a driver who needs todrive to work at 6 a.m. every weekday, to be toldthat he should not drive before 9 a.m., because itcould increase his insurance premium.
After taking all these different considerationsinto account, we decided to concentrate on speed-ing and acceleration and braking behaviour. Theseare three of the most important parameters for in-surance companies, because wrong behaviour inthese categories often causes accidents. They arealso important for driving instructors. There are,of course, many other important parameters, likedistraction and safety distance, which can not betaken into account due to the limitation of theavailable data.
Speeding, acceleration and braking also havequantitative dimensions, which are very importantfor feedback generation. While it is reasonable todefine driving 30 mph where 20 mph are allowedas wrong behaviour it is arguable if that is the casefor driving 21 mph too. In the UK, there is no com-
158

date time x y z08.01.2015 12:07:10.838 1.4939818 2.1068976 9.76834308.01.2015 12:07:10.858 1.4556746 2.183512 9.73003608.01.2015 12:07:10.879 1.6472107 2.1452048 9.653421
Table 1: Data logged by the acceleration sensor (in ms2
)
lat lon accuracy (in m) timestamp57.16042614 -2.09462595 10.0 142071883192157.1604265 -2.0946818 6.0 142071883293357.16042663 -2.0946828 6.0 1420718833934
Table 2: Data logged by the GPS receiver
pulsory law about how to handle these issues andthe decision is up to the police officer’s discretion.The Association of Chief Police Officers (2015)suggest a tolerance of 10% of the speed limit +2mph. Other countries have fixed tolerance, likeGermany, with a tolerance of 3%, or no toleranceat all, like Switzerland. Due to the limited ac-curacy of our measuring method, we decided toadopt a tolerance of 10% of the speed limit, be-fore an incident is classified as speeding. We alsodecided to ignore violations of the speed limit witha length under 10 meters.
While the quantification of speeding incidentscan be derived from laws, the situation is less obvi-ous for inappropriate acceleration or braking. Af-ter numerous test, we decided to adopt the guide-lines we derived from the AXA Drivesave app,which categorises speeding and braking incidentsin 4 classes: An acceleration up to +/- 2m
s2is
permissible. Non-permissible behaviour is classi-fied in three categories: Acceleration between +/-2− 3m
s2, +/- 3− 4m
s2and >+/<- 4m
s2.
3.2.2 Detection of Relevant BehaviourAfter finishing a trip, the raw sensor data, ob-tained by the smart phone application, is parsedfor incidents that meet the above described cri-teria. While acceleration and braking incidentscan be detected directly from the sensor data, therecognition of speeding needs further information,namely the speed limit. The prototype we de-veloped uses speed limits provided by the Open-StreetMap project. As the speed limit is not avail-able for all streets in the OpenStreetMap-data, wealso implemented a fall-back-mechanism, whichsets the speed limit to the general national limit forthe road type, for example 60 mph for single car-riageways in the UK, if no further information is
provided. Although data from OpenStreetMap hasshown to be relatively reliable (Neis et al., 2011)user generated data can always have flaws. Butsince our analysis focuses on recurring behaviourpatterns, rather than single incidents, the impact ofsingle failures is minimized. However, for a com-mercial system, more reliable data sources couldbe used.
Each detected incident is stored in a database, asshown in Figure 1. The saved data set contains twotimestamps and two GPS coordinate-pairs (startand end), the distance of the incident, the maxi-mum value during the incident (either maximumspeed or maximum acceleration) and the averagevalue, as well as a unique ID that links to the streetthe incident happened on.
Based on these information an importance valueis calculated for each incident. The importance ofan incident is expressed as a number between 0and 100 and is based on the type of the incident(speeding incidents are more important than brak-ing incidents, which are more important than ac-celeration incidents), the distance, the maximumand average value and the type of the road the in-cident happened on.
3.2.3 Aggregation through ClusteringCommon feedback systems for drivers, like lanedeparture warning systems or distance alert sys-tems, give instant feedback about current or evenupcoming situations. Our approach however isbased on non-instant feedback and aims for aweekly feedback period. The significance of asingle incident is therefore considerably lower inour system. As past behaviour can not be changedanyway, we focus on influencing future behaviour.We try to achieve this goal by identifying recurringbehaviour patterns in the driving as these patterns
159
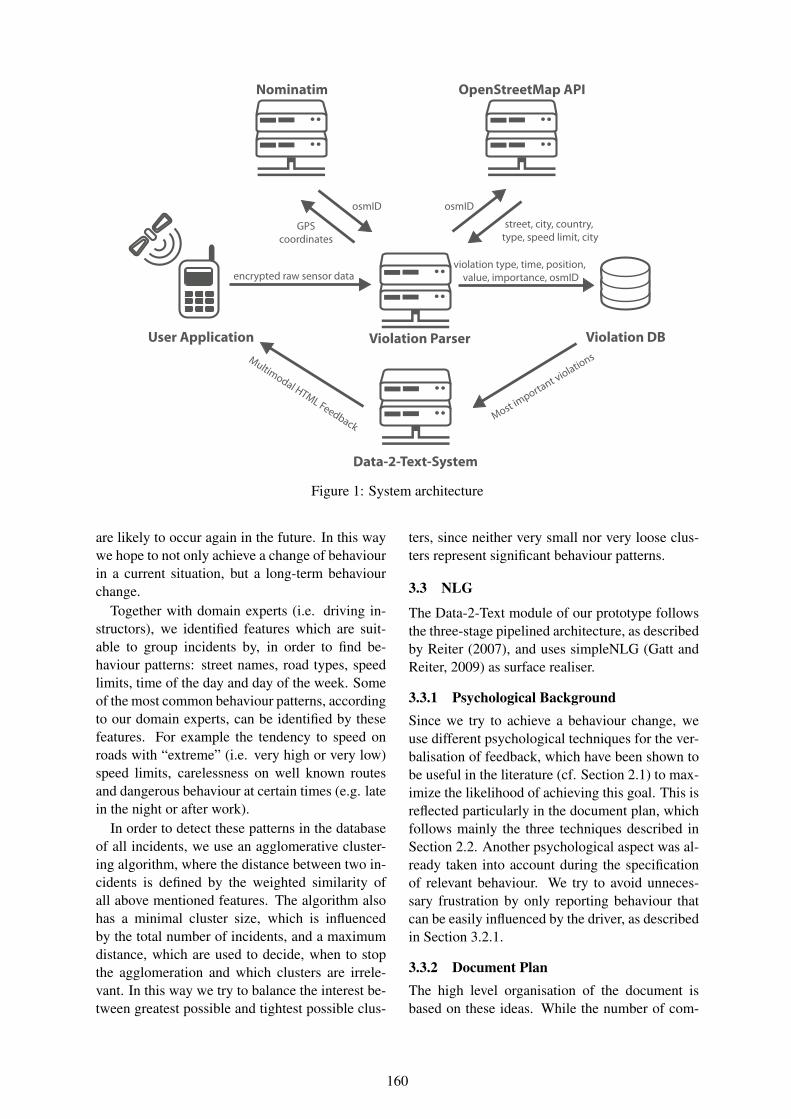
Nominatim
Violation DBUser Application
encrypted raw sensor data
GPScoordinates
street, city, country, type, speed limit, city
violation type, time, position, value, importance, osmID
Multimodal HTML Feedback
Violation Parser
Data-2-Text-System
Most importa
nt violations
OpenStreetMap API
osmID osmID
Figure 1: System architecture
are likely to occur again in the future. In this waywe hope to not only achieve a change of behaviourin a current situation, but a long-term behaviourchange.
Together with domain experts (i.e. driving in-structors), we identified features which are suit-able to group incidents by, in order to find be-haviour patterns: street names, road types, speedlimits, time of the day and day of the week. Someof the most common behaviour patterns, accordingto our domain experts, can be identified by thesefeatures. For example the tendency to speed onroads with “extreme” (i.e. very high or very low)speed limits, carelessness on well known routesand dangerous behaviour at certain times (e.g. latein the night or after work).
In order to detect these patterns in the databaseof all incidents, we use an agglomerative cluster-ing algorithm, where the distance between two in-cidents is defined by the weighted similarity ofall above mentioned features. The algorithm alsohas a minimal cluster size, which is influencedby the total number of incidents, and a maximumdistance, which are used to decide, when to stopthe agglomeration and which clusters are irrele-vant. In this way we try to balance the interest be-tween greatest possible and tightest possible clus-
ters, since neither very small nor very loose clus-ters represent significant behaviour patterns.
3.3 NLG
The Data-2-Text module of our prototype followsthe three-stage pipelined architecture, as describedby Reiter (2007), and uses simpleNLG (Gatt andReiter, 2009) as surface realiser.
3.3.1 Psychological BackgroundSince we try to achieve a behaviour change, weuse different psychological techniques for the ver-balisation of feedback, which have been shown tobe useful in the literature (cf. Section 2.1) to max-imize the likelihood of achieving this goal. This isreflected particularly in the document plan, whichfollows mainly the three techniques described inSection 2.2. Another psychological aspect was al-ready taken into account during the specificationof relevant behaviour. We try to avoid unneces-sary frustration by only reporting behaviour thatcan be easily influenced by the driver, as describedin Section 3.2.1.
3.3.2 Document PlanThe high level organisation of the document isbased on these ideas. While the number of com-
160
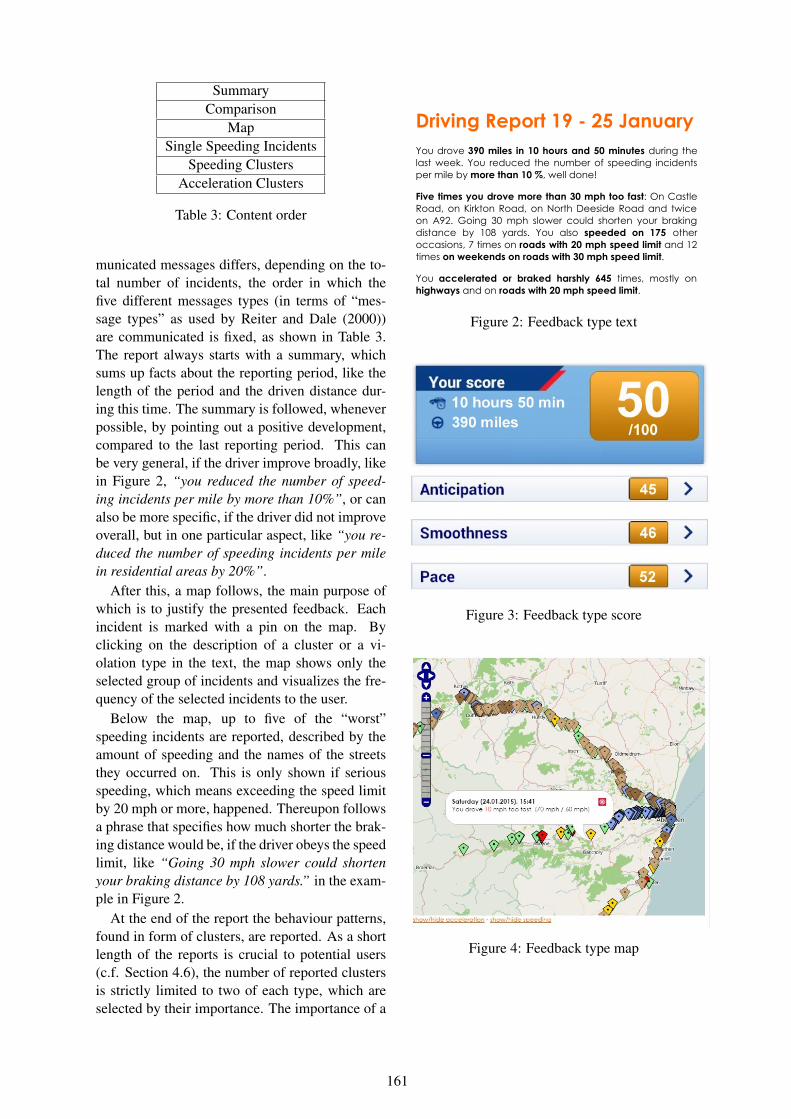
SummaryComparison
MapSingle Speeding Incidents
Speeding ClustersAcceleration Clusters
Table 3: Content order
municated messages differs, depending on the to-tal number of incidents, the order in which thefive different messages types (in terms of “mes-sage types” as used by Reiter and Dale (2000))are communicated is fixed, as shown in Table 3.The report always starts with a summary, whichsums up facts about the reporting period, like thelength of the period and the driven distance dur-ing this time. The summary is followed, wheneverpossible, by pointing out a positive development,compared to the last reporting period. This canbe very general, if the driver improve broadly, likein Figure 2, “you reduced the number of speed-ing incidents per mile by more than 10%”, or canalso be more specific, if the driver did not improveoverall, but in one particular aspect, like “you re-duced the number of speeding incidents per milein residential areas by 20%”.
After this, a map follows, the main purpose ofwhich is to justify the presented feedback. Eachincident is marked with a pin on the map. Byclicking on the description of a cluster or a vi-olation type in the text, the map shows only theselected group of incidents and visualizes the fre-quency of the selected incidents to the user.
Below the map, up to five of the “worst”speeding incidents are reported, described by theamount of speeding and the names of the streetsthey occurred on. This is only shown if seriousspeeding, which means exceeding the speed limitby 20 mph or more, happened. Thereupon followsa phrase that specifies how much shorter the brak-ing distance would be, if the driver obeys the speedlimit, like “Going 30 mph slower could shortenyour braking distance by 108 yards.” in the exam-ple in Figure 2.
At the end of the report the behaviour patterns,found in form of clusters, are reported. As a shortlength of the reports is crucial to potential users(c.f. Section 4.6), the number of reported clustersis strictly limited to two of each type, which areselected by their importance. The importance of a
Driving Report 19 25 JanuaryYou drove 390 miles in 10 hours and 50 minutes during thelast week. You reduced the number of speeding incidentsper mile by more than 10 %, well done!
Five times you drove more than 30 mph too fast: On CastleRoad, on Kirkton Road, on North Deeside Road and twiceon A92. Going 30 mph slower could shorten your brakingdistance by 108 yards. You also speeded on 175 otheroccasions, 7 times on roads with 20 mph speed limit and 12times on weekends on roads with 30 mph speed limit.
You accelerated or braked harshly 645 times, mostly onhighways and on roads with 20 mph speed limit.
Figure 2: Feedback type text
Figure 3: Feedback type score
Figure 4: Feedback type map
161

cluster is a combination of the importance valuesof the single incidents within the cluster and thesize of the cluster.
3.3.3 VariationDue to the fixed structure and the brevity of thetext, the space for variation is limited. Neverthe-less, as feedback reports will be generated weekly,we added some variation to the text generation. Aswe expect behaviour changes, there should be a“natural” variation, because of the change of theunderlying messages. The most static text, withregard to the underlying data, is the summary atthe beginning, therefore there are nine differentpossibilities how the content of the same messagecan be realised as text, by changing the order ofthe sentence, formulations or leaving less impor-tant facts, like the driven time, out. In the secondpart, which starts after the map and consists of twosections, there is also a possible structural varia-tion, as there is either one section about speedingand one about acceleration or one section with sin-gle incidents and one with clusters.
4 Evaluation
In order to evaluate our approach, we developed aquestionnaire to find out how potential users per-ceive textual feedback, compared to the two stateof the art types of feedback, maps and scores.
4.1 Data
For this evaluation we used two real datasetsrecorded in Aberdeen and Aberdeenshire each ofwhich was used twice, once in full length and onceby selecting a smaller subset. The feedback thatwas evaluated by the participants of our study wasbased on these datasets. These trips were not partof the training dataset we used to develop our pro-totype.
4.2 Questionnaire
We presented feedback reports for four configura-tions to every participant:
1. low (i.e. short) driven distance, low numberof incidents (LL)
2. low driven distance, high number of incidents(LH)
3. high (i.e. long) driven distance, low numberof incidents (HL)
Score Map Text1
1.5
2
2.5
3
Ave
rage
rank
ing
posi
tion
(AM
+SE
)
Figure 5: Ranking results
4. high driven distance, high number of inci-dents (HH)
For each of these four configurations, whichwere shown in a random order, we presented threetypes of feedback, which were also shown in a ran-dom order: A score, a map and a text. Figures2, 3 and 4 show the three different types of feed-back for the configuration HH. For each type offeedback three statements were given: “The feed-back is helpful.”, “The feedback gives me an ideahow I could adapt my driving behaviour.” and“The feedback encourages me to change my driv-ing behaviour.”. Participants were asked to indi-cate how much they agree or disagree with eachstatement on a Likert scale with seven options. Af-ter that, we asked the participants to give a rank-ing, which type of feedback would be their first,second and third choice, if they had to chooseone. We also asked which type(s) of feedback theywould choose if they could choose a combinationof different types (only one, two or all three). Inthe end, participants were asked about their atti-tude towards telematic car insurances in general.
4.3 Participants
The survey was completed by 21 participants be-tween the age of 20 and 52. The average age of theparticipants was 25. About 19% of all participantswere female, 81% male. In average the partici-pants had 7 years of driving experience and morethan 66% of them drive every day.
162

map & score1
text & map & score
2
text & score
6
text & map
12
Figure 6: Preferred combination of feedback types
4.4 Basic Findings
The most basic conclusion that we can draw fromthe results of this survey is, that our participantspreferred the textual feedback over the two otherfeedback types: 13 participants chose textual feed-back as their first preference, 4 the score and 4 themap (χ2 = 7.722; df = 2; p = 0.02). The aver-age ranking position for the text was 1.4, for themap 2.1 and 2.4 for the score (cf. Figure 5). Whenasked to choose a combination of feedback types,only one participant chose a combination withouttextual feedback. The most chosen combinationwas text and map (12 times). Only two peoplechose a combination of all three types of feedback(cf. Figure 6).
4.5 Likert Scale Results
We ran three ANOVA analyses, one with each ofthe three statements (“The feedback is helpful.”,“The feedback gives me an idea how I could adaptmy driving behaviour.” and “The feedback en-courages me to change my driving behaviour.”) asdependent variables (Likert scale of 1-7) and feed-back type (score, map or text), distance travelledand number of incidents (low/high) as fixed factorsand the participant as a random factor. We foundan overwhelming main effect of the feedback type(p < 0.0001). No other effects or interactionswere significant at p < 0.05. Post hoc analysisby TukeyHSD confirmed that the textual feedbackwas more helpful, encouraging and provided moreideas than either the map or the score (p < 0.0001in all cases, except text-map, p = 0.0002). Figures7a to 7c display the differences graphically.
LL LH HL HH1
2
3
4
5
6
7
Med
ian
ofal
lans
wer
s Score Map Text
(a) Results for: “The feedback is helpful.”
LL LH HL HH1
2
3
4
5
6
7
Med
ian
ofal
lans
wer
s Score Map Text
(b) Results for: “The feedback gives me an idea how I couldadapt my driving behaviour.”
LL LH HL HH1
2
3
4
5
6
7
Med
ian
ofal
lans
wer
s Score Map Text
(c) Results for: “The feedback encourages me to change mydriving behaviour.”
Figure 7: Evaluation of the Likert scale questions(1 = completely disagree, 4 = neutral, 7 = com-pletely agree; LL = distance low & incidents low,LH = distance low & incidents high, HL = dis-tance high & incidents low, HH = distance high &incidents high)
163

4.6 CommentsSix participants used the possibility to give addi-tional comments via a free text field. Three partic-ipants said that the length of the text is importantand should not be too long. Two participants ex-pressed concerns about the score and that they donot trust the score, because they are not able to re-construct how it is calculated.
4.7 PrivacyAlthough it was not the focus of our work, wewere, of course, aware of the privacy issues thatcome with a system that tracks locations and anal-yse behaviour patterns. In our survey, more than76% of the participants agreed that they wouldhave privacy concerns if they would use a telem-atic car insurance. Our system itself can run com-pletely autonomously on the phone of the user.That means, in order to guarantee the utmost pri-vacy, no user data will be transmitted. If used incombination with a telematic car insurance, oursystem does not produce any additional personaldata. Instead it processes existing data in a waythat, as our evaluation has shown, is more helpfuland preferred by users. In this way, the user prof-its more from his own data and also gets a betterunderstanding of which data is collected.
5 Conclusion and Outlook
The results of our evaluation show, that textualdriver feedback is perceived as more helpful thanthe currently used forms of feedback. It also givesdrivers a more concrete idea how to adapt theirdriving. We are confident that textual feedbackcould not only increase acceptance for automaticgenerated driver feedback, but could also have abigger impact on the behaviour than other formsof feedback.
The upcoming EU-legislation “eCall”5, whichwill make telematic sensors mandatory in newcars from April 2018, will lead to a rapid spreadof telematic devices in cars within the EuropeanUnion and will make feedback systems, like theone presented in this paper, even more attrac-tive. Besides the possible applications mentionedabove, textual feedback systems could also beused in driving training.
At the moment we are conducting a field studyin order to evaluate whether the perceived advan-
5http://ec.europa.eu/digital-agenda/ecall-time-saved-lives-saved
tages of the textual feedback also manifest in abigger influence on the behaviour of drivers. Forthis study, we equipped the experimental subjectswith smart phone applications, so that each partic-ipant will evaluate feedback that is based on his orher own driving and we will be able to analyse iftheir is a change in behaviour.
ReferencesCharles Abraham and Susan Michie. 2008. A taxon-
omy of behavior change techniques used in interven-tions. Health psychology, 27(3):379.
Ernesto Arroyo, Shawn Sullivan, and Ted Selker. 2006.Carcoach: A polite and effective driving coach. InCHI ’06 Extended Abstracts on Human Factors inComputing Systems, CHI EA ’06, pages 357–362,New York, NY, USA. ACM.
Association of Chief Police Officers. 2015. Acpospeed enforcement policy guidelines 2011 - 2015:Joining forces for safer roads. Technical report.
Steven Blake, Advaith Siddharthan, Hien Nguyen,Nirwan Sharma, Anne-Marie Robinson, ElaineO’Mahony, Ben Darvill, Chris Mellish, and ReneVan Der Wal. 2012. Natural language genera-tion for nature conservation: Automating feedbackto help volunteers identify bumblebee species. InCOLING, pages 311–324.
Kanok Boriboonsomsin, Alexander Vu, and MatthewBarth. 2010. Eco-driving: pilot evaluation of driv-ing behavior changes among us drivers. Universityof California Transportation Center.
Daniel Braun, Christoph Endres, and Christian Muller.2011. Determination of mobility context using low-level data. In Adjunct Proceedings of the 3rd In-ternational Conference on Automotive User Inter-faces and Interactive Vehicular Applications (Auto-motiveUI 2011), pages 41–42.
Department for Transport. 2014. Reported road casu-alties great britain: 2013 annual report. Technicalreport.
Anne Dohrenwend. 2002. Serving up the feedbacksandwich. Family practice management, 9(10):43–50.
Christoph Endres, Jan Miksatko, and Daniel Braun.2010. Youldeco-exploiting the power of online so-cial networks for eco-friendly driving. In Adjunctproceedings of the 2nd International Conference onAutomotive User Interfaces and Interactive Vehicu-lar Applications (AutomotiveUI 2010), page 5.
Barbara Di Eugenio, Davide Fossati, Dan Yu, SusanHaller, and Michael Glass. 2005. Aggregation im-proves learning: experiments in natural language
164
generation for intelligent tutoring systems. In Pro-ceedings of the 43rd Annual Meeting on Associationfor Computational Linguistics, pages 50–57. Asso-ciation for Computational Linguistics.
Martin Fishbein. 2000. The role of theory in hiv pre-vention. AIDS care, 12(3):273–278.
Brian J Fogg. 2009. A behavior model for persuasivedesign. In Proceedings of the 4th international Con-ference on Persuasive Technology, page 40. ACM.
Albert Gatt and Ehud Reiter. 2009. Simplenlg: A re-alisation engine for practical applications. In Pro-ceedings of the 12th European Workshop on NaturalLanguage Generation, pages 90–93. Association forComputational Linguistics.
Albert Gatt, Francois Portet, Ehud Reiter, Jim Hunter,Saad Mahamood, Wendy Moncur, and SomayajuluSripada. 2009. From data to text in the neonatal in-tensive care unit: Using nlg technology for decisionsupport and information management. Ai Commu-nications, 22(3):153–186.
Dimitra Gkatzia, Helen Hastie, Srinivasan Ja-narthanam, and Oliver Lemon. 2013. Generatingstudent feedback from time-series data usingreinforcement learning. ENLG 2013, page 115.
Catalina Hallett, Richard Power, and Donia Scott.2006. Summarisation and visualisation of e-healthdata repositories.
Peter Handel, Isaac Skog, Johan Wahlstrom, FaridBonawiede, Richard Welch, Jens Ohlsson, and Mar-tin Ohlsson. 2014. Insurance telematics: oppor-tunities and challenges with the smartphone solu-tion. Accepted in IEEE Intell. Transport. Syst. Mag.,2014.
John Hattie and Helen Timperley. 2007. Thepower of feedback. Review of educational research,77(1):81–112.
Daniel R Ilgen, Cynthia D Fisher, and M Susan Tay-lor. 1979. Consequences of individual feedback onbehavior in organizations. Journal of applied psy-chology, 64(4):349.
Pascal Neis, Dennis Zielstra, and Alexander Zipf.2011. The street network evolution of crowdsourcedmaps: Openstreetmap in germany 2007–2011. Fu-ture Internet, 4(1):1–21.
Matthieu Nol. 2015. The role of obd in the 2015connected car market. SMis Telematics for Usage-Based Insurance Conference.
Kapila Ponnamperuma, Advaith Siddharthan, ChengZeng, Chris Mellish, and Rene Van Der Wal. 2013.Tag2blog: Narrative generation from satellite tagdata. In ACL (Conference System Demonstrations),pages 169–174.
Ehud Reiter and Robert Dale. 2000. Building natu-ral language generation systems, volume 33. Cam-bridge university press.
Ehud Reiter, Roma Robertson, and Liesl M Osman.2003. Lessons from a failure: Generating tailoredsmoking cessation letters. Artificial Intelligence,144(1):41–58.
Ehud Reiter. 2007. An architecture for data-to-textsystems. In Proceedings of the Eleventh EuropeanWorkshop on Natural Language Generation, pages97–104. Association for Computational Linguistics.
Stuart Rose. 2013. Telematics: How big data is trans-forming the auto insurance industry. Technical re-port, SAS.
Taly Sharon, Ted Selker, Lars Wagner, and Ariel JFrank. 2005. Carcoach: a generalized layered ar-chitecture for educational car systems. In Software-Science, Technology and Engineering, 2005. Pro-ceedings. IEEE International Conference on, pages13–22. IEEE.
Lisa A Steelman and Kelly A Rutkowski. 2004. Mod-erators of employee reactions to negative feedback.Journal of Managerial Psychology, 19(1):6–18.
Randy L Teach and Edward H Shortliffe. 1987. Ananalysis of physician attitudes regarding computer-based clinical consultation systems. In Use and im-pact of computers in clinical medicine, pages 68–85.Springer.
Johannes Tulusan, Thorsten Staake, and Elgar Fleisch.2012. Providing eco-driving feedback to corporatecar drivers: what impact does a smartphone applica-tion have on their fuel efficiency? In Proceedings ofthe 2012 ACM Conference on Ubiquitous Comput-ing, pages 212–215. ACM.
Ross Turner, Somayajulu Sripada, Ehud Reiter, andIanP Davy. 2008. Selecting the content of tex-tual descriptions of geographically located events inspatio-temporal weather data. In Richard Ellis, TonyAllen, and Miltos Petridis, editors, Applications andInnovations in Intelligent Systems XV, pages 75–88.Springer London.
Rene van der Wal, Nirwan Sharma, Anne-Marie Robin-son, Chris Mellish, and Advaith Siddharthan. 2016.The role of automated feedback in training and re-taining conservation volunteers: a case study ofbumblebee recording. To appear in ConservationBiology.
JL Weiner. 1980. Blah, a system which explains itsreasoning. Artificial intelligence, 15(1):19–48.
Sandra Williams and Ehud Reiter. 2008. Skillsum:basic skills screening with personalised, computer-generated feedback.
L Richard Ye and Paul E Johnson. 1995. The impactof explanation facilities on user acceptance of expertsystems advice. Mis Quarterly, pages 157–172.
165

Proceedings of the 15th European Workshop on Natural Language Generation (ENLG), pages 166–174,Brighton, September 2015. c©2015 Association for Computational Linguistics
A personal storytelling about your favorite data
Cyril Labbe, Claudia Roncancio, Damien BrasUniv. Grenoble Alpes, LIG, F-38000 Grenoble, France
Abstract
A controlled use of omnipresent datacan leverage a potential of services neverreached before. In this paper, we pro-pose a user driven approach to take ad-vantage of massive data streams. Oursolution, named Stream2Text, relies on apersonalized and continuous refinement ofdata to generate texts (in natural language)that provide a tailored synthesis of rel-evant data. It enables monitoring by awide range of users as text streams can beshared on social networks or used individ-ually on mobile devices.
1 IntroductionConsidering a user-centered point of view, tak-ing advantage of Big Data may be quite difficult.Managing data volume, variety and velocity to ex-tract the adequate information is still challenging.The information extraction needs customizationto adapt both, content and form, so to fit user’scurrent profile. For content, data volume can bereduced by using user preferences, regarding theform, answers should be adapted to be displayedon the available user devices.
This paper focuses on improving stream datamonitoring by proposing the construction of ad-hoc abstracts of data. This paper presents the gen-eration of short texts which summarize (in naturallanguage) the result of continuous complex datamonitoring. Text summaries can be shared in so-cial networks or can be delivered to personal de-vices in various context (e.g. listen to summarieswhile driving). Such a solution facilitates moni-toring, even for disabled users.
Let’s consider a running example on stock op-tions monitoring involving data on volatility of thestock options, transactions and information aboutthe country emitting the actions. This informationrepresents a large volume of streamed data which
could not be handled by an individual user. Ratherthan getting data about all the transaction of theday, users would prefer to focus on those whichare the most relevant to him. This paper proposesa way to produce personalized summaries of themonitored data which fits better the user’s currentpreferences. We adopt contextual preferences tointegrate user’s priority. For example:
In the IT category, I’m more interested in stock options
that had low volatility during the last 3 days
Our system named, Stream2text will produce astream of personalized summaries to provide im-portant information to the user. Knowledge on theconcepts of the application domain and a continu-ous query evaluation allows to serve queries suchas the following.
Every two hours, I would like a summary of
the last 50 transactions on my preferred stock options.
To the best of our knowledge, Stream2text isthe first effort proposing a comprehensive solu-tion that produces a stream of summaries based ona continuous analysis of streamed and persistentdata1. . Section 2 details our running example.Section 3 provides a global picture of Stream2text.Section 4 and 5 respectively presents the theoreti-cal basis for personalized continuous querying andthe text generator operator. Section 6 exposes im-plementation and experimental results, sections 7and 8 present related work and our conclusions.2 Motivation and running exampleThis work adopts an unified model to querypersistent relational data and streams. A precisedefinition of streams and relational data is given insection 4. In our running example, Luc, a cautiousinvestor, likes to follow stock exchange informa-tion. He has access to real-time quotations andvolatility rates as well as real-time transactions.These data involve the following streams andpersistent relations (see the conceptual schema in
1A french version of this paper has been presented in thefrench conference on Information Systems INFORSID’14.
166

StockOption
StOpName {unique}CategoryCountry Transactions
OrderID {unique}VolumePrice
Volatility
RateMethod
DateTime
1..1
0..∗0..∗
0..∗
1..1 0..∗
Figure 1: Data model for stock exchange information
figure 1):– Relation StockOption(StOpName, Category,Country): stores the stock option name, its cate-gory (e.g. Commodities (Co), Technologie (IT)),and the country where the company headquartersare located.– Stream Transactions(OrderID, TTime, StOp-Name, Volume, Price): a data stream providingreal-time information about stock options transac-tions. It includes the transaction time (TTime),the quantity of shares (V olume) and the (Price)of the stock option share.– Stream Volatility(StOpName, ETime, Rate,Method): a data stream providing real-timeinformation about the estimated volatility (rate)of stock options. It includes the time of theestimation ETime and the estimation Method.
Luc wants to access such data any where, anytime from any device (mobile, with or withoutscreen). He has some preferences he wants to betaken into account so to get only the most appro-priate data in order to facilitate and speed up hisdecisions. His preferences are described by thefollowing statements:[P1] Concerning stocks of category ’Co’, Lucprefers those with a volatility-rate less than 0.25.On the other hand, concerning IT stocks, Lucprefers those with a volatility-rate greater than0.35.[P2] For stock options with volatility greater than0.35 at present (calculated according to somemethod), Luc prefers those from Brazil thanVenezuela’s one.[P3] For stock options with volatility-rate greaterthan 0.35 at present, Luc is interested in transac-tions carried out during the last 3 days concerningthese stock options, preferring those transactionswith quantity exceeding 1000 shares than thosewith a lower amount of shares.
Luc’s preferences will be expressed in thesystem by means of rules of form IF somecontext is verified THEN Luc prefers some-thing to something else. For [P1] the con-
text is StockOption.Category = ‘Co′ and forLuc V olatility.Rate ≤ 0.25 is better thanV olatility.Rate > 0.25.
Preference rules may involve streams or rela-tional data on both context side and preferenceside of the rule. Luc’s summary requirements mayalso involve queries on relational data and streamsand can be “one-shot” or continuous.[Q1] Every day, a summary concerning the stockTotal over the last two days.[Q2] Every hour, a summary, over the last hour,for the category IT inside the 100 transactions thatfits the best my preferences.[Q3] Every hour, a summary of the last hour, ofthe 100 preferred transactions in the category ’IT’.[Q4] A summary of the last 1000 transactions forFrench stock options having a rate > 0.8 and withat least one transaction with volume > 100.
Data extraction can be precisely customized ac-cording to the current user preferences. For ex-ample [Q2] identifies Luc’s 100 most preferredtransactions and then extracts those being from the’IT’ category. Whereas [Q3] selects transactionsof category ’IT’ and among them extracts Luc’s100 most preferred. The rate of summary produc-tion is given either with a temporal pattern (e.g.Q1, Q2, Q3) either with a positional pattern (e.g.Q4: every 1000 transactions).
3 Overview of Stream2textThis section presents the global picture ofStream2text, illustrated in Figure 2.
Users provide queries and preferences onstreams and persistent data. Stream2text evaluatesthe continuous queries by integrating user’s pref-erences and generates a text stream summarizingthe most pertinent data. User’s query for the sum-mary creation include a ”point of view”, the scopeand the frequency of the summary production. Thescope allows to limit the volume of data to con-sider in the production of one summary.
The support of users queries on streams and per-sistent data rely on the use of a formal model.Such model provides a non-ambiguous represen-
167

User query and preferences
Textualsummariesgenerator
Queryevaluator
Datastreams
Persistent data
Summaries
Figure 2: Architecture of Stream2text
tation of the data to be summarized. User’s prefer-ences allows to limit the volume of data to producevery customized summaries that fitts the currentuser’s interest. Data summarization involves first,a data aggregation step to produce a structuredsummary and second, a natural language summarygeneration which leads to the text sent to the user.Architecture of the text generator. This compo-nent (see Figure 3) relies on information about theconceptual schema of the data and the aggregationfunctions used to create the structured summary.
The main information about the schema con-cern the textual description of the properties of theentities. For example, StOpName=v can be ex-pressed in a text by ”The stock option v”. A stockoption, represented as a tuple t ∈ StockOption,can be described in a text as ”The stock optiont.StOpName is of category t.Category and it’shome country is t.Country”. Such phrases areusually available during the design phases of ap-plications.
As text generation phase relies on the structuredsummary, it requires textual descriptions of the ag-gregation functions being used. For example, ifthe summary of the values of a propertyA includesAvg(A), then the associated text could be ”Theaverage value of A is Avg(A)” or ”the average Ais Avg(A)”.
4 Theoretical foundation for queryevaluation
This section introduces the theoretical foundationsfor query evaluation with contextual preferences(query and user preferences in Figure 2).
4.1 Stream algebraLet us first consider the queries introduced in Sec-tion 2 in a version without preferences and sum-marization aspects:[Q1’] Every day, information concerning the shareTotal over the last two days.[Q2’]/[Q3’] Every hour, informations related to
the category ’IT’.[Q4’] Informations for the last 1000 transac-tions concerning french stocks option havingrate > 0.8 and with at least one transaction withvolume > 100.
These queries are written using (Petit et al.,2012b). This algebra formalizes expressions ofcontinuous and instantaneous queries combiningstreams and relational data. In the following, wepresent the basics of query expression.
Streams and relations (hereafter resp. denotedby S and R) are different concepts (Arasu et al.,2004). A stream S is an infinite set of tuples witha common schema and two special attributes: atimestamp and the position in the stream2. A tem-poral relation R is a function that maps a timeidentifier t to a set of tuples R(t) having a com-mon schema. Classical relational operators (selec-tion σ, projection π, join 1) are extended to tem-poral relations and π and σ to streams. For exam-ple, σV olume>10(Transactions) is the stream oftransactions having V olume > 10.
A temporal relation is extracted from a streamusing windows operators. The algebra provides anextended model for windows operators includingpositional, temporal and cross domain windows(e.g. slide n tuples every δ seconds). The follow-ing expressions represent some very useful win-dows:– S[L] contains the last tuple of a stream (L stand-ing for Last);– S[N slide ∆] is a sliding window of size N slid-ing ∆ every ∆. N and ∆ are either a time durationor a number of tuples.
A stream is generated from a temporal relationusing a streamer operator. Among them, IS(R)produces the stream of tuples inserted in R. Givena window description, a streamer and a join con-
2These definitions can be extended using the notion ofbatch (Petit et al., 2012b).
168

Dictionary ofconcepts
SimpleNLG
TRANSCRIPTIONIST
Structured summary
XML
</>
XML
</>
Summaries
Dictionary ofaggregation functions
Figure 3: Architecture of the text generator
dition c, a join operator between two streams orbetween a stream and a relation can be defined. Inthe following we will use:
S1cR = IS(S[L]1cR).
The stream S 1c R may have new tuples orig-inated by tuple arrivals in S or updates in R.The semi-sensitive-join operator ( BJ) produces astream resulting from a join between the last tupleof the stream and the relation by the time the tuplearrives:
S BJcR = IS(S[L] 1c R(τS(S[L])))
where τS denotes the function that gives the times-tamp of a tuple in the stream S (see (Petit et al.,2012b) for more details). In the following, thestream-join that joins tuples from two differentstreams will be defined as follows:
S11≤S2 = IS(S1[∞]1
≤S2[L])
where 1≤
joins the tuple of S2[L] with the single tu-
ple of S2 having the maximal timestamps lower orequal to the timestamp of S2[L] (i.e. τS(S2[L])).Previously defined queries can be written as:
[Q1’]((V olatility1≤Transaction) BJ
σStOpName=′Total′StockOption)
[2day slide 1day] (1)
[Q3’]((V olatility1≤Transaction) BJ
σCategory=′IT ′StockOption)[1h slide 1h] (2)
[Q4’]((σrate>0.8V olatility1≤σV olume>100Transaction) BJ
σCountry=‘FR′StockOption)[1000n slide 1n](3)
4.2 The Preference ModelIn this section we present the main concepts con-cerning the logical formalism for specifying andreasoning with preferences (see (de Amo andPereira, 2010; Petit et al., 2012a) for details). Intu-itively speaking, a rule of contextual preference (acp-rule) allows to compare two tuples of a relationR both of them fitting a particular context.
ϕ : u→ C1(X)�C2(X)[W ]
Where X ⊆ Attr(R), W ⊆ Attr(R) et X 6∈ W ;Ci(X) (for i = 1, 2) is an evaluable condition overtuples of R. u is also a condition in which neitherX norW are involved (cf. exemple 1). Two tuplesare comparable using a cp-rule, if they have thesame value for the so-called ceteris paribus (notedwith [ ]).
A contextual preference theory (cp-theory forshort) over R is a finite set of cp-rules. Undercertain consistency constraints a cp-theory inducea strict partial order over tuples allowing to rankthem according to the user preferences.
Example 1 Let us consider the two pref-erence statements P1 and P2 of our mo-tivating example. They can be expressedby the following cp-theory over the schemaT (StOpName,Cat, Country,ET ime,Rate,Method):– ϕ1: Cat = co → (Rate < 0.25 � Rate ≥0.25), [Method]– ϕ2: Cat = it → (Rate ≥ 0.35 � Rate <0.35), [Method]– ϕ3: Rate > 0.35 → (Country = Brazil �Country = V enezuela)
The user preferences of Figure 2 are cp-theories. The algebra integrates them in a stream-ing context. The semantics is the one called withconstraints.4.3 Preference OperatorPreference operators are algebraic and can beused on instantaneous and continuous queries onstreams and relations. User preferences, repre-sented as a cp-theory, can be seen as part of a userprofil. Preferences are used only if personalizationof queries is asked by the use of a ”top-k” queryin which the operator KBest is used. KBest selectsthe subset of k preferred data according to the hi-erarchy specified by the cp-theory. For example,Q2 of Section 2 is expressed as
(σCategory=′IT ′(KBest100((V olatility1≤
Transaction) BJStockOption)))[1h slide 1h]
169

Whereas Q3 can be written as:KBest100(Q2′).
4.4 Aggregation functions and structureddata summary
To generate textual summaries, Stream2text firstbuilds a structured summary of data by using ag-gregation functions provided by the query evalua-tor. The choice of functions may depend of the ap-plication domain. Intuitively, an aggregation func-tion f associates to a set of tuples a unique tuplefor which attributes and values are determined byf . We will use definition 1, which includes a re-sulting attribute named after the function used tocompute the aggregated value.
Definition 1 (Aggregation Operator) LetR be atemporal relation with schema A = {ai}i=1..n,Let f j({Ai}i∈{1,n})j=1..m, be m aggregationfunctions. The aggregation operator Gf1,f2,...fm
aggregates the set of tuples R in one tuple usingthe functions f j .
Gf1,f2,...fm(R) = {∪mj=1(fj , f j({Ai}i∈{1,n}))}
5 Text generation operatorWe define several functions and operators to as-sociate text to data. Sections 5.1 and 5.2 showhow the schema knowledge and structured sum-mary can be related to text. Section 5.3 defines thetranscription operator.
5.1 Dictionary of concepts
We will consider a database dealing with ne en-tities/classes {Ei}i=1..ne . Each of which has aset ni de property/attributes {Ai,j}i=1..ne
j=1..ni, some of
them being identifiers or key attributs.Schema knowledge is mandatory to be able to
express facts about data. A text fragment is associ-ated to each property of the data model. It may beused to name the referred concept in a text. Thesetexts are managed in a Dictionary of concepts.
Definition 2 (Dictionary of Concepts) It is afunction Dc which associates to each databaseconcept (ie. property Ai,j) a noun phrase NP .This noun phrase can be use to name the concept(property Ai,j) in a text.
Dc(Ai,j) = {NP}i,jwhere {NP}i,j is a noun phrase naming conceptAi,j in natural language.
The example 2 illustrates some possible valuesfor Dc (in french).
Example 2 (Dictionary of concepts (french entries))
Dc(StOpName) =
{le actiondet. noun
}
Dc(Price) =
{le prixdet. noun
}
Dc(Price) =
{le coursdet. noun
}
Dc may associate several values to a given con-cept. This can be used to improve diversity in thegenerated texts.5.2 Dictionary of aggregation functionsThe textual summary is based on a structured sum-marization computed using aggregation functions.A dictionary with sentence structures is used asthe basis to reflect the meaning of the aggrega-tion functions. A sentence structure is composedof sub fragments that can be used by a realizationengine (cf. (Gatt and Reiter, 2009) and example 3)i.e. the generation of a correct sentence regardingthe grammatical rules of the targeted natural lan-guage.
Example 3 (Sentence structure and realization)A sentence structure (in french), represented as agraph, followed by its realization is presented infigure 5.
The definition 3 formalizes the function usedto associate a text to the result of an aggre-gation function F over a set of k attributes{ai}i=1..k. The text is function of the textsDc(ai)i=1..k and the result of the aggregationfunction F ({ai}i=1..k).
Definition 3 (Dictionary of aggregation functions)It is a function Df that, given an aggregationfunction F ({ai}i=1..k), returns a sentence struc-ture SP . The realization of SP describes theaggregation function in natural language.
Df (F ) = {{Dc(ai)}i=1..k, V P, {Coi}i=1..x,
F ({ai}i=1..k), {Rj}j=1..y} (4)
where V P is a verb phrase explaining the rela-tion between attributes {ai}i=1..k and the valueF ({ai}i=1..k). {Coi}i=1..x is a set of x comple-ments (noun, direct object, indirect object) and{Rj}j=1..y is a set of y relations between sentenceelements.
Example 4 Hereafter a simplified example of sen-tence structure in french for the MostFreq(A)function which calculates the most frequent value.Other sentence structures are possible.
170

V P
NP Co Co
det. noun det adv. adj. verb noun
le categorie le plus frequent etre IT
La categorie la plus frequente est IT.
subjectDOC
Figure 4: sentence structure
NP Co V P Co
Dc(A) le plus frequent etre MostFreq(A)
A possible realization of this sentence struc-ture is presented in Example 3 with the attributeCategory. The same aggregation function usedwith an other attribute would give a different real-ization. For example, given the attribute Countrythe realization in french could be (given thatMostFreq(Country) = France):
Le pays le plus frequent est France.
The text generation for an aggregation function re-quires the realization of the entry of the dictionaryof functions and the computation of the functionitself.5.3 Transcription operatorA temporal relation (i.e. a function of time) is saidto be transcriptable if it is possible to generate aset of sentence structures concerning this relation.Thus, transcribing in natural language the signifi-cation of a set of data is equivalent to produce a setof sentence structures describing this data set. Thetranscription is a step that comes after the compu-tation of a structured summary, which has the formof a unique tuple. Definition 4 gives the form ofrelation that will be considered for transcription.Definition 4 (A transcriptable relation) is atemporal relation R that contains a unique tuplesuch that: ∀(A, v) ∈ t:– either A is a concept for which an entry exists inthe dictionary of concepts (ie. A ∈ Dom(Dc))– either A = F where F ({ai}i=1..n) is an ag-gregation function used to aggregate a set of val-ues {ai}i=1..n in a value v and such that F ∈Dom(Df ) and (F, v) ∈ GF (R)).
A transcription operator is defined to generatea set of sentence structures given a transcriptablerelation.
Definition 5 The transcription operator T pro-vides a set of sentence structures given a temporalrelation R having a schema Fi:
T (R) =⋃
i
Df (Fi)
R being a temporal relation, T (R) is a set ofsentence structures evolving with time. The use ofa streamer to create a stream on this set allows theinsertion in a stream of texts timestamped with thetime when R is modified.
Generally speaking, a function identity Id isused as name of attributes of a transcriptable re-lation gives the ”point of view” chosen to summa-rize the data. The dictionary of functions has toinclude an entry for such function Id. This couldbe a starting sentence for the textual summary.
Remark 1 (Special case for key attributes)When the function Id, in the list of attributes ofa transcriptable relation, is applied to a key, thenthe transcription must describe a particular objectand not the ”point of view” adopted to summarizethe data. In that case, it is not a summary butan object of the data base. It is thus necessaryto specify an entry in the dictionary of functionsfor such cases: i.e. Id on key attributes. As anexample, Df (GId(Name),Id(Country)) could bedefined in french as follows:
NP Co V P Adj
L′action Dc(Name) etre Id(Country)
So the realization of
T (GId(Name),Id(Country)(
πName,Country(σName=′Total′(StOpName))))
isL’ action Total est francaise.
The transcription operator builds texts for AS-TRAL queries (with or without preferences). The
171

T (GId(Name),Id(Country),Id(Category),Avg(V olume),MostFreq(Methode)(
πName,Country,Category,V olume,Methode(Q1′))) (5)
T (GMostFreq(Name),MostFreq(Country),Id(Category),Avg(V olume),MostFreq(Methode)(
πName,Country,Category,V olume,Methode(Q3′))) (6)
T (GMostFreq(Name),Id(Country),MostFreq(Category),Avg(V olume),MostFreq(Methode)(
πName,Country,Category,V olume,MethodeQ4′)) (7)
generated text depends only on data content and onthe functions used for the structure summary. Thequery itself is not directly transcripted (see exam-ple 5).Example 5 (Transcription) Assuming that nu-merical (resp. non-numerical) attributes are ag-gregated using the average function Avg (resp.most frequent MostFreq), queries Q1, Q3 andQ4 are written as presented in equations 5,6,7.
6 Implementation and experimentationof Stream2text
This section describes our prototype and the ex-perimentations realized (in french) as a proof-of-concept. We focus here on the transcription as thequery evaluation part is based on existing software(PostegreSQL and Asteroide (Petit, 2012)).
6.1 Data to text transcriptionThe transcriptionist component of Stream2text hasbeen developed in Java. It produces textual sum-maries of the data provided by the query man-ager. The conceptual entities are used to establishthe structure of the text. The transcriptionist pre-pares the grammatical structure of the sentencesand uses the french version of SimpleNLG (Gattand Reiter, 2009) for the text realization. Thetranscriptionist assembles the sentences issued bySimpleNlg and produces the paragraphs. Thesummaries include an introduction to give infor-mation on treated data and one paragraph per en-tity involved in the summary. Each paragraph in-cludes several sentences reflecting the meaning ofthe aggregation functions used for the structureddata summary.The current dictionary of functions includes: –MostFreq to calculate the most frequent value ina data set. – Avg, Med and Count with usualmathematical semantics. – Part(v,A) to indi-cate the % of a value v in the values of A. –Id(Key Attribute) to handle key attributes caseswhich require particular text generation (see re-mark 1). This is done for each entity of the
database schema. Except for Id, the dictionarycontains generic sentence structures. There is noneed of redefinition when the functions are usedfor different attributes and the dictionary is inde-pendent from the data schema and may be sharedby many applications and users. Nevertheless,the functions can be personalized to produce cus-tomized summaries.
6.2 Experiment with stock exchange dataFrom http://www.abcbourse.com/, anexperimental data set (5000 transactions) was cre-ated. Data involves twelve stock options belong-ing to ten categories and three countries. Datahave timestamps used in the streams (ie. TTimeand ETime). Quantity, price of transactions,volatility, the category and the country of the stockoptions are available.
The dictionary of concepts has entries for allattributes and concepts, such as StOpName andCategory, for the three entities (cf. section 2).We experimented summary generation for queriesas in the running example. To illustrate the result,see hereafter a summary for [Q1].
Example 6 (Summary for Q1) For its summary,let consider that Luc wishes the average and themedian for the volume of transactions, prices, etc.[Q1] is evaluated as specified in equation 5. Fig-ure 5 shows the summary for a 2 day period.
7 Related workThis work is related to several subjects includingcontinuous query evaluation, structured data sum-marization and natural language generation.
Many theoretical (Krishnamurthy et al., 2010)and practical (Arasu et al., 2006) works havebeen done to master continuous querying on data-streams. We use (Petit et al., 2012a) whichpresents the advantage of a non-ambiguous se-mantics for querying streams and temporal rela-tions. This is particularly important for joins (Petitet al., 2012b) and windows (Petit et al., 2010).
172

Resume de l’action Total
Ce resume est construit a partir de 17 transactions.
L’action est dans la categorie Energie et Produits de base et estfrancaise.
Concernant les transactions, le volume moyen d’une transaction estde 155 actions. De plus, la moitie des transactions ont un volumesuperieur a 141 actions. Le prix moyen d’une action est de 41,57 eu-ros. De plus, la moitie des transactions ont un prix superieur a 42,69euros. Ensuite, l’action Total represente 14 pour cent des transactions.Enfin, l’action Total represente 2 pour cent du volume.
En ce qui concerne la volatilite, l’action Total a la plus forte variationavec 1.22 pour cent. L’action a 1 methode de calcul de la volatilite.La methode M1 a une volatilite moyenne de 1,04 pour cent. Lamethode M1 a une valeur mediane de 1,00 pour cent. Pour terminer,la methode de calcul la plus frequente est M1.
Summarize title T (GId(Name)(Q1))
Head of summarize with data informations.
StockOption entity paragraph : gives category and country of the share Total.T (GId(Name),Id(Country),Id(Cat)(Q1))
Transactions entity paragraph : average volume, median price ...
T (
GAvg(V ol),Med(V ol),Avg(Price),Med(Price),..(
πV olume,Price(Q1)))
Last entity : this paragraph groups data about V olatility entity likenumber of calculation method of volatility, average volatility ...
Figure 5: Summary for query Q1 according to the example 6
There are also several efforts on summarizingor synthesizing numerical and structured data. Inthis context, we can understand preferences mod-els and top − k operators as a way to reduce thevolume of data. Our proposition supports top− kqueries combined to aggregation functions to pro-duce a structured summary. This phase could useother works of this nature as (Cormode et al.,2012; Cormode and Muthukrishnan, 2005). Thechoice of another preferences model (Koutrikaet al., 2010) is compatible with the natural lan-guage transcription phase but impacts the struc-tured summary. The use of the CPrefSQL model ismotivated by the qualitative approach it proposesand it’s support of ”contexts” in dominant tuplecalculation. This differs from approaches by scorefunctions (Borzsonyi et al., 2001; Papadias et al.,2005; Kontaki et al., 2010).
Concerning automatic text generation, thetext − to − text approach is used to automat-ically summarize texts (Rotem, 2003) or opin-ions (Labbe and Portet, 2012) expressed in nat-ural language. Our proposal follows a data −to − text approach which consists in text gener-ation to explain data. To the best of our knowl-edge, current proposals are specific to an applica-tion domain such as medicine (Portet et al., 2009;Gatt et al., 2009) or weather report (Turner etal., 2010). The NLG community focuses on lan-guage aspects as sentence aggregation, enumer-ative sentence construction or referential expres-sions. These works are independent of the appli-cation domain whereas the upstream phase includ-ing the determination of the content and documentplaning (Reiter and Dale, 2000), still require do-main experts help. However, (Androutsopoulos etal., 2013) proposed, recently, natural language de-scriptions of individuals or classes of an OWL on-
tology. In our context, this is analogous to the de-scription of a single tuple in a relation but does notinclude information summarization as proposed inthis paper. Stream2text facilitates concept de-termination and sentence generation by using theconceptual knowledge on data schema and aggre-gation functions used for the structured summary.The domain specific knowledge required for textgeneration can be extracted from the data analysisphase. The knowledge relative to the aggregationfunctions is mostly domain independent. Our pro-posal combines data model knowledge and datasets to produce summaries by using the realizationengine proposed by (Gatt and Reiter, 2009).
8 Conclusion and future research
Our work joins a global effort in mastering bigdata. We propose the automatic generation ofshort texts to summarize streamed and persistentdata. Such textual summaries allow new infor-mation access possibilities. For example, sharingin social networks, access through mobile devicesand the use of text-to-speech software.
We propose Stream2text which is a generic so-lution including the whole process, from continu-ous data monitoring until the generation of a natu-ral language summary. The personalization of theservice and, the reduction of the volume of data,rely on the integration of user preferences on dataand some knowledge on the conceptual model andthe aggregation functions. Stream2text has beenexperimented for texts in French. A version fortexts in English is in progress.
Our future research targets the combination ofcomplex data management and appropriate textgeneration. For example, the contextualizationof complex event detection and the production oftexts referring to present and past situations.
173
References
Ion Androutsopoulos, Gerasimos Lampouras, andDimitrios Galanis. 2013. Generating natural lan-guage descriptions from owl ontologies: the natu-ralowl system. Journal of Artificial Intelligence Re-search, 48:671–715.
Arvind Arasu, Brian Babcock, Shivnath Babu, JohnCieslewicz, Mayur Datar, K. Ito, R. Motwani,U. Srivastava, and J. Widom. 2004. STREAM: TheStanford Data Stream Management System. Tech-nical report, Stanford InfoLab.
Arvind Arasu, Shivnath Babu, and Jennifer Widom.2006. The CQL continuous query language: se-mantic foundations and query execution. In Proc.of 32nd int. conf. on Very Large Data bases (VLDB’06), volume 15.
S. Borzsonyi, D. Kossmann, and K. Stocker. 2001.The skyline operator. In Proceedings of the 17th In-ternational Conference on Data Engineering (ICDE2001), pages 412–430.
Graham Cormode and S. Muthukrishnan. 2005. Animproved data stream summary: the count-minsketch and its applications. J. Algorithms, 55(1):58–75.
Graham Cormode, Minos N. Garofalakis, Peter J.Haas, and Chris Jermaine. 2012. Synopses for mas-sive data: Samples, histograms, wavelets, sketches.Foundations and Trends in Databases, 4(1-3):1–294.
Sandra de Amo and Fabiola Pereira. 2010. Evalua-tion of conditional preference queries. Journal of In-formation and Data Management (JIDM). Proceed-ings of the 25th Brazilian Symposium on Databases,2010, Belo Horizonte, Brazil., 1(3):521–536.
Albert Gatt and Ehud Reiter. 2009. Simplenlg: A re-alisation engine for practical applications. In Pro-ceedings of the 12th European Workshop on Natu-ral Language Generation, ENLG ’09, pages 90–93,Stroudsburg, PA, USA. Association for Computa-tional Linguistics.
Albert Gatt, Francois Portet, Ehud Reiter, JamesHunter, Saad Mahamood, Wendy Moncur, and So-mayajulu Sripada. 2009. From data to text in theneonatal intensive care unit: Using NLG technologyfor decision support and information management.AI Communications, 22(3):153–186.
M. Kontaki, A.N. Papadopoulos, and Y. Manolopou-los. 2010. Continuous processing of preferencequeries on data streams. In Proc. of the 36th Int.Conf. on Current Trends in Theory and Practice ofComputer Science (SOFSEM 2010), pages 47–60.Springer Berlin Heidelberg.
Georgia Koutrika, Evaggelia Pitoura, and Kostas Ste-fanidis. 2010. Representation, composition and ap-plication of preferences in databases. In Proceed-ings of International Conference on Data Engineer-ing (ICDE), pages 1214–1215.
Sailesh Krishnamurthy, M.J. Franklin, Jeffrey Davis,Daniel Farina, Pasha Golovko, Alan Li, and NeilThombre. 2010. Continuous analytics over discon-tinuous streams. In SIGMOD ’10: Proc. of the 2010ACM SIGMOD int. conf. on Management of data,pages 1081–1092. ACM.
Cyril Labbe and Francois Portet. 2012. Towards anAbstractive Opinion Summarisation of Multiple Re-views in the Tourism Domain. In The First Interna-tional Workshop on Sentiment Discovery from Affec-tive Data (SDAD 2012), pages 87–94, Bristol, UK,sep.
D. Papadias, Y. Tao, G. Fu, and B. Seeger. 2005. Pro-gressive skyline computation in database systems.ACM Transactions on Database Systems, 30:41–82.
Loıc Petit, Cyril Labbe, and Claudia Lucia Roncan-cio. 2010. An Algebric Window Model for DataStream Management. In Proceedings of the 9th Int.ACM Workshop on Data Engineering for Wirelessand Mobile Access (MobiDE ’10) , pages 17–24.ACM.
Loıc Petit, Sandra de Amo, Claudia Roncancio, andCyril Labbe. 2012a. Top-k context-aware querieson streams. In Proc. of Int. Conf. on Database andExpert Systems Applications (DEXA 12), pages 397–411.
Loıc Petit, Cyril Labbe, and Claudia Lucia Roncancio.2012b. Revisiting Formal Ordering in Data StreamQuerying. In Proc. of the 2012 ACM Symp. on Ap-plied Computing, New York, NY, USA. ACM.
Loıc Petit. 2012. Gestion de flux de donnes pourl’observation de systemes. These de doctorat, Uni-versite de Grenoble, Decembre.
F. Portet, E. Reiter, A Gatt, J. Hunter, S. Sripada,Y. Freer, and C. Sykes. 2009. Automatic generationof textual summaries from neonatal intensive caredata. Artificial Intelligence, 173(7–8):789–816.
Ehud Reiter and Robert Dale. 2000. Building NaturalLanguage Generation Systems. Cambridge Univer-sity Press, New York, NY, USA.
N Rotem. 2003. Open text summarizer (ots). June,2012, http://libots.sourceforge.net.
Ross Turner, Somayajulu Sripada, and Ehud Reiter.2010. Generating approximate geographic descrip-tions. In Emiel Krahmer and Mariet Theune, edi-tors, Empirical Methods in Natural Language Gen-eration, volume 5790 of Lecture Notes in ComputerScience, pages 121–140. Springer Berlin Heidel-berg.
174

Author Index
Baez Miranda, Belen A., 86Baltaretu, Adriana, 48Barros, Cristina, 9Belz, Anja, 100Bras, Damien, 166Braun, Daniel, 156
Caffiau, Sybille, 86Cercas Curry, Amanda, 90, 112Cerisara, Christophe, 18
de Oliveira, Rodrigo, 127Demberg, Vera, 105Dokkara, Sasi Raja Sekhar, 1
Farrell, Rachel, 52Fischer, Andrea, 105
Gaizauskas, Robert, 117Garbay, Catherine, 86Gardent, Claire, 18Gkatzia, Dimitra, 57, 90, 112Glas, Nadine, 146Gyawali, Bikash, 18
Haque, Florin, 114Haralambous, Yannis, 66He, Qianhui, 81Horacek, Helmut, 114Howcroft, David M., 28
Inglis, Stephanie, 95
Kato, Yoshihide, 61Klakow, Dietrich, 105Krahmer, Emiel, 48
Labbe, Cyril, 166Lapalme, Guy, 109, 136Lemon, Oliver, 112Lloret, Elena, 9Loth, Sebastian, 38
Maes, Alfons, 48Mahamood, Saad, 57Matsubara, Shigeki, 61
Mazzei, Alessandro, 76Molins, Paul, 109Muscat, Adrian, 100
Ohno, Tomohiro, 61
Pace, Gordon, 52Pelachaud, Catherine, 146Penumathsa, Suresh Verma, 1Portet, Francois, 86Puentes, John, 66
Reiter, Ehud, 127, 156Rieser, Verena, 90, 112Roncancio, Claudia, 166Rosner, M, 52
Sauvage-Vincent, Julie, 66Schlangen, David, 38Schuurman, Ineke, 71Sevens, Leen, 71Siddharthan, Advaith, 156Sripada, Somayajulu Gowri, 1Sripada, Yaji, 127
Van Eynde, Frank, 71Vandeghinste, Vincent, 71Vaudry, Pierre-Luc, 136
Wang, Josiah, 117Wang, Xiaojie, 81White, Michael, 28
Yoshida, Kazushi, 61Yuan, Caixia, 81
Zarrieß, Sina, 38
175