Annual Research Review Workshop 2019
149
i Annual Research Review Workshop 2019 Date: 26-27 January 2020 BLRI Conference Hall 3 rd floor, Building 3 PROGRAMME Bangladesh Livestock Research Institute Savar, Dhaka 1341, Bangladesh
-
Upload
khangminh22 -
Category
Documents
-
view
3 -
download
0
Transcript of Annual Research Review Workshop 2019

i
Annual Research Review Workshop 2019
Date: 26-27 January 2020
BLRI Conference Hall
3rd
floor, Building 3
PROGRAMME
Bangladesh Livestock Research Institute Savar, Dhaka 1341, Bangladesh

ii
TECHNICAL SESSIONS Day 1: Sunday, 26 January, 2020
Technical Session I : ANIMAL AND POULTRY DISEASES AND HEALTH
Chairperson : Professor Dr. Nitish Chandra Debnath
Director, Teaching & Training Pet Hospital and Research
Centre and Ex VC, CVASU, Chittagong
Co-Chairperson : Dr. MJFA Taimur
CSO (Rtd) and Ex Head
Animal Health Research Division, BLRI
Rapporteurs : DR. Md. Abu Yousuf , SO, BLRI
DR. Sonia Akther, SO, BLRI
09:30-09:40 Prevalence of sub-clinical mastitis in Pabna cows and high
yielding crossbreeds and its control strategies
SM Rahman
SSO
09:40-09:50 Surveillance and molecular evolution of highly pathogenic
avian influenza virus (HPAIV) in Bangladesh
MZ Ali
SO
09:50-10:00 Monitoring of Peste des Petits Ruminants (PPR) virus and
Peste des Petits Ruminants (PPR) like disease in Bangladesh
MA Yousuf
SO
10:00-10:10 Seroprevalence of tick borne blood protozoan diseases of
cattle and sheep and standardization of BLRI developed
TBDs autogenous killed vaccine
MZ Hassan
SO
10:10-10:20 Prevalence of different dairy cattle diseases in selected dairy
areas and farms of Bangladesh
MAH Miah
SO
10:20-10.45 Discussion
10:45-12:10 Inauguration
12:10-12:30 Refreshment
12:30-01:00 Poster Presentation
01:00-02:00 Lunch and Prayer

iii
Day 1: Sunday, 26 January, 2020
Technical Session II
:
ANIMAL AND POULTRY BREEDING AND GENETICS
Chairperson
:
Professor Dr. AK Fazlul Haque Bhuiyan
Department of Animal Breeding and Genetics
Bangladesh Agricultural University, Mymensingh 2202
Co-Chairperson : Md. Lutfor Rahman Khan
Director (Extension)
Department of Livestock Services, Farmgate, Dhaka
Rapporteurs : Dr. Mst. Parvin Mostari, SSO, BLRI
Nure Hasni Desha, SO, BLRI
02:00-02:10 Test-day and adjusted full lactation yield of local Pabna cows
in Bangladesh
MAI Talukder
CSO
02:10-02:20 Development of mobile and web based data recording
application for Dairy Development Research Project
(DDRP)
M Shahjahan
SSO
02:20-02:30 Conservation and improvement of native chicken: laying
performance of seventh generation
S Faruque
SSO
02:30-02:40 Conservation and improvement of exotic germplasms and
development of egg and meat type chicken
MR Hassan
SSO
02:40-02:50 Conservation and improvement of Quail: Performance of
eighth generation
S Faruque
SSO
02:50-03.00 Conservation and improvement of native duck and geese
genotypes: Laying performances of 5th generation of BLRI
improved duck genotypes
H Khatun
SSO
03:00-03:10 Conservation and improvement of Black Bengal goat at
Bangladesh Livestock Research Institute (BLRI)
NH Desha
SO
03:10-03:20 Performance evaluation of F1 progeny of different beef
breeds with native cattle
MP Mostari
SSO
03:20-03:30 Characterization and screening of different coat color
variants goat stock at BLRI
MF Afroz
SSO
03:30-03:40 Red Chittagong cattle breeding and revealing their genetic
architecture using High Density Single Nucleotide
Polymorphism Array
AKFH
Bhuiyan
Professor,
BAU
03:40-04:00 Discussion
04:00-04:10 Tea and Snacks
04.10-05:00 Poster Presentation

iv
Day 2: Monday, 27 January, 2020
Technical Session III : FEEDS, FODDER AND NUTRITION
Chairperson : Professor Dr. Md. Jasimuddin Khan
Pro-Vice Chancellor
Bangladesh Agricultural University
Mymensingh 2202
Co-Chairperson : Dr. Sharif Ahmed Chowdhury
General Manager, PKSF
Agargaon, Dhaka
Rapporteurs : Dr. Ali Akbar Bhuiyan, SSO, BLRI
Mr. Md. Ashadul Alam, SSO, BLRI
09:30-09:40 Development of feeds and feed additives for producing
value added poultry meat and eggs emphasizing lipid
profile and antioxidant
F Sharmin
Post-Doc.
Fellow
09:40-09:50 Study on production, nutritive value and land use
efficiency of fodder maize (Zea mays) intercropped
with alfalfa (Medicago sativa)
S Ahmed
SSO
09:50-10:00 Strategic development of feeding and management
techniques to improve the performance of egg and meat
type chicken and their qualities
MAG
Rabbani
SO
10:00-10:10 Evaluation of the weaning stress and estimation of
weaning age of Black Bengal kids at different weaning
condition
S Ahmed
SSO
10:10-10:20 On-farm validation of TMR technology for fattening
cattle
MA Alam
SSO
10:20-10.30 Conservation, multiplication and adaptation of High
Yielding Fodder (HYF) variety at BLRI Regional
Station
US Alam
SO
10:30-10:40 Development of feeding system for growing buffalo in
coastal area of Bangladesh
BK Roy
SSO
10.40-10.50 Determination of best practice management for Napier
grass: Defoliation height and severity to optimize
nutritive value and regrowth
BK Roy
SSO
10.50-11.00 Study on production potentiality and preservation
technique of Moringa fodder and assessment of it’s
nutritional quality
N Sultana
PSO
11:00-11:20 Discussion
11:20-11:30 Tea and Snacks

v
Day 2: Monday, 27 January, 2020
Technical Session IV : BIOTECHNOLOGY, ENVIRONMENT AND
CLIMATE RESILIENCE
Chairperson
:
Professor Dr. MAM Yahia Khandoker
Department of Animal Breeding and Genetics
Bangladesh Agricultural University
Mymensingh 2202
Co-Chairperson
:
Md. Abdul Gofran
Chairman
Bangladesh Biogas Development Foundation
Rapporteurs
: Dr. Shakila Faruque, SSO, BLRI
Dr. Shabiha Sultana, SO, BLRI
11:30-11:40 Screening of heavy metal residue in animal food chain
system
MA Islam
MS Student
11:40-11:50 Adaptation of ovum pick up technology for the
production of Red Chittagong calves
GK Deb
SSO
11:50-12:00 Isolation and identification of lactic acid bacteria for the
development of microbial silage inoculant
SM
Amanullah
SSO
12:00-12:10 Efficient management of poultry manure: anaerobic co-
digestion for biogas production and application of
additives for odor reduction
MM Rahman
SO
12:10-12:20 Carbon footprint of beef cattle production at Khulna
division of Bangladesh
NG Das
SSO
12:20-12.30 Study on the improvement of existing manure
management system of Bangladesh
JS Khanam
SO
12:30-12:50 Discussion
12:50-02:00 Lunch and Prayer

vi
Day 2: Monday, 27 January, 2020
Technical Session V : SOCIOECONOMICS AND FARMING SYSTEM
RESEARCH
Chairperson : Dr. Jahangir Alam Khan
Former Director General
Bangladesh Livestock Research Institute, Savar, Dhaka
Co-Chairperson
:
Dr. Md. Shahjahan Ali Khandaker
Joint Chief
Agriculture, Water Resource and Rural Institutions
Planning Division, Ministry of Planning
Rapporteurs
:
Dr. Zillur Rahman, SSO, BLRI
Sabina Yasmin, SO, BLRI
02:00-02:10 Baseline study on available Horse genetic resources in
Bangladesh
MFH Miraz
SO
02:10-02:20 Determination of income elasticity of demand and
forecasting demand for milk, meat and egg in Bangladesh in
2025 and 2030
S Yasmin
SO
02:20-02:30 Determinants of profitability of cattle fattening: A technical
and allocative efficiency analysis of fattening enterprise in
Bangladesh
M Khatun
SO
02:30-02:40 Development of model village through BLRI technologies at
Dhamrai areas
R Khatun
SSO
02:40-02:50 Impact of farmers training on adoption of BLRI developed
technologies
MZ Rahman
SSO
02:50-03:10 Discussion
03:10-04.00 Poster Presentation
04:00-05:10 Closing session
05:10-05:30 Tea and Snacks

vii
POSTER SESSION
Day 1: 12:30-01:00 pm & 04:10-05:00 pm
Day 2: 03:10-0400 pm
Rapporteurs
Mr. Md. Ataul Goni Rabbani, SO, BLRI
DR. Habibur Rahman, SO, BLRI
SL
No.
Title Presenter
1. Comparison on different morphological parameter, biomass
production and nutritive value of three fodder germplasms
MM Billah
SO
2. Collection, conservation and improvement of specialized fowl
(Turkey, Guinea fowl and Pigeon) production at BLRI
MA Rashid
SSO
3. Substitution of soybean meal by cotton seed meal as a source of
protein supplement in the diet of broiler chicken
MRA Sumon
SO
4. Improvement of Black Bengal goat in rural areas NH Desha
SO
5. Conservation and improvement of native sheep at BLRI NH Desha
SO
6. Production and evaluation of crossbred sheep of Coastal with
Damara, Dorper and Parendale
NH Desha
SO
7. Evaluation of new developed lines from BLRI Napier-3 cultivar
under saline condition in coastal region of Bangladesh
MK Alam
SSO
8. Feeding of vegetable waste silage to beef cattle at farm level NG Das
SSO
9. Field testing of BLRI Feed Master mobile application in selective
locations of Bangladesh
MA Kabir
SO
10. Adaptation of somatic cell nuclear transfer (SCNT) technologies
for cattle in Bangladesh
GK Deb
SSO
11. Developing a model for up-scaling livelihood of the rural poor
farmers by rearing Red Chittagong cattle
MR Amin
SO
12. Development of animal ID and recording system of RCC and their
graded cattle through computer and mobile application technology
SMJ Hossain
PSO
13. Development of herd book based RCC recording system at the
community level
H Rahman
SO
14. Development of starter culture for Yoghurt MA Kabir
SO
15. Conservation and improvement of Munshiganj cattle MFH Miraz
SO
16. Development of low input community breeding model for Red
Chittagong cattle
MFH Miraz, SO

viii
17. Empowerment factors of rural women through homestead native
sheep rearing in Hilly area at Naikhongchari
MA Hemayet
SO
18. Cryopreservation of exotic ram semen for conservation and
multiplication of sheep germplasm of BLRI
MKH
Mazumder
SSO
19. Design and development of products from native sheep skin MKH
Mazumder
SSO
20. Development of blended yarns and fabrics from jute, cotton and
native sheep wool
MKH
Mazumder
SSO
21. Phenotypic and genotypic profiling of antimicrobial resistance
(AMR) in enteric bacterial communities in finisher livestock and
poultry in Bangladesh
MR Begum
22. Canned meat production and its preservation quality assessment JS Khanam
SO
23. Morphological features and growth traits of half-sib local Pabna
calves up to yearling stages
S Munira
SO
24. Improving production performance of local buffalo through
crossbreeding
GK Deb
SSO
25. Study on follicular physiology of repeat breeder cows in Baghabari
milk shed areas
R Khatun
SSO
26. Identification of candidate gene markers for prediction of RCC
sperm quality and fertility
MFH Miraz
SO
27. Effect of nitrogen fertilizer on morphological parameter, biomass
yield and nutritive value of Napier fodder
MM Billah
SO
28. Development of a mini processing plant for safe poultry meat
production
MSK Sarker
SSO
29. Impact of sheep project on socioeconomic conditions and sheep
management practices in selected areas of Bangladesh
MR Amin
SO
30 Development of system generated database at BLRI research farm
for genetic evaluation in progressive generations
S Ahmed
SSO
31 Genetic variants of beta-casein in native and crossbred cattle of
Bangladesh
MP Mostari
SSO
32 Conservation and improvement of farm animal genetic resources
(FAnGR) at Hilly region at Naikhongchari
MA Alam
SSO

ix
INAUGURAL SESSION
(26 January, 2020)
Chief Guest
: Mr. Md. Ashraf Ali Khan Khasru, MP Hon’ble State Minister
Ministry of Fisheries and Livestock
Special Guest : Dr. Md. Enamur Rahman, MP Hon’ble State Minister
Ministry of Digester Management and Relief
Special Guest
Special Guest
:
:
Mr. Rawnak Mahmud
Secretary
Ministry of Fisheries and Livestock
Mr. Md. Zakir Hossain Akanda
Member (Secretary)
Agriculture, Water Resources and Rural Institutions,
Ministry of Planning
Guest of Honor : Dr. Abdul Jabbar Sikder
Director General
Department of Livestock Services
Chairperson : Dr. Nathu Ram Sarker Director General
Bangladesh Livestock Research Institute
10:45 am Guests take their seats
11:00 am Recitation from the Holy Qurán and Holy Gita
11:05 am Welcome Address by Md. Azharul Amin
Additional Director & Convener, Annual Research Review Workshop-2019
11:10 am Address by the Guest of Honor Dr. Abdul Jabbar Sikder
Director General, Department of Livestock Services
11:15 am Address by the Special Guest Mr. Rawnak Mahmud
Secretary, Ministry of Fisheries and Livestock
11:25 am Address by the Special Guest Mr. Md. Zakir Hossain Akanda
Member (Secretary), Agriculture, Water Resources and Rural Institutions,
Ministry of Planning
11:35 am Address by the Special Guest Dr. Md. Enamur Rahman, MP
Hon’ble State Minister, Ministry of Digester Management and Relief
11:50 am Address by the Chief Guest Mr. Md. Ashraf Ali Khan Khasru, MP
Hon’ble State Minister, Ministry of Fisheries and Livestock
12:05 pm Address by the Chairperson Dr. Nathu Ram Sarker
Director General, Bangladesh Livestock Research Institute
12:10 pm Refreshment

x
CLOSING SESSION
(27 January, 2020)
Chief Guest
: Mr. Rawnak Mahmud
Secretary
Ministry of Fisheries and Livestock
Special Guest : Dr. Abdul Jabbar Sikder
Director General
Department of Livestock Services
Chairperson : Dr. Nathu Ram Sarker
Director General
Bangladesh Livestock Research Institute
04:00 pm Recitation from the Holy Qurán and Holy Gita
04:05 pm Presentation of Workshop Recommendation by Dr. Md. Giasuddin
Head, Animal Health Research Division, BLRI
04:20 pm Open Discussion
04:40 pm Address by the Special Guest Dr. Abdul Jabbar Sikder
Director General, Department of Livestock Services
04:50 pm Address by the Chief Guest Mr. Rawnak Mahmud
Secretary, Ministry of Fisheries and Livestock
05:00 pm Concluding remarks by the Chairperson Dr. Nathu Ram Sarker
Director General, Bangladesh Livestock Research Institute
05:10 pm Refreshment

xi
CONTENTS
Sl.
No
Programme area and Research title Page
No
Session I: Animal and Poultry Diseases and Health
1. Prevalence of sub-clinical mastitis in Pabna cows and high yielding
crossbreeds and its control strategies
1
2. Surveillance and molecular evolution of highly pathogenic avian influenza
virus (HPAIV) in Bangladesh
3
3. Monitoring of Peste des Petits Ruminants (PPR) virus and Peste des Petits
Ruminants (PPR) like disease in Bangladesh
4
4. Seroprevalence of tick borne blood protozoan diseases of cattle and sheep
and standardization of BLRI developed TBDs autogenous killed vaccine
5
5. Prevalence of different dairy cattle diseases in selected dairy areas and
farms of Bangladesh
7
Session II: Animal and Poultry Breeding and Genetics
6. Test-day and adjusted full lactation yield of local Pabna cows in
Bangladesh
9
7. Development of mobile and web based data recording application for
Dairy Development Research Project (DDRP)
11
8. Conservation and improvement of native chicken: laying performance of
seventh generation
13
9. Conservation and improvement of exotic germplasms and development of
egg and meat type chicken
15
10. Conservation and improvement of Quail: Performance of eighth generation 17
11. Conservation and improvement of native duck and geese genotypes:
Laying performances of 5th generation of BLRI improved duck genotypes
19
12. Conservation and improvement of Black Bengal goat at Bangladesh
Livestock Research Institute (BLRI)
21
13. Performance evaluation of F1 progeny of different beef breeds with native
cattle
23
14. Characterization and screening of different coat color variants goat stock at
BLRI
25
15. Red Chittagong cattle breeding and revealing their genetic architecture
using High Density Single Nucleotide Polymorphism Array
27
Session III: Feeds, Fodder and Nutrition
16. Development of feeds and feed additives for producing value added
poultry meat and eggs emphasizing lipid profile and antioxidant
28
17. Study on production, nutritive value and land use efficiency of fodder
maize (Zea mays) intercropped with alfalfa (Medicago sativa)
30

xii
18. Strategic development of feeding and management techniques to improve
the performance of egg and meat type chicken and their qualities
32
19. Evaluation of the weaning stress and estimation of weaning age of Black
Bengal kids at different weaning condition
34
20. On-farm validation of TMR technology for fattening cattle 36
21. Conservation, multiplication and adaptation of High Yielding Fodder
(HYF) variety at BLRI Regional Station
38
22. Development of feeding system for growing buffalo in coastal area of
Bangladesh
40
23. Determination of best practice management for Napier grass: Defoliation
height and severity to optimize nutritive value and regrowth
43
24. Study on production potentiality and preservation technique of Moringa
fodder and assessment of it’s nutritional quality
46
Session IV: Biotechnology, Environment and Climate Resilience
25. Screening of heavy metal residue in animal food chain system 48
26. Adaptation of ovum pick up technology for the production of Red
Chittagong calves
50
27. Isolation and identification of lactic acid bacteria for the development of
microbial silage inoculant
52
28. Efficient management of poultry manure: anaerobic co-digestion for biogas
production and application of additives for odor reduction
53
29. Carbon footprint of beef cattle production at Khulna division of
Bangladesh
55
30. Study on the improvement of existing manure management system of
Bangladesh
57
Session V: Socioeconomics and Farming System Research
31. Baseline study on available Horse genetic resources in Bangladesh 59
32. Determination of income elasticity of demand and forecasting demand for
milk, meat and egg in Bangladesh in 2025 and 2030
61
33. Determinants of profitability of cattle fattening: A technical and allocative
efficiency analysis of fattening enterprise in Bangladesh
63
34. Development of model village through BLRI technologies at Dhamrai
areas
65
35. Impact of farmers training on adoption of BLRI developed technologies 67
Poster Session
36. Comparison on different morphological parameter, biomass production and
nutritive value of three fodder germplasms
69
37. Collection, conservation and improvement of specialized fowl (Turkey,
Guinea fowl and Pigeon) production at BLRI
71
38. Substitution of soybean meal by cotton seed meal as a source of protein
supplement in the diet of broiler chicken
73

xiii
39. Improvement of Black Bengal goat in rural areas 75
40. Conservation and improvement of native sheep at BLRI 77
41. Production and evaluation of crossbred sheep of Coastal with Damara,
Dorper and Parendale
79
42. Evaluation of new developed lines from BLRI Napier-3 cultivar under
saline condition in coastal region of Bangladesh
81
43. Feeding of vegetable waste silage to beef cattle at farm level 83
44. Field testing of BLRI Feed Master mobile application in selective locations
of Bangladesh
85
45. Adaptation of somatic cell nuclear transfer (SCNT) technologies for cattle
in Bangladesh
87
46. Developing a model for up-scaling livelihood of the rural poor farmers by
rearing Red Chittagong cattle
88
47. Development of animal ID and recording system of RCC and their graded
cattle through computer and mobile application technology
89
48. Development of herd book based RCC recording system at the community
level
91
49. Development of starter culture for Yoghurt 93
50. Conservation and improvement of Munshiganj cattle 94
51. Development of low input community breeding model for Red Chittagong
cattle
95
52. Empowerment factors of rural women through homestead native sheep
rearing in Hilly area at Naikhongchari
97
53. Cryopreservation of exotic ram semen for conservation and multiplication
of sheep germplasm of BLRI
99
54. Design and development of products from native sheep skin 101
55. Development of blended yarns and fabrics from jute, cotton and native
sheep wool
103
56. Phenotypic and genotypic profiling of antimicrobial resistance (AMR) in
enteric bacterial communities in finisher livestock and poultry in
Bangladesh
105
57. Canned meat production and its preservation quality assessment 106
58. Morphological features and growth traits of half-sib local Pabna calves up
to yearling stages
109
59. Improving production performance of local buffalo through crossbreeding 111
60. Study on follicular physiology of repeat breeder cows in Baghabari milk
shed areas
113
61. Identification of candidate gene markers for prediction of RCC sperm
quality and fertility
115
62. Effect of nitrogen fertilizer on morphological parameter, biomass yield and
nutritive value of Napier fodder
117

xiv
63. Development of a mini processing plant for safe poultry meat production 119
64. Impact of sheep project on socioeconomic conditions and sheep
management practices in selected areas of Bangladesh
121
65. Development of system generated database at BLRI research farm for
genetic evaluation in progressive generations
123
66. Genetic variants of beta-casein in native and crossbred cattle of
Bangladesh
124
67. Conservation and improvement of farm animal genetic resources (FAnGR)
at Hilly region at Naikhongchari
126
1. Committee and Different Sub-Committees of the Annual Research
Review Workshop 2019 128

Proceedings of the Annual Research review Workshop 2019, BLRI, Savar, Dhaka 1341, January 26-27, 2020
1 Technical Session I
Prevalence of sub-clinical mastitis in Pabna cows and high yielding crossbreeds and its
control strategies
MAI Talukder1, SM Rahman
2*, MAH Miah
2, M Shahjahan
2, MY Ali
2 and MM Billah
2
1Bangladesh Livestock Research Institute, Savar, Dhaka-1341
2Bangladesh Livestock Research Institute Regional Station, Baghabari, Sirajganj-6770
*Corresponding author: [email protected]
Executive summary
Bovine mastitis is the most costly disease of dairy cattle due to economic losses from reduced milk
production, treatment costs, increased labour, milk withheld following treatment, death and premature
culling. There are three forms of mastitis namely clinical, sub-clinical and chronic. It is now a well
known fact that the sub clinical mastitis (SCM) is more serious and is responsible for greater loss to
the dairy industry in Bangladesh. Though the indigenous cattle are believed to be less susceptible to
any forms of mastitis its prevalence in different grads of dairy cattle is not studied. Good management
practices are believed to play a great role in controlling SCM but the practice is not standardized.
Considering all these matters the present study was taken the prevalence of SCM in selected dairy
areas and to develop prophylactic treatment and management practices. The study areas were the
NBH and the community of the Dairy Development Research Project. NBH is located in the BLRI-
RS, Baghabari and the community consists of three villages of Bera upazilla of Pubna district namely
Kharbagan, Hatalaralia and Charsabolla. A preformed questioner was developed to study the
prevalence and farming practices shown in Table 1. California Mastitis Test (CMT) was performed in
three parameters (weak, distinct and strong) healthy cows to study the prevalence. Commercial anti-
mastitis preparation, vit-E and selenium supplementation was given to CMT positive cows (Data not
shown). The survey and drug trial data was analyzed by SPSS 20.0 statistical package program.
Table1. Farming practice in the study area
Parameter Homestead Farm Bathan % adoption of
the good practice
No. of cows 42 (18 farms) 45 (6 farms) 34 (3 farms) -
Barn type Free Open
stall-tethered
In house-
tethered
Open
stall-natural Free
-
Floor type Muddy & unclean Watery &
unclean
Muddy & unclean 0
Milking At the barn At the barn At the barn 0
Milking machine Not used Not used Not used 0
Feeding Before milking Before milking Before milking 0
Post milking teat-
dipping
No No No 0
Dry cow therapy No No No 0
Periodic use of
CMT
No No No 0
Post-milking udder
massage
No No No 0
Milking interval
(hours)
Not fixed, 9-12 Not fixed, 11-
13
Not fixed, 9-12 -
The study shows that prevalence of different types of SCM varied significantly (p <0.001) within the
two genotypes of cattle and in their quarter (Table 2) while the difference was non-significant (p
>0.05) between the two genotypes (59.61% in Pabna and 53.96% in crossbreds). Although clinical
mastitis was absent in Pabna cattle but SCM was present in higher percentage. Many researchers
shows the beneficial effect of vitE (E-sel gold) in treating subclinical mastitis. So we use a
combination of the both to treat the condition and found them to be satisfactorily positive.

Proceedings of the Annual Research review Workshop 2019, BLRI, Savar, Dhaka 1341, January 26-27, 2020
2 Technical Session I
Table 2. Prevalence and severity of subclinical mastitis in lactating cows
Genotyp
e
Types No.
tested
Positive No. (%) Negative
No. (%)
Level
of sig. Weak Distinct Strong Total
Pabna Cows 52 14 (26.9) 4 (7.7) 13 (25) 31 (59.6) 21 (40.4) ***
Quarters 208 48 (23.1) 20 (9.6) 19 (9.13) 87 (41.8) 121(58.2) ***
Cross Cows 63 6 (9.5) 10 (15.9) 18 (28.57) 34 (53.9) 29 (46.0) ***
Quarters 252 36 (14.3) 30 (11.9) 28 (11.11) 94 (37.3) 158 (62.7) ***
Overall Pabna 52 14 (26.9) 4 (7.7) 13 (25) 31 (59.6) 21 (40.4) NS
Cross 63 6 (9.5) 10 (15.9) 18 (28.57) 34 (53.9) 29 (46.0)
Anti-mastitic drugs can successfully reduce the severity of SCM in lactating cows. In 11 identified
cows with different severity of SCM we used a commercial anti-mastitic drug (MasticareR, Square,
Dhaka, Bangladesh). The recommended dose (30 gm/cow/day) for 7 days was effective and 9 days
treatment made all the cows negative for CMT. All the animals were negative for CMT for the next
three months. In the community we conduct campaign and training for hygienic milking, udder health
management and general healthcare to reduce the SCM. But after one year we found 57.65% CMT
positive cows in the community.
In this study period, clinical mastitis was absent in the NBH and scanty in the community which
should be investigated further.

Proceedings of the Annual Research review Workshop 2019, BLRI, Savar, Dhaka 1341, January 26-27, 2020
3 Technical Session I
Surveillance and molecular evolution of highly pathogenic avian influenza virus
(HPAIV) in Bangladesh
M Giasuddin, MA Samad, MZ Ali, MR Karim and M Hasan
National Reference Laboratory for Avian Influenza, Animal Health Research Division, Bangladesh Livestock
Research Division, Savar, Dhaka 1341, Bangladesh.
Executive summary
Influenza A viruses, belonging to the orthomyxoviridae family, are negative single-stranded RNA
viruses with an eightfold segmented genome. Among at least eleven proteins encoded by this genome,
the Haemagglutinin (HA) and Neuraminidase (NA) are of utmost importance in terms of
immunogenicity and induction of protective immunity following vaccination. There exist 16 different
types of HA and 9 of NA, antigenically distinguishable protein subtype, thus theoretically giving rise
to 144 combinations. Influenza viruses are known to undergo a process called antigenic drift, whereby
they continuously change their antigenic properties by accumulating non-synonymous point mutations
in the HA and NA encoding gene segments. The absence of proof-reading and post-replicative repair
mechanisms characteristic of the RNA polymerase complex of these viruses is, in addition to external
selection pressure, an important factor of antigenic drift. The most important outcomes of antigenic
drift may be an increased ability of the virus to avoid naturally acquired or vaccine induced host
immunity, as well as a possibility of breaching host-range barriers. Both the HA and the NA proteins
are involved in the process of antigenic drift with the HA implicated much more, since it is the main
target of neutralizing antibodies and is known to accumulate many point mutations in its epitopes or
antibody binding regions.
The main objectives of this study were to detect and isolate the highly pathogenic serotypes (H5N1,
H5N6, H5N2, H5N8, and H9N2) at farm level. A total of 582 samples including 562 (swab), 20
(trachea) were collected from different small and medium poultry farms in different areas of Gazipur
and Dhamrai. Immediately after collection, the samples was transferred to the National Reference
Laboratory for Avian Influenza (NRL-AI) and all the samples were processed for genome extraction
by using MagMax AIV/ND RNA extraction kit according to manufacturer protocol and tested for M
(matrix) gene to confirm influenza A. Then the positive samples were undertaken for further
screening for H5, H9, N1, N2, N6 and N8 subtypes using the Australian Animal Health laboratories
(AAHL) protocols which is an OIE reference laboratory. Among the 582 samples, 45 samples
(7.73%) were positive for AIV type A. Out of 45 AIV type A positive samples H5N1, H5N2, H9N1,
and H9N2 were found 26.66% (12/45), 28.88% (13/45), 2.22% (1/45), 2.22% (1/45) respectively.
Considering subtypes only N1 and N2 was 64.44% (29/45) and 64.44% (29/45) respectively. The
unknown subtypes were 4.44% (2/45). All positive samples were stored for further molecular
characterization which will be done in coming financial year. From the above observation we could
concluded avian influenza are still circulating in the poultry of selected areas and this study will
contribute to control and eradicate avian influenza to achieve SDG goal 2.
26.66% 28.88%
2.22% 2.22% 4.44%
64.44% 64.44%
0
5
10
15
20
25
30
35
H5N1 H5N2 H9N1 H9N2 Unknown Only N1 Only N2
Nu
mb
er
AIV Subtypes

Proceedings of the Annual Research review Workshop 2019, BLRI, Savar, Dhaka 1341, January 26-27, 2020
4 Technical Session I
Monitoring of Peste des Petits Ruminants (PPR) virus and Peste des Petits Ruminants
(PPR) like disease in Bangladesh
MA Samad1, MA Yousuf
1, M Nazia
2, ME Chowdhury
3 and M Giasuddin
2
1SAARC Regional Leading Diagnostic Laboratory for PPR,
2Animal Health Research Division, Bangladesh
Livestock Research Institute, Savar, Dhaka, 2 Professor, Department of Pathology, Faculty of Veterinary
Science, Bangladesh Agricultural University, Mymensingh2202, Bangladesh.
Executive summary
Peste des Petits Ruminants (PPR) is a highly fatal viral disease of goats and sheep which is
characterized by high fever, depression, oro-nasal secretion, respiratory distress, diarrhea, high
morbidity and mortality in small ruminants. In Bangladesh, this disease was first identified in the year
1993. Since then, PPR is endemic all over the country causing huge economic loss. To control PPR in
Bangladesh, a live attenuated conventional PPR vaccine was developed by Animal Health Research
Division of Bangladesh Livestock Research Institute (BLRI) in 2000 and successfully used in the
country. Control of economic diseases such as PPR will increase the national productivity of the small
ruminants and reduce poverty among poor farmers. Although sporadic vaccination against PPR has
been practiced all over the country for a long period, no specific strategic plan was followed. The OIE
and FAO developed a strategic plan under the title “Global strategy for the control and eradication of
PPR”, targeting to eradicate PPR from the globe at 2030. To control this disease, proper monitoring of
this virus is necessary. To ensure the efficacy of mass vaccination against PPR, a current project was
undertaken with the aim of monitoring the PPR control strategy in Bangladesh through determining
the level of conferred immunity in vaccinated flocks and conducting surveillance of PPR and PPR like
diseases to reduce the misperception concerning PPR.
Sero-surveillance was conducted throughout the region of PPR mass vaccination. A total of 185
villages were surveyed under four Upazila of the southern part of the country where mass vaccination
was done. The geographic locations of sampling household were recorded by GPS method during
sampling. Blood sera was collected randomly from vaccinated goat/sheep flocks and tested with
cELISA kit to assess the titer levels. A total of 1794 sera were collected and tested by cELISA
method to assess the antibody levels. Among them, 83.70% immunity at 48 months of post
vaccination in Jichergacha upazilla of Jossore district. Whereas, at 3 months of post vaccination the
immunity level was 93.70% in Jibannagar, 64% in Debhata, 78% in Damurhuda and 75% in
Meherpur Sadar upazilla. The overall herd immunity level in vaccinated animal was 80%, nonetheless
28% of positive antibody found in control villages. The duration of immunity level in Jikorgacha
Upazila of Jessore district was revealed to be lifelong even at 48 months of post vaccination against
the PPR virus.
During outbreak investigation, a total of 25 nasal swabs samples were collected along with related
epidemiological and economic impacts information using pretested questionnaire. In molecular
diagnosis, 80% (25/20) samples were found positive for PPR in RT-PCR. Epidemiologically, PPR
and some other non-specific diseases were recorded in the selected areas. New entry of goats into the
household or village is one of the most important risk factors for PPR virus circulation and several
outbreaks were recorded in control villages. Morbidity and case fatality rates were 14% and 70.55%
respectively during outbreaks. There was no outbreak of PPR in the mass vaccinated villages, and
only one goat died that was purchased from local market and new entry. As for sick goats, about 82%
received treatment, 13% were sold and 5% were slaughtered. The 93% of dead goats were buried
under soil. To sum, it can be concluded that this study will be helpful for the PPR eradication
program aiming at 2030, to achieve the SDG goal 2.

Proceedings of the Annual Research review Workshop 2019, BLRI, Savar, Dhaka 1341, January 26-27, 2020
5 Technical Session I
Seroprevalence of Tick Borne Blood Protozoan Diseases of Cattle and sheep and
Standardization of BLRI Developed TBDs Autogenous Killed Vaccine
MZ Hassan*1
, M Giasuddin1, M Hasan
1, MM Rahman
3, MA Yousuf
1, M Z Ali
1, S Akhter
2, MH
Rahman2, M Ershaduzzaman
3 and MAHNA Khan
4
1Animal Health Research Division,
2Goat and Sheep Production Research Division,
3Sheep Development
Project, BLRI, Savar, Dhaka, 4Dept. of Pathology, Bangladesh Agricultural University, Mymensingh 2202.
Bangladesh.*Correspondence at [email protected]
Executive summary
Babesiosis, Anaplasmosis, and Theileriosis (TBDs) are the silent killer intra cellular (RBC) blood
protozoan diseases in the animal. It is usually known as tick borne blood protozoan diseases (TBDs).
The TBDs are life-threatening disease in the exotic and high yielding animal in tropical and
subtropical countries including Bangladesh. They are transmitted through tick bites usually Ixodes. In
2018, there were 10 exotic sheep were died within a week in BLRI main sheep farm. During the
outbreaks the sheep was showing the clinical signs like TBDs, notably high fever (105-1070F),
complete off feeding, respiratory distress, continual panting, rapid breathing, diarrhea, sometimes
bloody diarrhea and coffee color urine and could not show positive response to practice line of
treatment. To check this crisis period an experimental autogenous killed blood protozoan vaccine
(BPV) was prepared for the purpose of seroprevalence and efficacy trial of experimental autogenous
blood protozoan killed vaccine (BPV) in exotic sheep.
However, a total number of 525 blood samples were collected from cattle (480) and sheep (45) for
Giemsa’s stain blood smear microscopy in Parasitology laboratory, BLRI. The selected exotic sheep
breed was Dhamara, Dorper, Parendale at different age and sex. Molecular detection of blood
protozoa was done by multiplex PCR in the blood of suspected sheep breed. The primer sequences
and PCR conditions were designed according to Bilgic et al. (2017) and Bilgic et al. (2013) for
Babesia ovis, Babesia motasi, Anaplasma marginale and Theileria annulata (Table 1). After that, the
PCR confirmed blood samples were selected for experimental autogenous BPV preparation. The
isolation of blood protozoa were done through lysis of RBC by ammonium chloride and killing the
protozoan fragment through heat treatment. The TBDs killed vaccine was containing blood protozoan
fragment @ 1×10⁶ per ml of vaccine seed. This vaccine seed was mixed with oil adjuvant at the ratio
of 1:1000 and selected for vaccination in the exotic sheep. During the experimental period, the
vaccine was introduced @3ml containing 3×10³ fragments of antigen subcutaneously in the infected
sheep. After vaccination, randomly selected serum samples were collected at 30 days interval six
times. However, the antibody titer was detected and monitored by using commercially available c-
ELISA, kit (VMRD, USA) against Babesia ovis and Anaplasma margenale.
Table1. Primer sequence of Babesia, Anaplasma and Theileria spp in sheep for multiplex PCR
SL
No.
Primers Name Sequence (5'-3') Amplicon size References
01 B. Ovis F1 [CCTGGGTAATGGTTAATAGGAACGG] 422bp Bilgic et al.,
2017
02 B. Ovis R1 [GCAGGTTAAGGTCTCGTTCGTTAAC] 422 bp
03 B. Motasi F1 [CTCTGGTACAATATGCATTGC] 518 bp
04 B. Motasi R1 [CTGGTTCCCAGATATGGTAGC] 518bp
05 A. Ovis F1 [CAGCCAGGCACTCTGCACCAC] 265bp
06 A. Ovis R1 [CAACAATTGATGTGAGTGCGC] 265bp
07 A. Margin F1 [GCTCTAGCAGGTTATGCGTC] 265bp Bilgic et al.,
2013
08 A. Margin R1 [CTGCTTGGGAGAATGCACCT] 265 bp
09 T. Anulata F [ACTTTGGCCGTAATGTTAAAC] 312 bp
10 T. Anulata R [CTCTGGACCAACTGTTTGG] 312 bp
In blood smear microscopy, the overall prevalence of TBDs was 68% (n=357) in cattle and 100%
(n=45) in sheep. Among the positive sample in sheep, the prevalence of Anaplasma spp. was 33%,
Babesia spp. 24%, Anaplasma + Babesia spp. 29%, Theileria spp 11%, and Anaplasma + Babesia +
Theileria spp were detected 4%. In multiplex PCR, among 15 blood sample (sheep), the prevalence of
Anaplasma marginale, Anaplasma ovis, Babesia motasi, Babesia ovis and Theileria annulata were

Proceedings of the Annual Research review Workshop 2019, BLRI, Savar, Dhaka 1341, January 26-27, 2020
6 Technical Session I
33.33% (n=5), 13.33% , 26.67% (n=4), 13.33% (n=2), 13.33% (n=2) respectively. During this
experimental period, no clinical outbreaks were found and animal deaths were checked. Moreover,
routine blood microscopy was done every month where the prevalence of blood protozoa reduced
significantly. In conclusion, it can be stated that the exotic sheep was highly susceptible to TBDs. The
developed blood protozoan autogenous killed vaccine (BPV) can give the protection of exotic sheep,
even during clinical outbreaks. However, the efficacy of the vaccine was monitored properly and
standardization of vaccine required further study.

Proceedings of the Annual Research review Workshop 2019, BLRI, Savar, Dhaka 1341, January 26-27, 2020
7 Technical Session I
Prevalence of different dairy cattle diseases in selected dairy areas and farms of
Bangladesh
MAI Talukder1, SM Rahman
2*, MAH Miah
2, M Shahjahan
2, MY Ali
2 and MM Billah
1Bangladesh Livestock Research Institute (BLRI), Savar, Dhaka-1341 and
2BLRI Regional Station, Baghabari,
Sirajganj-6770, Bangladesh. *Correspondence at [email protected]
Executive summary
The present study was designed to have a comprehensive epidemiological data of the circulating
diseases in the Nucleus breeding herd (NBH) and the community of Dairy Development Project of
BLRI. The NBH is located in the BLRI-RS, Baghabari and the community consists of three villages
of Bera upazila of Pabna district namely Kharbagan, Hatalaralia and Charsabolla. The cattle
population was 546 (441 in the community and 105 in the NBH). A total of 1250 clinical cases of
cattle of different breed and sex were diagnosed during the period from July 2018 to June 2019. The
handling of animals in the study was performed in accordance with current Bangladesh legislation
(Cruelty to Animals Act 1920, Act No. I of 1920 of the Government of the People’s Republic of
Bangladesh). Diagnosis of diseases was made by general physical examination of animals, clinical
signs, gross pathology and laboratory procedures. In some cases, confirmatory diagnosis was made by
cultural and biochemical test of causative organisms following standard procedure. Parasitic
infestations were diagnosed by faeces examination under microscope (Soulsby, 1986). Blood smears
were prepared and examined under microscope after Giemsa’s staining.
The prevalence of endo-parasites, bovine ephemeral, foot rot, nonspecific diarrhea and postpartum
anoestrus were higher among the parasitic, viral, bacterial, digestive disorder, reproductive disorder
respectively. In case of other diseases, there were not any significant difference between on station
and community. Nonetheless, in paired t-test, there is no significant difference in the pattern of
diseases. The descriptive statistics suggested that Endo-parasites (10.56 %), Bovine Ephemeral Fever
(10.97%), Non-specific Diarrhea (10.51 %) and Post-partum anoestrus (8.43 %) are the most
prevailing diseases in the community and Foot-rot (26.82%), Maggot infestation (14.06%), Endo-
parasites (9.38%), UTIs (9.12%) and Hump sore (3.65%) are the most prevailing diseases in the NBH.

Proceedings of the Annual Research review Workshop 2019, BLRI, Savar, Dhaka 1341, January 26-27, 2020
8 Technical Session I
Table 1. Comparative prevalence of different dairy cattle diseases between community and the
Nucleus breeding herd
Disease
category
Name of the
disease
No. of identified
cases
Prevalence% by
cases
t- test prevalence % by
population
t-test
Comm
unity
On
station
Commu
nity
On
station
Comm
unity
On
station
Parasitic Blood protozoa 11 2 1.27 0.52 0.76 2.49 1.90 0.39
End-parasite 116 36 10.56 9.38 20.73 34.29
Hump sore 2 14 0.23 3.65 0.45 13.33
Ectoparasite 27 4 3.12 1.04 6.12 3.81
Maggot 25 54 2.89 14.06 5.67 51.43
Viral FMD 16 0 1.85 0 0.23 3.63 0 0.49
Ephemeral fever 85 6 10.97 1.56 21.59 5.71
Wart 7 1 0.81 0.26 1.59 0.95
Rabies 1 0 0.12 0 0.23 0
Bacterial Anthrax 1 0 0.12 0 0.47 0.23 0 0.35
HS 33 0 3.81 0 7.48 0
Dermatophilosis 12 9 1.39 2.34 2.72 8.57
Conjunctivitis 14 8 1.62 2.08 3.17 7.62
Pneumonia 13 0 1.50 0 2.95 0
Mastitis 17 2 1.96 0.52 3.85 1.90
BQ 4 0 0.46 0 0.91 0
Tetanus 1 0 0.12 0 0.23 0
Foot rot 5 103 0.58 26.82 1.13 98.10
Arthritis 6 1 0.69 0.26 1.36 0.95
Digestive
Anorexia 25 3 2.89 0.78 0.10 5.67 2.86 0.17
Ruminal
acidosis
20 0 2.31 0 4.54 0
Constipation 3 3 0.35 0.78 0.68 2.86
Simple
indigestion
5 0 0.58 0 1.13 0
Non specific
Diarrhea
91 5 10.51 1.30 20.63 4.76
Blot 25 0 2.89 0 5.67 0
Metabolic Milk fever 10 0 1.15 0 0.34 2.27 0 0.78
Grass tetany 3 0 0.35 0 0.68 0
Weak calf
syndrome
15 5 1.73 1.30 3.40 4.76
Reproduct
ive
Retained
Placenta
1 9 0.12 2.34 0.95 0.23 8.57 0.53
UTIs 3 35 0.35 9.12 0.68 33.33
Repeat breeding 23 1 2.66 0.26 5.22 0.95
Post-partum
anoestrus
73 2 8.43 0.52 16.55 1.90
Prolapse 1 1 0.12 0.26 0.23 0.95
Surgical Abscess 2 1 0.23 0.26 0.47 0.45 0.95 0.22
Naval-ill 5 2 0.58 0.52 1.13 1.90
UPF 0 4 0.00 1.04 0.00 3.81
Hernia 2 0 0.23 0 0.45 0

Proceedings of the Annual Research review Workshop 2019, BLRI, Savar, Dhaka 1341, January 26-27, 2020
9 Technical Session II
Test-day and adjusted full lactation yield of local Pabna cows in Bangladesh
MAI Talukder1, M Shahjahan
1*, S Rahman
1 and AKFH Bhuiyan
2
1Dairy Development Research Project, Bangladesh Livestock Research Institute, Savar, Dhaka 1341 and
2Department of Animal Breeding and Genetics, Bangladesh Agricultural University, Mymensingh 2202,
Bangladesh. *Correspondence at [email protected]
Executive summary
The local Pabna cows are more promising among the native cattle varieties in Bangladesh. The study
was designed to reveal the test-day milk yield and identify the adjusted factors to convert morning to
evening milking for calculating full lactation yield. Data of 320 test-day milking (15 days’ interval
started from 6th day after parturition) were collected from 21 local Pabna cows having 1-3 parity
number during January, 2018 to June, 2019 (DDRP-BLRI solution, SourceTrace System,
Massachusetts, USA). All the cows were kept under similar management system with dry matter basis
feeding regime (2.50% of body weight using concentrate, straw and/or green grass). Morning milking
was registered for all cows but evening milking was performed 15 days’ interval. Out of 21 cows, 14
cows completed their lactation period from which data of lactation period and total milk yield were
collected. Adjustment factors (morning to evening) were calculated based on percentage from the 1st
to 21st test days’ milking and these factors were used to calculate the missing evening milking (out of
test day) for 305 days full lactation yield. The average adjustment factor between two consecutive test
days was multiplied within the morning milking of those respective two test days to obtain the values
of evening milking. However, to assess the last five days of lactation after 300 days the adjustment
factor of 21st test day was multiplied with morning milking of those days for getting the values of
evening milking. Multivariate analysis using GLM under Randomized Complete Block Design
(RCBD) was applied including Bonferroni post hoc mean separation test. One-way ANOVA of
Completely Randomized Design (CRD) was also followed using Tukey’S HSD post hoc mean
separation test to analyze the lactation length and lactation yield.
The effect of dam parity, calving season and lactation stages showed significant differences (p<0.05)
on test-day milking (Figure 1) after fifth day of calving (Table 1). It was observed that cows of third
parity (4.06±0.33 L), calving in Summer (3.74±0.16 L) and first stage of lactation during 0-105 days
of lactation (4.00±0.13 L) produced more milk than others. However, calves having birth weight
above 22 kg (4.17±0.17 L) and dams’ body weight above 275 kg (3.93±0.15 L) had significant effect
(p<0.05) on higher milk yield. These data suggested the selection criteria to identify elite local cows
based on parity and weight of dam, lactation stage, calving season and calves’ birth weight.
Adjustment factors for morning to evening milking revealed that higher and lower values observed at
first (0.51) and 21st (0.39) test day milking, respectively. The second parity of dam (3.22±0.02 L),
calving at Summer (3.17±0.02 L) and 0-105th days of milking stage (3.53±0.03 L) also indicated
higher milk production (p<0.05) based on adjusted overall lactation period. The average lactation
length and milk yield of Pabna cows in full lactation observed 252 days and 800 L, respectively.
Based on 305 days of lactation (Figure 1), the cows covered full lactation provided statistically
(p<0.05) higher milk (1037.67±94.68 L) than those cows (734.91±57.95 L) having lower lactating
days. The cows had lengthy lactation period and higher average production would be suitable for
nucleus breeding herd.

Proceedings of the Annual Research review Workshop 2019, BLRI, Savar, Dhaka 1341, January 26-27, 2020
10 Technical Session II
Table 1. Effect of dam parity, calving season and lactation stages on milk yield of local Pabna cows
Variable n Milk yield (L) Minimum Maximum P value
LSM SE
Parity
1st 50 2.72
b 0.18 0.64 7.40 0.000
2nd
258 3.54a 0.08 0.78 9.10
3rd
12 4.06a 0.33 2.60 6.60
Calving season
Summer 68 3.74a 0.16 1.76 6.20 0.001
Rainy 56 3.39abc
0.25 1.44 5.51
Autumn 51 3.08abc
0.18 1.27 4.77
Late autumn 42 2.50c 0.25 0.64 7.84
Winter 51 3.55ab
0.19 0.78 9.10
Spring 52 3.63ab
0.16 1.42 7.40
Lactation stage
0-105th day 147 4.00
a 0.13 1.41 9.10 0.000
106th -210
th day 116 3.09
b 0.14 1.40 5.78
211th -305
th day 57 2.48
c 0.19 0.64 4.50
Interactions
Parity*Season 0.008
Season*Lactation stage 0.053
Parity*Lactation stage 0.679
Parity*Season*Lactation stage 0.071
The parity number and body weight of dam, calving season and calves’ birth weight, lactation stage,
and lactation length could be considered as section parameters for local Pabna cows considering total
milk yield.

Proceedings of the Annual Research review Workshop 2019, BLRI, Savar, Dhaka 1341, January 26-27, 2020
11 Technical Session II
Development of mobile and web based data recording applications for Dairy
Development Research Project
MAI Talukder and M Shahjahan
Dairy Development Research Project, Bangladesh Livestock Research Institute, Savar, Dhaka 1341, Bangladesh
Executive summary
Data recording is utmost important for farm management and conducting research. Except few
research station or farms, data recording is not available in the dairy sector of Bangladesh, while it can
be done well with the utilization of digital data recording. The key utility of such digital innovations
lies in strengthening the management information system (MIS) by enabling online real-time data
collection. As digitalization is one of the prime visions of the Government of Bangladesh, it can use
for documentation and processing of research activities across scattered locations ranging from
research stations to community villages through digital devices to bring about ease and efficiency in
its operational systems. The Dairy Development Research Project (DDRP) of Bangladesh Livestock
Research Institute (BLRI) looked for database software to establish a digital data recording system
leading its smart dairy research initiatives. The software has been executed to input farm and
community based research data via mobile (online and offline) and web.
The data recording system of DDRP-BLRI applications includes genotype based pedigree history of
individual cattle with climate changing parameters (Figure 1).This software incorporated cattle and
calf enrollment with cattle herd book, characterization, growth, breeding and reproduction, milking
cows, dairy characteristics, semen characteristics, daily feeding, body condition and health modules
(Figure 2). There are few supporting modules (weather, transaction summary, cattle list, settings, exit
etc.) added with mobile’s applications for facilitating enumerator works. This software enables to
capture farm pictures with GPS coordinates and physical positioning on maps, in addition, input
(feeding, vaccinations, deworming etc.) and output (milk yield, physio-chemical parameters of milk
and semen, growth etc.) tracking. Additionally, it has been using for breed history tracking that would
contribute to develop a digital cattle herd book for individual animal considering a lifetime certificate.
After inputting primary data in that software, all those data can be downloaded either by excel or pdf
format from report section of that applications to analyze in future.

Proceedings of the Annual Research review Workshop 2019, BLRI, Savar, Dhaka 1341, January 26-27, 2020
12 Technical Session II
Therefore, the DDRP-BLRI applications might be considered as an ideal digitalized farming data
recording software towards breed development and conservation having user friendly characteristics
for simultaneous data inputting and reporting.

Proceedings of the Annual Research review Workshop 2019, BLRI, Savar, Dhaka 1341, January 26-27, 2020
13 Technical Session II
Conservation and improvement of native chicken: laying performance of seventh
generation
S Faruque, AKFH Bhuiyan, MR Hassan, MAG Rabbani, MA Rashid, MSK Sarker and NR Sarker
Executive summary
The present study was conducted at Bangladesh Livestock Research Institute, Savar, Dhaka with the
objectives (i) to assess the laying performances of three native chicken (Non-descript Deshi, Hilly,
Naked Neck) genotypes under intensive management, ii) to study the comparative performances
among native and Kadaknath chickens. The selection objectives of the study were to improve the egg
production and / or growth rate of Indigenous Chicken depending on the genotype (ND, H and NN) of
birds. At 40-week of age, on the basis of an index comprising the age at first egg laid (AFE), body
weight (BW) at 40 week, egg production (EP) up to 280 days and egg weight (EW) at 40 weeks. Egg
production was recorded on 280 days. For Kadaknath (K), a total of 500 pedigree hatched day old
chicks were identified individually by wing band. Egg quality was observed at 40 weeks of bird’s age
and blood profile was analysed. At 10 weeks of age, a total of 24 birds (Naked Neck, Hilly, Non-
descript Deshi and Kadaknath chicken) (6 birds in each genetic group, 3 males and 3 females) were
randomly selected and peripheral blood samples (2-3 ml) were obtained by wing vein puncture.
Glucose, Haemoglobin, Iron content were measured on a Humalyzer 2000 chemistry (Germany) using
a turbidimetric method as described by the manufacturer. The data were analyzed in CRD by General
Linear Model (GLM) Univariate Procedure in SPSS Computer Program.
Hatching egg weights of ND, H and NN were 46.29, 46.68 and 46.52g; respectively. Chick weight
was not affected (p>0.05) by genotype (Table 1). Fertility of ND, H and NN were 88.96, 87.03 and
86.67%, respectively. The highest hatchability (90.85%) was found in ND (p<0.001) compared to H
(89.25%) and NN (83.94%) (Table 1). Egg production (20-40 weeks) number was significantly
(p<0.001) affected by genotype. The highest egg production number of ND, H and NN were 79.08,
69.33 and 74.86, respectively. The hen-day egg production (HDEP %) of native chicken genotypes
are presented in Table 1. Hen-day egg production (HDEP %) was affected (p<0.001) by genotype.
Significantly (p<0.05) the lowest glucose content was found in K chicken (4.34 mMol/L) compared to
H (7.34 mMol/L)), NN (5.88 mMol/L) and ND (5.76 mMol/L) (Table 2). Iron content of blood was
non-significantly highest in K chicken compared to other three native chickens. Haemoglobin content
of blood was non-significantly highest in H chicken. Significantly (p<0.05) the highest dressing yield
(76.47 %) and breast meat weight (10.37 %) were observed in H genotype followed by other three
genotypes.
Table 1. Performances of non-descript, naked neck and Hilly chicken genotypes under intensive
rearing condition
Parameter Genotype Level of significance
ND
(Mean ±SE)
H
(Mean ±SE)
NN
(Mean ±SE)
Hatching egg wt (g) 46.29±0.39 46.68±0.39 46.52±±0.35 NS
Chick wt (g) 31.48±0.22 31.60±0.22 30.96±0.20 NS
Fertility (%) 88.96±1.35 87.03±1.35 86.67±1.21 NS
Hatchability (%) of
fertile eggs
90.85a±1.32 89.25
a±1.32 83.94
b±1.19 p<0.001
EP (no.) (20-40 wks) 79.08a±1.19 69.33
c±1.31 74.86
b±1.17 p<0.001
HDEP (%) (20-40
wks)
56.48a±0.85 49.52
c±0.93 53.47
b±0.83 p<0.001
ND=Non-descript Deshi; H=Hilly; NN=Naked Neck; HDEP=Hen day egg production; least squares means
without a common superscript along the row within a factor differed significantly (p<0.001).

Proceedings of the Annual Research review Workshop 2019, BLRI, Savar, Dhaka 1341, January 26-27, 2020
14 Technical Session II
Table 2. Comparative Performances of three native and Kadaknath chicken genotypes
Parameter Genotype Level of
significance
K H NN ND
Glucose (mMol/L) 4.34b 7.34
a 5.88
ab 5.76
ab p<0.05
Iron (µg/dl) 138.00 128.20 129.80 129.80 NS
Haemoglobin (g/dl) 11.98 12.88 11.70 11.56 NS
Dressing (%) 69.40 76.47 75.19 74.67 p<0.05
Drumstick wt (g) 9.09 10.45 10.49 9.57 P<0.01
Breast meat (%) 7.84 10.37 9.55 9.08 p<0.05
.Shape Index 76.05 75.40 76.54 77.44 NS
Albumen Index 9.75b 11.08
ab 11.89
a 12.36
a p<0.05
Yolk Index 45.03b 48.09
a 48.97
a 48.59
a p<0.001
ESBS (kg/cm2) 3.87 3.63 4.21 3.35 NS
Haugh Unit 84.83b 89.71
a 91.03
a 92.91
a p<0.01
K=Kadaknath, ND=Non-descript Deshi; H=Hilly; NN=Naked Neck; ESBS=Egg Shell Breaking Strength; least
squares means without a common superscript along the row within a factor differed significantly (p<0.05),
NS=Non-significance
The qualities of the eggs collected from different chickens genotypes kept under intensive rearing
system are presented in Table 2. There were non-significant (p>0.05) differences in shape index
among the genotypes. Non-significant (p>0.05) variation was found in breaking strength. The internal
quality trait such as Haugh unit was significantly (p<0.01) affected by genotype. Non-descript Deshi
was superior for egg production, fertility and hatchability traits. No extra ordinary result was found in
case of Kadaknath chicken.

Proceedings of the Annual Research review Workshop 2019, BLRI, Savar, Dhaka 1341, January 26-27, 2020
15 Technical Session II
Conservation and improvement of exotic germplasms and development of egg and meat
type chicken
MR Hassan, MAG Rabbani, S Sultana, S Faruque and NR Sarker
Poultry Production Research Division, Bangladesh Livestock Research Institute, Savar, Dhaka 1341,
Bangladesh
Executive summary
In recent years, climates are changing in Bangladesh. Therefore, summers becoming hotter; monsoon
irregular, untimely rainfall directly affects bird performance. Keeping those issues in mind, BLRI has
developed multi color table chicken (MCTC) for meat production using native germplasms which has
mixed feather color like native chicken. Therefore, to know the performance and adaptabilities of
MCTC, several experiments were conducted from 2016-2019. In consecutive four on station trials
results, day old chick’s weight ranges from 37-40 g, body weight at 8 wks: 950-1000 g, feed intake:
2200-2300 g, FCR: 2.2-2.3 and mortality was found 1-1.5 %. Therefore, the present research program
was undertaken to address two activities. Activity 1: a total of 600 day old chicks were allotted in 30
pens (20 chicks per pen) to know the performance and carcass characteristics. The birds were feed
with the starter (1-21 d), grower (22-35 d) and finisher (36-56 d) diet. Body weight (BW), weight gain
(WG), feed intakes (FI) and feed conversion ratio (FCR) were measured weekly. In results, the
average day-old weight was found 39.46 grams. During 0-56 days, average BW, WG, FI and FCR
were found 985.65 g, 945.35 g, 2199.23 g and 2.326 respectively. Average mortality was found 1.36
%. Activity 2: a total of 12000 day old chicks of MCTC were distributed to 12 different district of the
country to validate the growth performance, adaptability and benefit cost ratio under farmer’s existing
condition. All data were analyzed by SAS and differences were determined by Duncan Multiple
Range Test.
Table 1. Performance of MCTC under on station condition
Parameter
On station trial
Average SEM P
value Exp 1 Exp 2 Exp 3 Exp 4
Day old chicks weight (g) 38.83 37.76 39.43 38.436 38.61 0.512 0.718
Body weight (g) at 8 weeks 985.12 930.60 980.50 960.35 964.15 32.17 0.125
Weight gain (g) 946.29 892.84 941.07 921.91 925.53 31.45 0.148
Feed intake (g) 2338.28 2190.30 2234.27 2223.64 2221.63 56.90 0.423
FCR 2.471 2.453 2.374 2.412 2.427 0.094 0.294
Mortality (%) 1.50 2.10 1.90 2.20 1.93 0.002 0.872
Dressing % (with viscera) 71.22 73.58 72.99 71.86 72.41 0.743 0.736
Cooking loss (%) of meat 15.17 15.32 14.63 14.82 14.98 1.867 0.324
Meat pH 5.74 5.88 5.86 5.84 5.83 0.041 0.997
During on station trials no differences (P>0.05) were observed for studied parameters (Table 1). Day
old chick’s weight was varied from 37 to 39 gram. At 8 weeks of age, average body weight was found
900-1050 g (male 1050-1200g and female 800-950 g). At 7 weeks of age, average body weight was
found 750-820 g by feeding of 1600-1700 g per bird. During 0-8 weeks rearing, average mortality
was found 1-2 % among the experiment.
During on farm experiments, growth performance was found significantly higher in Rajbari and lower
in Rangpur region (Table 2). Therefore, better FCR was found in Rajbari which might be due to the
variations in season, housing and management system. In economic evaluation, the average total cost
and gross return were found 145935.97 and 185744.10 taka respectively. Therefore, the average net
returns were found 39809.04 taka within 8 weeks rearing of 1000 MCTC chicken. So, the input output
ratio was found 1:1.274.

Proceedings of the Annual Research review Workshop 2019, BLRI, Savar, Dhaka 1341, January 26-27, 2020
16 Technical Session II
Table 2. Comparative performances of MCTC chicken under on farm condition (0-56 d)
Location
Bird
no.
Parameters
DOC
weight (g)
Body
weight (g)
Weight
gain (g)
Feed intake
(g)
FCR Mortality
(%)
Khulna 1000 37.49 950.31ab
912.82ab
2250.21 2.464a 1.69
Barisal 1100 38.15 1020.54a 982.39
a 2190.54 2.229
ab 1.38
Pabna 500 37.08 920.18ab
883.10ab
2210.63 2.503a 2.10
Rajbari 900 41.01 1040.00a 998.99
a 2027.52 2.029
b 0.96
Manikgonj 1500 37.91 963.00ab
925.09ab
2280.68 2.465a 3.68
Comilla 1000 37.68 972.58ab
934.90ab
2310.05 2.471a 2.94
Rangpur 940 36.92 895.63b 858.71
b 2190.29 2.551
a 4.21
Gazipur 980 38.36 940.50ab
902.14ab
2240.61 2.483a 1.72
Dhaka 1500 37.21 965.02ab
927.81ab
2160.73 2.328ab
2.64
Norsingdi 1250 38.00 925.00ab
887.02ab
2210.81 2.492a 3.23
Narayangonj 800 38.54 958.00ab
919.46ab
2170.28 2.360a 1.89
Noakhali 540 37.84 960.30ab
922.46ab
2315.34 2.509a 3.49
SEM 0.482 38.29 37.43 63.84 0.073 0.271
P value 0.137 0.023 0.027 0.384 0.032 0.078
The performance of chicks at different locations signifies its acclimatization in local environment.
Based on the on station and on farm trials, results indicated that production performance of MCTC is
consistent, adaptable and profitable under farmer’s condition.

Proceedings of the Annual Research review Workshop 2019, BLRI, Savar, Dhaka 1341, January 26-27, 2020
17 Technical Session II
Conservation and improvement of Quail: Performance of eighth generation
S Faruque1, AKFH Bhuiyan
2, MA Rashid
1, MSK Sarker
1 and NR Sarker
1
1Poultry Production Research Division, Bangladesh Livestock Research Institute, Savar, Dhaka 1341 and
Bangladesh Agricultural University, Mymensingh 2202, Bangladesh
Executive summary
Four genotypes of quail like Dhakai (D), White (W), Brown (Br) and Black (Bl) quail are being
maintained at BLRI with the objectives i) to increase the sixth week body weight of Dhakai and BB
(BLRI, BAU) white quail through selective breeding, ii) to select parental birds (males and females)
and breed them in an assortative plan for the production of 8th generation birds. The parent males and
females were maintained in cages for single pair mating through selective breeding systems produce
successive generation. Pedigree records are being kept by using commercially available leg bands to
identify quail of all ages. For producing eighth generation (G8), parent quails of each genotype were
selected from the seventh generation (G7) on the basis of breeding value according to their 6th week
body weight. Hatching eggs were collected from every single pen of the selected parent quails. A total
of 1118-day-old quail chicks comprising of 4 types of quail namely White (W-681), Black (Bl-193),
Brown (Br-84), Dhakai (D-160) were hatched in one batch to produce eighth generation (G8).The diet
containing 24% crude protein and 3000kcal ME/kg were provided to the birds at laying period. Data
on egg weight, hatchability, body weight of chick at first day, 2nd
week, 4th week, 5
th week and 6
th
week of age, feed intake, mortality and egg production were recorded to study their productive and
reproductive performance. Collected data were analyzed in a CRD by General Linear Model
Univariate Procedure using SPSS Software version 11.5. The expected genetic progress due to
selection for 5thweek body weight was estimated for G8 using the following equation;R = h
2 ×S ;
where, R = Expected response, h2 = heritability for 6
th week body weight and S = selection differential
for the selected males and females.
The genotype had significant (p<0.001) effect on the body weight of quails at 5th week of age (Table
1). Body weights at5th week were132.34±0.8, 123.91±0.5, 104.29±0.7 and 105.36±0.6g, respectively
for D, W, Br and Bl genotypes. The hatchability rate was significantly (p<0.001) higher in D
(78.47%) compared to other three genotypes of quail (Table 1). The eggs production (%) up to 24th
week of age was 85.27±1.0, 80.22±1.61, 81.07±1.2 and 96.12±1.1, respectively for D, W, Br and Bl
and significantly (p<0.001) differed among all genotypes. Mortality among 4 genotypes did not differ
(p>0.05).
Table 1. Productive and reproductive performance of four quail genotypes
Parameter Genotype (Mean±SE) Level of sig.
Dhakai White Brown Black
5th
week body weight (g) 132.34a±0.8 123.91
b±0.5 104.29
c±0.7 105.36
c±0.6 p<0.001
Hatchability on setting
eggs (%)
78.47a±1.3 77.32
a±1.0 69.21
b±1.3 75.15
a±1.2 p<0.001
Feed intake(g/b/d) (6-24
wks)
19.11±1.05 18.54±1.1.0 17.31±1.04 18.05±1.11 NS
Egg production (%)
(6-24 wks)
85.27b±1.0 80.22
c±1.61 81.07
c±1.2 96.12
a±1.1 p<0.001
Mortality (%) 3.28±0.16 2.58±0.23 3.11±0.11 2.41±0.13 NS
Least squares means without a common superscript along the row within a factor differed significantly
(p<0.001), NS=Non-significance; wks: weeks
Table 2 showed that 6th week body weight of males of D, W, Br and Bl quails were expected to
increase by 4.06, 6.36, 2.39 and 3.12 g, respectively. While in females of D, W, Br and Bl quails, the
expected responses were 5.60, 3.61, 4.17 and 3.91g, respectively. Based on the performance Dhakai
quail was superior for body weight and Black quail for egg production. These findings suggested for
continuing the quail breeding research for producing a suitable meat type quail genotype in our
country.

Proceedings of the Annual Research review Workshop 2019, BLRI, Savar, Dhaka 1341, January 26-27, 2020
18 Technical Session II
Table 2. Selection response for 6 weeks body weight (g) in eighth generation (G8) G
eno
ty
pe
Sex
Before selection After selection Selection
Differential
(S) (g)
Heritability
(h2)
Expected
response to
selection (R) No. Aver. No. Aver.
Dh
a
kai
M 95 152.9 40 162.3 9.40 0.432 4.06
F 100 165.98 40 180.3 14.32 0.391 5.60
Wh
ite
M 200 135.6 120 148.8 13.20 0.482 6.36
F 201 152.9 120 160.5 7.60 0.476 3.61
Bro
wn
M 175 130.5 120 135.8 5.30 0.451 2.39
F 180 135.7 120 144.9 9.2 0.454 4.17
Bla ck
M 102 128.9 40 136.7 7.8 0.401 3.12
F 92 136.8 40 145.4 8.6 0.455 3.91

Proceedings of the Annual Research review Workshop 2019, BLRI, Savar, Dhaka 1341, January 26-27, 2020
19 Technical Session II
Conservation and improvement of native duck and geese genotypes; Laying
performances of 5th
generation of BLRI improved duck genotypes
H Khatun, S Sultana, S Faruque, MSK Sarker, MRA Sumon and NR Sarker
Poultry Production Research Division, Bangladesh Livestock Research Institute, Savar, Dhaka 1341,
Bangladesh
Executive summary
Improving the performance characteristics of Rupali and Nageswari duck genotypes, an individual
selection program has been taken at BLRI since 2012. After improvement of fourth generations of
Rupali and Nageswari ducks, laying performance of fifth generation (G5) were studied in this year.
The selection Index was used for the selection of ducks. The individuals with higher score were
selected for breeding purposes. In each generation selection were practiced on the basis of age at first
lay (day), body weight at first lay (g), egg production % (168-336 days) and egg weight (g). Selected
male and female were mated at the maximum ratio of 1: 5 using natural mating. Adult ducks were
housed in an open sided shed and diet contains 17.5% CP and 2750 Kcal ME/kg DM. The drinking
water was provided adlibitum throughout the day. Egg production egg weight, feed intake, egg mass
and FCR data were calculated. Two eggs from each duck genotypes were randomly collected at the
age of 40 weeks and egg quality characteristics were evaluated. The selection intensity and selection
responses of selection criteria of two duck genotypes were estimated. All recorded data were analyzed
by SAS and differences were determined by DMRT.
Table 1. Selection differential, selection intensity and selection responses of Rupali and Nageswari
Ducks in fifth generation (G5)
Genotype Traits Before
selection
After
selection
Selection
differential
(S)
Selection
intensity
(i)
Heritability
(h2)
Selection
responses ®
Rupali ASM (d) 157.23 155.66 -1.57 -0.12 0.4 -1.63
EW(g) 57.96 59.16 1.20 0.32 0.5 0.60
BW(g) 1412.60 1452.58 39.98 0.46 0.5 19.99
EP (%) 44.60 51.36 6.76 1.23 0.15 1.01
Nageswari ASM (d) 152.63 150.50 -2.13 -0.13 0.4 -0.85
EW(g) 54.28 55.06 0.78 0.23 0.5 0.39
BW(g) 1346.58 1345.78 -0.80 -0.01 0.5 -0.40
EP (%) 41.75 44.86 3.11 0.45 0.15 0.47
ASM-Age at sexual maturity, BW-Body weight, EW-Egg weight, EP-Egg production
Table1 shows the selection criteria of fifth generation (G5) of both duck genotypes. Selection
differential of age at sexual maturity, egg weight and egg production for Rupali and Nageswari were -
1.57 and -2.13; 1.2 and 0.78; 6.76 and 3.11, respectively. The intensity of selection for ASM, egg
weight and egg production were -0.12 and -0.13; 0.32 and 0.23; 1.23 and 0.45 for Rupali and
Nageswari duck, respectively. As a result of selection, age at sexual maturity, egg weight, and egg
production were expected to improve by -1.63, 0.60, 1.01 and -0.85, 0.39, 0.47 for Rupali and
Nageswari ducks, respectively. The laying and egg quality performance data of Rupali and Nageswari
ducks are presented in Table2 and found that,egg mass was significantly(P<0.05)higher in Rupali
(40.24g) thanNageswari (37.55g) duck whereas, egg weight was not significantly (p>0.05) differ in
both genotypes. Egg production in Rupali and Nagesswari duck was 59.93% and 57.46%,
respectively. Rupali ducks were significantly (p<0.05) consumed more feed (134.54 g) than
Nagesswari ducks (126.23 g). The FCR was significantly (p<0.05) better in Rupali (3.34) than
Nageswari (3.61) ducks.The egg quality results showed that egg shell thickness of Rupal iduck was
significantly (p<0.05) higher than Nageswari. Higher values for albumen width (65.03) was also
found in Rupali than Nageswari(P<0.05) duck.On the other hand shape index, albumen index, yolk
index and haugh unit were not found significantly different in both genotypes.

Proceedings of the Annual Research review Workshop 2019, BLRI, Savar, Dhaka 1341, January 26-27, 2020
20 Technical Session II
Table 2. Production and egg quality performanceof Rupali and Nageswari ducks in fifth generation
(G5)
Parameters Rupali Nageswari SEM P value
EP% 59.93 57.46 0.918 0.117
EW (g) 67.12 65.40 0.572 0.103
EM (g/d) 40.24 37.55 0.363 0.042
FI(g/d) 134.54 126.23 0.398 0.039
FCR 3.34 3.61 0.384 0.043
Egg weight (g) 66.93 63.68 1.227 0.216
Albumen length (mm) 88.44 86.28 1.200 0.429
Albumen width (mm) 65.03 59.11 1.572 0.035
Shell thickness (mm) 0.51 0.44 0.015 0.0001
Shape index (%) 78.36 75.56 0.833 0.085
Albumen index (%) 11.05 11.76 0.351 0.369
Yolk index (%) 38.89 39.93 0.339 0.136
Haugh unit 90.17 90.85 0.587 0.620
EP= Egg Production, EM= Egg mass, EW= Egg weight, FI= Feed intake, FCR= Feed conversion ratio
These findings revealed that among the native duck genotypes Rupal duck was better in terms of egg
weight, egg mass and egg production. But Nageswari genotype was also found reaching maturity
earlier than Rupali genotype and this findings give us more attention for continuing the duck breeding
research for developing suitable egg type native duck genotypes in Bangladesh.

Proceedings of the Annual Research review Workshop 2019, BLRI, Savar, Dhaka 1341, January 26-27, 2020
21 Technical Session II
Conservation and improvement of Black Bengal Goat at Bangladesh Livestock Research
Institute (BLRI)
MA Jalil and NH Desha
Goat and Sheep Production Research Division, Bangladesh Livestock Research Institute, Savar, Dhaka 1341,
Bangladesh
Executive summary
Goat is one of the potential livestock species which contributing meat and skins, and to some extent,
milk, fleece and manure. The Black Bengal goat is the heritage and pride of Bangladesh which is
popular for higher prolificacy, short generation interval and better adaptability to adverse
environmental conditions. But, the breed is being diluted by unwanted crossing all over the country
resulting genetic erosion of this valuable goat breed. Considering the fact, the project has designed
with the objectives- i) To conserve, improve and evaluate the performance of Black Bengal goat
through selective breeding and ii) To reveal the factors affecting kid mortality. The study was
conducted in Goat and Sheep Research Farm of Bangladesh Livestock Research Institute, Savar,
Dhaka. The breeding program was conducted through Open Nucleus Breeding System (ONBS)
avoiding inbreeding in order to improve the genetic and phenotypic traits of existing breeding goat
stock. The selection objectives of the study were to improve the prolificacy, milk production and
growth rate of the breed. The targeted prolificacy, milk production and 6 months body weight of
Black Bengal goat were, minimum 2 kids per kidding; 0.5 litter/day and 12 kg, respectively. The
selection index was calculated by the following equation, IB = b1x1 + b2x2 + …. + bnxn. Where, b1,
b2,..,bn were phenotypic values for the traits and x1, x2,…, xn were relative economic values given to
each of the traits. Kid mortality rate was calculated by data recorded from the period of September,
2017 to August, 2019. The following general linear model was used to estimate the effect of different
factors on mortality rate of kid, Yijklmn = μ + Bi + Gj + Tk + Sl + Vm + e ijklmn. Where, μ = Overall
population mean for any of the said traits, Bi = Effect of i’th parity, Gj = Effect of j’th birth type, Tk =
Effect of k’th sex, Sl = Effect of l’th birth weight,Vm = Effect of m’th birth season and e ijklm =
Random residual error associated with Yijklmn observation.
The average prolificacy birth weight, 3 months body weight and 6 months body weight were
2.12±0.03, 0.28±0.02 litter, 1.15±0.02 kg, 5.73±0.10 kg and 8.59±0.18 kg, respectively. Table 1
shows higher prolificacy in generation 1 (2.29±0.06) whereas, higher 6 months body weight in
generation 2 (9.32±0.58). The average kid mortality was 29.8% whereas, the kid mortality of selected
Black Bengal goat was 10.33% and also affected by sex, birth weight, season, birth type and parity
(table 2).
Table 1. Productive and reproductive performance of Black Bengal Goat (Mean ± SE):
Generation Average prolificacy Birth weight (kg) 3 months body
weight (kg)
6 months body weight
(kg)
1 2.29±0.06 (53) 1.11±0.03 (53) 5.77±0.19 (45) 8.47±0.3 (29)
2 2.006±0.02 (25) 1.17±0.05 (25) 6.01±0.32 (24) 9.32±0.58 (20)
3 2.24±0.09 (23) 1.05±0.04 (23) 5.47±0.15 (23) 8.16±0.34 (16)
4 1.83±0.08 (13) 1.24±0.06 (13) 5.71±0.40 (9) 7.92±0.45 (8)
5 1.74±0.06 (12) 1.15±0.05 (12) 5.80±0.29 (10) 8.57±0.30 (9)
6 2.19±0.10 (14) 1.27±0.06 (14) 5.69±0.26 (14) 9.01±0.44 (7)
7 2.00 (3) 1.13±0.03 (3) 4.75±1.45 (2) 7.45±1.65 (2)
Sig. level NS NS NS NS
Figure in the parenthesis indicate the number of observations. NS= Non significance (p>0.05)

Proceedings of the Annual Research review Workshop 2019, BLRI, Savar, Dhaka 1341, January 26-27, 2020
22 Technical Session II
Table 2. Kid mortality in Black Bengal Goat (%)
Total kid mortality (%) 29.8%
Kid mortality in Selected BBG (%) 10.33%
Kid mortality in Non-Selected BBG (%) 19.47%
Sex Male Female
Kid mortality (%) 41.91 58.8
Birth weight (kg) ≤1 kg BW >1kg BW
Kid mortality (%) 32.88 66.91
Season Summer Rainy Winter
Kid mortality (%) 23.33 44.89 27.54
Birth type Single Twin Triplet Quadruplet
Kid mortality (%) 22.06 56.62 14.7 4.41
Parity 1st 2
nd 3
rd 4
th 5
th 6
th 7
th – 9
th
Kid mortality (%) 16.18 22.06 21.32 14.70 8.82 5.15 4.41
In conclusion, superior bucks and does will be selected by the individual performance score. On the
other hand, the initial findings of kid mortality suggested for further research to minimize the effect of
factors affecting kid mortality. Therefore, the research program should continue for the coming years
to achieve the targeted goal.

Proceedings of the Annual Research review Workshop 2019, BLRI, Savar, Dhaka 1341, January 26-27, 2020
23 Technical Session II
Performance evaluation of F1 progeny of different beef breeds with native cattle
MP Mostari, MYA Khan, BK Roy and N Sultana
Animal Production Research Division, Bangladesh Livestock Research Institute, Savar, Dhaka 1341,
Bangladesh
Executive summary
Bangladesh has a high dense of cattle population but low carcass yield of native cattle and to meet
up the growing demand of beef in the upcoming years, crossbreeding of native cattle with suitable
high yielding exotic beef sire (s) is prerequisite. Aiming at developing breeding bulls for crossing,
the cows of BLRI Cattle Breed 1 (BCB-1) were inseminated with the imported frozen semen of
Brahman, Simmental, Charolais or Limousine. The crossbred bulls of different assorted F1
genotypes are being selected and their production and breeding performance are being recorded,
evaluated and compared with native BCB-1. All calves were raised in an identical care and
management. The supplied concentrate mixture contained 18% CP. The recorded economic traits
were compared statistically in an ANOVA of a Completely Randomized Design using General
Linear Model of “agricolae” package of R software (version 3.5.1). A total number of 53 F1
crossbred progeny were produced and out of that 15 were Limousine, 14 were Simmental, 12 were
Charolais and 12 were Brahman crosses.
Table 1. Effects of genotypes on live weight of F1 progeny at different ages
***Highly significant (p<0.001);**Significant (p<0.01); *Significant (p<0.05); SD= standard deviation;
NS= not significant; value in the parenthesis indicate the number of observation
Table1 revealed that all crossbred F1 progeny performed better than BCB-1 in terms of live weight
at different ages and they differ significantly among the groups except at the yearling age of both
sexes. At birth both male and female calves of Charolais showed the highest live weight but at 2
years (Market age) of age male of Simmental cross showed the highest live weight followed by
Charolais, Limousine, Brahman crosses and BCB-1. Interestingly, at 3 years of age males of all
crosses did not differ statistically among them. Similarly to male, Simmental female also attained
higher live weight compared to other crosses and BCB-1 at market age.
Live
weight
(kg)
Genotype (Mean±SD) Sig.
Lev.
Purebred
BCB-1
Brahman cross Charolais cross Limousine
cross
Simmental
cross
Male
At
birth
18.84b±3.40(5) 24.90
a±2.48(7) 25.70
a±6.09(9) 22.43
ab±4.77(9) 23.08
ab±2.10(6) *
At 1 yr 202.20±9.75(5
)
250.14±19.75(7
)
246.14±74.19(7
)
231.62±41.41(8) 235.60±60.32(5
)
NS
At 2
yrs
348.00d±20.0(
5)
407.14c±15.23(
7)
495.00ab
±40.92(
4)
472.66b±38.(6) 543.50
a±105.35
(2)
***
At 3
yrs
460.20b±67.12
(5)
583.50a±36.84(
4)
633.50a±51.62(
4)
602.80a±32.58(5) 658.00
a±70.71(
2)
***
Female
At
birth
16.84b±4.13(5) 22.54
a±2.01(5) 25.55
a±4.16(6) 22.58
a±6.13(7) 22.79
a±2.87(13) *
At 1 yr 173.6b±9.31(5) 210.6
ab±26.43(5
)
225.83a±43.7(6) 205.57
ab±37.13(7
)
229.72a±45.49(
11)
NS
At 2
yrs
290.8c±11.79(
5)
323.6bc±14.32(
5)
382.2ab
±47.83(5
)
385.25ab
±69.73(4
)
413.87ab
±75.88(
8)
**

Proceedings of the Annual Research review Workshop 2019, BLRI, Savar, Dhaka 1341, January 26-27, 2020
24 Technical Session II
Table 2. Effects of genotypes on intake, growth and FCR at 24 months of age
Parameters Genotypes Sig
.lev.
PurebredBC
B-1 (5)
Brahman
cross (6)
Charolais
cross (5)
Limousine
cross (3)
Simmental
cross (3)
Total DMI (Kg/d) 6.02 b±1.57 7.44
ab±1.12 8.53
a±1.23 8.40
a±1.20 8.01
ab±1.89 NS
Total Gain (Kg) 53.40±5.68 44.00±12.47 53.80±13.10 48.00±6.56 49.33±10.07 NS
ADG (Kg) 0.78±0.08 0.65±0.18 0.79±0.19 0.71±0.10 0.72±0.15 NS
FCR 7.79 b±2.46 12.16
a±3.22 11.33
ab±3.39
11.90 ab
±0.15 11.22 ab
±2.47 NS
NS= not significant; value in the parenthesis indicate the number of observation
During birth to market age and above, all crossbred males gained more than BCB-1 and Simmental
cross gained the highest daily live weight (0.74±0.16 kg) followed by Charolais (0.67±0.03kg),
Limousine (0.65±0.04kg), Brahman (0.57±0.05kg) crosses and BCB-1 (0.46±0.03kg).Table 2
revealed that genotypes had no significant (p>0.05) effects on total dry matter (DM), total live
weight gain, average daily gain (ADG) and feed conversion ratio (FCR) at 24 and >24 months of
age for 68 days of feeding trial. This Table indicated that purebred BCB-1 took the lowest DM and
showed the highest feed conversion efficiency compare to other crosses. It means crossbreds
showed the higher extend of beef production but BCB-1 is more efficient in feed utilization and
profitable farming. Here, initially the control BCB-1group had some compensatory growth effect
but the crosses were better in body condition scores.
It may be stated that among the four crosses Simmental×BCB-1 performed best based on growth
but purebred native BCB-1 also has production potentials. More F1 progeny is yet to be produced
and required to evaluate the production and breeding performance of crossbreds. Carcass
characteristics and meat quality of different beef breeds at different ages will be determined in the
upcoming fiscal year. Semen collection, evaluation and preservation of selected bulls, field testing,
inter-se mating in F1 generation of the best performing genotype(s), back crosses, three-breed
terminal cross, and synthetic beef breeds will be produced under the program. For these, this
breeding program should be continued to achieve its goal.

Proceedings of the Annual Research review Workshop 2019, BLRI, Savar, Dhaka 1341, January 26-27, 2020
25 Technical Session II
Characterizing and screening of different coat color variants goat stock at BLRI
1SMJ Hossain,
1MF Afroz,
1MFH Miraz,
2MA Jalil and
3MA Habib
1Biotechnology Division,
2Sheep and Goat Research Division and
3Dairy Development Research Project,
Bangladesh Livestock Research Institute, Savar, Dhaka 1341, Bangladesh
Executive summary
In Bangladesh, the goat ranks second in position among the ruminant species with high prolificacy
rate. Goats have great variation in color and the genetic control can be tricky. Although, lots of solid
and mixed colored goats are available in our country but the studies on coat color inheritance are very
scanty in our country. The present study were taken to develop pure-line goat genotypes based on coat
color variant and phenotypic characterization of different coat color goat. The research conducted at
BLRI goat research farm. To develop different color variants’ goat stock, having three distinguished
colors viz. solid white, Dutch belted and Toggenburg pattern. Within color pure breeding was
followed for designing mating plan. Progeny was screened based on their color inheritance. Semi-
intensive management was followed for animals of each flock. Genetic and phenotypic data were
recorded. The collected data were analyzed statistically with IBM SPSS 20.0. Mean comparison were
estimated by DMRT method.
Table 1. Body weight of kid at different ages
Table 1 shows the body weight and growth performances of kids at different ages. Irrespective of
different genetic factors, the overall mean birth weight (BWT), three month body weight (3MWT), six
month body weight (6MWT), growth rate at 0 to 3 month (GR0-3) and growth rate at 3 to 6 month
(GR3-6) were 1.17±0.01kg, 7.43±0.16kg, 11.75±0.28kg, 69.45±1.73g/d and 48.10±1.84g/d,
respectively. Three month body weight (3MWT) of kids were significantly (p<0.05) higher than those
of parity. Birth weight of kids were highly significant (p<0.001) than those of litter type. However,
sex and genotype had no significant effect on BWT, 3MWT, 6MWT, GR0-3 and GR0-6. Table 2 shows
the reproductive performances for different color genotypes of goat. The overall gestation length,
Factor Mean±SE
BWT (Kg) 3MWT (kg) 6MWT (kg) GR0-3 (g/d) GR3-6 (g/d)
Sex NS NS NS NS NS
Male 1.18±0.02 (107) 7.48±0.23 (71) 11.79±0.39 (56) 69.68±2.41 (71) 49.11±2.79 (55)
Female 1.15±0.02 (90) 7.39±0.23 (62) 11.70±0.40 (49) 69.19±2.52 (62) 46.94±2.35 (48)
Genotype NS NS NS NS NS
SW 1.16±0.02 (87) 7.21±0.22 (58) 11.53±0.44 (46) 66.72±2.41(58) 49.26±2.78(45)
DB 1.15±0.04(57) 7.90±0.37(34) 12.12±0.59(23) 74.19±3.84(34) 46.04±4.36(23)
TB 1.16±0.01(49) 7.25±0.28(34) 11.55±0.42(28) 68.61±3.05(34) 46.75±2.72(27)
Parity NS * NS NS NS
1st 1.13±0.03(71) 7.01
ab±0.23(53) 11.12
ab±0.42(42) 64.91±2.43(53) 47.34±2.77(41)
2nd
1.19±0.04(55) 7.90a±0.32(29) 11.61
a±0.38(27) 73.16±3.29(29) 42.22±2.89(27)
3rd
1.15±0.02(36) 6.98ab
±0.27(25) 10.92ab
±0.35(19) 64.80±2.89(25) 45.20±3.68(19)
4th
1.06±0.08(12) 6.52b±0.38(10) 8.97
b±1.29(3) 63.11±4.78(10) 35.55±5.55(2)
5th
1.23±0.09 (6) - - - -
Litter type *** NS NS NS NS
Single 1.37a±0.09(19) 7.32±0.76(13) 11.30±1.03(8) 66.01±7.24(13) 45.0±5.17(8)
Twin 1.14b±0.03(57) 7.17±0.25(35) 11.61±0.51(30) 66.22±2.71(35) 49.08±3.51(29)
Triplet 1.15b±0.03(68) 7.25±0.24(43) 10.70±0.33(37) 67.84±2.45(46) 42.19±2.50(36)
Quadruplet 1.15b±0.03(24) 6.78±0.37(13) 10.75±0.29(12) 62.29±4.04(13) 43.33±4.41(12)
Five fold 1.03b±0.04(15) 7.03±0.33(11) 11.50±0.25(5) 65.86±1.55(11) 44.44±4.96(5)
Overall 1.17b±0.01(197) 7.43±0.16(133) 11.75±0.28(105) 69.45±1.73(133) 48.10±1.84(103)
(Figures in the parenthesis indicate number of observation; NS-Non-significant, (p>0.05), *(p<.05) and ***
(p<0.001).BWT= Birth weight, 3MWT=Three month body weight, 6MWT=Six month body weight,GR=Growth
rate)

Proceedings of the Annual Research review Workshop 2019, BLRI, Savar, Dhaka 1341, January 26-27, 2020
26 Technical Session II
litter size, post-partum heat period and kidding interval obtained in this study were 159±2.14 d,
2.21±0.09, 50.79±9.06 d, and 214.44±16.66 d, respectively. Color genotype, had no significant effect
on gestation length, litter size, post-partum heat period and kidding interval. On the other hand, Parity
had significantly effect on gestation length (p<.05) and litter size (p<.01) but had no significant effect
on post-partum heat period and kidding interval.
Table 2. Reproductive performance for different genotype
*Figures in the parenthesis indicate number of observation; *-p<0.05; **-p<0.01); NS-Non-significant (p>0.05).
This study reveals that phenotypic performances among three coat color goat genotypes showed
almost similar and they are very prolific in term of growth rate and litter size. From above research
work it can be said that all three coat color goat genotypes needs to be conserved which may lead to
establish pure line indigenous goat population based on coat color phenotype.
Factor (Mean±SE)
Gestation length
(days)
Litter size
(no.)
Post-partum heat
period(days)
Kidding Interval (days)
Genotype NS NS NS NS
SW 157. 17±4.07 (35) 2.39±0.15(43) 43.13±12.26 (15) 211.58±33.00 (12)
DB 161.57±2.95 (38) 2.10±0.16 (39) 51.88±12.99 (18) 217.14±16.70 (14)
TB 157.84±4.25 (19) 2.00±0.13 (19) 66.67±84.73 (6) 208.0±21.08 (12)
Parity * ** NS NS
1st 168.21
b±4.19 (28) 1.81
b±0.13 (36) - -
2nd
158.81ab
±3.44 (27) 2.13b±0.15 (30) 59.88±15.33(17) 230.20±28.62 (15)
3rd
156.26ab
±4.34 (19) 2.63ab
±0.23 (19) 35.55±8.05 (11) 195.40±10.75 (7)
4th
152.15a±3.22 (13) 2.55
ab±0.36(11) 35.60±19.96(5) 193.40±21.76(5)
5th
- 3.50a±0.50(2) - -
Overall 159.13±2. 14 (92) 2.21±0.09 (101) 50.79±9.06 (39) 214.44±16.65 (27)

Proceedings of the Annual Research review Workshop 2019, BLRI, Savar, Dhaka 1341, January 26-27, 2020
27 Technical Session II
Red Chittagong Cattle breeding and revealing their genetic architecture using High
Density Single Nucleotide Polymorphism Array
AKFH Bhuiyan1, MSA Bhuiyan
1, SMJ Hossain
2, GK Deb
2, MF Afroz
2 and MFH Miraz
2
1Department of Animal Breeding and Genetics, Bangladesh Agricultural University, Mymensingh 2202 and
2Bangladesh Livestock Research Institute, Savar, Dhaka 1341, Bangladesh
Executive summary
The Red Chittagong Cattle (RCC) is a valuable cattle genetic resource of Bangladesh. The objectives
of this project were: (1) to assess the performance of pure and graded RCC with a view to make
available young bulls to national breeding service providers and (2) to investigate the genetic diversity
and genomic architecture of RCC using high density Single Nucleotide Polymorphism (SNP)
markers. Data on a total of 822 pure RCC of different ages and sexes available in BAU, BLRI, DLS,
BRAC, ADL etc. except rural farmers of greater Chattogram district and elsewhere have so far been
collected, a standard database developed and uploaded in National RCC website. Alongside, a total of
162 Local Non-descript cows have been bred with pure RCC semen produced at the BAU AI Centre
to produce graded RCC in Mymensingh district which are also being tracked. Standard RCC Herd
Book has been developed and data on pedigree and traits of economic are being kept on all identified
RCCs and graded RCC. For molecular study, 114 blood samples from pure and unrelated RCC have
already been collected from BLRI, ADL, Chattogram and Mymensingh. Besides, 167 blood samples
were collected from Pabna, North Bengal Grey, Munshiganj, Sahiwal and Indigenous cattle. The
concentration of extracted DNA samples ranged between 32.6 to 279.8 ng/μl whereas purity of those
samples varied between 1.67 to 2.00. In total, 210 samples have already been sent to commercial
sequencing service company for genotyping by Illumina 50K SNP bead chip and are waiting for
genotyping results. On the other hand, 8 ear tissue samples were collected from pure and unrelated
RC cows and bulls. The extracted DNA samples are ready for whole genome sequence using Illumina
NGS technology. Twelve potential pure young RCC bulls with known pedigree records have been
screened and their fortnightly body weight, growth and andrological data are being recorded at the
BAU AI Centre for making meritorious yearling RCC bulls available to the breeding service
providers of the country.

Proceedings of the Annual Research review Workshop 2019, BLRI, Savar, Dhaka 1341, January 26-27, 2020
Technical Session III 29
Development of feeds and feed additives for producing value added poultry meat and
eggs emphasizing lipid profile and antioxidant
F Sharmin1, NR Sarker
2, MSK Sarker
2 and S Faruque
2
1Post-Doctoral Fellow, Bangabandhu Science and Technology Fellowship Trust, Ministry of Science and
Technology, Dhaka and 2Poultry Production Research Division, Bangladesh Livestock Research Institute,
Savar, Dhaka 1341, Bangladesh
Executive summary
Now-a-days, consumers demand are increasing on natural, safe and eco-friendly products that can
promote health benefits beyond their nutritional value, improve well-being and limit the risk of some
chronic diseases. These foods are named as functional foods or nutraceuticals. This consumers' attitude
applies for the poultry products also. Various nutritional manipulations to the chicken diet can be done to
produce different types of value added meat and egg products. Two different experiments were
performed to fulfill these objectives. At first experiment was carried out to investigate the effects
of Moringa oleifera and Spirulina platensis on lipid profile, oxidative stability and fatty acid profile in
broiler meat. Two hundred forty day old Cobb 500 broiler chicks were assigned to five dietary treatments
for 5 weeks with four replications having 12 chicks per replication. The dietary treatments were: positive
control (T1), M. oleifera leaf meal 1% (T2); 1.5%, (T3) and S. platensis 1% (T4); 1.5% (T5). Final body
weight gain was significantly (p<0.05) higher in T2 and T5 group and feed conversion ratio improved
in T2 group (1.68). The lowest (p<0.05) thiobarbituric acid reactive substances values (TBARS) obtained
in breast meat T3 (10.38) and T4 (14.52) groups, respectively than the control (27.11 µmol MDA1/100g)
after 3rd
week preservation. In addition serum cholesterol (mg/dl) level was significantly reduced in
additives group 124.11±3.56c in T2 and 100.93±1.79
e in T5 group. It was interesting that T2 (93.52
mg/100g) and T5 (76.56 mg/100g) had lower total cholesterol compared to control group (269.42
mg/100g). The fatty acids profiles both breast and thigh meat showed that total ω-3, have the highest
concentration in additives group (T2-T5) compared to control (Table 1).
Table 1. Effect of diets added with M. oleifera leaf meal and S. platensis on body weight, feed
conversion ratio (feed:gain), cholesterol and ω-3 fatty acid of broiler chickens
Parameter Dietary Treatments
T1 T2 T3 T4 T5
BW(g)
0d 46.42±0.34 46.38± 0.43 47.54±0.88 47.06±0.15 48.46±1.4
21d 779.50±11.97a 786.25±5.06
a 751.75±6.61
b 768.50±11.25
b 778.75±75
a
35d 1512.65±29.47b 1612.28±25.66
a 1521.71±23.96
b 1518.31±30.07
b 1629.47±.29.01
a
F:G (g:g)
21d 1.66±0.09 1.62±0.09 1.63±0.07 1.61±0.08 1.64±0.09
35d 1.79±0.02 b 1.68±0.03
a 1.75±0.04
b 1.77±0.02
b 1.72±0.11
ab
Serum cholesterol 140.33±2.68a 124.11±3.56
c 134.33±4.05
b 113.42±3.52
d 100.93±1.79
e
Total cholesterol 269.42±4.31 93.52±2.37 105.60±2.98 137.61±3.81 76.57±3.50
Σω-3 (breast meat) 0.43±0.17 1.45±0.31 0.64±0.26 1.22±0.21 2.29±0.41
Σω-3 (thigh meat) 0.60±0.32 1.07±0.09 1.00±0.03 0.80±0.02 1.27±0.11
a, b, cMean with different superscripts within same raw are significantly different (p<0.05). BW-Body weight (g),
FG- Feed:gain (g:g), Σω-Total omega -3
In the second experiments, two hundred native chickens at the age of 26 weeks were selected and fed
treatment diets as in first experiment for 42 weeks. The birds were housed in a close, ventilated caged-
layer house and were distributed in five dietary groups having 40 birds in each group with 5
replications having 8 birds per replication. The average egg weight was found to be increased in
additives groups. Serum cholesterol levels were significantly reduced (P<0.05) in all additive groups.
In contrast, total egg cholesterol content in T2 and T5 was the lowest with the value of 173.95 and
226.21 mg/100g compared to control group, 283.86 mg/100g (Fig. 1). Omega 3 fatty acids in egg
(g/100g) of the said dietary treatments were increased in T2 group with the value of 1.57 and 1.55 in

Proceedings of the Annual Research review Workshop 2019, BLRI, Savar, Dhaka 1341, January 26-27, 2020
Technical Session III 30
T4 group. However, higher omega 3 fatty acid was found in commercial egg 1(CE1) with the value of
2.03 g/100g. Similar trends were found in total PUFA compared to control diet fed chicken egg.
Figure 1. Effect of M. oleifera and S. platensis as natural feed additives on total cholesterol
(mg/100g) of egg
Based on this study, it may be concluded that functional meat and egg, rich in n-3 PUFA and
antioxidant can be produced by feeding hens with functional feed additives (M. oleifera and S.
platensis) containing bioactive ingredients. This functional feeds, not only improved the general
health the hens (broiler and layer), but also incorporated these health-promoting ingredients into the
meat and egg. Consumption of such functional meat and eggs by humans may significantly improve
their health. Further trails may be required to produce designer or value added egg production as well
as commercialization.
Tota
l chole
ste
rol (m
g/1
00g)
283.86
173.95 176.71
231.71 226.21
276
133.47
239
0
50
100
150
200
250
300
T1 T2 T3 T4 T5 CE1 CE2 CE3
Treatments

Proceedings of the Annual Research review Workshop 2019, BLRI, Savar, Dhaka 1341, January 26-27, 2020
Technical Session III 31
Study on production, nutritive value and land use efficiency of fodder maize (Zea mays)
intercropped with alfalfa (Medicago sativa)
S Ahmed1, MA Habib
2 and NR Sarker
2
1Goat and Sheep Production Research Division, Bangladesh Livestock Research Institute (BLRI) and
2Fodder
Research and Development Project, BLRI, Savar, Dhaka 1341, Bangladesh
Executive summary
Intercropping is mostly used for higher yields per unit area than sole cropping. The present research
work was conducted to study the yield, quality and land use efficiency of fodder maize intercropped
with alfalfa. For this purpose 40 plots each with (5m×5m) areas of land at Pachutia Research Farm,
Bangladesh Livestock Research Institute (BLRI) were laid out in a randomized block design (RBD)
with 8 treatments (described in Table 1) in five blocks. The field was prepared properly by removing
stubbles, ploughing, manuring and leveling. The maize and alfalfa seeds were planted both in
broadcasting and line sowing at the same rate of 40 and 15 Kg ha-1
, respectively with a line spacing of
30cm. The experiment was started at 25th
December and data were collected up to July, and was
analyzed statistically by SPSS.
The results revealed that highest yields both for green herbage (170.64 tones ha-1
from 3 harvests) and
dry matter (20.65 tones ha-1
from 3 harvests) were obtained from fodder maize cultivated as
monoculture. On the other hand, lowest yields both for green herbage (30.21 tones ha-1
from 3
harvests) and dry matter (5.96 tones ha-1
from 3 harvests) were obtained from alfalfa cultivated as
monoculture.
Table 1. Crude protein (CP) yields of alfalfa and fodder maize intercrop
Treatments CP yields (MT ha-1
) at different harvest (H)
Alfalfa Fodder Maize Grand
Total H-1 H-2 H-3 H-4 Total H-1 H-2 H-3 Total
T1 (Mb) - - - - - 0.763a 0.805
a 0.546
ab 2.114
ab 2.114
d
T2 (Ms) - - - - - 0.749a 0.818
a 0.597
a 2.164
a 2.164
cd
T3 (Ab) 0.328a 0.439 0.197
a 0.141 1.106
a - - - - 1.106
e
T4 (As) 0.301a 0.410 0.178
ab 0.134 1.023
ab - - - - 1.023
e
T5 (MbAb) 0.178b 0.412 0.126
b 0.120 0.837
d 0.767
a 0.613
bc 0.549
ab 1.929
b 2.766
a
T6 (MsAs) 0.185b 0.397 0.126
b 0.133 0.842
cd 0.596
b 0.523
c 0.402
c 1.521
c 2.363
bc
T7 (MsAb) 0.199b 0.477 0.176
b 0.120 0.973
bc 0.734
a 0.694
b 0.503
abc 1.931
b 2.904
a
T8 (MbAs) 0.197b 0.386 0.129
b 0.132 0.844
cd 0.593
b 0.549
c 0.432
bc 1.573
c 2.417
b
SEM 0.03 0.01 0.01 0.01 0.05 0.03 0.05 0.03 0.11 0.25
Sig. level *** NS ** NS *** *** *** * *** ***
*p<0.05; **p<0.01; ***p<0.001; NS-p>0.05; uncommon superscript of mean values within same column
differed significantly; SEM-standard error of means; Mb-maize broadcasted; MS-maize line-sowed; Ab-alfalfa
broadcasted; As-alfalfa line-sowed.
Table 2. Nutrient composition of alfalfa and maize fodder as affected by intercropping pattern
#Treatments DM (%) CP (%) Ash (%) ADF (%) NDF (%)
Alfalfa Maize Alfalfa Maize Alfalfa Maize Alfalfa Maize Alfalfa Maize
T1 (Mb) - 12.22 - 10.54b - 09.34
ab - 49.47
c - 77.17
b
T2 (Ms) - 12.10 - 10.48b - 14.10
a - 48.05
bc - 76.38
b
T3 (Ab) 19.73 - 18.55 - 13.31 - 43.87 - 63.43a -
T4 (As) 19.54 - 17.04 - 12.40 - 45.68 - 65.98a -
T5 (MbAb) 19.88 15.09 16.39 17.47a 12.11 08.97
ab 47.08 46.42
b 74.00
b 70.15
ab
T6 (MsAs) 18.30 13.06 17.81 17.22a 14.87 11.48
ab 45.12 47.26
bc 65.24
a 64.70
a
T7 (MsAb) 20.73 14.40 16.87 17.62a 12.59 08.24
ab 45.57 42.85
a 75.24
bc 69.27
ab
T8 (MbAs) 20.88 13.35 15.85 17.98a 13.10 07.89
b 45.65 45.40
ab 78.81
c 74.81
b
SEM 0.38 0.48 0.40 1.49 0.40 0.54 0.42 0.94 2.59 1.98
Sig. level NS NS NS *** NS NS NS ** *** *

Proceedings of the Annual Research review Workshop 2019, BLRI, Savar, Dhaka 1341, January 26-27, 2020
Technical Session III 32
*p<0.05; **p<0.01; ***p<0.001; NS-p>0.05; uncommon superscript of mean values within same column
differed significantly; SEM-standard error of means; #described in Table 1.
The yields in intercropped treatments were moderate ranging from 91.05 to 103.92 tones ha-1
for
green herbage and 13.56 to 16.73 tones ha-1
for dry matter yields. CP yields were significantly higher
in intercrop than sole crop (Table 1). The nutrient compositions of fodder maize and alfalfa for
different treatment combinations (Table 2). N-uptake differed significantly among treatments. Lowest
N-uptake was observed in fodder maize monoculture (10.29 kg ha-1
), highest in alfalfa monoculture
(38.42 kg ha-1
) and intermediate (ranging from 20.80 to 33.69 kg ha-1
) in intercrop treatments. To
assess the profitability of intercrop, competition index (CI) was estimated and found to be less than 1
that intercropping is more profitable than monoculture yields.
Finally, it may be concluded that yields of maize fodder intercropped with alfalfa was better than
mono culture for both fodders in terms of CP yields. Further, intercropping of alfalfa enhanced the
nutrient quality of fodder maize.

Proceedings of the Annual Research review Workshop 2019, BLRI, Savar, Dhaka 1341, January 26-27, 2020
Technical Session III 33
Strategic development of feeding and management techniques to improve the
performance of egg and meat type chicken and their qualities
MR Hassan1*
, MAG Rabbani1, S Sultana
1, SM Amanullah
2 and NR Sarker
1
1Poultry Production Research Division and
2Biotechnology Division, Bangladesh Livestock Research Institute,
Savar, Dhaka 1341, Bangladesh. *Correspondence at [email protected]
Executive summary
An optimum amino acid concentration in broiler diet is a strategy to maximize the performance and
minimize noxious gas emission in broiler litter. Therefore, the present experiment was undertaken to
investigate the effects of low protein diets with glutamine supplementation on growth performance,
meat quality, gut morphology and noxious gas emission of broiler chicken. A total of 600 day old
Lohman broiler chicks were purchased from Ag Agro Hatchery and body weight were equalized and
distributed into 30 pens (5 replicate pens/treatment; 20 birds/pen) and were provided 2 level of CP
and 3 level of L-Glutamine resulting in a 3×2 factorial arrangement of dietary treatments (Starter T1,
23×0; T2, 23×0.2; T3, 23×0.3; T4, 21×0; T5, 21×0.2 and T6, 21×0.3 % CP and glutamine level)
respectively. During grower (2-3 weeks) and finisher (4-5 weeks) period dietary CP level was reduced
2% in each treatment. Feed intake (FI) was recorded daily. Body weights (BW), weight gain (WG)
and feed conversion ratio (FCR) were measured weekly. At 5th weeks of age, 6 birds per treatment
were sacrificed and samples were collected to analyze met and carcass characteristics. In addition,
intestinal segments (jejunum, Meckel’s diverticulum) were collected and fixed in 4%
paraformaldehyde in 0.1 M phosphate buffer for 48 h, and paraffin sections (5 μm thick) were made
and stained with hematoxylin and eosin. Villus height and crypt depth were measured from 5
vertically oriented crypts and villi structures of each section by using image analysis software. Excreta
(1000 g) were collected in each treatment and allowed to ferment for 1 day at room temperature and
gases were measured using a Geotech (Biogas 5000,UK). All data were arranged by 2-way ANOVA
plus interaction mixed procedure of SAS and differences were determined by DMRT.
In the present results, there was significant dietary interaction between CP and glutamine on BW, WG
and FCR of broiler chicken (Table 1). With decreasing dietary CP levels and increasing glutamine
(reduce 2 % dietary CP and 0.30% glutamine in T6 treatment) highest BW, WG and lowest FCR were
found in T6 group compared to T4 treatment which contains low CP without supplementation of
glutamine in the diet. While feed intake was not significantly affected by the dietary treatment, it was
numerically increased by the T4 treatment.
Table 1. Effect of dietary protein and glutamine on the performance of broiler chicks
Parameters Treatments
SEM P value
CP x Glu T1 T2 T3 T4 T5 T6
BW (g) 1795.94b 1817.72a
b 1800.47
ab 1704.58
c 1763.68
b 1858.50
a 9.084 0.002
WG (g) 1752.43b 1774.22a
b 1756.96
ab 1661.08
c 1720.18
b 1815.00
a 8.987 0.006
FI (g) 3150.56 3128.33 3016.76 3173.83 3171.78 3154.92 15.69 0.234
FCR 1.795ab
1.764ab
1.717b 1.911
a 1.843
ab 1.738
b 0.142 0.031
Treatment, interaction of dietary protein and glutamine T1, (23x0); T2, (23x0.20); T3 (23x0.30); T4 (21x0); T5
(21x0.20); T6 (21x0.30); 2% CP was reduced in grower & finisher phase in each treatment group
In meat quality, the present results showed that muscular pH, color and cooking loss % were
significantly improved in T6 treatment as compared to other dietary treatments. However, variation of
CP and glutamine did not influence the carcass characteristics of broiler chicks. On the other hand, T6
treatment was showed higher (P<0.05) villus height and villus height:crypt depth ratio in compare to
T4 group (Table 2). However no significant differences were found among the T1, T2, T3 and T5
treatments.

Proceedings of the Annual Research review Workshop 2019, BLRI, Savar, Dhaka 1341, January 26-27, 2020
Technical Session III 34
Table 2. Effect of different level of protein and glutamine on gut morphology of broiler chicks
Parameters Treatments
SEM P value
CP x Glu T1 T2 T3 T4 T5 T6
Villus height (µm) 67.21a 65.43
ab 68.56
a 61.92
b 63.48
ab 69.23
a 4.09 0.036
Crypt depth (µm) 17.36 15.90 15.33 16.43 15.96 14.58 2.11 0.513
Villus height-to-crypt
depth ratio 3.872
b 4.151
a 4.472
a 3.76
b 3.98
ab 4.746
a 0.29 0.043
In addition, significantly higher level of NH3 and H2S gases were produced in T1 treatment as
compared to other dietary treatments (Table 2). However, there were no dietary protein and glutamine
interactions regarding CO2 and O2 gases production of broiler litter. Therefore, starter (21x 0.30 %),
grower (19 x 0.30 %) and finisher (17 x 0.30 %) level of dietary protein and glutamine may enhanced
growth performance, gut morphology and meat quality characteristics of broiler chicken.

Proceedings of the Annual Research review Workshop 2019, BLRI, Savar, Dhaka 1341, January 26-27, 2020
Technical Session III 35
Evaluation of the weaning stress and estimation of weaning age of Black Bengal kids at
different weaning condition
S Ahmed, MA Hemayet, MH Rahman and MA Jalil
Goat and Sheep Production Research Division, Bangladesh Livestock Research Institute, Savar, Dhaka 1341,
Bangladesh
Executive summary
The objective of the present study was to evaluate the weaning stress and estimation of appropriate
weaning age of Black Bengal kids. A total of twenty four (24) lactating does (2 to 4 parity and
average live weight of 19 ±2.80 kg) with kids were selected and divided into four treatment groups
having six (6) doe in each treatment group. Kids of different treatment groups were weaned at
different ages after kidding i.e. 45, 60, 75 and 90 days and denoted as ‘A’, ‘B’, ‘C’ and ‘D’,
respectively. The group ‘D’ was considered as control group. The BPM (no. of heart beat/minutes) of
the kids were measured 03 days before (-3), days at weaned (0) and 03 days after (+3) of respective
weaning schedule of different treatment groups. Similarly -3 and +3 days, blood samples were also
collected from the kids to analysed T3 (triiodothyronine), T4 (thyroxine) and cortisol hormones.
Besides these, kid’s birth weight, weight changes and weaning weight were also recorded. Data were
analysed the GLM procedure of SPSS with 4x3 and 4 x2 factorial design and Duncan’s test was used
to test the differences between means.
Table 1. Changes of blood hormone levels in different treatment groups at different sampling date
(mean±SE)
Treatment Sampling day T3, ng/ml T4, ug/dl Cortisol, ug/dl
A -3 26.63±4.54 23.80±2.29 0.28±0.43
+3 31.33±4.54 27.90±2.29 0.31±0.43
B -3 37.34±4.98 28.76±2.50 0.67±0.47
+3 26.20±4.98 23.80±2.29 0.66±0.43
C -3 35.80±4.54 26.78±2.29 0.82±0.43
+3 23.82±4.54 27.80±2.29 1.63±0.43
D -3 34.75±4.54 27.33±2.29 0.58±0.43
+3 21.75±4.54 24.55±2.29 2.26±0.43
Treatment
(T)
A 28.98±3.21 25.85±1.62 0.29a±0.31
B 31.26±3.37 26.05±1.70 0.67ab±0.32
C 29.81±3.21 27.29±1.62 1.22b±0.31
D 28.25±3.21 25.94±1.62 1.42b±0.31
Day
(d)
-3 33.47±2.33 26.58±1.17 0.79±0.22
+3 25.78±2.27 26.01±1.14 1.21±0.22
Sig. level T NS NS *
d * NS *
T x d NS NS *
T3 (triiodothyronine), T4 (thyroxine), different superscript in same column differ significantly, *p<0.05.
In the growth performance data of kids, only weaning weight were significantly (p<0.05) differ
among treatment groups as the weaning age were different. The T3, T4 and cortisol hormones were
monitored to assess the stress level of kids at different weaning age (Table 1). The serum
concentration of T3 and T4 hormones decrease significantly (p<0.05) at +3 days after weaning
compare to -3 days before weaning except A group of kids. During the stressful condition the thyroid
hormone secretion is suppressed. The results suggest that the kids under B, C and D groups were felt
more stress due to weaning compare to group A. On the other hand, cortisol concentration increased
(p<0.05) about 2 and 4 fold at +3 sampling date for C and D groups, respectively and their interaction
also significant (p<0.05). Normally, in stressful condition cortisol concentration increases. Hence,
results suggest that kids in C and D groups were more stressful condition due to weaning compare to

Proceedings of the Annual Research review Workshop 2019, BLRI, Savar, Dhaka 1341, January 26-27, 2020
Technical Session III 36
kids under A and B groups. The BPM value of kids increased significantly (p<0.05) due to weaning
stress (Table-2). In group A and B, both BPM_max and BPM_av was highest in 0 (zero) sampling
day and then decline (+3). But for group C and D, increment (p<0.01) started at 0 (zero) sampling day
and highest value observed at +3 day. Results suggest that the kids of C and D groups were in more
stressful condition due to separation from their mother.
Table 2. The BPM of different weaning group of kids at different sampling date (mean±SE)
Treatment BPM_max BPM_av
Sampling Day Sampling Day
-3 0 +3 -3 0 +3
A
B
C
D
155.43±7.60 172.00±7.60 156.19±7.60 130.29±6.26 139.86±6.26 138.90±6.26
153.10±7.11 166.10±7.60 160.08±7.60 134.48±5.86 152.10±6.26 142.13±6.26
113.26±6.70 130.37±6.70 145.67±6.70 96.67±5.52 121.11±5.52 131.41±5.52
80.80±6.36 91.06±5.89 133.92±6.98 74.70±5.24 80.46±4.86 115.36±5.74
BPM_max BPM_av
T
A 161.21a±4.39 136.35
a±3.62
B 159.77a±4.30 142.86
a±3.54
C 129.77b±3.87 116.40
b±3.19
D 99.54c±3.71 88.23
c±3.10
d
-3 123.41a±3.48 107.82
a±2.87
0 130.13a±3.49 113.91
a±2.88
+3 149.46a±3.62 133.44
b±2.99
Sig
.
T ** **
d ** **
Tx
d ** **
BPM_max= height no. of heart beat/minute, BPM_Av= average no. of heart beat/minute, different superscript in
same column differ significantly, * *p<0.01, T=treatment, d=sampling day
Thus, weaning of Black Bengal Goat kids before 75 days of age was more stressful that may affect
post weaning growth and production. Finally, it can be concluded that weaning age should not be less
than 75 days for Black Bengal Kids.
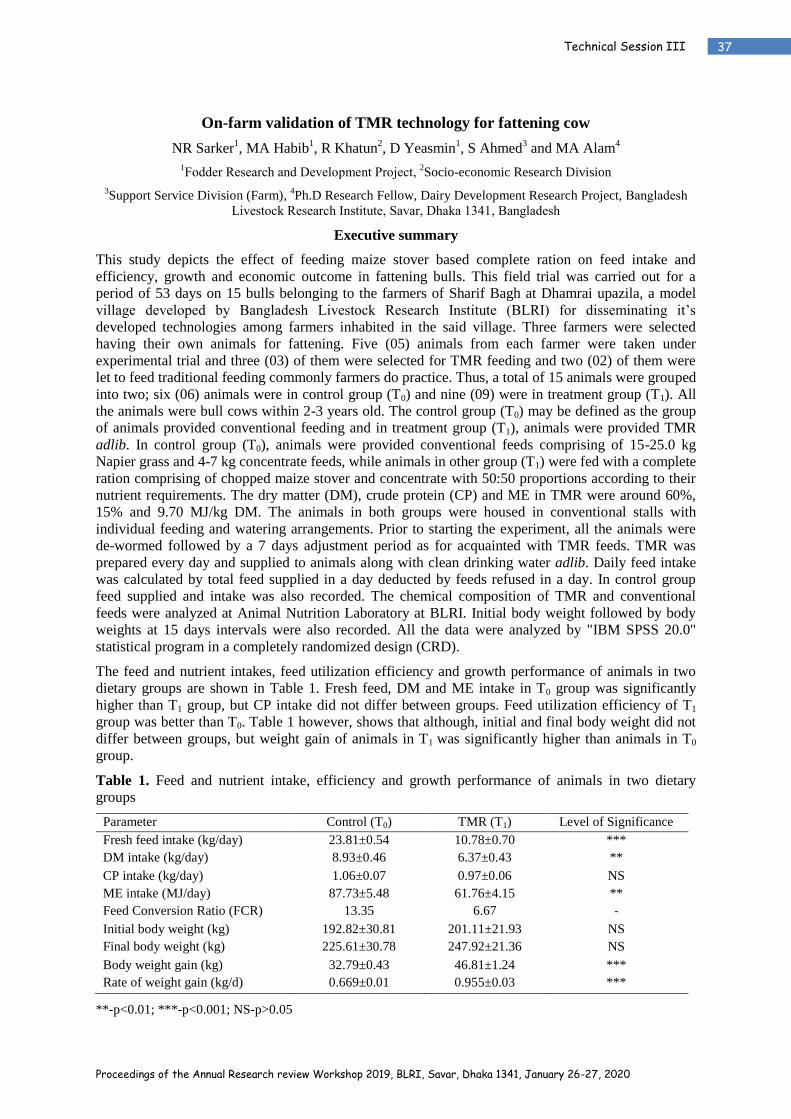
Proceedings of the Annual Research review Workshop 2019, BLRI, Savar, Dhaka 1341, January 26-27, 2020
Technical Session III 37
On-farm validation of TMR technology for fattening cow
NR Sarker1, MA Habib
1, R Khatun
2, D Yeasmin
1, S Ahmed
3 and MA Alam
4
1Fodder Research and Development Project,
2Socio-economic Research Division
3Support Service Division (Farm),
4Ph.D Research Fellow, Dairy Development Research Project, Bangladesh
Livestock Research Institute, Savar, Dhaka 1341, Bangladesh
Executive summary
This study depicts the effect of feeding maize stover based complete ration on feed intake and
efficiency, growth and economic outcome in fattening bulls. This field trial was carried out for a
period of 53 days on 15 bulls belonging to the farmers of Sharif Bagh at Dhamrai upazila, a model
village developed by Bangladesh Livestock Research Institute (BLRI) for disseminating it’s
developed technologies among farmers inhabited in the said village. Three farmers were selected
having their own animals for fattening. Five (05) animals from each farmer were taken under
experimental trial and three (03) of them were selected for TMR feeding and two (02) of them were
let to feed traditional feeding commonly farmers do practice. Thus, a total of 15 animals were grouped
into two; six (06) animals were in control group (T0) and nine (09) were in treatment group (T1). All
the animals were bull cows within 2-3 years old. The control group (T0) may be defined as the group
of animals provided conventional feeding and in treatment group (T1), animals were provided TMR
adlib. In control group (T0), animals were provided conventional feeds comprising of 15-25.0 kg
Napier grass and 4-7 kg concentrate feeds, while animals in other group (T1) were fed with a complete
ration comprising of chopped maize stover and concentrate with 50:50 proportions according to their
nutrient requirements. The dry matter (DM), crude protein (CP) and ME in TMR were around 60%,
15% and 9.70 MJ/kg DM. The animals in both groups were housed in conventional stalls with
individual feeding and watering arrangements. Prior to starting the experiment, all the animals were
de-wormed followed by a 7 days adjustment period as for acquainted with TMR feeds. TMR was
prepared every day and supplied to animals along with clean drinking water adlib. Daily feed intake
was calculated by total feed supplied in a day deducted by feeds refused in a day. In control group
feed supplied and intake was also recorded. The chemical composition of TMR and conventional
feeds were analyzed at Animal Nutrition Laboratory at BLRI. Initial body weight followed by body
weights at 15 days intervals were also recorded. All the data were analyzed by "IBM SPSS 20.0"
statistical program in a completely randomized design (CRD).
The feed and nutrient intakes, feed utilization efficiency and growth performance of animals in two
dietary groups are shown in Table 1. Fresh feed, DM and ME intake in T0 group was significantly
higher than T1 group, but CP intake did not differ between groups. Feed utilization efficiency of T1
group was better than T0. Table 1 however, shows that although, initial and final body weight did not
differ between groups, but weight gain of animals in T1 was significantly higher than animals in T0
group.
Table 1. Feed and nutrient intake, efficiency and growth performance of animals in two dietary
groups
Parameter Control (T0) TMR (T1) Level of Significance
Fresh feed intake (kg/day) 23.81±0.54 10.78±0.70 ***
DM intake (kg/day) 8.93±0.46 6.37±0.43 **
CP intake (kg/day) 1.06±0.07 0.97±0.06 NS
ME intake (MJ/day) 87.73±5.48 61.76±4.15 **
Feed Conversion Ratio (FCR) 13.35 6.67 -
Initial body weight (kg) 192.82±30.81 201.11±21.93 NS
Final body weight (kg) 225.61±30.78 247.92±21.36 NS
Body weight gain (kg) 32.79±0.43 46.81±1.24 ***
Rate of weight gain (kg/d) 0.669±0.01 0.955±0.03 ***
**-p<0.01; ***-p<0.001; NS-p>0.05

Proceedings of the Annual Research review Workshop 2019, BLRI, Savar, Dhaka 1341, January 26-27, 2020
Technical Session III 38
At the end of the whole experiment, economic analysis was conducted based on variable cost and
income from animals sold of two treatment groups. In this experiment maximum profit from fattening
bulls was obtained in T1 group (Table 2).
Table 2. Economic analysis for two dietary groups
Parameter Control (T0) TMR (T1)
Cost (BDT) of animal purchased for fattening 50205.00 50278.00
Total feed cost (BDT) during experiment 9460.00 12616.00
Labor cost (considering 1 labor for managing 25 animals) 880.00 880.00
Other cost (electricity, equipment, medication, miscellaneous) 100.00 100.00
Total cost (BDT) 60645.00 63874.00
Return from animals sold (BDT/animal) 74400.00 79444.00
Net return (BDT/animal) 13755.00 15570.00
Benefit-cost ratio (BCR) 1.23 1.24
Based on the results, it may be concluded that feeding of maize stover based complete ration (TMR)
improved body weight and feed utilization efficiency, with concurrent higher profit margin from
fattening bulls.

Proceedings of the Annual Research review Workshop 2019, BLRI, Savar, Dhaka 1341, January 26-27, 2020
Technical Session III 39
Conservation, multiplication and adaptation of high yielding fodder (HYF) variety at
BLRI regional station
MY Ali1, M Ershaduzzaman
1, R Khatun
1, US Alam
1, M Shahjahan
2 and NR Sarker
3
1System Research Division,
2Dairy Development and Research Project and
3Poultry Production Research
Division, Bangladesh Livestock Research Institute, Savar, Dhaka 1341, Bangladesh
Executive summary
The experiments were conducted at Bangladesh Livestock Research Institute, Regional Station,
Baghabari, Shahjadpur; Sirajgonj and on-farm at farmer’s community at the village of Tiar Bond
during the financial year 2018-19. These experiments were implemented to fulfill the following
objectives to conserve and multiply of high yielding fodder crops for the distribution of cuttings/seeds
among the farmers, determine the biomass yield & nutritive value of different high yielding fodder,
adapt HYF at farmers level, evaluate the variation of nutrient content according to season and cutting
interval with their botanical fraction, calculate economic analysis of fodder production and maintain
an ideal fodder germplasm bank at the regional station. The experimental design was split-plot in
(CRD) with three replications.
For this study we selected 6 farmers from 3 villages of Shahjadpur Upzila for on farm fodder
cultivation and each plot were 20 decimal. At the same time we also maintained the same amount of
land at BLRI regional station for trial of Napier and Sugar beet. The land was prepared in both on
farm and on station according to the guideline of BLRI developed fodder cultivation
techniques/guidelines. Sugar beet (Beta Vulgaris) as another HYF fodder variety was collected
adapted and evaluated the production potentiality at BLRI regional station. All collected data were
statistically analyzed by the SPSS 17.0 computer software program. Results revealed that,
comparatively highest fresh biomass yield of Napier fodder (57.66±4.68) t/ha was observed in on-
station than farmers community level but they were not significantly (P>0.05) differed. In case of leaf
length of Napier fodder (3.59±0.04) ft. and plant height (6.36±0.20) ft. were significantly (P<0.05)
differed and maximum values were observed in on-station than farmers community level 3.37±0.02 ft.
and 6.00±0.03ft respectively. Tiller number (no/hill) and stem perimeter (cm) of Napier fodder highly
significant (P<0.001) differences were observed and maximum values (30.72±4.27 and 6.68±0.06)
obtained in on-station compared to farmer’s community (18.21±0.65 and 6.14±0.02) level
respectively. Leaf and Hillar number were did not differed significantly (P>0.05) though the
parameter of on-station comparatively higher than farmers community level respectively. The
production performance of sugar beet (Beta Vulgaris) the weight of fresh root with leaf (g/plant),
fresh root weight without leaf (g/plant), Leaf weight (g/plant), Existing plant no(thousand/ha) and
Survivability percentage (%) were not significantly (P>0.05) differed among the plots (treatments) at
on-station. Maximum fresh root weight with leaf (g/plant) was observed in treatment 1 compared to
others treatments.
Table 1. Production performance of high yielding fodder variety (Napier) at 40 days of cutting (Mean±SE)
Parameter On-station Farmers
community
P value Level of
significance
Biomass(t/ha) 57.66±4.68 54.89±1.20 0.568 NS
Leaf length(ft.) 3.59±0.04 3.37±0.02 0.010 *
Leaf number (Leaf No/Plant) 16.24±0.79 17.13±0.18 0.231 NS
Plant height(ft.) 6.36±0.20 6.00±0.03 0.011 *
Tiller number (No/Hill) 30.72±4.27 18.21±0.65 0.000 **
Hillar number (thousand/ha) 58.66±5.15 55.20±1.06 0.425 NS
Stem perimeter (cm) 6.68±0.06 6.14±0.02 0.000 **
NS= Non significant (P>0.05), * stands for significant differed and ** stands for highly significant

Proceedings of the Annual Research review Workshop 2019, BLRI, Savar, Dhaka 1341, January 26-27, 2020
Technical Session III 40
Table2. Production performance of Beeta vulgaris (Sugar beet)
Parameter Plot(Mean±SE) P
Value
Level of
significance 1 2 3 4 5
Fresh root weight
with leaf(g/plant)
478.0±70.
6a
248.4±70
.6ab
224.4±70.6b
c
266.0±70.6b
229.2±70.6c
0.70 NS
Fresh root weight
without leaf
(g/plant)
393.6±57.
7a
210.4±57
.7ab
178.8±57.7b
c
219.2±57.7b
189.6±57.7c
0.65 NS
Leaf weight
(g/plant)
84.4±19.6a
38.0±19.
6c
45.6±19.6ab
46.8±19.6b 39.6±19.6
bc 0.14 NS
Existing plant
no(thousand/ha)
54.0±0.97a
44.0±0.9a
b
42.0±0.9bc
50.0±0.9b 40.0±0.9
c 0.12 NS
Survivability% 51.8±4.4b 43.8±4.4
c 47.9±4.4
ab 54.0±4.4
a 44.9±4.4
bc 0.15 NS
NS= Non significant (P>0.05)

Proceedings of the Annual Research review Workshop 2019, BLRI, Savar, Dhaka 1341, January 26-27, 2020
Technical Session III 41
Development of feeding system for growing buffalo in coastal area of Bangladesh
BK Roy, N Huda, N Sultana, S Ahmed and MK Rahman1
Bangladesh Livestock Research Institute, Savar, Dhaka 1341 and 1AD, GJUS, Bhola, Bangladesh
Executive summary
Buffaloes, are being distributed @ 3.77±2.63 heads per Km2
(Huque & Khan, 2017), mostly
concentrated in the north-western and south deltas. The production potentials of conventional pastoral
buffaloes of the south delta is yet to be unearthed through good practice interventions and the capacity
enhancement of farmers and entrepreneurs. The salinity rich pastures and the seasonal loss of green
vegetation especially, during hot & dry period in maritime belts along with conventional herd
management often affect the production and productivity of buffaloes and the socioeconomic
contributions to farmers and the paid labors get their livelihood support out of the age-old pastoral
buffalo raising system in the south. Scarcity of feeds and absent of specific feeding system are the
two major problems faced by the buffalo farmers in the country. Thus, an investigation was made
with the objectives: i) to increase production and productivity of buffalo through improving the
existing feed resources in the southern deltas of Bangladesh & ii) to develop a sustainable and cost
effective roughage based feeding system for buffalo fattening under on-station and on-farm
conditions. To achieve the above objectives, BLRI head quarter and coastal region like Bhola Sadar
Upazila were selected as the on-station and on-farm experimental site, respectively for this study.
Under on-station condition, fifteen (15) local growing buffalo bulls were put on feeding trial in three
different diets such as UMS based diet, Silage based diet and Fermented Corn Mixture (FCM) based
diet as denoted by T1, T2 and T3, respectively and each dietary group having 5 animals. The bulls used
in each group were of almost the same weight and their age ranged between 2 and 3 years. In case of
T1 and T2 dietary treatment groups, the total DM intake during the feeding trial of animals were
fulfilled approx. 40 percent from concentrate mixture and the rest 60 % were provided from roughage
sources (adlib) on DM basis. However, animals under T3 treatment were provided FCM and protein
supplement/protein mixture at a rate of 1.25% and 0.25%, respectively in addition to supply adlib
roughages on their live weight. In on-farm condition, a total of 12 local buffalo bulls of age ranges
from 2-3 years were fed only UMS based diet. The animals both on-station and on-farm conditions
were housed individually in separate pens and offered daily ration in two equal meals at 9:00 and
16:00 h. At the onset of feeding trial, animals both under on-station and on-farm condition were
dewormed properly with anthelmentics (Levamesol BP 600 mg per bolus). The feeding trial was
continued for a period of 90 days including 7 days conventional digestion trial was conducted only for
animals reared under the on-station condition. The animals were weighed at an interval of 10 days,
and their feed intake, digestibility of nutrients, FCR, growth performance and cost-net profit
calculation were analyzed statistically in an ANOVA of a completely randomized design (CRD) using
the compare means with SPSS, 20 computer software packages.
Table 1. Chemical composition of diets used in on-station & on-farm experiment their cost
Items DM, %
fresh
Chemical composition (% DM) GE
(MJ/kg,
DM)
Cost (Kg,
DM; BDT) OM CP ADF NDF
On-station
Napier silage 18.46 93.00 7.98 59.06 86.92 16.00 6.50
Fermented Corn mix. 61.79 91.51 15.91 15.18 49.54 24.13 14.71
Protein mix. 89.18 83.34 22.92 10.65 30.18 24.26 33.42
UMS 57.80 85.50 9.47 42.82 67.24 20.63 11.60
Concentrate mix. 87.73 92.25 18.21 14.53 31.34 16.48 36.00
On-farm
UMS 56.23 82.40 9.11 45.15 67.69 - 9.80
Concentrate mix 87.95 92.13 17.53 13.40 35.00 - 36.00
The chemical composition of diets used in on-station and on-farm experiment and their cost of
production are presented in Table 1. In on-station trial, the production cost per Kg DM silage, FCM,

Proceedings of the Annual Research review Workshop 2019, BLRI, Savar, Dhaka 1341, January 26-27, 2020
Technical Session III 42
protein mixture, UMS and concentrate mixture were TK. 6.50, 14.71, 33.42, 11.60 and Tk. 36.00,
respectively. Similarly, the production cost of UMS and concentrate mixture in on-farm trial were Tk.
9.80 and Tk. 36.00, respectively (Table 1). The total per head daily DM, OM, ADF and NDF intake of
buffalo bulls did not vary significantly (p>0.05) among the three different dietary treatment groups.
However, the DM intake of bulls based on percent live weight was significantly (p<0.001) higher in
UMS based dietary groups (2.65% LW) than that of Napier silage (2.34% LW) and FCM (2.00% LW)
based dietary groups. Similarly, per day CP intake of bulls fed UMS based diet (1.03 Kg/d) was
significantly higher (p<0.05) followed by bulls those fed Napier silage (0.89 Kg/d) and FCM based
diet (0.75 Kg/d). The DM, OM and CP digestibility did not vary significantly (p>0.05) among the
three dietary treatment groups. However, the ADF (p<0.001) and NDF (p<0.05) digestibility appear
to be greatest for FCM based diet (65.97 & 70.35%, respectively, intermediate for Napier silage based
diet (58.73 & 64.78%, respectively) and the lowest for UMS based diet (54.44 & 60.97%,
respectively). Similarly, bulls fed UMS based diet had the highest (p<0.05) intake of digestible DM
and digestible CP followed by DDM and DCP intake of Napier silage and FCM based diets.
However, the intake of DOM did not vary significantly (p>0.05) among the dietary treatment groups.
Feeding Napier silage based diet had higher (p>0.05) average daily gain of 1.00 Kg compared to 0.97
Kg of UMS or 0.84 Kg of FCM based diet with an average feed conversion efficiency of 7.10, 8.35
and 7.24, respectively (p<0.05; Table 2) indicating that the FCR of bulls fed Napier silage and FCM
based diet found better (<0.05) than bulls those fed UMS based diets. The results on validation of
UMS based feeding system under on-farm condition and its comparison with the results obtained
from on-station trial revealed that except OM and CP intake, the daily DM, ADF and NDF intake of
bulls did not vary significantly (p>0.05) in between groups. However, daily OM and CP intake was
significantly (p<0.05) higher in bulls those fed UMS based diet under on-station condition (7.11 Kg/d
&1.03 Kg/d, respectively) than bulls fed UMS diet in on-farm condition (6.16 Kg/d & 0.88 Kg/d,
respectively).
Table 2. Intake, nutrient digestibility, growth, feed conversion efficiency & cost-benefit of buffalo
bulls fed different diets under on-station conditions
Parameters Experimental diets SED Sig.
T1 (UMS) T2 (Silage) T3 (FCM)
DMI (Kg/d) 8.07 7.12 6.15 0.50 NS
DMI (Kg; % LW) 2.65a 2.34
b 2.00
c 0.03 ***
OMI (Kg/d) 7.11 6.60 5.62 0.42 NS
CPI (Kg/d) 1.03a 0.89
ac 0.75
bc 0.06 *
DM dig. 64.07 64.19 65.08 0.61 NS
OM dig. 67.72 66.49 66.96 0.59 NS
CP dig. 66.62 66.87 67.79 0.64 NS
ADF dig. 54.44b 58.73
b 65.97
a 1.29 ***
NDF dig. 60.97b 64.78
bc 70.35
ac 1.54 *
Initial LW(Kg) 259.2 256.6 257.8 20.8 NS
Final LW (Kg) 346.8 346.8 333.2 24.4 NS
ADG (Kg) 0.97 1.00 0.84 0.05 NS
FCR 8.35a 7.10
bc 7.24
ac 0.32 *
Total cost/Kg gain 216.4a 176.5
b 126.3
c 6.20 ***
Net profit 11265b 15175
a 15877
a 1215 *
The ADG and FCR of bulls fed UMS based diet however did not differ significantly (p>0.05)
between on-station and on-farm conditions. The total cost including feed, refusal and management
cost and net benefit analysis of buffalo fattening under on-station feeding condition revealed that the
total cost involved per Kg gain was significantly (p<0.001) higher in bulls fed UMS based diet (Tk.
216.00) followed by bulls fed Napier silage (Tk. 176.00) and FCM based diets (Tk. 126.00).
Considering the total cost involved for 90 days fattening of a bull, the net profit on the other hand
were significantly (p<0.05) higher in bulls fed both FCM and Napier silage based diet than bulls those
fed with UMS based diet. Though, the profit margin was less but still feeding UMS to buffalo bulls
showed an efficient and cost effective diets (Table 2). The total cost per Kg gain and net profit of a

Proceedings of the Annual Research review Workshop 2019, BLRI, Savar, Dhaka 1341, January 26-27, 2020
Technical Session III 43
bull fattening with feeding of UMS based diet however, did not vary significantly (p>0.05) when
comparing both on-station and on-farm conditions.
Therefore, it may be concluded that, considering the results of FCR and cost-benefit analysis, the
bulls fed both FCM and silage based diet performed better than that of UMS based diet under on-
station condition. Though, the FCR and profit margin was relatively less but still feeding UMS to
buffalo bulls showed an efficient and cost effective dietary system both on-station and on farm
conditions. Based on the availability of feed resource, farmers in different locality including coastal
regions my use either FCM, silage or UMS based feeding system for sustainable and profitable
buffalo fattening enterprise.
Proceedings of the Annual Research review Workshop 2019, BLRI, Savar, Dhaka 1341, January 26-27, 2020
Technical Session III 44
Determination of best practice management for Napier Grass: Defoliation height and
severity to optimize nutritive value and regrowth
BK Roy, NR Sarker, 1MR Islam,
1APC Clark,
2A Roy and N Sultana
Bangladesh Livestock Research Institute, Savar, Dhaka 1341, Bangladesh, 1The University of Sydney, Australia
and 2Department of Livestock Services, Farmgate, Dhaka, Bangladesh
Executive summary
Development and growth of livestock are conditioned by the availability of fodder both qualitatively
and quantitatively from arable land (Bhende et al., 2004). Roughage feed plays an important role in
the development of diets for dairy or beef cattle, as it directly or indirectly determines the diet cost
and influence animal performance. Napier (Pennisatum purpureum) is a perennial grass widely used
for ruminants particularly for dairy production in Bangladesh. Generally, this grass is used to feed the
livestock as cut and carry system when it reaches~200-300 cm height and harvested at a severity of 5-
6 cm above ground mainly to achieve greater biomass. However, protein and energy content of Napier
grass harvested at this stage/height is low. Little or no information is available on the impact of
Napier grass harvest/cut height and severity on yield and nutritive value to guide management
decisions for small-holder farmers. Therefore, the present study was undertaken to determine best
practice of cut and carry management principles for Napier grass to optimize the performance of
small-holder dairy production system in Bangladesh.
The materials used were two cultivars of Napier grass viz BLRI Napier hybrid (BLRI Napier-3) and
Napier Pakchong grass under this study. The experiment incorporated 3 defoliation heights of 50, 100
and 200 cm, and 3 cutting/severity heights of 5, 10 and 20 cm. from ground level. The design was a
3×3 factorial arrangement in a randomized complete block with 3 replications-giving a total of 54 plot
each 4×4 m2. Before planting, soil samples were taken from depths of 0-30 cm as composites of 3
samples from three random locations. Limestone was applied at 1976 kg/ha based on the soil analysis,
before planting 14 days. The basal fertilizer viz. Urea, TSP, MoP and Zipsam were given at a rate of
292 kg/ha, 214 kg/ha, 56 kg/ha and 90 kg/ha, respectively to all plots. Planting both Napier hybrid and
Napier Pakchong grass by stem cutting with 2 nodes of a piece and placed 45o with 2 pieces a hole
with plant spacing of 70 x 100 cm for Napier hybrid (No. of hills-30) and 50 x 50 cm for Napier
Pakchong (No. of hills-64) in 4 x 4 m plot size. Each plot was applied urea fertilizer at a rate of 312
kg/ha at fortnightly basis during the whole experimental period. According to necessity, all plots were
watered by hosepipe to ensure adequate soil moisture for plant growth. Morphological characteristic
measurements like normal and raised plant height, dead and green leaf number, number tillers, node
number, leaf- stem ratio etc. and biomass yield were recorded during harvesting time.
Defoliation height had a significant effect on the percentage content of dry matter and organic matter
in both Napier hybrid (p<0.001) and Napier Pakchong (p<0.001) grass, with DM percent and OM
percent increasing as the defoliation height increased from 50 to 200 cm. By comparison, crude
protein showed a decrease as the defoliation height increased for both the Napier hybrid (Table 1) and
Napier Pakchong (Table 2). The effect of severity/cutting height on the percentage content of DM,
OM and CP in Napier hybrid did not vary significantly (p>0.05). For Napier Pakchong grass,
severity/cutting height had a significant effect on DM and OM content, with DM and OM content
increasing as the severity/cutting height increased. However, the cutting height had no effect on CP
content in Napier Pakchung grass (Table 2). Dry matter & crude protein yield is an important
indicator of forage production. Both the defoliation height and cutting height had a significant effect
on fresh biomass and dry mater yield per cut of Napier hybrid and Napier Pakchong grass. As the
defoliation height increasing, the fresh biomass and dry matter yield per cut for both Napier hybrid
(p<0.001) and Napier Pakchong (p<0.001) were increased linearly and significantly. Similarly, the
cutting height had also a significant effect on dry matter and crude protein yield per cut of both Napier
hybrid and Napier Pakchong. The crude protein yield per cut were higher at 10 cm cutting height
when cut both the Napier hybrid (p>0.05) and Napier Pakchong (p<0.001) from ground level (table 1
& 2). Both defoliation and severity height had a significant effect on harvesting interval. The average
days between harvesting or harvesting interval increasing as the defoliation height increased from 50-

Proceedings of the Annual Research review Workshop 2019, BLRI, Savar, Dhaka 1341, January 26-27, 2020
Technical Session III 45
200 cm for both the cultivars. The harvesting interval however, was decreasing as the increased of
severity height for both Napier hybrid and Pakchong grass. The average number of green leaf
increasing as the increased of defoliation height of both the Napier cultivars. The regrown tiller
number for both Napier hybrid and Napier Pakchong grass was higher in the plants cuts from 50-100
cm defoliation height than in those cut at a 200 cm defoliation height.
Table 1. Chemical composition, biomass yield and morphological characteristics of BLRI Napier
hybrid (BLRI Napier-3) grass cutting at different defoliation heights and different severity heights.
Parameters Defoliation height (cm) Severity height (cm) SED Sig. level
50 100 200 5 10 20 P S PxS
Chemical composition (%)
DM content 13.25b
15.96a
16.00a
14.97 14.87 15.37 0.25 *** NS NS
OM content 88.54c
89.95b
91.29a
90.10 89.74 89.93 0.26 *** NS NS
CP content 19.22a
15.48b
11.44c
15.19 15.24 15.70 0.29 *** NS NS
Biomass yield (t/ha/cut)
Fresh yield 16.34c
28.37b
66.86a
38.47bc
38.59ac
34.50b
1.00 *** * NS
DM yield 2.08c
4.36b
10.70a
5.92a
5.83ac
5.38bc
0.12 *** * NS
CP yield 0.39c
0.65b
1.22a
0.76 0.77 0.72 0.02 *** NS NS
Ave. days between
harvest
21.75c
38.42b
72.00a
44.94a
44.56b
42.67c
0.40 *** * NS
Morphological characters
No. of green leaf per
plant
5.48c
8.30b
10.72a 8.36 8.03 8.11 0.09 *** NS NS
No. of dead leaf per plant 0.00c
2.04b
3.31a
1.77 1.78 1.81 0.07 *** NS NS
No. of tillers per hill 85.38a
80.50a
68.93b
72.44 82.58 79.79 2.43 ** NS NS
Table 2. Chemical composition, biomass yield and morphological characteristics of Napier Pakchong
grass cutting at different defoliation heights and different severity heights
Parameters Defoliation height (cm) Severity height (cm) SED Sig. level
50 100 200 5 10 20 P S PxS
Chemical composition (%)
DM content 11.84c
12.45b
13.70a
11.77bc
12.89ac
13.31a
0.17 *** *** NS
OM content 83.67c
88.34b
92.29a
87.33b
88.13bc
88.85ac
0.34 *** * NS
CP content 20.58a
20.40a
12.61b
18.42 17.78 17.39 0.28 *** NS *
Biomass yield (t/ha/cut)
Fresh yield 3.36c
10.41b
44.18a
20.72a
20.66a
16.57b
0.45 *** *** ***
DM yield 0.39c
1.29b
6.04a
2.61a
2.81a
2.30b
0.07 *** ** *
CP yield 0.08c
0.26b
0.79a
0.38a
0.44a
0.30b
0.01 *** *** ***
Ave. days between
harvest
14.27c
26.78b
54.50a
34.43b
32.17b
28.85a
0.68 *** *** NS
Morphological characters
No. of green leaf per
plant
6.00c
9.03b
13.14a
9.69 9.27 9.25 0.29 *** NS NS
No. of dead leaf per plant 0.00c
1.70b
3.01a
1.98a
1.54b
1.20c
0.07 *** *** ***
No. of Node per plant 0.00c
0.76b
10.43a
3.99 3.65 3.54 0.14 *** NS NS
No. of tillers per hill 20.00b
24.29a
10.50c
16.75 18.45 19.59 1.01 *** NS NS
The results so far obtained, it may be concluded that the crude protein content in both the Napier
hybrid and Napier Pakchong grass were higher in the plants cuts at a 50 cm defoliation height than in
those cut at 100 or 200 cm defoliation height. The crude protein yield per cut were higher at 10 cm
severity height when cut both the Napier cultivars from ground level. Napier hybrid (BLRI Napier-3),
irrespective of their defoliation and severity height, being yielded more than double DM and CP yield
than Napier Pakchong even though the plant density of Napier hybrid was lower than Napier
Pakchong.

Proceedings of the Annual Research review Workshop 2019, BLRI, Savar, Dhaka 1341, January 26-27, 2020
Technical Session III 46
Study on Production Potentiality and Preservation Technique of Moringa Fodder and
Assessment of it’s Nutritional Quality
N Sultana, S Jobaida and MT Islam1
Animal Production Research Division, 1
Development of Knowledge Hub on Animal Feed Resources for
Efficient feeding Management of Livestock Project, PBRG, NATP, BARC
Executive summary
Moringa is an exclusive animal feed compared to any other fibrous feed, fodders and by-products of
cereal or agro-industrial products which are available in our country. It plays a significant impact on
the production and productivity of dairy, fattened or small ruminant animals and even poultry too. So,
exploring the new approaches of moringa cultivation and its suitable preservation technique could
play a promising role on reducing feed demand and cost besides of enhancing the farm economy in
terms of qualitative and quantitative production. In this regard, BLRI started research work on
exploring the potentiality of Moringa as livestock feed. BLRI developed agronomy of moringa fodder
cultivation which was practiced in Dinajpur, Khustia and Chuadanga to validate the findings as
obtained in BLRI. Based on the results of continuous research and validation program, in the current
fiscal year the expectancy of moringa as livestock feed and its agronomical practice is already been
handed over as technology to Department of Livestock Services (DLS). To expand the hidden
potentiality of Moringa and to make it available to farmers. Some exotic variety (PKM-1, PKM-2 and
Parynal) of Moringa have been imported and cultivated at BLRI farm following previously developed
agronomical practice and an experiment was designed to study the germination rate, yield and its
nutritional value assessment. At the same time, another experiment was designed to develop a simple
and cost-effective fresh biomass preservation technique keeping with its nutritional quality and impact
on dairy production. The study of biomass production of three imported variety was conducted at
BLRI research field designed in CRD consisting of three treatment and four replications of each. For
this purpose, seeds were prepared by soaking and drying method. After germination, seeds were
transferred in seed bed to grow upto 30 days. After 30 days the growing seedlings were transferred in
well prepared plot. The plot size was 6×6 square meter and the plant distance was 1.5×1.5 cm from
each plant to other. Before transferring of the seedling, the plots were prepared by cultivation,
fertilizer application (cow dung and potash) and foradan as aninsecticide. After planting the seedlings
first cutting was given at 120 days at 60 cm height from land.Subsequent cuttings was continued after
first cutting in every40 days interval. Fresh Moringa (Black seed, local variety) was chopped in 1.5 to
2.0 cm length. Fresh chopped moringa was packed in small air tight plastic container. A
total45containers were filled with chopped fresh moringa and another 45 containers were filled with
fresh moringa including 5% straw in small (6 kg capacity) air tight plastic container. Each group had
9 treatments (7, 14, 21, 28, 35, 42, 49, 56 and 63th day) with 5 replications. Filled moringa container
were opened at each 7 days interval upto 63 days. All samples were taken and analyzed at animal
nutrition laboratory of BLRI for proximate component and fiber analysis. Feeding trial was conducted
to study the impact of moringa silage on milk production and its quality of dairy cow, the experiment
was arranged with 10 (ten) lactating RCC cows of which 5 (five) RCC cows were considered as
control group (supplied feed in accordance to common farm practice) and 5 (five) RCC cows were
supplied moringa silage as complete feed. Daily milk production was recorded and milk quality in
terms of milk fat, protein, SNF, fatty acid profile, calcium, phosphorus and cholesterol was analyzed.
Blood glucose, cholesterol and lipid profile were also analyzed. Statistical analyses were performed
using SPSS statistical software program 17.0 (SPSS Inc., Chicago, IL, USA). Fresh biomass and dry
matter yield were significantly higher in Paraynal variety compared to PKM1 and PKM2,
respectively. Nutrient composition interms of dry matter (DM), crude protein (CP), acid detergent
fiber (ADF), neutral detergent fiber (NDF) and ash were nearly similar in all varieties of fresh
moringa (Table-1). DM, CP, ADF, NDF and ash of preserved fresh moringa foliage and added 5.0%
straw in fresh moringa foliage were similar, except ADF and NDF at 7, 14, 21, 28, 35, 42, 49 56 and
63th days. ADF and NDF were reduced after preservation.

Proceedings of the Annual Research review Workshop 2019, BLRI, Savar, Dhaka 1341, January 26-27, 2020
Technical Session III 47
Table 1. Biomass yield and their nutritional composition of different moringa varieties
Moringa silage increased milk yield by about 14.17%. Milk composition (Fat, protein, lactose and
SNF) was not significantly (P>0.05) different between two treatments, while milk fat was a bit higher
(5.52%) in Moringa supplemented RCC cows compared to control (5.06%) which increased about
9.07% in milk. Moringa silage increases polyunsaturated fatty acids (PUFA), linoleic acid (C18:2),
linolenic acid (C18:3), arachidonic acid (C20:0) ecosopantanoic acids (C20:1) and decreased
saturated fatty acid (SFA) and mono unsaturated fatty acids (MUFA) in milk.Milk cholesterol was
found lower (0.092 mg/kg) in moringa supplemented milk compared to control (0.142 mg/kg).
Calcium, phosphorus and lead (40.96, 83.50 and 0.04 vs 38.54, 80.06 and 0.043) were not
significantly (P>0.05) different between treatment and control group. Cadmium (Cd)and Chromium
(Cr) level was found to be below detected level in both groups. Moringa silage had no significant
effect on the concentration of serum cholesterol, HDL, LDL, triglyceride and glucose.The study
shows that parynal variety of moringa produced higher fresh yield of moringa biomass. Therefore,
paraynal variety may be cultivated as livestock feed. Fresh moringa fodder can possibly to be
preserved as silage. Feeding moringa silage to RCC cow was increased milk production and its
quality. Furthermore, research need to be arranged to draw a specific conclusion regarding impact of
preserved moringa fodder on production.
Table 2. Effect of moringa silage (Black Moringa Native) on milk production and quality
(Mean±SEM)
Parameter Paraynal PKM-1 PKM-2 Sign
Fresh biomass yield (ton/ha/cut) 3.13±0.35a
1.91±0.17b
1.83±0.14b
***
Dry matter (DM) yield 0.65±0.07a
0.35±0.03b
0.31±0.02b
***
Dry matter (DM) 18.07±0.46 18.54±0.23 17.66±0.81 NS
Crude protein (CP) 17.11±0.30 17.66±0.32 18.17±0.09 NS
Acid detergent fiber (ADF) 57.13±0.45 56.18±0.73 56.820.43 NS
Neutral detergent fiber (NDF) 64.33±0.58 61.38±0.45 63.96±0.50 NS
Ash 8.02±0.35 7.83±0.14 7.81±0.41 NS
Parameter Treatment Control Sign
Milk production (kg/day) 5.16±0.31 4.76±0.28 NS
Milk composition (%)
Fat 5.52±0.09 5.06±0.11 ***
SNF 9.37±0.20 9.31±0.10 NS
Protein 3.43±0.06 3.41±0.4 NS
Lactose 5.07±0.02 5.1±0.05 NS
Mineral (mg/kg)
Calcium 40.95±2.3 38.53±1.3 NS
Phosphorus 83.5±1.3 80.05±1.8 NS
Cholesterol 0.9±0.03 0.14±0.08 NS
Heavy metal (mg/kg)
Lead (Pb) 0.04±0.0 0.04±0.0 NS
Cadmium (Cd) BDL BDL -
Chromium (Cr) BDL BDL -
Fatty acid profile
Saturated Fatty Acids 62.07±o.25 65.95±0.72 *
MUFA 33.06±0.80 36.19±0.66 *
PUFA 3.82±0.28 2.05±0.53 *
Linoleic acid 3.61±0.28 1.18±0.38 **
Linolenic acid 0.92±0.13 0.60±0.16 NS

Proceedings of the Annual Research review Workshop 2019, BLRI, Savar, Dhaka 1341, January 26-27, 2020
Technical Session IV 48
Screening of heavy metal residue in animal food chain system
MA Islam1, MK Alam
2, NR Sarker
2, AM Shohael
1 and MA Habib
2
1Depart ment of Biotechnology and Genetic Engineering, Jahangirnagar University, Savar, Dhaka1342
and 2Fodder Research and Development Project, Bangladesh Livestock Research Institute, Savar, Dhaka-
134, Bangladesh.
Executive summary
Heavy metals are those metals with relatively high densities or atomic weights. Some heavy
metals are essential as nutrients which are harmless, but some of them are highly poisonous.
Most of the heavy metals are highly poisonous in human at a certain dosage. Poisonous heavy
metals have a great negative impact on almost every living organism. In recent years, there has
been an increasing ecological and global public health concern due to heavy metal
contamination in our environment. An exponential increase of usage of heavy metals in several
industrial, agricultural, domestic and technological applications has been occurred in recent
years. Animal may get exposure of heavy meatal through animal food chain system. Human
and livestock are inextricably related. It causes various diseases including cancer in human. To
determine the concentration of heavy metals, nine different samples; soil (rice field), soil
(fodder field), water (home), water (field), rice straw, fodder, cow dung, blood and milk were
collected from five different arsenic prone districts (Faridpur, Jashore, Narayanganj, Chadpur
and Sirjganj) of Bangladesh which covered most of the agro-geological regions of Bangladesh.
The sampling area were selected by evaluating the arsenic polluted area map of Bangladesh
developed by Sustainable Development Networking Program (SNDP) under United Nations
Development Program (UNDP). Samples were collected from six to seven farmers who had
milking cows and cultivated fodders in each study areas. Collected samples were digested by
Aqua regia-Perchloric acid digestion method and analyzed by Atomic Absorption Spectroscopy
(AAS).
Average concentrations of cadmium (Cd) and chromium (Cr) in different samples of all studied
locations in Bangladesh have been presented in Figure 1 and Figure 2. Cd was found in most of
the samples in all the studied locations (Fig. 1), but the concentrations were less than the WHO
standard (0.8 ppm) in soil. Water samples in Faridpur contained higher concentration of Cd
(0.014 ± 0.005 ppm) compared to other locations and the concentration was higher than the
Bangladesh Food Safety Authority (BFSA) standard limit (0.003 ppm) for drinking water in
Bangladesh. Fodder samples in all studied locations contained lower concentration of Cd than
the WHO standard limit (0.02 ppm) in plant.
Figure 1. Average concentration of Cd in different samples from five studied locations of
Bangladesh
0
0.002
0.004
0.006
0.008
0.01
0.012
0.014
0.016
Soil (Rice
Field)
Soil
(Fodder
Field)
Water
(Home)
Water
(Field)
Rice Straw Fodder Cow Dung Blood Milk
Co
nce
ntr
ati
on
(p
pm
)
Samples

Proceedings of the Annual Research review Workshop 2019, BLRI, Savar, Dhaka 1341, January 26-27, 2020
Technical Session IV 49
Chromium (Cr) was found in most of the samples in all the studied locations (Fig. 2). Soil (rice
field) samples in Faridpur contained higher (0.7 ± 0.123 ppm) concentration of Cr than the
other studied locations and the concentration was lower than the WHO standard in soil (100
ppm). Water, except in Sirajganj, other studied locations contained higher concentration of Cr
than the United States Environmental Protection Agency (US EPA) standard (0.1 ppm) for
drinking water.
Figure 2. Average concentration of Cr in different samples from five studied locations of
Bangladesh
In the summing up, the study clearly showed that all the studied samples contained Cd and Cr.
Therefore, steps should be taken so that the concentrations of these two heavy metals may not
exceed the existing concentration which may cause harmful for animals and human beings.
0
0.1
0.2
0.3
0.4
0.5
0.6
Soil (Rice
Field)
Soil
(Fodder
Field)
Water
(Home)
Water
(Field)
Rice Straw Fodder Cow Dung Blood Milk
Co
nce
ntr
ati
on
(p
pm
)
Samples

Proceedings of the Annual Research review Workshop 2019, BLRI, Savar, Dhaka 1341, January 26-27, 2020
Technical Session IV 50
Adaptation of ovum pick up technology for the production of Red Chittagong
calves
GK Deb1, MA Kabir
1, MFH Miraz
1, SMJ Hossain
1 and AK Pal
2
1 Biotechnology Division, Bangladesh Livestock Research Institute, Savar, Dhaka 1341 and
2 Patuakhali
Science and Technology University, Dumki, Patuakhali, Bangladesh.
Executive summary
The present study was designed to characterize the follicular dynamics of Red Chittagong
Cattle (RCC) during natural estrous cycle. For this purpose, 5 RCC cows and 5 RCC heifers
were selected for studying follicular dynamics measured by follicular growth pattern and
circulating concentration of progesterone (P4), follicle stimulating hormone (FSH) and
luteinizing hormone (LH). From the detection of estrus onward, ovary of studied cattle were
scanned using ultrasonography system (HS-2200V Honda Electronics Co., LTD) equipped with
a vaginal probe (7.5MHz) twice daily in two consecutive estrous cycles. Blood samples were
collected daily for separation of serum used for determination of concentration of studied
hormones using standard ELISA procedure. Data were analyzed using Microsoft excel
programme. The length of estrus cycle were differed (p<0.01) between RCC cows (21.00±1.50
days) and heifers (20.00±1.10 days). The follicular growth patterns were occurred in two waves
in all experimental cattle (Figure 1). It was found that the interval since the emergence of the
wave to the deviation of the dominant follicle was 4.29±1.89, 3.29±2.17 days for the first and
second wave, respectively; likewise, the number of follicles was 9.11±2.47 and 8.18±1.86.
Finally, the dominant follicle diameter was 9.56±1.58 mm for first and 9.75±1.67 mm for
second wave. The maximum luteal diameter was 17.58±4.16 mm for RCC cows and
18.74±3.32 mm in heifers. Luteal regression took place at 15.22±5.26 and 17.62±1.68 days of
the oestrous cycle in RCC cows and heifers, respectively. The number of follicular waves did
not affect the maximum size and volume reached by the CL during its development in luteal
phase of cycle because the maximum diameter of the ovulatory follicle was similar between
two follicular waves. The first dominant follicular diameter of first wave was 11.5 mm in cows
and 10.5 mm in heifers, respectively.
Figure 1. Follicular growth pattern of Red Chittagong cattle at BLRI Research herd
The concentrations of FSH during the estrus cycle in two follicular wave cycles of RCC heifers
were 0.96 to 2.25 mIU/mL and 1.13-2.32 mIU/ml in RCC cows. The mean plasma levels of

Proceedings of the Annual Research review Workshop 2019, BLRI, Savar, Dhaka 1341, January 26-27, 2020
Technical Session IV 51
FSH followed a constant pattern and FSH-peaks (p< 0.05) occurred around days 2, 3, 4 and 13,
14, 15 in RCC cows and heifers showing a wavelike pattern. The P4 concentration
progressively increased from <1 ng/mL in 1–2 days post-ovulation to approximately ≥27
ng/mL at days 4–6, at the same time as follicular deviation in the first follicular wave; after that
they were maintained and declined <1 ng/mL during ovulation time. The concentrations
determined two days before and three days after ovulation are constantly low between 0.2 and
17.55 ng/ml plasma in blood serum. From day 4, a gradual increment was observed and
progesterone levels reached in a plateau around day 10 after ovulation. There is a sharp and
significant (p<0.005) fall in the progesterone levels on day 17 which was lasting for about 18
hours. The mean concentrations of LH calculated from plasma of 2 cycles basal values are
fairly constant. Concentrations decrease below the calculated mean levels on days 11-13 and
thereafter increased again. A further gradual increment (p<0.05) that exceeded the basal levels
beginning from day 17 until the preovulatory LH-peak on day 20. Immediately before
ovulation LH values again decrease to the basal concentrations.
Considering follicular dynamics of RCC research is conducting to adopt the ovum pick up
technology at BLRI. Follicular dynamics in RCC were characterized by the predominance of
two follicular waves. The concentration of P4, FSH and LH hormone corresponded with
follicular developmental stages in RCC cow and heifer.
Table 1. Follicular dynamics in Red Chittagong Cattle (RCC) during estrous cycle (Mean±SD)
Parameter Cow Heifer p-value
Duration of the estrous cycle (days) 21.00±1.50 20.00±1.10 0.01
Number of waves 2 2 NA
Emergence of wave 1 (day of the estrous cycle) 2.00±1.50 1.00±1.84 0.02
Number of follicles in wave 1 8.00±1.50 5.00±1.70 0.01
Deviation of wave 1 (day of the estrous cycle) 4.00±1.10 4.00±1.44 0.04
Diameter of the deviation of wave 1 (mm) 8.00±1.70 8.00±1.17 0.01
Emergence of wave 2 (day of the estrous cycle) 12.00±2.10 12.00±1.50 0.03
Number of follicles in wave 2 6.50±1.70 6.00±1.90 0.02
Deviation of wave 2 (day of the estrous cycle) 14.00±2.10 15.00±1.10 0.01
Diameter of the deviation of wave 2 (mm) 8.00±1.16 8.80±0.50 0.04
Diameter of the preovulatory follicle (mm) 12.00±1.70 11.00±1.50 0.02

Proceedings of the Annual Research review Workshop 2019, BLRI, Savar, Dhaka 1341, January 26-27, 2020
Technical Session IV 52
Isolation and identification of lactic acid bacteria for the development of microbial
silage inoculant
SM Amanullah, MM Rahman, MA Kabir and SMJ Hossain
Biotechnology Division, Bangladesh Livestock Research Institute, Savar, Dhaka 1341, Bangladesh
Executive summary
Forage ensiling for feeding dairy cattle as well as selling silage in the market are getting
momentum, coupling with dairy development in recent years in Bangladesh. Although silage
fermentation occurs naturally under anaerobic conditions due to the native epiphytic bacteria,
the speed and efficiency of fermentation are variable, depending on the numbers and types of
lactic acid bacteria (LAB) on the crop. Bacterial inoculant of selective species was found
effective to ensure quick fermentation with minimum nutrient losses and increased aerobic
stability of silage after opening silo. These reactions are very much important to achieve during
ensiling, especially for large/commercial scale silage production. Therefore, identification and
use of such bacteria for ensiling fodder were included as one of the priority tasks in the Action
Plan under The National Biotechnology Policy 2012. The current study was undertaken to
isolate and identify suitable phytic bacteria for the developmrnt of microbial silage inoculant.
For this purpose, 33 samples (Napier: 12 fodder, 3 silage; Maize: 15 fodder, 3 silage) from
Napier and Maize fodder and silages were collected. Bacteria were isolated using MRS Agar
media. Based on colony morphology and size, Gram’s staining and biochemical properties, 21
colonies were selected and isolated following purification through culturing in MRS agar and
MRS broth sequentially. In addition to above tests, biochemical characterization also included
growth at different temperatures (5,10,15, 30, 40, 43,45 and 50ºC), different NaCl
concentrations (2, 3, 4,6.5, 7, 8 and 10% NaCl), different pH (3.0, 3.5, 4.0, 4.5, 5.0, 6.5, 7.0,
8.0, 8.5, 9.0 and 9.5) and carbohydrate fermentation profile (glucose, sucrose, arabinose, ribose,
melibiose, cellobiose, sorbitol and raffinose etc.). Molecular confirmation of isolates was done
by using 16s rRNA gene sequencing, where PCR products were determined directly with a
sequencing kit using the prokaryotic 16S ribosomal DNA universal primers (27F: 5´- AGA
GTT TGA TCM TGG CTC AG -3´ and 1492R:3´- CGG TTA CCT TGT TAC GAC TT -5´).
Sequence similarity searches were performed using the Basic Local Alignment Search Tool
(BLAST) in NCBI database. The sequence information was imported into the CLUSTAL X
software program for assembly and alignment. Then the phylogenetic trees were constructed
using the neighbor-joining method. The topologies of trees were evaluated using bootstrap
analysis of the sequence data with Molecular Evolutionary Genetics Analysis (MEGA) 4
software, based on 100 random re-samplings.
All 21 isolates were found Gram positive and heterofermentative. Of the 21 isolates, only one
isolate was coccus in shape, while two found cocco-bacillus and the rest 18 were bacilli. Seven
strains were found catalase negative, while 14 were catalase positive. Based on these
characteristics 6 isolates were identified as Lactobacillus, 14 as Bacillus and 1 as
Staphylococcus genus. Together with the results of biochemical characterization (growth at
different temperature, NaCl concentrations, and at different pH and sugar fermentation profile;
data are not shown), sequence data revealed that 6 isolates were Lactobacillus fermentum, 4
were Bacillus spp. 7 were Bacillus subtilis, 1 was Lysinibacillus sphaericus, 2 were Bacillus
megaterium and 1 was Staphylococcus spp. Among these, L. fermentumand B. subtilis are
being used as silage inoculant and therefore, will be tested for their potential as silage inoculant
under this study. Besides, isolation and identification of other suitable bacteria will be
continued.

Proceedings of the Annual Research review Workshop 2019, BLRI, Savar, Dhaka 1341, January 26-27, 2020
Technical Session IV 53
Efficient management of poultry manure: anaerobic co-digestion for biogas
production and application of additives for odor reduction
SM Amanullah, MM Rahman, MA Kabir and SMJ Hossain
Biotechnology Division, Bangladesh Livestock Research Institute, Savar, Dhaka 1341, Bangladesh
Executive summary
Major uses of poultry manure (layer droppings) under traditional management system are in
aquaculture and organic fertilizer production. Considerable portions are being wasted and very
few farmers use it for biogas production. However, poultry manure (PM) could be an efficient
biomass for biogas production, especially when it is co-digested with other carbon rich, but
nitrogen deficient biomass. Again, whatever the management system is, temporary pilling of
manure in farm is liable for noxious odor in vicinity. Therefore, this study was conducted to
know the efficacy of PM for biogas production and composition in co-digestion with slaughter-
house rumen digesta (SHRD) and effects of additives for odor reduction during temporary
storage. In the first experiment, PM was mixed with SHRD at 100:0(RD0), 75:25(RD25), 50:50
(RD50), 25:75(RD75) and 0:100 (RD100) on total solid (TS) basis and anaerobically digested in
laboratory simulated biogas digester at 350C for 54 days. Gas production was measured daily,
gas composition was analyzed weekly, pH and microbial load was determined at beginning in
fresh substrate and bio-slurry at the end. In the second experiment, 1 kg of PM was surface
applied with either “no additives” (control) or aqueous solution (5%) of different chemicals
e.g., aluminium sulfate (AS), calcium chloride (CC), hydrogen peroxide (HP) or aqueous
extract (10%) of different plant sources e.g., Sapindus mukorossi (SM) fruit, Azadirachta
indica (AI) leaf and Yucca schidigera (YS) plant for 4 consecutive days. The pH and
concentration of NH3 and H2S were analyzed before and immediately after (0 hours) additive
application and then daily up to day 4. The E. coli and Salmonella spp. were counted at the
beginning and at the end of the experiment. Gas composition data were analyzed using repeated
measures in General Linear Model (GLM), while other data were subjected to Analysis of
Variance (ANOVA) in complete randomized design (CRD) in SPSS 20.
In experiment 1 (Table 1), biogas production was observed highest (P<0.01) in RD25 and RD50
than that in other treatments, which was almost double compared to the control. Moreover, CH4
concentration was found triple time higher (P<0.01) in RD25, RD50 and RD75, compared to the
control and RD100 treatment. Though the fresh substrates contained E. coli (Average 5.9±0.02
log10 CFU/g) and Salmonella spp. (Average 5.2±0.02 log10 CFU/g) but none of the slurries
contained any of these microorganism after anaerobic digestion.
Table 1. Biogas production from anaerobic co-digestion of PM with SHRD in different ratios
Biogas production Treatments SEM Sig
RD0 RD25 RD50 RD75 RD100
Biogas production
Total gas, L 7.0c 13.4
a 13.9
a 11.0
b 5.4
c 0.14 <0.01
L/kg of FM 18.9b 32.2
a 27.8
a 20.9
b 8.1
c 0.31 <0.01
L/kg of TS 66.6b 113.4
a 107.6
a 83.0
b 38.8
c 1.44 <0.01
L/kg of VS 80.1b 148.9
a 147.7
a 124.3
a 63.6
b 2.08 <0.01
Daily gas, ml/ day 128.6c 248.5
a 257.5
a 204.3
b 100.6
c 2.67 <0.01
Biogas composition
CH4, % 10.1c 30.6
b 33.1
a 31.9
ab 8.5
c 0.58 <0.01
CO2, % 29.7a 26.8
a 22.6
b 21.5
b 14.6
c 1.02 <0.01
NH3, ppm 478.5a 292.8
b 209.6
c 202.6
c 32.4
d 9.22 <0.01
H2S, ppm 2770.5a 1597.5
b 946.8
c 1016.5
c 43.2
d 39.46 <0.01
TS, Total solids; VS, volatile solids; FM, fresh manure; SEM, Standard error of mean; a-e
Means having
different superscripts differ significantly (P<0.05).
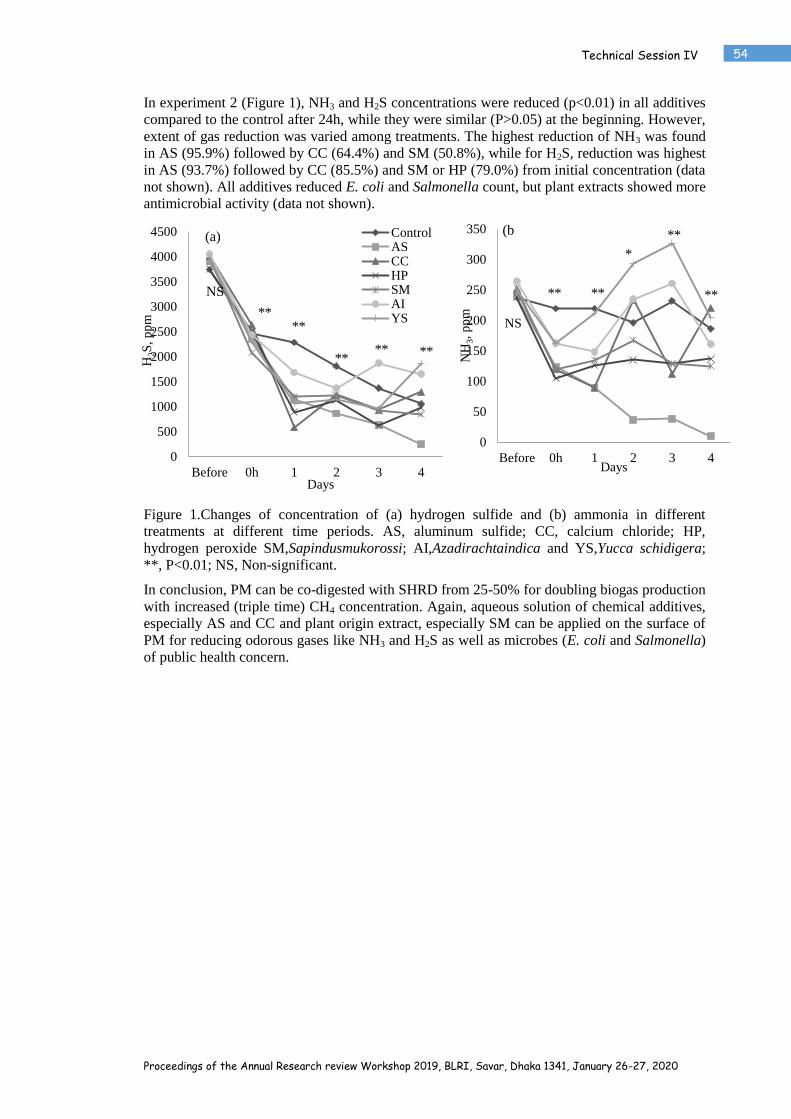
Proceedings of the Annual Research review Workshop 2019, BLRI, Savar, Dhaka 1341, January 26-27, 2020
Technical Session IV 54
In experiment 2 (Figure 1), NH3 and H2S concentrations were reduced (p<0.01) in all additives
compared to the control after 24h, while they were similar (P>0.05) at the beginning. However,
extent of gas reduction was varied among treatments. The highest reduction of NH3 was found
in AS (95.9%) followed by CC (64.4%) and SM (50.8%), while for H2S, reduction was highest
in AS (93.7%) followed by CC (85.5%) and SM or HP (79.0%) from initial concentration (data
not shown). All additives reduced E. coli and Salmonella count, but plant extracts showed more
antimicrobial activity (data not shown).
Figure 1.Changes of concentration of (a) hydrogen sulfide and (b) ammonia in different
treatments at different time periods. AS, aluminum sulfide; CC, calcium chloride; HP,
hydrogen peroxide SM,Sapindusmukorossi; AI,Azadirachtaindica and YS,Yucca schidigera;
**, P<0.01; NS, Non-significant.
In conclusion, PM can be co-digested with SHRD from 25-50% for doubling biogas production
with increased (triple time) CH4 concentration. Again, aqueous solution of chemical additives,
especially AS and CC and plant origin extract, especially SM can be applied on the surface of
PM for reducing odorous gases like NH3 and H2S as well as microbes (E. coli and Salmonella)
of public health concern.
0
50
100
150
200
250
300
350
Before 0h 1 2 3 4N
H3,
pp
m
Days
(b
NS
** **
*
**
**
0
500
1000
1500
2000
2500
3000
3500
4000
4500
Before 0h 1 2 3 4
H2S
, p
pm
Days
ControlASCCHPSMAIYS
NS
** **
** ** **
(a)

Proceedings of the Annual Research review Workshop 2019, BLRI, Savar, Dhaka 1341, January 26-27, 2020
Technical Session IV 55
Carbon footprint of beef cattle production at Khulna division of Bangladesh
N Sultana, NG Das, MT Islam and JS Khanom
Animal Production Research Division, Bangladesh Livestock Research Institute, Savar, Dhaka-1341,
Bangladesh
Executive summary
The beef cattle farming enterprise contributes to greenhouse gas (GHG) emission. This GHG
emission is associated with the production or purchase of farm feed recourses, enteric
fermentation of feedstuffs in the rumen, manure management system and farm operation
activities. The exploration of carbon footprint of beef cattle production is of importance in
order to identify major sources of GHG emission from their farming and to take appropriate
mitigation measures.
In order to study this, a survey was conducted in 202 beef cattle farms at Khulna division,
Bangladesh. The partial tier 2 approach of IPCC was followed to estimate the greenhouse gas
emission factors for enteric fermentation, manure management, farm operation and farm
feedstuffs under a gate to gate system boundary where the quantification was done during the
period from the animals being housed to being sold. During the survey, 10 representative
samples of each feedstuff from different farms (about 500 g) (different fodders, local grasses,
rice straw, and concentrate mixtures) were collected and analyzed in the laboratory to calculate
energy and nitrogen intake of animals. Nitrogen excretion rate which determines nitrous oxide
emission was estimated by using appropriate mathematical model. The difference in emission
factor between small (1-5 cattle) and large farms (>5 cattle) was calculated. The carbon
footprint of farm feedstuffs of the study area are presented in the Table 1. It showed that the
carbon footprint of Napier, Jumbo and maize grass was 12.72, 11.44 and 21.48 CO2e kg/t fresh
biomass. All the farms had to purchase feedstuffs to meet their requirements, and its average
share was 0.77. Considering the distance between farm and market (2.58 km), the carbon
footprint of purchased feedstuffs was estimated as 0.97 CO2e kg/t fresh biomass. Considering
the share of purchased and cultivated feedstuffs, the resultant carbon footprint of farm
feedstuffs was quantified as 2.55 CO2e kg/t fresh biomass.
Table 1. Carbon footprint of farm feedstuffs (fresh basis)
Parameters Carbon footprint
Mean SD Replication
Carbon footprint of Napier grass, kg CO2e/t fresh 12.72 1.25 100
Carbon footprint of Jumbo, kg CO2e/t fresh 11.44 1.64 12
Carbon footprint of Maize, kg CO2e/t fresh 21.48 3.24 7
Share of purchased feedstuffs in the total farm feedstuffs 0.77 0.25 202
Distance between market and farm, km 2.58 1.97 202
Carbon footprint of purchased feedstuffs, kg CO2e/t fresh 0.97 0.70 202
Carbon footprint of farm feedstuffs, kg CO2e/t fresh 2.55 2.57 202
SD, standard deviation.
The emission factor of different GHG and the carbon footprint of beef cattle production are
presented in the Table 2. The study found that the emission factors of enteric methane, direct
and indirect nitrous oxide, carbon dioxide from farm operation and feedstuffs were different
between small and large farms (P<0.05). However, manure methane emission was not different
between them. Considering the emission factors, the cumulative GHG emission from different
sources of farming enterprise resulted in the carbon footprint of 11.12 CO2e kg /kg LW of beef
cattle (7.57-19.42), which was similar between small and large farms (P>0.05).

Proceedings of the Annual Research review Workshop 2019, BLRI, Savar, Dhaka 1341, January 26-27, 2020
Technical Session IV 56
Table 2. Greenhouse gas emission factor and carbon footprint of beef cattle production
Parameters Farm size All farms
Small Large SEM P-values Mean Range
Emission factors
Enteric CH4 emission, kg/year CH4 38.02 47.10 12.08 0.000 42.47 21.70-75.50
Manure CH4 emission, kg/year CH4 6.48 9.54 11.35 0.057 7.98 0.35-73.00
Direct N2O emission, kg/year N2O 1.93 2.37 0.58 0.000 2.15 1.18-3.77
Indirect N2O emission, kg/year N2O 0.06 0.10 0.07 0.000 0.08 0.00-0.29
Farm operation, kg/year CO2e 193.00 140.00 64.81 0.000 167.00 17.10-411.00
Farm feedstuffs, kg/year CO2e 2.63 5.04 3.30 0.000 3.81 0.11-22.97
Carbon footprint, kg CO2e/kg LW
CH4 from enteric fermentation 5.54 5.54 0.79 0.997 5.54 4.00-7.59
CH4 from manure management 0.95 1.15 1.42 0.305 1.05 0.04-7.35
Direct N2O emission 3.38 3.32 0.48 0.435 3.35 2.37-4.91
Indirect N2O emission 0.11 0.13 0.09 0.037 0.12 0.00-0.39
CO2 emission from farm operation 1.19 0.74 0.47 0.000 0.97 0.08-2.64
CO2 emission from farm feedstuffs 0.07 0.13 0.08 0.000 0.10 0.002-0.50
Total carbon footprint 11.23 11.02 2.20 0.498 11.12 7.59-19.42
Small farm, 5≤ beef cattle; Large farm, 5< beef cattle; SEM, standard error of mean; P<0.05, significant.
In conclusion, it may be stated that the carbon footprint of available feedstuffs in the beef cattle
farms of the study area was 2.55 CO2e, kg /t fresh. It may be 11.12 CO2e kg/kg LW of beef
cattle production.

Proceedings of the Annual Research review Workshop 2019, BLRI, Savar, Dhaka 1341, January 26-27, 2020
Technical Session IV 57
Study on the improvement of existing manure management system of Bangladesh
N Sultana1, JS Khanam
1 and MA Islam
2
1Animal Production Research Division, Bangladesh Livestock Research Institute, Savar, Dhaka 1341 and
2 Bangladesh Agricultural University, Mymensingh 2202. Bangladesh
Executive summary
Animal wastes are important resources to supplement soil organic matter with mitigating
several national challenges like renewable energy, the sector which got a noticeable priority
from the Government of Bangladesh. Anaerobic digestion is now a forwarding step to turn
animal waste into benefit where a major challenge of managing bio-slurry is being faced.
Regarding this issue, the present study was designed to determine the extent of bio-slurry
production from per kg dung, the existing bio-slurry management system at field level, to
introduce the BLRI developed technique of it’s improved utilization and to explore the
potentiality of bio-slurry water (BSW) on controlling pests of crop field. At the same time
vermi-composting of cow dung was also studied to define its sustainability as animal waste
management tool for small scale farmers. To determine the extent of bio-slurry production from
DM of per kg dung, an animal trial with10 growing bull of BCB-1 cattle was continued for 1
month. Laboratory scale biogas digester was used for partitioning the biogas and slurry
production. A baseline survey was conducted to represent the field condition of bio-slurry
management for which a pre-tested questionnaire was used. Total 180 farmers of twelve
different districts of whole country was interviewed personally for collecting data on concerned
issue. Three farmers having biogas digester was selected at Sharifbag village of Dhamrai
upazila to introduce the BLRI developed bio-slurry management technique. A laboratory based
experiment was designed to determine the microbial association of bio-slurry water. To test the
response of bio-slurry water (BSW) on controlling pest infestation two summer crops (brinjal
and chilli) was cultivated at research field of horticulture department of BAU..An RCBD
(Randomized Complete Block Design) experiment was designed with 6 (T1=Basal Soil
application of BSW, T2=100% Foliar application of BSW, T3= 50% Foliar application of BSW,
T4= 50% Soil Application and 100% Foliar application of BSW, T5= Farmers practice
(chemical pesticide) and T6= Control (no pesticide) ) treatments and three replication of each.
For vermi-composting study, total 9 cement made round shaped pot was used and each pot was
filled with 20 kg dung previously decomposed for 21 days and three level of red worm (100,
300 and 500 nos) with three replication of each. Results showed that, on an average, daily an
animal ingested 7.84±0.2 kg DM and voided amount was 10.43±0.3 kg DM. Only 29.17% of
per kg dung DM converts into bio-gas during anaerobic digestion and remaining 70.83% was
come out with slurry. About 1.84 kg slurry was produced from per kg dung digestion and this
slurry converts into fertilizer at the rate of 15%.
Table 1. Bio-slurry utilization routes (%)
Parameter Results (Mean±SEM)
Crop field 12.29±1.10
Fish pond 8.96±1.16
Compost 0.32±0.15
Horticulture 3.04±0.68
Fodder Cultivation 5.22±0.66
Wasted 70.31±1.57
On average farmers having 5 or 6 either local or crossbred cattle were found to be interested in
anaerobic digestion of animal solid biomass. Daily 10.73±0.19 kg dung per animal was
produced of which 75% was used for biogas purpose, and 9% became totally wasted. But
incase of bio-slurry management, most of the respondents never remove slurry from tank at a
fixed interval or immediate after fulfilling the tank. They showed no interest to use it due to its
semi-solid physical structure and to quantify the total produced amount. A very few of
respondents utilized it in a sporadic way and their utilization routes are presented in Table-1,

Proceedings of the Annual Research review Workshop 2019, BLRI, Savar, Dhaka 1341, January 26-27, 2020
Technical Session IV 58
which reveals that, about 70% of total produced bio-slurry remains in unused condition. The
implication of BLRI developed sun-drying method of fresh bio-slurry up to desired DM (40-
45%) level showed that, farmers never gave any attention for bio-slurry management and
maximum time it overflows the tank in nearby pond or field. During summer, some of them
prepared burning fuel from it and locally sell at very nominal price which accounts only 1500-
2000 taka per year. But using the BLRI technique, they produced organic fertilizer with an
impressive return rate and nutrient content. Bio-slurry water was found to compose of
Pseudomonas fluorescence, Bacillus, Xenthomonas and Trichoderma species. Association of
50% soil with 100% foliar BSW application (T4) on selected crops (Brinjal and Chilli) resulted
minimum incidence of pest infestation (Table 2) and maximum quantity of crop yield (16.10 ±
0.55 a and 5.64±0.22a ton/ha). In case of vermi compost, maximum amount of fertilizer was
obtained from dung with 500 worms.. On an average 60-70 worm was required for producing
per kg fertilizer and per kg production cost was 4.00 taka. To utilize this huge valuable
resources appropriate management approach should be define first in accordance to farm and
farmer type and this will ensure the sustainability of farm and enhance farmers’ profit.
Table 2. Effect of liquid bio-slurry on pests infestation of vegetable crops (Mean±SEM)
Treatments
Brinjal (% incidence) Chilli (%
incidence) Yield (T/ha)
Brinjal shoot and
fruit borer
Phomophsis blight
infection Anthracnose Brinjal Chilli
T1 67.67 ± 4.41 ab
2.33 ± 1.33 a 4.24±1.88
a 9.43 ± 0.87
b 4.02±0.32
a
T2 53.00 ± 2.31 cd
1.06 ± 0.96 a 7.45±3.87
a 7.52 ± 0.21
bc 4.07±0.68
a
T3 59.00 ± 2.89 bc
1.36 ± 0.85 a 7.04±3.73
a 7.66 ± 0.32
bc 5.54±0.91
a
T4 41.67 ± 3.38 d 0.10 ± 0.00
a 3.47±0.39
a 16.10 ± 0.55
a 5.64±0.22
a
T5 48.00 ± 4.36 cd
0.10 ± 0.00 a 5.96±1.57
a 8.08 ± 0.27
bc 4.04±0.4
a
T6 75.00 ± 2.65 a 3.33 ± 0.33
a 13.22±2.66
a 6.04 ± 0.32
c 4.27±1.07
a
p<0.05*= p<0.05; ** = p<0.01; NS= Non-significant

Proceedings of the Annual Research review Workshop 2019, BLRI, Savar, Dhaka 1341, January 26-27, 2020
Technical Session V 59
Baseline study on available horse genetic resources in Bangladesh
GK Deb1, MFH Miraz
1, NH Desha
2, MA Kabir
1, MM Rahman
1, SMJ Hossain
1 and MA Jalil
2
1 Biotechnology Division and
2Goat and Sheep Production Research Division, Bangladesh Livestock Research
Institute, Savar, Dhaka 1341, Bangladesh
Executive summary
Horse (Equus caballus), a non-ruminant equine species, has played significant role in the human
civilization especially in developed countries. In Bangladesh, horse is widely used for racing,
transportation, cart pulling, draft and social festival purposes in horse pocket areas. Very little and
scanty information are available on impact of horse rearing on socioeconomic, available genotypes,
their distribution and phenotypic characteristics. This study aimed to evaluate the impact of horse
rearing on socioeconomic status of their owners and characterization of horse genetic resources in
Bangladesh. A questionnaire was developed and pre-tested before final data collection. Data were
collected from randomly selected 233 horse owners covering each administrative division (Coxs
bazar, Chittagong; Jaintapur, Sylhet; Bogra and Rajshahi Sadar, Rajshahi; Dinajpur and
Lalmonirhat, Rangpur; Kuakata, Barisal, Muktagacha, Mymensingh; Bangabazar, Gopalganj and
Modhupur, Dhaka and Dumuria, Khulna division) through direct and indirect questions with
farmers. Baseline data of the selected farmers were collected and analyzed descriptively by using
Microsoft Excel and SPSS programme.
Farmers kept horse as a secondary source of income and agriculture is their main occupation
(43.30%) followed by business (18.50%). The highest literacy level among the horse keepers was
HSC (0.9%) and most of the farmers were literate (could sign their name only) (53.20%) followed
by primary (25.30%) and illiterate (9%). Horses are reared mostly in semi-intensive (90.60%) and
extensive system (7.70%) with the purpose of carrying load (wood, paddy, pineapple, banana etc.),
human transportation and recreation (horse riding competition, riding in beach) throughout the
country. About 29.60, 38.20, 26.20, and 4.30% horse rearer earned a yearly amount of TK 0-50000,
50001-100000, 100001-150000 and150001-200000 respectively. Generally no specialized horse
breed was observed during this study and available horses are non-descript indigenous types
(86.70%). Farmers usually rear horse as a linkage of their family tradition. About 43.30% farmer
rear horse as a business and 77.30% farmer’s rear horse as a source of livelihood and rearing of
horse is 40.30% more profitable and easier than other livestock species. Among different age and
sex group, 43.30% horses were stallion followed by gelding (21.00%) and mare (17.60%) in
surveyed areas. Farmers purchased about 85.00% of the horses from different market and they
frequently change their animal on the basis of their performances. Farmers always maintain young
and energetic horse in their farm for carrying load. After end of productive life, horses are kept free
until natural death. Natural breeding is common all over the country (100.00%) and they use their
own (22%) or neighboring (78.00%) stallion for breeding purpose. Phenotypic, productive and
reproductive characteristics of indigenous horses were presented in Table 1. Chestnut and bay coat
color is predominating whereas black, albino, grey and roan color are also available. Star, stripe and
patch color was observed on the faces. More concentrate and less roughage based feeding practices
for horses are almost common throughout the country. Horses are engaged with carrying load for
larger part of the day so they have minimum chances to have green grasses and their ration
comprises with rice polish, maize/wheat crushed, mustard cakes and wheat/maize bran and salt. Due
to having higher percentage of concentrate in their ration, bloating is regular problem of horse
throughout the country. Deworming was practiced (89.69%) by farmers, where 99.57% have no
knowledge about vaccination and they do not vaccinate their animals. Farmers rear horse in
traditional method and there is no technology in terms of breeding, feeding and managements. So, in
survey it was focused that they are interested to get training about horse rearing and management.
From the survey it has been concluded that there is a great opportunity to contribute in livestock
GDP through horse farming in rural areas of Bangladesh. Government should take immediate
initiative to address this livestock species for its conservation and subsequent development as well
as the farmers who rely upon this germplasm as source of their livelihood.

Proceedings of the Annual Research review Workshop 2019, BLRI, Savar, Dhaka 1341, January 26-27, 2020
Technical Session V 60
Table1. Phenotypic, productive and reproductive characteristics of indigenous horse in Bangladesh
Phenotypic characteristics Mean±SD
Body weight (Kg) 166.437±41.315
Body length (cm) 110.120±11.452
Heart girth (cm) 126.832±11.391
Neck length(cm) 40.543±6.395
Head length(cm) 43.428±4.865
Ear length(cm) 14.870±1.503
Front height(cm) 115.778±7.931
Back height(cm) 112.820±7.829
Ear to tail length(cm) 156.875±17.459
Kesore length(cm) 67.092±9.850
Tail length(cm) 42.700±13.312
Milk yield (Li/day) 0.95±0.25
Lactation length (months) 3.21±1.28
Birth weight (Kg) 15.67±4.84
Age of 1st heat (months) 34.19±6.58
Gestation length (months) 10.55±0.83
Estrous period (months) 1.38±0.75

Proceedings of the Annual Research review Workshop 2019, BLRI, Savar, Dhaka 1341, January 26-27, 2020
Technical Session V 61
Determination of income elasticity of demand and forecasting demand for milk, meat
and egg in Bangladesh in 2025 and 2030
S Yasmin1, M Ershaduzzaman
1 and S Haque
2
1Socioeconomic Research Division, BLRI, Savar, Dhaka 1341 and
2Bangladesh Agricultural University,
Mymensingh 2202, Bangladesh
Executive summary
Bangladesh is now recognized as one of the middle-income countries by achieving all the indexes.
Since January 2016, Bangladesh is working to implement the Sustainable Development
Goals to end poverty, protect the planet and ensure that all people enjoy peace and
prosperity. To be promoted to a middle-income country, it is necessary to increase protein intake
level especially for children, women and economically active population. Protein is an important
nutrient requirement in food chart. Milk, meat and egg are the main source of protein. With this
sense, our study presents the relationship between income and demand for milk, meat and egg which
we get from income elasticity of demand for these products by estimating coefficients through log
linear regression. To achieve the objectives, both primary and secondary data were collected. About
700 primary data collected from 7 upazillas of 7 divisions through using a structured interview
schedule. Secondary data (Time series data on protein consumption and price) were collected from
BBS. The study also considered data of milk, meat and egg production in Bangladesh during the
time periods 1979-80 to 2015-16 to find out appropriate deterministic type growth model using
model selection criteria. The study found that the average daily consumption of milk is 40ml per
day/person while the recommended amount is 250ml/day. The amount of meat consumed in
Bangladesh has increased three times over past 40 years. Animal products consumption has
increased due to population growth, urbanization and income growth that created an absolute
Livestock Revolution. Many people’s diets have changed over time. Though a significant portion of
people in Bangladesh can afford animal protein daily, still considerable number of people cannot
afford milk, meat and egg as required. The overall income elasticity for milk is elastic (1.69) and for
meat (chicken, mutton, beef) and egg the income elasticity is inelastic (Table 1).
Table 1. Income elasticity of demand for milk, meat and egg
Divisions Coefficients
milk Chicken beef mutton Egg
Dhaka 1.73334*** 0.9242** 1.0665*** 0.0418** 0.9061**
Rajshahi 1.74379*** 1.0495*** 0.7466*** 0.8557* 0.9574***
Rangpur 2.34078*** 1.5211*** 0.1749*** 0.8983** 0.3691***
Khulna 0.58618*** 0.5515** 0.4326*** 0.5647*** 0.4981***
Barisal 1.77854*** 1.2459*** 0.9755*** 0.8793* 0.4783**
Mymensingh 1.90435*** 0.9756*** 0.3349** 1.0517*** 0.6903***
Sylhet 1.76579*** 0.4907*** 0.5255*** 0.6176*** 0.3776***
Overall 1.69 0.97 0.61 0.7 0.61
Note: The asterisks ٭٭ ,٭٭٭ and ٭ indicate the statistical significant at 1%, 5% and 10% levels, respectively.
Trend analysis was done to estimate the population, and demand for milk, meat and egg in 2030. It
could be mentioned here that though protein consumption and production are increasing but
inequality exist in consumption pattern. Besides, our study describes the growth pattern of milk,
meat and egg production and demand in Bangladesh by growth model with time series data using
model selection criteria where cubic model is best fitted and quadratic model is the 2nd
best fitted for
each product. By calculating demand, our study estimates the surplus/deficit amount of milk, meat
and egg in 2025 and 2030. In 2025, there will be surplus in milk, meat and egg and the amount is
73.31 lakh metric ton, 124.07 lakh metric ton, 1641.33 crore numbers respectively (Table 2). In
2030, there will also exist surplus in milk, meat and egg and the amount is 216.61 lakh metric ton,
257.11 lakh metric ton and 3746.35 crore numbers respectively. This study also shows socio-
economic graphing by descriptive statistics where 700 households have been used. The findings of

Proceedings of the Annual Research review Workshop 2019, BLRI, Savar, Dhaka 1341, January 26-27, 2020
Technical Session V 62
this study will help to recommend policies to take necessary steps for the demand and production of
milk, meat and egg in near future. Finally, it can be said that as any country goes forward, demand
for animal protein will rise but income elasticity of demand will be inelastic for those products. The
study is thus likely to contribute in public policy research of Bangladesh.
Table 2. Demand, production, availability and surplus of milk, meat and eggs in 2025
Products Cubic (best fitted)
Demand* Production Availability Surplus/ Deficit
Milk 168.16 Lakh Metric Ton
(250 ml/day/head)
241.47 Lakh Metric
Ton
358.99
(ml/day/head)
73.31 Lakh
Metric Ton
Meat 80.72 Lakh Metric Ton
(120gm/day/head)
204.78 Lakh Metric
Ton
304.45
(gm/day/head)
124.07 Lakh
Metric Ton
Egg 1916.55 Crore numbers
(104 numbers/year/head)
3557.88 Crore
numbers
5289.46
(numbers/year/head)
1641.33 Crore
numbers
*Estimated population of the country: 184283630, ** (+) sign= Surplus and (-) sign=Deficit

Proceedings of the Annual Research review Workshop 2019, BLRI, Savar, Dhaka 1341, January 26-27, 2020
Technical Session V 63
Determinants of Profitability of Cattle Fattening: A technical and allocative efficiency
analysis of fattening enterprise in Bangladesh
M Ershaduzzaman1, M Khatun
1, S Yasmin
1, FA Huda
3, R Khatun
2and S Islam
1
1Socioeconomic Research Division,
2Farming System Research Division, Bangladesh Livestock Research
Institute, Savar, Dhaka 1341 and 3Bangladesh Agricultural University, Mymensingh 2202, Bangladesh
Executive summary
The illegal border trade monitoring, the consumer habits and the local cattle production increase rate
exceeded the beef cattle demand. In this scenario, management systems for livestock enterprises are
decently developed, with minimum cost exotic fodder, obtaining a concentrated feed and available
medicine. With control and open-market policy, agriculture and milk production react quickly,
intensifying their production and increasing external inputs with the objective of increasing
production and profit margins. Beef cattle production does not react with the same speed, and due to
land competency for these activities, it is relegated to marginal zones and of minor production.
Regarding this scenario, the study assessed the determinants of profitability of cattle fattening
enterprise in selected area of Bangladesh. The study uses a sample of beef cattle farms that belong to
the representative fattening region which includes 340 farms. About 90 farms for the period
2017/2018 and 250 farms for 2018/2019, data were collected using structured questionnaire.
Descriptive, inferential statistics as well as budgetary technique were used to analyse the data
obtained.The production frontier identification technique was used for each farms in order to
measure their efficiency. The Technical efficiency is obtained when comparing a farm's beef
production with the one proposed by the model in the same conditions, while allocative efficiency is
established according to economic results comparing the enterprise's gross margin with the best
possible margin (Colom, 1994).
Allocative efficiency shows the ability to achieve the best possible economic results.It was observed
that cost of feeder cattle accounts for 79% of Total Variable Cost (TVC), Feeds 10%, Labour 7%
while Drugs and Vaccines 4%. On an average, respondents obtained about Tk13,500 per cattle as
profit of 120 days fattening period. Regression estimates of factors affecting Gross Margin (GM) of
cattle fattening enterprise show that the coefficient of cost of feeds, number of cattle fattened were
positive and significantto GM of the enterprise. The coefficient of cattle fattening experience, was
also positive and significant (p≤0.01) to GM of the cattle fattening business. The study revealed that
inadequate financial capability, feed scarcity and land for fattening were the major constraints to the
enterprise.
After analysing management records the simulation model was developed.The linear programming
was developed to optimize beef production according to the following decision criteria: minimum
cost under energy and time constraints; and maximum yield under energy and time constraints.
These simulation models, which represent the production frontiers that these enterprises may
achieve, are later compared to the management results obtained; this allows to analysed, the
technical and allocative efficiency of farms, simulate management proposals and establish
production possibilities for different scenarios. The actual scenarios indicate that production may be
four folded by modifying breed, feeding strategy and increasing profits of around 40% if a criterion
of maximum yield is adopted and the allocative efficiency is improved.
The analysis of the farms' data permitted that subject to study adjust well to a minimum cost
decision model, not to a maximum yield model, maintaining scarce supplementation. This
demonstrates the aversion to the risk of livestock fattener, and also the lack of the process
optimization. The technical efficiency of the farms were very good, which may be 0.89
kg/animal/day, while the allocative efficiency, shown in little low. This indicates that small changes
in the observed enterprises that analysed result in being general technically efficient, but poorly
efficient in allocation.
This frontier always located above the minimum cost frontier, the point of maximum concentrated
feed consumption superior to the ones of minimum cost. Maximum yield is obtained in this case

Proceedings of the Annual Research review Workshop 2019, BLRI, Savar, Dhaka 1341, January 26-27, 2020
Technical Session V 64
with 4.4 kg/cattle /day. The fattening of 120 days and produces 200 kg of beef on an average. A
gross margin of 13,500/cattle per cycle is produced.
The allocation of resources and proper management of the capital will produce significant
improvement in the production and in the economic result. The study concluded that cattle fattening
enterprise is profitable in the study area and various factors affect profit of cattle enterprise. The
study recommends that capital should be provided in form of loan to cattle fatteners by government
and Non-Governmental Organisations (NGOs). This will go a long way in improving cattle
production and provide job opportunities for the teeming unemployed youth.

Proceedings of the Annual Research review Workshop 2019, BLRI, Savar, Dhaka 1341, January 26-27, 2020
Technical Session V 65
Development of Model village through BLRI Technologies at Dhamrai areas
R Khatun1, S Ahamed
3, MA Alam
1, MZ Hassan
2, NR Sarker
4, M Ershaduzzamans
1. M Giasuddin
2.
MY Ali1 and MA Yousuf
2
1Farming System Research Division,
2Animal Health Research Division,
3Support Service Division and
4Poultry Production Research Division, Bangladesh Livestock Research Institute, Savar, Dhaka1341,
Bangladesh
Executive summary
The aim of the study to disseminate BLRI developed most popular and sustainable livestock
technology to farmers level for increasing productivity; observe the impact of their interventions on
socioeconomic status of farm families; identification of constraints facing during acquaintance with
the technologies and adaptation. Keeping this mind, three villages namely Shorifbag, Soibaria and
Fukutia under Dhamrai Upazila (100 households/village) were surveyed through structured
questionnaires for a model village selection considering livestock prone area; farmer’s interest;
Govt. and Non-Govt. activities scenario and natural barrier like river. After village selection, the
whole household (301 households) of the selected village were surveyed to know existing scenario
where the farming system pattern were 60% of livestock +vegetable; 20% of crop + lobber; 8% of
livestock + fodder and 12% of livestock+ businessman. Based on these scenario three technologies
based group was formulated focusing on disease control, livestock-chicken production, and fodder
production and preservation model and that time three local service providers (LSP) developed to
service the community peoples.
Out of 301 farmers 50 farmers were given hands-on training and demonstration. A Society was
formulated with holistic approach by selected farmers, local leaders, imam, DLS peoples, specialist
and also volunteers. Mass deworming, vaccination and vitamin supplementation programme (1st &
2nd
dose) were completed for developing a FMD and PPR free control village and poultry
biosecurity measures. Total 60 blood samples were collected randomly before vaccination and after
one month of vaccination to detect Antibody titre level of vaccinated animal. Total 679 cattle, 183
goat, 15 sheep and 857chicken, 415pigeons, 45ducks were taken under this programme. Total 20%
farmers were directly involved with BLRI developed eight technologies and intervention but almost
100% were involved with FMD, PPR control model and Community based poultry biosecurity
practice. Three farmers were selected for adaptation of Total Mixed Ration (TMR) technology;
seven farmers for high yielding fodder (HYF) cultivation and preservation (Pakchong & Moringa);
25 farmers for improved native chicken (ND) rearing model; 15 farmers for beef fattening; 3farmers
for developed bio-slurry based bio-fertilizer management; 6 famers for sheep and goat rearing. The
TMR were prepared by using maize stover as roughage (R) with the concentrate (C) (R:C=50:50). A
feeding trial was conducted using TMR technologies on growing bull calves to determine the
feeding effect on body weight gain where 15 growing calves were equally divided into 3 treatment
groups and duration of feeding trial was 90 days. Total 70 decimal land were cultivated under HYF
production and used this fodder for their livestock feeding and four new kids were born under sheep
and goat rearing. The animal waste management model will be developed to validate of BLRI
developed technique of organic fertilizer production from bio-slurry and bio-slurry water use as an
organic pesticide. Under this study, a survey of existing system of bio-slurry management by
farmers, organic fertilizer production using bio-slurry, feed feces, fresh bio-slurry and produced
organic fertilizer sample collection for nutrimental evaluation was done. The end of feeding trial
study revealed that body weight gain per day (0.955gm) was higher in beef cattle fed 50:50
(roughage: concentrate) TMR compared to control (0,669g). No clinical outbreaks against FMD,
PPR, ND and duck plague were found during this period and antibody level was protective after one
month. In case of native chicken, the age at sexual maturity at 20 wks. Mortality rate in growing and
laying period were found 1.6% and 0-1.2%, respectively under semi-intensive condition compare to
existing native chicken. The body weight at 12th, 20
th and 26
th weeks of age 813g, 1274g, 1406g for
Desi fowls respectively. Average egg production at 21-27 weeks of age was 25% and feed intake
was 70.00 (g/bird/day) and egg weight varied from 32-35g and afternoon egg production found
21.19% where scavenging local native birds with an annual average production of 35-49 eggs/hen

Proceedings of the Annual Research review Workshop 2019, BLRI, Savar, Dhaka 1341, January 26-27, 2020
Technical Session V 66
each weighing 35-39g. Based on results it was clearly indicated that the native germplasm is much
more potential in respect of disease resistant and production and reproduction perspectives and act
as tools of income source for rural women. Therefore, a sustainable community or technology based
village may be developed through validation and adaptation of developed technologies in selected
areas which will lead to an increase in farmer’s income.

Proceedings of the Annual Research review Workshop 2019, BLRI, Savar, Dhaka 1341, January 26-27, 2020
Technical Session V 67
0
100
200
300
male female male female male female
2017 2018 2019
298
48
156
15
155
73
Figure 1. Number of trainees took training on livestock last 3 years
Fattening Dairy poultry Sheep & Goat
21%
32% 33%
22%
0%
10%
20%
30%
40%
0%
20%
40%
60%
80%
Fattening Poultry Dairy Goat
Figure 2. Education qualification of
different categories farmers
Below Secondary level Secondary level
Higher Secondary level Graduates
Impact of farmers training on adoption of BLRI developed technologies
KN Monira1*
, MZ Rahman1, S Yasmin
2 and N Sultana
1
1 Training Planning and Technology Testing Division and
2Socioeconomic Research Division,
Bangladesh Livestock Research Institute, Savar, Dhaka1341, Bangladesh
Executive summary
Most of the people in Bangladesh rear different species of livestock of indigenous chicken,
cattle, buffalo, goat and sheep. Thus, the economy of Bangladesh is mostly dominated by
Agricultural sector. Livestock also plays an important role in the national economy and its.
Livestock contribution in GDP is about 2.5%. But almost all of them have no scientific
knowledge and training on how to manage profitable livestock farming. Bangladesh
Livestock Research Institute (BLRI) is providing training to livestock and poultry farmers
alongside with research. This study was conducted to assess the impact of BLRI training on
changes of socio-economic status of livestock and poultry farmers by taking information
from poultry, goat, dairy and beef fattening farmers. Farmers of each category were taken
face to face interview with a structured questionnaire prior to orientation of training and
again after some period of training. Simple statistical measures like mean, average, and
percentage were estimated for categorization and calculating data.
Figure 1 shows that the number of
trainees taken training from BLRI last 3
years. Total 1756 number of male &
511 numbers of female had been trained
in four technologies. Among them
cattle fattening was the highest
demanded technologies. To assess the
output of training it should be essential
to explore the socio-economic status of
the farmers who were considered for
interviewing. The analytical results
revealed that respondent farmers were
received various educational
qualifications having graduation of
21%, 32%, 33%, 22%; fattening,
poultry, dairy and goat rearing training
respectively(figure 2). In case of
occupation of the farmers most of them
were occupied by business (33%),
farming (27%), and service (13%).
Rest 27% of them had different kind of
occupations. Among the interviewed
respondents about 73% household families had 4 to 6 family members. According to land
lordship, about 35% were landless (0-49 d.m), about 36% were marginal (50-125 d.m), 17%
were small (126-249 d.m), about 12% were medium (250-749 d.m), and only 1.28% were

Proceedings of the Annual Research review Workshop 2019, BLRI, Savar, Dhaka 1341, January 26-27, 2020
Technical Session V 68
large (>750 d.m),) farmers. Based on cropping pattern, about 21% farmers cultivate crops
once in a year, about 47% twice in a year and about 32% thrice in a year.
Table 1. Technology adopted by different categories of farmers
Farmer category % farmers adopted technology
Yes No
Poultry 16 84
Goat 55.56 33.33
Dairy 100 -
Fattening 100 -
After getting specific training related to technology from BLRI, about 16% poultry farmers
adopted poultry rearing technology, about 56% goat farmers adopted goat rearing
technology and 100% dairy and fattening farmers adopted the relevant technologies in their
own farms (table 1). Among poultry farmers, population size of chicken (native chicken)
was 50.4 per household before training and it was increased to 250.4 chicken per household
after training, while duck population was remain unchanged. In the goat keepers, the
average population size per household of goat, sheep and kids before training were 5.56,
2.67 and 2.78 numbers, respectively, which increased to 5.78, 5.44 and 3.56. The average
population size of dairy cows before training was 5.87 cows per household, which increased
to an average of 10.00 cows. In the fattening farmers, the average population size of
fattening bull before training was 4.04, which increased to 10.83 after training. The annual
income of the different categories farmers are illustrated in (Table 2) which shows that a
substantial percent of income is generated from poultry and others farming. Percent change
have been found 34%, 29%, 15% and 18% for poultry, sheep & goat, dairy and fattening
farmers respectively.
Table 1. Income of different categories farmers before and after training
Farmer category Species Income before training Income after training %
change Range (lac
BDT)
Average
(lac BDT)
Range
(lac BDT)
Average
(lac BDT)
Poultry (n=25) Chicken 0-4.50 1.94 0-5.50 2.94 34%
Duck 0-2.00 1.04 0-2.00 1.04
Total 0-5.30 3.44 0-5.30 4.44
Sheep/Goat (n=09) Sheep/Goat 0.80-3.55 1.55 0.80-4.55 2.00 29%
Dairy (n=15) Cow 0.50-7.00 2.35 0.50-7.00 2.75 15%
Bull 0.50-2.50 1.21 0.50-3.50 1.51
Total 3.50-4.05 1.61 3.50-4.55 1.75
Fattening (n=29) Bull 0.50-2.50 1.00 0.50-3.50 1.22 18%
Finally it concluded that the sign of increasing animal population size, income and food
habit after getting training the improvement of socio-economic status of different categories
of farmers. But they face several natural & marketing problems. To solve these, have to
work more about disease control, vaccination, record keeping, marketing and women
empowerment.
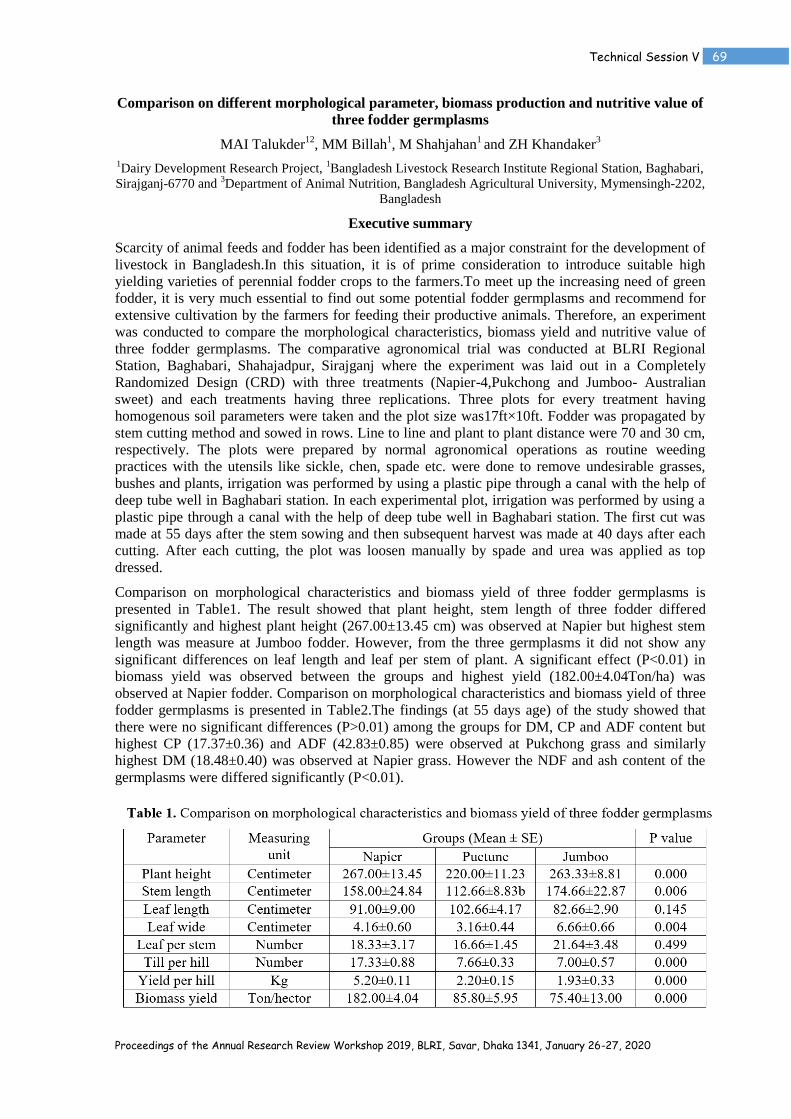
Proceedings of the Annual Research Review Workshop 2019, BLRI, Savar, Dhaka 1341, January 26-27, 2020
Technical Session V 69
Comparison on different morphological parameter, biomass production and nutritive value of
three fodder germplasms
MAI Talukder12
, MM Billah1, M Shahjahan
1 and ZH Khandaker
3
1Dairy Development Research Project,
1Bangladesh Livestock Research Institute Regional Station, Baghabari,
Sirajganj-6770 and 3Department of Animal Nutrition, Bangladesh Agricultural University, Mymensingh-2202,
Bangladesh
Executive summary
Scarcity of animal feeds and fodder has been identified as a major constraint for the development of
livestock in Bangladesh.In this situation, it is of prime consideration to introduce suitable high
yielding varieties of perennial fodder crops to the farmers.To meet up the increasing need of green
fodder, it is very much essential to find out some potential fodder germplasms and recommend for
extensive cultivation by the farmers for feeding their productive animals. Therefore, an experiment
was conducted to compare the morphological characteristics, biomass yield and nutritive value of
three fodder germplasms. The comparative agronomical trial was conducted at BLRI Regional
Station, Baghabari, Shahajadpur, Sirajganj where the experiment was laid out in a Completely
Randomized Design (CRD) with three treatments (Napier-4,Pukchong and Jumboo- Australian
sweet) and each treatments having three replications. Three plots for every treatment having
homogenous soil parameters were taken and the plot size was17ft×10ft. Fodder was propagated by
stem cutting method and sowed in rows. Line to line and plant to plant distance were 70 and 30 cm,
respectively. The plots were prepared by normal agronomical operations as routine weeding
practices with the utensils like sickle, chen, spade etc. were done to remove undesirable grasses,
bushes and plants, irrigation was performed by using a plastic pipe through a canal with the help of
deep tube well in Baghabari station. In each experimental plot, irrigation was performed by using a
plastic pipe through a canal with the help of deep tube well in Baghabari station. The first cut was
made at 55 days after the stem sowing and then subsequent harvest was made at 40 days after each
cutting. After each cutting, the plot was loosen manually by spade and urea was applied as top
dressed.
Comparison on morphological characteristics and biomass yield of three fodder germplasms is
presented in Table1. The result showed that plant height, stem length of three fodder differed
significantly and highest plant height (267.00±13.45 cm) was observed at Napier but highest stem
length was measure at Jumboo fodder. However, from the three germplasms it did not show any
significant differences on leaf length and leaf per stem of plant. A significant effect (P<0.01) in
biomass yield was observed between the groups and highest yield (182.00±4.04Ton/ha) was
observed at Napier fodder. Comparison on morphological characteristics and biomass yield of three
fodder germplasms is presented in Table2.The findings (at 55 days age) of the study showed that
there were no significant differences (P>0.01) among the groups for DM, CP and ADF content but
highest CP (17.37±0.36) and ADF (42.83±0.85) were observed at Pukchong grass and similarly
highest DM (18.48±0.40) was observed at Napier grass. However the NDF and ash content of the
germplasms were differed significantly (P<0.01).

Proceedings of the Annual Research Review Workshop 2019, BLRI, Savar, Dhaka 1341, January 26-27, 2020
Technical Session V 70
From the above findings it may be concluded that among the three fodder germplasms, Napier
fodder was superior for biomass production while Puctune was better for nutritive values.

Proceedings of the Annual Research Review Workshop 2019, BLRI, Savar, Dhaka 1341, January 26-27, 2020
Technical Session V 71
Collection, conservation and improvement of specialized fowl (Turkey, Guinea fowl
and Pigeon) production at BLRI
MA Rashid, S Faruque, MSK Sarker and NR Sarker
Poultry Production Research Division, Bangladesh Livestock Research Institute, Savar, Dhaka 1341,
Bangladesh
Executive summary
The study was conducted to evaluate the performances of specialized fowl varieties at research farm
of BLRI, to introduce new varieties of specialized fowl with the existing stock, and to know the
existing turkey production system in some selected areas of Bangladesh. A total of 265 turkey poults
were hatched including White and Mixed colored as new varieties with the existing Black and
Bronze turkey germ plasm. Their weekly live weight and daily feed intake were recorded. A total of
100 turkey raisers were surveyed in Mymensingh, Gazipur, Narsingdi, Narayanganj and Dhaka
district. A total of 460 hatching eggs of Pearl, White, Lavender and Black varieties of guinea fowl
were collected and hatched for further breeding research. A total of 13 pairs were selected from the
total of 52 pigeons on the basis of coat colour of Golla variety. There are 3 distinct colour were
selected (White, White-Black and Mixed) to establish a foundation stock for high producing squab
production.
At 1st, 4
th , 8
th and 12
th week of age irrespective of varieties the average live weight, feed intake and
FCR of turkey recorded 70, 316, 800 and 1700g/bird; 9, 31, 87 and 129g/bird/day, and 2.3, 2.0, 5.4
and 3.4, respectively. The mortality up to 12 week of age was 1.13%. Regarding turkey survey,
business and farming was the main occupation by 56 and 12% respondents, respectively, and
farming was secondary occupation by 90% farmers. Cent percent found literate and 40% got higher
education, 71% respondents start turkey farming for higher profit, 37% for hobby and 59% started
for commercial purposes. Sixty percent farms were small category (1-50 turkey) and among the
45% running farms, small category was 56%, and large scale was only 2%; 78% respondents did not
have any knowledge on the variety of turkey reared. Cent percent farmers reared turkey with mixed
varieties. The common varieties found as American Black, Bronze, White Holland, Beltsville Small
White, Royal Palm, Bourbon Red, Silver and Mixed colored. American Black was the best turkey
variety as per 55% respondents.
Table1. On station performance of turkey
Parameter Week (Mean ± SD)
1st 4
th 8
th 12
th
Live weight (g/bird/week) 70±2.36 316±14.90 800±44.64 1700±105.84
Feed intake(g/bird/day) 9.12±4.68 30.93±2.61 86.63±4.05 129.10±3.76
FCR 2.3 2.0 5.4 3.4
Higher growth rate, suitable for Bangladesh, low disease incidence, good meat quality were
advantages of turkey rearing. Problems faced by the farmers in rearing turkey were unstable market,
higher feed cost and low quality feed, lack of proper marketing channels, veterinary services and
potential breeds. Cold, Pox, Ranikhet and Bird flu were reported as major diseases. Few years back
the average price of per chicks, eggs and adult turkey was 840, 136 and 2650 Taka, respectively.
The input (chicks and eggs) and the product prices of turkey was many fold higher than that of
chicken and ducks that is the beyond capacity of common people. For making the price reasonable
the cost of production must be lower. Therefore, some research initiative is imperative to overcome
the existing problems in turkey production in Bangladesh e.g. i) Development of suitable breed ii)
Formulation of low cost ration with the inclusion of nutritious forages, and iii) Established an
organized marketing channels. The performance of existing pearl varieties of guinea fowl were live
weight and feed intake at 20 weeks 1339g/bird and 100g/bird/day, respectively, age at sexual
maturity was 17 week and hen day egg production up to 52 weeks was 20%.

Proceedings of the Annual Research Review Workshop 2019, BLRI, Savar, Dhaka 1341, January 26-27, 2020
Technical Session V 72
Table 2. Field level performance of turkey
Sl. no. Parameter Average value
1 Age at first egg (months) 6.6
2 Egg production (number/year) 139
3 Clutch (Number 6
4 Fertility (%) 81
5 Hatchability (%) 74
6 Incubation by indigenous hen (number) 81
7 Incubation by turkey (number) 2
8 Incubation by incubator (number) 35
9 Marketing age (months) 6.3
10 Weight at marketing (Kg) 5.9
11 Feed required for 6 months (Kg) 23.5
12 Grass required for 6 months (Kg) 11.5
13 High mortality incidence (%) 28
14 Profitability (Tk. /50 turkey/year) 150,000.00 (Approx.)
15 BCR 1.79
The study revealed the actual turkey production scenario in Bangladesh and thorough research need
to be conducted to make the turkey production sustainable. A good number of new varieties of
specialized fowls were introduced and their performance study through selection and breeding is on-
going to produce high producing specialized fowl breeds/varieties at BLRI.

Proceedings of the Annual Research Review Workshop 2019, BLRI, Savar, Dhaka 1341, January 26-27, 2020
Technical Session V 73
Substitution of soybean meal by cotton seed meal as a source of protein supplement in
the diet of broiler chicken
MSK Sarker1, RA Sumon
1, NR Sarker
1 and F Sharmin
2
1Poultry Production Research Division, Bangladesh Livestock Research Institute (BLRI), Savar, Dhaka
2Post-
Doctoral Fellow, Bangabandhu Science &and Technology Fellowship Trust, Ministry of Science and
Technology, Dhaka, Bangladesh
Executive summary
Cotton is a versatile crop producing a number of products of value to man and domesticated
livestock. The residue of cottonseed oil extraction industry commonly known as, cotton seed meal
(CSM) is a fairly good source of protein (39%) and energy (15 MJ /kg). The use of CSM in poultry
diet is limited due to the presence of some anti nutritional factors such as gossypol, cyclopropenoid
fatty acids (CPFA) high fibre and poor protein quality. Hence, this study was conducted to find out
the ability of substituting soybean meal by cotton seed meal to use in the broiler chicken diet. Two
hundred eighty eight (288) day old broiler chicks were assigned to six dietary treatments for 5
weeks with four replications having 12 chicks per replication. Six dietary treatments were prepared
from the basal feed as follows: control T0 (100% Soybean meal (SBM) + 0% CSM), T1 (90% SBM
+ 10% CSM), T2 (80% SBM + 20% CSM), T3 (70% SBM + 30% CSM), T4 (60% SBM + 40%
CSM), and T5 (50% SBM + 50% CSM). Experimental diets were divided into three phases; starter
0-2 weeks, grower 3-4 and finisher 5th week of age. The diets were formulated following NRC
(1998) standard and birds were reared by floor pen. The chemical composition of the diets was
analyzed by following the detail guidelines of AOAC (2000), where the feed ingredients chemical
compositions were analyzed.
Table 1. Effect of cotton seed meal (CSM) on the growth performance of broiler chicken (5th wk)
Treatment
To
T1
T2
T3
T4
T5
SEM
value
Initial BW (g/b) 43.67 44.07 43.55 43.84±0.15 44.00 43.37 0.92
Weight gain (g/b) 1459 1527 1566.87 1475.50 1452.47 1486.73 17.53
Final Wt (g/b) 1415.48 1443.77 1518.33 1431.67 1431.45 1444.35 17.52
Feed intake (g/b) 3004.35 3181.30 3162.15 3170.20 3142.87 3135.22 9.09
FCR 2.50 2.28 2.15 2.27 2.37 2.23 2.20
FCR : Feed Conversion Ratio
Numerically, highest weight gain was observed in 80% SBM + 20% CSM dietary group than other
treatments (Table 1). The similar trend was observed in feed conversion ratio. This imply that up to
20% cotton seed meal can be incorporated to soybean meal that will obviously reduce the 20%
demand or load in feed formulation in poultry. Kanyinji and Sichangwa (2014) also got the similar
result; they compared the efficacy of unfermented and fermented CSM, used at the dietary levels of
15 or 20% as replacements of soybean meal in broilers nutrition. Addition of 600 ppm Fe (El
Boushy and Raterink, 1989) was done in the treatments to mitigate the gossypol content in the
cotton seed meal.
The proximate components of broiler breast and thigh (Table 2) meat were analyzed. Moisture and
Dry matter (DM) in both types of meat didn’t show any significant (p>0.05) variation among the
treatments. The amount of crude protein (CP) in breast meat showed about 2% higher than thigh
meat in all the treatments (Table 2). Crude fat (CF) content was found higher in all the thigh meat
than breast meat. The ash content in the meat (80% SBM & 20% CSM) for both breast and thigh
meat showed highest than less CSM content group

Proceedings of the Annual Research Review Workshop 2019, BLRI, Savar, Dhaka 1341, January 26-27, 2020
Technical Session V 74
Table 2. Effects of dietary CSM treatments on breast and thigh meat composition (%) of broiler
chicken
To T1 T2 T3 T4 T5
Breast meat
Mo 74.26± 1.12 72.81±0.64 72.42±0.33 72.20±0.42 70.77±0.72 71.38±0.48
DM 25.74±1.12 27.19±1.29 27.58±0.33 27.80±0.42 29.23±0.72 28.62±0.48
CP 21.89±0.88ab
22.24±0.42a 21.39±0.77
ab 20.85±0.93
bc 20.72±0.41
bc 22.57±0.53
a
EE 0.96±0.17d 1.70±0.47
c 2.32±0.21
ab 2.28±0.18
a 2.56±0.22
ab 2.26±0.16
b
CF 0.96±0.13a 0.90±0.11
a 0.79±0.05
b 0.69±0.05
b 0.70±0.07
b 0.78±0.09
b
Ash 1.30±0.11c 1.32±0.15
c 2.01±0.11
ab 2.14±0.19
a 1.80±0.05
ab 1.50±0.07
bc
Thigh meat
Mo 71.39±2.56 71.74±2.16 73.83±0.77 74.04±0.81 73.30±0.86 73.37±0.69
DM 28.61±0.48 28.27±2.16 26.17±0.38 25.96±0.41 26.7±0.86 26.63±0.69
CP 19.90±0.67ab
20.46±0.69ab
19.36±0.85ab
18.05±0.21c 18.76±0.64
bc 20.03±0.62
ab
EE 1.36±0.22c 2.88±0.31
bc 3.09±0.12
ab 3.69±0.22
a 3.62±0.42
ab 3.62±0.11
ab
CF 1.49±0.13a 1.05±0.17
bc 1.02±0.09
bc 1.09±0.05
bc 0.97±0.03
c 1.10±0.07
bc
Ash 1.30±0.24bc
1.06±0.17c 1.42±0.21
bc 1.72±0.27
a 1.22±0.21
bc 1.14±0.05
bc
Mo = Moisture, DM = Dry Matter, CP=Crude Protein, EE= Ether Extract, CF=Crude Fat, NFE = Nitrogen
Free Extract, The value are mean ± SE
It can be concluded that CSM is an acceptable ingredient in poultry diets, relatively rich source of
protein and can be replaced up to 20 percent of soybean meal in the broiler production.

Proceedings of the Annual Research Review Workshop 2019, BLRI, Savar, Dhaka 1341, January 26-27, 2020
Technical Session V 75
Improvement of Black Bengal Goat in rural areas
MA Jalil1, NH Desha
1, MP Choudhury
1, SA Chowdhury
2, MA Hemayet
1 and MH Rahman
1
1Goat and Sheep production Research Division, Bangladesh Livestock Research Institute, Savar, Dhaka 1341
and 2Palli Karma-Sahayak Foundation, Sher-e-Bangla Nagar, Dhaka 1207, Bangladesh
Executive summary
Bangladesh has only one goat breed of its own, popularly known as Black Bengal Goat (BBG). The
BBG is a dwarf breed of goat and known to be famous for its high adaptability, fertility, prolificacy,
delicious meat and superior skin. Selection is one of the vital tools for improving the native animal
genetic resources. Since 1988, Bangladesh Livestock Research Institute (BLRI) has taken attempted
to improve BBG through selective breeding. In this situation, “Co-operative Village Breeding
Program” may play a vital role in the improvement of indigenous goat. The objectives of this project
were to improve the Black Bengal goat at farmer’s level, to improve livelihood of community
farmer through rearing Black Bengal goat and to operate community based Buck Park at farmer’s
level. The research was conducted at three villages namely Pachpai, Borochala and Gangatia under
Bhaluka Upazilla of Mymensingh district. A well organized questionnaire was developed for
baseline survey through Participatory Rural Appraisal (PRA) to know the goat population,
management, feeding and breeding system, social status of the farmers etc. Fifty (50) farmers were
selected randomly in the project areas to conduct baseline survey and finally fourteen (14) farmers
were selected who had at least 4-5 years experiences of BBG rearing under community breeding
program. Twenty (20) maiden does and six (6) superior bucks taken from Goat Research Farm,
BLRI were distributed among 14 selected farmers. All the distributed goats were tagged for their
identification. A well organized recording card was given to record all the data of the goat in the
community. Routine vaccination and de-worming were practiced. Data were analyzed using
Statistical Package for the Social Sciences (SPSS) version 17.0.
Table1 shows the performance of BLRI BBG progeny. The birth weight, 3 month weight, 6 month
weight, 12 month weight and litter size were significantly (p<0.001) higher in progeny of BLRI
bucks than progeny of BLRI does. There was no significant difference of gestation length between
progeny of BLRI bucks and progeny of BLRI does.
Table1. Performance of BLRI BBG progeny at farmer’s level
Parameters Progeny of BLRI does Progeny of BLRI bucks Level of significance
Mean±SE Mean±SE
Birth weight (kg) 1.42±0.05b (57) 1.52±0.06
a (66) ***
3 month weight (kg) 6.98±0.36b (41) 8.74±0.28
a (46) ***
6 month weight (kg) 11.47±0.68b (24) 14.96±0.44
a (40) ***
12 month weight (kg) 15.40±0.48b (15) 19.14±0.94
a (24) ***
Litter size (no) 1.76±0.09b (28) 2.21±0.11
a (33) ***
Gestation length (days) 145.22±0.68 (28) 148.81±0.77 (31) NS
Kidding interval (days) 247.25±37.32 (14) - -
Figures in the parenthesis indicate the number of observation, ***= Significant at 0.1% level of probability
(p<0.001). NS= Not significant (p>0.05).
The effect of sex, parity and litter size on performances of BLRI BBG progeny at farmer’s level are
shown in Table-2. Result shows that, sex had significant effect on birth weight (p<0.05), 3 month
weight (p<0.05) and 6 month weight (p<0.01). There was no significant effect of sex on gestation
length. There was no significant effect of parity on birth weight, 3 month weight, 6 month weight
and gestation length. There was no significant effect of litter size on birth weight, 3 month weight, 6
month weight except on gestation length.

Proceedings of the Annual Research Review Workshop 2019, BLRI, Savar, Dhaka 1341, January 26-27, 2020
Technical Session V 76
Table 2. Effect of sex, parity and litter size on performances of BLRI BBG progeny at farmer’s
level
Factors Parameters
BW (kg)±SE 3M (kg)±SE 6M (kg)±SE GL (days) ±SE
Sex
Male 1.32±0.05 (25) 8.40±0.52 (15) 11.02±0.64 (10) 145.16±0.82 (15)
Female 1.20±0.08 (22) 6.47±0.66 (18) 8.94±0.72 (12) 146.67±1.02 (12)
LS * * ** NS
Parity
1 1.31±0.07 (11) 7.58±0.42 (9) 9.70±0.42 (8) 146.71±0.72 (10)
2 1.25±0.14 (14) 7.77±0.40 (6) 8.79±1.22 (9) 145.71±0.42 (9)
3+
1.15±0.19 (10) 7.65±1.20 (8) 8.84±2.30 (6) 148.40±1.50 (8)
LS NS NS NS NS
Litter size
1 1.49±0.15 (19) 8.05±0.81 (8) 10.40±0.49 (8) 148.14±1.42 (8)
2 1.30±0.17 (16) 7.19±0.35 (4) 9.22±0.69 (6) 146.10±0.64 (11)
LS NS NS NS *
BW= Birth weight, 3M= 3 month weight, 6M=6 month weight, GL= Gestation length, LS= Level
significance. Figures in the parenthesis indicate the number of observation.*= Significant at 5% level of
probability (p<0.05), **= Significant at 1% level of probability (p<0.01), NS= Not significant (p>0.05).
Superior bucks and does will be selected for breeding purpose according to their performance. The
study will be continued until a significant level of achievement through community based goat
production in the study areas.

Proceedings of the Annual Research Review Workshop 2019, BLRI, Savar, Dhaka 1341, January 26-27, 2020
Technical Session V 77
Conservation and improvement of native sheep at BLRI
MA Jalil1, NH Desha
1, MP Choudhury
1, SA Chowdhury
2, S Akhter and MH Rahman
1
1Goat and Sheep production Research Division, Bangladesh Livestock Research Institute, Savar, Dhaka 1341
and 2Palli Karma-Sahayak Foundation, Sher-e-Bangla Nagar, Dhaka 1207, Bangladesh
Executive summary
Sheep production is an important component of livestock sector to address the food insecurity and
reduce poverty among smallholder farmers in the developing countries like Bangladesh because of
their unique adaptation to marginal environments with low level of input, high prolific nature and
contributes much for sustaining rural livelihoods by producing a wide range of products.
Conservation is the management of human use of the biosphere, so that it may yield the greatest
sustainable benefits to present generation while maintaining its potential to meet the needs and
aspirations of the future generations (FAO, World Watch List, 2000). Therefore, considering the
above facts and circumstances this project has designed for conservation and improvement of native
sheep at Goat and Sheep Research Farm, Bangladesh Livestock Research Institute (BLRI), Savar,
Dhaka. The breeding program was conducted at Goat and Sheep research farm. The breeding
program was conducted through Open Nucleus Breeding System (ONBS) in such a way, which
resists inbreeding. Ram was kept separately from ewes to avoid unplanned mating. All the sheep
were housed in slated floor permanent house raise above the ground level with sufficient space to
keep them comfortable. Green grass (ad-libitum) and concentrate (17% CP, 11MJ/kg DM) were
supplied twice daily (morning and evening) at the rate of 300g per head per day. The subsequent
data are being recorded throughout the year. Subsequently, a Nucleus Breeding Herd is being
established by selecting superior ewes and rams of the respected breeds. All the sheep of this study
were tagged to maintain the individual identity. During this study, phenotypic measurements on
indigenous sheep populations (Barind, Jamuna river basin, Coastal) were recorded using measuring
tape and hanging digital balance following the guidelines of FAO. Data were analyzed using
Statistical Package for the Social Sciences (SPSS) version 17.0.
Table 1. Morphological characteristics of different type of indigenous sheep in Bangladesh
(Mean±SE)
Parameters
Type of indigenous sheep in Bangladesh
F-value Sig. Coastal sheep Barinda sheep
Jamuna river
basin sheep
Body weight (kg) 21.42±0.51
a
(145) 17.91±0.68
b (58) 19.05±1.23
ab (24) 19.90 p<0.001
Body length (cm) 55.44±0.49
a
(145)
51.76±0.76 b
(58) 52.99±1.15
b (24) 8.75 p<0.001
Height at wither (cm) 54.48±0.42
a
(145) 51.71±0.58
b (58) 52.83±1.00
ab (24) 7.08 p<0.001
Chest girth (cm) 64.12±0.83
a
(145) 60.69±0.98
b (58)
61.81±1.72b
(24) 3.05 p<0.05
Tail length (cm) 12.67±0.14
a
(145) 11.42±0.22
b (58)
11.64±0.43b
(24) 12.20 p<0.001
Means with uncommon superscripts differ significantly. Figures in the parenthesis indicate the number of
observation.
Table 1 showed that, body weight, body length, height at wither, tail length were significantly
(p<0.001) higher in Coastal sheep than Barind and Jamuna River Basin sheep. Chest girth was
significantly (p<0.5) differed among Coastal, Barind and Jamuna River Basin sheep.
Table 2 showed that, post lambing ewe weight and Birth weight of lamb were significantly (p<0.01)
differed among Coastal, Barind and Jamuna River Basin sheep. There was no significantly
difference among Coastal, Barind and Jamuna River Basin sheep for Gestation Length, Litter size
and Placenta weight. Superior rams and ewes will be selected by the individual performance.
Therefore, the selection program will be continued until significant results.
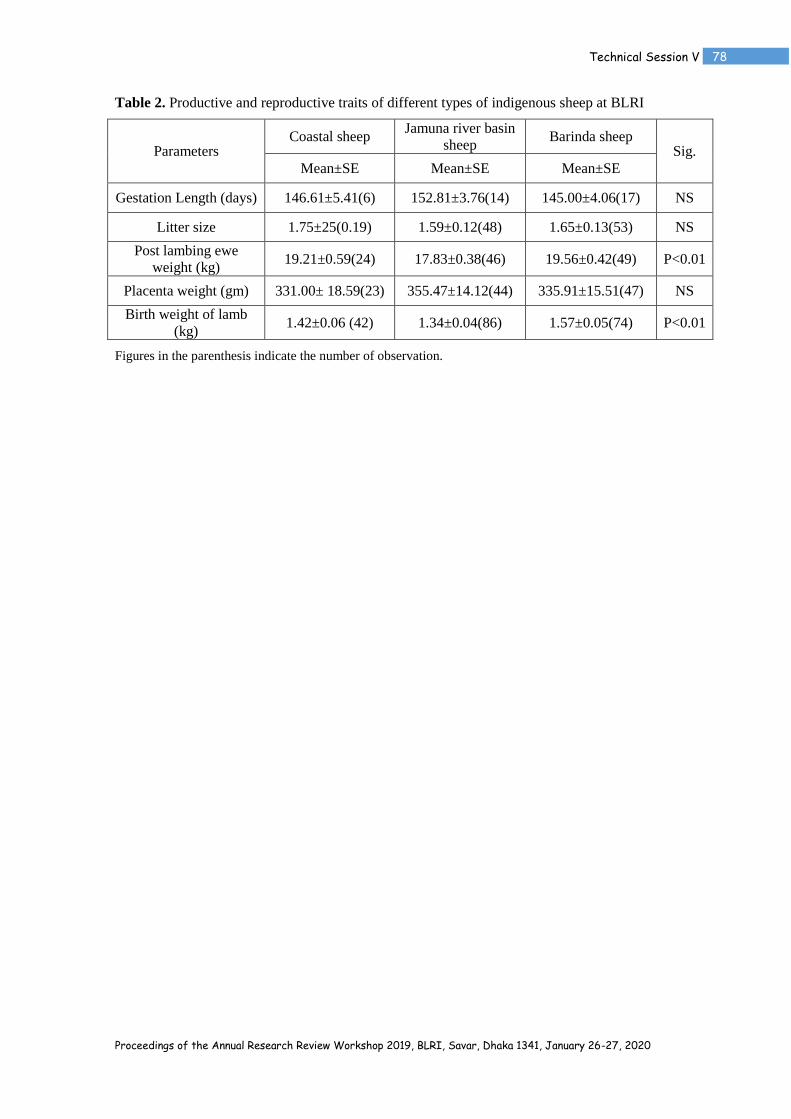
Proceedings of the Annual Research Review Workshop 2019, BLRI, Savar, Dhaka 1341, January 26-27, 2020
Technical Session V 78
Table 2. Productive and reproductive traits of different types of indigenous sheep at BLRI
Parameters Coastal sheep
Jamuna river basin
sheep Barinda sheep
Sig.
Mean±SE Mean±SE Mean±SE
Gestation Length (days) 146.61±5.41(6) 152.81±3.76(14) 145.00±4.06(17) NS
Litter size 1.75±25(0.19) 1.59±0.12(48) 1.65±0.13(53) NS
Post lambing ewe
weight (kg) 19.21±0.59(24) 17.83±0.38(46) 19.56±0.42(49) P<0.01
Placenta weight (gm) 331.00± 18.59(23) 355.47±14.12(44) 335.91±15.51(47) NS
Birth weight of lamb
(kg) 1.42±0.06 (42) 1.34±0.04(86) 1.57±0.05(74) P<0.01
Figures in the parenthesis indicate the number of observation.

Proceedings of the Annual Research Review Workshop 2019, BLRI, Savar, Dhaka 1341, January 26-27, 2020
Technical Session V 79
Production and evaluation of crossbred sheep of Coastal with Damara, Dorper and
Parendale
MA Jalil1, NH Desha
1, MP Choudhury
1, M Ershaduzzaman
2, SA Chowdhury
3 and FT Jahura
2
1Goat and Sheep production Research Division and
2Sheep Development and Conservation Project,
Bangladesh Livestock Research Institute, Savar, Dhaka 1341 and 3Palli Karma-Sahayak Foundation,
Sher-e-Bangla Nagar, Dhaka 1207, Bangladesh
Executive summary
Cattle, goat and chicken are the major and popular sources of meat in Bangladesh. Numbers of
programmes were implemented and some of them are under execution for increasing production
efficiency of cattle, goat and chicken species. These initiatives results 76.11% increment in national
meat production in 2010-11 compared to domestic production of the year 2005-06 (BBS,
2012).However, this rate of increment is not sufficient to meet the national demand of meat.
Therefore, different species including sheep might be emphasized as a meat animal. Meat produced
by different conventional sources like poultry, cattle, sheep and goat is quite insufficient to meet-up
the growing demand of animal protein in spite of high density of livestock. Protein deficiency has
been taken as the major contributory factor in malnutrition. It is therefore, important to develop
crossbred to minimize the deficiency of animal protein. Thus, the present study was undertaken to
evaluate the productive and reproductive performances and also the adaptability of different
crossbred genotypes in hot and humid climatic conditions.
The breeding program was conducted at Goat and Sheep Research farm of Bangladesh Livestock
Research Institute, Savar, Dhaka. A total of 75 native Coastal type ewes were crossed naturally with
the ram of pure Damara, Dorper and Parendale sheep breed (25 ewes for each breed). The average
body weight of costal ewes were 20 kg or above and 70 kg or above for the ram of foreign sheep.
All the ewes and rams were housed in slated floor permanent house raise above the ground level
with sufficient space to keep them comfortable. Ram was kept separately from ewes to avoid
unplanned mating. Green grass was supplied at adlibitum basis and concentrate (17% CP, 11MJ
ME/kg DM) was offered twice daily (morning and evening) at the rate of 1.5% of body weight per
day. The birth weight of newborn kids was taken by digital weighing balance within one hour after
birth. The subsequent weight of kids was recorded in the morning and before feeding at fortnight
basis throughout the year. Subsequently, the data on productive and reproductive performances were
recorded regularly. The collected data were analyzed by SPSS 17.0 Statistical computer programme.
Table 1. Production performances of different crossbred sheep genotype (Mean ± SE)
Parameters Sheep genotypes
Damara-Coastal
crossbred
Dorper-Coastal
crossbred
Parendale-Coastal
crossbred
Birth weight (kg) 1.98±0.06 (45) 1.97±0.19 (10) 1.87±0.86 (9)
3 month weight (kg) 9.80±0.35 (40) 11.56±0.76 (5) 8.57±0.78 (5)
6 month weight (kg) 12.12±0.52 (35) 13.98±0.74(4) 12.87±0.65(4)
3 month growth rate (g/d) 87.2±0.04 (40) 104.6±0.01 (5) 73.00±0.02 (5)
6 month growth rate (g/d) 71.00±0.02 (40) 65.2±0.01(4) 69.59±0.03(4)

Proceedings of the Annual Research Review Workshop 2019, BLRI, Savar, Dhaka 1341, January 26-27, 2020
Technical Session V 80
The production performances of different crossbred sheep genotype are presented in Table 1. Birth
weight, body weight at 3 months and 6 month t of Damara-Coastal crossbred genotype were
1.98±0.06 kg, 9.80±0.35 kg and 12.12±0.52 kg, respectively. On the other hand, 3 month and 6
month growth rate of Damara-Coastal crossbred genotype were 87.2±0.04 g/d and 71.00±0.02 g/d,
respectively Birth weight, 3 month weight and 6 month weight of Dorper-Coastal crossbred
genotype were 1.97±0.19 kg, 11.56±0.76 kg and 13.98±0.74 kg, respectively. Beside this, 3 month
and 6 month growth rate of Dorper-Coastal crossbred genotype were 104.6±0.01 g/d and 65.2±0.01
g/d, respectively. Birth weight, 3 month weight and 6 month weight of Parendale-Coastal crossbred
genotype were 1.87±0.86 kg, 8.57±0.78 kg, and 12.87±0.65, respectively. The growth rate of
Parendale-Coastal crossbred genotype for 3 month weight and 6 month were 73.00±0.02 g/d and
69.59±0.03 g/d, respectively. Superior rams and ewes will be selected by the individual
performance. This is on-going research program. The study will be continued until significant
results.

Proceedings of the Annual Research Review Workshop 2019, BLRI, Savar, Dhaka 1341, January 26-27, 2020
Technical Session V 81
Evaluation of new developed lines from BLRI Napier-3 cultivar under saline condition
in coastal region of Bangladesh
MKAlam1, MA Habib
1, NRSarker
1,2, KM Nasiruddin
3 and AM Shohael
4
1Fodder Research and Development Project,
1Bangladesh Livestock Research Institute, Savar, Dhaka 1341,
3Bangabandhu Sheikh Mujibur Rahman Science and Technology University, Gopalganj and
4Department of Biotechnology and Genetic Engineering, Jahangirnagor University, Savar, Dhaka
1442, Bangladesh
Executive summary
The South West region of Bangladesh is covers almost 29,000 km2
(20% of the country), which
contains 30% of the cultivable lands of the country. However, about 53% of the coastal areas are
affected by different levels of salinity, in which approximately 49% of the population is engaged in
farming crops, livestock or aquaculture. Saline intrusion is widely considered to have a negative
impact on agriculture, reducing plant growth and decreasing productivity as well as grazing land and
fodder crops for livestock production. Salinity levels do fluctuate between seasons and between
different geographical areas along the coast. In the view of developing salt tolerant fodder crops,
BLRI Napier-3 cultivar was exposed to gamma rays (Gys) irradiation and performs tissue culture
(micro-propagation) for development of salt tolerant new Napier line(s). Two mutant lines (Line-2
and Line-3) from gamma irradiation and one line (Line-1) from tissue culture (micro-propagation)
along with a control (mother cultivar) were selected for field testing in the Southern part of
Bangladesh. Five innovative farmers were selected and plot size for each line was (10x12) ft. Soil
and irrigated water samples taken in both wet (June-November) and dry seasons (December-May)
from each farmer and were analyzed. Fertilizer dose was estimated on the basis of soil test following
FRG-2012. First harvest was done at 60 days after plantation and subsequent harvests were done at
50 days interval. Plant survivability, biomass yield, plant height, number of tiller per clump, leaf and
stem weight were recorded and analyzed statistically by SPSS 20.0 package.
In wet season, soil EC was estimated as 3.65±0.51 dS/m which significantly (p<0.05) increased as
5.02±0.63 dS/m in dry season. Water EC in dry season (11.98±0.12 dS/m) was significantly
(p<0.01) higher than in wet season (4.95±0.09 dS/m). Survivability, biomass yield, tillering, plant
height and leaf to stem ratio varied significantly (p<0.05; p<0.01) among lines in both wet (June-
November) and dry seasons (December-May) except leaf to stem ratio in dry season. In wet season,
highest survivability (82.90±1.93%), biomass yield (27.52±0.89 ton/ha/cut), tillering (39.52±1.48
numbers/clump) and plant height (62.20±1.13 inch) were obtained in Line-2 and leaf to stem ratio
(1.19±0.03) in Line-1 (Table-1). However, in dry season, highest survivability (74.50±1.25%),
biomass yield (21.13±0.65 ton/ha/cut), tillering (32.04±1.04 number/clump) and plant height
(52.20±1.46 inch) were obtained in Line-2. Highest leaf to stem ratio (1.04±0.04) was obtained in
Line-1 (Table-2).
Table 1. Comparative performance of different lines from BLRI Napier-3 during wet season (June-
November)
Line Parameters
Survivability
(%)
Biomass yield
(ton/ha/cut)
Number of
tiller/clump
Plant height
(inch)
Leaf : Stem ratio
Control 75.25c±2.61 19.26
c±0.68 34.26
b±0.86 51.36
b±1.26 1.15a
b±0.05
Line-1 79.95ab
±1.88 25.99ab
±0.86 37.27a±1.08 59.75
a±1.68 1.19
a±0.03
Line-2 82.90a±1.93 27.52
a±0.89 39.52
a±1.48 62.20
a±1.13 1.01
c±0.03
Line-3 82.80a±1.86 27.20
a±0.61 38.04
a±1.09 60.10
a±1.60 1.03
bc±0.04
Sig. level ** ** ** ** *
abcvalues in the same column with different superscripts differ significantly (*= p<0.001), NS- not significant
(p>0.05

Proceedings of the Annual Research Review Workshop 2019, BLRI, Savar, Dhaka 1341, January 26-27, 2020
Technical Session V 82
Table 2. Comparative performance of different lines from BLRI Napier-3 during dry season
(December-May)
Line Parameters
Survivability
(%)
Biomass yield
(ton/ha/cut)
Number of
tiller/clump
Plant height
(inch)
Leaf : Stem ratio
Control 68.95b±1.64 16.36
c±0.53 27.20
b±0.87 39.20
d±0.95 0.96±0.05
Line-1 72.75a±1.43 19.38
b±0.40 30.71
ab±1.43 43.25
c±1.27 1.04±0.04
Line-2 74.50a±1.25 21.13
a±0.65 32.04
a±1.04 52.20
a±1.46 0.93±0.06
Line-3 73.25a±1.09 20.35
ab±0.60 31.90
b±1.27 48.30
b±1.28 0.90±0.04
Sig. level ** ** * ** NS
abcvalues in the same column with different superscripts differ significantly (*=p<0.01, **= p<0.001), NS- not
significant (p>0.05).
The results revealed that mutant lines (Line-2 and Line-3) and tissue culture line (Line-1) performed
better than control line in terms of yield and plant morphology in both wet (June-November) and dry
seasons (December-May).

Proceedings of the Annual Research Review Workshop 2019, BLRI, Savar, Dhaka 1341, January 26-27, 2020
Technical Session V 83
Feeding of vegetable waste silage to beef cattle at farm level
NG Das, N Sultana and KS Huque
Animal Production Research Division, Bangladesh Livestock Research Institute, Savar, Dhaka 1341,
Bangladesh
Executive summary
Animal Production Research Division, Bangladesh Livestock Research Institute, Savar, Dhaka-1341
The vegetable wastes (VW) that pollute environment was reported earlier to be ensiled successfully
and fed to lambs as a basal diet. Therefore, the study was conducted with the objectives to
demonstrate ensiling process of vegetable wastes and its feeding practices in a beef cattle farm. The
VW – including cabbage, cauliflower, reddish, carrot and other leaves at 31, 24, 22, 20 and 3%,
respectively, as found during collection – was collected by a beef cattle farmer, Savar, Dhaka and
ensiled by shredding, dewatering and adding molasses and chopped rice straw (2-3 cm) at 85:5:10
ratio in 65 kg plastic drums for 150 days under the supervision of Bangladesh Livestock Research
Institute. Then, twelve native bulls of 2-2.6 years old with average initial live weight (LW) of 219
(±26) kg were randomly allocated into two groups. Maize silage, a conventional feedstuff of the
farm, was fed ad libitum as basal diet to one group (control), while 50% maize silage was replaced
with VW silage in another group. Fresh maize silage and VW silage was mixed manually at 1:1
ratio, and offered to bulls. A common concentrate mixture of conventional ingredients containing
wheat bran, rice polish, maize broken, soybean meal, DCP and common salt was fed at 1.5% of LW
of bulls. The trial was conducted for 56 days. Samples of feedstuffs and refusals were collected
every other day during the whole trial period and stored at -20⁰C. At the end of trial, samples were
thawed at room temperature and composited before analyzing chemical composition. During
digestibility trial, dung samples were weighed at 0700h daily and about 20% of them were collected
and stored at -20⁰C. The dung samples were processed and analyzed according to the same methods
followed for feedstuffs and refusals. The data were analyzed by Paired sample t-test using SPSS-
11.5 software. The chemical compositions of diets are presented in the Table 1.
Table 1. The chemical composition of diets (% DM)
Chemical composition Maize silage Mixed silage Concentrate mixture
DM (% fresh) 23.2 25.8 91.3
OM 93.3 91.6 88.4
CP 8.6 11.2 17.1
DM, dry matter; OM, organic matter; CP, crude protein; Mixed silage, mixture of fresh maize silage and
vegetable waste silage at 1:1 ratio.
The intake of nutrients and live weight gain of bulls are presented in the Table 2. The results of the
study indicate that the dry matter (DM) intake of bulls - neither total, nor from roughage or
concentrate separately - differ (P>0.05) between the groups. The daily DM intake represented about
2.95 and 3.27% LW of bulls, respectively in the maize and mixed silage groups. Similarly, organic
matter (OM) intake between groups was also similar (P>0.05).
Table 2. Intake and digestibility of nutrients of bulls
Parameters Maize silage Mixed silage SE P-values
DM intake from roughage, kg/d 4.1 4.6 0.264 0.094
DM intake from concentrate, kg/d 2.85 3.25 0.097 0.051
Total DM intake, kg/d 6.9 7.8 0.620 0.066
DM intake, %LW 2.95 3.27 0.658 0.917
OM intake, kg/d 6.3 7.1 0.511 0.089
CP intake, g/d 838 1070 10473 0.003
Initial LW, kg/d 216.7 221.1 730 0.779
Final LW, kg/d 254.0 258.8 705 0.759
LW gain, g/d 667 673 4168 0.876
DM, dry matter; OM, organic matter; CP, crude protein; Mixed silage, mixture of fresh maize silage and
vegetable waste silage at 1:1 ratio; LW, live weight; SE, standard error;

Proceedings of the Annual Research Review Workshop 2019, BLRI, Savar, Dhaka 1341, January 26-27, 2020
Technical Session V 84
The crude protein (CP) intake was significantly higher (P<0.01) in the bulls fed mixed silage diet,
compared to maize silage diet. The higher CP intake might be due to higher CP values of mixed
silage (Table 1). The difference between initial and final LW of bulls in both groups was similar
(P>0.05). As a result, the daily LW gain of bulls between diets was also similar (P>0.05). It may be
concluded that replacing of maize silage at 50% in the diet of bulls at farm level did not effect on
their dietary intake and live weight gain.

Proceedings of the Annual Research Review Workshop 2019, BLRI, Savar, Dhaka 1341, January 26-27, 2020
Technical Session V 85
Field testing of BLRI Feed Master mobile application in selective locations of
Bangladesh
N Sultana1, MA Kabir
2, MFH Miraz
2, GK Deb
2, MR Amin
3 and MA Habib
4
1 Training, Planning and Technology Testing Division,
2 Biotechnology Division,
3 Conservation and
Improvement of Red Chittagong cattle project and 4 Fodder Research and Development project, Bangladesh
Livestock Research Institute, Savar, Dhaka 1341, Bangladesh
Executive summary
"BLRI Feed Master" is a farmer´s and extension personnel friendly android application. However,
the efficacy of this technology has not yet been justified in field level. Considering this fact, the
current research was designed to measure the efficacy, socio-economic impact and identifying the
constraints of adaptation and sustainability of this technology at farmer's level as well as
disseminating technology in field level. In the previous year, a baseline survey was conducted
through a pretested questionnaire regarding the existing farming system of the farmers in Dhaka,
Rajshahi and Sirajganj regions with a sample size 100 in each location. However, in this year
efficacy of this application was evaluated by adopting different ways. Firstly, three days trading on
the application was given to 19 District Livestock Officers working as a livestock expert in field
level and efficacy of the software was evaluated through a pretested questionnaire. Secondly, a field
demonstration of Feedmaster technology was conducted on Rajabarihat and Savar upazilla. For field
demonstration 5 farmers were selected form each location and hands-on training was provided.
Three months close supervision of farmers was conducted on each location. During close
supervision feed, vaccination and production cost and income from milk as well as milk
composition was recorded and compared with an existing condition. Finally, data were analyzed by
using SPSS software version 13.
From the data analysis, it was observed that according to livestock expert BLRI Feedmaster
application was very much helpful (100%) for ration formulation, animal weight calculation and
technology dissemination in field level. However, only 15.79% and 10.52% expert were
recommended for some modification on ration formulation and animal weight feature respectively.
On ration formulation feature adding alternative feed ingredient option with nutritional composition
was recommended. Whereas, on weight feature accuracy of calculation along with adding
calculation of meat production option was recommended. However 63.16% and 63.15% expert
recommended for no modification on ration and weight feature of application respectively. On the
other hand, 89.47% of livestock expert believe that vaccination was helpful for the farmers at the
field level. Among them, 47.37% recommended for modification of vaccination feature of the
application. All of them (100%) recommended that this application is helpful for easy technology
transfer on field level. Furthermore, applying this technology on field level reduced time, cost and
visit significantly (P<0.001) (Table 1).
Table 1. Effect of application on TCV (Time, cost, visit)
Parameter Existing condition Using application F value
Time (Minutes) 270±34.30 5.29±1.50 59.42***
Cost (Taka) 235.71±59.42 3.21±1.51 15.29***
Visit (Time ) 3.07±0.38 0.36±0.13 44.43***
***= P<0.001
Moreover, during field testing, it was observed that before adopting BLRI FeedMaste farmers were
providing an average 5.6 kg feed /animal and price of mixed feed was 29.75 TK./kg. However, after
adopting the software in farm-level concentrate feed supply was reduced 12.73% per animal/day by
providing optimum nutrition to the animals. On the other hand, feed price was reduced by 5.88%
per kg than the existing system by formulating balanced ration on 28 TK/kg. Moreover, the average
milk production of farmers increased by 12.2. % per animal /day along with milk fat percent was
significantly increased (P<0.001). Although another milk component such as Protein, SNF and
Lactose was increased, but statically non-significant.

Proceedings of the Annual Research Review Workshop 2019, BLRI, Savar, Dhaka 1341, January 26-27, 2020
Technical Session V 86
Table 2. Effect of application on milk composition
Parameter Existing system Using application F value
Fat (%) 4.12±0.13 4.91±0.14 15.014***
SNF (%) 3.65±0.07 3.67±0.06 0.018NS
Protein (%) 10.26±0.11 10.30±o.12 0.070NS
Lactose (%) 5.39±0.20 5.41±0.21 0.006NS
***= P<0.001, NS= No significant
This is the second year of this research project. In this year the efficacy of BLRI FeedMaster
technology on field level was conducted. However, the assessment of socioeconomic importance
was not conducted due to time limitation. Moreover, BLRI FeedMaster was uploaded on Google
play store for disseminating of this technology. From Google play store it was reported that this
application was downloaded by more than 10000 downloaders and rated as 4.8 on the scale of 5. In
near future socioeconomic impact and further up-gradation of this application will be conducted.

Proceedings of the Annual Research Review Workshop 2019, BLRI, Savar, Dhaka 1341, January 26-27, 2020
Technical Session V 87
Adaptation of somatic cell nuclear transfer (SCNT) technology for cattle in
Bangladesh
GK Deb#, MA Kabir, MFH Miraz and SMJ Hossain
Biotechnology Division, Bangladesh Livestock Research Institute, Savar, Dhaka 1341, Bangladesh
#Correspondence at [email protected]
Executive summary
Somatic cell nuclear transfer (SCNT) technology is applying to multiply genetically elite farm
animals, to produce transgenic animals with the desired trait, or to conserve endangered species.
Cloning may also be used to increase the accuracy of selection and the rate of genetic progress in a
breeding programme through speeding up the dissemination of genes from animals of exceptionally
high genetic merit to the commercial population and to reproduce transgenic animals. SCNT
requires combination of some technologies including oocyte aspiration, in vitro maturation (IVM),
enucleation, donor cell preparation, activation of reconstructed cell, in vitro embryo culture and
embryo transfer into the recipient’s uterus. Oocyte aspiration, in vitro maturation, in vitro embryo
culture and embryo transfer protocols has already been adopted at Biotechnology Laboratory in
BLRI. Considering the above facts, the proposed research project aimed to adopt SCNT technology
at the same laboratory in BLRI. For this purpose, ovaries were collected from slaughtered cattle.
Cumulus-oocyte-complexes possessing an even cytoplasm and covered with minimum three layers
of compact cumulus cells was selected for IVM and placed into a 4-well culture dish containing
IVM media (TCM199 + 10% fetal bovine serum, 1 μg/mL β-estradiol, 10 μg/mL FSH, 0.6-mM
cystein, and 0.2-mM sodium pyruvate) for 24 hr (5% CO2 in air at 38.5°C with maximum
humidity). After maturation, oocytes were denuded by gentle pipetting and treatment with trypsinase
enzyme for complete removal of cumulus cells. For the development of fibroblast cell line, ear
tissue was collected from slaughtered cattle in saline solution. The ear tissue was cleaned and
washed three times with Dulbecco’s phosphate-buffered saline (D-PBS; Invitrogen, Carlsbad, CA),
finely cut into 1-2 mm pieces, and digested in 0.25% (v/v) Trypsin-ethylene diaminetetra acetic acid
solution at 370C for 1 hour. Thereafter, cells were washed three times with donor cell culture
medium (Dulbecco’s modified Eagle’s medium [DMEM; Gibco] supplemented with different (0,
10, 15 and 20) percentages of [v/v] fetal bovine serum , 1% [v/v] l-glutamine, 1% [v/v] nonessential
amino acids, and 1% [v/v] penicillin–streptomycin [P/S]), centrifuged at 1000 rpm for 2 minutes and
seeded into a 100 mm plastic dish (Becton Dickinson, Franklin Lakes, NJ). Seeded cells were
subsequently cultured in donor cell culture medium at 370C in a humidified atmosphere of air
containing 5% CO2 for 15 days. After 15 days % of the viable cell were counted using
hemacytometer followed by adding 0.4% solution of trypan blue dye. A 0.1 mL trypan blue stock
solution was added to 1 mL of cells.
From data (Table 1), it was observed that FBS has a positive effect on fibroblast cell growth.
Fibroblast cell culture adding with 15% FBS showed the highest viable cell count (96.39%). It was
recommended that cell viability should be at least 95% for healthy log-phase cultures. Hence, this
study has been suggesting addition of 15% FBS into the cell culture medium for preparation of
donor nucleus. Moreover, the viable cell number was highest (6.74×10⁵) in culture media
containing 15% FBS. Moreover, skill on the preparation of holding and injection pipette for
enucleation of recipient oocyte and injection of donor nucleus were developed during the
experimental period. However, research on enucleation of recipient oocyte and injection of donor
nucleus into the recipient oocyte is on-going. It was a new project with an objective to adopt SCNT
technology at BLRI. Hence, baseline activity was conducted. After completion of this project,
SCNT technology will be adopted which may help to produce transgenic animal in near future.
Table 1. Effect of level of FBS on cell viability during fibroblast cell culture
% FBS % Viability Viable cell/ml
0 0 0
10 90.0% 1.98×10⁵
15 96.93% 6.74×10⁵

Proceedings of the Annual Research Review Workshop 2019, BLRI, Savar, Dhaka 1341, January 26-27, 2020
Technical Session V 88
20 94.59% 3.90×10⁵
Developing a model for up-scaling livelihood of the rural poor farmers by rearing Red
Chittagong Cattle
SMJ Hossain12
, MA Kabir1, MF Afroz
1, MR Amin
2, MH Rahman
2
1Biotechnology Division and
2Conservation and Improvement of Red Chittagong cattle project,
Bangladesh Livestock Research Institute, Savar, Dhaka 1341, Bangladesh
Executive summary
There are so many indigenous farm animal genetic diversity of Bangladesh. Among the indigenous
farm animals non-descript Deshi, Red Chittagong Cattle (RCC) are notable of them. Conservation of
promising indigenous cattle genetic resources through utilization following pure breeding program
and farmer-managed in-situ approaches may work for cattle development and rural livelihood
enhancement in Bangladesh. So, it is an important issue that RCC needs to be conserved in-situ by
keeping them into the rural farmers’ house. Besides, increasing the production potentiality of this
type should be considered, so that rural poor farmer can lead their live more securely. Considering
these facts, present research work is designed to develop a model for the up-scaling livelihood of the
rural poor people by keeping RCC and conserve RCC in the farmers’ house (in-situ). For this
purpose, 200 farmers from four Upazilas (Anowara, Patiya, Sakhipur and Godagari) of 3 Districts
(Chattogram, Rajshahi and Tangail) under the project area were selected and baseline survey was
conducted. The selected farmers were getting some privileges provided by the project like training,
RCC semen, vaccine and medication, etc. These privileges will be continued and before end of the
project final impact assessment will be conducted based on some livelihood, productive and
reproductive parameters such as household income, expenditure, deposits/savings money,
permanent assets, housing of cattle, feeds and feeding system, milk production, body weight,
production of healthy calves, disease and health management, etc. From the base line survey it was
found that from 200 sampled farmers male and female farmers were 84.73% and 15.26 %
respectively. About 72.24 % farmers were found educated and 27.76% were uneducated.
Agriculture was found as the main occupation of the farmers and 47.07% farmers were directly
involved in agriculture. Livestock farm, laborer, Business, job, fisheries, remittance and others
occupation were found 24.55%, 11.21%, 11.48%, 4.47%, 0%, 0.34% and 0.27% respectively.
Average land holding per household was 97.87 decimal. Average cattle population per household of
indigenous, RCC and crossbred were 4.98, 1.90 and 6.90 respectively. Semi-pakka, katcha, full tin
and shabby housing of cattle were found 10.80%, 24.32%, 24.05% and 40.81% respectively. It was
observed that 27.48 %, 32.65% and 39.87% households’ cattle rearing systems were stall feeding,
half grazing and full grazing system respectively. Cleaning and hygienic management such as
regular cleaning, regular washing and regular disinfection performed by the farmer about 83.70%,
82.87% and 27.29% respectively. About 8.79% and 13.44% farmer supplied feeds with grass-straw
and grass-concentrate respectively. About 34.67% farmers used natural insemination and 48.54%
used artificial insemination and 16.78% used both natural and artificial methods. The average
income from indigenous, RCC and crossbred cattle were found BDT 144985.66, 73748.00 and
312208.33 respectively in the last one year. The higher amount of income was generated from
crossbred cattle. The average milk yield (lit/day) were found 2.26, 1.33 and 9.86 from indigenous,
RCC and crossbred cow respectively. It was also found that average income from milk selling were
BDT 18418.00, 15965.00 and 188195.00 for indigenous, RCC and crossbred cow in the last one
year respectively. The average annual family income and expenditure were BDT 236933.33 and
195306.67 respectively. Average savings was BDT 41626.66 in the study area. About 79.37%
farmers had deposited and 9.95% had deficit annually. About 10.67% farmers had found that
income and expenditure were equal. This is an ongoing research and data on productive and
reproductive parameters, disease incidence, location wise distribution and marketing channel should
be discussed in the final assessment. From the findings of baseline data it was concluded that
agriculture was the main occupation of the farmers. Average cattle population per household of
RCC was lower than indigenous and crossbred cattle. In existing system management and feeding

Proceedings of the Annual Research Review Workshop 2019, BLRI, Savar, Dhaka 1341, January 26-27, 2020
Technical Session V 89
system was not very well and income from RCC was lower than the indigenous and crossbred cattle.
Finally, the impact of the model will be assessed before end of the project.

Proceedings of the Annual Research Review Workshop 2019, BLRI, Savar, Dhaka 1341, January 26-27, 2020
Technical Session V 90
Development of animal ID and recording system of RCC and their graded cattle
through computer and mobile application technology
SM Jahangir Hossain1, MA Kabir
2, MF Afroz
2, MR Amin
1and MH Rahman
1
1Conservation and Improvement of Red Chittagong cattle project,
2Biotechnology Division, Bangladesh
Livestock Research Institute, Savar, Dhaka 1341, Bangladesh
Executive summary
Numbering animal properly for identifying as well as recording different features of productive and
reproductive performance of individual and pedigree are the key tools for improving genetic
potentiality along with the production of livestock. In developed countries, farmers are recording
animals properly by using different software on electronic devices. However, in Bangladesh record
keeping is a tedious job for farmers as well as lack of willingness to record properly because there is
lack of availability of farmer-friendly recording system. Considering these facts, the present activity
was conducted to develop a smart animal recording system through a combination of mobile and
computer applications. Animal population, phenotypic feature; breeding and reproductive condition,
growth and milk production, health condition, feeding practice can be accurately recorded with the
application of developed recording systems. Before recording individual animal data with
developed system, animal numbering was conducted. For this purpose, 514 animalsunder6 project
areas were numbered using tattoo marker. Then baseline data about animal type, source of cattle and
milk production of individual animals were collected and analyzed using SPSS statistical software.
From the baseline data, it was observed that, among selected animals total RCC were 49.60% and
the highest percentage of RCC was in Hathazari Upazilla. Among selected animals 81.90% were
adult where as 18.10% animals were growing. It was also found that 72% cattle were owned by the
farmers and 26% was purchased from local market. From the baseline data, it was also revealed that
among selected animals overall average milk production of RCC was 2.36litter/animal/day but the
highest was 3.07±0.22 litter/animal/day in Anwara Upazilla. Nevertheless, the highest milk
production of RCC was 8.00 litter/animal/day in Anwara Upazilla and lowest milk production was
found 1.00 litter/animal/day in Chandanish, Hathazari, Patiya and Sandwip. After completion of the
project farmers will take part in keeping their animals’ records by their smart cell phone and thus
enabling accumulation of all records in a central RCC recording server. Finally, the selection of
superior sires and dams with high genetic merit and controlling breeding road map will be
established
Table 1. Types and source of cattle in the study areas
Areas
Types of animal Sources of cattle
Local/Non
descriptive (%)
RCC cattle
(%)
Growing
(%)
Adult (%) Owned Purchased Others
Anwara 62.50
(35)
37.50
(21)
33.90
(19)
66.10 (37) 76.80
(43)
16.10
(9)
7.10 (4)
Chandanish 11.30
(7)
88.70
( 55)
30.60
(19)
69.40 (43) 100.00
(62)
0.00
(0)
0.00 (0)
Hathazari 1.20
(1)
98.80
( 81)
41.50
(34)
58.50 (48) 80.50
(66)
19.5
(16)
0.00
(0)
Patiya 57.00
(61)
43.00
(46)
19.60
(21)
80.40 (86) 91.60
(98)
6.50
(7)
1.90 (2)
Sandwip 63.20
( 67)
36.80
(39)
0.00
(0)
100
(106)
38.70
(41)
61.30
(65)
0.00 (0)
Jaintiapur 87.10
(88)
12.90
(13)
0.00
(0)
100
(101)
59.40
(60 )
40.60
(41)
0.00 (0)
Total 50.40
(259)
49.60
(255)
18.10
(93)
81.90
(421)
72.00
(370)
26.80
(138)
1.20
(6)
Note: Number in the parenthesis indicates number of cattle

Proceedings of the Annual Research Review Workshop 2019, BLRI, Savar, Dhaka 1341, January 26-27, 2020
Technical Session V 91
Table 2: Milk production performance of RCC in different project areas
Areas
Average milk production
(Litter/animal/day)
(Mean±SE)
Highest milk production
(Litter/day)
Lowest milk production
Anwara 3.07± 0.22 8.00 1.25
Chandanish 2.17±0.05 3.50 1.00
Hathazari 1.83±0.97 5.00 1.00
Patiya 2.27±0.12 4.00 1.00
Sandwip 2.12±0.24 3.00 1.00
Jaintiapur 2.70±0.12 3.00 2.50
Overall 2.36±0.45 8.00 1.00

Proceedings of the Annual Research Review Workshop 2019, BLRI, Savar, Dhaka 1341, January 26-27, 2020
Technical Session V 92
Development of herd book based RCC recording system at the community level
SMJ Hossain1, MA Kabir
1, MF Afroz
1, MR Amin
2, MH Rahman
2, SF Shejuty
2, MZ Hossain
2, MR
Hassan2, S Sultana
2, T Akter
2, KT Tahira
2 and S Sultana
2
1Biotechnology Division and
2Conservation and Improvement of Red Chittagong cattle project,
Bangladesh Livestock Research Institute, Savar, Dhaka 1341, Bangladesh
Executive summary
Red Chittagong Cattle (RCC) is one of the promising breed of cattle in Bangladesh. The habitat of
these cattle is greater Chattagram and hill tracts. Notably, there is no evidence of foreign blood in
RCC which have been developed in the locality by natural selection and breeding among themselves
for a long historic period. But, this potential variety is under the threat of extinction due to
indiscriminate crossbreeding across the country, especially in their home tract. Thus, an in-depth
study on this type of cattle is our national demand in the perspective of conservation and
improvement of local animal genetic resources (AnGRs). Therefore, Bangladesh Livestock
Research Institute (BLRI) had been taken initiative for conservation and further improvement of
RCC through selective breeding and applying biotechnological tools since 2001. But due to
interruption of succeeding activity for a long period, the outcome has not yet been reached up to the
mark of expectation. Recently, BLRI has been implementing second phase of the previous research
work taking a wider range of areas in the country. Community based breeding program is being
conducted for the conservation and improvement of RCC. Pedigree & recording system is the
utmost breeding tool for genetic improvement of livestock. Moreover, herd book is an essential
component for the successful breeding operation of the breeding farm or community breeding
programs. Considering this fact, the objective of this activity was not only adopting farmers for
keeping records of their animals but also establishing a central information recording hub of Red
Chittagong Cattle.
For this purpose, a farmer’s friendly herd-book was formulated by analysis of different forms of
herd book used by farmer and their recording system. Then the hard book was pretested and
disseminated to the selected farmers of the project area. Moreover, Animals of the farmers were
numbered using tattoo machine. A total 300 farmers were selected from six project areas (Anwara,
Chandanish, Hathazari, Patiya, Sandwip, Jaintiapur) having local or RCC cattle and 514 animals
were numbered. To accustom with recordkeeping on herd-book, three days of training in each
project area was conducted. Moreover, with the help of scientific officer and community assistant
proper recording was monitored. After baseline data collection, it was analyzed using SPSS
software.
Table 1. AI activity under six project areas
After data analysis, it was observed that (Table:1) among selected animals, 50.40% were non-
descriptive and 49.60 % were RCC cattle. Non descriptive cattle were dominating on Jaintiapur,
Sandwip, Anwara and Patiya. However, RCC cattle was dominating on Hathazari and Chandanish.
For genetic up-gradation, artificial insemination was conducted using frozen seamen obtained from
RCC bull NO. 387,499 and 323. AI activity was on going and still now a total of 99 AI was
conducted. Among them, highest number of AI was conducted in Anwara but lowest number was
Upazilla AI using RCC
semen (%)
Natural breeding
Using local RCC
bull (%)
Repeated
breeding (%)
Service
/conception rate
Anwara 50.00 (28) 5.40 ( 3) 25.80 (8) 1.55
Chandanish 21.00 (13) 0.00 (0) 0.00 (0) 1
Hathazari 18.30 (15) 1.20 (1) 12.50 (2) 1.14
Patiya 26.20 (28) 0.00 (0) 20.00 (7) 1.33
Sandwip 12.30 (13) 0.00 (0) 0.00 (0) 1
Jaintiapur 2.00 (2) 0.00 (0) 0.00 (0) 1
Total 19.30 (99) 0.80 (4) 15.50 (17) 1.002

Proceedings of the Annual Research Review Workshop 2019, BLRI, Savar, Dhaka 1341, January 26-27, 2020
Technical Session V 93
Jaintiapur and the values were 50% and 2% respectively of total cattle numbered.Moreover, RCC
bull were using for reproduction but the value was very poor (0.80%). Among the project area
service per conception rate was higher in Anwara and among inseminated cow, 25.80% showed
repeated heat. The second highest was in Patiya (1.33 %). Besides breeding, vaccination and
deworming activity was on-going. After completion of the project, farmers of the selected
community will be adopted to keep in their animals’ records in the herd book, which will help in the
selection of superior parents for producing progeny with higher genetic worth. Also, this will help in
designing the breeding road map in the future.

Proceedings of the Annual Research Review Workshop 2019, BLRI, Savar, Dhaka 1341, January 26-27, 2020
Technical Session V 94
Development of starter culture for yoghurt
SMJ Hossain1, MA Kabir
1, SM Amanullah
1, MM Rahman
1, GK Deb
1 and MH Rashid
2
1Biotechnology Division, Bangladesh Livestock Research Institute, Savar, Dhaka 1341 and
2Department of Animal Breeding and Genetics, Bangladesh Agriculture University,
Mymensingh 2202,
Bangladesh
Executive summary
Yoghurt is a fermented dairy product, obtain from control fermentation of milk by a selective
culture of lactic acid bacteria (LAB) produced a flavor and typical aroma. To produce a good quality
yogurt, starter culture containing desirable live viable food grade LAB is pre requisite. However,
unlike developed countries, packed starter culture in sachet is not available in local market in
Bangladesh. Consumers are dependent mostly on traditional yogurt/dahi, bacterial type and contents
of which are non-descriptive and often not viable for further use as starter culture and not cost-
effective. Considering these facts, the present research was undertaken to develop a suitable starter
culture for yogurt/dahi preparation at consumer’s home.
In the previous year Lactobacillus acidophilus and Streptococcus thermophiles, bacteria were
identified using genus and species-specific 16S rDNA primer sequence from yogurt/dahi sample
collected from Dhaka. However, in this year fourteen yogurt samples were collected from the local
market of Rajshahi, Bogra, Khulna and Bhola and cultured on MRS and M17 selective Agar culture
media. Colony-forming unit (CFU) on selective culture media were calculated and Lactic acid
bacteria was initially identified by performing catalase and Gram's staining test. Catalase negative,
Gram's staining positive bacteria were isolated and purified through sequential sub-culture for
further identification. DNA was extracted from isolated bacteria by hot cold method, quantified by
Nanodrop 2000c specto-photometer and identified by PCR using genus and species-specific 16S r
DNA primer sequences.
After serial dilution, spreading on selected culture media, viable bacteria were observed for all
yogurt samples. Viable bacterial colony number on culture plate ranged from 14 x 10-6
to 224 x10-6
CFU/ml on MRS culture media and 60 x 10-6
to 278 x 10-6
CFU/ml on M17 culture media. Based on
Catalase and Gram's staining test, twenty bacterial colonies were isolated. Among them, 14 colonies
were rod shaped and the rest of them were cocci shaped. Among rod shaped four colonies showed
positive application for lactobacillus acidophilus and five bacteria showed positive application for
Lactobacillus bulgaricus with genus property nine isolated bacterial colonies were belong to
Lactobacillus genus whereas five of them were belong to Befedobacterium genus. Among cocci
shaped bacteria four colonies were belonged to Streptococcus genus. However, among them one
bacteria colony was identified as Streptococcus thermophiles. Isolation and identification process is
going on for other bacteria suitable for starter culture.

Proceedings of the Annual Research Review Workshop 2019, BLRI, Savar, Dhaka 1341, January 26-27, 2020
Technical Session V 95
Conservation and improvement of Munshiganj cattle
SMJ Hossain1, MFH Miraz*
1, MF Afroz
1, GK Deb
1 and AKFH Bhuiyan
2
1Biotechnology Division, Bangladesh Livestock Research Institute, Savar, Dhaka 1341 and
2Department of Animal Breeding and Genetics, Bangladesh Agriculture University,
Mymensingh 2202,
Bangladesh. *Correspondence at [email protected]
Executive summary
Munshiganj cattle (MC) are predominantly found in Munshignaj and its adjacent areas. Farmers are
replacing MC with high yielding crossbred cattle and population of MC is rapidly declining in their
breeding tract. As this variety is only concentrated in a certain area, so conservation in its pure form
and subsequent development is necessary. The on-going artificial insemination programme
throughout the country is also popular in Munshiganj district. Despite having good quantity of milk
production potentiality of MC farmers are yet intend to inseminate their pure MC with foreign
germplasm in order to get more milk. Considering the above facts, Bangladesh Livestock Research
Institute (BLRI) has taken an initiatives to conserve, characterize and subsequent improvement of
MC germplasm at their own habitat and BLRI. For in situ conservation, a Munsiganj cattle rearing
community was established in Munshiganj district having at least one MC cow. A mini nucleus herd
was established in BLRI and this herd has been enlarged with a total population of 32 animals
including 10 cows, 6 breeding bulls, 8 heifer calves and 8 bull calves. Different productive and
reproductive performance was recorded in the nucleus herd. For conservation of this variety to
regain its purity in the farmer’s house artificial insemination is ongoing in their original breeding
tract with pure Munshiganj frozen semen. Some non-descript indigenous cattle are also selected for
AI to increase the population of MC. Following AI, 45 calves has been born so far and 220 AI was
done with an average conception rate of 52.19%. Among 220 AI performed 190 AI was performed
in MC and 40 Munshiganj calf has born so far in which 16 is male calf and 24 female calf.
Table 1. Artificial insemination statistics of MC in Munshiganj community
Cattle type No of AI
performed
No of animal
conceived
Conception rate
(%)
No of calf
born
Calf sex
Male Female
Munshiganj cattle 190 97 51.05 40 16 24
Indigenous cattle 30 16 53.33 5 2 3
Total 220 113 51.36 45 18 27
The colour of body-coat was mostly creamy to dull pinkish and looked different from other
indigenous varieties of Bangladesh. The average birth weights of male calves and female calves
were found 19.47 and 16.14 kg in on station. In on farm, birth weight of male and female calves
were found 16.91 kg and 14.32 kg respectively (Table 2). Average lactation length (LL), daily milk
yield (DMY), Gestation length (GL), postpartum heat period (PPH) and number of services per
conception (NSPC) were found 218.82 days, 4.13 L, 279.17 days, 63.42 days and 1.58 for on station
and 210.58 days, 3.03 L, 279.84 days , 70.89 days and 1.67 for on farm respectively.
Table 2. Comparative Productive and reproductive performances of Munshiganj cattle in on station
on farm
Characteristics On station (Mean±SD) On farm (Mean±SD)
Body weight of male calf (kg) 19.47±0.79 (n=8) 16.91±1.24 (n=16)
Body weight of female calf (kg) 16.14±0.52 (n=8) 14.32± 0.79 (n=24)
Lactation length (Days) 218.82±16.78 (n=10) 210.58±14.44 (n=49)
Daily milk yield (L) 4.13±0.39 (n=10) 3.03±0.57 (n=73)
Gestation period (days) 279.17± 3.76 (n=10) 279.84±1.34 (n=49)
Postpartum heat period (days) 63.42± 22.08 (n=10) 70.89±9.32 (n=73)
No of service per conception 1.58± 0.79 (n=10) 1.67± 0.67 (n=73)
The current ongoing AI programme in the community will ensure availability of potential
Munshiganj cattle conforming pure characteristics ready in hand for sustaining their unique features,
so that it can be disseminated in their original breeding tract.

Proceedings of the Annual Research Review Workshop 2019, BLRI, Savar, Dhaka 1341, January 26-27, 2020
Technical Session V 96
Development of low input community breeding model for Red Chittagong Cattle
SMJ Hossain1,2
, MFH Miraz*1 and GK Deb1
1Biotechnology Division and
2Conservation and Improvement of Red Chittagong cattle project,
Bangladesh Livestock Research Institute, Savar, Dhaka 1341, Bangladesh. *Correspondence at
Executive summary
Red Chittagong Cattle (RCC) is one of the promising variety of cattle in Bangladesh. The habitats of
these cattle are greater Chattagram and hill tracts. This variety evolved in the locality by natural
selection and breeding among themselves for a long historic period. Purebred populations are
declining due to indiscriminate breeding within the native stock and crossbreeding with exotic
breeds. In order to maintain the purity of Red Chittagong Cattle, it is important to maintain the
purity during breeding with either natural mating or artificial insemination. Bangladesh Livestock
Research Institute (BLRI) had been taken initiative for conservation and further improvement of
RCC through selective breeding and applying biotechnological tools since 2001. Community based
breeding program have been considered as a sustainable option to conserve and to improve RCC
production under smallholder conditions and in low-input system. Local communities have a vested
interest in all the natural resources on which their livelihoods depend. As a result, communities are
the best places of conserving local farm animal genetic resources. Thus, the present study was
designed with the objectives to develop a sustainable community led pure breeding program for Red
Chittagong Cattle. For the formation of model RCC community, farmers having at least one RCC
cow or heifer preferably nearest peripheral circle was selected and registered under the project in the
selected upazilla of Chattogram division. Other than Chattogram division, farmers having at least
one pure indigenous cow or heifer preferably nearest peripheral circle was selected and registered
under the project. All animals of the registered farmers of the community were permanently marked
with tattoo machine. To ensure semen of pure meritorious RCC bull for the community members,
semen collection, evaluation and cryopreservation was done at BLRI. Six (6) pedigree tested pure
meritorious RCC bull was supplied to DLS for production of frozen semen. Both BLRI and DLS
ensure the supply of RCC frozen semen to the community on regular basis for artificial insemination
to maintain purity of Red Chittagong cattle.
Table 1. Semen quality parameter of RCC bull semen (mean ± SD)
Parameter Volume Concentration Total motility Progressive motility Static motility
Fresh semen 3.9±1.2 1638.4±93.5 77.7±13.5 57.6 ± 14.4 22.4±13.5
Frozen semen -- -- 67.6±2.9 46.9±2.8 32.1±3.2
Table 2. Community breeding statistics of Red Chittagong Cattle
Project area No. of farmer
registered
Registered animal
(RCC+Indigenous)
Adult cow
(%)
RCC
(%)
No. of AI
performed
AI coverage
(%)
Patia 50 107 80.4 (86) 43.0 (46) 23 26.74
Chandonaish 50 62 69.4 (43) 88.7 ( 55) 12 27.91
Anowara 50 58 66.1 (37) 37.5 (21) 18 48.65
Satkania 50 75 69.3 (52) 60 (45) 18 34.62
Hathazari 50 82 58.5 (48) 98.8 ( 81) 27 56.25
Swandip 50 106 100 (106) 36.80 (39) 30 28.30
Total 300 415 77.11(320) 58.31(242) 128 40
The mean volume, concentration, total, progressive, and static motility of fresh semen were
3.94±1.15, 1638.42±923.51, 77.68±13.48%, 57.59 ± 14.42%, 22.37±13.47 % respectively. The
mean total, progressive, and static motility of frozen semen were 67.57±2.99, 46.86±2.79%,
32.12±3.24 % respectively (Table 1). Till date 15000 doses of frozen semen has been prepared and
distributed and 128 AI (Patia=23, Chandanaish=12, Anowara= 18, Satkania =18, Hathazari=27,

Proceedings of the Annual Research Review Workshop 2019, BLRI, Savar, Dhaka 1341, January 26-27, 2020
Technical Session V 97
Swandip =30) were done so far in the project area (Table 2). A total 300 farmers were selected in 6
upazilla of Chattogram district where 415 animals (Adult cow, heifer, bull and calf) were registered.
Among the registered animals 77.11% were adult cow and 58.31% were registered as RCC. Among
the registered adult cow, overall 40% animals were inseminated so far by using pure RCC semen
(Table 2). No calves has so far born yet. All the reproductive data of the animals are being recorded
in a herd book maintained by community farmers. The ongoing artificial insemination programme
may results more number of graded RCC cattle in the community that will eventually results
conservation of this germplasm in the community.

Proceedings of the Annual Research Review Workshop 2019, BLRI, Savar, Dhaka 1341, January 26-27, 2020
Technical Session V 98
Empowerment factors of rural women through homestead native sheep rearing in
Hilly area at Naikhongchari
MA Hemayet, M Ershaduzzaman, MA Alam, MA Hossain and MKH Mazumder
Bangladesh Livestock Research Institute, Savar, Dhaka 1341, Bangladesh
Executive summary
This paper attempts to assess the empowerment factors of rural women of the community people at
Naikhongchari upazilla in Bandarban district of Bangladesh through establishing the BLRI
improved native sheep rearing. Rural women are unable to work outside their home or beyond their
homestead because of family restrictions, social and traditional barriers. The determinants associated
with the empowerment of rural women from selected community were identified. Data were
collected from fifty rural women involved home-based in native sheep rearing practices through
interviews using a structured questionnaire. All responses were measured using a five point like
scale (1 = strongly disagree through 5 = strongly agree). Multiple regression analysis was used to
identify the relationships between the six empowerment factors and the overall empowerment of
rural women. From fifty women who were rearing native sheep for at least one year from seven
villages (bisamara, kalukata, thandajiri, mandoliagona, chakheadman para, adorshogram and
jaruliasiri) of Naikhongchari sadar upazilla included in this survey. Fifty completed questionnaires
were obtained and these questionnaires were used in our analysis. Data of sample population, age of
the respondents, number of years involved in sheep rearing practices and list of empowerment
factors (husband’s behavior, independence for spending money, independent decision making
authority, control over sheep rearing practices, position in the family, involvement in family affairs)
were used for analysis.
We used multiple regressions to identify which were the most significant factors in the
empowerment of rural women. The results of the regression analysis indicated that the overall model
was supported (R Square = .196, p<.05). Analysis of the significance levels indicated that
independent decision making authority (b = 0.294, p<.01) and involvement in family affairs (b =
0.201, p<.10) are significantly associated with the empowerment of rural women in Bangladesh
(Table 2). The findings of our study indicated that sheep rearing programs empowered women by
improving their economic condition and enhancing their ability to contribute to their family. The
first significant factor associated with the empowerment of rural women was independent decision
making authority. When women were given the freedom to initiate and run their sheep rearing
business, their status in the family improved considerably. Involvement of rural women in sheep
production increases their disposable income. The husband’s behaviors towards his wife become
changed by observing that his wife can earn money and contribute to improve the living standards of
the family. The second significant factor associated with the empowerment of rural women in
Bangladesh was involvement in family affairs. Greater involvement results in women being able to
provide financial assistance when buying household assets. Usually, rural women are not consulted
when decisions are made in rural households. Historically, women are perceived as inferior to their
husbands in Bangladesh. However, when they become important in the family by earning money
they were asked by the husbands to take part in making family decisions. They also can make
decisions on their own for the betterment of their children, husband and family. They can establish
control over the income of the sheep business. The overall decision-making authority of rural
women was increased when they exercise their own methods to initiate, run, and expand the sheep
business. When the women had earned control over their sheep business, it was possible to help
rural families in many respects such as, children’s education, financial support for the family etc.
Table 1. Number of Years Involved in Sheep Rearing Practices
Number of years Number of Respondents Percentage of Respondents
Less Than 2 Years 07 14.7%
1 – 2 Years 18 30.7%
2– 3 Years 16 22.6%
More Than 3 Years 9 12.0%

Proceedings of the Annual Research Review Workshop 2019, BLRI, Savar, Dhaka 1341, January 26-27, 2020
Technical Session V 99
Table 2. Results of regression analysis for empowerment of rural women
* p < .10, ** p < .05, *** p < .01
In summary, we found that simple sheep rearing practices do empower rural women and improve
their social status. Hence, homestead sheep rearing and other similar business projects should be
encouraged by government and non-government development agencies as it increases independent
decision making authority and the involvement of women in their family affairs, which enhances the
socio-economic development of the rural sector.
Variables b s.e.
(Constant) 0.064
Independent decision making
authority
0.294*** 0.053
Husband’s behavior -0.078 0.064
Control over sheep rearing
practices
0.047 0.053
Involvement in family affairs 0.201* 0.053
Independence in spending money -0.126 0.064
Position in the family -0.021 0.064
R2 0.196** 0.064
N 50 0.053

Proceedings of the Annual Research Review Workshop 2019, BLRI, Savar, Dhaka 1341, January 26-27, 2020
Technical Session V 100
Cryopreservation of exotic ram semen for conservation and multiplication of sheep
germplasm of BLRI
M Ershaduzzaman*, FT Jahura, MKH Majumder, GK Deb, MFH Miraz, M Yesmin and M Rahman
Bangladesh Livestock Research Institute, Savar, Dhaka-1341, Bangladesh *Correspondence at
Executive summary
Bangladesh Livestock Research Institute has imported 3 improved foreign sheep breeds (Perendale,
Dorper and Suffolk) from Australia in march 3, 2016 to judge their efficacy and adaptability in
Bangladesh as well as to improve productivity of indigenous sheep through cross breeding. Ram of
this three breeds have been used for natural mating within breed and crossbreeding with indigenous
stock for production of crossbreed offspring and therefore to produce a flock of improved sheep
germplasm in BLRI. Besides, all of this improved valuable germplasm are now being conserved in
live form which involves a huge maintenance and management cost. Therefore, the present study
was designed to develop of ram semen cryopreservation technique using standardized semen
extender to conserve this valuable germplasm to maintain their purity for future use through AI.
For semen collection ram was selected on the basis of their pedigree record and based on their true
breed characteristics. A through physical examination was conducted to ensure that the rams are free
from abnormality and do not display clinical symptom(s) of any infection or any contagious
diseases. Prior to introduction of new rams for semen collection, breeding soundness examination
was carried out. The rams was kept under hygienic conditions at all times. Balanced diet along with
sufficient amount of clean drinking water was supplied to the rams regularly. Semen was collected
from three different foreign sheep breeding ram on regular basis through artificial vaginal
method.After collection, volume and concentration of semen was recorded. For AI purpose estrous
synchronization was performed in indigenous sheep breed. Total animals were divided into two
group each group consists of 7 animal. Synchronization process was done by GnRH and
prostaglandin hormone treatment. Average volume was (0.88±0.13), (0.85±0.12), (0.8±0.11) ml and
the mean of concentration was (1301.64±111.51), (2405.42±76.31) and (2258.05±108.39) million
for Perendale, Dorper and Suffolk respectively. Here the highest volume was found in perendale and
the lowest on dorper but concentration was the highest in dorper and the lowest in perendale. The
semen sample was placed in a water bath at 30-34ºC and examined with Computer Assisted Semen
Analyzer (CASA) for determination of motility. Then semen was diluted with commercial
andromed semen extender at 34°C and was evaluated under microscope for progressive sperm
motility. Sperm concentration, total volume of diluents and number of straws to be filled with
diluted semen was determined by CASA. The degree of dilution was aimed at giving an
insemination dose rate of 20 million sperm cells per straw. Till now we are able to prepare 500 straw
from perendale, 120 straw from Suffolk and 200 straw from Dorper. Quality of stored frozen semen
was evaluated after 24 hr of storage for different parameters.The semen quality characteristics of
Perendale, Suffolk, Dorper are presented in table 1. The mean percentage total, progressive, static
and slow motility of fresh and frozen semen samples of perendale was (72.36±6.82, 49.74±6.50),
(51.36±5.45, 42.33±1.51), (27.64±7.63, 50.26±6.51), (21±2.34, 7.42±5.05), Suffolk was
(67.85±3.32, 45.8±3.67), (47.11±3.80, 37.89±2.04), (32.15±3.32, 54.2±3.67), (20.74±0.48,
7.91±1.63) and Dorper was (64.23±12.40, 46.81±7.53), (41.02±6.75, 35.03±5.41), (35.76±12.40,
53.18±7.53), (23.21±5.65, 22.16±6.12); respectively. The highest mean value of total, progressive,
static and slow motility was found in Perendale and the lowest in Dorper. This variation could be
caused by the age of animals and different breed characteristics.

Proceedings of the Annual Research Review Workshop 2019, BLRI, Savar, Dhaka 1341, January 26-27, 2020
Technical Session V 101
Table 1. Fresh and frozen semen quality of three exotic sheep breed (Mean±SD)
Parameter Parendale Suffolk Dorper
Fresh Frozen Fresh Frozen Fresh) Frozen
Volume (ml) 0.9±0.1 0.8±0.11 0.9±0.12
Concentration
(million/ml)
1301.6±111.5 - 2258.1 ±108.4 - 2405.4±76.3 -
Total motility (%) 72.4±6.8
49.7±6.5 67.95±3.3 45.8±3.7 64.2±12.4 46.8±7.5
Progressive
motility (%)
51.4±5.5 42.3±1.5
47.1±3.8 37.9±2.04 41.0±6.8 35.0±5.4
Static motility
(%)
27.6±7.6
50.3±6.5 32.2±3.3 54.2±3.7 35.8±12.4 53.2±7.5
Slow motility (%) 21.0±2.3 7.4±5.1 20.7±0.5 7.9±1.6 23.2±5.7 22.2±6.1
From this two group, twelve (12) animal show heat and artificial insemination was performed in
BLRI sheep farm with prepared frozen semen for evaluation of semen quality. After AI, three (3)
animal show repeat heat. So till now nine (9) animal is pregnant. Conception rate will be calculated
by pregnancy diagnosis following AI.

Proceedings of the Annual Research Review Workshop 2019, BLRI, Savar, Dhaka 1341, January 26-27, 2020
Technical Session V 102
Design and development of products from native sheep skin
MKH Majumder1, M Ershaduzzaman
1, MAA Khan
2, A Hossain
2, MAK Azad
2, MNE Alam
2, MA
Razzaq2
1Conservation and Improvement of Native Sheep through community and commercial farming project,
Bangladesh Livestock Research Institute, Savar, Dhaka-1341and 2Leather Research Institute, Nayarhat,
Dhamrai, Dhaka, Bangladesh.*Correspondence at [email protected]
Executive summary
Leather is animal skin that has been chemically modified to produce a strong, flexible material that
resists decay. Driven by its wide applications in everyday life, the demand for leather products has
become increasing from time to time. Sheep have been a key animal in the history of farming and
have a deeply entrenched place in human culture. They were one of the first animals to be
domesticated along with dogs as sheep have a natural herding instinct and could be easily managed
in groups. Sheep skin is used to produce leather products and soft wool-lined clothing or coverings,
including gloves, hats, slippers, footstools, automotive seat covers, baby and invalid rugs and pelts.
At present, more than 50 percent of bovine hides and approximately 40 percent of sheep and goat
skins are processed into footwear, with the remainder being used for the production of garments,
furniture and travel goods. So, the development of local sheep skin and value added products may
enable to unlock the enormous potential of this skin and provide very good scope for sheep farmer
to generate income. A research was conducted for commercial use of sheep skin in Bangladesh
through leather production with the joint collaboration of Bangladesh Livestock Research Institute
and Leather Research Institute of Bangladesh Council for Scientific and Industrial Research
(BCSIR). The aims of the research work are to assess the properties (physicals and chemicals) of
sheep skin and produce leather products from native sheep skin.
Twenty one (21) raw sheep skin was collected from sheep research farm of Bangladesh Livestock
Research Institute and twenty five (25) raw sheep skin was collected from local market and bring it
to Leather Research Institute for processing. The processing of leather, starting from preserved raw
sheep skins, as follows. Once cured, the skins were then soaked in water for several hours to several
days. The water and surfactants helps in the removal of salt, dirt, debris, blood and excess animal
fats. Rehydration was also reintroduced. Subcutaneous material and majority of hair was removed.
This was used to loosen the fibers allowing the skin to absorb chemicals that was used later in the
tanning processes. Limed hides appear swollen and with an increased thickness, therefore can be
easily split into two or more layers. This process brings to removal of alkali from the pelt with the
consequent dispelling of the fibers and helps lowering of the pH to the values used in the bating
process. It was [carried out with slightly acidic chemicals. This was an operation to complete the
deliming process, by eliminating residues of other substances and loosen the fibers of the skin, in
order to smooth the grain and achieve soft and flexible leather. Pelts were soaked in a solution of
water, salt, and hydrochloric (or sulphuric) acid. This was the process which converts the protein of
the raw hide or skin into a stable material which was not putrefy and it was suitable for a wide
variety of end applications, the leather.
Figure 1. Development of ladies bag and purse from sheep leather

Proceedings of the Annual Research Review Workshop 2019, BLRI, Savar, Dhaka 1341, January 26-27, 2020
Technical Session V 103
There were several types of tanning: chrome tanning was the most widespread. At the end of the
tanning the hides or skins appear blue-green. This is called wet-blue and temporary preserved. The
vegetable tanning was the oldest, made with the use of tannins which gave the vegetable tanned
leather shades of brown, more or less intense. The tanned leather was not yet usable to produce
articles. To turn it into a marketable product the leather must be further treated with syntan,
fatliquor, filler and mechanical processes in the drums. It was the final stage and the most complex
process, which includes all operations to be, carried out on dried skins, to change the surface
effect, both for aesthetic and functional aims. Finishing can be mechanical or chemical. During
manufacturing a product, the following important steps were involved as select target groups, gather
ideas, select ideas, design development, pattern development, assorting the materials, cutting, sub-
assembling processes, assembling and stitching, finishing. Manufacturing of some leather products
such as ladies bag and purse were completed and such products are going on. If products is available
with the help of supporting company, it is demandable so no problem in marketing.

Proceedings of the Annual Research Review Workshop 2019, BLRI, Savar, Dhaka 1341, January 26-27, 2020
Technical Session V 104
Development of blended yarns and fabrics from jute, cotton and native sheep wool
MKH Majumder1, M Ershaduzzaman
1, AK Azad
2, M Asaduzzaman
2, MMU Jubayer
2, MT Hossain
2,
S Alam2 and M Yesmin
1
1Conservation and Improvement of Native Sheep through community and commercial farming project, BLRI,
Savar, Dhaka-1341 and 2Bangladesh Jute Research Institute, Manik mia Avenue, Dhaka 1207, Bangladesh
Executive summary
Native sheep are considered as an important and promising animal resource in Bangladesh.
Bangladesh possesses 3.468 million sheep and the present annual rate of growth is ever increasing
(Bangladesh Economic Review, 2018). Average 700 to 800 gms of raw wool can be collected from
each sheep per year. Resulting three thousands (3000) metric tons of raw wool will be obtained.
Cotton, jute, wool and silk are some of the major fibers which are widely used throughout the world
for producing yarn and fabrics. Wool fiber is the natural hair grown on sheep and is composed of
protein substance called as keratin. Wool is composed of carbon, hydrogen, nitrogen and this is the
only animal fiber, which contains sulfur in addition. The characteristics of wool fiber are composed
of amino acids, excellent absorbency, high moisture regain, tend to be warmer than others, poor
resistance to alkalis but good resistance to acids and good elasticity and resiliency. Enormous
quantity of local sheep wool is wasted due to lack of processing. This fiber can play a significant
role if proper processing technology and products of today’s necessity can be developed out of this
fiber. Due to natural source, wool, jute and cotton blended yarn has tremendous potentiality for
making good quality warm cloth, floor mate, blazer cloth etc. So, the development of local sheep
wool blended yarn decorative fabrics and value added products may enable to unlock the enormous
potential of this fiber and provide very good scope for sheep farmers to generate income. A research
was conducted for commercial use of wool in the country producing yarn and fabrics with the joint
collaboration of Bangladesh Livestock Research Institute and Bangladesh Jute Research Institute.
The objectives of the research work are to produce blended yarn and fabrics from jute, cotton and
Native sheep wool and to determine the physical properties of jute, cotton and Native sheep wool.
Sheep wool was collected from sheep research farms of BLRI and also from the different sub-
stations of sheep project and Bengal Meat Processing Industries ltd, Pabna and sent to the
Bangladesh Jute Research Institute. Jute was collected from local market. Cotton was collected from
the cotton board. The required chemical was collected from local market. Raw sheep wool was
washed with detergent and carbonized with 8% H2S04 at normal temperature (30°C). It is known
that jute is long fiber but cotton is short staple length fiber so jute was cut at different length (1, 1.5
and 2 inch) blended the staple length of cotton. According to a standard procedure blending of wool,
jute and cotton fiber was mixed at different proportion. By using cotton processing system blended
yarn was produced. After producing blended yarn (jute, cotton and sheep wool), this yarn was used
in weaving machine (loom) to produce blended fabrics.
For processing of wool, jute and cotton fiber, we should know about some physical properties of
these fibers.
Table 1. Physical properties of jute, cotton fiber and sheep wool
Property Jute fiber Cotton fiber Sheep wool
Fiber fineness (µg /inch) 5.05 3.35 8.03
Moisture regain (%) 13-14 7-8 9-10
Tenacity (g/tex) 35 25 32
Note: Tenacity is the customary measure of strength of a yarn
Fibers are generally classified as very fine if they have a µg /inch value up to 3.1; Fine if they have
value between 3.1 to 3.9; Medium if they have value between 4.0 to 4.9; Slightly coarse between
values of 5 to 5.9 and Coarse if they have a µg /inch value above 6. So, Sheep wool is coarse fibers,
jute is slightly coarse fibers and cotton is fine fibers. For the production of smooth blended yarn,
sheep wool is mixed with jute and cotton fibers. In the present study, it was observed that 30%, 30%

Proceedings of the Annual Research Review Workshop 2019, BLRI, Savar, Dhaka 1341, January 26-27, 2020
Technical Session V 105
and 40% respectively wool, jute cotton fiber blended 12s (yarn count system) count yarn has been
successfully developed. After operating, there were observed some limitation in spinning section.
Wool dropping was more than jute and cotton fiber. Yarns were produced at different proportion.
Jute and wool is available in the locality. Cotton fiber is costly. For this reason, the cost of blended
yarn is less than 100% cotton yarn. Shawls, blanket and suiting fabrics (pant pieces, blazer piece)
were produced successfully. Shawl is produced with the production cost of Tk. 244 (7ft×3ft) and
suiting fabrics (pant piece, blazer piece etc.) with the production cost of Tk. 588 (per 1 meter).
Comfortable blanket was produced from 50:50 ratio of wool-jute yarn with the production cost of
Tk. 495 (6ft×8ft). Dining mate and floor mate were produced with the combination of wool and jute
in the ratio of 40:60 and the production cost of Tk. 280 and Tk. 140.
Spinning technique and types can play a vital role for the perfection of blended yarn properties and
specific blended ratio is very important to get diversified products. Fine wool is more effective for
making yarn than coarse wool. Wool, jute and cotton blended yarn may be a new horizon for
developing diversified products. Handicraft sector and cottage industries can use this blended yarn
for making their products. Sheep farmers will be encouraged by selling their waste wool and
therefore, the country will be economically benefited.
Wool blended yarn Shawl (7ft×3ft)
Blanket (6ft×8ft)
Suiting fabrics (1 meter)
Dining mate (4.5ft×1.2ft and
1.5ft×1.2ft) Floor mate (2.5ft×1.5ft)

Proceedings of the Annual Research Review Workshop 2019, BLRI, Savar, Dhaka 1341, January 26-27, 2020
Technical Session V 106
Phenotypic and genotypic profiling of antimicrobial resistance (AMR) in enteric
bacterial communities in finisher livestock and poultry in Bangladesh
MA Samad1, MR Karim, MR Begum, A Mahmud, MZ Ali, MNASiddiky and M Giasuddin
Animal Health Research Division, Bangladesh Livestock Research Institute, Savar, Dhaka 1341, Bangladesh. 1Correspondence at [email protected]
Executive summary
Food safety is a global health concern which describing hygienic handling, preparation, and storage
of food in ways that prevent foodborne illness. Food can transmit disease from person to person as
well as serve as a growth medium for bacteria that can cause food poisoning. Foodborne diseases are
widespread and becoming a growing public health concern not only for the developing countries but
also for the developed nations. Antimicrobials or antibiotics revolutionized medicine in the 20th
century and are probably one of the most successful forms of chemotherapy in the history of
medicine. Antimicrobial agents have been used for the last 70 years to treat patients who have
infectious diseases. Since the 1940s, these drugs have greatly reduced illness and death from
infectious diseases. However, the emergence of resistance of bacteria to antibiotics is a common
phenomenon. Emergence of resistance often reflects evolutionary processes that take place during
antibiotic therapy and become a great concern. Considering these facts, the study was under taken
with the objectives to assess herd-to-herd variation in antimicrobial resistance in faecal commensal
enteric bacteria in finisher livestock and poultry, and to assess spatio-temporal variation in
antimicrobial resistance profile in retail meat in LMBs (live bird markets) and slaughter houses.
During January to June 2019, a total of 476 samples were collected from 10 super shop of Dhaka
city; categorized in chicken meat (n=170), beef (n=68), mutton (n=34) and environment (n=204).
Salmonella spp. were isolated from the samples by using selective enriched media and confirmed by
real-time PCR. Phenotypic resistance was determined by disk diffusion method according to CLSI
guideline 219. Extended-spectrum β-lactamases (ESBLs) and quinolone resistance genes were
determined by PCR. The overall prevalence of Salmonella spp. was 18.5% (n=88; 95% CI:15-22%)
comprising in chicken meat 26% (n=44; 95% CI:19.5-32.5%), beef 15% (n=10; 95% CI:7-23%),
mutton 18% (n=6; 95% CI:6-30%) and environment 14% (n=28; 95% CI:9.5-18.5%). In
antimicrobial assay, 55% isolates were found multi-drug resistant (MDR). Among 22 tested
antibiotics, extreme level of resistance was observed against Tetracycline and Erythromycin 99.1%
(n=87, 95% CI: 94.5-99.9%), followed by Doxycycline 98%, Pefloxacin 93.9%, Azithromycin
92.2%, Enrofloxacin 91.2%, Moxifloxacin 89.7%, Nalidixic Acid 87.1%,
Trimethoprim/Sulfamethoxazole 75%, Ciprofloxacin 53.4% and Streptomycin 49.6%. Nevertheless,
only Ceftriaxone, Cefotaxime, Imipenem, Amoxicillin/Clavulanic acid showed good level of
sensitivity as 82%, 73%, 73% and 68% respectively. Among the phenotypically resistant isolates,
prevalence of ESBL encoding genes and Quinolone resistance genes determination is ongoing.
High level prevalence of MDR Salmonella spp. in retail meat which could cause foodborne illness is
a great alarming issue for public health.
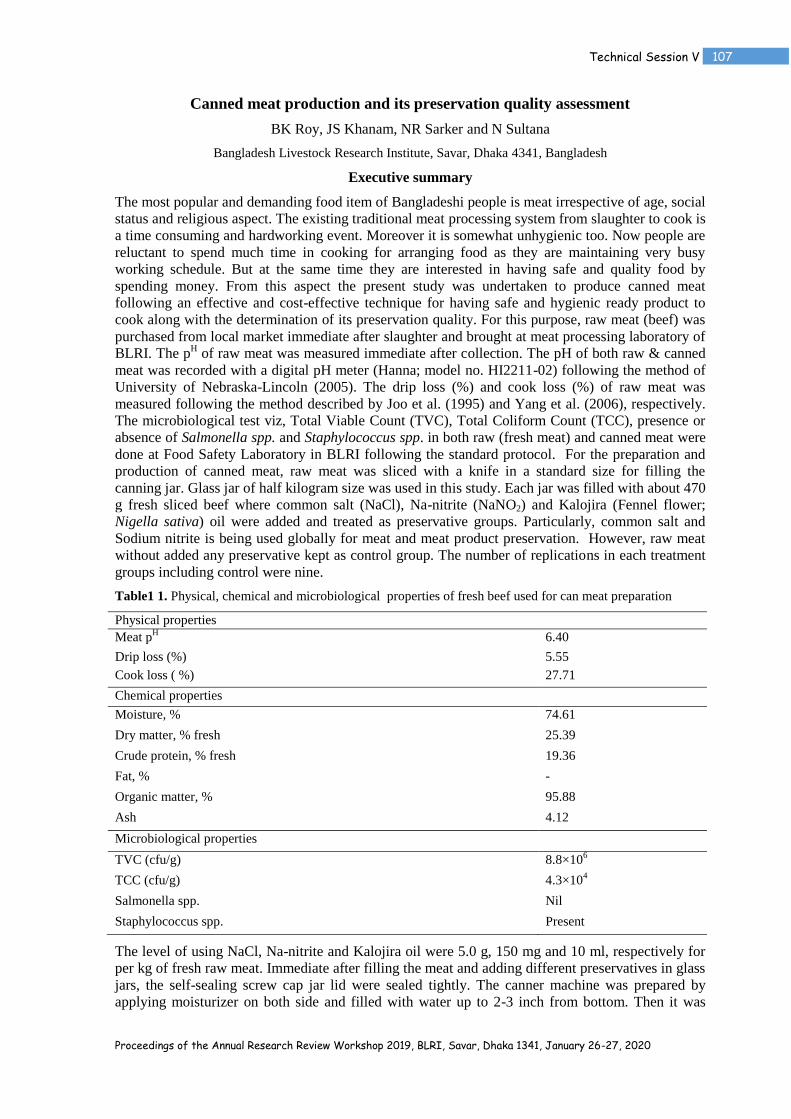
Proceedings of the Annual Research Review Workshop 2019, BLRI, Savar, Dhaka 1341, January 26-27, 2020
Technical Session V 107
Canned meat production and its preservation quality assessment
BK Roy, JS Khanam, NR Sarker and N Sultana
Bangladesh Livestock Research Institute, Savar, Dhaka 4341, Bangladesh
Executive summary
The most popular and demanding food item of Bangladeshi people is meat irrespective of age, social
status and religious aspect. The existing traditional meat processing system from slaughter to cook is
a time consuming and hardworking event. Moreover it is somewhat unhygienic too. Now people are
reluctant to spend much time in cooking for arranging food as they are maintaining very busy
working schedule. But at the same time they are interested in having safe and quality food by
spending money. From this aspect the present study was undertaken to produce canned meat
following an effective and cost-effective technique for having safe and hygienic ready product to
cook along with the determination of its preservation quality. For this purpose, raw meat (beef) was
purchased from local market immediate after slaughter and brought at meat processing laboratory of
BLRI. The pH of raw meat was measured immediate after collection. The pH of both raw & canned
meat was recorded with a digital pH meter (Hanna; model no. HI2211-02) following the method of
University of Nebraska-Lincoln (2005). The drip loss (%) and cook loss (%) of raw meat was
measured following the method described by Joo et al. (1995) and Yang et al. (2006), respectively.
The microbiological test viz, Total Viable Count (TVC), Total Coliform Count (TCC), presence or
absence of Salmonella spp. and Staphylococcus spp. in both raw (fresh meat) and canned meat were
done at Food Safety Laboratory in BLRI following the standard protocol. For the preparation and
production of canned meat, raw meat was sliced with a knife in a standard size for filling the
canning jar. Glass jar of half kilogram size was used in this study. Each jar was filled with about 470
g fresh sliced beef where common salt (NaCl), Na-nitrite (NaNO2) and Kalojira (Fennel flower;
Nigella sativa) oil were added and treated as preservative groups. Particularly, common salt and
Sodium nitrite is being used globally for meat and meat product preservation. However, raw meat
without added any preservative kept as control group. The number of replications in each treatment
groups including control were nine.
Table1 1. Physical, chemical and microbiological properties of fresh beef used for can meat preparation
Physical properties
Meat pH 6.40
Drip loss (%) 5.55
Cook loss ( %) 27.71
Chemical properties
Moisture, % 74.61
Dry matter, % fresh 25.39
Crude protein, % fresh 19.36
Fat, % -
Organic matter, % 95.88
Ash 4.12
Microbiological properties
TVC (cfu/g) 8.8×10⁶
TCC (cfu/g) 4.3×10⁴
Salmonella spp. Nil
Staphylococcus spp. Present
The level of using NaCl, Na-nitrite and Kalojira oil were 5.0 g, 150 mg and 10 ml, respectively for
per kg of fresh raw meat. Immediate after filling the meat and adding different preservatives in glass
jars, the self-sealing screw cap jar lid were sealed tightly. The canner machine was prepared by
applying moisturizer on both side and filled with water up to 2-3 inch from bottom. Then it was

Proceedings of the Annual Research Review Workshop 2019, BLRI, Savar, Dhaka 1341, January 26-27, 2020
Technical Session V 108
placed on cooking burner until boiling of water. When boiling was started then the vapor was
removed, glass jars were placed in pressure canner machine and proper pressure weight (10 lb) was
settled. Canning was performed at 2400 F under10lb pressures for 75 minutes. After removing the
glass jars from pressure canner machine, checked the jar properly for any leakage. Finally, the lids
of all the jar was again sealed with shrink paper using an electric hot gun. However, all the jars were
kept under ambient room temperature for a period of 30 days. Both fresh and canned meat at 30
days aged samples were collected for proximate component analysis, microbial count and final
recovery rate calculation. However, the proximate composition of both fresh and canned meat were
determined by the method described by Association of Official Analytical Chemist (AOAC; 2005).
Data on physical, chemical and recovery rate of both fresh raw meat and canned meat were
compared statistically in an ANOVA of a Completely Randomized Design using General Linier
Model Procedures of SPSS, 20 computer software packages.
Table 2. Effect of preservatives on physico-chemical, microbiological properties and loss or
recovery rate of canned beef
Parameters Preservatives SED Sig.
Control Klj. oil NaNO3 NaCl
Physico-chemical properties
PH
6.47bc
6.48bc
6.55ac
6.38b 0.02 *
Moisture, % 63.36 59.21 63.31 61.96 1.11 NS
Dry matter, % 36.64 40.79 36.69 38.04 1.11 NS
Organic matter, % 97.03bc
97.06bc
97.34ac
96.41b 0.15 *
Crude Protein, % 28.31 28.99 28.54 28.57 0.24 NS
Total mineral, % 2.97 2.94 2.67 3.59 0.15 *
Loss or recovery rate
Losses during canning process,
%
3.83 2.13 6.70 6.28 1.26 NS
Water in canned jar, % 30.85 28.30 28.72 27.55 0.80 NS
Meat in canned jar, % 62.76 64.36 62.23 63.08 2.00 NS
Raw beef used, g 470.0 470.0 470.0 470.0 0.00 NS
Microbiological properties
TVC (cfu/g) Nil Nil 1×10²
1×10² - -
TCC (cfu/g) Nil Nil Nil Nil - -
Salmonella spp. Nil Nil Nil Nil - -
Staphylococcus spp. Present Nil Nil Nil - -
The physical, chemical and microbiological properties of fresh raw beef used for canning purpose
under this research, is presented in Table-1. It shows that the physical properties viz, pH
, drip and
cook loss of fresh raw beef were 6.40, 5.55% and 27.71%, respectively. The moisture content and
crude protein content in raw beef were 74.61 and 25.39%, respectively. The total viable bacteria
count and Coliform count in fresh raw beef however, were 8.8×10⁶ and 4.3×10
4 cfu/g (Table 1),
respectively. This quality deterioration of market raw beef was due to the slaughtering system of our
country which stands below the scientific standard and raw meat used in this study were collected
from local market, so this could be the reason behind it. The effect of preservatives on physico-
chemical, microbiological properties and recovery rate of canned meat is presented in Table 2. It
shows that, the pH of canned beef was significantly (p<0.05) higher in meat preserved with NaNO2
and Kalojira oil than that of NaCl and control group. Preservatives, however, had no effects
(p>0.05) on moisture or DM and CP content in canned beef. Similarly, the losses during canning
process or recovery rate after 30 days of canning did not vary significantly (p>0.05) among the
preservatives groups. Though, there was no significant (p>0.05) effect, but Kalojira oil performed as
impressive preservative compared to others. The maximum DM (40.79%) and CP (28.99%) content
was found in Kalojira oil which becomes proven in having maximum recovery rate (64.36%) and
lowest loosing rate (2.13%) during the canning processes. The highest mineral content (3.59%) was
in common salt (NaCl) group as because common salt itself is a mineral so it decreased the total
organic matter (96.4%) and increased the total mineral content as well. In microbiological aspects
of canned meat, the TVC, TCC, Salmonella spp. and Staphylococcus spp. were entirely absent in
Proceedings of the Annual Research Review Workshop 2019, BLRI, Savar, Dhaka 1341, January 26-27, 2020
Technical Session V 109
Kalojira group. In case of NaNO2 and NaCl group, only a very few number of viable bacteria was
found (1×10²). On the other hand only the Staphylococcus bacteria was found in case of control
group. Moreover, it was estimated that the production cost of 0.5 Kg canned beef using
preservatives and without preservatives were Tk. 357, Tk. 362, Tk. 357 and Tk. 357, respectively
for control, Kalojira oil, Sodium nitrite and Sodium chloride as preservatives. Considering the
physico-chemical and microbiological aspects in canned beef, it may be concluded that the Kalojira
oil could be a suitable value added preservative in meat canning compare to NaCl and NaNO2 the
two recognized preservatives; may be for its own herbal or medicinal properties. Before marketing
however, further in-depth study on shelf-life of canned meat and assurance of its quality will be
needed for making it safe and consumer friendly.

Proceedings of the Annual Research Review Workshop 2019, BLRI, Savar, Dhaka 1341, January 26-27, 2020
Technical Session V 110
Morphological features and growth traits of half sib local Pabna calves up to yearling
stages MAI Talukder
1, M Shahjahan
2*, S Munira
2, S Rahman
2 and AKFH Bhuiyan
3
Bangladesh Livestock Research Institute (BLRI), Savar, Dhaka 1341;
2Dairy Development Research Project,
BLRI Regional Station, Baghabari, Sirajganj 6770 and 3Department of Animal Breeding and Genetics,
Bangladesh Agricultural University, Mymensingh 2202, Bangladesh. Correspondence at [email protected]
Executive summary
Phenotypic features and growth traits are important parameters for breed characterization and
performance evaluation. The study was conducted to reveal the phenotypic and growth traits of half
sib Pabna calves up to yearling stages to select the comparative best cattle based on increasing
pattern of body size and morphological features towards the development of a uniform Pabna cattle
herd. Data of various preselected phenotypic measures and growth were collected from 18 and 22
half sib Pabna calves, respectively, using measuring tape and digital weighing balance up to 12
months of calving at BLRI Regional Station, Baghabari during March, 2018 to June, 2019. The
body weight of newborn calves and respective dams were recorded separately. Further body weights
of calves were recorded in each consecutive measuring period of one month’s interval (DDRP-BLRI
solution, SourceTrace System, Massachusetts, USA). In case of phenotypic measurements of calves,
same side and direction were followed for all individuals in each time. Each calf was allowed to
drink 10% of milk for individual’s body weight from respective dam twice per day at calf shed. In
addition, dams were reared under specific farm management conditions (feeding regime on dry
matter basis; 2.50% of body weight) at milking shed of BLRI Regional Station, Baghabari. Data
analyses of phenotypic measurements were conducted following independent sample t-test and one-
way ANOVA of Completely Randomized Design (CRD). Analysis on growth traits were performed
using multivariate of GLM in Randomized Complete Block Design (RCBD) and also one-way
ANOVA of Completely Randomized Design (CRD) following Bonferroni and Tukey’s HSD mean
separation post hoc tests, respectively.
Linear increasing trend identified in all morphological features from birth to yearling stages for both
body and head characteristics of Pabna calves in which heart girth (63.33±1.31 cm at birth and
91.83±2.18 cm at pre-weaning), wither height (84.17±0.60 cm at pre-weaning), carpal
circumference (10.50±0.50 cm at birth), mouth circumference (21.33±0.33 cm at birth and 26.58 cm
at pre-weaning) and head length (30.08±0.99 cm at pre-weaning) had significant differences
(p<0.05) in male calves compare to female (Table 1). These data indicated that phenotypic measures
might use in selecting the desire individual from herd associating weight gain. Body weight of
Pabna calves also showed linear fashion from birth (19.56±2.11 kg) to yearling stages (112.33±3.30
kg) including strong correlation at first (53%) and yearling (48%), and weak at weaning (7%) stages
(Figure 1). The sex and birth weight of calf had significant effects (p<0.05) up to pre-weaning stage
of calf. The average daily gains (ADG) of calf showed highest (449.33±17.07 g) and lowest
(261.35±12.96 g) values at first and twelfth month of birth, respectively. In pre-weaning stage, the
ADG observed highest in Winter season (471.11± 20.95 g) while at post-weaning stage in Summer
(333.88±13.44 g). However, average monthly gain (AMG) did not show any statistical differences
(p>0.05) among the growth rate from pre-weaning (365.06±22.29 g) to yearling (145.19±116.13 g)
stages. These data suggested the growth rate patterns of local Pabna calves and also to provide
special care through feeding management during adverse situation.

Proceedings of the Annual Research Review Workshop 2019, BLRI, Savar, Dhaka 1341, January 26-27, 2020
Technical Session V 111
Table 1. Effect of sex on morphological features of Pabna cattle calves up to weaning period
Morphological features Sex At birth
(n=18; M-6, F-12)
Pre-weaning
(n=17; M-6, F-11)
Weaning
(n=14; M-4, F-10)
Mean SE Mean SE Mean SE
Body characteristics (cm)
Heart girth (HG) Male 63.33 1.31 91.83 2.18 101.00 2.58
Female 59.42 0.74 86.50 1.00 102.90 1.92
P value 0.013 0.022 0.594
Wither height (WH) Male 65.83 1.01 84.17 0.60 90.50 1.71
Female 64.58 0.69 79.77 0.69 88.15 0.86
P value 0.317 0.000 0.196
Carpal circumference
(CC)
Male 10.50 0.50 11.17 0.17 12.13 0.31
Female 9.25 0.22 10.86 0.14 12.05 0.41
P value 0.016 0.193 0.915
Head characteristics (cm)
Mouth circumference
(MC)
Male 21.33 0.33 26.58 0.76 31.00 1.00
Female 20.17 0.27 24.73 0.48 29.20 0.74
P value 0.020 0.047 0.204
Head length (HL) Male 21.25 0.40 30.08 0.99 33.88 0.83
Female 21.08 0.36 27.45 0.35 32.70 0.26
P value 0.779 0.007 0.094
Finally, the variations of phenotypic feature and growth trait from birth to yearling stages could be
used for selection among the G1 local Pabna calves for further breeding purpose.

Proceedings of the Annual Research Review Workshop 2019, BLRI, Savar, Dhaka 1341, January 26-27, 2020
Technical Session V 112
Improving production performance of local buffalo through crossbreeding
GK Deb, MFH Miraz, MF Afroz and SMJ Hossain
Biotechnology Division, Bangladesh Livestock Research Institute, Savar, Dhaka 1341, Bangladesh.
Correspondence at [email protected]
Executive summary
Evaluation of adaptability of crossbred buffaloes (Murrah× Local & Nili-Ravi× Local) at farmer’s
condition and on-station is very important for implementation of buffalo breeding programme.
Considering above fact, this study was aimed 1) to produce crossbred buffalo, 2) to evaluate their
production performances at BLRI Buffalo Research Farm and 3) to validate previously adopted
estrus synchronization (ES) protocols. Indigenous buffalo was inseminated/naturally mated with
pure Murrah and Nili-Ravi bull/semen at BLRI Buffalo Research Farm (39 cows with Murrah and
Nili-Ravi bull/semen) and Godagari, Rajshahi (14 Cows with Murrah semen). Body weight from
birth to 30 month age, age at first heat and calving and gestation period were recorded to evaluate
the performance of Murrah×Local and Nili-Ravi×Local crossbred buffaloes at BLRI. BLRI has
developed ES technology for buffalo. However, the efficacy of this technology has not been
validated yet. Hence, ES protocols were validated on-farm at Fulbaria of Mymensingh district and
on-station at BLRI. Two ES protocols (i. cows with corpus luteum were treated with PGF2α followed
by mating on day 3 and GnRH administration just after mating and ii. GnRH administration at any
stage of the cycle and PGF2α on day 7 and AI on day 9 followed by 2nd
dose of GnRH) were applied
during this experiment.
During this study period, 4 crossbred calves (Murrah×Local) were born at Rajshahi and 35 (21
Murrah×Local and 14 Nili-Ravi×Local) at BLRI. Conception rates in AI at Rajshahi and natural
mating at BLRI were 35.71% (5 out of 14) and 92.31% (36 out of 39) respectively. Although both
Murrah and Nili-Ravi crossbreds have almost similar birth weight (30.07±0.64 kg vs 29.93± 0.64
kg) but body weight of Nili-Ravi at 30 months (355±12.78 kg) was higher than Murrah crossbred
(291±2.00 kg) (Table 1). Two Murrah crossbred heifers showed first heat at 767 and 1126 days,
respectively. One heifer delivered first calf at 1065 days with a gestation period of 298 days.
Responses of buffalo cows on ES protocol 1 and 2 at BLRI were 83.33% (10 out of 12) and 100%
(12 out of 12), respectively. However, responses of buffalo cows against ES protocol 1 and 2 at
Fulbaria, Mymensingh were 33.33% (2 out of 6) and 44.44% (4 out of 9). None of the experimental
buffalo cow established pregnancy at Fulbaria. Research is conducting to find out the reason behind
failure in conception following ES. For this purpose, 5 Animals were daily examined by
ultrasonography from day 1 of treatment till day 10 after treatment (day of estrus) with ES protocol
2 to characterize the follicular statistics, pattern of growth and regression of the dominant follicle
and CL.
Follicular growth (small, medium and large follicle) occurs in even manner in left (4.48±2.92) and
right ovary (4.25±3.47) of the treated animal. Buffaloes that were subjected to ES 1 protocol at the
beginning of treatment, the mean diameter of the largest follicle of left and right ovary was found
(8.40±1.47 mm) and (7.765±1.58 mm) respectively. On day 7 of treatment (day of PGF2α
administration) the mean diameter of the largest follicle of the left and right ovaries of the buffaloes
was (10.79 ± 2.44 mm) and (7.65 ± 0.21mm) respectively. On day 10 of treatment the mean
diameter of the largest follicle of left and right ovary was (9.20± 0.92mm) and (7.75± 0.22 mm)
respectively (Fig 1). Out of 5 buffaloes, 4 buffaloes showed heat and inseminated with frozen semen
followed by second dose of GnRH. After AI two animals shows repeat heat after 21 days and two
animals has not shown repeat heat yet. Blood sampling was carried out every other day, from the 1st
day of treatment till the day of estrus for estimation of serum progesterone and estradiol level.
Collected blood samples were centrifuged immediately at 2500 rpm for 15 min and serum samples
were stored at -20°C until hormone analyses.
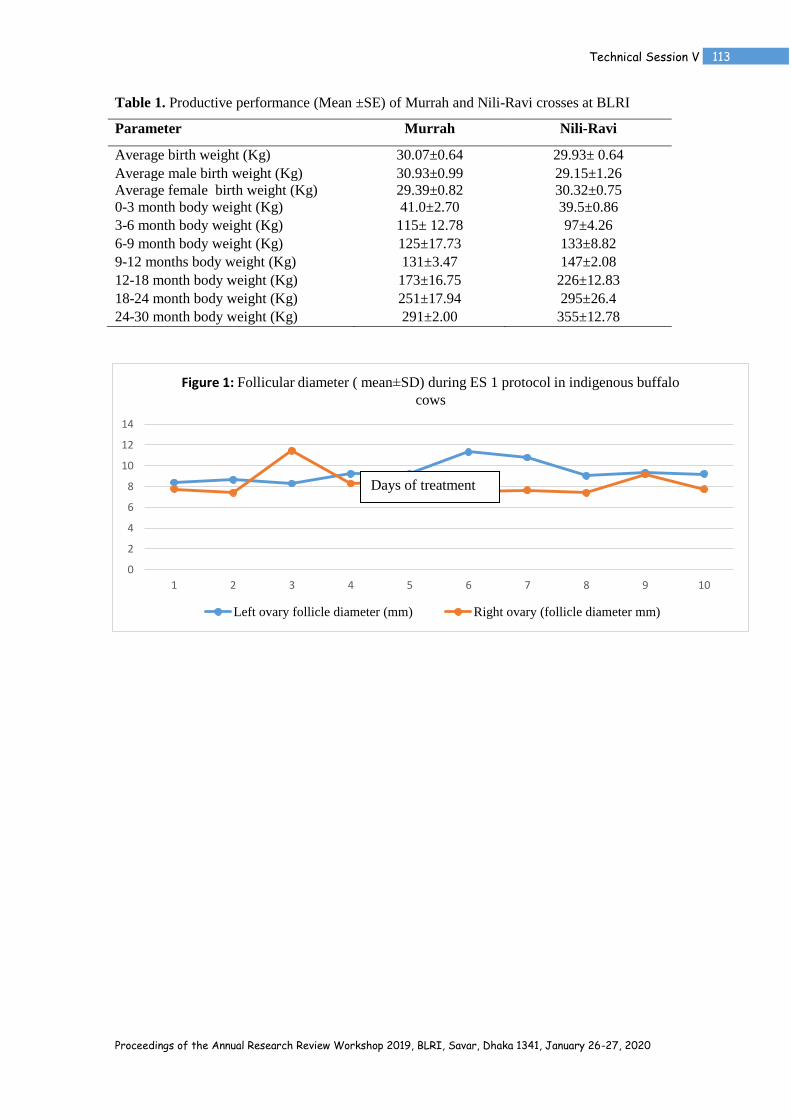
Proceedings of the Annual Research Review Workshop 2019, BLRI, Savar, Dhaka 1341, January 26-27, 2020
Technical Session V 113
0
2
4
6
8
10
12
14
1 2 3 4 5 6 7 8 9 10
Figure 1: Follicular diameter ( mean±SD) during ES 1 protocol in indigenous buffalo
cows
Left ovary follicle diameter (mm) Right ovary (follicle diameter mm)
Table 1. Productive performance (Mean ±SE) of Murrah and Nili-Ravi crosses at BLRI
Parameter Murrah Nili-Ravi
Average birth weight (Kg) 30.07±0.64 29.93± 0.64
Average male birth weight (Kg) 30.93±0.99 29.15±1.26
Average female birth weight (Kg) 29.39±0.82 30.32±0.75
0-3 month body weight (Kg) 41.0±2.70 39.5±0.86
3-6 month body weight (Kg) 115± 12.78 97±4.26
6-9 month body weight (Kg) 125±17.73 133±8.82
9-12 months body weight (Kg) 131±3.47 147±2.08
12-18 month body weight (Kg) 173±16.75 226±12.83
18-24 month body weight (Kg) 251±17.94 295±26.4
24-30 month body weight (Kg) 291±2.00 355±12.78
Days of treatment

Proceedings of the Annual Research Review Workshop 2019, BLRI, Savar, Dhaka 1341, January 26-27, 2020
Technical Session V 114
Study on follicular physiology of repeat breeder cows in Baghabari milk shed areas
MY Ali1, M Ershaduzzaman
1, R Khatun
1, MR Amin
2, US Alam
1, MA Habib
3, JM Esha
2 and NR
Sarker4
1System Research Division,
3Fodder Research and Development Project and
4Poultry Production Research
Division, Bangladesh Livestock Research Institute, Savar, Dhaka 1341and 2Deparment of Genetics and
Breeding, Bangladesh Agricultural University, Mymensingh 2202, Bangladesh
Executive summary
The experiment was implemented at farmer’s house and Bathan areas of Shahjadpur upazila under
Sirajgonj district. This experiment was conducted to know the incidence rate in Holstein Frisian
(HF) Repeat Breeder cows (RBC) compared with the normal HF cows; the physiology of different
follicles of RB cows at different stages of estrus cycle; the deformity of ovary and uterus. Forty (40)
RB cows of Holstein Friesian (HF) were selected initially on the basis of age and parity number. A
herd comprising 10 cows at farmer’s house and another 30 cows at Bathan areas were brought and
maintained. All RBC were marked by ear tag and maintained breeding record by Cattle Herd Book.
After selecting the RB cows, pyometra, endometra, cervicitis, sulphagitis and tumor like growth etc.
in uterine wall were identified with the help of modern veterinary approaches. The status of ovarian
follicles at different stages of estrus cycle observed. Finally Luteal and follicular cyst (if present)
were also identified with the veterinary concerned researchers. All experimental cows were
synchronized by the treatment of GnRH (day-0), PGF2α (day-7) and Artificial Insemination (AI) +
GnRH (day -9). Pregnancy tests were done after 50 days of AI by rectal palpation and chemical test
in the laboratory. Growing follicle number appeared ultrasonically, size of Graafian follicle, breed,
cows body size, and inheritance level and parity, nutritional factors, heat stress (record temperature
and Relative Humidity at the time of estrus), days calving to first service, hormone (estrogen,
progesterone and LH) around the time of estrus, luteal and follicular cyst and different reproductive
diseases were recorded. All collected data were statistically analyzed by the SPSS soft-ware
program. Results revealed that, significantly (P<0.05) highest Body Condition Score (BCS) was
3.47±0.05 observed in the cows of group-D whose age was more than 8 years compared to others
group (Table 1). In-case of average daily milk yield and remained dry condition differences were
highly significant (P<0.001). Maximum milk yield (20.41±0.82 l/day) was observed in group-C
compared to others group but minimum dry condition remaining period was observed in group-A
than others. Days of heat showed number of AI service were non-significant (P>0.05) in the whole
experiment (table-1). The percentage of infection (Pyometra, Endometra and Metratis) in the uterine
wall differed non-significantly (P>0.05) among all the groups and minimum values were observed
in group-A (Table 2). Percentage of cyst presented in both ovaries is given in table-2. Highest
percent of cyst observed in the right ovary than left of the cows of group-D compared to others
groups but the differences were non-significant (P>0.05).Comparatively higher percentage
(58.82±12.30) of follicles observed in left ovary of group-D than right ovary in the whole duration
of the experiment (Table 2). The highest average number (2.40±0.44) of follicles was observed in
left ovary of the group-C than the cows of others group but the differences were non-significant
(P>0.05). Though the follicle size in the end of luteal phase differed non-significantly (P>0.05) but
comparatively larger (3.47±1.34 mm) follicle in diameter were observed in group-A than the
follicles of others groups.
Table 1. Phenotypic parameter of repeat breeder cows
Parameters Group P
Value
Level
of Sig. A(2-4 years) B(5-7 years) C(7-8 years) D(>8 years)
BCS(0-5) 2.94±0.17 3.00±0.14 3.22±0.06 3.47±0.05 0.01 *
Milk yield(L/d) 18.15±1.52 15.27±0.76 20.41±0.82 20.06±0.94 0.00 **
Remained dry condition (M) 20.66±1.36 31.07±1.32 30.27±1.12 30.23±1.98 0.00 **
Heat showed interval(days) 31.50±6.91 47.56±7.71 44.90±4.11 41.47±9.28 0.71 NS
Service given (No) 8.67±1.95 6.74±0.95 5.79±0.62 8.18±2.34 0.37 NS
*= Significant, **= Highly significant, NS= Non significant

Proceedings of the Annual Research Review Workshop 2019, BLRI, Savar, Dhaka 1341, January 26-27, 2020
Technical Session V 115
Table 2. Physiological parameters of the ovaries of repeat breeder cows
Parameters Group P
Value
Level
of Sig. A(2-4 years) B(5-7 years) C(7-8 years) D(>8 years)
Pyometra (%) 33.33±16.67 37.04±9.47 60.47±7.54 64.71±11.94 0.11 NS
Endometra (%) 22.22±14.69 29.63±8.95 23.26±6.51 29.41±11.39 0.91 NS
Metratis (%) 0.00 11.11±6.16 11.63±4.94 11.76±8.05 0.77 NS
Right ovarian cyst (%) 66.67±16.66 48.15±9.79 48.84±7.71 70.59±11.39 0.35 NS
Left ovarian cyst (%) 11.11±5.11 14.81±6.96 23.26±6.51 17.65±9.53 0.76 NS
Follicles in right ovary (%) 33.33±16.66 25.93±8.59 37.21±7.45 11.76±8.05 0.26 NS
Follicles in left ovary (%) 44.44±17.56 29.63±8.95 37.21±7.45 58.82±12.30 0.27 NS
Follicles in right ovary (no) 2.00±0.80 2.00±0.52 2.40±0.44 1.33±0.80 0.31 NS
Follicles in left ovary (no) 1.67±0.70 0.85±0.46 0.90±0.38 1.00±0.70 0.38 NS
Right ovarian follicle
diameter (mm)
1.34±0.91 1.07±0.60 2.10±0.50 2.59±0.91 0.20 NS
Left ovarian follicle diameter
(mm)
3.47±1.34 2.94±1.10 1.26±0.73 2.81±1.34 0.21 NS
NS= Non significant

Proceedings of the Annual Research Review Workshop 2019, BLRI, Savar, Dhaka 1341, January 26-27, 2020
Technical Session V 116
Identification of candidate gene markers for prediction of RCC sperm quality and
fertility
GK Deb, MFH Miraz and SMJ Hossain
Biotechnology Division, Bangladesh Livestock Research Institute, Savar, Dhaka 1341, Bangladesh
Executive summary
The present cattle breeding policy encouraging artificial insemination (AI) program throughout the
country to increase productivity of milk and meat. Purebred populations are declining due to
indiscriminate breeding within the native stock and crossbreeding with exotic breeds. In order to
maintain the purity of indigenous genetic resources like Red Chittagong Cattle (RCC), it is
important to maintain the purity during breeding with either natural mating or AI. But in both cases,
quality of the breeding male is most important as AI allows semen from one bull to be used to
inseminate thousands of females. Thus, bull effects are paramount on herd genetics, dynamics, and
production. Use of sperm from a low fertility bull leads to lower pregnancy rates, which results in
greater economic loss. Evaluation of semen quality and early prediction of fertility of RCC bull
before mass AI will results more conception rate, more calves and reduces the cost of rearing low
fertile bull in the breeding center. Therefore this study was designed to identify candidate genes or
markers related with semen quality and fertility of bulls. In this study, twelve (12) RCC bulls were
selected considering their true breed characteristics and pedigree records. The selected bulls were
trained for semen collection. Semen was collected twice in a week from each bull using artificial
vagina method. After initial evaluation with computer assisted semen analyzer, semen sample was
diluted with extender to give a sperm concentration of 20 million/dose. Diluted semen was placed in
a cold handling cabinet (Minitube, Germany) for 4 hrs at 4°C for equilibration. The semen samples
were filled and sealed in standard printed straws (0.25ml) using an automated sealing filling
machine. After equilibration, freezing of straws was carried out in liquid nitrogen (LN2) vapor using
a programmable bio-freezer (Minitube, Germany). The straws were then plunged in LN2 (−196°C)
for overnight storage. Data were analyzed using Microsoft excel programme. The volume,
concentration, total motility, progressive motility and static motility of fresh semen were 3.94±1.15,
1638.42±923.51, 77.68±13.48%, 57.59 ± 14.42%, 22.37±13.47 % respectively. The total,
progressive, and static motility of frozen semen were 67.57±2.99, 46.86±2.79%, 32.12±3.24 %
respectively.
Table 1. Semen quality parameter (Mean±SD) of RCC bull semen
Parameter Volume Concentration Motility
Total Progressive Static
Fresh semen 3.9±1.2 1638.4±93.5 77.7±13.5 57.6 ± 14.4 22.4±13.5
Frozen semen -- -- 67.6±2.9 46.9±2.8 32.1±3.2
Fresh and post thaw semen samples were analyzed and different kinematic parameters were
recorded (Table 2) for studied bulls. Results showed significant variations (p<0.01) for average path
velocity (APV), straight linear velocity (SLV), straightness (STR) and linearity (LIN) of different
sperm kinematic parameters of fresh and frozen semen as shown in Table 2.
Table 2. Kinematic parameters (Mean±SE) of fresh and post thawed RCC bull sperms
Freezing
stage
APV
(μm/s)
SLV
(μm/s)
VCL (μm/s) STR (%)
LIN
(%)
ALH
(Μm)
BCF
(Hz)
Fresh 98.7a ±0.7 79.7
a±0.7 140.8
a±0.7 88.9
a±0.8 57.9
a±0.4 7.4
a±0.6 27.9
a±0.6
Post thaw 84.7b±0.5 68.7
b±0.7 139.8
a±0.7 85.3
b±0.7 54.2
b±0.5 7.0
a±0.5 26.2
a±0.5
APV: average path velocity, SLV: straight linear velocity, VCL: curvilinear velocity, STR: straightness, LIN:
linearity ALH: Amplitude of lateral head displacement and BCF: beat cross frequency. Means bearing
different superscripts (a, b, c
) among extenders at post-thaw stage differ significantly (p<0.01)

Proceedings of the Annual Research Review Workshop 2019, BLRI, Savar, Dhaka 1341, January 26-27, 2020
Technical Session V 117
A number of previously studied gene transcript related with different biological functions of sperm
were selected from published research articles for searching candidate marker genes to predict
semen quality and fertility. Semen characteristics of RCC bull were studied and semen was
cryopreserved for experimental purposes. AI is conducting for evaluation of conception rates of
cryopreserved semen of individual bull. Moreover, gene expression analysis using quantitative real
time PCR will be conducted for identification candidate gene/marker for prediction of sperm quality
and fertility of bulls.

Proceedings of the Annual Research Review Workshop 2019, BLRI, Savar, Dhaka 1341, January 26-27, 2020
Technical Session V 118
Effect of nitrogen fertilizer on morphological parameter, biomass yield and nutritive
value of Napier fodder
MAI Talukder1, MM Billah
2*, M Shahjahan
2 and ZH Khandaker
3
1Bangladesh Livestock Research Institute, Savar, Dhaka-1341,
2 Dairy Development Research Project, BLRI
Regional Station, Baghabari, Sirajganj-6770 and 3Department of Animal Nutrition, Bangladesh Agricultural
University, Mymensingh 2202, Bangladesh
Executive summary
The yield and chemical composition of fodder varies due to many factors such as the soil quality,
plant density, fertilizer dose, growing season and stage of maturity etc. Among the various factors,
fertilizer application is important which directly contributes to the quality and quantity of fodder
production. In our country nitrogen fertilizer is normally used in the form of Urea and excessive use
of this fertilizer may increase the cultivation cost. So the appropriate level of Urea application in
Napier fodder cultivation is needed to know. It is also established that crude protein content of
forage is increased by increased level of N-fertilizer. Considering the above facts, the present
investigation was carried out to study the effect of nitrogen fertilizer doses on morphological
characteristics, biomass yield and chemical composition of Napier fodder at BLRI Regional Station,
Baghabari, Sirajganj. For the work soil samples were analyzed for soil pH, nitrogen, organic matter,
salinity, Ca, K, S, Zn, Pb, Co, Mg, Fe etc. at the Central Laboratory of Soil Resource Development
Institute (SRDI), Dhaka. The pH
value, organic matter, total nitrogen (N), potassium (K), calcium
(Ca), phosphorus (P), sodium (Na) content of the soil was 6.20, 1.75%,
0.088%,0.15millitulanko/100g,8.05millitulanko/100g,11.66 millitulanko/100 g, 0.15
millitulanko/100 g, respectively. The experiment was conducted by using 4 levels of Nitrogen
fertilizer namely 0 (T1), 50 (T2), 100 (T3) and 150 (T4) kg Urea/ha at 12 plots. Three plots for
every treatment having homogenous soil parameters were taken and the plot size was17ft×10ft.
Fodder was propagated by stem cutting method and sowed in rows. Line to line and plant to plant
distance were 70 and 30 cm, respectively. The plots were prepared by normal agronomical
operations as routine weeding practices with the utensils like sickle, chen, spade etc. were done to
remove undesirable grasses, bushes and plants, irrigation was performed by using a plastic pipe
through a canal with the help of deep tube well in Baghabari station. In each experimental plot,
irrigation was performed by using a plastic pipe through a canal with the help of deep tube well in
Baghabari station. The first cut was made at 55 days after the stem sowing and then subsequent
harvest was made at 40 days after each cutting. After each cutting, the plot was loosen manually by
spade and urea was applied as top dressed. During the time of harvest, records of plant height, stem
length, leaf length, number of leaf per stem, number of till per hill, yield per hill and total biomass
yield were taken from each of the plot. All the recorded data were analyzed using ‘SPSS’ statistical
program to compute analysis of variance following one way ANOVA for Completely Randomized
Design (CRD).
Effect of nitrogen fertilizer doses on morphological characteristics and biomass yield of Napier
fodder is presented in Table 1. The result showed that the application of nitrogen fertilizer had
significant (P<0.01) effect on plant height and highest plant height (235.44±8.79 cm) was observed
at 100 kgN/ha (T3) at 60 days age. However, application of nitrogen fertilizer from urea did not
show any significant effect on stem length and leaf per stem of plant. A significant effect (P<0.01)
in biomass yield was observed between the groups and highest yield (101.76±1.89 Ton/ha) was
observed at 150 kg Urea/ha (T4). Effect of nitrogen fertilizer doses on chemical composition of
Napier fodder is presented in Table 2. The application of nitrogen fertilizer significantly (P<0.05)
increased the dry matter content of Napier grass and highest DM content (21.03±0.16) was observed
at 150 kgN/ha. Here showed a highly significant difference (P<0.01) among the groups for chemical
composition of Napier due to increasing rate of N fertilizer and highest CP (13.78±0.06), ADF
(43.60±0.04) and NDF (64.27±0.04) were observed at 150 kgN/ha group.

Proceedings of the Annual Research Review Workshop 2019, BLRI, Savar, Dhaka 1341, January 26-27, 2020
Technical Session V 119
N.B: T1 (0 kg Urea/ha), T2 (50 kg Urea/ha), T3 (100 kg Urea/ha) and T4 (150 kg Urea/ha)
N.B: T1 (0 kg Urea/ha), T2 (50 kg Urea/ha), T3 (100 kg Urea/ha) and T4 (150 kg Urea/ha)
From the results of the present study, it may be concluded that the application of N at the rate of 150
Kg/ha could be used for Napier grass production.

Proceedings of the Annual Research Review Workshop 2019, BLRI, Savar, Dhaka 1341, January 26-27, 2020
Technical Session V 120
Development of a mini processing plant for safe poultry meat production
MSK Sarker1, MRA Sumon
1, NR Sarker
2 and F Sharmin
3
1Poultry Production Research Division,
2Director General, Bangladesh Livestock Research Institute Savar,
Dhaka and 3Post-Doctoral Fellow, Bangabandhu Science and Technology Fellowship Trust
Executive summary
Meat consumption in developing countries has been continuously increasing and will reach per
capita 37 kg around the year 2030 according to FAO projection. This forecasting suggests that in a
few decades, consumption of meat will move towards that of developed countries where meat
consumption remains stagnant at a high level. According to Gaya (2006), the main attributes related
to poultry meat that may determine its quality are color and its water holding capacity. The ability of
preserving food in general is related to environmental air quality and temperature, as well as
conditioning and packaging characteristics (Fletcher et al., 2000). Poultry meat is a perishable
product consisting of protein, carbohydrates, lipids, and water. Product conservation must meet
certain standards in order to preserve its quality until consumption by the final user. In order to
reduce risks, the standards of agricultural and food production such as Good Farming Practice
(GFP), Good Slaughtering Practice (GSP) and Hazard Analysis Critical Control Point (HACCP)
concept etc. have been implemented to control food chains thoroughly. Therefore, the present
ongoing research was undertaken to know the effect of processing procedures, shelf life and other
quality characteristics of poultry meat. These data will be required for labeling the nutrition fact on
the packaged meat. Moreover, packing and branding of the products with BLRI logo & following
HACCP guidelines. In previous year, as a part of the present study the existing problems of the mini
processing plant were identified and accordingly the current activities of the project were designed.
At the end of a broiler trial at our division 10 birds per treatment were randomly selected and
weighed. The samples of breast and thigh-drumstick were collected to determine the chemical
composition of meat. The nutritional quality of breast and thigh meat was analyzed. The frozen
samples of meat were dissected into small pieces and homogenized in a blender. Moisture, protein,
fat, and ash contents of breast and thigh meat samples were determined following the standard
procedures (AOAC, 2000). Ten samples per treatment were randomly selected and collected from
breast and thigh meat. The pH values of each pectoral muscle sample were determined using a
digital pH meter. Cooking loss was determined based on the formula:
Cooking loss= (cooked weight/initial weight) ×100
The meat color values were obtained using a Minolta colorimeter after calibration expressed as y=
92.80, x=0.313, and y=0.319, and duplicate readings per sample was determined. Each treatment
reading was expressed as the CIE L*, a*, and b* color space value, respectively.
In Table 1 represented that thiobarbituric acid (TBA) values were not significantly different among
the 4 dietary treatments. According to (Gheisari, 2011) the extent of oxidative rancidity in a fat may
also be determined by its TBA number. The 2- thiobarbituric acid (TBA) test is believed to measure
the breakdown products of unsaturated fatty acid oxidation.
Table 1. Different meat quality characteristics of broiler feeding with different feed additives
Treatment PH TBA Cooking loss Color values
L* a* b*
T0 6.30 8.81 18.25 53.33a 4.44
bc 9.01
T1 6.36 10.8 15.04 49.11b 6.41
a 7.23
T2 6.23 8.63 18.36 51.23ab
3.48c 8.21
T3 6.42 11.19 17.76 51.99a 5.31
ab 8.67
SEM 0.043 0.693 0.606 0.526 0.399 0.385
P-Value 0.498 0.472 0.169 0.016 0.038 0.42
* Meat color values of lightness (L*), redness (a*), and yellowness (b*)
T0 = Control, T1 = antibiotic, T2 = Probiotic(Bacillus), T3 = Probiotic(Lactobacillus)

Proceedings of the Annual Research Review Workshop 2019, BLRI, Savar, Dhaka 1341, January 26-27, 2020
Technical Session V 121
For hygienic meat production proper processing procedure was following and will be followed with
the principles of HACCP. Hence, after completion of all the planned activities this processing plant
will serve the purpose of supplying safe poultry meat to the consumers. From next Financial Year
(2020-21) similar replicated processing plants will be established in 5 regions (Rajshahi, Jashore,
Faridpur, Saidpur and Nikhongchari) through the Strengthening of Poultry Research and
Development Project for the different community people.

Proceedings of the Annual Research Review Workshop 2019, BLRI, Savar, Dhaka 1341, January 26-27, 2020
Technical Session V 122
Impact of sheep project on socioeconomic conditions and sheep management practices
in selected areas of Bangladesh
MR Amin, MKH Majumder, M Ershaduzzaman, M Yesmin, MM Rahman and FT Jahura
Conservation and Improvement of Native Sheep through community and commercial farming project
(Component A, Research-2nd
phase), BLRI, Savar, Dhaka
Executive summary
Livestock plays a vital role for the economy of Bangladesh. Quality protein mainly comes from
animal protein source. Small ruminants, specially goat and sheep are very effective source of quality
protein supply through meat and milk. Most of the small ruminants of the country belong to
landless, marginal and small farmers. Improvement in the productivity of small ruminants especially
sheep will directly benefit the poorest part of the society, through poverty reduction, employment
generation and improvement of nutrition. The present study was conducted to assess the impact of
the project “Conservation and Improvement of Native Sheep through Community and Commercial
Farming (Component A, Research-2nd
Phase)”. The objectives of the research work are to identify
the socio-demographic characteristics of native sheep farmer; to assess the before and after effects of
native sheep rearing on livelihoods of beneficiary farmer; to assess the before and after changes of
native sheep management practices; to assess the problems facing by the farmer in native sheep
rearing; and to suggest adequate policy recommendation. The project implementation created
noticeable awareness and changes among the sheep farming communities of selected 11 Upazilas of
6 District. Relevant primary data was collected from project beneficiaries with the help of interview
schedule through direct interview. Data will be analyzed with a combination of descriptive statistics
& the appropriate econometric models.
From the research, it was found that the average age and family size of sheep farmers were found
42.86 years and 4.01 respectively. The male-female ratio of sheep farming households was 1.01.
The dependency ratio of the households was 2.22. Most of the sheep farmer were found uneducated.
About 53.31 percent farmers were found that they only can sing. About 52.42 percent family
member including respondent were found agriculture as their main occupation. The average land
holdings of the households were found 158.13 decimal. Average sheep per households was
increased 100.79 percent in the project areas. Remarkable livelihoods improvement is occurred
among the project beneficiary farmers. On an average all kinds of livelihood assets were increased
by 54.09 percent.
Figure 1. Changes in household income, expenditure and savings (yearly)
The average annual income of the sheep farming household was increased by 62.81 percent. Annual
savings of the sheep farmers were increased by 80.49 percent. Both male and female participation in
sheep rearing was found increased remarkably. Most of the household’s expenditure increases
remarkably. The average expenditure of sheep farmer were found 144661.00 (Tk.) per year which is
62.81 percent higher than before of implementation of sheep project. It implies that both demand
and purchasing power of sheep farmers increased remarkably. A noticeable improvement occurred
in neo-natal nourishment practices of sheep. Housing facility, anthelmentic and vaccine uses were
found increased by 438.89, 1275.00 and 3567.00 percent respectively. Mixed feeding system was
0
50000
100000
150000
200000
250000
Average family
income
Average family
expenditure
Annual savings
124274.69
92325
31949.69
202328.91
144661
57667.91
Before (Tk)
After (Tk)
0
10
20
30
40
50
60
70
80
90
Average family
income
Average family
expenditure
Annual savings
62.81 56.67
80.49 Changes (%)
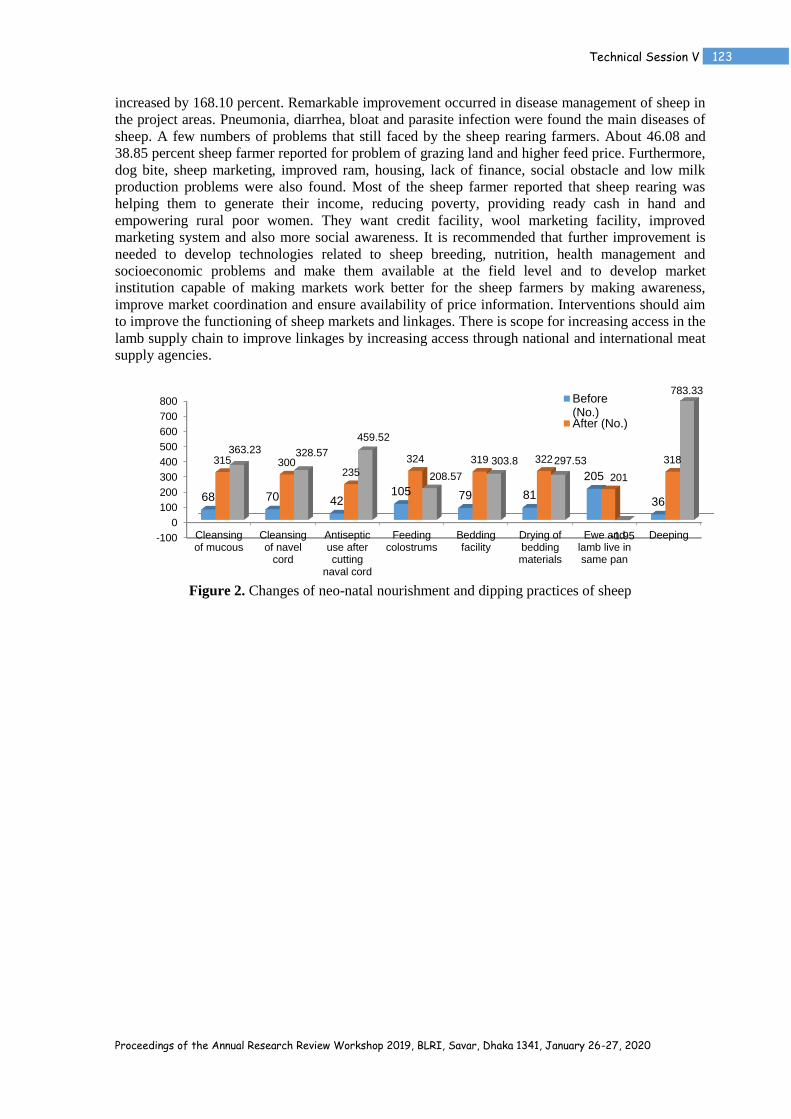
Proceedings of the Annual Research Review Workshop 2019, BLRI, Savar, Dhaka 1341, January 26-27, 2020
Technical Session V 123
increased by 168.10 percent. Remarkable improvement occurred in disease management of sheep in
the project areas. Pneumonia, diarrhea, bloat and parasite infection were found the main diseases of
sheep. A few numbers of problems that still faced by the sheep rearing farmers. About 46.08 and
38.85 percent sheep farmer reported for problem of grazing land and higher feed price. Furthermore,
dog bite, sheep marketing, improved ram, housing, lack of finance, social obstacle and low milk
production problems were also found. Most of the sheep farmer reported that sheep rearing was
helping them to generate their income, reducing poverty, providing ready cash in hand and
empowering rural poor women. They want credit facility, wool marketing facility, improved
marketing system and also more social awareness. It is recommended that further improvement is
needed to develop technologies related to sheep breeding, nutrition, health management and
socioeconomic problems and make them available at the field level and to develop market
institution capable of making markets work better for the sheep farmers by making awareness,
improve market coordination and ensure availability of price information. Interventions should aim
to improve the functioning of sheep markets and linkages. There is scope for increasing access in the
lamb supply chain to improve linkages by increasing access through national and international meat
supply agencies.
Figure 2. Changes of neo-natal nourishment and dipping practices of sheep
-100
0
100
200
300
400
500
600
700
800
Cleansingof mucous
Cleansingof navel
cord
Antisepticuse aftercutting
naval cord
Feedingcolostrums
Beddingfacility
Drying ofbeddingmaterials
Ewe andlamb live insame pan
Deeping
68 70 42 105 79 81
205
36
315 300 235
324 319 322
201
318 363.23 328.57
459.52
208.57
303.8 297.53
-1.95
783.33 Before(No.)After (No.)

Proceedings of the Annual Research Review Workshop 2019, BLRI, Savar, Dhaka 1341, January 26-27, 2020
Technical Session V 124
Development of system generated database at BLRI research farm for genetic
evaluation in progressive generations
S Ahmed1, MA Habib
2 and MYA Khan
3
1Support Service Division,
2Fodder Research and Development Project and
3Animal Production Research
Division, Bangladesh Livestock Research Institute, Savar, Dhaka 1341, Bangladesh
Executive summary
Animal recording is a generic term that integrates animal identification and registration, animal
traceability, animal health information and animal performance recording. Animal identification is a
top priority for any genetic improvement program. Errors in identification can lower estimates of
genetic variability and can result in biased genetic evaluations. Animal recording and registrations
are needed to improve the breed or population. So, successful animal breeding requires collection
and storage of data on individually identified animals; complete pedigree information and
appropriate statistical methods and computing hardware. Without these pieces of information little
genetic change can be made in a population. Records need to be stored electronically for computer
manipulation and data analyses. On-farm computer database systems have also helped in the
collection of data. A good farm management keeps lots of register to run their farm more precisely
like livestock register, breeding register, milk register, calf register, feed register, health and disease
registeretc. BLRI also maintains such type of records. At present BLRI cattle and buffalo research
farm owns three different genotypes of cattle as; BCB-1, RCC and Munshiganj and two genotypes
of buffalo as indigenous and crossbred for conservation and research purposes. Since its inception, a
lot of data had been generated to date. These data are mainly being kept in paper book. However, it
is very difficult to pick up all data in a summarized form from this paper book for genetic evaluation
of all individuals in the herd. Computer aided analytical programs (CAAP) are now very much
convenient ways to make it ease of such type of complex task. To do so, a system generated
computer based database is essentially needed for BLRI animal research farm. Therefore, to
digitalize farm database, this work was designed with a view to develop an up-to-date system
generated database software that could be useable both in PC and mobile phone.
A team composed of a software developer; animal breeders and animal nutritionists planned and
designed the thematic features of the software prior to develop. In the software, input facility of
economic important traits of all individuals exposed from birth up to end of productive life was
created with systematic arrangements (Fig. 1 and Fig. 2). Based on the imputed data, output will be
obtained within a moment. The software will facilitate to filter the data of an individual from large
data set very easily. Besides, population data of any trait of interest will be obtained for extraction
from the whole dataset followed by statistical analyses. The software is securely stored in cloud
hosted by Microsoft Corporation with monthly payment system. It is lifelong protected, not publicly
open and authorized users may visit this site with their user password. In the software, vaccination,
calving and feeding schedules along with breeding calendar, disease calendar, breeding plan etc.
were incorporated for farm operation smoothly.
Finally, it may be concluded that the developed database software will help in storing data
permanently and hence, decision for selection and culling of animals based on the genetic merit
analyzed by taking data from the software will be very convenient for farm manager.
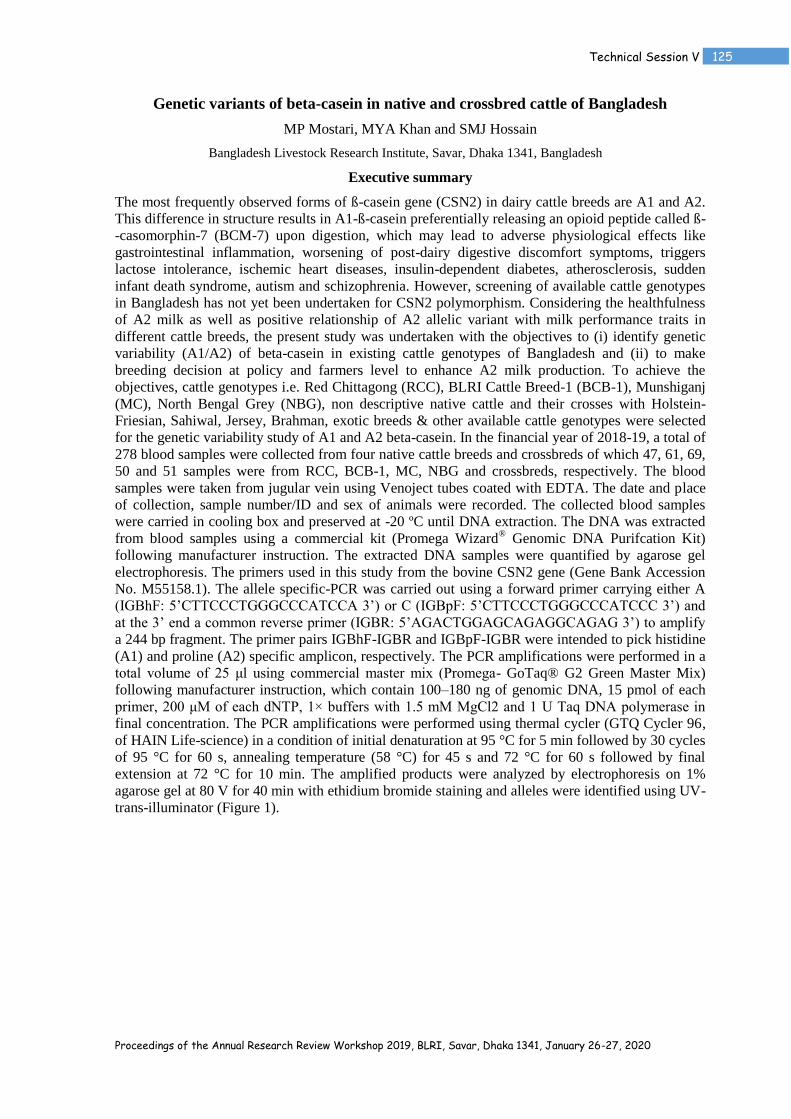
Proceedings of the Annual Research Review Workshop 2019, BLRI, Savar, Dhaka 1341, January 26-27, 2020
Technical Session V 125
Genetic variants of beta-casein in native and crossbred cattle of Bangladesh
MP Mostari, MYA Khan and SMJ Hossain
Bangladesh Livestock Research Institute, Savar, Dhaka 1341, Bangladesh
Executive summary
The most frequently observed forms of ß-casein gene (CSN2) in dairy cattle breeds are A1 and A2.
This difference in structure results in A1-ß-casein preferentially releasing an opioid peptide called ß-
-casomorphin-7 (BCM-7) upon digestion, which may lead to adverse physiological effects like
gastrointestinal inflammation, worsening of post-dairy digestive discomfort symptoms, triggers
lactose intolerance, ischemic heart diseases, insulin-dependent diabetes, atherosclerosis, sudden
infant death syndrome, autism and schizophrenia. However, screening of available cattle genotypes
in Bangladesh has not yet been undertaken for CSN2 polymorphism. Considering the healthfulness
of A2 milk as well as positive relationship of A2 allelic variant with milk performance traits in
different cattle breeds, the present study was undertaken with the objectives to (i) identify genetic
variability (A1/A2) of beta-casein in existing cattle genotypes of Bangladesh and (ii) to make
breeding decision at policy and farmers level to enhance A2 milk production. To achieve the
objectives, cattle genotypes i.e. Red Chittagong (RCC), BLRI Cattle Breed-1 (BCB-1), Munshiganj
(MC), North Bengal Grey (NBG), non descriptive native cattle and their crosses with Holstein-
Friesian, Sahiwal, Jersey, Brahman, exotic breeds & other available cattle genotypes were selected
for the genetic variability study of A1 and A2 beta-casein. In the financial year of 2018-19, a total of
278 blood samples were collected from four native cattle breeds and crossbreds of which 47, 61, 69,
50 and 51 samples were from RCC, BCB-1, MC, NBG and crossbreds, respectively. The blood
samples were taken from jugular vein using Venoject tubes coated with EDTA. The date and place
of collection, sample number/ID and sex of animals were recorded. The collected blood samples
were carried in cooling box and preserved at -20 ºC until DNA extraction. The DNA was extracted
from blood samples using a commercial kit (Promega Wizard® Genomic DNA Purifcation Kit)
following manufacturer instruction. The extracted DNA samples were quantified by agarose gel
electrophoresis. The primers used in this study from the bovine CSN2 gene (Gene Bank Accession
No. M55158.1). The allele specific-PCR was carried out using a forward primer carrying either A
(IGBhF: 5’CTTCCCTGGGCCCATCCA 3’) or C (IGBpF: 5’CTTCCCTGGGCCCATCCC 3’) and
at the 3’ end a common reverse primer (IGBR: 5’AGACTGGAGCAGAGGCAGAG 3’) to amplify
a 244 bp fragment. The primer pairs IGBhF-IGBR and IGBpF-IGBR were intended to pick histidine
(A1) and proline (A2) specific amplicon, respectively. The PCR amplifications were performed in a
total volume of 25 μl using commercial master mix (Promega- GoTaq® G2 Green Master Mix)
following manufacturer instruction, which contain 100–180 ng of genomic DNA, 15 pmol of each
primer, 200 μM of each dNTP, 1× buffers with 1.5 mM MgCl2 and 1 U Taq DNA polymerase in
final concentration. The PCR amplifications were performed using thermal cycler (GTQ Cycler 96,
of HAIN Life-science) in a condition of initial denaturation at 95 °C for 5 min followed by 30 cycles
of 95 °C for 60 s, annealing temperature (58 °C) for 45 s and 72 °C for 60 s followed by final
extension at 72 °C for 10 min. The amplified products were analyzed by electrophoresis on 1%
agarose gel at 80 V for 40 min with ethidium bromide staining and alleles were identified using UV-
trans-illuminator (Figure 1).

Proceedings of the Annual Research Review Workshop 2019, BLRI, Savar, Dhaka 1341, January 26-27, 2020
Technical Session V 126
Figure 1. Identification of A1 and A2 alleles in crossbreds through AS-PCR and agarose gel
electrophoresis
Genotype frequencies of A2A2, A1A2 and A1A1 in RCC were 89.40, 10.60 and 0.00. However, the
corresponding frequencies in BCB-1 were 85.25, 13.11 and 1.64 and, in MC were 79.70, 18.80 and
1.40, and, in NBG were 72.00, 28.00 and 0.00 and, in crossbreds were 64.71, 29.41 and 5.88,
respectively (Table 1).
Table 1. Genotype frequencies of beta-casein in RCC, BCB-1, MC, NBG and crossbred cattle
Breeds No. of
Sample
Genotype frequency
A2A2 A1A2 A1A1
RCC 47 89.4 (n=42) 10.6 (n=5) 0 (n=0)
BCB-1 61 85.25 (n=52) 13.11 (n=8) 1.64 (n=1)
MC 69 79.70 (n=55) 18.88 (n=13) 1.40 (n=1)
NBG 50 72.00(n=36) 28.00(n=14) 0.00(n=0)
Crossbreds 51 64.71 (n=33) 29.41(n=15) 5.88(n=3)
In conclusion, so far data obtained, it may be stated that, most of the native cattle and crossbreds
have A2A2 genotype. Compare to native, crossbreds have higher A1A2. No A1A1 was observed in
RCC and NBG population. The present investigation offers a plenty of scope for changing gene
frequency through using A2A2 genotyped bulls in artificial insemination program.
Crossbreds, PCR-amplified for A1 and A2 genes A1
A2
A1
A2
A1
A2
A1
A2
A1
A2
A1
A2
A1
A2
DNA Ladder
bp
2510
50
75
10
2000
Genotypes
A1A2
A1A2
A1A2
A1A2
A1A1
A2A2
A1A2
Proceedings of the Annual Research Review Workshop 2019, BLRI, Savar, Dhaka 1341, January 26-27, 2020
Technical Session V 127
Conservation and improvement of farm animal genetic resources (FAnGR) at Hilly
region at Naikhongchari
MA Alam1, M Ershaduzzman
1, R Khatun
1, A Hossen
1, KMS Hossain
1, MM Rahman
3 MY Ali
1
and NR Sarker2
1System Research Division;
2Poultry Production Research Division and
3Biotechnology Division,
Bangladesh Livestock Research Institute, Savar, Dhaka 1341, Bangladesh
Executive summary
The aim of the study is to improve the production potentialities of the native genetic resources of
livestock at Hilly regions. The Hilly Brown Bengal (HBB) goats, Hilly chickens and Gayal are
available at hill tracts region of Bangladesh. The main objectives of the research work was to
evaluate the productive and reproductive performances of HBB goats, hilly chickens and gayal and
their improvement and conservation at Naikhongchari; to know the influence of dietary
supplementation on growth of HBB goats at growing stage; to find out the current herd structure of
gayal and their dynamic movement at hilltract areas. The experiment was conducted at Bangladesh
Livestock Research Institute, Regional Station Research Farm, Naikhongchari, Bandarban. The
hilly chickens were reared in open sided poultry house with standard management system. On the
other hands, sixteen HBB goat of 5 month age were selected and their average initial body weight
was 7.86 kg. The animals were randomly grouped into T0, T1, T2 and T3 having 4 replications in
each group and duration of the experiment period was 105 days. The diet of different level of
energy viz. standard energy (ME content 10.26MJ/kg DM) (NRC, 1981), low energy (10% less,
ME content 9.25MJ/kg DM) and high energy (10% high, ME content 11.30MJ/kg DM) than
standard energy and Napier-4 as a basal diet were supplied to T1, T2 and T3 group respectively, and
T0 (control) were grazing in the field and reared in conventional system. All treatment groups were
supplied concentrate @1.5% of the body weight of goat. Another activity of field survey of Gayal
was conducted at Ruma, Thanchi and Bilaichariupazilla of Chittagong Hill tract region with the
help of respective local Livestock Offices and tribal people through structured questionnaire. In
hilly chicken study, result showed that average body weight of 861.10±17g in growing period up
to 12 weeks of age. The body weights of hilly growing chicken were lower than previous year. The
feed intake and mortality of hilly chicken up to 12 weeks of age was 33.5±13g/bird/ day and
8.46±1.87% which was higher than previous year. It was found that hatchability of eggs was
62.12±9.13% hatched by both broody hens and the incubator. However, hatchability percentage of
hilly chicken is slightly lower than previous year. The adult body weight up to 30 weeks of age of
hen and cock were 1852.67±17g and 3097.23±11g respectively. The egg production (H.D) of hilly
chicken was 36.60±5% which was increase from previous year. Egg weight and day old chick
weight of chicken were 45.34±7g and 30.01±5g respectively. Age at first egg, feed consumption
and mortality of hilly chickens were 157 days, 84.48g and 15.27% respectively. Gayalsurvey result
showed that about 18% and 38% farmers reared deshi cattle and chicken together with gayal, the
average 82.48% farmers were illiterate, family size 5.23 and their farming experience about 22
years. The average monthly income of the farmers was found 18890.65taka. Gayal population at
Ruma, Thanchi and Bilaichari upazilla were 300(60), 360(65) and 185(40) respectively and the
average number of gayal of the household were 5.12. About 95% farmers were not supplied
concentrate feed to their gayal and 44% farmers provided anthelmintics and no vaccine were
administered to their gayal whereas respondents replied about 72% gayals were affected by FMD
and 74% affected by worm. Result showed that total DM intake of T0, T1, T2 and T3 treatment
group were 278.18±22.15, 280.77±15.4, 250.67±9.87 and 298.23±8.35g/day; the initial body
weight were 7.85±0.30, 7.50±0.33, 7.88±0.38 and 8.20±0.24 kg/goat and the final body weight
(kg) of 12.57±0.46, 12.98±0.48, 12.10±0.30 and 13.88±0.37 kg/goat respectively. There were
significant (p<0.05) differences of initial body weight and final body weight among T2 and T3
treatments groups of growing HBB goat. Daily weight gain of HBB goat were 44.96±3.15,
52.19±4.06, 40.21±2.93 and 54.09±2.79g/day at T0, T1, T2 and T3 treatment group respectively. It
may be concluded that high energy level contents of the diet had significant (p<0.05) effect on
body weight changes of growing hilly goat. The production potentialities of different type of

Proceedings of the Annual Research Review Workshop 2019, BLRI, Savar, Dhaka 1341, January 26-27, 2020
Technical Session V 128
genetic resources of livestock and poultry at hill tracts region should be improved through better
management, feeding, health care and genetics.

83
Annual Research Review Workshop 2019
Workshop Committee and Different Sub-Committees
Workshop Committee
1. Head, Animal Production Research Division Convener
2. Head, Biotechnology Division Member
3. Head, Poultry Production Research Division Member
4. Head, Animal Health Research Division Member
5. Head, Goat and Sheep Research Division Member
6. Head, System Research Division Member
7. Head, Socio-Economic Research Division Member
8. Head, Training, Planning and Technology Testing Division Member Secretary
Invitation, Press-Publication and Stage Sub-committee
1. Dr. Md. Giasuddin, PSO, Animal Health Research Division Convener
2. Mohammad Lutful Haque, System Analyst Member
3. Member
4. Halima Khatun, SO, Poultry Production Research Division Member
5. Most. Farhana Afroz, SO, Biotechnology Division Member
6. Md. Shah Alam, Information Officer Member Secretary
Program Planning and Paper Preparation Sub-committee
1. Dr. Md. Giasuddin, PSO, Animal Health Research Division Convener
2. Dr. Md. Sazedul Karim Sarker, SSO, Poultry Production Research Member
3. Dr. Biplob Kumar Ray, SSO, Animal Production Research Division Member
4. Member
5. Dr. Gautam Kumar Deb, SSO, Biotechnology Division Co-opt member
6. Dr. Rezia Khatun, SSO Co-opt member
7. Dr. Sadek Ahmed, SO, Goat & Sheep Production Research Division Member
8. Member
9. Division Member Secretary
Refreshment, Resident and Transport Sub-Committee
1. Dr. Md. Azharul Islam Talukder, PSO and Head, Goat and Sheep
Research Division
Convener
2. Dr.Md. Abdul Jalil, PSO, Goat and Sheep Research Division Member

84
3. Dr. Biplob Kumar Ray, SSO, Animal Production Research Division Member
4. Shamim Ahmed, SO, Training, Planning and Technology Testing
Division
Member
5. Md. Khairul Bashar, SO, Animal Production Research Division Member
6. Md. Ponir Chowdhury, SO, Goat and Sheep Research Division Member
7. Md. Ahsan Habib, Security Officer Member
8. Md. Abdus Samad, Sub-Assistant Engineer Member Secretary
Registration Sub-committee
1. Dr. Md. Ershaduzzaman, PSO and Head, System Research Division Convener
2. Dr. Parvin Mostari, SSO, Animal Production Research Division Member
3. Dr. Md. Zillur Rahman, SSO, Training, Planning and Technology Testing
Division
Member
4. Dr. Md. Rakibul Hassan, SO, Poultry Production Research Division Member
5. Md. Khorshed Alam, PhD Fellow, Fodder Research and Development
Project
Member
6. DR. Md. Hafizur Rahman, SO, Animal Health Research Division Member
7. Shakila Faruque, SSO, Poultry Production Research Division Member Secretary
Environment Sub-Committee
1. Md. Ashraful Islam, Executive Engineer Convener
2. Dr. Md. Giasuddin , PSO and Head, Animal Health Research Division Member
3. Dr. SM Jahangir Hossain, PSO, Animal Production Research Division Member
4. Md. Ahsan Habib, Security Officer Member
5. Md. Abdul Karim, LDA-cum-Typist, Biotechnology Division Member
6. Md. Abdul Malek, Messenger, Support Service Division Member
7. Md. Abdus Samad, Sub Assistant Engineer Member Secretary
SESSION I
ANIMAL AND POULTRY DISEASES
AND HEALTH

SESSION II
ANIMAL AND POULTRY BREEDING
AND GENETICS

SESSION III
FEEDS, FODDER AND NUTRITION

SESSION IV
BIOTECHNOLOGY, ENVIRONMENT
AND CLIMATE RESILIENCE
SESSION V
SOCIOECONOMICS AND FARMING
SYSTEM RESEARCH

POSTER SESSION