
Proceedings of the WORKSHOP ON NEW ASPECTS AND ...
163
DEPARTMENT OF PHYSICS THE UNIVERSITY OF IOANNINA MAY 5-6, 2017 HELLENIC INSTITUTE OF NUCLEAR PHYSICS Proceedings of the WORKSHOP ON NEW ASPECTS AND PERSPECTIVES IN NUCLEAR PHYSICS 4 th Edited by A. Pakou ▪ C. Papachristodoulou
-
Upload
khangminh22 -
Category
Documents
-
view
6 -
download
0
Transcript of Proceedings of the WORKSHOP ON NEW ASPECTS AND ...
DEPARTMENT OF PHYSICS
THE UNIVERSITY OF IOANNINA
MAY 5-6, 2017
H E L L E N I C I N S T I T U T E O F N U C L E A R P H Y S I C S
Proceedings of the
WORKSHOP ON NEW ASPECTS AND PERSPECTIVES IN NUCLEAR PHYSICS 4 th
Edited by
A. Pakou C. Papachristodoulou
H E L L E N I C I N S T I T U T E O F N U C L E A R P H Y S I C S
PROCEEDINGS
of the
4th WORKSHOP on New Aspects and Perspectives in Nuclear Physics
(HINPW4)
DEPARTMENT OF PHYSICS
THE UNIVERSITY OF IOANNINA
MAY 5-6, 2017
ORGANISING COMMITTEE
X. Aslanoglou University of Ioannina
D. Bonatsos NCSR “Demokritos”
K. Ioannides University of Ioannina
G.A. Lalazissis Aristotle University of Thessaloniki
N.G. Nicolis University of Ioannina
A. Pakou University of Ioannina
C. Papachristodoulou University of Ioannina
G. Souliotis National and Kapodistrian University of Athens
K. Stamoulis University of Ioannina
EDITORS
A. Pakou, C. Papachristodoulou
HINPW4 WEB-SITE
http://hinpw4.physics.uoi.gr/
WORKSHOP SPONSORS
University of Ioannina www.uoi.gr
VECTOR Technologies Ltd www.vectortechnologies.gr
FOREWORD The 4th Workshop on new Aspects and Perspectives in Nuclear Physics (HINPW4) was held in Ioannina from May 5 to 6, 2017. This series of symposia, organized by the Hellenic Institute of Nuclear Physics since 2012, provides a lively forum not only for leading scientists of the Greek Universities and Institutes but also for fresheners in the field of Nuclear Physics to share the most recent advancements on various topics, thus offering a unique platform to exchange ideas and keep track of new aspects and perspectives in the area. This year, there has been a very enthusiastic response, resulting in approximately 50 participants, mostly young scientists and post-graduate students. A total of 22 oral contributions were included in the agenda, in addition to 8 lectures delivered by distinguished colleagues invited from abroad. We are grateful to all the speakers and participants and especially to the invited speakers for their overwhelming response and participation in the Workshop. The Workshop sessions covered the topics of Nuclear Structure and Nuclear Reactions, Hadron Physics and Environmental, Medical and Archaeometry Applications, with emphasis on Nuclear Reactions. All invited and contributed talks were of high quality and the articles based on the talks are collected together in the present volume. We would like to thank the University of Ioannina for hosting the Workshop at the “Carolos Papoulias” Conference Center, and for providing accommodation of participants at the “Stavros Niarchos” guesthouse. Financial support by VECTOR Technologies LtD is warmly acknowledged. We also thank the Vice Rector of the University of Ioannina and the Dean of the School of Sciences for their kind presentations in the opening session. To O. Sgouros and V. Soukeras, PhD students of the University of Ioannina, we express our gratitude for providing us with the Workshop webpage and for their untiring efforts towards the successful organization of the Workshop. Last, but not least, I personally would like to cordially thank the President of HINP, G. Lalazissis, for his thoughtful gesture to honor me with a HINP plaque, as well as N. Alamanos for his touching farewell speech and accompanying letter, applauding my career so far and putting his trust in my future scientific work. These are included in the end of this volume. Athena Pakou on behalf of the Organizing Committee Ioannina, August 2017
Contents
I N V I T E D A N D C O N T R I B U T E D P A P E R S ( i n p r o g r a m m e o r d e r )
Covariant density functionals in nuclear physics and their microscopic origin P. Ring
1
Evolution of ideas in direct and fusion reactions N. Alamanos
8 Everything is coupled; reactions with weakly bound projectiles K. Rusek
9 Light charged particle production in reactions induced by weakly-bound projectiles: Still an open question N. Keeley
12 The EXOTIC project at INFN-LNL D. Pierroutsakou et al.
18 NUMEN project @ LNS: Status and perspectives F. Cappuzzello et al.
23 Speed of sound bounds, tidal polarizability and gravitational waves from neutron stars Ch. Moustakidis et al.
26 Momentum dependent mean-field dynamics for in-medium Y-interactions T. Gaitanos and A. Violaris
33 Spin-orbit splittings of neutron states in N = 20 isotones from covariant density functionals (CDF) and their extensions K. Karakatsanis et al.
39 A symmetry for heavy nuclei: Proxy-SU(3) D. Bonatsos et al.
46 Proxy-SU(3) symmetry in heavy nuclei: Foundations D. Bonatsos et al.
50 Parameter-independent predictions for shape variables of heavy deformed nuclei in the proxy-SU(3) model D. Bonatsos et al.
57 Prolate dominance and prolate-oblate shape transition in the proxy-SU(3) model D. Bonatsos et al.
63 Nuclear Physics Using Lasers A. Bonasera
68 EoS studies in heavy ion collisions: from Coulomb barrier to LHC M. Veselsky et al.
69 Production of neutron-rich rare isotopes toward the astrophysical r-process path: recent results and plans G. Souliotis et al.
76 Fission in high-energy proton induced spallation reactions: Recent Progress N. Nicolis et al.
81

AMIAS: A Model Independent Analysis Scheme - From Hadronics to Medical Imaging E. Stiliaris and C.N. Papanicolas
85
A model independent analysis of pion photoproduction data with the AMIAS L. Markou et al.
91 Employing a Novel Analysis Method in the field of Tomographic Image Reconstruction for Single Photon Emission Computed Tomography (SPECT) L. Koutsantonis et al.
97 PhoSim: A Simulation Package designed for Macroscopic and Microscopic Studies in the Time-Resolved Optical Tomography N. Rapsomanikis et al.
101 Mastering Conic Sections for a Direct 3D Compton Image Reconstruction M. Mikeli, M. Zioga et al.
106 Nuclear and atomic techniques to the study of U-bearing formation of Epirus region I.T. Tzifas and P. Misaelides
114 Paleoseismology: Defining the seismic history of an area with the use of the OSL dating method K. Stamoulis et al.
115
210Pb and 7Be concentrations in moss samples from the region of Northern Greece Ch. Betsou et al.
120 Systematic study of proton-induced spallation reactions with microscopic and phenomenological models A. Assimakopoulou et al.
123 Microscopic description of neutron-induced fission with the Constrained Molecular Dynamics (CoMD) Model: recent progress S. Papadimitriou et al.
128 Neutron-rich rare isotope production with stable and radioactive beams in the mass range A = 40-60 at 15 MeV/nucleon A. Papageorgiou et al.
132 Study of 7Be+28Si at near barrier energies: Elastic scattering and alpha production O. Sgouros et al.
136 A global study of the 6Li+p system at near barrier energies in a CDCC approach V. Soukeras et al.
143
I N H O N O R O F P R O F E S S O R A T H E N A P A K O U
HINP honor plaque
Closing speech by N. Alamanos
P A R T I C I P A N T S L I S T
A U T H O R I N D E X

I N V I T E D A N D C O N T R I B U T E D P A P E R S
( i n p r o g r a m m e o r d e r )
Covariant density functionals in nuclear physics and theirmicroscopic origin
Peter Ring1,2 a
1 Physics Department, Technical University of Munich, 85748 Garching, Germany2 School of Physics, Peking University, Beijing 100871, People’s Republic of China
Abstract. Nuclear density functional theory provides a universal description of many nuclear propertiesall over the periodic table. However, at the moment, most of the successful functionals are completelyphenomenological, dependent on up to a dozen parameters, which are adjusted to various experimentaldata in finite nuclei. The predictive power of such functionals is therefore under debate. Microscopicderivations, as they are possible nowadays in Coulombic systems are at their infancy. We discuss here severalattempts to a better microscopic understanding of covariant density functional theory (a) by includingin the fit ab-initio calculations for nuclear matter properties and reducing in this way the number ofphenomenological parameters considerably and (b) by comparing the results of phenomenological resultswith those obtained by relativistic Brueckner-Hartree-Fock theory in finite nuclei, which is based on theG-matrix, a microscopically derived density dependent interaction.
PACS. PACS-key discribing text of that key – PACS-key discribing text of that key
1 Introduction
In recent years considerable progress has been achievedin ab-initio derivations of nuclear properties from barenucleon-nucleon forces. For light nuclei it is possible tosolve the exact nuclear many-body problem on the com-puter. For heavier nuclei approximate methods have beenapplied. The calculation of nuclear properties for the ma-jority of nuclear systems, however, is left to density func-tional theory (DFT). Non-relativistic [1,2] and relativis-tic [3–7] versions enable an effective description of the nu-clear many-body problem not only for bulk properties,such as binding energies and radii, but also for collec-tive excitations such as rotations and giant resonances,and, by going beyond mean field, for complicated config-urations [8–12] and for sophisticated low-lying spectra intransitional nuclei [13,14].
At present most of these functionals are purely phe-nomenological. Of course, one of the main goals in nucle-ar physics is to build a universal density functional theorybased on microscopic calculations [15,16]. This functionalshould be able to explain as many as possible measureddata within the same parameter set and to provide reliablepredictions for properties of nuclei far from stability notyet or never accessible to experiments in the laboratory.It should be derived in a fully microscopic way from theinteractions between bare nucleons. At present, however,
a Supported in part by the DFG cluster of excellence ”Originand Structure of the Universe” (www.universe-cluster.de)
attempts to derive such a density functional provide on-ly qualitative results for two reasons: first, the three-bodyterm of the bare interaction is not known well enough and,second, the methods to derive such a functional are notprecise enough to achieve the required accuracy. Note thata 1 per mille error in the binding energy per particle ofsymmetric nuclear matter leads to an error of several MeVin the binding energy of heavy nuclei, an error which is anorder of magnitude larger than required by astrophysicalapplications. From such considerations it is evident, thatsuccessful ab-inito functionals in nuclear physics, at leastin foreseeable future will always depend on a very smallnumber of phenomenological parameters for fine tuning.It is the number of final parameters which counts.
One of the underlying symmetries of QCD is Lorentzinvariance and therefore covariant density functionals areof particular interest in nuclear physics. This symmetrynot only allows to describe the spin–orbit coupling, whichhas an essential influence on the underlying shell struc-ture, in a consistent way, but it also puts stringent restric-tions on the number of parameters in the correspondingfunctionals without reducing the quality of the agreementwith experimental data [17]. It is true, that the velocitiesof nucleons in the Fermi sea are relatively small and theirkinetic energy is small compared to the rest mass. How-ever, because of the large scalar field their effective Diracmass is considerably reduced and the velocity dependentspin-orbit term is dramatically increased, such that evensmall velocities lead to large effects, which cannot be treat-
user
Text Box
1

2
ed by perturbation theory. Of course, a non-relativistic ex-pansion is possible, but it leads to various correction termsat the cost of a lot of additional phenomenological param-eters [18]. A well known example is the spin-orbit term innon-relativistic density functionals. Therefore we restrictourselves in the following to covariant density functionalstheory (CDFT).
2 Phenomenological covariant DFT’s
In contrast to non-relativistic functionals of Skyrme [1]or Gogny [2] type, which start from the beginning withroughly a dozen parameters and a simple power-law of∼ ρ1/3 for the density dependence, relativistic function-als, such as the Walecka model [3] start with only fourparameters, the coupling constants for the three mesonsgσ, gω, gρ, and the mass mσ of the σ-meson. These forparameters are clearly connected with basic properties ofthe effective nuclear force: medium range attraction (gσ),short range repulsion (gω), isospin dependence (gω) andthe range of the force (mσ), which determines the surfaceproperties, such as radii in finite nuclei. The details are,however more complicated. As Boguta and Bodmer [19]have pointed out already very early, this linear model failsto describe nuclear systems as for instance nuclear com-pressibility or nuclear deformations [20] . This was thebirthday of covariant density functional theory and fromthat moment all the efforts of additional phenomenolog-ical parameters has been devoted to a better descriptionof the density dependence. To keep the theory renormal-izable Boguta et. al. used a ϕ4-ansatz and introduced twoadditional parameters g2 and g3 for the cubic and quarticcoupling of σ-mesons and therefore all the early successfulparameter sets, such as for instance NL3 [21] or its modernversion NL3* [22] had only 6 parameters.
In these and in many other relatively successful pa-rameter sets the density dependence enters only in the iso-scalar channel. This leads to rather large neutron skins atthe upper end of the experimental error bars, to a neutronequation of state deviating considerably from theoreticalpredictions [23,24] and to a rather stiff symmetry energyS2(ρ). The parameter L = 3ρdS2/dρ at saturation is larg-er then 120 MeV and far above the usual adopted valueof L ≈ 50 MeV. Since renormalizability plays no role inphenomenological density functional theory modern func-tionals, such as DD-ME2 [25] eliminate non-linear mesoncouplings and introduce density dependent coupling con-stants gσ(ρ), gω(ρ), and gρ(ρ) with depend, apart fromtheir values at saturation on additional four parameterswhich are fitted to finite nuclei. In particular they includealso a density dependence in the isovector channel andthis allows also a much better description of the EoS ofneutron matter and of the symmetry energy.
Calculations with finite meson masses are still rela-tively complicated and therefore modern point-couplingfunctionals have been developed [26–28]. In the zero-rangelimit the meson exchange terms are replaced by contac-t terms of the proper spin- and isospin dependence and
three coupling constants at saturation gσ, gω, gρ are re-placed by the coupling constants αS , αV , and αST andthe finite mass mσ leads to a derivative term in the scalarisoscalar channel with the strength δS . Again one has fourparameters and their density dependence. All in all onehas roughly 10 phenomenological parameters. This seemsa similar number as in the non-relativistic case, but thereis a difference: in the relativistic models most of the pa-rameters (roughly 6) are used for a sophisticated descrip-tion of the density dependence, where Skyrme or Gognyuse only a power law ρα, and even that α is most caseschosen as fixed α = 1
3or α = 1
3 Semi-microscopic covariant DFTs
In Coulombic system an essential input for the derivationof microscopic functionals [29] is the exact numerical solu-tion of the homogeneous electron gas at various densities.Starting from this energy functional E[ρ] additional gra-dient terms and many other corrections have been addedwith great success.
Therefore it seems to be reasonable to apply a similarconcept in nuclear physics. Of course, at present there areno exact solutions of the nuclear matter problem available.One has to rely on approximate solutions, such as sophis-ticated variational calculations [23] or modern Brueckner-Hartree-Fock methods [24]. The covariant point couplingfunctional DD-PC1 of the Munich-Zagreb group [28] usedthis microscopic input together with experimental mas-ses of 64 heavy deformed nuclei in order to adjust 10phenomenological parameters, the four coupling αS , αV ,αST , and δS at saturation and six further parameters todescribe the density dependence. The result is a semi-microscopic functional with an EoS nearly identical to themicroscopic EoS of the Ilinois group [23], which can beused at higher densities in neutron stars with much moreconfidence than the extrapolations of phenomenologicalfunctionals adjusted only at saturation density and below.
0 0.1 0.2 0.3
ρ ( fm−3
)
-20
0
20
40
E /
A (
MeV
)
BHF BaldoDD-MEδ
Fig. 1. Equation of state (EoS) for symmetric nuclear mat-ter and for pure neutron matter as a function of the nucleondensity. Details are given in the text (from Ref. [30].)
user
Text Box
P. Ring: Covariant density functionals in nuclear physics and their microscopic origin 2

3
0 0.05 0.1 0.15 0.2 0.25
ρ ( fm−3
)
40
80
120
m* p −
m* n (
MeV
)
DBHF DD-MEδ
Fig. 2. Proton-neutron effective mass splitting as a functionof the nucleon density in pure neutron matter (from Ref. [30])
Recently we went a step further [30]. We followed thespirit of the Barcelona group [31], who used Brueckner-Hartree-Fock calculations in nuclear matter (see Fig. 1) asa starting point for a semi-phenomenological non-relativis-tic potential, and derived in a similar way a relativisticfunctional DD-MEδ [30] with density dependent mesoncouplings. In contrast to the phenomenological covariantdensity functionals, where the isospin dependence is com-pletely determined by the vector ρ-meson, microscopicDirac-Brueckner-Hartree-Fock (DBHF) calculations [32]show very clearly that there is also a isospin dependencein the scalar channel described by the isovector δ-meson(sometimes called a0). The density dependence of the me-son nucleon coupling vertices in the new functional DD-MEδ [30] is derived from ab-initio DBHF calculations innuclear matter. As shown in Fig. 1 the starting pointforms the Equation of State (EoS) of symmetric nucle-ar matter and of neutron matter derived by Baldo etal. [24] in a state-of-the-art non-relativistic Brueckner-Hartree-Fock calculation including relativistic correctionsand three-body forces. In addition the isovector part ofthe effective Dirac mass m∗
p − m∗n, which is derived by
the Tubingen group [32] using DBHF theory, determinesthe coupling constant of the δ-meson and its density de-pendence (see Fig. 2). Only four additional parameters thecoupling constants gσ, gω, gρ at saturation density andmσ
are used for a fine-tuning of binding energies and radii offinite nuclei.
In Fig. 3 we show in the upper panel, that for DD-MEδthe total symmetry energy is obtained as a sum of a nearlylinear kinetic term and the a repulsive contribution fromthe ρ-meson and an attractive contribution from the δ-meson. Both cancel each other to a large extend. A nearlyidentical symmetry energy is obtained in the lower pan-el for DD-ME2 by the ρ-meson alone. Therefore it turnsout that is very difficult to determine the strength of theδ-coupling from masses and radii of finite nuclei alone. Inour calculations this strength has been determined by theisovector effective mass derived from the ab-inito calcula-tions of Ref. [32].
20
40
60
S 2(ρ)
(M
eV)
0 0.1 0.2 0.3 0.4
-20
0
20
40
S 2(ρ)
(M
eV) total
ρ
kin
δδ (approx.)
ρ δ+
ρ
ρtotal
Fig. 3. Upper panel: the symmetry energy S2(ρ) (full in black)and its contributions as a function of the density. Lower panel:the symmetry energy S2(ρ) resulting from the parameter set-s NL3 (triangles), DD-ME2(circles), and DD-MEδ (from Re-f. [30])
0 40 80 120 160 200 240 280Mass number A
-4
-2
0
2
4
6
(Eth
-Eex
p)/|E
exp|*
100
[%]
DD-MEδ
(c)
+0.5%
-0.5%
Fig. 4. The relative difference between theoretical and exper-imental masses of 835 even-even nuclei investigated in rela-tivistic Hartree Bogoliubov (RHB) calculations with the setDD-MEδ If Eth − Eexp < 0, the nucleus is more bound in thecalculations than in experiment. Dashed lines show the ±0.5% limit (from Ref. [33]).
user
Text Box
P. Ring: Covariant density functionals in nuclear physics and their microscopic origin 3
4
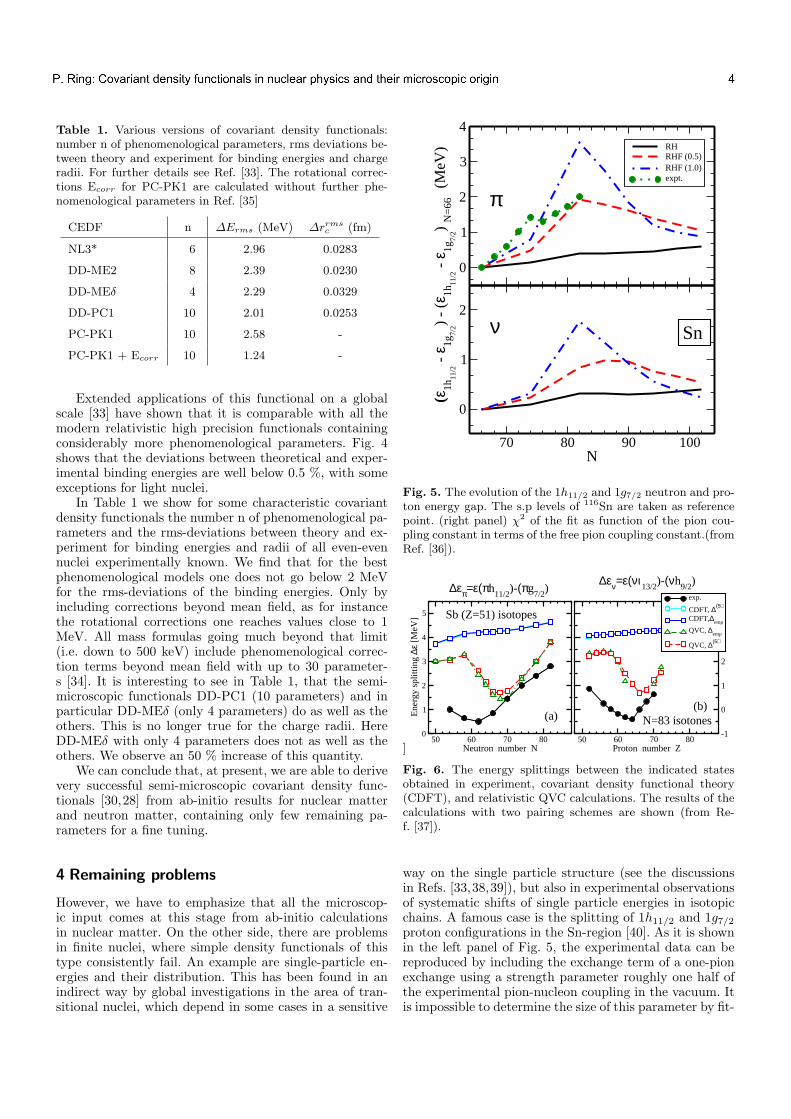
Table 1. Various versions of covariant density functionals:number n of phenomenological parameters, rms deviations be-tween theory and experiment for binding energies and chargeradii. For further details see Ref. [33]. The rotational correc-tions Ecorr for PC-PK1 are calculated without further phe-nomenological parameters in Ref. [35]
CEDF n ∆Erms (MeV) ∆rrmsc (fm)
NL3* 6 2.96 0.0283
DD-ME2 8 2.39 0.0230
DD-MEδ 4 2.29 0.0329
DD-PC1 10 2.01 0.0253
PC-PK1 10 2.58 -
PC-PK1 + Ecorr 10 1.24 -
Extended applications of this functional on a globalscale [33] have shown that it is comparable with all themodern relativistic high precision functionals containingconsiderably more phenomenological parameters. Fig. 4shows that the deviations between theoretical and exper-imental binding energies are well below 0.5 %, with someexceptions for light nuclei.
In Table 1 we show for some characteristic covariantdensity functionals the number n of phenomenological pa-rameters and the rms-deviations between theory and ex-periment for binding energies and radii of all even-evennuclei experimentally known. We find that for the bestphenomenological models one does not go below 2 MeVfor the rms-deviations of the binding energies. Only byincluding corrections beyond mean field, as for instancethe rotational corrections one reaches values close to 1MeV. All mass formulas going much beyond that limit(i.e. down to 500 keV) include phenomenological correc-tion terms beyond mean field with up to 30 parameter-s [34]. It is interesting to see in Table 1, that the semi-microscopic functionals DD-PC1 (10 parameters) and inparticular DD-MEδ (only 4 parameters) do as well as theothers. This is no longer true for the charge radii. HereDD-MEδ with only 4 parameters does not as well as theothers. We observe an 50 % increase of this quantity.
We can conclude that, at present, we are able to derivevery successful semi-microscopic covariant density func-tionals [30,28] from ab-initio results for nuclear matterand neutron matter, containing only few remaining pa-rameters for a fine tuning.
4 Remaining problems
However, we have to emphasize that all the microscop-ic input comes at this stage from ab-initio calculationsin nuclear matter. On the other side, there are problemsin finite nuclei, where simple density functionals of thistype consistently fail. An example are single-particle en-ergies and their distribution. This has been found in anindirect way by global investigations in the area of tran-sitional nuclei, which depend in some cases in a sensitive
0
1
2
3
4RHRHF (0.5)RHF (1.0)expt.
70 80 90 100N
0
1
2
(ε 1h
11/2 -
ε1g
7/2)
- (ε
1h11
/2 -
ε1g
7/2)
N=
66 (
MeV
)
Sn
π
ν
Fig. 5. The evolution of the 1h11/2 and 1g7/2 neutron and pro-ton energy gap. The s.p levels of 116Sn are taken as referencepoint. (right panel) χ2 of the fit as function of the pion cou-pling constant in terms of the free pion coupling constant.(fromRef. [36]).
]50 60 70 80
Neutron number N
0
1
2
3
4
5
Ene
rgy
split
ting
∆ε [M
eV]
50 60 70 80Proton number Z
-1
0
1
2
3
4
exp.
CDFT, ∆(5)
CDFT,∆emp
QVC, ∆emp
QVC, ∆(5)
Sb (Z=51) isotopes
N=83 isotones(a)(b)
∆επ=ε(πh11/2
)-(πg7/2
)∆εν=ε(νι
13/2)-(νh
9/2)
Fig. 6. The energy splittings between the indicated statesobtained in experiment, covariant density functional theory(CDFT), and relativistic QVC calculations. The results of thecalculations with two pairing schemes are shown (from Re-f. [37]).
way on the single particle structure (see the discussionsin Refs. [33,38,39]), but also in experimental observationsof systematic shifts of single particle energies in isotopicchains. A famous case is the splitting of 1h11/2 and 1g7/2proton configurations in the Sn-region [40]. As it is shownin the left panel of Fig. 5, the experimental data can bereproduced by including the exchange term of a one-pionexchange using a strength parameter roughly one half ofthe experimental pion-nucleon coupling in the vacuum. Itis impossible to determine the size of this parameter by fit-
user
Text Box
P. Ring: Covariant density functionals in nuclear physics and their microscopic origin 4

5
ting to bulk properties, such a masses and radii, becausethe best fit is obtained without pion contributions [36].Similar results have also been found in density dependentRelativistic Hartree-Fock (RHF) theory [41].
On the other side, it is an open question, whether theseshifts in observed single particle energies are an indicationof the necessity of effective tensor forces in relativistic den-sity functionals. It is also know, that present nuclear den-sity functionals do not describe the exact solutions of thenuclear many-body problem. There are cases, which can-not be taken into account on the mean field level, andwhere one has to go beyond mean field. An example isparticle vibrational coupling which has a considerable in-fluence on the single particle energies. It can also be treat-ed in covariant density functionals [8,42]. In fact, recentlyit has been shown by A. Afanasjev and E. Litvinova [37]that a large part of the shifting single particle spectra inthe Sn region can be described with the simple functionalNL3 including quasiparticle-vibrational coupling (QVC)(see Fig.6).
5 Microscopic calculations in finite nuclei
The concept to derive density functionals from propertiesof infinite nuclear matter, is very successful for generalproperties of these functionals. However, it cannot teachus too much when it comes to properties of the functional-s, which do not show up in nuclear matter calculations asfor instance the tensor term in spin non-saturated systems.Nuclear matter is usually spin-saturated and therefore thecontributions of the tensor term in first order are small.In order to study such effects from ab-inito calculation-s, we have to carry out microscopic calculations in finitenuclei, in particular also in heavy nuclei, which are notspin-saturated.
An obvious way to carry out such investigations isBrueckner theory, the mother of modern density function-al theory in nuclei [43,44]. The advantage of relativisticBrueckner theory is that one does not need three-bodyforces to get saturation in nuclear matter close to the ex-perimental area. Therefore Dirac-Brueckner-Hartree-Fock(DBHF) theory has been used to describe also finite nu-clei [45–48]. In most of these applications the local den-sity approximation has been used, i.e. in a first step theself-energies are calculated in nuclear matter of variousdensities. In a second step the relativistic Hartree-Fockequations for Walecka-type functionals are solved in fi-nite nuclei with density dependent coupling constants ad-justed to the results of nuclear matter calculations at thecorresponding density. This provides a mapping of the mi-croscopically obtained nuclear matter results onto RHF-models of Walecka type.
Although such calculations are successful, they cannotreach the accuracy of present day phenomenological co-variant density functionals. In particular, the mapping isnot unique and therefore the results of different groups de-viate form each other considerably. It is also clear that thisconcept is relatively useless for a microscopic study of theinfluence of the tensor force in finite non spin-saturated
Table 2. Ground state properties of 16O obtained with RBH-F theory are compared various other approximations andwithexperiment (from Ref. [51]).
E (MeV) rc (fm) ∆Elsπ1p (MeV)
Exp. [56,57] −127.6 2.70 6.3RBHF −120.7 2.55 6.0BHF [58] −105.0 2.29 7.5DDRH [59] −106.4 2.72 −
DDRHF [59] −142.6 2.62 4.5NCSM [60] −119.7 - −
PKO1 [41] −128.3 2.68 6.4
nuclei, because, as discussed above, nuclear matter is spin-saturated.
By this reason we started a new project to solve theDBHF equations in large finite basis. First we started in anoscillator basis [49], but then we found we found a largeDirac-Woods-Saxon (DWS) basis more appropriate [50].There are basis states with positive and negative energies.and cut-off-parameters are introduced for the basis, suchthat convergence is achieved. For details see Ref. [51]
Within relativistic Brueckner-Hartree-Fock (RBHF) the-ory [52–55] the relativistic Hartree-Fock (RHF) equation-s are solved with an effective interaction in the nucle-ar medium, the so-called G-matrix. Its matrix elements⟨ab|G(ω)|cd⟩ are determined by the solution of the Bethe-Goldstone (BG) equation in the DWS basis
G(ω) = V N + V NQF1
ω −H0
QFG(ω). (1)
Here V N are the anti-symmetrized matrix elements ofthe relativistic bare force, H0 are the self-consistent two-particle energies ϵm + ϵm′ of the RHF-operator at eachstep of the iteration, and QF is the Pauli operator
QF =∑
m<m′
|mm′⟩⟨mm′|. (2)
summing over intermediate states m,m′ above the Fermisurface. Of course, since the single particle energies ϵmand ϵm′ refer to the eigenvalues of the RHF-operator, thePauli operator (2) is defined in the corresponding relativis-tic Hartree-Fock basis. Therefore the full solution of thisproblem requires the transformation of the Pauli-operatorfrom the RHF basis to the DWS basis and this is the finalgoal of such calculations. In a first step we applied theso-called Dirac-Woods-Saxon approximation for the Paulioperator, i.e. we use in Eq. (2) DWS states for the wavefunctions |mm′⟩. On the other hand self-consistent RHF-energies ϵm + ϵm′ with the same number of radial nodeswill be used for H0. With a properly chosen DWS-basisthis seems to be a reasonable approximation.
As an application we consider the nucleus 16O. We usethe realistic NN interaction Bonn A which has been ad-justed to the NN scattering data in Ref. [61]. The ground-state properties are listed in Table 2: the total energy,the charge radius, and the proton spin-orbit splitting forthe 1p shell. The results of our full RBHF calculation are
user
Text Box
P. Ring: Covariant density functionals in nuclear physics and their microscopic origin 5

6
compared with the corresponding experimental data andwith several other calculations: BHF is a non-relativisticBrueckner calculation based on the interaction Bonn A.We also show results obtained in RHF-calculations withthe phenomenological effective interaction PKO1, whichhas been fitted to binding energies and charge radii of aset of spherical nuclei. It is seen that the ground-stateproperties in RBHF theory are improved considerably ascompared with the non-relativistic results. This energy of16O is also very close to the value of E = −119.7 MeVobtained in the No Core Shell Model (NCSM) calculationusing the chiral NN interaction N3LO [60]. Of course theresults of the calculations with PKO1 which has been fit-ted to these data shows only a very small deviation fromthe experimental values
Next we compare in Fig. 7 our self-consistent results infinite nuclei with those obtained in Ref. [59] by two ”ab ini-tio” calculations based on the LDA. There the full RBHFequations are solved for nuclear matter at various densities
2.2 2.3 2.4 2.5 2.6 2.7 2.8
-9
-8
-7
-6
PKO1
DDRHF
DDRH
RBHF
BHF
16O
rc (fm)
Exp.16O
E/A
(MeV
)
Fig. 7. Energy per particle and charge radius of 16O by (rel-ativistic) BHF theories compared with experimental data andother calculations. See text for details (from Ref. [51]).
6 5 4 3 2 1
-80
-60
-40
-20
0 BHF Exp. RBHF
Proton
r (fm)
Ener
gy (M
eV)
0 1 2 3 4 5 6
Neutron
RBHF Exp.
16O
r (fm)
1p3/2
1p1/2
1s1/2
Fig. 8. Single-particle spectra for protons and neutrons ob-tained from the solution of the RHF-equation are comparedwith experimental values [57]. The red line corresponds to alocal potential V (r) + S(r) in a Dirac equation producing thesame wave function and the same eigenvalue for the lowest1s1/2 state as the full RBHF-equation (from Ref. [51]).
and the corresponding scalar and vector self-energies arederived. Then density-dependent coupling strengths forthe exchange of various mesons in a relativistic Hartree(RH) or a RHF model have been adjusted to these re-sults. In this case it is possible to investigate finite nucleiin an ab inito DDRH or DDRHF approach without anyphenomenological parameters.
The single-particle energy levels of 16O for protonsand neutrons obtained from the full RBHF calculationare plotted in Fig. 8. They are compared with experimen-tal data and (for the protons) with the results of non-relativistic BHF calculations.
6 Conclusions
In summary, the full relativistic Brueckner-Hartree-Fock(RBHF) equations have been solved in a Dirac-Woods-Saxon (DWS) basis. The relativistic structure of the two-body matrix elements as well as of the Pauli operator isfully taken into account. The only input is the bare NN -interaction Bonn A adjusted to the scattering phase shiftsin Ref. [61]. No other parameter is used. Since nuclearmatter calculations within the same framework produceresults far away from the Coester line and close to theexperimental values of saturation, we neglect at this stagethree-body forces.
Despite the good agreement of these results, there isroom for improvements. The RBHF-theory presented hereis no exact solution of the nuclear many-body problem. Sofar, rearrangement terms are not taken into account andhigher order diagrams in the hole-line expansion are notincluded. Those effects have been taken into account insome approximation in non-relativistic calculations [62],but for relativistic theories they are left for future inves-tigations.
On the other side, our method has the potential to in-vestigate heavier nuclei, where exact solutions are impossi-ble, in particular systems without spin saturation and withlarge neutron excess. In this case we hope to be able togain a parameter-free, microscopic understanding of openquestions in modern phenomenological density functionaltheories, such as their isospin dependence or the impor-tance of the tensor terms [36].
7 Aknowledgments
I would like to express my deep gratitude to all my collab-orators, who contributed to the results presented in thiscontribution, in particular to Anatoli Afanasjev, GeorgeLalazissis, Elena Litvinova, Jie Meng, Takaharu Otsuka,Xavier Roca-Maza, Shihang Shen, and Milena Serra†. Thiswork was partly supported by the DFG cluster of excel-lence “Origin and Structure of the Universe” (www.universe-cluster.de).
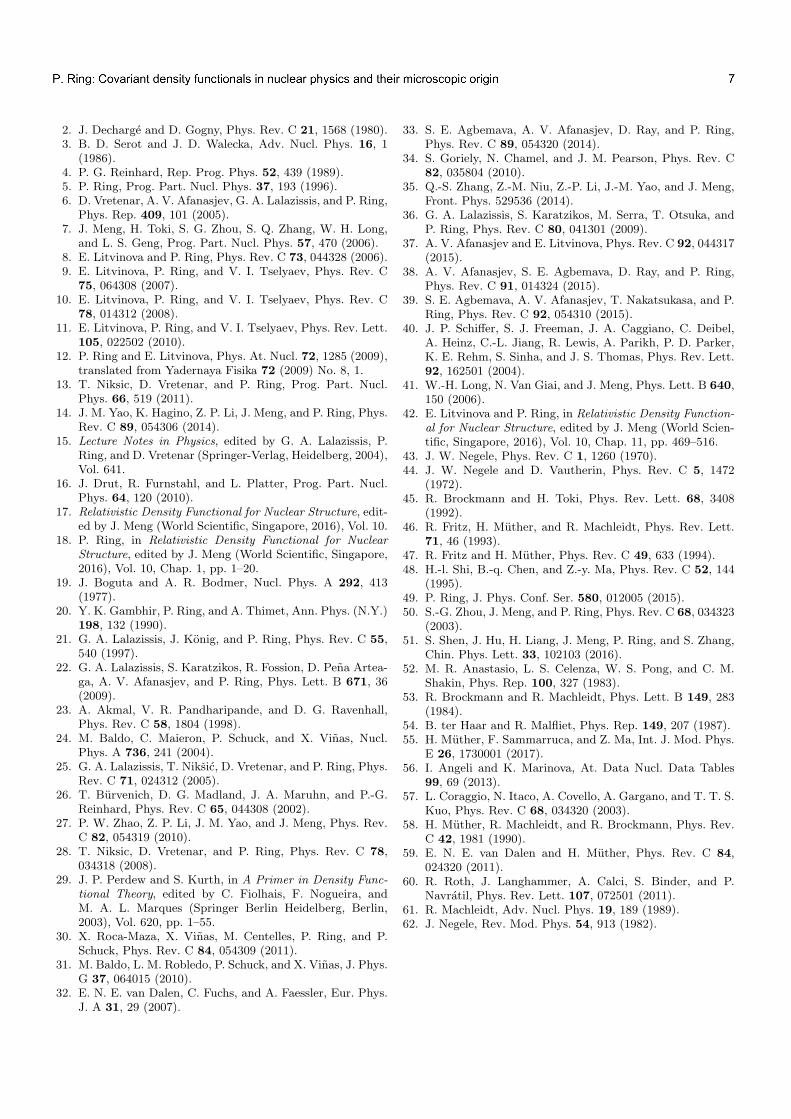
References
1. D. Vautherin and D. M. Brink, Phys. Rev. C 5, 626 (1972).
user
Text Box
P. Ring: Covariant density functionals in nuclear physics and their microscopic origin 6
7
2. J. Decharge and D. Gogny, Phys. Rev. C 21, 1568 (1980).3. B. D. Serot and J. D. Walecka, Adv. Nucl. Phys. 16, 1
(1986).4. P. G. Reinhard, Rep. Prog. Phys. 52, 439 (1989).5. P. Ring, Prog. Part. Nucl. Phys. 37, 193 (1996).6. D. Vretenar, A. V. Afanasjev, G. A. Lalazissis, and P. Ring,
Phys. Rep. 409, 101 (2005).7. J. Meng, H. Toki, S. G. Zhou, S. Q. Zhang, W. H. Long,
and L. S. Geng, Prog. Part. Nucl. Phys. 57, 470 (2006).8. E. Litvinova and P. Ring, Phys. Rev. C 73, 044328 (2006).9. E. Litvinova, P. Ring, and V. I. Tselyaev, Phys. Rev. C
75, 064308 (2007).10. E. Litvinova, P. Ring, and V. I. Tselyaev, Phys. Rev. C
78, 014312 (2008).11. E. Litvinova, P. Ring, and V. I. Tselyaev, Phys. Rev. Lett.
105, 022502 (2010).12. P. Ring and E. Litvinova, Phys. At. Nucl. 72, 1285 (2009),
translated from Yadernaya Fisika 72 (2009) No. 8, 1.13. T. Niksic, D. Vretenar, and P. Ring, Prog. Part. Nucl.
Phys. 66, 519 (2011).14. J. M. Yao, K. Hagino, Z. P. Li, J. Meng, and P. Ring, Phys.
Rev. C 89, 054306 (2014).15. Lecture Notes in Physics, edited by G. A. Lalazissis, P.
Ring, and D. Vretenar (Springer-Verlag, Heidelberg, 2004),Vol. 641.
16. J. Drut, R. Furnstahl, and L. Platter, Prog. Part. Nucl.Phys. 64, 120 (2010).
17. Relativistic Density Functional for Nuclear Structure, edit-ed by J. Meng (World Scientific, Singapore, 2016), Vol. 10.
18. P. Ring, in Relativistic Density Functional for Nuclear
Structure, edited by J. Meng (World Scientific, Singapore,2016), Vol. 10, Chap. 1, pp. 1–20.
19. J. Boguta and A. R. Bodmer, Nucl. Phys. A 292, 413(1977).
20. Y. K. Gambhir, P. Ring, and A. Thimet, Ann. Phys. (N.Y.)198, 132 (1990).
21. G. A. Lalazissis, J. Konig, and P. Ring, Phys. Rev. C 55,540 (1997).
22. G. A. Lalazissis, S. Karatzikos, R. Fossion, D. Pena Artea-ga, A. V. Afanasjev, and P. Ring, Phys. Lett. B 671, 36(2009).
23. A. Akmal, V. R. Pandharipande, and D. G. Ravenhall,Phys. Rev. C 58, 1804 (1998).
24. M. Baldo, C. Maieron, P. Schuck, and X. Vinas, Nucl.Phys. A 736, 241 (2004).
25. G. A. Lalazissis, T. Niksic, D. Vretenar, and P. Ring, Phys.Rev. C 71, 024312 (2005).
26. T. Burvenich, D. G. Madland, J. A. Maruhn, and P.-G.Reinhard, Phys. Rev. C 65, 044308 (2002).
27. P. W. Zhao, Z. P. Li, J. M. Yao, and J. Meng, Phys. Rev.C 82, 054319 (2010).
28. T. Niksic, D. Vretenar, and P. Ring, Phys. Rev. C 78,034318 (2008).
29. J. P. Perdew and S. Kurth, in A Primer in Density Func-
tional Theory, edited by C. Fiolhais, F. Nogueira, andM. A. L. Marques (Springer Berlin Heidelberg, Berlin,2003), Vol. 620, pp. 1–55.
30. X. Roca-Maza, X. Vinas, M. Centelles, P. Ring, and P.Schuck, Phys. Rev. C 84, 054309 (2011).
31. M. Baldo, L. M. Robledo, P. Schuck, and X. Vinas, J. Phys.G 37, 064015 (2010).
32. E. N. E. van Dalen, C. Fuchs, and A. Faessler, Eur. Phys.J. A 31, 29 (2007).
33. S. E. Agbemava, A. V. Afanasjev, D. Ray, and P. Ring,Phys. Rev. C 89, 054320 (2014).
34. S. Goriely, N. Chamel, and J. M. Pearson, Phys. Rev. C82, 035804 (2010).
35. Q.-S. Zhang, Z.-M. Niu, Z.-P. Li, J.-M. Yao, and J. Meng,Front. Phys. 529536 (2014).
36. G. A. Lalazissis, S. Karatzikos, M. Serra, T. Otsuka, andP. Ring, Phys. Rev. C 80, 041301 (2009).
37. A. V. Afanasjev and E. Litvinova, Phys. Rev. C 92, 044317(2015).
38. A. V. Afanasjev, S. E. Agbemava, D. Ray, and P. Ring,Phys. Rev. C 91, 014324 (2015).
39. S. E. Agbemava, A. V. Afanasjev, T. Nakatsukasa, and P.Ring, Phys. Rev. C 92, 054310 (2015).
40. J. P. Schiffer, S. J. Freeman, J. A. Caggiano, C. Deibel,A. Heinz, C.-L. Jiang, R. Lewis, A. Parikh, P. D. Parker,K. E. Rehm, S. Sinha, and J. S. Thomas, Phys. Rev. Lett.92, 162501 (2004).
41. W.-H. Long, N. Van Giai, and J. Meng, Phys. Lett. B 640,150 (2006).
42. E. Litvinova and P. Ring, in Relativistic Density Function-
al for Nuclear Structure, edited by J. Meng (World Scien-tific, Singapore, 2016), Vol. 10, Chap. 11, pp. 469–516.
43. J. W. Negele, Phys. Rev. C 1, 1260 (1970).44. J. W. Negele and D. Vautherin, Phys. Rev. C 5, 1472
(1972).45. R. Brockmann and H. Toki, Phys. Rev. Lett. 68, 3408
(1992).46. R. Fritz, H. Muther, and R. Machleidt, Phys. Rev. Lett.
71, 46 (1993).47. R. Fritz and H. Muther, Phys. Rev. C 49, 633 (1994).48. H.-l. Shi, B.-q. Chen, and Z.-y. Ma, Phys. Rev. C 52, 144
(1995).49. P. Ring, J. Phys. Conf. Ser. 580, 012005 (2015).50. S.-G. Zhou, J. Meng, and P. Ring, Phys. Rev. C 68, 034323
(2003).51. S. Shen, J. Hu, H. Liang, J. Meng, P. Ring, and S. Zhang,
Chin. Phys. Lett. 33, 102103 (2016).52. M. R. Anastasio, L. S. Celenza, W. S. Pong, and C. M.
Shakin, Phys. Rep. 100, 327 (1983).53. R. Brockmann and R. Machleidt, Phys. Lett. B 149, 283
(1984).54. B. ter Haar and R. Malfliet, Phys. Rep. 149, 207 (1987).55. H. Muther, F. Sammarruca, and Z. Ma, Int. J. Mod. Phys.
E 26, 1730001 (2017).56. I. Angeli and K. Marinova, At. Data Nucl. Data Tables
99, 69 (2013).57. L. Coraggio, N. Itaco, A. Covello, A. Gargano, and T. T. S.
Kuo, Phys. Rev. C 68, 034320 (2003).58. H. Muther, R. Machleidt, and R. Brockmann, Phys. Rev.
C 42, 1981 (1990).59. E. N. E. van Dalen and H. Muther, Phys. Rev. C 84,
024320 (2011).60. R. Roth, J. Langhammer, A. Calci, S. Binder, and P.
Navratil, Phys. Rev. Lett. 107, 072501 (2011).61. R. Machleidt, Adv. Nucl. Phys. 19, 189 (1989).62. J. Negele, Rev. Mod. Phys. 54, 913 (1982).
Powered by TCPDF (www.tcpdf.org)Powered by TCPDF (www.tcpdf.org)Powered by TCPDF (www.tcpdf.org)Powered by TCPDF (www.tcpdf.org)Powered by TCPDF (www.tcpdf.org)Powered by TCPDF (www.tcpdf.org)
user
Text Box
P. Ring: Covariant density functionals in nuclear physics and their microscopic origin 7
Evolution of ideas in direct and fusion reactions N. Alamanos
CEA-Saclay, DAPNIA-SPhN, Gif-sur-Yvette, France
Abstract. The evolution of our ideas in the domain of elastic and inelastic scattering as well as of direct and fusion reactions at near- and sub-barrier energies will be presented briefly. Start point will be our first attempts to describe elastic and inelastic scattering via the JLM model, without adjustable parameters, up to recent analyses using this model and aiming to obtain experimental matter radii. This new observable, "matter radii", will be compared to state-of-the-art ab-initio calculations and challenge their predictive strength. Fusion of very neutron-rich nuclei may be important to determine the composition and heating of the crust of accreting neutron stars. The evolution of our ideas in this domain will be discussed. Near- and sub-barrier fusion results will be compared to modern theoretical calculations (CDCC, density-constrained Hartree-Fock calculations). Personal ideas for both direct and sub- or near-barrier fusion reactions will be given, responding to the questions "where do we stand? What is next?".
user
Text Box
8

Everything is coupled; reactions with weakly bound projectiles
K. Rusek
Heavy Ion Laboratory, University of Warsaw, Poland
Abstract. Weakly bound light nuclei are ideal to study the importance of coupling effects observed in ex-periments devoted to elastic scattering, transfer reactions and fusion. Dominant effects come from couplingsto the breakup channels while the effects of transfer reactions are of less importance.
PACS. 25.45.De Elastic and inelastic scattering – 25.60.-t Reactions induced by unstable nuclei – 24.10.EqCoupled-channel and distorted-wave models
1 Introduction
In nuclear physics we deal with real and virtual processes,allowed by quantum mechanics. As an example of a virtualprocess we may take the case where a projectile nucleusis raised to an excited state in the field of a target nu-cleus and then decays back to the ground state before ithas traversed this field. It may also happen that insteadof excitation, a nucleon is transfered back and forth whenthe two nuclei collide. At first glance such a process isindistinguishable from elastic scattering. However, it wasdemonstrated in experiments with polarized lithium iso-topes that analysing powers are very sensitive to such cou-plings [1]. The elastic scattering cross section also showssensitivity to coupling effects [2] while the influence of thedirect reaction channels (mainly excitations of the nucleiinvolved) on the fusion cross section is the subject of along lasting discussion [3].
2 Elastic scattering and couplings to the
breakup and transfer channels
In experiments with a weakly bound projectile its desin-tegration in the field of the target nucleus is the dom-inant process at forward scattering angles, so couplingsof the elastic scattering to the breakup channels mustplay a dominant role. In order to study these effects oneneeds a more microscopic model than the Optical Model(OM) usually applied to analyses of elastic scattering data.One of the best is the Continuum-Discretized Coupled-Channels (CDCC) model developed originally for d elas-tic scattering [4]. This is an extension of coupled channelstechnique to allow treatment of the couplings to resonantand non-resonant states from the continuum.
The coupling effect depends on energy and is pro-nounced at energies close to the Coulomb barrier. An
example is shown in Fig. 1. In the upper panel the ex-perimental data for 6Li+28Si elastic scattering taken ata bombarding energy slightly above the barrier are plot-ted. A standard analysis using the OM underestimatesthe data (dotted curve) while inclusion of couplings tothe 6Li → α+d breakup channels (CDCC method) im-proves significantly the description of the data (dashedcurve). The couplings increase the differential cross sec-tions, a general trend also observed for other scatteringsystems at energies from the vicinity of the Coulomb bar-rier. Such an increase could be simulated in OM calcula-tions by a reduction of the real part of the OM potential.Thus, the couplings to the breakup channels correspondto a repulsive real term added to the standard OM poten-tial, the so called Dynamic Polarization Potential (DPP).This conclusion is in agreement with many other observa-tions reported previously for various scattering systems.At higher bombarding energies, well above the Coulombbarrier, the effective reduction of the real part of the OMpotential by the breakup leads to another observation - thedifferential cross section for elastic scattering is supressedat forward scattering angles in comparison with the OMprediction [8]. This is due to the fact that at higher ener-gies the scattering amplitude is dominated by the far-sidecomponent being reduced by weaker attraction in the fieldof the target [9].
The analysis by the CDCC method provides predic-tions for the breakup channel. They are plotted as thedashed curve in the lower panel of Fig. 1 and coincidewell with the measured values of the breakup differentialcross section (open dots).
Breakup is one of many processes that could be in-duced in the scattering of two nuclei, one of the mostprobable is transfer of neutrons. Indeed, in the 6Li+28Siexperiment discussed here the largest cross section wasmeasured for the one-neutron transfer reaction leading tomany states in the final nucleus, 29Si [7]. The effect of cou-pling to the transfer channels on the elastic scattering has
user
Text Box
9
2 K. Rusek: Everything is coupled..
6Li +
28Si, 13 MeV
σ / σ
R
no coupl. br br+tr
0 50 100 150
10–2
10–1
100
101
θcm (deg)
σ (m
b/sr
)
1n transfer
6Li breakup
0 50 100 150
10–1
100
101
102
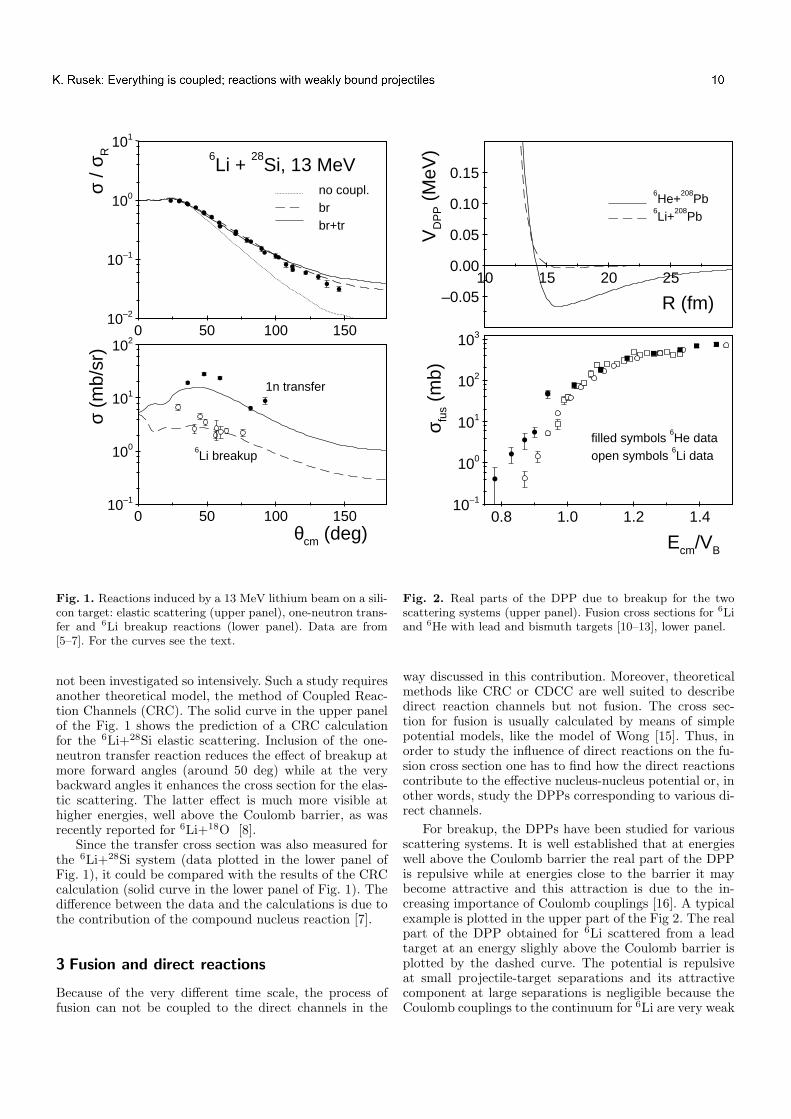
Fig. 1. Reactions induced by a 13 MeV lithium beam on a sili-con target: elastic scattering (upper panel), one-neutron trans-fer and 6Li breakup reactions (lower panel). Data are from[5–7]. For the curves see the text.
not been investigated so intensively. Such a study requiresanother theoretical model, the method of Coupled Reac-tion Channels (CRC). The solid curve in the upper panelof the Fig. 1 shows the prediction of a CRC calculationfor the 6Li+28Si elastic scattering. Inclusion of the one-neutron transfer reaction reduces the effect of breakup atmore forward angles (around 50 deg) while at the verybackward angles it enhances the cross section for the elas-tic scattering. The latter effect is much more visible athigher energies, well above the Coulomb barrier, as wasrecently reported for 6Li+18O [8].
Since the transfer cross section was also measured forthe 6Li+28Si system (data plotted in the lower panel ofFig. 1), it could be compared with the results of the CRCcalculation (solid curve in the lower panel of Fig. 1). Thedifference between the data and the calculations is due tothe contribution of the compound nucleus reaction [7].
3 Fusion and direct reactions
Because of the very different time scale, the process offusion can not be coupled to the direct channels in the
R (fm)
VD
PP (
MeV
)
6He+
208Pb
6Li+
208Pb
10 15 20 25
–0.05
0.00
0.05
0.10
0.15
Ecm/VB
σ fus (
mb)
filled symbols 6He data
open symbols 6Li data
0.8 1.0 1.2 1.4
10–1
100
101
102
103
Fig. 2. Real parts of the DPP due to breakup for the twoscattering systems (upper panel). Fusion cross sections for 6Liand 6He with lead and bismuth targets [10–13], lower panel.
way discussed in this contribution. Moreover, theoreticalmethods like CRC or CDCC are well suited to describedirect reaction channels but not fusion. The cross sec-tion for fusion is usually calculated by means of simplepotential models, like the model of Wong [15]. Thus, inorder to study the influence of direct reactions on the fu-sion cross section one has to find how the direct reactionscontribute to the effective nucleus-nucleus potential or, inother words, study the DPPs corresponding to various di-rect channels.
For breakup, the DPPs have been studied for variousscattering systems. It is well established that at energieswell above the Coulomb barrier the real part of the DPPis repulsive while at energies close to the barrier it maybecome attractive and this attraction is due to the in-creasing importance of Coulomb couplings [16]. A typicalexample is plotted in the upper part of the Fig 2. The realpart of the DPP obtained for 6Li scattered from a leadtarget at an energy slighly above the Coulomb barrier isplotted by the dashed curve. The potential is repulsiveat small projectile-target separations and its attractivecomponent at large separations is negligible because theCoulomb couplings to the continuum for 6Li are very weak
user
Text Box
K. Rusek: Everything is coupled; reactions with weakly bound projectiles 10

K. Rusek: Everything is coupled.. 3
E (MeV)
6Li +
28Si
dashed – no coupl.
dotted – br
solid – br + tr
Dqe
l
4 6 8 10 12 14
0.00
0.05
0.10
0.15
0.20
0.25
0.30
0.35
Fig. 3. Predicted Coulomb barrier distributions for 6Li+28Si.For comparison with the data see [14].
(no E1 excitations). For 6He the dipole couplings to theα+2n continuum are strong and they generate the attrac-tive component of the DPP (solid curve). Thus, one mayexpect that in low energy experiments, sensitive to theeffective potential at large separations, the Coulomb bar-rier for 6He+208Pb is lower than that for 6Li+208Pb and,consequently, the fusion cross section for the latter sys-tem is reduced in comparison with the previous one. Thisspeculation is in agreement with the experimental resultsplotted in the lower panel (fusion cross sections are plot-ted as a function of the energy divided by the nominalCoulomb barrier for the corresponding system).
For transfer reactions, much less is known about theDPPs generated by these channels. Complex analysis of6He+206Pb experimental data [17] has shown that neutron-transfer reactions included in the CRC calculations led toa strong reduction of the imaginary part of the effectivepotential that became of the typical ”short range” Woods-Saxon form, leaving the real part of the effective potentialuntouched.
4 Effect on the Coulomb barrier distribution
The problem of the influence of direct reaction channels onfusion cross section is related to investigations of Coulombbarrier distributions. The experimental studies rely mainlyon measurements of the quasielastic scattering excitationfunction performed at backward scattering angles. Its firstderivative (Dqel(E) in Fig. 3) reflects the Coulomb barrierdistribution for a given scattering system [18] and it is de-pendent on couplings to the various direct reaction chan-nels. The curves presented in Fig. 3 show the predictionsfor such a dependence resulting from CRC calculationsfor the 6Li+28Si system (for comparison with the datasee [14]). As in the case of elastic scattering, coupling tothe breakup channels has the dominant influence on thedistribution while the one-neutron transfer reaction mod-ifies this result only slightly.
5 Summary
Coupling to the breakup channels affects strongly the elas-tic scattering differential cross sections and contributes tothe generation of analysing powers. Depending on the en-ergy, this coupling may enhance or reduce the elastic crosssection values with respect to ”static” OM predictions.The effect of transfer reactions on the elastic scattering isespecially important at backward scattering angles wherean enhancement of the elastic scattering differential crosssection due to transfer channels was reported.
Direct reaction channels may significantly affect fusioncross section predictions with respect to those based ona ”static” potential model, e.g. enhance the predictionsbelow the Coulomb barrier and supress them above it. Inexperiments investigating Coulomb barrier distributionsbreakup tends to broaden the distribution and to increaseits average energy, while the role of the transfer is of lessimportance.
The best way to investigate coupling effects is to per-form a series of complementary experiments and collect avariety of data. So far not many data sets exist that coverall posible reaction channels for a given pair of nuclei.However, one good example of such a set is the data forthe 6Li+28Si system collected by Professor Athena Pakouand her team and discussed in this contribution.
All the calculations presented in this contribution wereperformed by means of the computer code FRESCO [19].
6 Aknowledgements
The author aknowledges financial support from the Min-istry of Science and Higher Education of Poland and stim-ulating discussions with dr Nicholas Keeley.
References
1. D. Fick, G. Grawert and Irena M. Turkiewicz, Phys. Reports214 (1992) 1.
2. N. Keeley et al., Eur. Phys. J. A 50, 145 (2014).3. J. J. Kolata et al., Eur. Phys. J. A 52, 123 (2016).4. G.H. Rawitsher, Phys. Rev. C 9, 2210 (1974).5. A. Pakou et al., Phys. Lett. 633, 691 (2006).6. A. Pakou et al., Phys. Rev. C 69, 054602 (2004).7. A. Pakou et al., Phys. Rev. C 76, 054601 (2007).8. K. Rusek et al., Phys. Rev. C 91, 044612 (2015).9. Y. Sakuragi, Phys. Rev. C 35, 2161 (1987).10. R. Wolski et al., Eur. Phys. J. A 47, 111 (2011).11. J.J. Kolata et al., Phys. Rev. Lett. 81, 4580 (1998).12. Y.W. Wu et al., Phys. Rev. C 68, 044605 (2003).13. M. Dasgupta et al., Phys. Rev. C 66, 041602 (2002).14. K. Zerva et al., Phys. Rev. C 82, 044607 (2010).15. C.Y. Wong, Phys. Rev. Lett. 31, 766 (1973).16. K. Rusek, Eur. Phys. J. A 41, 399 (2009).17. L. Standylo et al. Phys. Rev. C 87, 064603 (2013).18. J.P. Fernandez-Garcia et al., Phys. Rev. C 92, 054602(2015).
19. I.J. Thompson, Comput. Phys. Rep. 7, 167 (1988).
Powered by TCPDF (www.tcpdf.org)Powered by TCPDF (www.tcpdf.org)
user
Text Box
K. Rusek: Everything is coupled; reactions with weakly bound projectiles 11
Light charged particle production in reactions induced byweakly-bound projectiles: Still an open question.
N. Keeley
National Centre for Nuclear Research, ul. Andrzeja So ltana 7, 05-400 Otwock, Poland
Abstract. It is often assumed that the large inclusive cross sections for production of alpha particles andother light fragments in reactions induced by weakly-bound projectiles are due to breakup. This is in spiteof considerable evidence dating back over forty years that transfer reactions actually play the main role inmost systems of this type. Some of the evidence available in the literature will be reviewed for the stableweakly-bound nuclei 6Li and 7Li as well as the rather more fragmentary data for radioactive beams like6He, 8He, 8B etc.
PACS. 24.50.+g Direct reactions – 25.60.-t Reactions induced by unstable nuclei
1 Introduction
Reactions induced by light weakly-bound nuclei producelarge numbers of light charged particles (d, t, α, etc.) withatomic number less than that of the projectile. This phe-nomenon was first observed almost sixty years ago [1] andis still an active topic of research, see e.g. Ref. [2]. Giventhe low thresholds against breakup into two (or more)fragments of the projectiles involved it seems obvious thatthe large observed yields of light charged particles are dueto breakup, so why the continued interest? We shall seethat this simple but nevertheless attractive explanationhad difficulties even from the very first studies and thatthe key to a full understanding is provided by exclusive,that is to say coincidence, measurements.
In the space available it is impossible to give more thana brief overview of the subject, since a complete surveywould require a substantial review article. This contribu-tion therefore represents a highly compressed summaryand the choice of examples reflects the work with whichthe author is most familiar rather than a comprehensivereference list.
2 Breakup, or transfer, or . . .
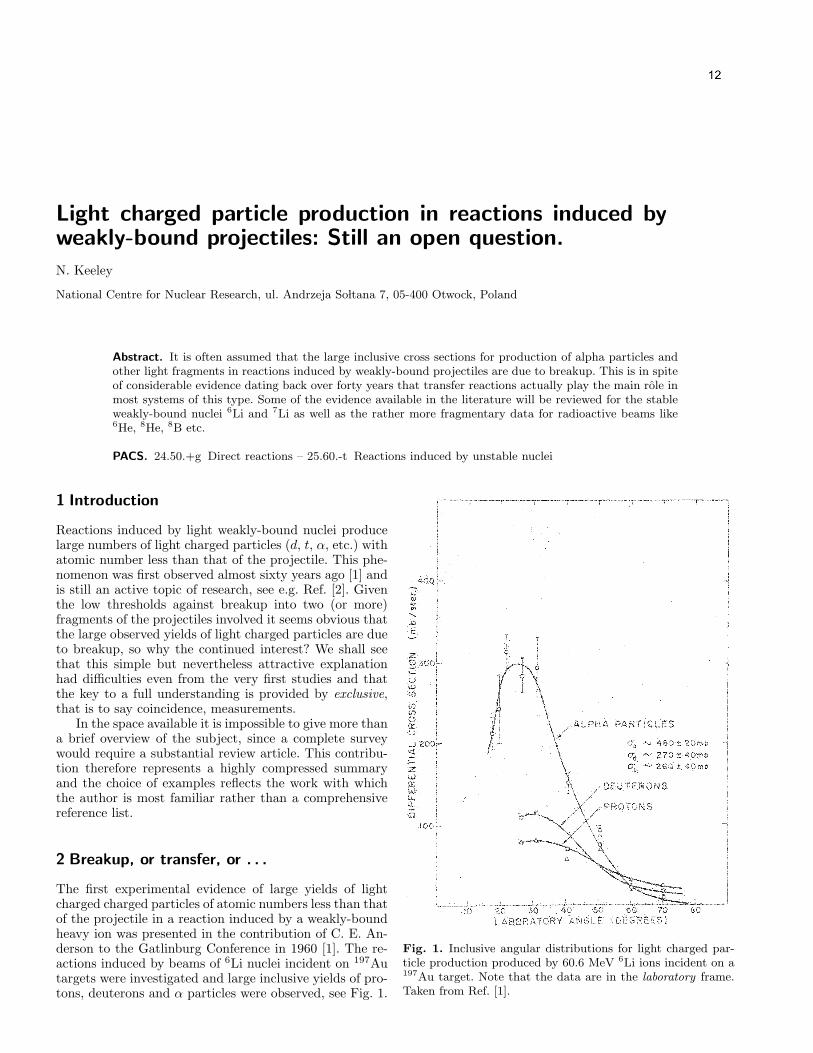
The first experimental evidence of large yields of lightcharged charged particles of atomic numbers less than thatof the projectile in a reaction induced by a weakly-boundheavy ion was presented in the contribution of C. E. An-derson to the Gatlinburg Conference in 1960 [1]. The re-actions induced by beams of 6Li nuclei incident on 197Autargets were investigated and large inclusive yields of pro-tons, deuterons and α particles were observed, see Fig. 1.
Fig. 1. Inclusive angular distributions for light charged par-ticle production produced by 60.6 MeV 6Li ions incident on a197Au target. Note that the data are in the laboratory frame.Taken from Ref. [1].
user
Text Box
12
2
Leaving aside the protons for the moment, it is im-mediately obvious that the breakup hypothesis for theorigin of these particles has a problem: approximatelytwice as many α particles as deuterons are observed. If the6Li → α+d process were solely responsible then the inclu-sive α and d cross sections should be identical. The initialexplanation proposed to overcome this difficulty was basedon the observation that σα ≈ σd + σp; since the deuteronis itself weakly bound some of the deuterons produced inthe initial 6Li → α + d breakup subsequently break upthemselves, and/or part of the α yield comes from the6Li → α + n+ p four-body breakup (threshold 3.70 MeVcompared to the 1.47 MeV of the 6Li → α+ d three-bodybreakup).
This attractive explanation subsequently proved to beuntenable. It was found [3] in exclusive measurements thatmuch (∼ 50%, as was later established) of the α + d co-incidences were due to decay of the 2.19 MeV 3+ reso-nance in 6Li. The lifetime of the 3+ (2.7 × 10⁻²⁰ s) issuch that on average it only decays into α + d at dis-tances too far from the target for there to be much like-lihood of the deuteron breaking up in its turn. It is alsobelow the threshold for four-body breakup. Thus, for theexplanation to hold much of the breakup via the non-resonant continuum would have to proceed either via four-body breakup or involve the subsequent breakup of thedeuteron.
Ost et al. [3] also recorded significant numbers of α+pand α+α coincidences in their measurements of the 6Li +208Pb system. The projected α+ p spectrum showed dis-tinct peaks corresponding to levels in 209Pb, proving thatthese coincidences came from the decay of 5Li formed inthe 208Pb(6Li,5Li)209Pb single neutron stripping reaction.The α + α coincidences came from the decay of the 8Beground state formed in the 208Pb(6Li,8Be)206Tl deuteronpickup reaction. Their conclusion was that these trans-fer reactions could account for the observed excess of αparticles over deuterons in the inclusive measurements.
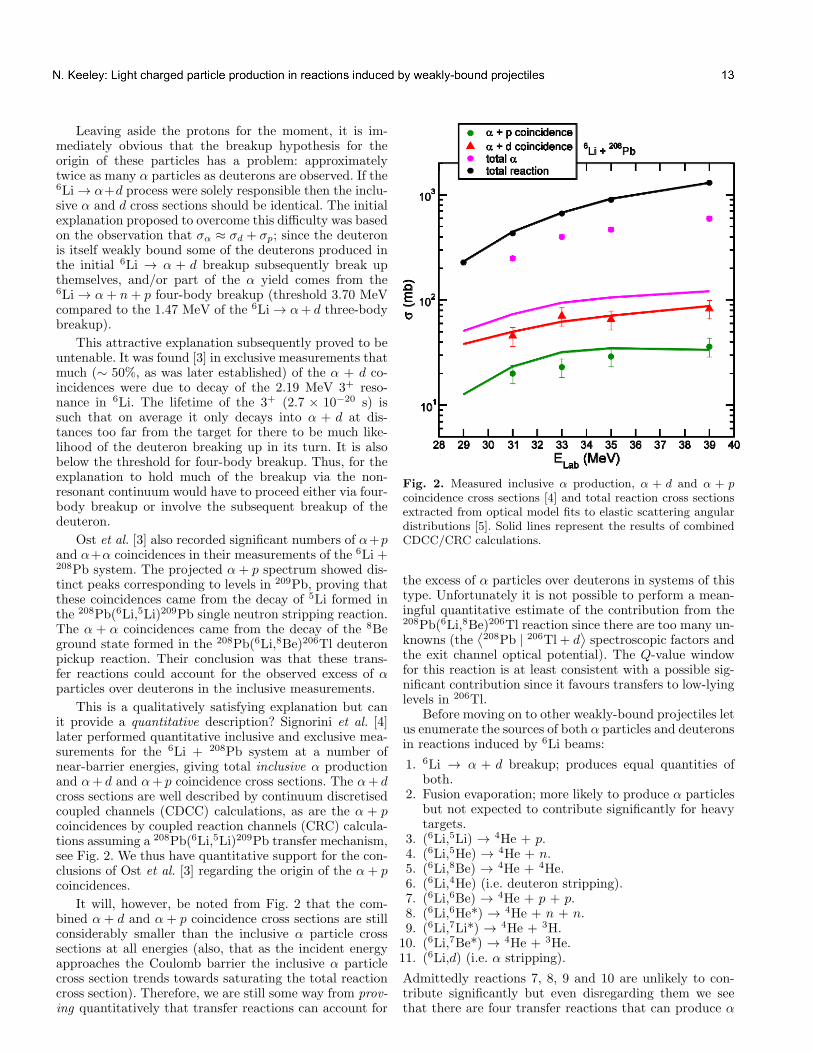
This is a qualitatively satisfying explanation but canit provide a quantitative description? Signorini et al. [4]later performed quantitative inclusive and exclusive mea-surements for the 6Li + 208Pb system at a number ofnear-barrier energies, giving total inclusive α productionand α+ d and α+ p coincidence cross sections. The α+ dcross sections are well described by continuum discretisedcoupled channels (CDCC) calculations, as are the α + pcoincidences by coupled reaction channels (CRC) calcula-tions assuming a 208Pb(6Li,5Li)209Pb transfer mechanism,see Fig. 2. We thus have quantitative support for the con-clusions of Ost et al. [3] regarding the origin of the α+ pcoincidences.
It will, however, be noted from Fig. 2 that the com-bined α + d and α + p coincidence cross sections are stillconsiderably smaller than the inclusive α particle crosssections at all energies (also, that as the incident energyapproaches the Coulomb barrier the inclusive α particlecross section trends towards saturating the total reactioncross section). Therefore, we are still some way from prov-
ing quantitatively that transfer reactions can account for
Fig. 2. Measured inclusive α production, α + d and α + p
coincidence cross sections [4] and total reaction cross sectionsextracted from optical model fits to elastic scattering angulardistributions [5]. Solid lines represent the results of combinedCDCC/CRC calculations.
the excess of α particles over deuterons in systems of thistype. Unfortunately it is not possible to perform a mean-ingful quantitative estimate of the contribution from the208Pb(6Li,8Be)206Tl reaction since there are too many un-knowns (the
⟨208Pb | 206Tl + d
⟩spectroscopic factors and
the exit channel optical potential). The Q-value windowfor this reaction is at least consistent with a possible sig-nificant contribution since it favours transfers to low-lyinglevels in 206Tl.
Before moving on to other weakly-bound projectiles letus enumerate the sources of both α particles and deuteronsin reactions induced by 6Li beams:
1. 6Li → α + d breakup; produces equal quantities ofboth.
2. Fusion evaporation; more likely to produce α particlesbut not expected to contribute significantly for heavytargets.
3. (6Li,5Li) → 4He + p.4. (6Li,5He) → 4He + n.5. (6Li,8Be) → 4He + 4He.6. (6Li,4He) (i.e. deuteron stripping).7. (6Li,6Be) → 4He + p + p.8. (6Li,6He*) → 4He + n + n.9. (6Li,7Li*) → 4He + 3H.10. (6Li,7Be*) → 4He + 3He.11. (6Li,d) (i.e. α stripping).
Admittedly reactions 7, 8, 9 and 10 are unlikely to con-tribute significantly but even disregarding them we seethat there are four transfer reactions that can produce α
user
Text Box
N. Keeley: Light charged particle production in reactions induced by weakly-bound projectiles 13

3
particles (one, reaction 5, with a multiplicity of 2) com-pared to just one that yields deuterons. This provides fur-ther qualitative support for what we may call the “transferhypothesis”. Of course, the relative importance of these re-actions will depend very much on the target and incidentenergy since Q-value and L matching conditions and theavailability of suitable states in the target-like residue willbe critical to producing significant cross sections. The con-tribution of breakup will also depend on the target to someextent, since a higher Z implies more Coulomb breakupand thus a larger total breakup cross section. Finally, forlighter targets fusion-evaporation may be a major sourceof α particles and possibly also deuterons, further compli-cating matters.
The situation is similar for reactions induced by beamsof 7Li; many more α particles than tritons are observed ininclusive reactions for different targets over a wide massrange. In this case, four-body breakup of 7Li and breakupof the triton following 7Li → α+ t breakup may be ruledout as contributing factors to the lack of tritons. As anexample we quote the study of the 7Li + 197Au system byQuebert et al. [6]. Their measured singles (i.e. inclusive)yield for α particles was about a factor of 10 greater thanthe triton yield. In addition, they measured significantnumbers of α+ d coincidences coming from the (7Li,6Li*)single neutron stripping reaction to the 2.19 MeV 3+ res-onance of 6Li.
3 Quantitative case studies
We have discussed qualitative support for a significant(and possibly dominant) contribution from transfer reac-tions to the α particle production in reactions induced by6Li and 7Li but what quantitative support is there for thisconclusion? In this section we present studies of two sys-tems, 6Li + 28Si and 7Li + 93Nb where rather completecoincidence measurements have been made to disentanglethe various production mechanisms.
In a series of papers [7–10] a group led by Prof. A.Pakou of the University of Ioannina made a completestudy of the α particle production mechanism in the 6Li+ 28Si system at near-barrier incident energies. Throughcoincidence measurements the dominant contribution oftransfer reactions to the total cross section was deter-mined, see Fig. 3. For this light target compound nucleusprocesses may make significant contributions which haveto be estimated (using Hauser-Feshbach codes, for exam-ple) and subtracted from the data before comparing withdirect reaction calculations. In this case the agreement ofthe DWBA calculations assuming nucleon stripping reac-tions is reasonable, the shapes of the angular distributionsbeing well reproduced while the magnitudes are somewhatunderestimated (but within the likely uncertainties of thecalculations).
A recent study [11] of the 7Li + 93Nb system at en-ergies approximately 2-3 times the Coulomb barrier mea-sured significant cross sections for α + d and α + α co-incidences; the α + t coincidence from breakup were alsorecorded. A combination of CDCC and rather complete
Fig. 3. Angular distributions for the 28Si(6Li,5Li)29Si (upper)and 28Si(6Li,5He)29P (lower) reactions at an incident 6Li en-ergy of 13 MeV obtained from α+γ coincidence measurements.The solid curves represent the calculated compound nucleuscontributions, the stars the “raw” data and the squares the“direct” (with the compound contribution subtracted). Thedot-dashed curves are the results of DWBA calculations for 1nand 1p stripping, multiplied by factors of 3.5 and 2.2 respec-tively. Adapted from Ref. [10].
CCBA calculations was able to describe very well thewhole of the data (assuming neutron stripping to the 2.19MeV 3+ resonance of 6Li and neutron pickup to the groundstate of 8Be) using structure information from the liter-ature without the need for any renormalisation (this washelped by the fact that cuts were placed on the coinci-dence data to correspond exactly to the excitation energyranges of the target-like residue states that it was possibleto include in the CCBA calculations). Fig. 4 shows theresults for an incident energy of 28 MeV.
We therefore see that there is quantitative proof ofthe importance of transfer mechanisms, at least for the αproduction in systems involving 6Li and 7Li projectiles.
user
Text Box
N. Keeley: Light charged particle production in reactions induced by weakly-bound projectiles 14

4
Fig. 4. Measured inclusive and exclusive cross sections for the7Li + 93Nb system at 28 MeV. (a) Elastic scattering data andthe CDCC calculation. Inset: the inclusive cross section for α
production. (b) Prompt and resonant (the 7/2− state) breakupof 7Li, shown as asterisks and filled circles respectively. TheCDCC results for prompt and resonant breakup are denotedby dot-dot-dashed and dashed lines respectively. (c) Exclusivedata for 1p pickup to 8Be(0+
1) and 1n stripping to 6Li(3+
1) are
presented as filled circles and asterisks respectively. The CCBAcalculations for 1p pickup and 1n stripping are denoted by dot-dashed and solid lines respectively. Taken from Ref. [11].
However, as we found in the previous section for the 6Li+ 208Pb system, it is still not always possible to accountquantitatively for all of the observed inclusive α cross sec-tion in these stable beam systems. In the next section weshall examine the status of reactions induced by weakly-bound radioactive beams.
4 Radioactive beams
The situation becomes a little more complex in some re-spects when we turn to reactions induced by beams oflight, weakly-bound radioactive nuclei. The range of lightparticles produced by breakup and/or transfer reactionsincreases, plus in many cases one or more neutrons may be
Fig. 5. Measured inclusive α particle angular distribution forthe 6He + 209Bi system at an incident energy of 19.0 MeV.Taken from Ref. [13].
produced by breakup, complicating coincidence measure-ments. However, in the case of perhaps the best studiednucleus of this type, 6He, the problem is actually simpli-fied. The possible reactions leading to α particles are: 6Hebreakup, 6He → α+n+n and possibly 6He → 5He+n →α+n+n; 1n stripping, (6He,5He → α+n); 2n stripping,(6He,4He); plus fusion evaporation for lighter targets.
The most complete data set is for the 6He + 209Bisystem, measured at the TwinSol system of the Univer-sity of Notre Dame. In a series of pioneering experimentsbasic elastic scattering angular distributions, fusion andinclusive α production excitation functions and α + ncoincidence data were measured at near-barrier energies[12–16]. Very large inclusive α yields, much larger thanmeasured fusion cross sections, were recorded. Their an-gular distributions suggested direct process(es), see Fig. 5.The cross section remains large at energies well below thebarrier, implying that it is not dominated by breakup. Ina series of α + n (+ n) coincidence measurements it wasestablished that for a 22.5 MeV incident energy 6He about75% of the total α production cross section was due to the(6He,5He) and (6He,4He) transfer reactions (about 25% 1nstripping and 50% 2n stripping) with the remaining 25%due to breakup. Thus, it is something of a paradox thatthe α production is completely understood for the exotic6He nucleus but still not so in all cases for the stable 6Liand 7Li nuclei.
The situation is similar for 8He, although a little morecomplicated since there is substantial 6He production aswell as 4He and the available beam intensities are one totwo orders of magnitude lower than for 6He. Nevertheless,coincidence experiments have been performed for systemsinvolving 8He projectiles and it has been established thattransfer reactions dominate the production mechanismsfor 6He and, for heavier targets, 4He (for lighter mass tar-gets the most important mechanism for 4He production isfusion-evaporation), see e.g. Ref. [17].
Reactions induced by 7Be appear to be similar to thoseinduced by 6Li and 7Li projectiles in that there is an ex-cess of α particles over 3He in inclusive measurements, al-
user
Text Box
N. Keeley: Light charged particle production in reactions induced by weakly-bound projectiles 15

5
Fig. 6. Measured inclusive α particle angular distribution forthe 7Be + 58Ni system at an incident energy of 22.0 MeV.The curves denote the various calculated contributions. Thefusion-evaporation component has been subtracted from thedata. Taken from Ref. [18].
though we still cannot be absolutely sure of all the produc-tion mechanisms. A recent study [18] examined the 7Be +58Ni system at 22 MeV and found that while the 4He pro-duction appears to be dominated by fusion-evaporationthe 3He are mainly produced by α particle stripping. Thepossible direct reactions that can lead to 3He are only twoin number, 7Be → 4He + 3He breakup and the (7Be,3He)α transfer reaction. By contrast, 4He can be produced bybreakup, (7Be,8Be) 1n pickup, (7Be,6Be) 1n stripping and(7Be,4He) 3He stripping in addition to fusion-evaporation.
The direct processes seem to contribute about equallyto the 4He production, but the (7Be,4He) contributioncannot be meaningfully calculated (the same applies tothe (7Be,3He) contribution to the 3He production), seeFig. 6.
Other weakly bound radioactive beams may behavedifferently. For example, it is fairly well established thatbreakup dominates the production of 7Be and 16O in re-actions induced by 8B and 17F respectively. This may alsobe the case for 9Li and 10Be production in reactions in-duced by 11Li and 11Be beams. On the other hand, for 8Lithe 7Li production is dominated by single neutron strip-ping. For 15C the honours may be equal between breakupand transfer for the 14C production, although this has yetto be measured. Of course, the exact trade-off betweentransfer and breakup for a given projectile may well de-pend critically on target and/or incident energy.
5 Conclusion
A brief survey of light charged particle production mecha-nisms in reactions induced by beams of stable and radioac-tive weakly bound nuclei has been given. In spite of almost
sixty years of investigations into this topic there remainunanswered questions. Is 4He (and d, t or 3He) strippingin the conventional sense really important for light parti-cle production in reactions induced by 6Li, 7Li and 7Beor is the mechanism something else like “incomplete fu-sion” or “capture breakup”? Is it even meaningful to talkabout different mechanisms in this context? All that canbe said with any confidence is that, by some means orother, mass is transferred from the projectile to the tar-get, whether this is transfer in the conventional nuclearreaction sense or some other mechanism.
It appears as something of a paradox that the mecha-nisms are better understood in the case of certain radioac-tive beams that is the case for their stable counterparts.This is due to the smaller number of mechanisms involvedin these cases compared to the rather complex situationfor 6Li and 7Li. In addition to 6He we may cite the case of15C where only two mechanisms can contribute to the 14Cproduction, single neutron stripping and breakup. In thiscase we can also be sure that there will be no compoundnucleus contribution.
There is thus still room for work in this area, and moreexclusive (that is, coincidence) data are required to un-ravel this interesting problem.
References
1. C. E. Anderson, Proc. 2nd Conf. on reactions between com-
plex nuclei, Gatlinburg, 1960, ed. A. Zucker, E. C. Halbertand F. J. Howard (Wiley, N.Y., 1960).
2. J. Lei and A. M. Moro, Phys. Rev. C 95, 044605 (2017).3. R. Ost, K. Bethge, H. Gemmeke, L. Lassen, and D. Scholz,
Z. Phys. 266, 369 (1974).4. C. Signorini, A. Edifizi, M. Mazzocco, M. Lunardon, D. Fab-
ris, A. Vitturi, P. Scopel, F. Soramel, L. Stroe, G. Prete,E. Fioretto, M. Cinausero, M. Trotta, A. Brondi, R. Moro,G. La Rana, E. Vardaci, A. Ordine, G. Inglima, M. La Com-mara, D. Pierroutsakou, M. Romoli, M. Sandoli, A. Diaz-Torres, I. J. Thompson, and Z. H. Liu, Phys. Rev. C 67,044607 (2003).
5. N. Keeley, S. J. Bennett, N. M. Clarke, B. R. Fulton,G. Tungate, P. V. Drumm, M. A. Nagarajan, and J. S. Lilley,Nucl. Phys. A 571, 326 (1994).
6. J. L. Quebert, B. Frois, L. Marquez, G. Sousbie, R. Ost,K. Bethge, and G. Gruber, Phys. Rev. Lett. 32, 1136 (1974).
7. A. Pakou, N. Alamanos, A. Gillibert, M. Kokkoris, S. Kos-sionides, A. Lagoyannis, N. G. Nicolis, C. Papachristodoulou,D. Patiris, D. Pierroutsakou, E. C. Pollacco, and K. Rusek,Phys. Rev. Lett. 90, 202701.
8. A. Pakou, K. Rusek, N. G. Nicolis, N. Alamanos,G. Doukelis, A. Gillibert, G. Kalyva, M. Kokkoris,A. Lagoyannis, A. Musumarra, C. Papachristodoulou,G. Perdikakis, D. Pierroutsakou, E. C. Pollacco, A. Spyrouand Ch. Zarkadas, J. Phys. G 31, S1723 (2005).
9. A. Pakou, N. Alamanos, N. M. Clarke, N. J. Davis,G. Doukelis, G. Kalyva, M. Kokkoris, A. Lagoyannis,T. J. Mertzimekis, A. Musumarra, N. G. Nicolis, C. Pa-pachristodoulou, N. Patronis, G. Perdikakis, D. Pierrout-sakou, D. Roubos, K. Rusek, S. Spyrou, and Ch. Zarkadas,Phys. Lett. B 633, 691 (2006).
user
Text Box
N. Keeley: Light charged particle production in reactions induced by weakly-bound projectiles 16
6
10. A. Pakou, K. Rusek, N. Alamanos, X. Aslanoglou, S. Haris-sopulos, M. Kokkoris, A. Lagoyannis, T. J. Mertzimekis,A. Musumarra, N. G. Nicolis, C. Papachristodoulou, D. Pier-routsakou, and D. Roubos, Phys. Rev. C 76, 054601 (2007).
11. S. K. Pandit, A. Shrivastava, K. Mahata, N. Keeley,V. V. Parkar, P. C. Rout, K. Ramachandran, I. Martel,C. S. Palshetkar, A. Kumar, A. Chatterjee, and S. Kailas,Phys. Rev. C 93, 061602(R) (2016).
12. J. J. Kolata, V. Guimaraes, D. Peterson, P. Santi,R. White-Stevens, P. A. DeYoung, G. F. Peaslee, B. Hughey,B. Atalla, M. Kern, P. L. Jolivette, J. A. Zimmerman,M. Y. Lee, F. D. Becchetti, E. F. Aguilera, E. Martinez-Quiroz, and J. D. Hinnefeld, Phys. Rev. Lett. 81, 4580(1998).
13. E. F. Aguilera, J. J. Kolata, F. M. Nunes, F. D. Becchetti,P. A. DeYoung, M. Goupell, V. Guimaraes, B. Hughey,M. Y. Lee, D. Lizcano, E. Martinez-Quiroz, A. Nowlin,T. W. O’Donnell, G. F. Peaslee, D. Peterson, P. Santi, andR. White-Stevens, Phys. Rev. Lett. 84, 5058 (2000).
14. J. P. Bychowski, P. A. DeYoung, B. B. Hilldore, J. D. Hin-nefeld, A. Vida, F. D. Becchetti, J. Lupton, T. W. O’Donnell,J. J. Kolata, G. Rogachev, and M. Hencheck, Phys. Lett. B596, 26 (2004).
15. P. A. DeYoung, P. J. Mears, J. J. Kolata, E. F. Aguilera,F. D. Becchetti, Y. Chen, M. Cloughesy, H. Griffin, C. Guess,J. D. Hinnefeld, H. Jiang, S. R. Jones, U. Khadka, D. Lizcano,E. Martinez-Quiroz, M. Ojaniega, G. F. Peaslee, A. Pena,J. Rieth, S. VanDenDriessche, and J. A. Zimmerman, Phys.Rev. C 71, 051601(R) (2005).
16. J. J. Kolata, H. Amro, F. D. Becchetti, J. A. Brown,P. A. DeYoung, M. Hencheck, J. D. Hinnefeld, G. F. Peaslee,A. L. Fritsch, C. Hall, U. Khadka, P. J. Mears, P. O’Rourke,D. Padilla, J. Rieth, T. Spencer, and T. Williams, Phys. Rev.C 75, 031302(R) (2007).
17. A. Lemasson, A. Navin, M. Rejmund, N. Keeley,V. Zelevinsky, S. Bhattacharyya, A. Shrivastava, D. Bazin,D. Beaumel, Y. Blumenfeld, A. Chatterjee, D. Gupta,G. de France, B. Jacquot, M. Labiche, R. Lemmon, V. Nanal,J. Nyberg, R. G. Pillay, R. Raabe, K. Ramachandran,J. A. Scarpaci, C. Schmitt, C. Simenel, I. Stefan, andC. N. Timis, Phys. Lett. B 697, 454 (2011).
18. M. Mazzocco, D. Torresi, D. Pierroutsakou, N. Keeley,L. Acosta, A. Boiano, C. Boiano, T. Glodariu, A. Gugliel-metti, M. La Commara, J. A. Lay, I. Martel, C. Mazzoc-chi, P. Molini, C. Parascandolo, A. Pakou, V. V. Parkar,M. Romoli, K. Rusek, A. M. Sanchez-Benıtez, M. Sandoli,O. Sgouros, C. Signorini, R. Silvestri, F. Soramel, V. Souk-eras, E. Stiliaris, E. Strano, L. Stroe, and K. Zerva, Phys.Rev. C 92, 024615 (2015).
Powered by TCPDF (www.tcpdf.org)Powered by TCPDF (www.tcpdf.org)Powered by TCPDF (www.tcpdf.org)Powered by TCPDF (www.tcpdf.org)Powered by TCPDF (www.tcpdf.org)
user
Text Box
N. Keeley: Light charged particle production in reactions induced by weakly-bound projectiles 17
The EXOTIC project at INFN-LNL
D. Pierroutsakou1, A. Boiano1, C. Boiano2, M. La Commara3,1, G. La Rana3,1, M. Mazzocco4,5, C. Parascandolo1,C. Signorini4,5, F. Soramel4,5, and E. Strano4,5
1 INFN - Sezione di Napoli, Via Cintia, I-80126 Napoli, Italy2 INFN - Sezione di Milano, Via Celoria 16, I-20133 Milano, Italy3 Dipartimento di Fisica, Universita di Napoli, Via Cintia, I-80126 Napoli, Italy4 Dipartimento di Fisica e Astronomia, Universita di Padova, Via Marzolo 8, I-35131 Padova, Italy5 INFN - Sezione di Padova, Via Marzolo 8, I-35131 Padova, Italy
Abstract. The low-energy light Radioactive Ion Beam in-flight facility EXOTIC and the associated ex-perimental apparatus, installed at INFN-LNL and designed for nuclear physics and nuclear astrophysicsmeasurements is presented.
PACS. 29.38.-c Radioactive beams – 29.40.Gx Tracking and position-sensitive detectors – 29.40.Cs Gas-filled counters – 29.40.Wk Solid-state detectors – 25.60.-t Reactions induced by unstable nuclei – 27.20.+n6 ≤ A ≤ 19
1 Introduction
The growing availability of Radioactive Ion Beams (RIBs)worldwide has opened up new scenarios and challenges innuclear physics. Experiments with radioactive (exotic) nu-clei allow to explore the properties of isotopes that havea proton-to-neutron ratio very different from the stableones, measure cross sections of important reactions for thestellar nucleosynthesis occurring in explosive astrophysicalenvironments, constrain the isospin-dependent nucleon-nucleon interaction in neutron-rich nuclei and in neutronstars, synthesize superheavy elements and test physics be-yond the standard model.
While several large-scale RIB facilities are actually op-erating at RIKEN [1], NSCL/MSU [2], GANIL (France)[3], GSI [4], CERN (ISOLDE) [5], TRIUMF (ISAC) [6]and small-scale facilities like Twinsol in Notre Dame Uni-versity (USA) [7], RIBRAS (Brasil) [8], JYFL (Jyvaskyla,Finland) [9], CRIB (Japan) [10–12], EXOTIC (LNL-INFN,Italy) [13–16], future infrastructures like SPES (LNL-INFN,Italy), SPIRAL2 (France), HIE-ISOLDE (CERN), FRIB(USA), FAIR (Germany), EURISOL (Europe) are aimedat delivering RIBs with the highest intensity and purityand with good ion optical quality for investigating un-reachable parts of the nuclear chart.
Along with the construction of new RIB infrastruc-tures, a continuous development of detection arrays is un-der way. Depending on the radioactive ion incident energyand on the class of reactions to be studied, different ex-perimental set-ups were built for the detection of chargedparticles.
In this paper we describe the EXOTIC project, devel-oped at the INFN Legnaro National Laboratories (LNL)and constisting of the EXOTIC RIB facility and the asso-ciated experimental apparatus.
2 EXOTIC facility
The EXOTIC facility is dedicated to the in-flight produc-tion of low-energy light RIBs, by inverse kinematics nu-clear reactions using the intense heavy-ion beams from theLNL Tandem XTU accelerator hitting a light gas target(H2, D2,
3He, 4He). The main characteristics of the facil-ity, displayed in Fig. 1, are a large RIB acceptance of theoptics elements and a large capability to suppress all theunwanted scattered beams. It consists of: i) a productiongas target that is a 5 cm-long cylindrical cell with entrance(φ=14 mm) and exit (φ=16 mm) windows made of 2.2 µm(1.83 mg/cm2) thick HAVAR foil, operating at room or atliquid N2 temperatures with an operational pressure upto 1 atm; ii) a beam selection and transport system con-sisting of: a triplet of large diameter quadrupole lenses(φ=160 mm), a 30 bending magnet, a Wien filter and asecond triplet of quadrupole lenses placed before the reac-tion chamber. The Wien filter eliminates to a very largeextent the tails of the primary beam that pass throughthe system with the same magnetic rigidity. In order tostop the RIB contaminants, different slit sets are installedalong the beamline. All the slit sets are mounted on mov-able arms to be adjusted to the envelope of the consideredRIB. The total length of the facility from the productiontarget to the reaction target is 8.34 m. The beamline char-
user
Text Box
18
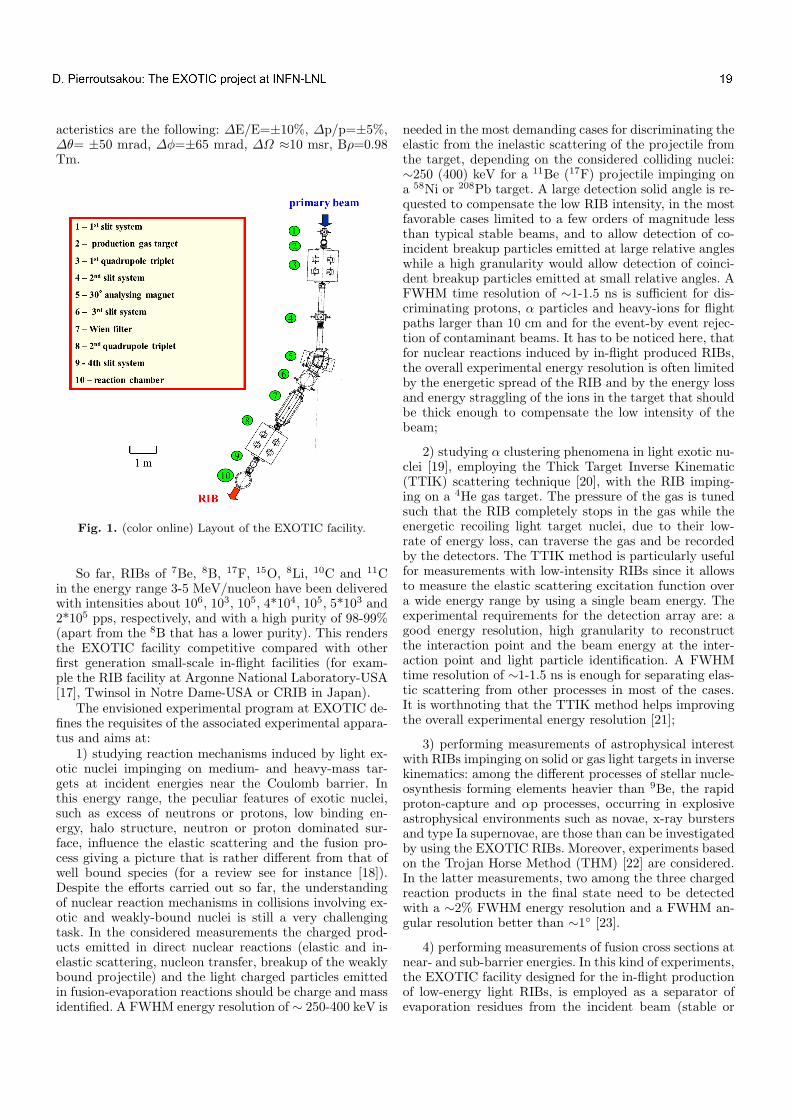
2
acteristics are the following: ∆E/E=±10%, ∆p/p=±5%,∆θ= ±50 mrad, ∆φ=±65 mrad, ∆Ω ≈10 msr, Bρ=0.98Tm.
Fig. 1. (color online) Layout of the EXOTIC facility.
So far, RIBs of 7Be, 8B, 17F, 15O, 8Li, 10C and 11Cin the energy range 3-5 MeV/nucleon have been deliveredwith intensities about 106, 103, 105, 4*104, 105, 5*103 and2*105 pps, respectively, and with a high purity of 98-99%(apart from the 8B that has a lower purity). This rendersthe EXOTIC facility competitive compared with otherfirst generation small-scale in-flight facilities (for exam-ple the RIB facility at Argonne National Laboratory-USA[17], Twinsol in Notre Dame-USA or CRIB in Japan).
The envisioned experimental program at EXOTIC de-fines the requisites of the associated experimental appara-tus and aims at:
1) studying reaction mechanisms induced by light ex-otic nuclei impinging on medium- and heavy-mass tar-gets at incident energies near the Coulomb barrier. Inthis energy range, the peculiar features of exotic nuclei,such as excess of neutrons or protons, low binding en-ergy, halo structure, neutron or proton dominated sur-face, influence the elastic scattering and the fusion pro-cess giving a picture that is rather different from that ofwell bound species (for a review see for instance [18]).Despite the efforts carried out so far, the understandingof nuclear reaction mechanisms in collisions involving ex-otic and weakly-bound nuclei is still a very challengingtask. In the considered measurements the charged prod-ucts emitted in direct nuclear reactions (elastic and in-elastic scattering, nucleon transfer, breakup of the weaklybound projectile) and the light charged particles emittedin fusion-evaporation reactions should be charge and massidentified. A FWHM energy resolution of ∼ 250-400 keV is
needed in the most demanding cases for discriminating theelastic from the inelastic scattering of the projectile fromthe target, depending on the considered colliding nuclei:∼250 (400) keV for a 11Be (17F) projectile impinging ona 58Ni or 208Pb target. A large detection solid angle is re-quested to compensate the low RIB intensity, in the mostfavorable cases limited to a few orders of magnitude lessthan typical stable beams, and to allow detection of co-incident breakup particles emitted at large relative angleswhile a high granularity would allow detection of coinci-dent breakup particles emitted at small relative angles. AFWHM time resolution of ∼1-1.5 ns is sufficient for dis-criminating protons, α particles and heavy-ions for flightpaths larger than 10 cm and for the event-by event rejec-tion of contaminant beams. It has to be noticed here, thatfor nuclear reactions induced by in-flight produced RIBs,the overall experimental energy resolution is often limitedby the energetic spread of the RIB and by the energy lossand energy straggling of the ions in the target that shouldbe thick enough to compensate the low intensity of thebeam;
2) studying α clustering phenomena in light exotic nu-clei [19], employing the Thick Target Inverse Kinematic(TTIK) scattering technique [20], with the RIB imping-ing on a 4He gas target. The pressure of the gas is tunedsuch that the RIB completely stops in the gas while theenergetic recoiling light target nuclei, due to their low-rate of energy loss, can traverse the gas and be recordedby the detectors. The TTIK method is particularly usefulfor measurements with low-intensity RIBs since it allowsto measure the elastic scattering excitation function overa wide energy range by using a single beam energy. Theexperimental requirements for the detection array are: agood energy resolution, high granularity to reconstructthe interaction point and the beam energy at the inter-action point and light particle identification. A FWHMtime resolution of ∼1-1.5 ns is enough for separating elas-tic scattering from other processes in most of the cases.It is worthnoting that the TTIK method helps improvingthe overall experimental energy resolution [21];
3) performing measurements of astrophysical interestwith RIBs impinging on solid or gas light targets in inversekinematics: among the different processes of stellar nucle-osynthesis forming elements heavier than 9Be, the rapidproton-capture and αp processes, occurring in explosiveastrophysical environments such as novae, x-ray burstersand type Ia supernovae, are those than can be investigatedby using the EXOTIC RIBs. Moreover, experiments basedon the Trojan Horse Method (THM) [22] are considered.In the latter measurements, two among the three chargedreaction products in the final state need to be detectedwith a ∼2% FWHM energy resolution and a FWHM an-gular resolution better than ∼1 [23].
4) performing measurements of fusion cross sections atnear- and sub-barrier energies. In this kind of experiments,the EXOTIC facility designed for the in-flight productionof low-energy light RIBs, is employed as a separator ofevaporation residues from the incident beam (stable or
user
Text Box
D. Pierroutsakou: The EXOTIC project at INFN-LNL 19

3
RIB). The evaporation residues are transported and de-tected at the focal plane of the facility.
3 Experimental set-up
The design of a high-performance detection system suit-able for the above mentioned experiments must meet sev-eral requirements:
a) event-by-event beam tracking capabilities to accountfor the typical poor emittance of in-flight produced RIBsin conjuction with a good time resolution for Time ofFlight (TOF) measurements and a fast signal for handlingcounting rates up to 106 Hz; b) charge and mass identi-fication of the reaction products with the highest achiev-able energy resolution; c) a solid angle coverage as largeas possible; d) high segmentation to achieve good angularresolution and for reducing pile up events and low-energyevents coming from the radioactive decay of the elasticallyscattered projectiles; e) flexibility in order to be suitablefor different experimental needs.
The experimental set-up [24] installed at the focal planeof the facility and displayed in Fig.2 consists of: (a) theRIB tracking system and (b) EXPADES, a new charged-particle telescope array. It satisfies the previously men-tioned requisites for studies with low-energy light RIBs,moreover, it has the additional advantages of compact-ness and portability. The components of the EXPADESarray can be easily reconfigured to suit many experimentswhile it can be used as an ancillary detection system withγ-ray and neutron arrays.
The two Parallel Plate Avalanche Counters (PPACs)of the tracking system, are position-sensitive, fast, high-transparency detectors, radiation hard which can sustaincounting rates up to ∼106 Hz. They are placed 909 mm(PPAC A) and 365 mm (PPAC B) upstream the reactiontarget (see Fig. 2). PPAC B is positioned at the entranceof the reaction chamber. The PPACs are filled with isobu-tane (C4H10) at a working pressure of 10-20 mbar andhave entrance and exit windows that are made of 1.5 µm-thick mylar foil. The detector has a three-electrode struc-ture: a central cathode and two anodes, placed symmetri-cally with respect to the cathode at a distance of 2.4 mm.The detector active area is 62 x 62 mm2. The cathode ismade of a 1.5 µm-thick stretched mylar foil while eachanode is a mesh of 60 gold-plated tungsten 20 µm-thickwires in the x and y directions, with a spacing of 1 mm.The wires of the first anode are oriented horizontally andthose of the second one vertically. The position informa-tion of a particle crossing the PPAC is extracted from theanode signals by using a delay-line readout. The FWHM 1mm resolution of the two PPACs allows us to reconstructthe position of the event on the reaction target with aFWHM 2.3 mm position resolution. The cathode signal isused as a reference time for TOF measurements and fortrigger purposes. The FWHM time resolution of a PPACis about 0.9 ns.
EXPADES is an array of eight telescopes arranged ina cylindrical configuration around the reaction target (seeFig. 2). The telescope structure is flexible and is composed
Fig. 2. (color online) Schematic view of: a) the event-by-eventtracking system of the RIB in-flight facility EXOTIC, consist-ing of two PPACs: PPAC A and PPAC B, the second onebeing placed at the entrance of the reaction chamber; b) theEXPADES array telescopes arranged in the reaction cham-ber. Each telescope is made up of: A) 300 µm-thick DSSSD(Eres stage); B) 40 µm-thick DSSSD (∆E stage); C) Ion-ization chamber (∆E stage in experiments where the ions donot pass through the 40/60 µm DSSSD stage); D) Low-noisecharge-sensitive preamplifier boards for the ∆E DSSSDs; E)
Electronic boards for the Eres DSSSDs; F) Motherboard forthe Eres DSSSD electronics. The beam enters in the reactionchamber from the left passing through PPAC A and PPAC B.
of two Double Side Silicon Strip Detectors (DSSSDs) and/oran Ionization Chamber (IC), depending on the experimen-tal requests.
We use 40/60 µm-thick DSSSDs for the ∆E stage(elements B in Fig.2), whereas we adopt 300 µm-thickDSSSDs for the Eres layer (elements A in Fig.2), manu-factured by Micron Semiconductor Ltd. [25]. Each DSSSDhas 32 junction and 32 ohmic elements (strips). The stripsare 64-mm long, with 2 mm pitch size and 40 µm inter-strip separation. The junction strips of the front (y) sideare oriented orthogonally to the ohmic strips of the back(x) side, defining thus a ∼2 × 2 mm2 pixel structure.For experiments requiring the detection of more energeticparticles than those stopped in the Eres layer, few 1 mm-thick DSSSDs were recently purchased, to substitute the300 µm-thick DSSSDs or to be used in addition to theprevious stages.
The choice of the electronic front end of the DSSSDswas based on a compromise between the requirement forhigh granularity, good energy and good time resolutionand that to maintain low the overall cost. ApplicationSpecific Integrated Circuit (ASIC)-based electronics wasemployed for the treatment of the Eres signals. ASIC elec-tronics allows us to handle 32 energy signals of each side ofthe 300 µm-thick Eres DSSSD, ensuring a high granularitywith a very low cost at the expense, however, of the possi-bility to perform TOF measurements with the requestedtime resolution (due to the lack of a constant fraction dis-criminator in the chip). To compensate the above draw-back, for the signal readout of 40/60 µm DSSSD ∆E stagea compact low-noise electronics with an adequate dynamic
user
Text Box
D. Pierroutsakou: The EXOTIC project at INFN-LNL 20

4
range for the considered experiments (∼ 100 MeV fullrange) and good energy and timing characteristics wasdeveloped by our collaboration.
In some experiments, the unambiguous identificationby means of the ∆E-Eres technique of reaction productswith range in silicon shorter than 40/60 µm might be ofcrucial relevance. A valid alternative to allow for ∆E-Eres
identification of all the considered ions, is the use of an ICthat can be handled easily, presents thickness uniformity,possibility to tune the effective thickness by changing thegas pressure, offers the chance of a large detection surfaceand does not present radiation damage problems. Thus,the construction of eight transverse-field ICs was under-taken. The ICs (elements C in Fig. 2) can be used as analternative ∆E stage or to build up more complex tripletelescopes. The IC is filled with carbon tetrafluoride (CF4)at an operational gas pressure that can be varied up to100 mbar, depending on the incident ion energy and onthe species to be detected. It has 65 × 65 mm2 entranceand exit windows made of 1.5 µm-thick mylar foil and anactive depth along the ion direction of 61.5 mm.
The low-noise charge-sensitive preamplifiers for the∆EDSSSDs (element D in Fig. 2), those of the ICs (not dis-played in Fig. 2) as well as the boards containing the ASICelectronics (elements E in Fig. 2) for the Eres DSSSDs areplaced under vacuum in the proximity of the array. Thiswas done mainly for three reasons: 1) to have a compactset-up (detectors + electronics); 2) to minimize the inter-nal and external connections and 3) to overcome the envi-ronmental noise at the EXOTIC beamline. In this way, wemanage to keep as low as possible the DSSSDs electronicthresholds, typically 300-500 keV.
The distance of the EXPADES telescopes from the tar-get can be varied continuously from a minimum value of105 mm to a maximum of 225 mm, which corresponds toan angular resolution for a pixel from ∆θ = 1 to 0.5.The maximum solid angle coverage (achieved in the con-figuration with only DSSSDs in use) is 2.72 sr (∼ 22%of 4π sr). When all eight ICs are employed, the DSSSDshave to be placed at a minimum distance of 225 mm fromthe target position and the maximum solid angle coveragedecreases to 0.64 sr (∼ 5% of 4π sr).
The whole EXPADES array and the PPACB are housedin the reaction chamber, placed at the final focal plane ofthe EXOTIC facility. To allow the realization of experi-ments with RIBs impinging on both solid and gas reactiontargets, a small chamber housing the PPAC B was built.When requested, this small chamber isolates, through a 2µm-thick HAVAR window, the two PPACs and the beamline (held at vacuum) from the reaction chamber that isfilled with gas at pressures ranging from 0.4 to 1 bar.
The low-energy RIBs of the EXOTIC facility and theabove described experimental apparatus have been usedso far, in the framework of international collaborations,for the study of nuclear reaction dynamics at Coulombbarrier energies [26–31] and α clustering phenomena inthe light exotic nuclei 19Ne [32] and 15O [33]. Moreover,a first experiment of astrophysical interest was performed
by means of the THM for the study of the 7Be(n,α)4Hereaction [34].
4 Conclusion
The EXOTIC facility dedicated to the in-flight productionof low-energy light RIBs and associated with a dedicatedexperimental set up is fully operational at INFN-LNL. Nu-clear physics and nuclear astrophysics measurements canbe carried out employing the produced RIBs, in the frame-work of international collaborations. Moreover, the facilitycan be used, besides for the RIB production, as a velocityfilter to perform fusion-evaporation experiments at near-and sub-barrier energies with stable beams and also withthe neutron-rich RIBs delivered by the SPES (SelectiveProduction of Exotic Species) ISOL-type facility [35], inconstruction at INFN-LNL.
References
1. T. Kubo et al., Nucl. Instr. and Meth. B 70 (1992) 309; T.Suda J. Phys.: Conf. Ser. 267 (2011) 012008
2. The K500-K1200, A Coupled Cyclotron Facility at theNSCL, MSU, MSUCL-939, July 1994
3. W. Mittig, J. Phys. G: Nucl. Part. Phys. 24 (1998) 13314. H. Geissel et al., Nucl. Instr. and Meth. B 70 (1992) 2865. A. Herlert, Nucl. Phys. News 20 (2010) 56. G. C. Ball et al., J. Phys. G: Nucl. Part. Phys. 38 (2011)024003
7. A. Aprahamian and M. Wiescher, Nucl. Phys. News 12
(2002) 58. R. Lichtenthaler et al., Nucl. Phys. News 15 (2005) 259. J. Aysto et al., Eur. Phys. J. A 48 (2012) 4210. S. Kubono et al., Eur. Phys. J. A 13 (2002) 21711. Y. Yanagisawa et al., Nucl. Instr. and Meth. A 539 (2005)74
12. H. Yamaguchi et al., Nucl. Instr. and Meth. 589 (2008)150
13. V.Z. Maidikov et al., Nucl. Phys. A 746 (2004) 389c14. D. Pierroutsakou et al., Eur. Phys. J. Special Topics 150
(2007) 4715. F. Farinon et al., Nucl. Instr. and Meth. B 266 (2008) 409716. M. Mazzocco et al., Nucl. Instr. and Meth. B 266 (2008)4665; Nucl. Instr. and Meth. B 317 (2013) 223
17. B. Harss et al., Rev. Sci. Instrum. 71 (2000) 38018. L.F. Canto et al., Phys. Rep. 424 (2006) 1; Phys. Rep.596 (2015) 1
19. M. Freer, Rep. Prog. Phys. 70 (2007) 2149221020. K. Artemov et al., Sov. J. Nucl. Phys. 52 (1990) 408-411ISSN 0038-5506
21. J. Walshe et al., J. Phys.: Conf. Ser. 569 (2014) 01205222. G. Baur, Phys. Lett. B 178 (1986) 135; R. E. Tribble etal., Rep. Prog. Phys. 77 (2014) 106901
23. S. Cherubini et al., Phys. Rev. C 92 (2015) 01580524. D. Pierroutsakou et al., Nucl. Instr. and Meth. A 834
(2016) 4625. http://www.micronsemiconductor.co.uk/pdf/cat.pdf26. C. Signorini et al., Eur. Phys. J. A 44 (2010) 63
user
Text Box
D. Pierroutsakou: The EXOTIC project at INFN-LNL 21

5
27. M. Mazzocco et al., Phys. Rev. C 82 (2010) 054604; Phys.Rev. C 92 (2015) 024615; EPJ Web of Conferences 117
(2016) 0600628. N. Patronis et al., Phys. Rev. C 85 (2012) 02460929. A. Pakou et al., Phys. Rev. C 87 (2013) 014619; Eur. Phys.J. A (2015) 51: 55; Eur. Phys. J. A (2015) 51: 90
30. E. Strano et al., Phys. Rev. C 94 (2016) 02462231. O. Sgouros et al., Phys. Rev. C 94 (2016) 044623; Phys.Rev. C 95 (2017) 054609
32. D. Torresi et al., EPJ Web of Conferences 117 (2016)08027
33. D. Torresi et al., to be published34. L. Lamia et al., to be published35. https://web.infn.it/spes/.
Powered by TCPDF (www.tcpdf.org)Powered by TCPDF (www.tcpdf.org)Powered by TCPDF (www.tcpdf.org)Powered by TCPDF (www.tcpdf.org)
user
Text Box
D. Pierroutsakou: The EXOTIC project at INFN-LNL 22

NUMEN project @ LNS: Status and perspectives
F. Cappuzzello1,2 a, C. Agodi1 a, E. Aciksoz15, L. Acosta12, N. Auerbach17, J. Bellone1,2, S. Bianco4, R. Bijker12,D. Bonanno3, V. Branchina3, D. Bongiovanni3, T. Borello8, I. Boztosun15, M. P. Bussa4, L. Busso4, S. Calabrese1,2,L. Calabretta1, A. Calanna1, D. Carbone1, M. Cavallaro1, D. Calvo4, E.R. Chavez Lomelı12, M. Colonna1, G. D’Agostino1,2, N. Deshmukh1, P.N. de Faria9, C. Ferraresi4, J.L. Ferreira9, M. Fisichella4, A. Foti2,3, P. Finocchiaro1,G. Gallo1,2, U. Garcia5, G. Giraudo4, V. Greco1, A. Hacisalihoglu15, J. Kotila18, F. Iazzi4,6, R. Introzzi4,6, G.Lanzalone1,7, A. Lavagno4, F. La Via1,13, J.A. Lay1, H. Lenske14, R. Linares9, G. Litrico1, F. Longhitano3, D.Lo Presti2,3, J. Lubian9, N. Medina8, D. R. Mendes9, A. Muoio1, J.R.B. Oliveira8, A. Pakou10, L. Pandola1, H.Petrascu17, F. Pinna4,6, F. Pirri4, S. Reito3, D. Rifuggiato1, M.R.D. Rodrigues8, A. D. Russo1, G. Russo2,3, G.Santagati1, E. Santopinto5, O. Sgouros10, S.O. Solakci15, G. Souliotis11, V. Soukeras10, D. Torresi1, S. Tudisco1,R.I.M. Vsevolodovna5, R.J. Wheadon4, and V. Zagatto8
1 Istituto Nazionale di Fisica Nucleare, Laboratori Nazionali del Sud, Catania, Italy2 Dipartimento di Fisica e Astronomia, Universita di Catania, Italy3 Istituto Nazionale di Fisica Nucleare, Sezione di Catania4 Istituto Nazionale di Fisica Nucleare, Sezione di Torino5 Istituto Nazionale di Fisica Nucleare, Sezione di Genova6 Politecnico di Torino, Italy7 Universita degli Studi di Enna “Kore”, Enna, Italy8 Universidade de Sao Paulo, Brazil9 Universidade Federal Fluminense, Niteroi, Brazil
10 University of Ioannina and HINP, Ioannina, Greece11 University of Athens and HINP, Athens, Greece12 Universidad Nacional Autonoma de Mexico13 CNR-IMM, Sezione di Catania, Italy14 University of Giessen, Germany15 Akdeniz University, Antalya, Turkey16 School of Physics and Astronomy Tel Aviv University, Israel17 IFIN-HH, Romania18 University of Jyvaskyla, Jyvaskyla, Finland
Abstract. The NUMEN project aims at accessing experimentally driven information on Nuclear MatrixElements (NME) involved in the half-life of the neutrinoless double beta decay (0vββ), by high-accuracymeasurements of the cross sections of Heavy Ion (HI) induced Double Charge Exchange (DCE) reactions.Particular attention is given to the (18O,18Ne) and (20Ne,20O) reactions as tools for β+β+ and β−β−
decays, respectively. First evidence of the possibility to get quantitative information about NME fromexperiments is found for both kind of reactions. In the experiments, performed at INFN - LaboratoryNazionali del Sud (LNS) in Catania, the beams are delivered by the Superconducting Cyclotron (CS) andthe reaction products are detected by the MAGNEX magnetic spectrometer. The measured cross sectionsare challengingly low, limiting the present exploration to few selected isotopes of interest in the context oftypically low-yield experimental runs. A major upgrade of the LNS facility is foreseen in order to increasethe experimental yield of at least two orders of magnitude, thus making feasible a systematic study of allthe cases of interest. Frontiers technologies are going to be developed to this purpose for the acceleratorand the detection systems. In parallel, advanced theoretical models will be developed in order to extractthe nuclear structure information from the measured cross sections.
a Spokespersons: F. Cappuzzello ([email protected])and C. Agodi ([email protected])
1 Introduction
The 0vββ decay, besides establishing the Majorana na-ture of neutrinos, has the potential to shed light on theabsolute neutrino mass and hierarchy. To this purpose,
user
Text Box
23
2
it is critical that the associated Nuclear Matrix Elements(NME) are reliably known. From an updated comparisonof the results of NME calculations, obtained within vari-ous nuclear structure frameworks [1–3], significant differ-ences are found, which makes the present situation stillnot satisfactory. In addition, some assumption commonto different competing calculations, like the unavoidabletruncation of the many body wave-function, could causeoverall systematic uncertainties.
In order to access quantitative information, relevantfor 0vββ decay NME, the NUMEN project proposes touse HI-DCE reactions as a tool. These reactions are char-acterized by the transfer of two charge units, leaving themass number unchanged, and can proceed by a sequentialnucleon transfer mechanism or by meson exchange. De-spite 0vββ decay and HI-DCE reactions are mediated bydifferent interactions, they present a number of similari-ties. Among that, the key aspects are that initial and finalnuclear states are the same and the transition operators inboth cases present a superposition of isospin, spin-isospinand rank-two tensor components with a relevant momen-tum (100 MeV/c or so) available.
In a pioneering experiment, performed at the INFN-LNS laboratory, we studied the DCE reaction40Ca(18O,18Ne)40Ar at 270 MeV, with the aim to measurethe cross section at zero degrees [4]. In the experiment anadvantageous condition was set, using a beam of 18O and adouble magic target as 40Ca and choosing the bombardingenergy in such a way to mismatch the competing transferreactions leading to the same outgoing channel [5]. Thekey tools in the experiment were the high resolution CSbeams and the MAGNEX spectrometer, a modern highresolution and large acceptance magnetic system charac-terized by high resolution in energy, mass and angle [6,7]. The high-order solution of the equation of motion isthe key feature of MAGNEX, which guarantees the abovementioned performances and its relevance in the researchof heavy-ion physics [8,9]. In the “pilot experiment” wehave shown that high resolution and statistically signif-icant experimental data can be measured for DCE pro-cesses and that precious information towards NME deter-mination could be at our reach. To move towards candi-date nuclei for 0vββ decay important experimental limitsneed to be overcome [10–12]. The challenge is to measurea rare nuclear transition under a very high rate of heavyions produced by the beam-target interaction. We shouldconsider that:
(a) About one order of magnitude more yield would havebeen necessary for the reaction studied in Ref. [4], es-pecially at the largest angles where sizeable amountsof linear momentum (100-200 MeV/c) are transferred;
(b) The Q-value for DCE reactions on nuclei of interestfor 0vββ is normally more negative (typically -8 ÷ -10 MeV) than in the case of 40Ca explored in Ref. [4](Q = -5.9 MeV). This could strongly reduce the crosssection at very forward angles, especially for L = 0transitions.
(c) The (18O,18Ne) reaction is particularly advantageous,due to the large value of both the B[GT;18Ogs(0
+) →
18Fgs(1+)] and B[GT;18Fgs(1
+)→ 18Negs(1+)] strengths
and to the concentration of the GT strength in the18F(1+) ground state. However, this reaction is of β+β+
kind, while most of the research on 0vββ is in the op-posite direction;
(d) None of the reactions of β−β− kind looks like as fa-vorable as the (18O,18Ne). For example, the (18Ne,18O)requires a radioactive beam, which cannot be availablewith comparable intensity. The proposed (20Ne,20O)or the (12C,12Be) have smaller B(GT), so a sensiblereduction of the yield is foreseen in these cases;
(e) In some case gas or implanted targets are necessary,e.g. 136Xe or 130Xe, which are normally much thinnerthan solid state ones, with a consequent reduction ofthe collected yield;
(f) In some case the energy resolution we can provide(about half MeV) is not enough to separate the groundstate from the excited states in the final nucleus. Inthese cases the coincident detection of γ-rays from thede-excitation of the populated states is mandatory, butat the price of the collected yield.
As a consequence the present limits of beam power(∼100 W) for the CS accelerator and acceptable rate forthe MAGNEX focal plane detector (few kHz) must be sen-sibly overcome. For a systematic study of the many “hot”cases of ββ decays an upgraded set-up, able to work withat least two orders of magnitude more luminosity thanthe present, is thus necessary. This goal can be achievedby a substantial change in the technologies used in thebeam extraction and in the detection of the ejectiles. Forthe accelerator the use of a stripper induced extraction isan adequate choice [13]. For the spectrometer the mainforeseen upgrades are:
1. The substitution of the present focal plane detectorgas tracker, based on multiplication wire technologywith a tracker system based on micro patterned gasdetector [14];
2. The substitution of the wall of silicon pad stoppingdetectors with SiC detectors [15] or similar [16];
3. The introduction of an array of detectors for measuringthe coincident γ-rays;
4. The development of suitable front-end and read-outelectronics, capable to guarantee a fast read-out of thedetector signals, still preserving a high signal to noiseratio [17];
5. Develop a suitable architecture for data acquisition,storage and data treatment, including accurate detec-tor response simulations
6. The enhancement of the maximum magnetic rigidity,preserving the geometry of the magnetic field [18–21];
7. The installation of a beam dump to stop the highpower beams, keeping the generated radioactivity un-der control.
In addition, we are developing the technology for pro-ducing and cooling isotopically enriched thin films able toresist to the high intensity beams.
Finally, NUMEN is fostering the development of a spe-cific theory program to allow an accurate extraction of nu-
user
Text Box
F. Cappuzzello et al.: NUMEN project @ LNS: Status and perspectives 24
3
clear structure information from the measured cross sec-tions. Relying on the use of the DWBA approximation forthe cross section, the theory is focused on the develop-ment of microscopic models for DCE reactions, employingseveral approaches (QRPA, shell model, IBM) for inputsconnected to nuclear structure quantities. We are also in-vestigating the possible link between the theoretical de-scription of the 0vββ decay and DCE reactions.The project is divided into four different phases, coveringat least a decade time horizon.Phase1: the experiment feasibility
The pilot experiment: the 40Ca(18O,18Ne)40Ar reaction at270 MeV, with the first experimental data on heavy-ionDCE reactions in a wide range of transferred momenta,was already explored. The results demonstrate the tech-nical feasibility.Phase2: toward “hot” cases, optimizing experimental con-
ditions and getting first results
The necessary work for the upgrade of both the accelera-tor and MAGNEX will be carried out still preserving theaccess to the present facility. Due to the relevant techno-logical challenges, the Phase2 is foreseen to have a dura-tion of a 3-4 years. In the meanwhile, experiments withintegrated charge of tens of mC (about one order of mag-nitude more than that collected in the pilot experiment)will be performed. These will require several weeks (4-8 de-pending on the case) data taking for each reaction, sincethin targets (a few 1018 atoms/cm2) are used in orderto achieve enough energy and angular resolution in theenergy spectra and angular distributions. The attentionwill be focused on a few favorable cases, like for exam-ple the 116Sn(18O,18Ne)116Cd, 106Cd(18O,18Ne)106Pd asββ++ like reactions and the 116Cd (20Ne,20O)116Sn, 130Te(20Ne,20O)130Xe, 76Ge(20Ne,20O)76Se as ββ−− like reac-tions, with the goal to achieve valuable results for them.Phase3: the facility upgrade
Once all the building block for the upgrade of the acceler-ator and spectrometer facility will be ready at the LNS aPhase3, connected to the disassembling of the old set-upand re-assembling of the new will start. An estimate ofabout 18-24 months is considered.Phase4: the experimental campaign
The Phase4 will consist of a series of experimental cam-paigns at high beam intensities (some pµA) and long ex-perimental runs. The goal is to reach integrated chargesof hundreds of mC up to C, for the experiments in coinci-dences, spanning all the variety of candidate isotopes for0vββ decay, like: 48Ca, 76Ge, 82Se, 96Zr, 100Mo, 110Pd,124Sn, 128Te, 130Te, 136Xe, 148Nd, 150Nd, 154Sm, 160Gd,198Pt.
References
1. J. D. Vergados, H. Ejiri, and F. Simkovic, Reports onProgress in Physics, 75, no. 10, Article ID 106301, (2012).
2. P. Vogel, Journal of Physics G: Nuclear and ParticlePhysics, 39, no. 12, Article ID 124002, (2012).
3. J. Engel and J. Menendez Rep. Prog. Phys. 80, 046301(2017).
4. F. Cappuzzello, M. Cavallaro, C. Agodi et al., Eur. Phys.J. A 51, 145 (2015).
5. D. M. Brink, et al., Phys. Lett. B 40, 3 (1972).6. F. Cappuzzello, C. Agodi, D. Carbone et al., Eur. Phys. J.A 52, 167 (2016).
7. F. Cappuzzello et al., Nucl. Instr. Methods A 763, 314(2014).
8. F. Cappuzzello, D. Carbone, M. Cavallaro et al., NATURECOMMUNICATIONS 6, 6743 (2015).
9. D. Pereira et al., Phys. Lett. B 710, 426 (2012).10. C. Agodi, F. Cappuzzello et al., Nuclear and ParticlePhysics Proceedings265,28 (2015).
11. C. Agodi et al., AIP Conference Proceedings 1686,ArticleNumber: 020001(2015).
12. F. Cappuzzello et al., J. Phys.: Conf. Ser. 630, 12018(2015).
13. L. Calabretta et al., Modern Physics Letters A, 32, No. 17(2017).
14. M. Cortesi, S. Rost, W. Mittig, et al., Review of ScientificInstruments 88, Article Number: 013303 (2017).
15. A. Muoio, C. Agodi, D. Bonanno, et al., Eur. Phys. J. Webof Conferences Volume: 117 Article Number: 10006 (2016).
16. D. Carbone, M. Cavallaro, C. Agodi, F. Cappuzzello, L.Cosentino, P. Finocchiaro for the NUMEN collaboration, Re-sults in Physics 6, 863 (2016).
17. G. De Geronimo et al., IEEE Transactions On NuclearScience 60, 2314 (2013).
18. A. Lazzaro, F. Cappuzzello, A. Cunsolo et al., Nucl. Instr.Methods A 591, 394 (2008).
19. A. Lazzaro, F. Cappuzzello, A. Cunsolo et al., Nucl. Instr.Methods A 585, 136 (2008).
20. A. Lazzaro, F. Cappuzzello, A. Cunsolo et al., Nucl. Instr.Methods A 570, 192 (2007).
21. A. Lazzaro, F. Cappuzzello, A. Cunsolo et al., Nucl. Instr.Methods A 602, 494 (2009).
Powered by TCPDF (www.tcpdf.org)Powered by TCPDF (www.tcpdf.org)
user
Text Box
F. Cappuzzello et al.: NUMEN project @ LNS: Status and perspectives 25

Speed of sound bounds, tidal polarizability and gravitationalwaves from neutron stars
Ch.C. Moustakidis, T. Gaitanos, Ch. Margaritis, and G.A. Lalazissis
Department of Theoretical Physics, Aristotle University of Thessaloniki,54124 Thessaloniki, Greece
Abstract. The accurate determination of the maximum mass of the neutron stars is one of the most im-portant tasks in astrophysics. It is directly related to the identification of the black holes in the universe,the production of neutron stars from the supernovae explosion, and the equation of state (EoS) of densematter. However, not only the EoS is directly connected with neutron star masses, but also the speed ofsound in dense matter is a crucial quantity which characterizes the stiffness of the EoS. Recent obser-vations, of binary neutron star systems, offer the possibility of measuring with high accuracy both themass and the tidal polarizability of the stars. We study possible effects of the upper bound of the speedof sound on the upper bound of the mass and the tidal polarizability. We conclude that these kinds ofmeasurements, combined with recent observations of neutron stars with masses close to 2M
⊙, will provide
robust constraints on the equation of state of hadronic matter at high densities.
PACS. 26.60.-c, 21.30.Fe, 21.65.Cd, 26.60.Kp
1 Introduction
The determination of the maximum mass of a neutronstar (NS) (rotating and nonrotating) is one of the long-standing subjects in astrophysics (for a comprehensiveintroduction dedicated to this problem see Ref. [1]). Inparticular, the identification of a black hole requires theknowledge of the maximum mass of a neutron star. Themaximum neutron star mass is of considerable interest inthe study of the production of neutron stars and blackholes in the dynamics of supernovae explosion. Moreover,the experimental observations of neutron star masses haveimposed strong constraints on the hadronic equation ofstate (EoS) of superdense matter (see also the referencesabout the neutron star mass distribution [2,3]). The mostfamous examples are the recent discoveries of massive neu-tron stars with gravitational masses ofM = 1.97±0.04M⊙
(PRS J1614-2230 [4]) and M = 2.01 ± 0.04 M⊙ (PSRJ0348+0432 [5]).
From a theoretical point of view, it is well known thatthe exact value of the maximum mass Mmax of an NS de-pends strongly on the EoS of β-stable nuclear matter [6,7]. Despite intensive investigations, the upper bound ofneutron stars remains up to present uncertain [8–13]. Onepossibility of proceeding with an estimate ofMmax is basedon the pioneering idea of Rhoades and Ruffini [8], wherean optimum upper bound of mass of non-rotating neu-tron stars was derived using a variational technique. Anissue was raised recently concerning the high-density up-per bound of the speed of sound. The speed of sound vs,
because of the causality, should not exceed that of light.Recently, Bedaque and Steiner [14] have provided simple
arguments that support the limit c/√3 in non-relativistic
and/or weakly coupled theories. The authors pointed outthat the existence of neutron stars with masses abouttwo solar masses combined with the knowledge of theEoS of hadronic matter at low densities is not consistentwith this bound. The main motivation of the present pa-per is to study in detail the limiting cases of the upperbound of the speed of sound and their effects on the bulkneutron star properties. We calculate maximum neutronstar masses in relation to various scenarios for the upperbound of the speed of sound. We use a class of equation ofstates, which have been extensively employed in the liter-ature and mainly have the advantage to predict neutronstar masses close or higher to the experimentally observedvalue of 2M⊙ [4,5]. We also extend our study to the analy-sis of the tidal polarizability (deformability), which can beestimated experimentally. The theoretical results for thetidal polarizability are discussed and analyzed in compar-ison with the corresponding observations of the AdvancedLIGO and the Einstein Telescope.
2 Nuclear equation of state and the
maximum mass configuration
It is known that no bounds can be determined for themass of non-rotating neutron stars without some assump-tions concerning the properties of neutron star matter [1].
user
Text Box
26

2
In this study, following the work of Sabbadini and Hartle[16] we consider the following four assumptions: (i) thematter of the neutron star is a perfect fluid described bya one-parameter equation of state between the pressureP and the energy density E , (ii) the energy density E isnon-negative (because of the attractive character of grav-itational forces), (iii) the matter is microscopically stable,which is ensured by the conditions P ≥ 0 and dP/dE ≥ 0and (iv) below a critical baryon density n0 the equationof state is well known. Furthermore, we introduce two re-gions for specifying more precisely the EoS. The radius R0
at which the pressure is P0 = P (n0), divides the neutronstar into two regions. The core, where r ≤ R0 and n ≥ n0
and the envelope where r ≥ R0 and n ≤ n0. The adiabaticspeed of sound is defined as [17]
vsc
=
√(∂P
∂E
)
S
, (1)
where S is the entropy per baryon. In the present work weconsider the following three upper bounds for the speedof sound:
1.vsc
≤ 1: causality limit from special relativity (see [1]
and reference therein)
2.vsc
≤1√3: from QCD and other theories (see [14] and
reference therein)
3.vsc
≤
(E − P/3
P + E
)1/2
: from relativistic kinetic theory
(see [15] and reference therein)
We construct the maximummass configuration by con-sidering the following structure for the neutron star EoS
P (E) =
Pcrust(E), E ≤ Ec−edge
PNM (E), Ec−edge ≤ E ≤ E0
(vS
c
)2(E − E0) + PNM (E0), E0 ≤ E .
(2)
According to Eq. (2), the EoS yielding the maximum massof neutron stars, is divided into three regions. In par-ticular, above the critical energy density E0 the EoS is
maximally stiff with the speed of sound√(
∂P∂E
)S
fixed
in the interval(1/√3− 1
)c. In the intermediate region
Ec−edge ≤ E ≤ E0 we employed a specific EoS which is usedfor various nuclear models (see below for more details),while for E ≤ Ec−edge we used the equation of Feynman,Metropolis and Teller [18] and also of Baym, Bethe, andSutherland [19]. The crust-core interface energy densityEc−edge, between the liquid core and the solid crust is de-termined by employing the thermodynamical method [20].
We use the following notations and specifications forthe results of the theoretical calculations: a) the case wherethe critical (fiducial) density is n0 = 1.5ns and for n ≥ n0
the speed of sound is fixed to the value vs = c (EoS/maxstiff),b) the case where the fiducial density is n0 = 1.5ns and for
n ≥ n0 the speed of sound is fixed to the value vs = c/√3
(EoS/minstiff), and c) the case where the for n ≥ nc−crust
we simple employ the selected EoS without constraints(EoS/normal).
3 The Nuclear Models
In the present work we employed various relativistic andnon-relativistic nuclear models, which are suitable to re-produce the bulk properties of nuclear matter at low den-sities, close to saturation density as well as the maximumobservational neutron star mass (Refs. [4,5]).
3.0.1 The MDI model
The momentum-dependent interaction(MDI) model usedhere, was already presented and analyzed in a previouspaper [21]. The MDI model is designed to reproduce theresults of the microscopic calculations of both nuclear andneutron-rich matter at zero temperature and can be ex-tended to finite temperature. The energy per baryon atT = 0, is given by
E(n, I) =3
10E0
Fu2/3[(1 + I)5/3 + (1− I)5/3
]
+1
3A
[3
2− (
1
2+ x0)I
2
]u
+2
3B[3
2− ( 1
2+ x3)I
2]uσ
1 + 2
3B′[3
2− ( 1
2+ x3)I2
]uσ−1
(3)
+3
2
∑
i=1,2
[Ci +
Ci − 8Zi
5I
](Λi
k0F
)3
×
(((1 + I)u)
1/3
Λi
k0
F
− tan−1((1 + I)u)
1/3
Λi
k0
F
)
+3
2
∑
i=1,2
[Ci −
Ci − 8Zi
5I
](Λi
k0F
)3
×
(((1− I)u)
1/3
Λi
k0
F
− tan−1((1− I)u)
1/3
Λi
k0
F
),
where u = n/ns, with ns denoting the equilibrium sym-metric nuclear matter density, ns = 0.16 fm−3. The pa-rameters A, B, σ, C1, C2 and B′ employed to determinethe properties of symmetric nuclear matter at saturationdensity ns. By suitably choosing the parameters x0, x3,Z1, and Z2, it is possible to obtain different forms for thedensity dependence of the symmetry energy as well as onthe value of the slope parameter L and the value of thesymmetry energy at the saturation density [22].
3.0.2 Momentum-dependent relativistic mean-field model
The relativistic formulation of the nuclear matter prob-lem is based on the well-known quantum hadrodynamics
user
Text Box
Ch. Moustakidis et al.: Speed of sound bounds, tidal polarizability and gravitational waves from neutron stars 27
3
(QHD) [23–26]. Here we adopt an RMF approach withnon-linear derivative interactions, the so-called non-linearderivative (NLD) model; see Ref. [27,28] for details. Itis suitable for applications in systems beyond saturationdensity, because it contains explicitly the momentum de-pendence of the interaction.
The energy density in NLD is obtained from the time-like 00-component of the energy-momentum tensor and itreads
E =∑
i=p,n
k
(2π)3
∫
|p|≥pFi
d3pE(p)
+1
2
(m2
σσ2 + 2U(σ)−m2
ωω2 −m2
ρρ2). (4)
The first term in Eq. (4) is the kinetic contribution, whilethe other terms appear because of the in-medium interac-tion, mediated by the three virtual σ, ω and ρ mesons withmasses mσ, mω and mρ, respectively. The additional con-tribution U(σ) includes the conventional non-linear self-interactions of the σ field.
3.0.3 The HLPS model
Recently, Hebeler et al. [29,30] performed microscopic cal-culations based on chiral effective field theory interactionsto constrain the properties of neutron-rich matter belownuclear densities. It explains the massive neutron stars ofM = 2M⊙. In this model the energy per particle is givenby [30] (hereafter HLPS model)
E(u, x)
T0
=3
5
(x5/3 + (1− x)5/3
)(2u)2/3
− [(2α− 4αL)x(1− x) + αL]u
+ [(2η − 4ηL)x(1− x) + ηL]uγ , (5)
where T0 = (3π2n0/2)2/3h2/(2m) = 36.84 MeV. The pa-
rameters α, η, αL and ηL are determined by combining thesaturation properties of symmetric nuclear matter and themicroscopic calculations for neutron matter [29,30]. Theparameter γ is used to adjust the values of the incom-pessibility K and influences the range on the values of thesymmetry energy and its density derivative.
3.0.4 The H-HJ model
Heiselberg and Hjorth-Jensen [31] adopted the followingsimple form for the energy per particle in nuclear matter(hereafter H-HJ model)
E = E0uu− 2− d
1 + du+ Sou
γ(1− 2x)2, (6)
where E0 = −15.8 MeV. The parameters d and γ arefixed to the EoS of Akmal et al. [32], both for pure neutronmatter and symmetric nuclear matters. However, the high-density extrapolation is questionable, because the EoS ofAkmal et al. [32] becomes superluminal.
3.0.5 The Skyrme models
Finally, we also perform calculations using the well-knownSkyrme parametrization. The energy per baryon of asym-metric matter is given by [33,34]
E(n, I) =3
10
h2c2
m
(3π2
2
)2/3
n2/3F5/3(I)
+1
8t0n [2(x0 + 2)− (2x0 + 1)F2(I)]
+1
48t3n
σ+1 [2(x3 + 2)− (2x3 + 1)F2(I)] (7)
+3
40
(3π2
2
)2/3
n5/3
×[(t1(x1 + 2) + t2(x2 + 2))F5/3(I)
+1
2(t2(2x2 + 1)− t1(2x1 + 1))F8/3(I)
],
where Fm(I) =1
2[(1 + I)m + (1− I)m]. The parametriza-
tion is given in Refs. [33,34].
3.1 The relativistic kinetic theory
The relativistic kinetic theory also predicts an upper boundof the speed of sound, which differs from unity. This wasachieved by Olson using a Grad method of moments [15,36,37], in the framework of the Israel-Stewart theory [36,37]. In the low temperature limit 1/kT −→ ∞ the con-ditions are given by the following inequalities (for moredetails of the derivations of the inequalities see Ref. [38])
E , P ≥ 0, (P+E)(vsc
)2≥ 0,
(vsc
)2≤
E − P/3
P + E, P ≤ 3E .
(8)The conditions in Eqs. (8) impose stringent constraintson the high-density equation of state and thus, stringentconstraints on the maximum neutron star mass. The re-quirement of these conditions implies that the maximallystiff equation of state fulfills the following expression:
(vsc
)2=
E − P/3
P + E. (9)
Equation (9) can be easily solved and leads to
E(n) = C1na1+C2n
a2 , a1 = (1+√13)/3, a2 = (1−
√13)/3,(10)
and also
P (n) = C1na1(a1 − 1) + C2n
a2(a2 − 1). (11)
The values of the constants C1 and C2 are determined withthe help of the critical density n0. Now, the total equationof state, suitably to describe the maximum mass config-uration of a neutron matter, is given by the ansatz [see
user
Text Box
Ch. Moustakidis et al.: Speed of sound bounds, tidal polarizability and gravitational waves from neutron stars 28

4
again Eq. (2)]
P (n) =
Pcrust(n), n ≤ nc−edge
PNM (n), nc−edge ≤ n ≤ n0
C1na1(a1 − 1) + C2n
a2(a2 − 1), n0 ≤ n.
(12)
For the equation of sate in the interval nc−edge ≤ n ≤ n0
we employed the MDI model with L = 110 MeV.
4 Tidal Polarizability
Gravitational waves from the final stages of inspiralingbinary neutron stars are expected to be one of the mostimportant sources for ground-based gravitational wave de-tectors [39–43]. Flanagan and Hinderer [39] have recentlypointed out that tidal effects are also potentially measur-able during the early part of the evolution when the wave-form is relatively clean. The tidal fields induce quadrupolemoments on the neutron stars. The response of the neu-tron star is described by the dimensionless so-called Lovenumber k2, which depends on the neutron star structureand consequently on the mass and the EoS of the nuclearmatter. The tidal Love numbers k2 is obtained from theratio of the induced quadrupole moment Qij to the ap-plied tidal field Eij :
Qij = −k22R5
3GEij ≡ −λEij , (13)
where R is the neutron star radius and λ = 2R5k2/3G isthe tidal polarizability. The tidal Love number k2 is givenby [39,40]
k2 =8β5
5(1− 2β)
2[2− yR + (yR − 1)2β]
×[2β (6− 3yR + 3β(5yR − 8))
+ 4β3(13− 11yR + β(3yR − 2) + 2β2(1 + yR)
)
+ 3 (1− 2β)2[2− yR + 2β(yR − 1)] ln (1− 2β)
]−1
(14)
where β = GM/Rc2 the compactness parameter. Thetidal Love number k2 depends on the compactness param-eter β and the quantity yR. Actually, yR is determined bysolving the following differential equation for y
rdy(r)
dr+y2(r)+y(r)F (r)+r2Q(r) = 0, y(0) = 2, yR ≡ y(R)
(15)where F (r) and Q(r) are functionals of E(r), P (r) andM(r) [42]. Equation (15) must be integrated with theTOV equations using the boundary conditions y(0) = 2,P (0) = Pc and M(0) = 0. The solution of the TOV equa-tions provides the mass M and radius R of the neutronstar, while the corresponding solution of the differentialEq. (15) provides the value of yR = y(R). This together
8 10 12 14 16 18 0.0
0.5
1.0
1.5
2.0
2.5
3.0
Ska
SkI4
H-HJ(0.13)
MDI(95)
MDI(110)
MDI(80) H-HJ(0.2)
NLD
HLPS(stiff)
HLPS(intermediate)
HLPS(soft)
M (
M so
lar )
R (km)
MDI(L80) MDI(L95) MDI(L110) HLPS(soft) HLPS(intermediate) HLPS(stiff) H-HJ (d=0.20) H-HJ (d=0.13) Ska SkI4 NLD
Fig. 1. Mass-radius diagram for the equations of state used inthe present work.
with the quantity β are the basic ingredients of the tidalLove number k2 [Eq. (14)].
In addition, the combined tidal effects of two neutronstars in a circular orbits are given by a weighted averageof the quadrupole responses [39,42],
λ =1
26
[m1 + 12m2
m1
λ1 +m2 + 12m1
m2
λ2
], (16)
where λ1 = λ1(m1) and λ2 = λ2(m2) are the tidal de-formabilities of the two neutron stars and M = m1 +m2
the total mass. The symmetric mass ratio is defined ash = m1m2/M
2. As pointed out in Ref. [42], the univer-sality of the neutron star EoS allows one to predict thetidal phase contribution for a given binary system fromeach EoS. In this case the weighted average λ is usuallyplotted as a function of chirp mass M = (m1m2)
3/5/M1/5
for various values of the ratio h.
5 Results and Discussion
We start the discussion with Fig. 1. It shows the radius-mass relation of neutron stars using various EoS withoutany restriction on the speed of sound (except the rela-tivistic one). One can see, that all hadronic models canreproduce the recent observation of two-solar massive neu-tron stars. In general, the stiffer EoS (at high densities)the higher the maximum neutron star mass. Before start-ing to analyze the effects of the speed of sound limits onthe EoS, we show in Fig. 2 the density dependence ofthis quantity for the various EoSs used here. It is obviousthat almost all the EoSs are causal even for high values ofthe pressure (the only exception is the case HLPS (stiff)where the vc exceed the c for relative low pressure). How-ever, it is worth mentioning that in all hadronic models,used in the present study, the speed of sound vs reaches
user
Text Box
Ch. Moustakidis et al.: Speed of sound bounds, tidal polarizability and gravitational waves from neutron stars 29

5
50 100 150 200 250 300 0.0
0.2
0.4
0.6
0.8
1.0
v s =0.577 c
v s =c
H-HJ (d=0.20) H-HJ (d=0.13) Ska SkI4 NLD
MDI(L80) MDI(L95) MDI(L110) HLPS(soft) HLPS(intermediate) HLPS(stiff)
v s /c
P (MeV fm -3 )
Fig. 2. The speed of sound dependence on the pressure forthe EoSs used in the paper. The two specific upper boundsconsidered in the present work vs = c and vs = c/
√3 ≃ 0.577c
are also indicated.
the bound limit c/√3 at relative low values of the pres-
sure (for P ≤ 100 MeV · fm−3). This feature has dramaticeffect on the maximum mass configuration. This is nowdiscussed in Fig. 3. The neutron star configurations withthe five selected EoSs in the normal case (no constraintson vs except the conventional vs < c) are also shown forcomparison. It is seen that the upper bound limit of thespeed of sound imposes essential changes to the neutronstar structure. The higher the limit after the fiducial den-sity, the stiffer the corresponding EoS. This results to ahigher value for the maximum neutron star mass. By set-ting the upper limit to vs = c/
√3 the stiffness of the EoS
weakens at higher densities and consequently the neutronstar mass reduces to lower values.
To further clarify the critical density dependence onMmax, we display in Fig. 4 the dependence of the max-imum mass for the chosen EoS, on the fiducial densityn0. We considered three upper bounds for the speed ofsound: vs = c, vs = c/
√3, and the bound originated from
the kinetic theory [see Eq. (9)]. First, one sees an overallreduction of the neutron star mass with increasing criti-cal density. Using the density behavior of the vs = c/
√3
constraint in the calculations, the neutron star mass firstdecreases and then approaches a constant value, whichis characteristic for each EoS. It is remarkable that inall cases the neutron star mass drops below the experi-mental value of two solar masses (the only exception isthe stiff case of the HLPS model). Therefore, the assump-
tion of vs = c/√3 value as the upper limit for the speed
of sound in compressed matter would exclude particularEOSs which contradict with recent astrophysical observa-tion of massive neutron stars. Our results are similar tothose of Bedaque and Steiner [14]. On the other hand,when the causality limit vs = c is imposed, the upperbound on the maximum mass significantly increases as is
8 10 12 14 16 18 0.0
0.5
1.0
1.5
2.0
2.5
3.0
3.5 MDI(L95) HLPS(intermediate) H-HJ(d=0.13) Ska NLD
M (
M so
lar )
R (km)
Fig. 3. The mass-radius diagram for five EoSs (EoS/normalcase, line with thick width) in comparison with the correspond-ing maximum mass configuration results of the EoS/minstiffcase (line with medium width) and and EoS/maxstiff case (linewith thin width).
1.5 2.0 2.5 3.0 3.5 4.0 4.5 5.0
1.6
2.0
2.4
2.8
3.2
3.6
Kinetic theory
(v s /c) 2 =1/3
(v s /c) 2 =1
H-HJ(d=0.20) H-HJ(d=0.13) Ska SkI4 NLD Kinetic
MDI(L80) MDI(L95) MDI(L110) HLPS(soft) HLPS(intermediate) HLPS(stiff)
M (
M so
lar )
n 0 /n
s
Fig. 4. The maximum mass of neutron stars as a function ofthe critical density n0 for the two upper bounds for the speedof sound vs = c and vs = c/
√3. The case which corresponds to
the upper bound for vs, which is taken from the kinetic theory,is also indicated.
well known from previous studies and the relevant predic-tions (see Refs. [11,13] and references therein). The predic-tions of the kinetic theory for theMmax are lower but closeto those of the causality limit and also in accordance withthe observations. It is noted that recently an upper boundof neutron star masses was obtained from an analysis ofshort gamma-ray bursts [44]. Assuming that the rotationof the merger remnant is limited only by mass-shedding,then the maximum gravitational mass of a nonrotatingneutron star is Mmax = (2 − 2.2) M⊙ [44]. Furthermore,the authors of Ref. [45], using population studies, deter-
user
Text Box
Ch. Moustakidis et al.: Speed of sound bounds, tidal polarizability and gravitational waves from neutron stars 30
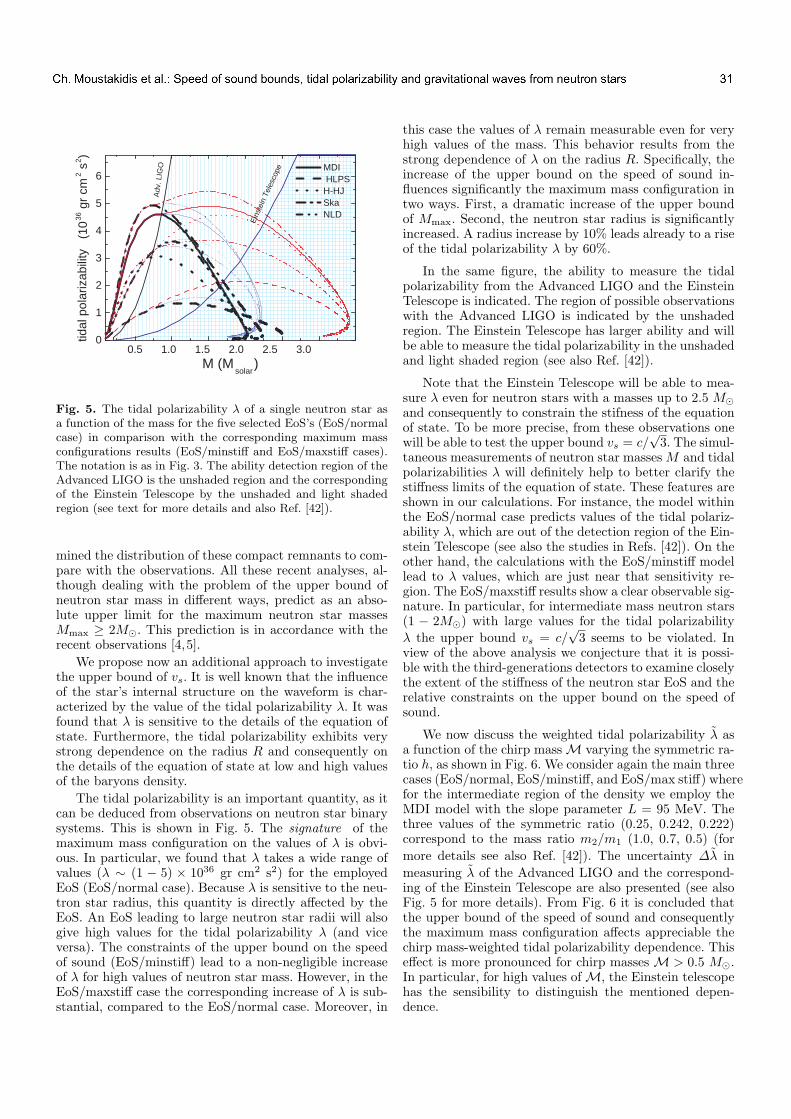
6
0.5 1.0 1.5 2.0 2.5 3.0 0
1
2
3
4
5
6
(10
36 g
r cm
2 s 2 )
tidal
pol
ariz
abili
ty
Ein
stei
n Te
lesc
ope
Adv
. LIG
O
MDI HLPS H-HJ Ska NLD
M (M solar
)
Fig. 5. The tidal polarizability λ of a single neutron star asa function of the mass for the five selected EoS’s (EoS/normalcase) in comparison with the corresponding maximum massconfigurations results (EoS/minstiff and EoS/maxstiff cases).The notation is as in Fig. 3. The ability detection region of theAdvanced LIGO is the unshaded region and the correspondingof the Einstein Telescope by the unshaded and light shadedregion (see text for more details and also Ref. [42]).
mined the distribution of these compact remnants to com-pare with the observations. All these recent analyses, al-though dealing with the problem of the upper bound ofneutron star mass in different ways, predict as an abso-lute upper limit for the maximum neutron star massesMmax ≥ 2M⊙. This prediction is in accordance with therecent observations [4,5].
We propose now an additional approach to investigatethe upper bound of vs. It is well known that the influenceof the star’s internal structure on the waveform is char-acterized by the value of the tidal polarizability λ. It wasfound that λ is sensitive to the details of the equation ofstate. Furthermore, the tidal polarizability exhibits verystrong dependence on the radius R and consequently onthe details of the equation of state at low and high valuesof the baryons density.
The tidal polarizability is an important quantity, as itcan be deduced from observations on neutron star binarysystems. This is shown in Fig. 5. The signature of themaximum mass configuration on the values of λ is obvi-ous. In particular, we found that λ takes a wide range ofvalues (λ ∼ (1 − 5) × 1036 gr cm2 s2) for the employedEoS (EoS/normal case). Because λ is sensitive to the neu-tron star radius, this quantity is directly affected by theEoS. An EoS leading to large neutron star radii will alsogive high values for the tidal polarizability λ (and viceversa). The constraints of the upper bound on the speedof sound (EoS/minstiff) lead to a non-negligible increaseof λ for high values of neutron star mass. However, in theEoS/maxstiff case the corresponding increase of λ is sub-stantial, compared to the EoS/normal case. Moreover, in
this case the values of λ remain measurable even for veryhigh values of the mass. This behavior results from thestrong dependence of λ on the radius R. Specifically, theincrease of the upper bound on the speed of sound in-fluences significantly the maximum mass configuration intwo ways. First, a dramatic increase of the upper boundof Mmax. Second, the neutron star radius is significantlyincreased. A radius increase by 10% leads already to a riseof the tidal polarizability λ by 60%.
In the same figure, the ability to measure the tidalpolarizability from the Advanced LIGO and the EinsteinTelescope is indicated. The region of possible observationswith the Advanced LIGO is indicated by the unshadedregion. The Einstein Telescope has larger ability and willbe able to measure the tidal polarizability in the unshadedand light shaded region (see also Ref. [42]).
Note that the Einstein Telescope will be able to mea-sure λ even for neutron stars with a masses up to 2.5 M⊙
and consequently to constrain the stifness of the equationof state. To be more precise, from these observations onewill be able to test the upper bound vs = c/
√3. The simul-
taneous measurements of neutron star masses M and tidalpolarizabilities λ will definitely help to better clarify thestiffness limits of the equation of state. These features areshown in our calculations. For instance, the model withinthe EoS/normal case predicts values of the tidal polariz-ability λ, which are out of the detection region of the Ein-stein Telescope (see also the studies in Refs. [42]). On theother hand, the calculations with the EoS/minstiff modellead to λ values, which are just near that sensitivity re-gion. The EoS/maxstiff results show a clear observable sig-nature. In particular, for intermediate mass neutron stars(1 − 2M⊙) with large values for the tidal polarizability
λ the upper bound vs = c/√3 seems to be violated. In
view of the above analysis we conjecture that it is possi-ble with the third-generations detectors to examine closelythe extent of the stiffness of the neutron star EoS and therelative constraints on the upper bound on the speed ofsound.
We now discuss the weighted tidal polarizability λ asa function of the chirp mass M varying the symmetric ra-tio h, as shown in Fig. 6. We consider again the main threecases (EoS/normal, EoS/minstiff, and EoS/max stiff) wherefor the intermediate region of the density we employ theMDI model with the slope parameter L = 95 MeV. Thethree values of the symmetric ratio (0.25, 0.242, 0.222)correspond to the mass ratio m2/m1 (1.0, 0.7, 0.5) (for
more details see also Ref. [42]). The uncertainty ∆λ in
measuring λ of the Advanced LIGO and the correspond-ing of the Einstein Telescope are also presented (see alsoFig. 5 for more details). From Fig. 6 it is concluded thatthe upper bound of the speed of sound and consequentlythe maximum mass configuration affects appreciable thechirp mass-weighted tidal polarizability dependence. Thiseffect is more pronounced for chirp masses M > 0.5 M⊙.In particular, for high values of M, the Einstein telescopehas the sensibility to distinguish the mentioned depen-dence.
user
Text Box
Ch. Moustakidis et al.: Speed of sound bounds, tidal polarizability and gravitational waves from neutron stars 31

7
0.5 1.0 1.5 2.0 2.5 3.0 0
2
4
6
8
MDI L=95 MeV
EoS/maxstiff
EoS/minstiff
EoS/normal
Eins
tein
Tel
esco
pe
Adv
. LIG
O
(10
36 g
r cm
2 s 2 )
wei
ghte
d po
lariz
abili
ty
Chirp Mass (M solar
)
h=0.250 h=0.242 h=0.222
Fig. 6. The weighted tidal polarizability λ as a function of thechirp mass M for various values of the symmetric ratio η forthe three considered cases which correspond to the MDI (L95)EoS. The uncertainty ∆λ in the λ measure of the AdvancedLIGO and the corresponding of the Einstein Telescope are alsoindicated (for more details see text and also Ref. [42]).
We believe that the simultaneous measure of M andλ will help to better understand the stiffness limit of theequation of state. In particular, observations with third-generation detectors, will definitely provide constraints forthe stiffness of the EoS at high density. This is expected toprovide more information related to the upper bound ofthe speed of sound in hadronic matter. The accurate esti-mate of the upper bound of the speed of sound in hadronicmatter is greatly important for a consistent prediction ofthe maximum mass of a neutron star. The future detec-tion and analysis of gravitational waves in binary neutronstar systems is expected to shed light on this problem.
References
1. J.B. Hartle, Phys. Rep. 46, 201 (1978).2. M. Coleman Miller and J.M. Miller, Phys. Rep. 548, 1
(2015).3. B. Kiziltan, A. Kottas, M.De Yoreo, and S.E. Thorsett,
Astrophys. J. 778, 66 (2013).4. P. Demorest, T. Pennucci, S. Ransom, M. Roberts, and J.
Hessels, Nature 467, 1081 (2010).5. J. Antoniadis, P.C. Freire, N. Wex, T.M. Tauris, R.S.
Lynch, et al., Science 340, 1233232 (2013).6. S.L. Shapiro and S.A. Teukolsky, Black Holes, White
Dwarfs, and Neutron Stars (John Wiley and Sons, NewYork, 1983).
7. N.K. Glendenning, Compact Stars: Nuclear Physics, Par-
ticle Physics, and General Relativity, (Springer, Berlin,2000)
8. C.E. Rhoades and R. Ruffini, Phys. Rev. Lett. 32, 324(1974).
9. V. Kalogera and G. Baym, Astrophys. J. 470, L61 (1996).
10. S. Koranda, N. Stergioulas, and J.L. Friedman, Astrophys.J. 488, 799 (1997).
11. J.M. Lattimer and M. Prakash, in From Nuclei to Stars,(edited by S. Lee, (World Scientific, Singapore, 2011),p.275.
12. S. Gandolfi, J. Carlson, and S. Reddy, Phys. Rev. C 85,032801(R) (2012).
13. N. Chamel, P. Haensel, J.L. Zdunik, and A.F. Fantina, Int.J. Mod. Phys. E, 22 1330018 (2013).
14. P. Bedaque and A.W. Steiner, Phys. Rev. Lett. 114,031103 (2015).
15. T.S. Olson, Phys. Rev. C 63, 015802 (2000).16. A.G. Sabbadini and J.B. Hartle, Ap. Space Sci., 25, 117
(1973).17. L.D. Landau an E.M. Lifshitz, Fluid Mechanics (Perga-
monm Oxford, 1987), pages 251-254.18. R. P. Feynman, N. Metropolis and E. Teller, Phys. Rev.
75, 1561 (1949).19. G. Baym, C. Pethik and P. Sutherland, Astrophys. J. 170,
299 (1971).20. Ch.C. Moustakidis, T. Niksic, G. A. Lalazissis, D. Vrete-
nar, and P. Ring, Phys. Rev. C 81, 065803 (2010).21. Madappa Prakash, I. Bombaci, Manju Prakash, P. J. Ellis,
J. M. Lattimer, and R. Knorren, Phys. Rep. 280, 1 (1997).22. Ch.C. Moustakidis, Phys. Rev. C 91, 035804 (2015).23. H.-P. Duerr, Phys. Rev. 103, 469 (1956).24. J. Walecka, Annals Phys. 83, 491 (1974).25. B. D. Serot and J. D. Walecka, Int. J. Mod. Phys. E 6,
515 (1997).26. D. Vreternar, A.V. Afanasjev, G.A. Lalazissis, and P. Ring,
Phys. Rep. 409, 101 (2005).27. T. Gaitanos and M. M. Kaskulov, Nucl. Phys. A 899, 133
(2013).28. T. Gaitanos and M. Kaskulov, Nucl. Phys. A 940, 181
(2015).29. K. Hebeler, J.M. Lattimer, C.J. Pethick, and A. Schwenk,
Phys. Rev. Lett. 105, 161102 (2010).30. K. Hebeler, J.M. Lattimer, C.J. Pethick, and A. Schwenk,
Astrophys. J. 773, 11 (2013).31. H. Heiselberg and M. Hjorth-Jensen, Phys. Rep. 328, 237
(2000).32. A. Akmal, V.R. Pandharipande, D.G. Ravenhall, Phys.
Rev. C 58, 1804 (1998).33. E. Chabanat, P. Bonche, P. Haensel, J. Meyer and R. Scha-
effer, Nucl. Phys. A 627, 710 (1997).34. M. Farine, J.M. Pearson and F. Tondeur, Nucl. Phys. A
615, 135 (1997).35. F. Douchin and P. Haensel, A & A, 380, 151 (2001).36. W. Israel, Ann. Phys. (N.Y.) 100, 310 (1976).37. W. Israel and J.M. Stewart, Ann. Phys. (N.Y.) 118, 341
(1979).38. T.S. Olson and W.A. Hiscock, Phys. Rev. C 39, 1818
(1989).39. E.E. Flanagan and T. Hinderer, Phys. Rev. D 77, 021502
(2008).40. T. Hinderer, Astrophys. J. 677, 1216 (2008).41. T. Damour and A. Nagar, Phys. Rev. D 80, 084035 (2009).42. T. Hinderer, B.D. Lackey, R.N. Lang, and J.S. Read, Phys.
Rev. D 81, 1230161 (2010).43. B.D. Lackey and L. Wade, Phys. Rev. D 91, 043002 (2015).44. S. Lawrence, J. G. Tervala, P. F. Bedaque and M.C. Miller,
Astrophys. J. 808, 186 (2015).45. C.L. Freyer, K. Belczynski, E.R. Ruiz, S. Rosswong, G.
Shen, A.W. Steiner, Astrophys. J. 812, 24 (2015).
Powered by TCPDF (www.tcpdf.org)Powered by TCPDF (www.tcpdf.org)Powered by TCPDF (www.tcpdf.org)Powered by TCPDF (www.tcpdf.org)Powered by TCPDF (www.tcpdf.org)Powered by TCPDF (www.tcpdf.org)
user
Text Box
Ch. Moustakidis et al.: Speed of sound bounds, tidal polarizability and gravitational waves from neutron stars 32
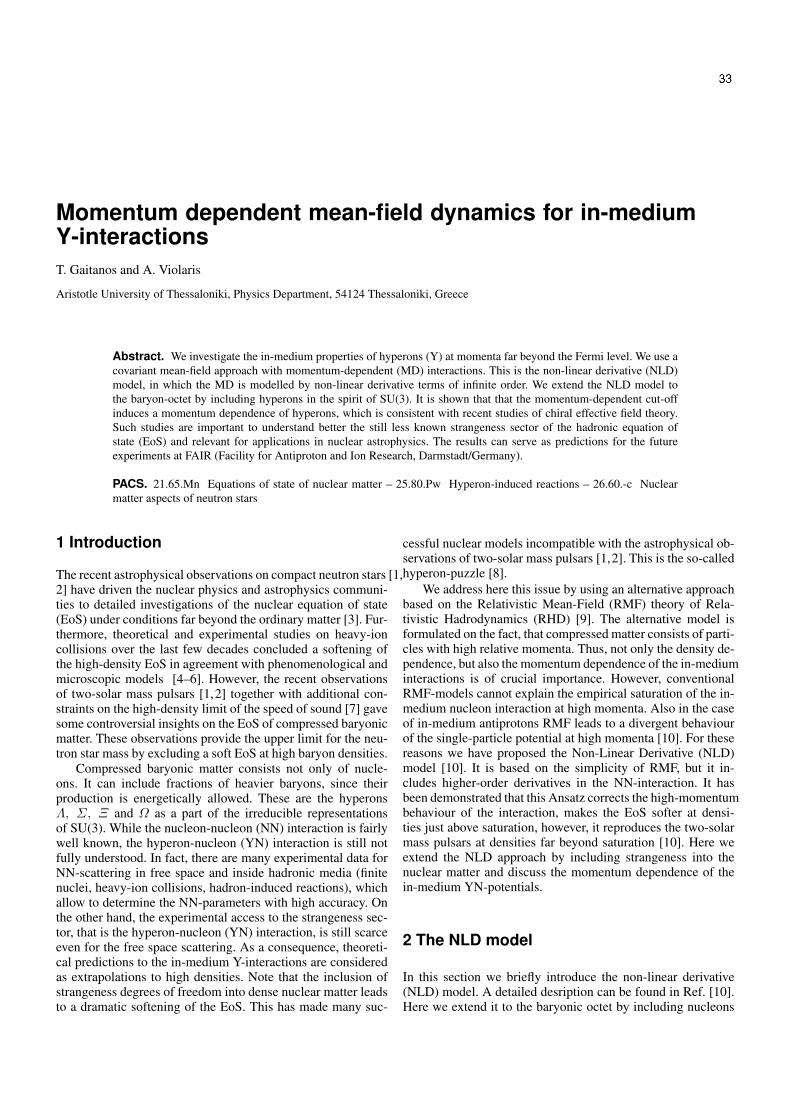
Momentum dependent mean-field dynamics for in-mediumY-interactions
T. Gaitanos and A. Violaris
Aristotle University of Thessaloniki, Physics Department, 54124 Thessaloniki, Greece
Abstract. We investigate the in-medium properties of hyperons (Y) at momenta far beyond the Fermi level. We use a
covariant mean-field approach with momentum-dependent (MD) interactions. This is the non-linear derivative (NLD)
model, in which the MD is modelled by non-linear derivative terms of infinite order. We extend the NLD model to
the baryon-octet by including hyperons in the spirit of SU(3). It is shown that that the momentum-dependent cut-off
induces a momentum dependence of hyperons, which is consistent with recent studies of chiral effective field theory.
Such studies are important to understand better the still less known strangeness sector of the hadronic equation of
state (EoS) and relevant for applications in nuclear astrophysics. The results can serve as predictions for the future
experiments at FAIR (Facility for Antiproton and Ion Research, Darmstadt/Germany).
PACS. 21.65.Mn Equations of state of nuclear matter – 25.80.Pw Hyperon-induced reactions – 26.60.-c Nuclear
matter aspects of neutron stars
1 Introduction
The recent astrophysical observations on compact neutron stars [1,2] have driven the nuclear physics and astrophysics communi-ties to detailed investigations of the nuclear equation of state(EoS) under conditions far beyond the ordinary matter [3]. Fur-thermore, theoretical and experimental studies on heavy-ioncollisions over the last few decades concluded a softening ofthe high-density EoS in agreement with phenomenological andmicroscopic models [4–6]. However, the recent observationsof two-solar mass pulsars [1,2] together with additional con-straints on the high-density limit of the speed of sound [7] gavesome controversial insights on the EoS of compressed baryonicmatter. These observations provide the upper limit for the neu-tron star mass by excluding a soft EoS at high baryon densities.
Compressed baryonic matter consists not only of nucle-ons. It can include fractions of heavier baryons, since theirproduction is energetically allowed. These are the hyperonsΛ, Σ, Ξ and Ω as a part of the irreducible representationsof SU(3). While the nucleon-nucleon (NN) interaction is fairlywell known, the hyperon-nucleon (YN) interaction is still notfully understood. In fact, there are many experimental data forNN-scattering in free space and inside hadronic media (finitenuclei, heavy-ion collisions, hadron-induced reactions), whichallow to determine the NN-parameters with high accuracy. Onthe other hand, the experimental access to the strangeness sec-tor, that is the hyperon-nucleon (YN) interaction, is still scarceeven for the free space scattering. As a consequence, theoreti-cal predictions to the in-medium Y-interactions are consideredas extrapolations to high densities. Note that the inclusion ofstrangeness degrees of freedom into dense nuclear matter leadsto a dramatic softening of the EoS. This has made many suc-
cessful nuclear models incompatible with the astrophysical ob-servations of two-solar mass pulsars [1,2]. This is the so-calledhyperon-puzzle [8].
We address here this issue by using an alternative approachbased on the Relativistic Mean-Field (RMF) theory of Rela-tivistic Hadrodynamics (RHD) [9]. The alternative model isformulated on the fact, that compressed matter consists of parti-cles with high relative momenta. Thus, not only the density de-pendence, but also the momentum dependence of the in-mediuminteractions is of crucial importance. However, conventionalRMF-models cannot explain the empirical saturation of the in-medium nucleon interaction at high momenta. Also in the caseof in-medium antiprotons RMF leads to a divergent behaviourof the single-particle potential at high momenta [10]. For thesereasons we have proposed the Non-Linear Derivative (NLD)model [10]. It is based on the simplicity of RMF, but it in-cludes higher-order derivatives in the NN-interaction. It hasbeen demonstrated that this Ansatz corrects the high-momentumbehaviour of the interaction, makes the EoS softer at densi-ties just above saturation, however, it reproduces the two-solarmass pulsars at densities far beyond saturation [10]. Here weextend the NLD approach by including strangeness into thenuclear matter and discuss the momentum dependence of thein-medium YN-potentials.
2 The NLD model
In this section we briefly introduce the non-linear derivative(NLD) model. A detailed desription can be found in Ref. [10].Here we extend it to the baryonic octet by including nucleons
user
Text Box
33
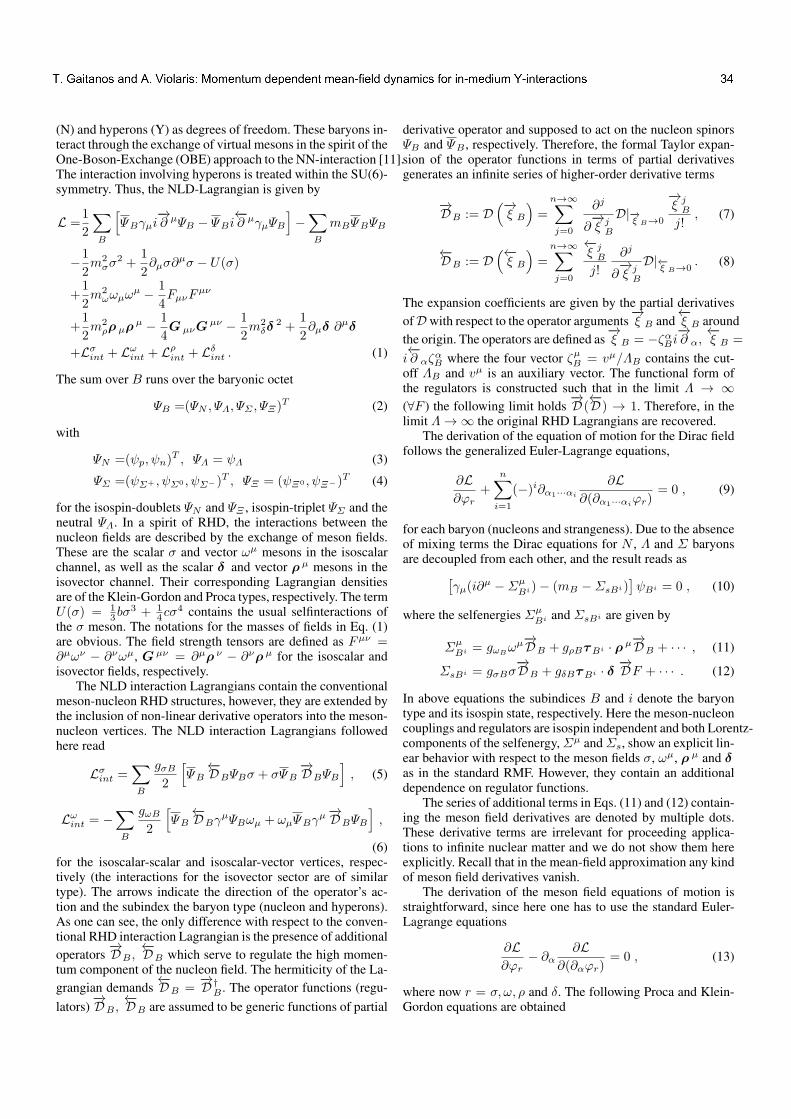
2
(N) and hyperons (Y) as degrees of freedom. These baryons in-teract through the exchange of virtual mesons in the spirit of theOne-Boson-Exchange (OBE) approach to the NN-interaction [11].The interaction involving hyperons is treated within the SU(6)-symmetry. Thus, the NLD-Lagrangian is given by
L =1
2
∑
B
[ΨBγµi
−→∂ µΨB − ΨBi
←−∂ µγµΨB
]−∑
B
mBΨBΨB
−1
2m2
σσ2 +
1
2∂µσ∂
µσ − U(σ)
+1
2m2
ωωµωµ −
1
4FµνF
µν
+1
2m2
ρρ µρµ −
1
4G µνG
µν −1
2m2
δδ2 +
1
2∂µδ ∂
µδ
+Lσint + L
ωint + L
ρint + L
δint . (1)
The sum over B runs over the baryonic octet
ΨB =(ΨN , ΨΛ, ΨΣ , ΨΞ)T (2)
with
ΨN =(ψp, ψn)T , ΨΛ = ψΛ (3)
ΨΣ =(ψΣ+ , ψΣ0 , ψΣ−)T , ΨΞ = (ψΞ0 , ψΞ−)T (4)
for the isospin-doublets ΨN and ΨΞ , isospin-triplet ΨΣ and theneutral ΨΛ. In a spirit of RHD, the interactions between thenucleon fields are described by the exchange of meson fields.These are the scalar σ and vector ωµ mesons in the isoscalarchannel, as well as the scalar δ and vector ρ µ mesons in theisovector channel. Their corresponding Lagrangian densitiesare of the Klein-Gordon and Proca types, respectively. The termU(σ) = 1
3bσ3 + 1
4cσ4 contains the usual selfinteractions of
the σ meson. The notations for the masses of fields in Eq. (1)are obvious. The field strength tensors are defined as Fµν =∂µων − ∂νωµ, G µν = ∂µρ ν − ∂νρ µ for the isoscalar andisovector fields, respectively.
The NLD interaction Lagrangians contain the conventionalmeson-nucleon RHD structures, however, they are extended bythe inclusion of non-linear derivative operators into the meson-nucleon vertices. The NLD interaction Lagrangians followedhere read
Lσint =
∑
B
gσB2
[ΨB←−DBΨBσ + σΨB
−→DBΨB
], (5)
Lωint = −
∑
B
gωB
2
[ΨB←−DBγ
µΨBωµ + ωµΨBγµ−→DBΨB
],
(6)for the isoscalar-scalar and isoscalar-vector vertices, respec-tively (the interactions for the isovector sector are of similartype). The arrows indicate the direction of the operator’s ac-tion and the subindex the baryon type (nucleon and hyperons).As one can see, the only difference with respect to the conven-tional RHD interaction Lagrangian is the presence of additional
operators−→DB ,
←−DB which serve to regulate the high momen-
tum component of the nucleon field. The hermiticity of the La-
grangian demands←−DB =
−→D †B . The operator functions (regu-
lators)−→DB ,
←−DB are assumed to be generic functions of partial
derivative operator and supposed to act on the nucleon spinorsΨB and ΨB , respectively. Therefore, the formal Taylor expan-sion of the operator functions in terms of partial derivativesgenerates an infinite series of higher-order derivative terms
−→DB := D
(−→ξ B
)=
n→∞∑
j=0
∂j
∂−→ξ j
B
D|−→ξ B→0
−→ξ j
B
j!, (7)
←−DB := D
(←−ξ B
)=
n→∞∑
j=0
←−ξ j
B
j!
∂j
∂−→ξ j
B
D|←−ξ B→0
. (8)
The expansion coefficients are given by the partial derivatives
ofD with respect to the operator arguments−→ξ B and
←−ξ B around
the origin. The operators are defined as−→ξ B = −ζαBi
−→∂ α,←−ξ B =
i←−∂ αζ
αB where the four vector ζµB = vµ/ΛB contains the cut-
off ΛB and vµ is an auxiliary vector. The functional form ofthe regulators is constructed such that in the limit Λ → ∞
(∀F ) the following limit holds−→D (←−D ) → 1. Therefore, in the
limit Λ→∞ the original RHD Lagrangians are recovered.The derivation of the equation of motion for the Dirac field
follows the generalized Euler-Lagrange equations,
∂L
∂ϕr+
n∑
i=1
(−)i∂α1···αi
∂L
∂(∂α1···αiϕr)
= 0 , (9)
for each baryon (nucleons and strangeness). Due to the absenceof mixing terms the Dirac equations for N , Λ and Σ baryonsare decoupled from each other, and the result reads as
[γµ(i∂
µ −ΣµBi)− (mB −ΣsBi)
]ψBi = 0 , (10)
where the selfenergies ΣµBi and ΣsBi are given by
ΣµBi = gωB
ωµ−→DB + gρBτBi · ρ µ−→DB + · · · , (11)
ΣsBi = gσBσ−→DB + gδBτBi · δ
−→DF + · · · . (12)
In above equations the subindices B and i denote the baryontype and its isospin state, respectively. Here the meson-nucleoncouplings and regulators are isospin independent and both Lorentz-components of the selfenergy,Σµ andΣs, show an explicit lin-ear behavior with respect to the meson fields σ, ωµ, ρ µ and δas in the standard RMF. However, they contain an additionaldependence on regulator functions.
The series of additional terms in Eqs. (11) and (12) contain-ing the meson field derivatives are denoted by multiple dots.These derivative terms are irrelevant for proceeding applica-tions to infinite nuclear matter and we do not show them hereexplicitly. Recall that in the mean-field approximation any kindof meson field derivatives vanish.
The derivation of the meson field equations of motion isstraightforward, since here one has to use the standard Euler-Lagrange equations
∂L
∂ϕr− ∂α
∂L
∂(∂αϕr)= 0 , (13)
where now r = σ, ω, ρ and δ. The following Proca and Klein-Gordon equations are obtained
user
Text Box
T. Gaitanos and A. Violaris: Momentum dependent mean-field dynamics for in-medium Y-interactions 34

3
∂α∂ασ +m2
σσ +∂U
∂σ=
1
2
∑
B
gσB
[ΨB←−DBΨB + ΨB
−→DBΨB
],
(14)
∂µFµν +m2
ωων =
1
2
∑
B
gωB
[ΨB←−DBγ
νΨB + ΨBγν−→DBΨB
],
(15)
and similar for the isovector channels. General expressions forthe Noether-current and energy-momentum tensor can also bederived. We give them below in the RMF approximation.
We apply now the NLD formalism in the RMF approxima-tion to infinite nuclear matter. In this case, the spatial compo-nents of the Lorentz-vector meson fields vanish, ωµ → (ω0, 0 ).Also in isospin space only the neutral component of the isovec-tor fields survive, i.e., ρ µ → (ρ0
3, 0 ) and δ → δ3. For simplic-
ity, we denote in the following the third isospin components ofthe isovector fields as ρ and δ. We do not show the equationsfor the isovector channels for transparency, however, they aretaken into account for asymmetric matter calculations.
The solutions of the RMF equations start with the usualplane wave ansatz
ψi(s,p ) = ui(s,p )e−ipµxµ , (16)
where i stands for the various isospin states of the baryons.pµ = (E,p ) is the single baryon 4-momentum. The applica-tion of the non-linear derivative operator D to the plane waveansatz of the spinor fields results in
D(−→ξ B)ψi = DB(p)ui(s,p )e−ip
µxµ , (17)
ψiD(←−ξ B) = DB(p)ui(s,p )e+ipµxµ , . (18)
The regulators DB are now functions of the scalar argument
ξB = − vαpα
ΛB. That is, they depend explicitly on the single
baryon momentum p (with an appropriate choice of the aux-iliary vector vα) and on the cut-off ΛB , which may be differentfor each baryon B.
With the help of Eqs. (16) and (17) one gets the Dirac equa-tions for the baryons as in Eq. (10) with the correspondingexplicitly momentum dependent selfenergies. For instance, thevector components are given by
Σµvp =gωN ωµDN + gρN ρµDN , (19)
Σµvn =gωN ωµDN − gρN ρµDN , (20)
ΣµvΛ =gωΛ ω
µDΛ , (21)
ΣµvΣ+ =gωΣ ω
µDΣ + gρΣ ρµDΣ , (22)
ΣµvΣ−
=gωΣ ωµDΣ − gρΣ ρ
µDΣ , (23)
ΣµvΣ0 =gωΣ ω
µDΣ , (24)
ΣµvΞ−
=gωΞ ωµDΞ − gρΞ ρ
µDΞ , (25)
ΣµvΞ0 =gωΞ ω
µDΞ + gρΞ ρµDΞ , . (26)
Similar are the expressions for the scalar selfenergies.
The solutions of the Dirac equation look similar as in thecase of free space, i.e.,
uBi(s,p ) = NBi
ϕs
σ · p
E∗Bi +m∗Bi
ϕs
, (27)
but now for quasi-free particles with an in-medium energy
E∗Bi := E −Σ0
vBi(p) , (28)
and a Dirac mass
m∗Bi := mB −ΣsBi(p) . (29)
For a given momentum the single particle energy E is obtainedfrom the in-medium on-shell relation (28). Note again that theselfenergies are explicitly momentum dependent.
Proper normalization leads to the following 4-current
Jµ =κ
(2π)3
∑
Bi
∫
|p |≤pFi
d3pΠµ
Bi
Π0
Bi
(30)
with the generalized 4-momentum
ΠµBi = p∗µBi +m∗Bi
(∂µpΣsBi
)−(∂µpΣ
βvBi
)p∗Biβ (31)
and the usual effective 4-momentum
p∗µBi = pµ −ΣµvBi (32)
The energy-momentum tensor in NLD is obtained by ap-plying the Noether theorem for translational invariance. In nu-clear matter the resummation procedure results in the followingexpression
Tµν =∑
Bi
κ
(2π)3
∫
|p |≤pFi
d3pΠµ
Bipν
Π0
Bi
− gµν⟨L⟩ , (33)
from which the energy density ε ≡ T 00 and the pressure P canbe calculated, i.e.,
ε =∑
Bi
κ
(2π)3
∫
|p |≤pFi
d3pE(p )− ⟨L⟩ , (34)
P =1
3
∑
Bi
κ
(2π)3
∫
|p |≤pFi
d3pΠ Bi · p
Π0
Bi
+ ⟨L⟩ . (35)
Above equations look similar as the familiar expressions of theusual RMF models. However, the NLD effects induced by theregulators show up through the generalized momentumΠµ
i andthrough the dispersion relation for the single-particle energyE(p ).
user
Text Box
T. Gaitanos and A. Violaris: Momentum dependent mean-field dynamics for in-medium Y-interactions 35
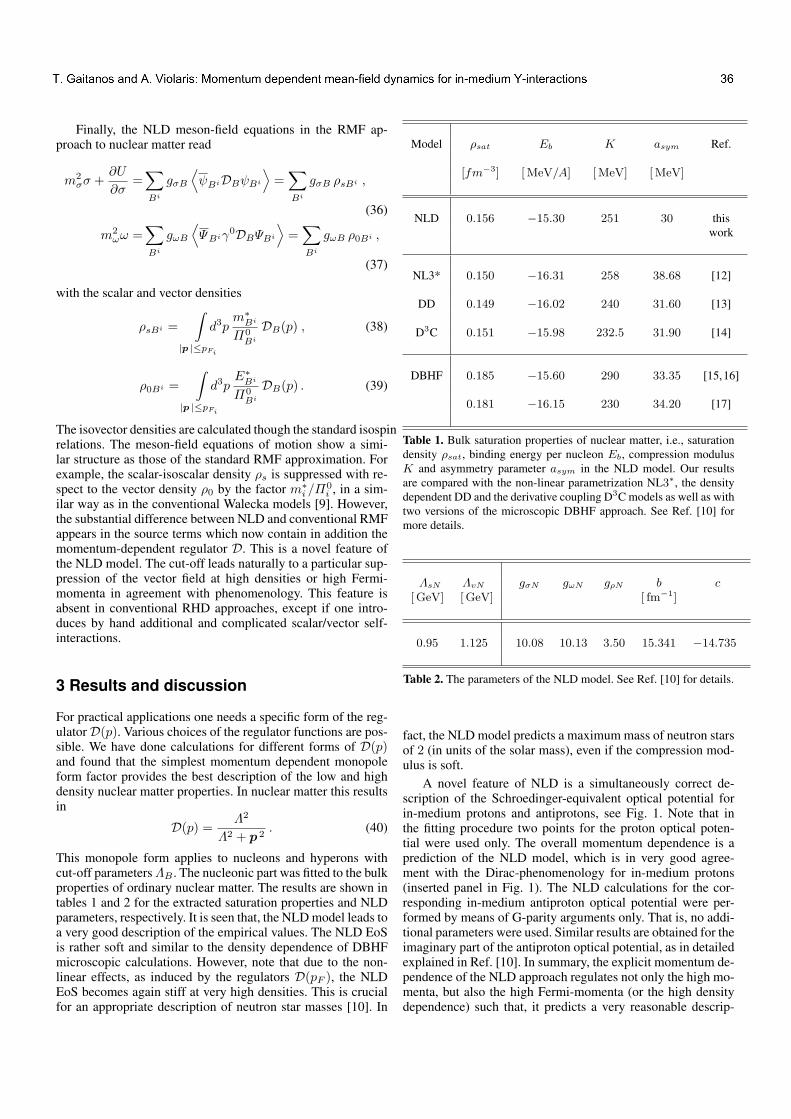
4
Finally, the NLD meson-field equations in the RMF ap-proach to nuclear matter read
m2
σσ +∂U
∂σ=∑
Bi
gσB
⟨ψBiDBψBi
⟩=
∑
Bi
gσB ρsBi ,
(36)
m2
ωω =∑
Bi
gωB
⟨ΨBiγ0DBΨBi
⟩=
∑
Bi
gωB ρ0Bi ,
(37)
with the scalar and vector densities
ρsBi =
∫
|p |≤pFi
d3pm∗Bi
Π0
Bi
DB(p) , (38)
ρ0Bi =
∫
|p |≤pFi
d3pE∗Bi
Π0
Bi
DB(p) . (39)
The isovector densities are calculated though the standard isospinrelations. The meson-field equations of motion show a simi-lar structure as those of the standard RMF approximation. Forexample, the scalar-isoscalar density ρs is suppressed with re-spect to the vector density ρ0 by the factor m∗i /Π
0
i , in a sim-ilar way as in the conventional Walecka models [9]. However,the substantial difference between NLD and conventional RMFappears in the source terms which now contain in addition themomentum-dependent regulator D. This is a novel feature ofthe NLD model. The cut-off leads naturally to a particular sup-pression of the vector field at high densities or high Fermi-momenta in agreement with phenomenology. This feature isabsent in conventional RHD approaches, except if one intro-duces by hand additional and complicated scalar/vector self-interactions.
3 Results and discussion
For practical applications one needs a specific form of the reg-ulatorD(p). Various choices of the regulator functions are pos-sible. We have done calculations for different forms of D(p)and found that the simplest momentum dependent monopoleform factor provides the best description of the low and highdensity nuclear matter properties. In nuclear matter this resultsin
D(p) =Λ2
Λ2 + p 2. (40)
This monopole form applies to nucleons and hyperons withcut-off parametersΛB . The nucleonic part was fitted to the bulkproperties of ordinary nuclear matter. The results are shown intables 1 and 2 for the extracted saturation properties and NLDparameters, respectively. It is seen that, the NLD model leads toa very good description of the empirical values. The NLD EoSis rather soft and similar to the density dependence of DBHFmicroscopic calculations. However, note that due to the non-linear effects, as induced by the regulators D(pF ), the NLDEoS becomes again stiff at very high densities. This is crucialfor an appropriate description of neutron star masses [10]. In
Model ρsat Eb K asym Ref.
[fm−3] [MeV/A] [MeV] [MeV]
NLD 0.156 −15.30 251 30 this
work
NL3* 0.150 −16.31 258 38.68 [12]
DD 0.149 −16.02 240 31.60 [13]
D3C 0.151 −15.98 232.5 31.90 [14]
DBHF 0.185 −15.60 290 33.35 [15,16]
0.181 −16.15 230 34.20 [17]
Table 1. Bulk saturation properties of nuclear matter, i.e., saturation
density ρsat, binding energy per nucleon Eb, compression modulus
K and asymmetry parameter asym in the NLD model. Our results
are compared with the non-linear parametrization NL3∗, the density
dependent DD and the derivative coupling D3C models as well as with
two versions of the microscopic DBHF approach. See Ref. [10] for
more details.
ΛsN ΛvN gσN gωN gρN b c
[ GeV] [GeV] [ fm−1]
0.95 1.125 10.08 10.13 3.50 15.341 −14.735
Table 2. The parameters of the NLD model. See Ref. [10] for details.
fact, the NLD model predicts a maximum mass of neutron starsof 2 (in units of the solar mass), even if the compression mod-ulus is soft.
A novel feature of NLD is a simultaneously correct de-scription of the Schroedinger-equivalent optical potential forin-medium protons and antiprotons, see Fig. 1. Note that inthe fitting procedure two points for the proton optical poten-tial were used only. The overall momentum dependence is aprediction of the NLD model, which is in very good agree-ment with the Dirac-phenomenology for in-medium protons(inserted panel in Fig. 1). The NLD calculations for the cor-responding in-medium antiproton optical potential were per-formed by means of G-parity arguments only. That is, no addi-tional parameters were used. Similar results are obtained for theimaginary part of the antiproton optical potential, as in detailedexplained in Ref. [10]. In summary, the explicit momentum de-pendence of the NLD approach regulates not only the high mo-menta, but also the high Fermi-momenta (or the high densitydependence) such that, it predicts a very reasonable descrip-
user
Text Box
T. Gaitanos and A. Violaris: Momentum dependent mean-field dynamics for in-medium Y-interactions 36
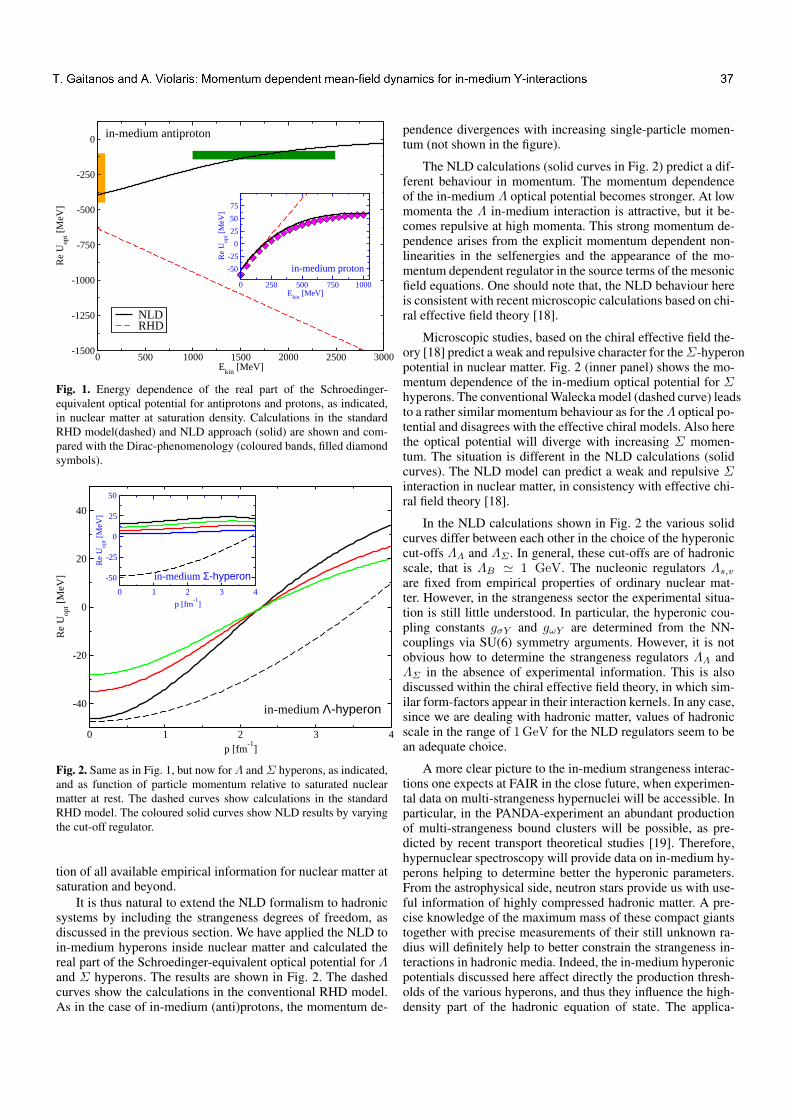
5
0 500 1000 1500 2000 2500 3000E
kin [MeV]
-1500
-1250
-1000
-750
-500
-250
0
Re
Uop
t [M
eV]
NLDRHD
0 250 500 750 1000E
kin [MeV]
-50
-25
0
25
50
75
Re
Uop
t [M
eV]
in-medium antiproton
in-medium proton
Fig. 1. Energy dependence of the real part of the Schroedinger-
equivalent optical potential for antiprotons and protons, as indicated,
in nuclear matter at saturation density. Calculations in the standard
RHD model(dashed) and NLD approach (solid) are shown and com-
pared with the Dirac-phenomenology (coloured bands, filled diamond
symbols).
0 1 2 3 4p [fm
-1]
-40
-20
0
20
40
Re
Uop
t [M
eV]
0 1 2 3 4
p [fm-1
]
-50
-25
0
25
50
Re
Uop
t [M
eV]
in-medium Λ-hyperon
in-medium Σ-hyperon
Fig. 2. Same as in Fig. 1, but now for Λ and Σ hyperons, as indicated,
and as function of particle momentum relative to saturated nuclear
matter at rest. The dashed curves show calculations in the standard
RHD model. The coloured solid curves show NLD results by varying
the cut-off regulator.
tion of all available empirical information for nuclear matter atsaturation and beyond.
It is thus natural to extend the NLD formalism to hadronicsystems by including the strangeness degrees of freedom, asdiscussed in the previous section. We have applied the NLD toin-medium hyperons inside nuclear matter and calculated thereal part of the Schroedinger-equivalent optical potential for Λand Σ hyperons. The results are shown in Fig. 2. The dashedcurves show the calculations in the conventional RHD model.As in the case of in-medium (anti)protons, the momentum de-
pendence divergences with increasing single-particle momen-tum (not shown in the figure).
The NLD calculations (solid curves in Fig. 2) predict a dif-ferent behaviour in momentum. The momentum dependenceof the in-medium Λ optical potential becomes stronger. At lowmomenta the Λ in-medium interaction is attractive, but it be-comes repulsive at high momenta. This strong momentum de-pendence arises from the explicit momentum dependent non-linearities in the selfenergies and the appearance of the mo-mentum dependent regulator in the source terms of the mesonicfield equations. One should note that, the NLD behaviour hereis consistent with recent microscopic calculations based on chi-ral effective field theory [18].
Microscopic studies, based on the chiral effective field the-ory [18] predict a weak and repulsive character for theΣ-hyperonpotential in nuclear matter. Fig. 2 (inner panel) shows the mo-mentum dependence of the in-medium optical potential for Σhyperons. The conventional Walecka model (dashed curve) leadsto a rather similar momentum behaviour as for theΛ optical po-tential and disagrees with the effective chiral models. Also herethe optical potential will diverge with increasing Σ momen-tum. The situation is different in the NLD calculations (solidcurves). The NLD model can predict a weak and repulsive Σinteraction in nuclear matter, in consistency with effective chi-ral field theory [18].
In the NLD calculations shown in Fig. 2 the various solidcurves differ between each other in the choice of the hyperoniccut-offs ΛΛ and ΛΣ . In general, these cut-offs are of hadronicscale, that is ΛB ≃ 1 GeV. The nucleonic regulators Λs,v
are fixed from empirical properties of ordinary nuclear mat-ter. However, in the strangeness sector the experimental situa-tion is still little understood. In particular, the hyperonic cou-pling constants gσY and gωY are determined from the NN-couplings via SU(6) symmetry arguments. However, it is notobvious how to determine the strangeness regulators ΛΛ andΛΣ in the absence of experimental information. This is alsodiscussed within the chiral effective field theory, in which sim-ilar form-factors appear in their interaction kernels. In any case,since we are dealing with hadronic matter, values of hadronicscale in the range of 1GeV for the NLD regulators seem to bean adequate choice.
A more clear picture to the in-medium strangeness interac-tions one expects at FAIR in the close future, when experimen-tal data on multi-strangeness hypernuclei will be accessible. Inparticular, in the PANDA-experiment an abundant productionof multi-strangeness bound clusters will be possible, as pre-dicted by recent transport theoretical studies [19]. Therefore,hypernuclear spectroscopy will provide data on in-medium hy-perons helping to determine better the hyperonic parameters.From the astrophysical side, neutron stars provide us with use-ful information of highly compressed hadronic matter. A pre-cise knowledge of the maximum mass of these compact giantstogether with precise measurements of their still unknown ra-dius will definitely help to better constrain the strangeness in-teractions in hadronic media. Indeed, the in-medium hyperonicpotentials discussed here affect directly the production thresh-olds of the various hyperons, and thus they influence the high-density part of the hadronic equation of state. The applica-
user
Text Box
T. Gaitanos and A. Violaris: Momentum dependent mean-field dynamics for in-medium Y-interactions 37

6
tion of the NLD approach with hyperons to neutron stars isin progress [20].
4 Summary and conclusions
We have investigated the properties of strangeness particles in-side nuclear matter in the framework of the NLD approach.The NLD model is based on the simplicity of the relativisticmean-field theory, but it includes the missing momentum de-pendence in a manifestly covariant fashion. This is realized bythe introduction of non-linear derivative series in the interac-tion Lagrangian. In momentum space this prescription leads tomomentum dependent regulators, which are determined by acut-off. The NLD approach does not only resolve the opticalpotential issues of protons and antiprotons at high momenta,but it affects the density dependence. That is, the cut-off regu-lators make the EoS softer at densities close to saturation andstiffer at very high densities relevant for neutron stars.
Because of the successful application of the NLD model toinfinite nuclear matter (and to finite nuclei [21]), it is a natu-ral desire to extend this approach to hadronic matter by takingstrangeness degrees of freedom into account. This is realizedin the spirit of SU(6) symmetry. We apply the NLD modelto the description of in-medium hyperon interactions for or-dinary nuclear matter. It is found that the strangeness cut-offregulates the momentum dependence of the optical potentialsof hyperons in multiple ways. At first, the optical potentials donot diverge with increasing hyperon momentum. Furthermore,the NLD model predicts an attractive Λ-optical potential at lowmomenta, which becomes repulsive at high energies and finallysaturates. As an important result, it is possible to predict a weakand repulsive in-medium interaction for Σ-hyperons inside nu-clear matter at saturation density. These results are in consistentagreement with calculations based on the chiral effective fieldtheory.
This study is relevant not only for hadron physics, but alsofor nuclear astrophysics. The application of the NLD approachto β-equilibrated compressed matter is under progress, in orderto investigate the hyperon-puzzle in neutron stars. Another in-teresting application concerns the dynamics of neutron star bi-naries. To do so, an extension to hot and compressed hadronic
matter is necessary and also under progress. Note that the NLDformalism is fully thermodynamically consistent, which is animportant requirement before applying it to hot and dense sys-tems. In summary, we conclude the relevance of our studies forfuture experiments at FAIR and for nuclear astrophysics.
References
1. P. Demorest, T. Pennucci, S. Ransom, M. Roberts, and J. Hessels,
Nature 467 (2010) 1081.
2. J. Antoniadis et al., Science 340 (2013) 6131.
3. J.M. Lattimer, A.W. Steiner, Astrophys. J. 784 (2014) 123.
4. T. Klahn, et al., Phys. Rev. C 74 (2006) 035802.
5. C. Fuchs, Prog. Part. Nucl. Phys. 56 (2006) 1.
6. C. Hartnack, et al., Phys. Rept. 510 (2012) 119.
7. Ch. Moustakidis, T. Gaitanos, Ch. Margaritis, G.A. Lalazissis,
Phys. Rev. C 95 (2017) 045801.
8. I. Bombaci, arXiV:1601.05339 [nucl-th],
D. Chatterjee, I. Vidana, Eur. Phys. J. A 52 (2016) 29.
9. H.-P. Duerr, Phys. Rev. 103 (1956) 469,
J.D. Walecka, Ann. Phys. 83 (1974) 491,
J. Boguta, A. Bodmer, Nucl. Phys. A 292 (1977) 413.
10. T. Gaitanos, M. Kaskulov, Nucl. Phys. A 899 (2013) 133,
T. Gaitanos, M. Kaskulov, Nucl. Phys. A 940 (2015) 181.
11. R. Machleidt, K. Holinde, and C. Elster, Phys. Rept. 149 (1987)
1,
K. Erkelenz, Phys. Rept. 13 (1974) 191.
12. G. Lalazissis et al., Phys. Lett. B 671 (2009) 36.
13. S. Typel and H. Wolter, Nucl. Phys. A 656 (1999) 331.
14. S. Typel, Phys. Rev. C 71 (2005) 064301.
15. G. Li, R. Machleidt, and R. Brockmann, Phys. Rev. C45, 2782
(1992).
16. R. Brockmann and R. Machleidt, Phys. Rev. C42, 1965 (1990).
17. T. Gross-Boelting, C. Fuchs, and A. Faessler, Nucl. Phys. A648,
105 (1999).
18. S. Petschauer, J. Haidenbauer, N. Kaiser, U. G. Meiner and
W. Weise, Eur. Phys. J. A 52 (2016) no.1, 15
19. T. Gaitanos, Int. J. Mod. Phys. E 25 (2016) no.12, 1630008,
T. Gaitanos, C. Moustakidis, G. A. Lalazissis and H. Lenske, Nucl.
Phys. A 954 (2016) 308.
20. A. Violaris, T. Gaitanos, in preparation.
21. S. Antic and S. Typel, AIP Conf. Proc. 1645 (2015) 276.
Powered by TCPDF (www.tcpdf.org)Powered by TCPDF (www.tcpdf.org)Powered by TCPDF (www.tcpdf.org)Powered by TCPDF (www.tcpdf.org)Powered by TCPDF (www.tcpdf.org)
user
Text Box
T. Gaitanos and A. Violaris: Momentum dependent mean-field dynamics for in-medium Y-interactions 38

Spin-orbit splittings of neutron states in N = 20 isotones fromcovariant density functionals (CDF) and their extensions.
Konstantinos Karakatsanis, Georgios Lalazissis1, Peter Ring2, and Elena Litvinova3
1 Physics Department, Aristotle University of Thessaloniki, Thessaloniki GR-54124, Greece2 Physik Department, Technische Universitat Munchen, D-85747 Garching, Germany3 Department of Physics, Western Michigan University, Kalamazoo MI 49008-5252 USA
Abstract. The spin-orbit splitting is an essential ingredient for our understanding of the shell structure innuclei. One of the most important advantages of relativistic mean-field (RMF) models in nuclear physics isthe fact that the large spin-orbit (SO) potential emerges automatically from the inclusion of Lorentz-scalarand -vector potentials in the Dirac equation. It is therefore of great importance to compare the results ofsuch models with experimental data. We investigate the size of 2p- and 1f -splittings for the isotope chain40Ca, 38Ar, 36S, and 34Si in the framework of various relativistic and non-relativistic density functionals.They are compared with the results of a recent experiment by Burgunder et al. [13].
PACS. 21.60.Cs, 21.10.Pc, 21.10.Ft
1 Introduction
Self-consistent mean field models in the framework of nu-clear density functional theory provide a very successfulway to study nuclear structure phenomena throughoutthe entire nuclear chart. The nucleons are treated as in-dependent particles moving inside the nucleus under theinfluence of various potentials, derived from such function-als [2]. These methods are similar to those used in elec-tronic systems where the form of the density functionalscan be deduced ab-initio from the well known Coulombforce between the electrons [3,4]. Contrary to that, atpresent, the nuclear density functionals are constructedphenomenologically. The form of those functionals is mo-tivated by the symmetries of the underlying basic theories.The parameters of the model, however, are adjusted to ex-perimental data in finite nuclei.
Within the concept of density functional theory, thefull quantum mechanical nuclear many-body problem ismapped onto a single particle problem, assuming that theexact ground state of the A-body system is determined bya Slater determinant and the corresponding single parti-cle density matrix generated from the products of A singleparticle states. By imposing a variation principle on theenergy functional with respect to this density one derivesthe equations of motion of the independently moving nu-cleons. The specific form of the phenomenological densityfunctional leads to a certain form of the mean-field.
There are two general versions of this theory. The stan-dard since almost fifty years ago, are non-relativistic func-tionals. The most widely known forms are the Skyrme
type functionals, based on zero range interactions [5] andthe Gogny type functionals of finite range interactions [6].Later on covariant density functionals have been intro-duced. Their relativistic form is based on the simple modelof Walecka [7,8] and its density dependence has been in-troduced by non-linear meson couplings by Boguta andBodmer [9].
In all the conventional non-relativistic models the spin-orbit term is derived from a two-body spin-orbit interac-tion of zero range [5,6,11]. The corresponding Fock termleads to a strong isospin dependence of the spin-orbit split-ting. This is the origin of the failure to reproduce the kinkin the isotopic shifts mentioned above. In covariant modelsthe spin-orbit splitting is a single-particle effect, deriveddirectly from the Dirac equation. Its isospin dependenceis given by the ρ-meson. Its strength is determined bythe symmetry energy and it leads usually only to a weakisospin dependence [10,7]. The use of an additional scalarisovector δ-meson does not change very much this situa-tion, because the contributions of the isovector mesons tothe spin-orbit term are small as compared to the contri-butions of the isoscalar mesons [12].
There has been lately a renewed interest in experimen-tal studies concerning the spin orbit part of the nuclearforce. In particular two specific experiments [13,14] wererecently published, where the structure of the N = 20nucleus 34Si nucleus is investigated. The reason why thisparticular nucleus was chosen is its unique bubble struc-ture, unveiled in earlier theoretical calculations [15] usingboth relativistic and non-relativistic models.
1
user
Text Box
39

2
Following, therefore, the identification of 34Si as a bub-ble nucleus [15] a very specific experiment by Burgunderet.al. [13] was conducted attempting to set an additionalconstraint on the strength of the spin-orbit force. Compar-ing these results with earlier experiments of nuclei withinthe N = 20 isotone chain such as in [16,17], one is ableto evaluate a reduction in the 2p3/2−2p1/2 splitting. Thiseffect has been attributed to the occurrence of a bubblein the central proton density as one advances from 36S to34Si.
We first neglect pairing correlations, as it has beendone in the earlier non-relativistic work of Ref. [18] andcalculate the single particle energies in the relativistic Hartreemodel (RH) based on several modern nonlinear and den-sity dependent covariant density functionals. Afterwardswe go beyond these investigations in various aspects: westudy the influence of pairing correlations within the rel-ativistic Hartree-Bogoliubov (RHB) scheme, we includetensor forces in relativistic Hartree-Fock (RHF) theory,and finally we go beyond mean field and include particlevibration coupling (PVC).
2 Results
As mentioned in the introduction we concentrate our studyto the series of N = 20 isotones. We start with the nucleus40Ca with Z = 20 protons, where the last four protons fillthe 1d3/2 orbit. By removing two protons we go to 38Ar
and by removing two more we reach 36S which has its lasttwo protons in the 2s1/2 orbit. The density distribution ofthis state is peaked in the center of the nucleus. and theremoval of the two protons, as we go to 34Si, leads to anoccupation probability close to zero. Therefore we have acentral depletion in the proton density and the formationof a dimple around the centre of the nuclear charge den-sity. This is shown in Fig.1, where we have plotted theproton densities with respect to the nuclear radius. Forthe first three nuclei in this chain we can see clearly apeak of the proton density at the center of the nucleuswhereas for 34Si there is a dimple, (see also Ref. [15]). Ex-perimental evidence of the existence of this bubble struc-ture has been given very recently by Mutschler et. al. inRef. [14], where the one-proton removal reaction 34Si(−1p)33Al has been studied. Even though the occupancy of asingle-particle orbit is not a direct observable, its valuecan be calculated using experimental data. Therefore anoccupancy of 0.17(3) has been deduced for the 2s1/2 pro-
ton state in 34Si, which is only 10% of the 1.7(4) occu-pancy of the same state in 36S, resulting in an occupancychange of ∆(2s1/2) = 1.53. This result came in additionto the findings of the earlier experiment by Burgunder et.al. [13], where the energies and spectroscopic factors ofthe first 1f7/2, 2p3/2, 2p1/2 and 1f5/2 neutron states in
the nucleus 35Si were measured through a (d, p) transferreaction. Together with the results of Refs. [16,17], it wasdiscovered that the 2p = 2p1/2 − 2p3/2 spin-orbit splitting
was considerably reduced as one goes from 36S to 34Si.
2 4r (fm)
0
0.05
0.1
pro
ton d
ensi
ty f
m-3
40Ca
38Ar
36S
34Si
Fig. 1. (color online) Proton densities of the nuclei 40Ca, 38Ar,36S and 34Si for the functional DD-ME2.
Table 1. Spin-orbit splittings in MeV (Upper part) and theirrelative reductions (Lower part) for f and p neutron states inthe case of no pairing.
40Ca 38Ar 36S 34Si
W1
W2f p f p f p f p
NL3 1.11 7.21 1.69 6.90 1.77 6.43 1.80 6.08 0.71DD-ME2 1.07 7.40 1.71 7.04 1.72 6.52 1.65 6.12 0.87DD-PC1 1.07 7.83 1.77 7.57 1.74 7.12 1.64 6.61 0.88Exp. 6.98 1.66 5.61 1.99 5.5 1.13
40Ca →36S 36S →
34Si
f p f p
NL3 11% -6% 5% 61%DD-ME2 12% 3% 6% 47%DD-PC1 9% 8% 7% 46%Exp. 20% -20% 2% 43%
An important aspect of the spin-orbit force is its den-sity and isospin dependence. It is clearly stated in Refs. [13,14] that the results of these two experiments are ideal fora further theoretical investigation of the SO force deducedfrom the various nuclear density functionals. In particu-lar, the extreme neutron-to-proton density asymmetry inthe case of 34Si and the subsequent large and abrupt re-duction in the size of the p-spitting, can provide a bet-ter constraint of the SO force, since these results isolatethe contributions coming mostly from its density and itsisospin dependence.
As was noted in the introduction, the way the spin-orbit force is included in relativistic density functionaltheory is substantially different from the non-relativisticcase.
2.1 Pure mean-field effects
We begin our investigations with simple mean field calcu-lations without pairing: we solve the Relativistic Hartreeequations and investigate the behaviour of the single-neutron
user
Text Box
K. Karakatsanis et al.: Spin-orbit splittings of neutron states in N=20 isotones from CDF and their extensions 40

3
34363840Mass number A
0
0.5
1
1.5
2
2.5
3
E (
MeV
)
NL3DD-ME2DD-PC1SLy5
D1SExp.
34363840Mass number A
5
5.5
6
6.5
7
7.5
8
8.5
9
(p) (f)
Fig. 2. (Color online) Evolution of spin-orbit splittings for theneutron levels p (left panel) and f (right panel) with respectto the mass number A, without pairing.
energies in the N = 20 isotone chain. In this case the sin-gle particle orbits are either fully occupied or completelyempty. Thus the occupancy of the 2s1/2 proton state is
2 for the nuclei 40Ca, 38Ar, and 36S and 0 for 34Si. Thiswill give us the pure relativistic mean field effect on thespin-orbit splittings.
The results for this case are given in Table 1. In theupper part we show the f = 1f7/2 − 1f5/2 and p = 2p3/2 −2p1/2 energy splittings for each specific functional and for
each of the nuclei 40Ca, 38Ar, 36S, and 34Si. In the lowerpart we present the relative reduction of the f and p split-tings again for every functional, first as we move from 40Cato 36S and then as we go from 36S to 34Si. We also showin the last row the experimental values of the splittingsand the reductions for 40Ca [16], 36S [17], and 34Si [13].
For 40Ca we use the values of the centroids for thedistribution of the respective fragments. These data can becompared directly with our theoretical results. In the othertwo cases this is not possible, because the experimentalcentroids are not known. Therefore for the 2p3/2−2p1/2 in
both 36S and 34Si we use the major fragment of each state.For the 1f5/2 state in 36S we use the major contributionthat comes from three states centered at 5.61 MeV witha total spectroscopic factor SF = 0.36, and in 34Si thebroad structure around 5.5 MeV with a calculated SF =0.32. Even though this is not directly comparable withour results, we use it as an indication of the size of thereduction we should expect.
A schematic representation of our results together withthe results for the non-relativistic SLy5 and D1S models,is given in Fig. 2. For all the models we plot the evolutionof the p and the f spin-orbit splittings as a function of themass number A.
In this first approach we observe a gradual reductionin the f splittings of about 0.3-0.4 MeV at each step aswe move down the chain of isotones. This is also apparentfrom the fact that the curves that show the evolution of thef -splitting in Fig. 2 have a similar slope for the different
functionals. The total relative reduction is between 15-19% and around 5-7% at each step.
In contrast to the f -splittings, the p splittings changeonly slightly for the three first nuclei, the only exceptionbeing the functional DD-MEδ. Only when we move from36S to 34Si we find a large reduction for the p splittings ofthe order of 40% to 60%. Qualitatively this picture is inline with the experiment. However, the absolute size of thep-splitting in 34Si for most of our models is smaller thanthe respective experimental value. This leads in certaincases to an even larger relative reduction than what weshould expect.
When we compare between relativistic and non-relativisticresults we observe the following differences. In general thesizes of the splittings in all the relativistic models aresmaller than the respective splittings in non-relativisticSLy5 and D1S models. More specifically in the nuclei 40Caand 36S, where the proton density has the normal profile,i.e. no central depletion, the difference in the size of f -splittings is in the order of 1-2 MeV and the size of thep-splittings is around 0.5 MeV
In the interesting case of the bubble nucleus 34Si, thef -splittings are in the same size because of the bigger rel-ative reduction that appears in the non-relativistic casesomething not present in the relativistic models. Howeverthere is a difference in the p-splittings which are relativelysmall in size for all the relativistic functionals. This istranslated into a relative reduction of the p-splitting whenwe go from 36S to 34Si, which is larger for most of the rel-ativistic models as compared to the relative reduction fornon-relativistic models.
2.2 The effect of pairing correlations
Pairing correlations and the related pairing gap can af-fect the size of the SO splittings. Already in Ref. [15] itwas shown within the framework of Relativistic HartreeBogoliubov (RHB) calculations that pairing correlationsreduce the size of the bubble in 34Si. According to this re-sult and based on the previous discussion we expect to seea weakening of the bubble effect therefore larger absolutesizes and smaller relative reductions of the p-splitting, ascompared to the pure Hartree-calculations without pair-ing.
Within the RHB for superfluid nuclei we deal withquasiparticles. The occupancy of each state is calculatedself-consistently. It is determined by the strength of thepairing force. Subsequently, in the present work, we in-troduce pairing correlations in the proton subsystem andevaluate again the single-particle energies of the same neu-tron states as before. We also calculate the occupationprobabilities of the proton 2s1/2 state for 36S and 34Si,
since the bubble structure in 34Si is created because ofthis state being almost empty.
In this context we use the TMR separable pairing forceof Ref. [20] for the short range correlations. This kind ofseparable pairing force has been adjusted to reproduce thepairing gap of the Gogny force D1S in symmetric nuclearmatter [20]. Both forces are of finite range and therefore
user
Text Box
K. Karakatsanis et al.: Spin-orbit splittings of neutron states in N=20 isotones from CDF and their extensions 41
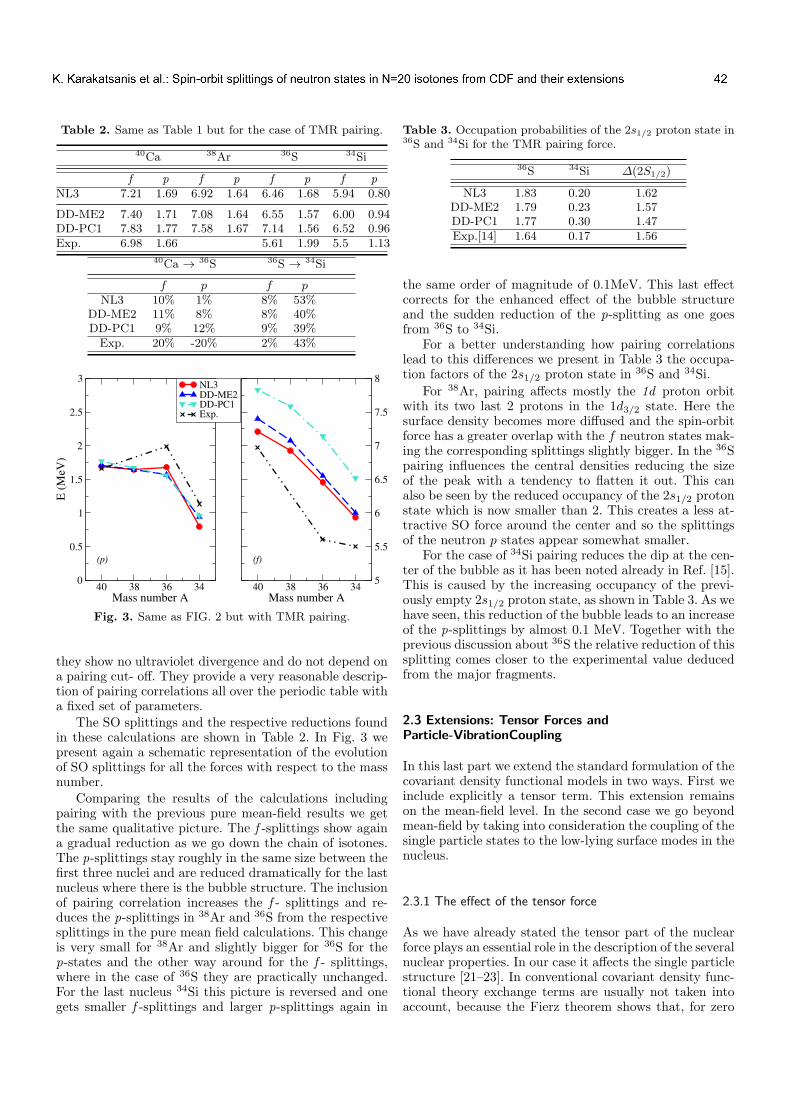
4
Table 2. Same as Table 1 but for the case of TMR pairing.
40Ca 38Ar 36S 34Si
f p f p f p f p
NL3 7.21 1.69 6.92 1.64 6.46 1.68 5.94 0.80
DD-ME2 7.40 1.71 7.08 1.64 6.55 1.57 6.00 0.94DD-PC1 7.83 1.77 7.58 1.67 7.14 1.56 6.52 0.96Exp. 6.98 1.66 5.61 1.99 5.5 1.13
40Ca →36S 36S →
34Si
f p f p
NL3 10% 1% 8% 53%DD-ME2 11% 8% 8% 40%DD-PC1 9% 12% 9% 39%Exp. 20% -20% 2% 43%
34363840Mass number A
0
0.5
1
1.5
2
2.5
3
E (
MeV
)
NL3DD-ME2DD-PC1Exp.
34363840Mass number A
5
5.5
6
6.5
7
7.5
8
(p) (f)
Fig. 3. Same as FIG. 2 but with TMR pairing.
they show no ultraviolet divergence and do not depend ona pairing cut- off. They provide a very reasonable descrip-tion of pairing correlations all over the periodic table witha fixed set of parameters.
The SO splittings and the respective reductions foundin these calculations are shown in Table 2. In Fig. 3 wepresent again a schematic representation of the evolutionof SO splittings for all the forces with respect to the massnumber.
Comparing the results of the calculations includingpairing with the previous pure mean-field results we getthe same qualitative picture. The f -splittings show againa gradual reduction as we go down the chain of isotones.The p-splittings stay roughly in the same size between thefirst three nuclei and are reduced dramatically for the lastnucleus where there is the bubble structure. The inclusionof pairing correlation increases the f - splittings and re-duces the p-splittings in 38Ar and 36S from the respectivesplittings in the pure mean field calculations. This changeis very small for 38Ar and slightly bigger for 36S for thep-states and the other way around for the f - splittings,where in the case of 36S they are practically unchanged.For the last nucleus 34Si this picture is reversed and onegets smaller f -splittings and larger p-splittings again in
Table 3. Occupation probabilities of the 2s1/2 proton state in36S and 34Si for the TMR pairing force.
36S 34Si ∆(2S1/2)
NL3 1.83 0.20 1.62DD-ME2 1.79 0.23 1.57DD-PC1 1.77 0.30 1.47Exp.[14] 1.64 0.17 1.56
the same order of magnitude of 0.1MeV. This last effectcorrects for the enhanced effect of the bubble structureand the sudden reduction of the p-splitting as one goesfrom 36S to 34Si.
For a better understanding how pairing correlationslead to this differences we present in Table 3 the occupa-tion factors of the 2s1/2 proton state in 36S and 34Si.
For 38Ar, pairing affects mostly the 1d proton orbitwith its two last 2 protons in the 1d3/2 state. Here thesurface density becomes more diffused and the spin-orbitforce has a greater overlap with the f neutron states mak-ing the corresponding splittings slightly bigger. In the 36Spairing influences the central densities reducing the sizeof the peak with a tendency to flatten it out. This canalso be seen by the reduced occupancy of the 2s1/2 protonstate which is now smaller than 2. This creates a less at-tractive SO force around the center and so the splittingsof the neutron p states appear somewhat smaller.
For the case of 34Si pairing reduces the dip at the cen-ter of the bubble as it has been noted already in Ref. [15].This is caused by the increasing occupancy of the previ-ously empty 2s1/2 proton state, as shown in Table 3. As wehave seen, this reduction of the bubble leads to an increaseof the p-splittings by almost 0.1 MeV. Together with theprevious discussion about 36S the relative reduction of thissplitting comes closer to the experimental value deducedfrom the major fragments.
2.3 Extensions: Tensor Forces andParticle-VibrationCoupling
In this last part we extend the standard formulation of thecovariant density functional models in two ways. First weinclude explicitly a tensor term. This extension remainson the mean-field level. In the second case we go beyondmean-field by taking into consideration the coupling of thesingle particle states to the low-lying surface modes in thenucleus.
2.3.1 The effect of the tensor force
As we have already stated the tensor part of the nuclearforce plays an essential role in the description of the severalnuclear properties. In our case it affects the single particlestructure [21–23]. In conventional covariant density func-tional theory exchange terms are usually not taken intoaccount, because the Fierz theorem shows that, for zero
user
Text Box
K. Karakatsanis et al.: Spin-orbit splittings of neutron states in N=20 isotones from CDF and their extensions 42
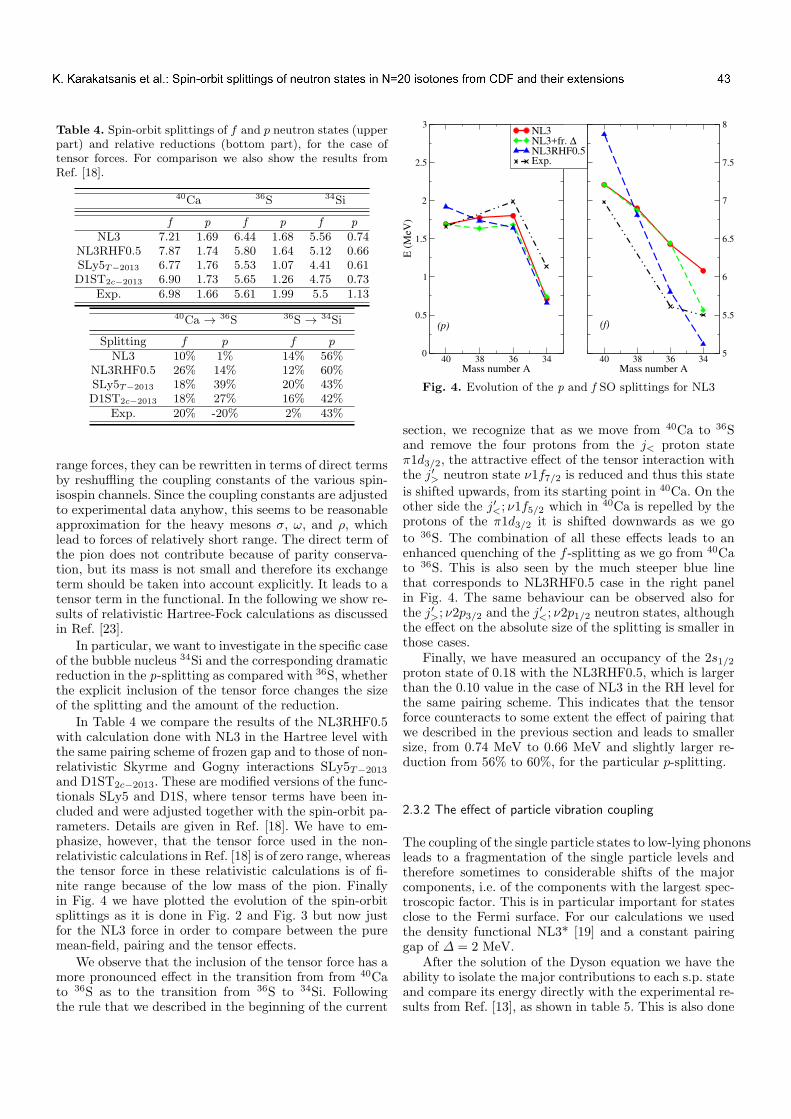
5
Table 4. Spin-orbit splittings of f and p neutron states (upperpart) and relative reductions (bottom part), for the case oftensor forces. For comparison we also show the results fromRef. [18].
40Ca 36S 34Si
f p f p f p
NL3 7.21 1.69 6.44 1.68 5.56 0.74NL3RHF0.5 7.87 1.74 5.80 1.64 5.12 0.66SLy5T−2013 6.77 1.76 5.53 1.07 4.41 0.61D1ST2c−2013 6.90 1.73 5.65 1.26 4.75 0.73
Exp. 6.98 1.66 5.61 1.99 5.5 1.13
40Ca →36S 36S →
34Si
Splitting f p f p
NL3 10% 1% 14% 56%NL3RHF0.5 26% 14% 12% 60%SLy5T−2013 18% 39% 20% 43%D1ST2c−2013 18% 27% 16% 42%
Exp. 20% -20% 2% 43%
range forces, they can be rewritten in terms of direct termsby reshuffling the coupling constants of the various spin-isospin channels. Since the coupling constants are adjustedto experimental data anyhow, this seems to be reasonableapproximation for the heavy mesons σ, ω, and ρ, whichlead to forces of relatively short range. The direct term ofthe pion does not contribute because of parity conserva-tion, but its mass is not small and therefore its exchangeterm should be taken into account explicitly. It leads to atensor term in the functional. In the following we show re-sults of relativistic Hartree-Fock calculations as discussedin Ref. [23].
In particular, we want to investigate in the specific caseof the bubble nucleus 34Si and the corresponding dramaticreduction in the p-splitting as compared with 36S, whetherthe explicit inclusion of the tensor force changes the sizeof the splitting and the amount of the reduction.
In Table 4 we compare the results of the NL3RHF0.5with calculation done with NL3 in the Hartree level withthe same pairing scheme of frozen gap and to those of non-relativistic Skyrme and Gogny interactions SLy5T−2013
and D1ST2c−2013. These are modified versions of the func-tionals SLy5 and D1S, where tensor terms have been in-cluded and were adjusted together with the spin-orbit pa-rameters. Details are given in Ref. [18]. We have to em-phasize, however, that the tensor force used in the non-relativistic calculations in Ref. [18] is of zero range, whereasthe tensor force in these relativistic calculations is of fi-nite range because of the low mass of the pion. Finallyin Fig. 4 we have plotted the evolution of the spin-orbitsplittings as it is done in Fig. 2 and Fig. 3 but now justfor the NL3 force in order to compare between the puremean-field, pairing and the tensor effects.
We observe that the inclusion of the tensor force has amore pronounced effect in the transition from from 40Cato 36S as to the transition from 36S to 34Si. Followingthe rule that we described in the beginning of the current
34363840Mass number A
0
0.5
1
1.5
2
2.5
3
E (
MeV
)
NL3NL3+fr. ∆NL3RHF0.5Exp.
34363840Mass number A
5
5.5
6
6.5
7
7.5
8
(p) (f)
Fig. 4. Evolution of the p and f SO splittings for NL3
section, we recognize that as we move from 40Ca to 36Sand remove the four protons from the j< proton stateπ1d3/2, the attractive effect of the tensor interaction withthe j′> neutron state ν1f7/2 is reduced and thus this state
is shifted upwards, from its starting point in 40Ca. On theother side the j′<; ν1f5/2 which in 40Ca is repelled by theprotons of the π1d3/2 it is shifted downwards as we go
to 36S. The combination of all these effects leads to anenhanced quenching of the f -splitting as we go from 40Cato 36S. This is also seen by the much steeper blue linethat corresponds to NL3RHF0.5 case in the right panelin Fig. 4. The same behaviour can be observed also forthe j′>; ν2p3/2 and the j′<; ν2p1/2 neutron states, althoughthe effect on the absolute size of the splitting is smaller inthose cases.
Finally, we have measured an occupancy of the 2s1/2proton state of 0.18 with the NL3RHF0.5, which is largerthan the 0.10 value in the case of NL3 in the RH level forthe same pairing scheme. This indicates that the tensorforce counteracts to some extent the effect of pairing thatwe described in the previous section and leads to smallersize, from 0.74 MeV to 0.66 MeV and slightly larger re-duction from 56% to 60%, for the particular p-splitting.
2.3.2 The effect of particle vibration coupling
The coupling of the single particle states to low-lying phononsleads to a fragmentation of the single particle levels andtherefore sometimes to considerable shifts of the majorcomponents, i.e. of the components with the largest spec-troscopic factor. This is in particular important for statesclose to the Fermi surface. For our calculations we usedthe density functional NL3* [19] and a constant pairinggap of ∆ = 2 MeV.
After the solution of the Dyson equation we have theability to isolate the major contributions to each s.p. stateand compare its energy directly with the experimental re-sults from Ref. [13], as shown in table 5. This is also done
user
Text Box
K. Karakatsanis et al.: Spin-orbit splittings of neutron states in N=20 isotones from CDF and their extensions 43

6
Table 5. Comparison between the spin-orbit splittings (Upperpart) and their relative reductions (Lower part) of the majorfragments from PVC with the corresponding experimental re-sults.
36S 34Si
Splitting f p f p
NL3* with PVC 6.3 2.28 5.28 1.4Exp. 5.61 1.99 5.5 1.13
36S →34Si
Splitting f p
NL3* with PVC 16% 39%Exp. 2% 43%
schematically in fig. 5 where we compare the results of thePVC calculations for the nuclei 36S and 34Si with the ex-perimental values of Ref. [13]. More specifically, we showthe position of the major fragments and the splittings be-tween the f and p states as well as their spectroscopic fac-tors. The experimentally observed reduction of the spin-orbit splitting is 43% for the p states. It is in rather goodagreement with the results obtained from the theoreticalPVC calculations, which show a reduction of 39%. In bothcases these are the splittings for the major fragments. No-tice, that in the PVC calculations we have not includedisospin-flip phonons as it is done, for instance, in Ref. [?].It has been observed that the inclusion of such phononscauses an additional fragmentation and shifts of the domi-nant fragments, bringing the results to a better agreementwith data. However, the latter approach is, so far, not yetadopted to the case of open-shell nuclei. It will be consid-ered in the future.
In Fig. 5 we show the positions of the neutron states2p1/2, 2p3/2 and 1f5/2 using the 1f7/2 as reference state
for the nuclei 37S (panel (a,b,c)) and 35Si (panel (d,e,f)).The experimental data of Ref. [13] in panels (a) and (d)are compared with results of PVC-calculations with thedensity functional NL3* in panels (b) and (e). In this fig-ure the experimental energies as well as the energies of thePVC-calculations correspond to the major components ofthe corresponding fragmented level. Only for the 1f5/2 or-bits we show in panel (a) the experimental fragmentationand in panel (d) the area of the experimental fragmenta-tion. In order to study the effect of particle vibrationalcoupling we show in panels (c) and (f) calculations withthe same density functional without particle vibrationalcoupling.
We find that in both nuclei the SO-splitting of the 1f -orbitals is reproduced relatively well. Particle vibrationalcoupling has only a small influence on this splitting. Onthe other side all 2p-orbits are shifted downwards closer tothe 1f7/2-orbit as it is also observed in the experiment. It iswell known, that this effect is in particular large for levelsclose to the Fermi surface, i.e. larger for the 2p3/2-orbitthan for the 2p1/2-orbit. As a result the SO-splitting of the2p orbits is increased considerably by particle vibrationalcoupling. As compared to the much too small SO-splitting
0.25
0.5
0.75
0.25
0.5
0.75
0.25
0.5
0.75
0.25
0.5
0.75
-1 0 1 2 3 4 5 6 7 8 9E(MeV)
(a)
(b)
(c)
PVC+NL3*
2.0
6.3
2.28
1.40
36S
34Si
36S
1f7/2
1f7/2
1f7/2
2p3/2
2p3/2
2p3/2
2p1/2
2p1/2
2p1/2
1f5/2
1f5/2
<1f5/2
>
1f7/2
2p3/2
2p1/2
<1f5/2
>34
Si
(d)
5.3
1.1
6.38
36S
1f7/2
2p3/2
2p1/2
1f5/2
1f5/2
2p1/22p
3/21f
7/2
34Si
(e)
(f)
PVC+NL3*
NL3*
NL3*
SF
SF
SF
SF
1.28
0.85
5.77
EXP.
EXP.
Fig. 5. Distribution of the major fragments of the single par-ticle strengths of 37S (panel (a)) and 35Si (panel (d)) as givenin Ref. [13] and the same distribution calculated with PVC forthe force NL3* (panels (b) and (e)). Panels (c) and (f) show re-sults obtained without particle vibrational coupling using thesame density functional.
for the 2p orbits without PVC it is now much closer to theexperimental value.
3 Conclusions
In this study we have calculated the single particle energiesof the spin-orbit doublets 1f7/2-1f5/2 and 2p3/2-2p1/2 inorder to investigate the spin-orbit splittings and their evo-lution as we move along the chain of isotones with N=20:40Ca, 38Ar, 36S, and 34Si. We used several relativistic func-tionals of three different types: non-linear meson coupling,density dependent meson coupling and density dependentpoint coupling models. Furthermore, we used the separa-ble TMR pairing force of finite range, which is essentiallyequivalent to the pairing part of the Gogny force D1S, inorder to determine the effect of pairing on the size and onthe reduction of the SO splittings. Finally, we consideredspecific extensions that go beyond the simple Hartree case,namely the inclusion of one-pion exchange which induces atensor force and particle vibration coupling that takes intoaccount correlations between single particle states goingbeyond the mean field approximation.
user
Text Box
K. Karakatsanis et al.: Spin-orbit splittings of neutron states in N=20 isotones from CDF and their extensions 44
7
In general we observe a significant reduction of the2p3/2−2p1/2 splitting for neutron states when we go from36S to 34Si as it is observed in the experiment. In the puremean-field level most of the forces show a relatively largereduction. When we include pairing this reduction is be-comes less and less dramatic with increasing pairing corre-lations, because the occupation of the 2s1/2 proton-orbit
changes less rapidly between 36S and 34Si. The isospin de-pendence of the effective spin-orbit force is weaker in therelativistic models and therefore the reduction is also lesspronounced in these models.
Finally we went beyond the conventional Hartree leveland included two effects, which have a strong influenceon the single particle structure: We included tensor termsand particle vibrational coupling.
Here we found that the tensor term induced by theone pion-exchange force has a relatively small effect. Itacts to some extent in the opposite direction of pairing.It increases the quenching of the spin-orbit distinctly forthe f and to a smaller extent for p states when going from40Ca to 36S, showing the tensor character of those reduc-tions. On the other hand, for the transition from 36S to34Si the size of the splittings are only slightly reduced forboth nuclei and thus the relative reduction remains prac-tically unchanged indicating that this comes purely fromthe spin-orbit interaction. Such an effect is also observedin the non-relativistic case [18] as it is seen in Table 4.On the other hand, particle vibrational coupling acts inthe same direction as pairing. We find that the relative re-duction of the splitting between 2p3/2 and 2p1/2 neutronstates decreases. This is consistent with the general effectof PVC to produce a more dense spectrum near the Fermisurface. Finally this produces a reasonable agreement withthe experimental data in the isotone chain with N = 20.
4 acknowledgments
This research is funded by the Greek State ScholarshipFoundation (IKY), through the program “IKY Fellow-ships of excellence for postgraduate studies in Greece-SIEMENS program”, by the DFG cluster of excellence“Origin and Structure of the Universe” (www.universe-cluster.de), and by US-NSF grant PHY-1404343.
References
1. G. Burgunder, O. Sorlin, F. Nowacki, S. Giron, F. Ham-mache, M. Moukaddam, N. de Sereville, D. Beaumel, L.Caceres, E. Clement, G. Duchene, J. P. Ebran, B. Fernandez-Dominguez, F. Flavigny, S. Franchoo, J. Gibelin, A. Gillib-ert, S. Grevy, J. Guillot, A. Lepailleur, I. Matea, A. Matta,L. Nalpas, A. Obertelli, T. Otsuka, J. Pancin, A. Poves, R.Raabe, J. A. Scarpaci, I. Stefan, C. Stodel, T. Suzuki, andJ. C. Thomas, Phys. Rev. Lett. 112, 042502 (2014).
2. M. Bender, P.-H. Heenen, and P.-G. Reinhard, Rev. Mod.Phys. 75, 121 (2003).
3. J. P. Perdew and S. Kurth, in A Primer in Density Func-
tional Theory, edited by C. Fiolhais, F. Nogueira, and
M. A. L. Marques (Springer Berlin Heidelberg, Berlin, 2003),Vol. 620, pp. 1–55.
4. R. J. Bartlett, Mol. Phys. 108, 3299 (2010).5. D. Vautherin and D. M. Brink, Phys. Rev. C 5, 626 (1972).6. J. Decharge and D. Gogny, Phys. Rev. C 21, 1568 (1980).7. J. D. Walecka, Ann. Phys. (N.Y.) 83, 491 (1974).8. B. D. Serot and J. D. Walecka, Adv. Nucl. Phys. 16, 1(1986).
9. J. Boguta and A. R. Bodmer, Nucl. Phys. A 292, 413(1977).
10. H.-P. Durr, Phys. Rev. 103, 469 (1956).11. M. Baldo, P. Schuck, and X. Vinas, Phys. Lett. B 663, 390(2008).
12. X. Roca-Maza, X. Vinas, M. Centelles, P. Ring, and P.Schuck, Phys. Rev. C
13. G. Burgunder, O. Sorlin, F. Nowacki, S. Giron, F. Ham-mache, M. Moukaddam, N. de Sereville, D. Beaumel, L.Caceres, E. Clement, G. Duchene, J. P. Ebran, B. Fernandez-Dominguez, F. Flavigny, S. Franchoo, J. Gibelin, A. Gillib-ert, S. Grevy, J. Guillot, A. Lepailleur, I. Matea, A. Matta,L. Nalpas, A. Obertelli, T. Otsuka, J. Pancin, A. Poves, R.Raabe, J. A. Scarpaci, I. Stefan, C. Stodel, T. Suzuki, andJ. C. Thomas, Phys. Rev. Lett. 112, 042502 (2014).
14. A. Mutschler, A. Lemasson, O. Sorlin, D. Bazin, C. Borcea,R. Borcea, Z.
15. M. Grasso, L. Gaudefroy, E. Khan, T. Niksic, J.Piekarewicz, O. Sorlin, N. V.
16. Y. Uozumi, N. Kikuzawa, T. Sakae, M. Matoba, K. Ki-noshita, S. Sajima, H. Ijiri,
17. G. Eckle, H. Kader, H. Clement, F. Eckle, F. Merz, R.Hertenberger, H. Maier,
18. M. Grasso and M. Anguiano, Phys. Rev. C 92, 054316(2015).
19. G. A. Lalazissis, S. Karatzikos, R. Fossion, D.Pena Arteaga, A. V. Afanasjev, and P. Ring, Phys.Lett. B 671, 36 (2009).
20. Y. Tian, Z. Y. Ma, and P. Ring, Phys. Lett. B 676, 44(2009).
21. T. Otsuka, T. Suzuki, R. Fujimoto, H. Grawe, and Y.Akaishi, Phys. Rev. Lett.
22. T. Otsuka, T. Matsuo, and D. Abe, Phys. Rev. Lett. 97,162501 (2006).
23. G. A. Lalazissis, S. Karatzikos, M. Serra, T. Otsuka, andP. Ring, Phys. Rev. C 80, 041301 (2009).
Powered by TCPDF (www.tcpdf.org)Powered by TCPDF (www.tcpdf.org)Powered by TCPDF (www.tcpdf.org)Powered by TCPDF (www.tcpdf.org)Powered by TCPDF (www.tcpdf.org)Powered by TCPDF (www.tcpdf.org)Powered by TCPDF (www.tcpdf.org)
user
Text Box
K. Karakatsanis et al.: Spin-orbit splittings of neutron states in N=20 isotones from CDF and their extensions 45
EPJ manuscript No.
(will be inserted by the editor)
A symmetry for heavy nuclei: Proxy-SU(3)
Dennis Bonatsos1, I. E. Assimakis1, N. Minkov2, Andriana Martinou1, R. B. Cakirli3, R. F. Casten4,5, and K. Blaum6
1 Institute of Nuclear and Particle Physics, National Centre for Scientific Research “Demokritos”, GR-15310 Aghia Paraskevi,Attiki, Greece
2 Institute of Nuclear Research and Nuclear Energy, Bulgarian Academy of Sciences, 72 Tzarigrad Road, 1784 Sofia, Bulgaria3 Department of Physics, University of Istanbul, Istanbul, Turkey4 Wright Laboratory, Yale University, New Haven, Connecticut 06520, USA5 Facility for Rare Isotope Beams, 640 South Shaw Lane, Michigan State University, East Lansing, MI 48824 USA6 Max-Planck-Institut fur Kernphysik, Saupfercheckweg 1, D-69117 Heidelberg, Germany
Received: date / Revised version: date
Abstract. The SU(3) symmetry realized by J. P. Elliott in the sd nuclear shell is destroyed in heavier shellsby the strong spin-orbit interaction. However, the SU(3) symmetry has been used for the description ofheavy nuclei in terms of bosons in the framework of the Interacting Boson Approximation, as well as interms of fermions using the pseudo-SU(3) approximation. We introduce a new fermionic approximation,called the proxy-SU(3), and we comment on its similarities and differences with the other approaches.
PACS. 21.60.Fw Models based on group theory – 21.60.Ev Collective models
1 Introduction
The SU(3) symmetry has been introduced in nuclear struc-ture by J. P. Elliott [1,2], who considered the sd shell nu-clei and showed the microscopic origins of the connectionbetween the nuclear quadrupole deformation and SU(3).A generalization of the Elliott SU(3) scheme to more thanone nuclear shell has been obtained in the framework ofthe microscopic symplectic model [3]. Since then the SU(3)symmetry has been used in the framework of various alge-braic models, especially for the study of medium-mass andheavy deformed nuclei, where the LS coupling scheme ofthe Elliott model breaks down [4], while microscopic cal-culations are still out of reach. Descriptions in terms ofbosons have been given in the frameowork of the Inter-acting Boson Model (IBM) [5] and of the Interacting Vec-tor Boson Model (IVBM) [6], while fermionic descriptionshave been provided by the Fermion Dynamical Symme-try Model (FDSM) [7]. It underlies also the pseudo-SU(3)scheme [8–14], which we will discuss below, as well as thequasi-SU(3) symmetry [15,16], in which an approximaterestoration of LS coupling in heavy nuclei is obtained,based on the smallness of certain ∆j = 1 matrix elements.
On the other hand, many properties of heavy deformednuclei have been successfully described in detail in termsof the Nilsson model [17–19]. Nilsson states are labelled byK[NnzΛ], where N is the number of oscillator quanta, nz
is the number of quanta along the cylindrical symmetryaxis, Λ is the projection of the orbital angular momen-tum along the symmetry axis, and K is the the projec-tion of the total angular momentum along the symmetry
axis, connected to Λ by K = Λ + Σ, where Σ is the theprojection of the spin along the symmetry axis. For largedeformations, the Nilsson wave functions reach the asymp-totic limit, in which these quantum numbers become goodquantum numbers, and they remain rather good even atintermediate deformation values [18].
Ben Mottelson has remarked [20] that the asymptoticquantum numbers of the Nilsson model can be seen as ageneralization of Elliott’s SU(3), applicable to heavy de-formed nuclei. Working in this direction, we have shown[21,22] that a proxy-SU(3) symmetry of the Elliott typecan be developed in heavy deformed nuclei. The develop-ment of the proxy-SU(3) scheme is based on the so-called0[110] pairs of Nilsson orbits related by∆K[∆N∆nz∆Λ] =0[110] [23]. These pairs, which are characterized by highoverlaps [24], have been shown to play a key role in theonset and development of nuclear deformation in the rareearth region [23,24].
In the proxy-SU(3) scheme we also focus attention onNilsson 0[110] pairs, but in a different way. Instead oftaking advantage of proton-neutron pairs, we use proton-proton and neutron-neutron pairs. In this way we revealan approximate SU(3) symmetry in heavy deformed nu-clei, which can be used for predicting nuclear propertieswithin the SU(3) symmetry using algebraic methods, aswe shall see in Refs. [25,26].
user
Text Box
46

2 Dennis Bonatsos et al.: A symmetry for heavy nuclei: Proxy-SU(3)
1g9/2
2d5/2
1g7/2
1h11/2
2d3/2
3s1/2
Fig. 1. Schematic representation of the 50–82 shell and thereplacement leading to the proxy sdg shell.
2 The proxy-SU(3) model
We are going to explain the basic idea behind the proxy-SU(3) scheme by considering as an example the 50-82 ma-jor nuclear shell, shown in Fig. 1.
In the 50-82 major shell one finds the 3s1/2, 2d3/2,2d5/2, and 1g7/2 orbitals (shown in Fig. 1 by solid lines).These are the pieces of the full sdg shell remaining afterthe desertion (because of the spin-orbit force) of the 1g9/2orbitals (indicated by dashed lines) into the next shell be-low, i.e. into the 28-50 nuclear shell. In addition, the 50-82major shell contains the 1h11/2 orbitals (shown by dashedlines plus one dotted line), which have invaded this shellfrom above, forced down and out of the pfh shell also bythe spin-orbit force.
The deserter 1g9/2 orbital consists of the Nilsson or-bitals 1/2[440], 3/2[431], 5/2[422], 7/2[413], 9/2[404]. Thesehappen to be 0[110] partners of the 1h11/2 Nilsson or-bitals 1/2[550], 3/2[541], 5/2[532], 7/2[523], 9/2[514], inthe same order. Two orbitals being 0[110] partners pos-sess exactly the same values of the projections of orbitalangular momentum, spin, and total angular momentum,thus they are expected to exhibit identical behavior as faras properties related to angular momentum projectionsare concerned. 0[110] partners have been first used in re-lation to proton-neutron pairs [23], found to correspondto increased strength of the proton-neutron interaction,because of their large overlaps [24].
One can thus think of replacing all of the invading1h11/2 orbitals (the upper group of dashed lines in Fig. 1),except the 11/2[505] orbital (the dotted line in Fig. 1) inthe 50-82 shell by their deserting 1g9/2 counterparts (thelower group of dashed lines in Fig. 1), expecting nuclearproperties related to angular momentum to be little af-fected, since angular momentum projections remain in-tact. However, one should take carefully into account thatduring this replacement the N and nz quantum numbershave been changed by one unit each, thus changing thesign of the parity. These changes will obviously affect theselection rules of various relevant matrix elements, as wellas the avoided crossings [27] in the Nilsson diagrams. De-tailed calculations to be shown in Ref. [28] will demon-strate that the changes inflicted in the Nilsson diagramsby these modifications are indeed minimal.
The 1h11/2 11/2[505] orbit has no 0[110] partner in the1g9/2 shell, thus it has been excluded from this replace-ment. However, this orbit lies at the top of the 50-82 shellin the Nilsson diagrams [17,18], where it is unlikely to findnuclei with large deformations. The same remark appliesto similar orbits in other shells such as the 13/2[606] orbitin the 82-126 shell.
After these two approximations have been performed,one is left with a collection of orbitals which form ex-actly the full sdg shell, which is known to possess a U(15)symmetry, having an SU(3) subalgebra [29]. However, inaxially symmetric deformed nuclei the relevant symmetryis not spherical, but cylindrical [30]. As a consequence,the relevant algebras are not U(N) Lie algebras, but morecomplicated versions of deformed algebras [31–36]. Nev-ertheless, one can expect that some of the SU(3) featureswould appear within the approximate scheme.
Since the present approximation scheme is based onthe replacement of the invading from above abnornal par-ity orbitals (except the one with highest angular momen-tum) by their 0[110] counterparts deserting to the lowershell, with the latter being used as proxies of the formerin subsequent considerations, we are going to call this ap-proximation the proxy-SU(3) model.
The same approximation can be made in the 28-50,82-126, 126-184 shells, which thus become approximatepf, pfh, sdgi shells, respectivel. These shells are known tocorrespond to U(10), U(21), U(28) algebras having SU(3)subalgebras (see [29] and references therein).
3 The pseudo-SU(3) scheme
The present approach exhibits several similarities withand differences from the pseudo-SU(3) scheme, which hasbeen extremely useful in the study of many properties ofmedium-mass and heavy nuclei away from closed shells.We list here some of these studies.
1) Yrast [10,11,37] and non-Yrast [38–43] bands ofeven-even deformed nuclei.
2) Normal parity bands and excited bands in odd-massnuclei [44–48].
3) The scissors mode and magnetic dipole excitations[49–54].
user
Text Box
D. Bonatsos et al.: A symmetry for heavy nuclei: Proxy-SU(3) 47
Dennis Bonatsos et al.: A symmetry for heavy nuclei: Proxy-SU(3) 3
4) Superdeformed bands [55,56].5) Double-beta decay [57–59], neutrinoless double-beta
decay [60], and double-electron capture [61].6) It should be pointed out that in the case of pseudo-
SU(3) a unitary transformation connecting the normalparity orbitals to the pseudo-SU(3) space is known [62,63].
It is expected that using a large number of results re-garding the study of fermionic systems by algebraic tech-niques, already developed and used in the pseudo-SU(3)framework, one would be able to perform further comple-mentary studies using the proxy-SU(3) model.
4 Conclusions
A new approximate SU(3) symmetry applicable in heavydeformed nuclei has been suggested [21,22], called theproxy-SU(3) scheme. In Ref. [28] a detailed numerical studywill demonstrate the validity of the approximation, whilein Refs. [25,26] some first applications of the method inpredicting nuclear properties will be described.
References
1. J. P. Elliott, Collective motion in the nuclear shell modelI. Classification schemes for states of mixed configura-tions, Proc. Roy. Soc. Ser. A 245, 128(1958).
2. J. P. Elliott, Collective motion in the nuclear shell modelII. The introduction of intrinsic wave-functions, Proc.Roy. Soc. Ser. A 245, 562 (1958).
3. G. Rosensteel and D. J. Rowe, On the algebraic formula-tion of collective models III. The symplectic shell modelof collective motion, Ann. Phys. (NY) 126, 343 (1980).
4. I. Talmi, Simple models of complex nuclei: The shell
model and the interacting boson model (Harwood, Chur,1993).
5. F. Iachello and A. Arima, The Interacting Boson Model
(Cambridge University Press, Cambridge, 1987).6. A. Georgieva, P. Raychev, and R. Roussev, Rotational
limit of the interacting two-vector-boson model, J. Phys.G: Nucl. Phys. 9, 521 (1983).
7. C.-L. Wu, D. H. Feng, X.-G. Chen, J.-Q. Chen, and M.W.Guidry, Fermion dynamical symmetry model of nuclei:Basis, Hamiltonian, and symmetries, Phys. Rev. C 36,1157 (1987).
8. R. D. Ratna Raju, J. P. Draayer, and K. T. Hecht, Searchfor a coupling scheme in heavy deformed nuclei: Thepseudo SU(3) model, Nucl. Phys. A 202, 433 (1973).
9. J. P. Draayer, K. J. Weeks, and K. T. Hecht, Strength ofthe Qπ · Qν interaction and the strong-coupled pseudo-SU(3) limit, Nucl. Phys. A 381, 1 (1982).
10. J. P. Draayer and K. J. Weeks, Shell-model descriptionof the low-energy structure of strongly deformed nuclei,Phys. Rev. Lett. 51, 1422 (1983).
11. J. P. Draayer and K. J. Weeks, Towards a shell modeldescription of the low-energy structure of deformed nucleiI. Even-even systems, Ann. Phys. (N.Y.) 156, 41 (1984).
12. C. Bahri, J. P. Draayer, and S. A. Moszkowski, Pseu-dospin symmetry in nuclear physics, Phys. Rev. Lett. 68,2133 (1992).
13. A. L. Blokhin, C. Bahri, and J. P. Draayer, Origin ofpseudospin symmetry, Phys. Rev. Lett. 74, 4149 (1995).
14. J. N. Ginocchio, Pseudospin as a relativistic symmetry,Phys. Rev. Lett. 78, 436 (1997).
15. A. P. Zuker, J. Retamosa, A. Poves, and E. Caurier,Spherical shell model description of rotational motion,Phys. Rev. C 52, R1741 (1995).
16. A. P. Zuker, A. Poves, F. Nowacki, and S. M. Lenzi,Nilsson–SU(3) self-consistency in heavy N=Z nuclei,Phys. Rev. C 92, 024320 (2015).
17. S. G. Nilsson, Binding states of individual nucleons instrongly deformed nuclei, Mat. Fys. Medd. K. Dan. Vi-densk. Selsk. 29, no. 16 (1955).
18. S. G. Nilsson and I. Ragnarsson, Shapes and Shells in Nu-clear Structure (Cambridge University Press, Cambridge,1995).
19. I. Ragnarsson, S. G. Nilsson, and R. K. Sheline, Shellstructure in nuclei, Phys. Reports 45, 1 (1978).
20. B. Mottelson, The Nilsson Model and Sven Gosta Nilsson,Phys. Scr. T125 (2006) editorial.
21. D. Bonatsos, I. E. Assimakis, N. Minkov, A. Martinou,R. B. Cakirli, R. F. Casten, and K. Blaum, Proxy-SU(3)symmetry in heavy deformed nuclei, Phys. Rev. C (2017)accepted, arXiv 1706.02282 [nucl-th].
22. D. Bonatsos, I. E. Assimakis, N. Minkov, A. Martinou,S. Sarantopoulou, R. B. Cakirli, R. F. Casten, and K.Blaum, Analytic predictions for nuclear shapes, prolatedominance and the prolate-oblate shape transition in theproxy-SU(3) model, Phys. Rev. C (2017) accepted, arXiv1706.02321 [nucl-th].
23. R. B. Cakirli, K. Blaum, and R. F. Casten, Indication ofa mini-valence Wigner-like energy in heavy nuclei, Phys.Rev. C 82, 061304(R) (2010).
24. D. Bonatsos, S. Karampagia, R. B. Cakirli, R. F. Casten,K. Blaum, and L. Amon Susam, Emergent collectivity innuclei and enhanced proton-neutron interactions, Phys.Rev. C 88, 054309 (2013).
25. D. Bonatsos. I. E. Assimakis, N. Minkov, A. Marti-nou, S. Sarantopoulou, R. B. Cakirli, R. F. Casten, andK. Blaum, Parameter-independent predictions for shapevariables of heavy deformed nuclei in the proxy-SU(3)model, in the Proceedings of the 4th Workshop of theHellenic Institute of Nuclear Physics (HINPw4), ed. A.Pakou, http://hinpw4.physics.uoi.gr
26. D. Bonatsos. I. E. Assimakis, N. Minkov, A. Martinou,S. Sarantopoulou, R. B. Cakirli, R. F. Casten, and K.Blaum, Prolate dominance and prolate-oblate shape tran-sition in the proxy-SU(3) model, in the Proceedings of the4th Workshop of the Hellenic Institute of Nuclear Physics(HINPw4), ed. A. Pakou, http://hinpw4.physics.uoi.gr
27. P. Cejnar and P. Stransky, Quantum phase transitions inthe collective degrees of freedom: nuclei and other many-body systems, Phys. Scripta 91, 083006 (2016).
28. D. Bonatsos. I. E. Assimakis, N. Minkov, A. Martinou,R. B. Cakirli, R. F. Casten, and K. Blaum, Proxy-SU(3) symmetry in heavy nuclei: Foundations, in theProceedings of the 4th Workshop of the Hellenic In-stitute of Nuclear Physics (HINPw4), ed. A. Pakou,http://hinpw4.physics.uoi.gr
29. D. Bonatsos and A. Klein, Exact boson mappings for nu-clear neutron (proton) shell-model algebras having SU(3)subalgebras, Ann. Phys. (NY) 169, 61 (1986).
user
Text Box
D. Bonatsos et al.: A symmetry for heavy nuclei: Proxy-SU(3) 48
4 Dennis Bonatsos et al.: A symmetry for heavy nuclei: Proxy-SU(3)
30. Y. Takahashi, SU(3) shell model in a deformed harmonicoscillator basis, Prog. Theor. Phys. 53, 461 (1975).
31. G. Rosensteel and J. P. Draayer, Symmetry algebra ofthe anisotropic harmonic oscillator with commensuratefrequencies, J. Phys. A: Math. Gen. 22, 1323 (1989).
32. W. Nazarewicz and J. Dobaczewski, Dynamical symme-tries, multiclustering, and octupole susceptibility in su-perdeformed and hyperdeformed nuclei, Phys. Rev. Lett.68, 154 (1992).
33. W. Nazarewicz, J. Dobaczewski, and P. Van Isacker, Shellmodel calculations at superdeformed shapes, AIP Conf.Proc. 259, 30 (1992).
34. D. Bonatsos, C. Daskaloyannis, P. Kolokotronis, andD. Lenis, The symmetry algebra of the N-dimensionalanisotropic quantum harmonic oscillator with rational ra-tios of frequencies and the Nilsson model, arXiv: hep-th/9411218.
35. K. Sugawara-Tanabe and A. Arima, New dynamicalSU(3) symmetry in deformed nuclei, Nucl. Phys. A 619,88 (1997).
36. A. Arima, Elliott’s SU(3) model and its developments innuclear physics, J. Phys. G: Nucl. Part. Phys. 25, 581(1999).
37. H. A. Naqvi and J. P. Draayer, Shell-model operator forK-band splitting, Nucl. Phys. A 516, 351 (1990).
38. G. Popa, J. G. Hirsch, and J. P. Draayer, Shell modeldescription of normal parity bands in even-even heavydeformed nuclei, Phys. Rev. C 62, 064311 (2000).
39. G. Popa, A. Georgieva, and J. P. Draayer, Systematicsin the structure of low-lying, nonyrast bandhead config-urations of strongly deformed nuclei, Phys. Rev. C 69,064307 (2004).
40. C. E. Vargas and J. G. Hirsch, Pushing the pseudo-SU(3)model towards its limits: Excited bands in even-even Dyisotopes, Phys. Rev. C 70, 064320 (2004).
41. G. Popa and A. Georgieva, Description of heavy deformednuclei within the pseudo-SU(3) shell model, J. Phys.:Conf. Ser. 403, 012009 (2012).
42. C. E. Vargas, V. Velazquez, and S. Lerma, Microscopicstudy of neutron-rich dysprosium isotopes, Eur. Phys. J.A 49, 4 (2013).
43. C. E. Vargas, V. Velazquez, S. Lerma-Hernandez,and N. Bagatella-Flores, Electromagnetic properties in160−170Dy nuclei: A microscopic description by thepseudo-SU(3) shell model, Eur. Phys. J. A 53, 73 (2017).
44. H. A. Naqvi and J. P. Draayer, Shell-model operator forKJ -band splitting in odd-A nuclei, Nucl. Phys. A 536,297 (1992).
45. C. Vargas, J. G. Hirsch, T. Beuschel, and J. P. Draayer,Shell model description of normal parity bands in odd-mass heavy deformed nuclei, Phys. Rev. C 61, 031301(R)(2000).
46. C. E. Vargas, J. G. Hirsch, and J. P. Draayer, PreudoSU(3) shell model: Normal parity bands in odd-mass nu-clei, Nucl. Phys. A 673, 219 (2000).
47. C. E. Vargas, J. G. Hirsch, and J. P. Draayer, InterbandB(E2) transition strengths in odd-mass heavy deformednuclei, Phys. Rev. C 64, 034306 (2001).
48. C. E. Vargas, J. G. Hirsch, and J. P. Draayer, Excitedbands in odd-mass rare-earth nuclei, Phys. Rev. C 66,064309 (2002).
49. O. Castanos, J. P. Draayer, and Y. Leschber, Towards ashell-model description of the low-energy structure of de-formed nuclei II. Electromagnetic properties of collectiveM1 bands, Ann. Phys. (N.Y.) 180, 290 (1987).
50. T. Beuschel, J. P. Draayer, D. Rompf, and J. G. Hirsch,Microscopic description of the scissors mode and its frag-mentation, Phys. Rev. C 57, 1233 (1998).
51. D. Rompf, T. Beuschel, J. P. Draayer, W. Scheid, and J.G. Hirsch, Towards understanding magnetic dipole exci-tations in deformed nuclei: Phenomenology, Phys. Rev. C57, 1703 (1998).
52. J. P. Draayer, T. Beuschel, and J. G. Hirsch, M1 strengthsin deformed nuclei, J. Phys. G: Nucl. Part. Phys. 25, 605(1999).
53. T. Beuschel, J. G. irsch, and J. P. Draayer, Scissors modeand the pseudo-SU(3) model, Phys. Rev. C 61, 054307(2000).
54. C. E. Vargas, J. G. Hirsch, and J. P. Draayer, Micro-scopic description of the scissors mode in odd-mass heavydeformed nuclei, Phys. Lett. B 551, 98 (2003).
55. J. Dudek, W. Nazarewicz, Z. Szymanski, and G. A. Le-ander, Abundance and systematics of nuclear superde-formed states; Relation to the pseudospin and pseudo-SU(3) symmetries, Phys. Rev. Lett. 59, 1405 (1987).
56. W. Nazarewicz, P. J. Twin, P. Fallon, and J. D. Garrett,Natural-parity states in superdeformed bands and pseudoSU(3) symmetry at extreme conditions, Phys. Rev. Lett.64, 1654 (1990).
57. O. Castanos, J. G. Hirsch, O. Civitarese, and P. O. Hess,Double-beta decay in the pseudo-SU(3) scheme, Nucl.Phys. A 571, 276 (1994).
58. J. G. Hirsch, O. Castanos, P. O. Hess, and O. Civitarese,Double-beta decay of 100Mo: The deformed limit, Phys.Rev. C 51, 2252 (1995).
59. J. G. Hirsch, O. Castanos, P. O. Hess, and O. Civitarese,Double-beta decay to excited states in 150Nd, Nucl. Phys.A 589, 445 (1995).
60. J. G. Hirsch, O. Castanos, and P. O. Hess, Neutrinolessdouble beta decay in heavy deformed nuclei, Nucl. Phys.A 582, 124 (1995).
61. V. E. Ceron and J. G. Hirsch, Double electron capture in156Dy, 162Er and 168Yb, Phys. Lett. B 547, 1 (1999).
62. O. Castanos, M. Moshinsky, and C. Quesne, Transfor-mation to pseudo-SU(3) in heavy deformed nuclei, Phys.Lett. B 277, 238 (1992).
63. O. Castanos, V. Velazquez A., P. O. Hess, and J. G.Hirsch, Transformation to pseudo-spin-symmetry of adeformed Nilsson hamiltonian, Phys. Lell. B 321, 303(1994).
Powered by TCPDF (www.tcpdf.org)Powered by TCPDF (www.tcpdf.org)Powered by TCPDF (www.tcpdf.org)Powered by TCPDF (www.tcpdf.org)Powered by TCPDF (www.tcpdf.org)
user
Text Box
D. Bonatsos et al.: A symmetry for heavy nuclei: Proxy-SU(3) 49
EPJ manuscript No.
(will be inserted by the editor)
Proxy-SU(3) symmetry in heavy nuclei: Foundations
Dennis Bonatsos1, I. E. Assimakis1, N. Minkov2, Andriana Martinou1, R. B. Cakirli3, R. F. Casten4,5, and K. Blaum6
1 Institute of Nuclear and Particle Physics, National Centre for Scientific Research “Demokritos”, GR-15310 Aghia Paraskevi,Attiki, Greece
2 Institute of Nuclear Research and Nuclear Energy, Bulgarian Academy of Sciences, 72 Tzarigrad Road, 1784 Sofia, Bulgaria3 Department of Physics, University of Istanbul, Istanbul, Turkey4 Wright Laboratory, Yale University, New Haven, Connecticut 06520, USA5 Facility for Rare Isotope Beams, 640 South Shaw Lane, Michigan State University, East Lansing, MI 48824 USA6 Max-Planck-Institut fur Kernphysik, Saupfercheckweg 1, D-69117 Heidelberg, Germany
Received: date / Revised version: date
Abstract. An approximate SU(3) symmetry appears in heavy deformed even-even nuclei, by omitting theintruder Nilsson orbital of highest total angular momentum and replacing the rest of the intruder orbitalsby the orbitals which have escaped to the next lower major shell. The approximation is based on the factthat there is a one-to-one correspondence between the orbitals of the two sets, based on pairs of orbitalshaving identical quantum numbers of orbital angular momentum, spin, and total angular momentum. Theaccuracy of the approximation is tested through calculations in the framework of the Nilsson model in theasymptotic limit of large deformations, focusing attention on the changes in selection rules and in avoidedcrossings caused by the opposite parity of the proxies with respect to the substituted orbitals.
PACS. 21.60.Fw Models based on group theory – 21.60.Ev Collective models
1 Introduction
The proxy-SU(3) scheme [1,2], already described in Ref.[3], is a new approximate scheme applicable in medium-mass and heavy deformed nuclei, able to provide predic-tions for various nuclear properties, as it will be shownin Refs. [4,5]. In this contribution we are going to justifythe relevant approximations by applying the proxy-SU(3)assumptions to the Nilsson model [6,7].
2 The Nilsson model
The Nilsson Hamiltonian [6,7] contains a harmonic oscil-lator with cylindrical symmetry,
Hosc =p2
2M+
1
2M(ω2
zz2 + ω2
⊥(x2 + y2)), (1)
where M is the nuclear mass, p is the momentum, andthe rotational frequencies ωz and ω⊥ are related to thedeformation parameter ǫ by
ωz = ω0
(1−
2
3ǫ
), ω⊥ = ω0
(1 +
1
3ǫ
), (2)
leading to
ǫ =ω⊥ − ωz
ω0
, (3)
with ǫ > 0 corresponding to prolate shapes and ǫ < 0corresponding to oblate shapes. In addition it contains aspin-orbit term and an angular momentum squared term,the total Hamiltonian having the form
H = Hosc + vlshω0(l · s) + vllhω0(l2 − 〈l2〉N ), (4)
where l is the angular momentum, s is the spin,
〈l2〉N =1
2N(N + 3) (5)
is the average of the square of the angular momentum l
within the Nth oscillator shell, and vls and vll are con-stants determined from the available data on intrinsic nu-clear spectra [8], their values being given in Table 5-1 ofRef. [8]. The eigenvalues of Hosc are
Eosc = hω0
(N +
3
2−
1
3ǫ(3nz −N)
). (6)
3 Calculation of matrix elements
In order to simplify the calculation of matrix elements, onecan choose a more convenient basis. Using the creation andannihilation operators a†x, ax, a
†y, ay for the quanta of the
harmonic oscillator in the Cartesian coordinates x and y,one can define creation and annihilation operators [7,9]
R+ =1√2(a†x + ia†y), R =
1√2(ax − iay), (7)
user
Text Box
50
2 Dennis Bonatsos et al.: Proxy-SU(3) symmetry in heavy nuclei: Foundations
S+ =1√2(a†x − ia†y), S =
1√2(ax + iay). (8)
These operators satisfy the commutation relations
[R,R†] = [S, S†] = 1. (9)
In this way one goes over to a new basis, |nzrsΣ〉, wherer (s) is the number of quanta related to the harmonicoscillator formed by R† and R (S† and S). The followingrelations hold
n⊥ = r + s = N − nz, Λ = r − s, (10)
where n⊥ is the number of quanta perpendicular to thez-axis.
It is then a straightforward task, described in detail inRef. [7], to calculate the matrix elements of the l · s andl2 operators in the new basis.
The spin-orbit term, l ·s, has diagonal matrix elements
〈nzrsΣ|l · s|nzrsΣ〉 = (r − s)Σ = ΛΣ, (11)
as well as non-diagonal matrix elements
〈nz−1, r+1, s, Σ−1|l·s|nzrsΣ〉 = −1√2
√nz(r + 1), (12)
〈nz+1, r, s−1, Σ−1|l ·s|nzrsΣ〉 =1√2
√(nz + 1)s, (13)
〈nz+1, r−1, s, Σ+1|l·s|nzrsΣ〉 = −1√2
√(nz + 1)r, (14)
〈nz−1, r, s+1, Σ+1|l ·s|nzrsΣ〉 =1√2
√nz(s+ 1). (15)
The orbital angular momentum term, l2, has diagonalmatrix elements
〈nzrsΣ|l2|nzrsΣ〉 = 2nz(r+s+1)+(r+s)+(r−s)2, (16)
as well as non-diagonal matrix elements
〈nz + 2, r − 1, s− 1, Σ|l2|nzrsΣ〉 =
−2√(nz + 2)(nz + 1)rs, (17)
〈nz − 2, r + 1, s+ 1, Σ|l2|nzrsΣ〉 =
−2√(nz − 1)nz(r + 1)(s+ 1). (18)
4 Numerical results
Numerical results for the matrix elements of l · s for the126-184 and sdgi shells are given in Table I, and thosefor the matrix elements of l2 for the same shells are givenin Table II. Furthermore, numerical results for the fullHamiltonian for ǫ = 0.3 for the 126-184 and sdgi shellsare given in Table III, while Nilsson-like diagrams involv-ing either just the diagonal terms of the Hamiltonian, or
obtained through the diagonalization of the full Hamil-tonian, are plotted for the same shells in Fig. 1. Manycomments are in place.
In each of the Tables I, II, III, the upper table corre-sponds to the original Nilsson model 126-184 shell, whilethe lower table represents the proxy-SU(3) approximationto it, which is an sdgi shell. The lower table has one rowand one column less than the upper table, since the or-bital with the highest angular momentum in the 126-184shell, 15/2[707], has no counterpart in the proxy-SU(3)sdgi shell. All tables are symmetric, thus only the upperhalf is shown.
All tables are divided into four blocks. The upper leftblock involves matrix elements among the normal parityorbitals, i.e. the orbitals which belong to the sdgi shell andremain in the 126-184 shell after the defection of the 1i13/2orbital to the major shell below. Therefore the upper leftblocks of the 126-184 and sdgi tables are identical.
The lower right block involves matrix elements amongthe abnormal orbitals, members of the 1j15/2 orbital whichhas invaded the sdgi shell coming from the major shellabove. The 126-184 and sdgi results are either identical,or very similar, due to the fact that during the proxy-SU(3) approximation all angular momentum projections(orbital angular momentum, spin, total angular momen-tum) remain unchanged.
The upper right block of the 126-184 tables containsonly vanishing matrix elements, since it connencts levelsof opposite parity, namely positive parity sdgi orbitals tonegative parity 1j15/2 orbitals. In the upper right block ofthe sdgi tables, though, a few non-vanishing matrix ele-ments appear, connecting the original positive parity sdgiorbitals to the proxies of the 1j15/2 orbitals, which arepositive parity 1i13/2 orbitals. These extra non-vanishingmatrix elements represent the “damage” caused by theproxy-SU(3) approximation, i.e., by the replacement of the1j15/2 orbitals (except the 15/2[707] one) by their 1i13/2proxies.
The size of these extra non-vanishing matrix elementsis comparable to the magnitude of the diagonal matrixelements in the case of the l ·s and l
2 operators, as one cansee in Tables I and II. However, as one can see in Table III,the extra non-vanishing matrix elements are much smaller(by at least one order of magnitude) than the diagonalmatrix elements. The reason behind this difference is thesmall values of the vls and vll coefficients (−0.127 and−0.0206 respectively, as given in Table 5-1 of Ref. [8]), bywhich the matrix elements of l · s and l
2 are multipliedbefore entering Table III.
The smallness of the extra non-vanishing matrix ele-ments means that the diagonalization of the Nilsson Hamil-tonian for various values of the deformation ǫ will yieldvery similar results for the 126-184 and proxy-SU(3) sdgishells, as seen in Fig. 1, indicating that the Nilsson dia-grams are very little affected by these extra non-vanishingmatrix elements and thus proving that the proxy-SU(3)approximation is a good one.
In a similar way one can see that good results are alsoobtained for the 28-50, 50-82, and 82-126 shells in com-
user
Text Box
D. Bonatsos et al.: Proxy-SU(3) symmetry in heavy nuclei: Foundations 51
Dennis Bonatsos et al.: Proxy-SU(3) symmetry in heavy nuclei: Foundations 3
parison to their pf, sdg, and pfh proxy-SU(3) counterparts[1].
5 Conclusions
By applying the proxy-SU(3) assumptions to the Nilssonmodel, we prove that the Nilsson diagrams of the 126-184 shell and of its proxy-SU(3) sdgi counterpart are verysimilar, thus justifying the use of the proxy-SU(3) scheme,some applications of which for the calculation of nuclearproperties will be discussed in Refs. [4,5].
References
1. D. Bonatsos, I. E. Assimakis, N. Minkov, A. Martinou,R. B. Cakirli, R. F. Casten, and K. Blaum, Proxy-SU(3)symmetry in heavy deformed nuclei, Phys. Rev. C (2017)accepted, arXiv 1706.02282 [nucl-th].
2. D. Bonatsos, I. E. Assimakis, N. Minkov, A. Martinou,S. Sarantopoulou, R. B. Cakirli, R. F. Casten, and K.Blaum, Analytic predictions for nuclear shapes, prolatedominance and the prolate-oblate shape transition in theproxy-SU(3) model, Phys. Rev. C (2017) accepted, arXiv1706.02321 [nucl-th].
3. D. Bonatsos. I. E. Assimakis, N. Minkov, A. Martinou, R.B. Cakirli, R. F. Casten, and K. Blaum, A new symmetryfor heavy nuclei: Proxy-SU(3), in the Proceedings of the4th Workshop of the Hellenic Institute of Nuclear Physics(HINPw4), ed. A. Pakou, http://hinpw4.physics.uoi.gr
4. D. Bonatsos. I. E. Assimakis, N. Minkov, A. Marti-nou, S. Sarantopoulou, R. B. Cakirli, R. F. Casten, andK. Blaum, Parameter-independent predictions for shapevariables of heavy deformed nuclei in the proxy-SU(3)model, in the Proceedings of the 4th Workshop of theHellenic Institute of Nuclear Physics (HINPw4), ed. A.Pakou, http://hinpw4.physics.uoi.gr
5. D. Bonatsos. I. E. Assimakis, N. Minkov, A. Martinou,S. Sarantopoulou, R. B. Cakirli, R. F. Casten, and K.Blaum, Prolate dominance and prolate-oblate shape tran-sition in the proxy-SU(3) model, in the Proceedings of the4th Workshop of the Hellenic Institute of Nuclear Physics(HINPw4), ed. A. Pakou, http://hinpw4.physics.uoi.gr
6. S. G. Nilsson, Binding states of individual nucleons instrongly deformed nuclei, Mat. Fys. Medd. K. Dan. Vi-densk. Selsk. 29, no. 16 (1955).
7. S. G. Nilsson and I. Ragnarsson, Shapes and Shells in Nu-clear Structure (Cambridge University Press, Cambridge,1995).
8. A. Bohr and B. R. Mottelson, Nuclear Structure, Vol. II:Nuclear Deformations (Benjamin, New York, 1975).
9. B. R. Mottelson and S. G. Nilsson, The shape of the nu-clear photo-resonance in deformed nuclei, Nucl. Phys. 13,281 (1959).
user
Text Box
D. Bonatsos et al.: Proxy-SU(3) symmetry in heavy nuclei: Foundations 52

4 Dennis Bonatsos et al.: Proxy-SU(3) symmetry in heavy nuclei: Foundations
1
TABLE
I:l·smatrix
elem
ents
forNilssonorbitals
inthe126–184shell(upper
part)andin
thefullsdgishell(low
erpart).
1 2[611]
1 2[600]
3 2[602]
1 2[631]
3 2[622]
5 2[613]
1 2[620]
3 2[611]
5 2[602]
7 2[604]
1 2[651]
3 2[642]
5 2[633]
7 2[624]
9 2[615]
1 2[640]
3 2[631]
5 2[622]
7 2[613]
9 2[604]
11 2[606]
1 2[770]
3 2[761]
5 2[752]
7 2[743]
9 2[734]
11 2[725]
13 2[716]
15 2[707]
1/2[611]
−0.5
1.225
00
00−1.732
00
00
00
00
00
00
00
00
00
00
00
1/2[600]
00
00
00
00
00
00
00
00
00
00
00
00
00
00
3/2[602]
−1
00
00−1.414
00
00
00
00
00
00
00
00
00
00
0
1/2[631]
−0.5
00
1.732
00
00
00
00
−2
00
00
00
00
00
00
0
3/2[622]
−1
00
1.414
00
00
00
00−2.121
00
00
00
00
00
00
5/2[613]
−1.5
00
10
00
00
00
0−2
00
00
00
00
00
0
1/2[620]
00
00
00
00
00
00
00
00
00
00
00
0
3/2[611]
0.5
00
00
00
00
00
00
00
00
00
00
0
5/2[602]
10
00
00
00
00
00
00
00
00
00
0
7/2[604]
−2
00
00
00
00−1.581
00
00
00
00
00
1/2[651]
−0.5
00
00
1.581
00
00
00
00
00
00
0
3/2[642]
−1
00
00
1.414
00
00
00
00
00
00
5/2[633]
−1.5
00
00
1.225
00
00
00
00
00
0
7/2[624]
−2
00
00
10
00
00
00
00
0
9/2[615]
−2.5
00
00
0.707
00
00
00
00
0
1/2[640]
00
00
00
00
00
00
00
3/2[631]
0.5
00
00
00
00
00
00
5/2[622]
10
00
00
00
00
00
7/2[613]
1.5
00
00
00
00
00
9/2[604]
20
00
00
00
00
11/2[606]
−3
00
00
00
00
1/2[770]
00
00
00
00
3/2[761]
0.5
00
00
00
5/2[752]
10
00
00
7/2[743]
1.5
00
00
9/2[734]
20
00
11/2[725]
2.5
00
13/2[716]
30
15/2[707]
3.5
1 2[611]
1 2[600]
3 2[602]
1 2[631]
3 2[622]
5 2[613]
1 2[620]
3 2[611]
5 2[602]
7 2[604]
1 2[651]
3 2[642]
5 2[633]
7 2[624]
9 2[615]
1 2[640]
3 2[631]
5 2[622]
7 2[613]
9 2[604]
11 2[606]
1 2[660]
3 2[651]
5 2[642]
7 2[633]
9 2[624]
11 2[615]
13 2[606]
1/2[611]
−0.5
1.225
00
00−1.732
00
00
00
00
00
00
00
00
00
00
0
1/2[600]
00
00
00
00
00
00
00
00
00
00
00
00
00
0
3/2[602]
−1
00
00−1.414
00
00
00
00
00
00
00
00
00
00
1/2[631]
−0.5
00
1.732
00
00
00
00
−2
00
00
00
00
00
00
3/2[622]
−1
00
1.414
00
00
00
00−2.121
00
00
00
00
00
0
5/2[613]
−1.5
00
10
00
00
00
0−2
00
00
00
00
00
1/2[620]
00
00
00
00
00
00
00
00
00
00
00
3/2[611]
0.5
00
00
00
00
00
00
00
00
00
00
5/2[602]
10
00
00
00
00
00
00
00
00
00
7/2[604]
−2
00
00
00
00−1.581
00
00
00
00
0
1/2[651]
−0.5
00
00
1.581
00
00
0−
1.732
00
00
00
3/2[642]
−1
00
00
1.414
00
00
0−2.236
00
00
0
5/2[633]
−1.5
00
00
1.225
00
00
0−2.450
00
00
7/2[624]
−2
00
00
10
00
00−2.450
00
0
9/2[615]
−2.5
00
00
0.707
00
00
0−2.236
00
1/2[640]
00
00
00
00
00
00
0
3/2[631]
0.5
00
00
00
00
00
0
5/2[622]
10
00
00
00
00
0
7/2[613]
1.5
00
00
00
00
0
9/2[604]
20
00
00
00
0
11/2[606]
−3
00
00
0−1.732
0
1/2[660]
00
00
00
0
3/2[651]
0.5
00
00
0
5/2[642]
10
00
0
7/2[633]
1.5
00
0
9/2[624]
20
0
11/2[615]
2.5
0
13/2[606]
3
user
Text Box
D. Bonatsos et al.: Proxy-SU(3) symmetry in heavy nuclei: Foundations 53

Dennis Bonatsos et al.: Proxy-SU(3) symmetry in heavy nuclei: Foundations 5
1
TABLE
II:l2
matrix
elem
ents
forNilssonorbitals
inthe126–184shell(upper
part)andin
thefullsdgishell(low
erpart).
1 2[611]
1 2[600]
3 2[602]
1 2[631]
3 2[622]
5 2[613]
1 2[620]
3 2[611]
5 2[602]
7 2[604]
1 2[651]
3 2[642]
5 2[633]
7 2[624]
9 2[615]
1 2[640]
3 2[631]
5 2[622]
7 2[613]
9 2[604]
11 2[606]
1 2[770]
3 2[761]
5 2[752]
7 2[743]
9 2[734]
11 2[725]
13 2[716]
15 2[707]
1/2[611]
18
00
−12
00
00
00
00
00
00
00
00
00
00
00
00
0
1/2[600]
60
00
0−8.485
00
00
00
00
00
00
00
00
00
00
00
3/2[602]
10
00
00
00
00
00
00
00
00
00
00
00
00
00
1/2[631]
28
00
00
00−12.649
00
00
00
00
00
00
00
00
00
3/2[622]
28
00
00
00
00
00
00
00
00
00
00
00
00
5/2[613]
26
00
00
00−9.798
00
00
00
00
00
00
00
00
1/2[620]
24
00
00
00
00−13.856
00
00
00
00
00
00
0
3/2[611]
18
00
00
00
00
−12
00
00
00
00
00
00
5/2[602]
10
00
00
00
00
−8
00
00
00
00
00
0
7/2[604]
22
00
0−6.325
00
00
00
00
00
00
00
0
1/2[651]
22
00
00
00
00
00
00
00
00
00
3/2[642]
30
00
00
00
00
00
00
00
00
0
5/2[633]
36
00
00
00
00
00
00
00
00
7/2[624]
40
00
00
10
00
00
00
00
0
9/2[615]
42
00
00
00
00
00
00
00
1/2[640]
26
00
00
00
00
00
00
0
3/2[631]
28
00
00
00
00
00
00
5/2[622]
28
00
00
00
00
00
0
7/2[613]
26
00
00
00
00
00
9/2[604]
22
00
00
00
00
0
11/2[606]
42
00
00
00
00
1/2[770]
14
00
00
00
0
3/2[761]
26
00
00
00
5/2[752]
36
00
00
0
7/2[743]
44
00
00
9/2[734]
50
00
0
11/2[725]
54
00
13/2[716]
56
0
15/2[707]
56
1 2[611]
1 2[600]
3 2[602]
1 2[631]
3 2[622]
5 2[613]
1 2[620]
3 2[611]
5 2[602]
7 2[604]
1 2[651]
3 2[642]
5 2[633]
7 2[624]
9 2[615]
1 2[640]
3 2[631]
5 2[622]
7 2[613]
9 2[604]
11 2[606]
1 2[660]
3 2[651]
5 2[642]
7 2[633]
9 2[624]
11 2[615]
13 2[606]
1/2[611]
18
00
−12
00
00
00
00
00
00
00
00
00
00
00
00
1/2[600]
60
00
0−8.485
00
00
00
00
00
00
00
00
00
00
0
3/2[602]
10
00
00
00
00
00
00
00
00
00
00
00
00
0
1/2[631]
28
00
00
00−12.649
00
00
00
00
00
00
00
00
0
3/2[622]
28
00
00
00
00
00
00
00
00
00
00
00
0
5/2[613]
26
00
00
00−9.798
00
00
00
00
00
00
00
0
1/2[620]
24
00
00
00
00−13.856
00
00
00
00
00
00
3/2[611]
18
00
00
00
00
−12
00
00
00
00
00
0
5/2[602]
10
00
00
00
00
−8
00
00
00
00
00
7/2[604]
22
00
0−6.325
00
00
00
00
00
00
00
1/2[651]
22
00
00
00
00
00
00
00
00
0
3/2[642]
30
00
00
00
00
00
00
00
00
5/2[633]
36
00
00
00
00
00
00
00
0
7/2[624]
40
00
00
10
00
00
00
00
9/2[615]
42
00
00
00
00
00
00
0
1/2[640]
26
00
00
0−
10.955
00
00
00
3/2[631]
28
00
00
0−12.649
00
00
0
5/2[622]
28
00
00
0−12
00
00
7/2[613]
26
00
00
0−9.798
00
0
9/2[604]
22
00
00
0−6.324
00
11/2[606]
42
00
00
00
0
1/2[660]
12
00
00
00
3/2[651]
22
00
00
0
5/2[642]
30
00
00
7/2[633]
36
00
0
9/2[624]
40
00
11/2[615]
42
0
13/2[606]
42
user
Text Box
D. Bonatsos et al.: Proxy-SU(3) symmetry in heavy nuclei: Foundations 54

6 Dennis Bonatsos et al.: Proxy-SU(3) symmetry in heavy nuclei: Foundations
1
TABLE
III:H
matrix
elem
ents
forǫ=
0.3
forNilssonorbitals
inthe126–184shell(upper
part)andin
thefullsdgishell(low
erpart).
1 2[611]
1 2[600]
3 2[602]
1 2[631]
3 2[622]
5 2[613]
1 2[620]
3 2[611]
5 2[602]
7 2[604]
1 2[651]
3 2[642]
5 2[633]
7 2[624]
9 2[615]
1 2[640]
3 2[631]
5 2[622]
7 2[613]
9 2[604]
11 2[606]
1 2[770]
3 2[761]
5 2[752]
7 2[743]
9 2[734]
11 2[725]
13 2[716]
15 2[707]
1/2[611]
8.05
−0.16
00.25
00
0.22
00
00
00
00
00
00
00
00
00
00
00
1/2[600]
8.53
00
00
0.17
00
00
00
00
00
00
00
00
00
00
00
3/2[602]
8.58
00
00
0.18
00
00
00
00
00
00
00
00
00
00
0
1/2[631]
7.24
00
−0.22
00
00.26
00
00
0.25
00
00
00
00
00
00
0
3/2[622]
7.61
00
−0.18
00
00
00
00
0.27
00
00
00
00
00
00
5/2[613]
8.01
00
−0.13
00
00.20
00
00
0.25
00
00
00
00
00
0
1/2[620]
7.56
00
00
00
00
0.29
00
00
00
00
00
00
0
3/2[611]
7.92
00
00
00
00
0.25
00
00
00
00
00
00
5/2[602]
8.32
00
00
00
00
0.16
00
00
00
00
00
0
7/2[604]
8.46
00
00.13
00
00
0.20
00
00
00
00
00
1/2[651]
6.77
00
00
−0.20
00
00
00
00
00
00
0
3/2[642]
6.97
00
00
−0.18
00
00
00
00
00
00
5/2[633]
7.21
00
00
−0.16
00
00
00
00
00
0
7/2[624]
7.49
00
00
−0.13
00
00
00
00
00
9/2[615]
7.81
00
00
−0.09
00
00
00
00
0
1/2[640]
6.92
00
00
00
00
00
00
0
3/2[631]
7.12
00
00
00
00
00
00
5/2[622]
7.35
00
00
00
00
00
0
7/2[613]
7.63
00
00
00
00
00
9/2[604]
7.95
00
00
00
00
0
11/2[606]
8.17
00
00
00
00
1/2[770]
7.53
00
00
00
0
3/2[761]
7.52
00
00
00
5/2[752]
7.55
00
00
0
7/2[743]
7.62
00
00
9/2[734]
7.74
00
0
11/2[725]
7.89
00
13/2[716]
8.089
0
15/2[707]
8.32
1 2[611]
1 2[600]
3 2[602]
1 2[631]
3 2[622]
5 2[613]
1 2[620]
3 2[611]
5 2[602]
7 2[604]
1 2[651]
3 2[642]
5 2[633]
7 2[624]
9 2[615]
1 2[640]
3 2[631]
5 2[622]
7 2[613]
9 2[604]
11 2[606]
1 2[660]
3 2[651]
5 2[642]
7 2[633]
9 2[624]
11 2[615]
13 2[606]
1/2[611]
8.05
−0.16
00.25
00
0.22
00
00
00
00
00
00
00
00
00
00
0
1/2[600]
8.53
00
00
0.17
00
00
00
00
00
00
00
00
00
00
0
3/2[602]
8.58
00
00
0.18
00
00
00
00
00
00
00
00
00
00
1/2[631]
7.24
00
−0.22
00
00.26
00
00
0.25
00
00
00
00
00
00
3/2[622]
7.61
00
−0.18
00
00
00
00
0.27
00
00
00
00
00
0
5/2[613]
8.01
00
−0.13
00
00.20
00
00
0.25
00
00
00
00
00
1/2[620]
7.56
00
00
00
00
0.29
00
00
00
00
00
00
3/2[611]
7.92
00
00
00
00
0.25
00
00
00
00
00
0
5/2[602]
8.32
00
00
00
00
0.16
00
00
00
00
00
7/2[604]
8.46
00
00.13
00
00
0.20
00
00
00
00
0
1/2[651]
6.77
00
00
−0.20
00
00
00.22
00
00
00
3/2[642]
6.97
00
00
−0.18
00
00
00.28
00
00
0
5/2[633]
7.21
00
00
−0.16
00
00
00.31
00
00
7/2[624]
7.49
00
00
−0.13
00
00
00.31
00
0
9/2[615]
7.81
00
00
−0.09
00
00
00.28
00
1/2[640]
6.92
00
00
00.23
00
00
00
3/2[631]
7.12
00
00
00.26
00
00
0
5/2[622]
7.35
00
00
00.25
00
00
7/2[613]
7.63
00
00
00.20
00
0
9/2[604]
7.95
00
00
00.13
00
11/2[606]
8.17
00
00
00.22
0
1/2[660]
7.40
00
00
00
3/2[651]
7.44
00
00
0
5/2[642]
7.51
00
00
7/2[633]
7.62
00
0
9/2[624]
7.78
00
11/2[615]
7.97
0
13/2[606]
8.21
user
Text Box
D. Bonatsos et al.: Proxy-SU(3) symmetry in heavy nuclei: Foundations 55

Dennis Bonatsos et al.: Proxy-SU(3) symmetry in heavy nuclei: Foundations 7
0.2 0.3 0.4 0.5 0.6
5.5
6.0
6.5
7.0
7.5
8.0
8.5
9.0
E
3/2[602]
1/2[600]
7/2[604]
5/2[602]
11/2[606]
13/2[606]
9/2[604]
1/2[611]
5/2[613]
3/2[611]
9/2[615]
11/2[615]
7/2[613]
3/2[622]
7/2[624]
1/2[620]
9/2[624]
5/2[622]
5/2[633]
1/2[631]
7/2[633]
3/2[631]
3/2[642]
5/2[642]
1/2[640]
1/2[660]
3/2[651]
1/2[651]
ε
(d)
sdgi neutron shell (proxy for the 126-184 shell)
full Nilsson Hamiltonian
0.2 0.3 0.4 0.5 0.6
5.5
6.0
6.5
7.0
7.5
8.0
8.5
9.0 3/2[602]
1/2[600]
7/2[604]
15/2[707] 5/2[602]
11/2[606]
9/2[604]
13/2[716]
1/2[611]
5/2[613]
3/2[611]
9/2[615]
11/2[725]
7/2[613]
3/2[622]
1/2[620]
9/2[734]
7/2[624]
5/2[622]
7/2[743]
1/2[631]
5/2[633]
5/2[752]
3/2[631]
3/2[761]
1/2[640]
3/2[642]
1/2[770]
1/2[651]
E
ε
(b)
normal 126-184 neutron shell
full Nilsson Hamiltonian
0.2 0.3 0.4 0.5 0.6
5.5
6.0
6.5
7.0
7.5
8.0
8.5
9.0 3/2[602]
1/2[600]
7/2[604]
5/2[602]
11/2[606]
13/2[606]
9/2[604]
1/2[611]
5/2[613]
3/2[611]
9/2[615]
11/2[615]
7/2[613]
3/2[622]
9/2[624]
1/2[620]
7/2[624]
5/2[622]
7/2[633]
1/2[631]
5/2[633]
3/2[631]
5/2[642]
3/2[642]
3/2[651]
1/2[640]
1/2[660]
1/2[651]
E
ε
(c)
sdgi neutron shell (proxy for the 126-184 shell)
diagonal matrix elements
0.2 0.3 0.4 0.5 0.6
5.5
6.0
6.5
7.0
7.5
8.0
8.5
9.0
E
ε
(a)
normal 126-184 neutron shell
diagonal matrix elements
3/2[602]
1/2[600]
7/2[604]
15/2[707] 5/2[602]
11/2[606]
9/2[604]
13/2[716]
1/2[611]
5/2[613]
3/2[611]
9/2[615]
11/2[725]
7/2[613]
3/2[622]
1/2[620]
9/2[734]
7/2[624]
5/2[622]
7/2[743]
1/2[631]
5/2[633]
3/2[631]
5/2[752]
3/2[761]
3/2[642]
1/2[640]
1/2[770]
1/2[651]
Fig. 1. Diagonal matrix elements (in units of hω0) of the Nilsson Hamiltonian for the 126-184 (a) and sdgi (c) neutron shellscompared to the results of the full diagonalization for the 126-184 (b) and sdgi (d) neutron shells, as functions of the deformationparameter ǫ. The Nilsson parameters are taken from Table 5-1 of Ref. [8]. The 1j15/2 orbitals in (a) and (b), as well as the1i13/2 orbitals in (c), are indicated by dashed lines. The 1j15/2 orbital labels in (a) and (b), as well as the 1i13/2 orbital labelsin (c) and (d), appear in boldface. Orbitals are grouped in color only to facilitate visualizing the patterns of orbital evolution.Note that the Nilsson labels at the right are always in the same order as the energies of the orbitals as they appear at the rightas well (largest deformation shown). Therefore, in some cases the order of the Nilsson orbitals changes slightly from panel topanel.
Powered by TCPDF (www.tcpdf.org)Powered by TCPDF (www.tcpdf.org)Powered by TCPDF (www.tcpdf.org)Powered by TCPDF (www.tcpdf.org)Powered by TCPDF (www.tcpdf.org)Powered by TCPDF (www.tcpdf.org)Powered by TCPDF (www.tcpdf.org)
user
Text Box
D. Bonatsos et al.: Proxy-SU(3) symmetry in heavy nuclei: Foundations 56
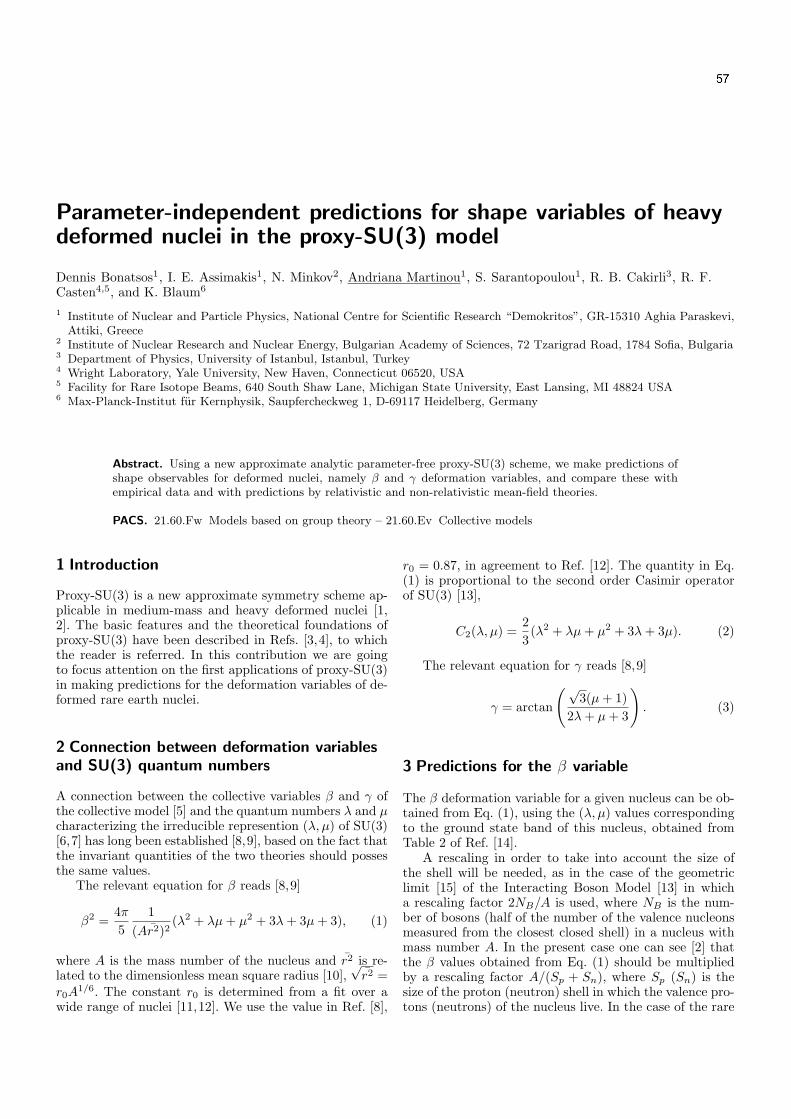
EPJ manuscript No.
(will be inserted by the editor)
Parameter-independent predictions for shape variables of heavydeformed nuclei in the proxy-SU(3) model
Dennis Bonatsos1, I. E. Assimakis1, N. Minkov2, Andriana Martinou1, S. Sarantopoulou1, R. B. Cakirli3, R. F.Casten4,5, and K. Blaum6
1 Institute of Nuclear and Particle Physics, National Centre for Scientific Research “Demokritos”, GR-15310 Aghia Paraskevi,Attiki, Greece
2 Institute of Nuclear Research and Nuclear Energy, Bulgarian Academy of Sciences, 72 Tzarigrad Road, 1784 Sofia, Bulgaria3 Department of Physics, University of Istanbul, Istanbul, Turkey4 Wright Laboratory, Yale University, New Haven, Connecticut 06520, USA5 Facility for Rare Isotope Beams, 640 South Shaw Lane, Michigan State University, East Lansing, MI 48824 USA6 Max-Planck-Institut fur Kernphysik, Saupfercheckweg 1, D-69117 Heidelberg, Germany
Received: date / Revised version: date
Abstract. Using a new approximate analytic parameter-free proxy-SU(3) scheme, we make predictions ofshape observables for deformed nuclei, namely β and γ deformation variables, and compare these withempirical data and with predictions by relativistic and non-relativistic mean-field theories.
PACS. 21.60.Fw Models based on group theory – 21.60.Ev Collective models
1 Introduction
Proxy-SU(3) is a new approximate symmetry scheme ap-plicable in medium-mass and heavy deformed nuclei [1,2]. The basic features and the theoretical foundations ofproxy-SU(3) have been described in Refs. [3,4], to whichthe reader is referred. In this contribution we are goingto focus attention on the first applications of proxy-SU(3)in making predictions for the deformation variables of de-formed rare earth nuclei.
2 Connection between deformation variables
and SU(3) quantum numbers
A connection between the collective variables β and γ ofthe collective model [5] and the quantum numbers λ and µcharacterizing the irreducible represention (λ, µ) of SU(3)[6,7] has long been established [8,9], based on the fact thatthe invariant quantities of the two theories should possesthe same values.
The relevant equation for β reads [8,9]
β2 =4π
5
1
(Ar2)2(λ2 + λµ+ µ2 + 3λ+ 3µ+ 3), (1)
where A is the mass number of the nucleus and r2 is re-lated to the dimensionless mean square radius [10],
√r2 =
r0A1/6. The constant r0 is determined from a fit over a
wide range of nuclei [11,12]. We use the value in Ref. [8],
r0 = 0.87, in agreement to Ref. [12]. The quantity in Eq.(1) is proportional to the second order Casimir operatorof SU(3) [13],
C2(λ, µ) =2
3(λ2 + λµ+ µ2 + 3λ+ 3µ). (2)
The relevant equation for γ reads [8,9]
γ = arctan
(√3(µ+ 1)
2λ+ µ+ 3
). (3)
3 Predictions for the β variable
The β deformation variable for a given nucleus can be ob-tained from Eq. (1), using the (λ, µ) values correspondingto the ground state band of this nucleus, obtained fromTable 2 of Ref. [14].
A rescaling in order to take into account the size ofthe shell will be needed, as in the case of the geometriclimit [15] of the Interacting Boson Model [13] in whicha rescaling factor 2NB/A is used, where NB is the num-ber of bosons (half of the number of the valence nucleonsmeasured from the closest closed shell) in a nucleus withmass number A. In the present case one can see [2] thatthe β values obtained from Eq. (1) should be multipliedby a rescaling factor A/(Sp + Sn), where Sp (Sn) is thesize of the proton (neutron) shell in which the valence pro-tons (neutrons) of the nucleus live. In the case of the rare
user
Text Box
57
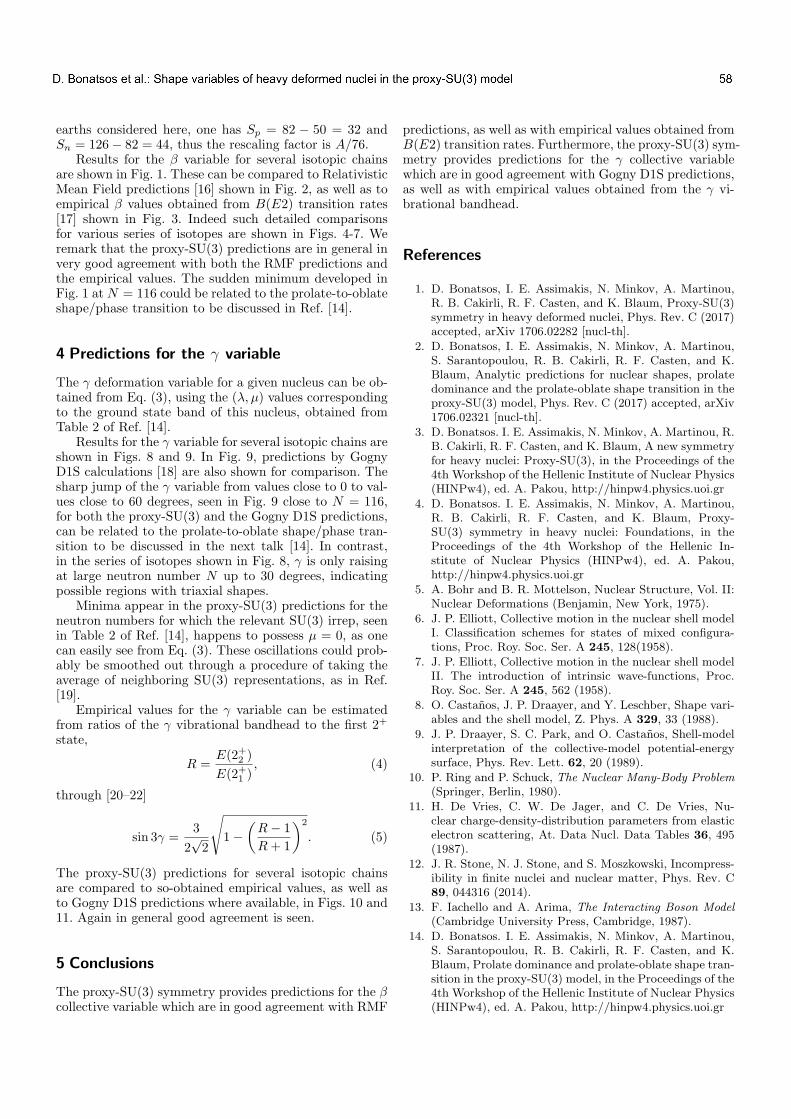
2 Dennis Bonatsos et al.: Shape variables in the proxy-SU(3) model
earths considered here, one has Sp = 82 − 50 = 32 andSn = 126− 82 = 44, thus the rescaling factor is A/76.
Results for the β variable for several isotopic chainsare shown in Fig. 1. These can be compared to RelativisticMean Field predictions [16] shown in Fig. 2, as well as toempirical β values obtained from B(E2) transition rates[17] shown in Fig. 3. Indeed such detailed comparisonsfor various series of isotopes are shown in Figs. 4-7. Weremark that the proxy-SU(3) predictions are in general invery good agreement with both the RMF predictions andthe empirical values. The sudden minimum developed inFig. 1 at N = 116 could be related to the prolate-to-oblateshape/phase transition to be discussed in Ref. [14].
4 Predictions for the γ variable
The γ deformation variable for a given nucleus can be ob-tained from Eq. (3), using the (λ, µ) values correspondingto the ground state band of this nucleus, obtained fromTable 2 of Ref. [14].
Results for the γ variable for several isotopic chains areshown in Figs. 8 and 9. In Fig. 9, predictions by GognyD1S calculations [18] are also shown for comparison. Thesharp jump of the γ variable from values close to 0 to val-ues close to 60 degrees, seen in Fig. 9 close to N = 116,for both the proxy-SU(3) and the Gogny D1S predictions,can be related to the prolate-to-oblate shape/phase tran-sition to be discussed in the next talk [14]. In contrast,in the series of isotopes shown in Fig. 8, γ is only raisingat large neutron number N up to 30 degrees, indicatingpossible regions with triaxial shapes.
Minima appear in the proxy-SU(3) predictions for theneutron numbers for which the relevant SU(3) irrep, seenin Table 2 of Ref. [14], happens to possess µ = 0, as onecan easily see from Eq. (3). These oscillations could prob-ably be smoothed out through a procedure of taking theaverage of neighboring SU(3) representations, as in Ref.[19].
Empirical values for the γ variable can be estimatedfrom ratios of the γ vibrational bandhead to the first 2+
state,
R =E(2+
2)
E(2+1), (4)
through [20–22]
sin 3γ =3
2√2
√
1−
(R− 1
R+ 1
)2
. (5)
The proxy-SU(3) predictions for several isotopic chainsare compared to so-obtained empirical values, as well asto Gogny D1S predictions where available, in Figs. 10 and11. Again in general good agreement is seen.
5 Conclusions
The proxy-SU(3) symmetry provides predictions for the βcollective variable which are in good agreement with RMF
predictions, as well as with empirical values obtained fromB(E2) transition rates. Furthermore, the proxy-SU(3) sym-metry provides predictions for the γ collective variablewhich are in good agreement with Gogny D1S predictions,as well as with empirical values obtained from the γ vi-brational bandhead.
References
1. D. Bonatsos, I. E. Assimakis, N. Minkov, A. Martinou,R. B. Cakirli, R. F. Casten, and K. Blaum, Proxy-SU(3)symmetry in heavy deformed nuclei, Phys. Rev. C (2017)accepted, arXiv 1706.02282 [nucl-th].
2. D. Bonatsos, I. E. Assimakis, N. Minkov, A. Martinou,S. Sarantopoulou, R. B. Cakirli, R. F. Casten, and K.Blaum, Analytic predictions for nuclear shapes, prolatedominance and the prolate-oblate shape transition in theproxy-SU(3) model, Phys. Rev. C (2017) accepted, arXiv1706.02321 [nucl-th].
3. D. Bonatsos. I. E. Assimakis, N. Minkov, A. Martinou, R.B. Cakirli, R. F. Casten, and K. Blaum, A new symmetryfor heavy nuclei: Proxy-SU(3), in the Proceedings of the4th Workshop of the Hellenic Institute of Nuclear Physics(HINPw4), ed. A. Pakou, http://hinpw4.physics.uoi.gr
4. D. Bonatsos. I. E. Assimakis, N. Minkov, A. Martinou,R. B. Cakirli, R. F. Casten, and K. Blaum, Proxy-SU(3) symmetry in heavy nuclei: Foundations, in theProceedings of the 4th Workshop of the Hellenic In-stitute of Nuclear Physics (HINPw4), ed. A. Pakou,http://hinpw4.physics.uoi.gr
5. A. Bohr and B. R. Mottelson, Nuclear Structure, Vol. II:Nuclear Deformations (Benjamin, New York, 1975).
6. J. P. Elliott, Collective motion in the nuclear shell modelI. Classification schemes for states of mixed configura-tions, Proc. Roy. Soc. Ser. A 245, 128(1958).
7. J. P. Elliott, Collective motion in the nuclear shell modelII. The introduction of intrinsic wave-functions, Proc.Roy. Soc. Ser. A 245, 562 (1958).
8. O. Castanos, J. P. Draayer, and Y. Leschber, Shape vari-ables and the shell model, Z. Phys. A 329, 33 (1988).
9. J. P. Draayer, S. C. Park, and O. Castanos, Shell-modelinterpretation of the collective-model potential-energysurface, Phys. Rev. Lett. 62, 20 (1989).
10. P. Ring and P. Schuck, The Nuclear Many-Body Problem
(Springer, Berlin, 1980).11. H. De Vries, C. W. De Jager, and C. De Vries, Nu-
clear charge-density-distribution parameters from elasticelectron scattering, At. Data Nucl. Data Tables 36, 495(1987).
12. J. R. Stone, N. J. Stone, and S. Moszkowski, Incompress-ibility in finite nuclei and nuclear matter, Phys. Rev. C89, 044316 (2014).
13. F. Iachello and A. Arima, The Interacting Boson Model
(Cambridge University Press, Cambridge, 1987).14. D. Bonatsos. I. E. Assimakis, N. Minkov, A. Martinou,
S. Sarantopoulou, R. B. Cakirli, R. F. Casten, and K.Blaum, Prolate dominance and prolate-oblate shape tran-sition in the proxy-SU(3) model, in the Proceedings of the4th Workshop of the Hellenic Institute of Nuclear Physics(HINPw4), ed. A. Pakou, http://hinpw4.physics.uoi.gr
user
Text Box
D. Bonatsos et al.: Shape variables of heavy deformed nuclei in the proxy-SU(3) model 58

Dennis Bonatsos et al.: Shape variables in the proxy-SU(3) model 3
80 90 100 110 120
0.1
0.2
0.3
proxy-SU(3)
β
N
Xe
Ba
Ce
Nd
Sm
80 90 100 110 120
0.1
0.2
0.3
β
N
Gd
Dy
Er
Yb
Hf
W
Os
Pt
proxy-SU(3)
Fig. 1. Proxy-SU(3) predictions for β, obtained from Eq. (1).
80 90 100 110 120
0.0
0.1
0.2
0.3
β
N
Xe
Ba
Ce
Nd
Sm
RMF
80 90 100 110 120
0.0
0.1
0.2
0.3
RMF
β
N
Gd
Dy
Er
Yb
Hf
W
Os
Pt
Fig. 2. RMF predictions for β, obtained from Ref. [16].
15. J. N. Ginocchio and M. W. Kirson, An intrinsic state forthe Interacting Boson Model and its relationship to theBohr–Mottelson model, Nucl. Phys. A 350, 31 (1980).
16. G. A. Lalazissis, S. Raman, and P. Ring, Ground-stateproperties of even-even nuclei in the relativistic mean-field theory, At. Data Nucl. Data Tables 71, 1 (1999).
17. S. Raman, C. W. Nestor, Jr., and P. Tikkanen, Transitionprobability from the ground to the first-excited 2+ stateof even-even nuclides, At. Data Nucl. Data Tables 78, 1(2001).
18. L. M. Robledo, R. Rodrıguez-Guzman, and P. Sarriguren,Role of triaxiality in the ground state shape of neutronrich Yb, Hf, W, Os and Pt isotopes, J. Phys. G: Nucl.Part. Phys. 36, 115104 (2009).
19. K. H. Bhatt, S. Kahane, and S. Raman, Collective prop-erties of nucleons in abnormal-parity states, Phys. Rev.C 61, 034317 (2000).
20. A. S. Davydov and G. F. Filippov, Rotational states ineven atomic nuclei, Nucl. Phys. 8, 237 (1958).
21. R. F. Casten, Nuclear Structure from a Simple Perspec-
tive (Oxford University Press, Oxford, 2000).
22. L. Esser, U. Neuneyer, R. F. Casten, and P. von Brentano,Correlations of the deformation variables β and γ in even-even Hf, W, Os, Pt, and Hg nuclei, Phys. Rev. C 55, 206(1997).
user
Text Box
D. Bonatsos et al.: Shape variables of heavy deformed nuclei in the proxy-SU(3) model 59

4 Dennis Bonatsos et al.: Shape variables in the proxy-SU(3) model
80 90 100 110 120
0.1
0.2
0.3 Xe
Ba
Ce
Nd
Sm
β
N
emp.
80 90 100 110 120
0.1
0.2
0.3
β
N
Gd
Dy
Er
Yb
Hf
W
Os
Pt
emp.
Fig. 3. Empirical predictions for β, obtained from Ref. [17].
80 90 100 110 120
0.0
0.1
0.2
0.3
β
N
proxy-SU(3)
RMF
exp.
Ba
80 90 100 110 120
0.0
0.1
0.2
0.3
β
N
proxy-SU(3)
RMF
exp.
Ce
Fig. 4. Proxy-SU(3) predictions for β, obtained from Eq. (1), compared with tabulated β values [17] and also with predictionsfrom relativistic mean field theory [16].
80 90 100 110 120
0.0
0.1
0.2
0.3
β
N
proxy-SU(3)
RMF
exp.
Nd
80 90 100 110 120
0.0
0.1
0.2
0.3
β
N
proxy-SU(3)
RMF
exp.
Sm
Fig. 5. Proxy-SU(3) predictions for β, obtained from Eq. (1), compared with tabulated β values [17] and also with predictionsfrom relativistic mean field theory [16].
user
Text Box
D. Bonatsos et al.: Shape variables of heavy deformed nuclei in the proxy-SU(3) model 60

Dennis Bonatsos et al.: Shape variables in the proxy-SU(3) model 5
80 90 100 110 120
0.1
0.2
0.3
β
N
proxy-SU(3)
RMF
exp.
Gd
80 90 100 110 120
0.1
0.2
0.3
β
N
proxy-SU(3)
RMF
exp.
Er
Fig. 6. Proxy-SU(3) predictions for β, obtained from Eq. (1), compared with tabulated β values [17] and also with predictionsfrom relativistic mean field theory [16].
80 90 100 110 120
0.10
0.15
0.20
0.25
0.30 proxy-SU(3)
RMF
exp.
β
N
Hf
80 90 100 110 120
0.05
0.10
0.15
0.20
0.25
0.30
W proxy-SU(3)
RMF
exp.
β
N
Fig. 7. Proxy-SU(3) predictions for β, obtained from Eq. (1), compared with tabulated β values [17] and also with predictionsfrom relativistic mean field theory [16].
80 90 100 110 120
0
15
30
45
60
Xe
Ba
Ce
Nd
γ (d
egre
es)
N
proxy-SU(3)
80 90 100 110 120
0
15
30
45
60
Sm
Gd
Dy
Er
γ (d
egre
es)
N
proxy-SU(3)
Fig. 8. Proxy-SU(3) predictions for γ, obtained from Eq. (3).
user
Text Box
D. Bonatsos et al.: Shape variables of heavy deformed nuclei in the proxy-SU(3) model 61
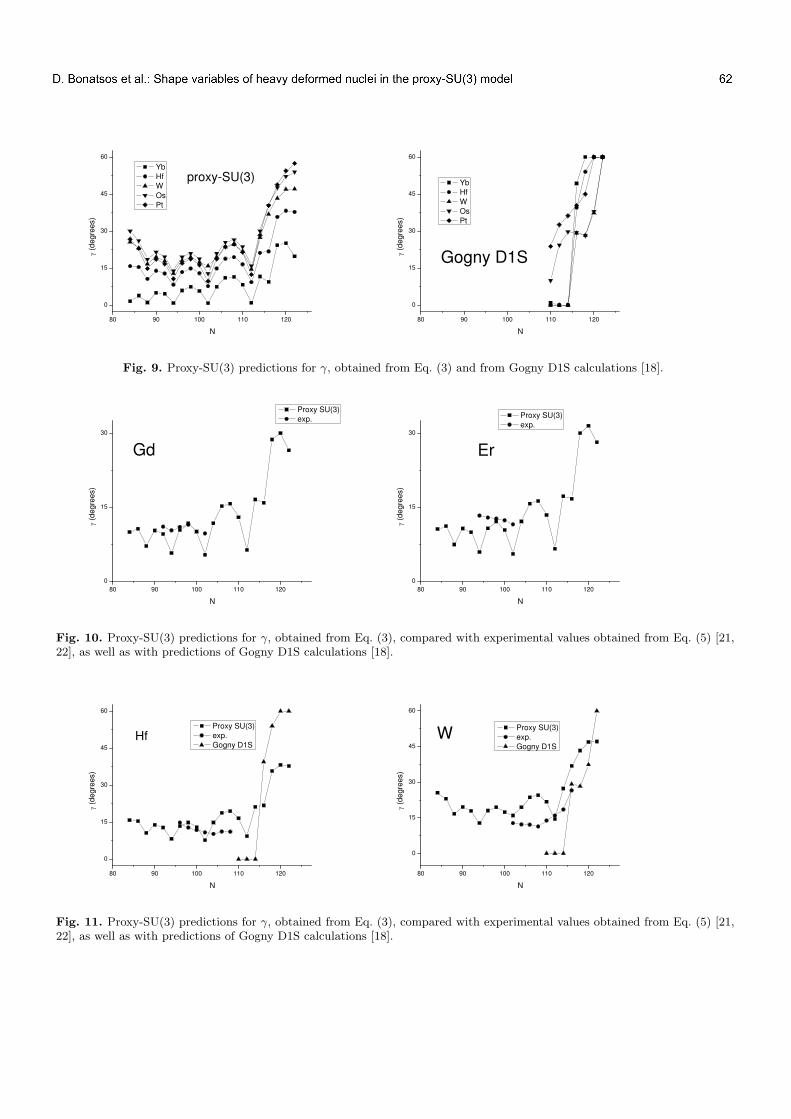
6 Dennis Bonatsos et al.: Shape variables in the proxy-SU(3) model
80 90 100 110 120
0
15
30
45
60
Yb
Hf
W
Os
Pt
γ (d
egre
es)
N
proxy-SU(3)
80 90 100 110 120
0
15
30
45
60
Yb
Hf
W
Os
Pt
Gogny D1Sγ (d
egre
es)
N
Fig. 9. Proxy-SU(3) predictions for γ, obtained from Eq. (3) and from Gogny D1S calculations [18].
80 90 100 110 120
0
15
30
γ (d
egre
es)
N
Proxy SU(3)
exp.
Gd
80 90 100 110 120
0
15
30
γ (d
egre
es)
N
Proxy SU(3)
exp.
Er
Fig. 10. Proxy-SU(3) predictions for γ, obtained from Eq. (3), compared with experimental values obtained from Eq. (5) [21,22], as well as with predictions of Gogny D1S calculations [18].
80 90 100 110 120
0
15
30
45
60
Proxy SU(3)
exp.
Gogny D1S
γ (d
egre
es)
N
Hf
80 90 100 110 120
0
15
30
45
60
Proxy SU(3)
exp.
Gogny D1S
γ (d
egre
es)
N
W
Fig. 11. Proxy-SU(3) predictions for γ, obtained from Eq. (3), compared with experimental values obtained from Eq. (5) [21,22], as well as with predictions of Gogny D1S calculations [18].
Powered by TCPDF (www.tcpdf.org)Powered by TCPDF (www.tcpdf.org)Powered by TCPDF (www.tcpdf.org)Powered by TCPDF (www.tcpdf.org)Powered by TCPDF (www.tcpdf.org)Powered by TCPDF (www.tcpdf.org)
user
Text Box
D. Bonatsos et al.: Shape variables of heavy deformed nuclei in the proxy-SU(3) model 62

EPJ manuscript No.
(will be inserted by the editor)
Prolate dominance and prolate-oblate shape transition in theproxy-SU(3) model
Dennis Bonatsos1, I. E. Assimakis1, N. Minkov2, Andriana Martinou1, S. Sarantopoulou1, R. B. Cakirli3, R. F.
Casten4,5, and K. Blaum6
1 Institute of Nuclear and Particle Physics, National Centre for Scientific Research “Demokritos”, GR-15310 Aghia Paraskevi,Attiki, Greece
2 Institute of Nuclear Research and Nuclear Energy, Bulgarian Academy of Sciences, 72 Tzarigrad Road, 1784 Sofia, Bulgaria3 Department of Physics, University of Istanbul, Istanbul, Turkey4 Wright Laboratory, Yale University, New Haven, Connecticut 06520, USA5 Facility for Rare Isotope Beams, 640 South Shaw Lane, Michigan State University, East Lansing, MI 48824 USA6 Max-Planck-Institut fur Kernphysik, Saupfercheckweg 1, D-69117 Heidelberg, Germany
Received: date / Revised version: date
Abstract. Using a new approximate analytic parameter-free proxy-SU(3) scheme, we make simple predic-tions for the global feature of prolate dominance in deformed nuclei and the locus of the prolate-oblateshape transition and compare these with empirical data.
PACS. 21.60.Fw Models based on group theory – 21.60.Ev Collective models
1 Introduction
The dominance of prolate (rugby ball) over oblate (pan-cake) shapes in the ground states of even-even nuclei isstill a puzzling open problem in nuclear structure [1]. Fur-thermore, there is experimental evidence for a prolate-to-oblate shape/phase transition in the rare earth regionaround neutron number N = 116 [2–6], in agreement withpredictions by microscopic calculations [7–10]. We are go-ing to consider these two issues in the framework of theproxy-SU(3) model, a new approximate symmetry schemeapplicable in medium-mass and heavy deformed nuclei [11,12]. The basic features and the theoretical foundations ofproxy-SU(3), as well as some first applications for mak-ing predictions for ground state properties of even-evendeformed nuclei, have been described in Refs. [13–15], towhich the reader is referred.
2 Particle-hole symmetry breaking
We are going to show that the prolate vs. oblate domi-nance in the deformed shapes of even-even nuclei is rootedin the breaking of the particle-hole symmetry in the shellpicture of the nucleus. A glance at the level schemes of theNilsson model [16,17] suffices in order to see that the firstfew orbitals lying in the beginning of a shell carry valuesof quantum numbers completely different from the lastfew orbitals at the end of the shell. In the neutron 50-82major shell, for example, and at a moderate deformation
ǫ = 0.3, the three orbitals at the beginning of the shellare 1/2[431], 1/2[420], and 1/2[550], while the last threeorbitals below the top of the shell are 11/2[505], 3/2[402],and 1/2[400], with the usual Nilsson notation K[NnzΛ]being used, where N is the number of oscillator quanta,nz is the number of oscillator quanta along the cylindricalsymmetry axis z, Λ is the z-projection of the orbital an-gular momentum, and K is the z-projection of the totalangular momentum.
In the framework of the proxy-SU(3) the particle-holesymmetry breaking can be seen in Table 1, in which theSU(3) irreducible representations (irreps) [18,19] corre-sponding to the highest weight state for a given number ofparticles (protons or neutrons) are shown. The harmonicoscillator shell, possessing a U(N) symmetry, correspond-ing to each nuclear shell within the proxy-SU(3) scheme isalso shown in Table 1. The highest weight states have beenobtained by using the code UNTOU3 [20]. We see that theparticle-hole symmetry is valid only up to 4 particles and4 holes, while it is broken in the middle of each shell. Inthe sd shell however, the particle-hole symmetry breakingis absent for even particle numbers and it appears onlyfor one odd particle number, due to the small size of theshell. It should be noticed that no particle-hole symmetrybreaking occurs if, instead of the highest weight irreps,one considers the irreps possessing the highest eigenvalueof the second order Casimir operator of SU(3) [21]
C2(λ, µ) =2
3(λ2 + λµ+ µ2 + 3λ+ 3µ). (1)
user
Text Box
63

2 Dennis Bonatsos et al.: Prolate dominance and prolate-oblate shape transition in the proxy-SU(3) model
0 10 20 30 40 50
0
10
20
30
U(6) proxy-SU(3)
U(10) proxy-SU(3)
U(15) proxy-SU(3)
U(21) proxy-SU(3)
U(6) p-h
U(10) p-h
U(15) p-h
U(21) p-h
square
root of C
2
N
Fig. 1. Values of the square root of the second order Casimiroperator of SU(3), obtained from Eq. (1), vs. particle num-ber N, for different shells, obtained through proxy-SU(3) orthrough the particle-hole symmetry assumption.
The difference can be seen in Fig. 1, where the values of thesquare root of the Casimir operator are shown for the twocases in discussion. The particle-hole symmetry breakingcan also be seen in Table 5 of Ref. [22], where the oddnumbers of particles in the U(10) shell are reported.
3 Prolate over oblate dominance
Using the group theoretical results reported in Table 1 forthe rare earths with 50-82 protons and 82-126 neutrons,one obtains for the highest weight irrep corresponding toeach nucleus the irreps shown in Table 2. Similar resultsfor rare earths with 50-82 protons and 50-82 neutrons areshown in Table 3.
As it was mentioned in Ref. [15], a connection betweenthe collective variables β and γ of the collective model[24] and the quantum numbers λ and µ characterizing theirreducible represention (λ, µ) of SU(3) [18,19] is known[25,26], based on the fact that the invariant quantitiesof the two theories should posses the same values, therelevant equation for γ being [25,26]
γ = arctan
(√3(µ+ 1)
2λ+ µ+ 3
). (2)
From this equation one easily sees that irreps with λ > µcorrespond to prolate shapes with 0 < γ < 30o, whileirreps with λ < µ correspond to oblate shapes with 30o <γ < 60o.
As a result, in Table 2 we see that most nuclei possessprolate ground states, with the exception of a few nucleiappearing simultaneously just below the Z = 82 shell clo-sure and just below the N = 126 shell closure. Similarconclusions are drawn from Table 3, where a few oblatenuclei are predicted just below the Z = 82 shell closureand just below the N = 82 shell closure.
4 The prolate-to-oblate shape/phase
transition
In Table 2 it appears that a prolate-to-oblate shape/phasetransition occurs at N = 116, while in Table 3 a similartransition is predicted at N = 72. The latter transitionlies far away from the experimentally accessible region,but the first one is supported by existing experimentaldata. In particular
1) In the W series of isotopes, 190W, which has N =116, has been suggested as the lightest oblate isotope [2].
2) In the Os series of isotopes, 192Os, which has N =116, has been suggested as lying at the shape/phase tran-sition point [3,4], with 194Os [3,4] and 198Os [5] found topossess an oblate character.
3) In the chain of even nuclei (differing by two protonsor two neutrons) 180Hf, 182−186W, 188−192Os, 194,196Pt,198,200Hg, considered in Ref. [6], the collection of experi-mental data used suggests the the transition from prolateto oblate shapes occurs between 192Os and 194Pt, both ofthem possessing N = 116.
Furthermore, the present findings are in agreementwith recent self-consistent Skyrme Hartree-Fock plus BCScalculations [7] and Hartree-Fock-Bogoliubov calculations[8–10] studying the structural evolution in neutron-richYb, Hf, W, Os, and Pt isotopes, reaching the conclusionthat N = 116 nuclei in this region can be identified as thetransition points between prolate and oblate shapes.
5 Conclusions
We have shown that the prolate over oblate dominancein the ground states of deformed even-even nuclei is pre-dicted by the proxy-SU(3) scheme, based on the breakingof the particle-hole symmetry within each nuclear shell.Furthermore, we have seen that the proxy-SU(3) symme-try suggests N = 116 as the point of the prolate-to-oblateshape/phase transition, in agreement with existing expre-rimental evidence [2–6] and microscopic calculations [7–10].
References
1. I. Hamamoto and B. Mottelson, Shape deformations inatomic nuclei, Scholarpedia 7(4), 10693 (2012).
2. N. Alkhomashi et al., β-delayed spectroscopy of neutron-rich tantalum nuclei: Shape evolution in neutron-richtungsten isotopes, Phys. Rev. C 80, 064308 (2009).
3. R. F. Casten, A. I. Namenson, W. F. Davidson, D. D.Warner, and H. G. Borner, Low-lying levels in 194Os andthe prolateoblate phase transition, Phys. Lett. B 76, 280(1978).
4. C. Wheldon, J. Garces Narro, C. J. Pearson, P. H. Re-gan, Zs. Podolyak, D. D. Warner, P. Fallon, A. O. Macchi-avelli, and M. Cromaz, Yrast states in 194Os: The prolate-oblate transition region, Phys. Rev. C 63, 011304(R)(2000).
user
Text Box
D. Bonatsos et al.: Prolate dominance and prolate-oblate shape transition in the proxy-SU(3) model 64

Dennis Bonatsos et al.: Prolate dominance and prolate-oblate shape transition in the proxy-SU(3) model 3
5. Zs. Podolyak et al.,, Weakly deformed oblate structuresin 198
76 Os122, Phys. Rev. C 79, 031305(R) (2009).
6. J. Jolie and A. Linnemann, Prolate-oblate phase tran-sition in the Hf-Hg mass region, Phys. Rev. C 68,031301(R) (2003).
7. P. Sarriguren, R. Rodrıguez-Guzman, and L. M. Robledo,Shape transitions in neutron-rich Yb, Hf, W, Os, and Ptisotopes within a Skyrme Hartree-Fock + BCS approach,Phys. Rev. C 77, 064322 (2008).
8. L. M. Robledo, R. Rodrıguez-Guzman, and P. Sarriguren,Role of triaxiality in the ground-state shape of neutron-rich Yb, Hf, W, Os and Pt isotopes, J. Phys. G: Nucl.Part. Phys. 36, 115104 (2009).
9. K. Nomura, T. Otsuka, R. Rodrıguez-Guzman, L. M.Robledo, P. Sarriguren, P. H. Regan, P. D. Stevenson,and Zs. Podolyak, Spectroscopic calculations of the low-lying structure in exotic Os and W isotopes, Phys. Rev.C 83, 054303 (2011).
10. K. Nomura, T. Otsuka, R. Rodrıguez-Guzman, L. M.Robledo, and P. Sarriguren, Collective structural evolu-tion in neutron-rich Yb, Hf, W, Os, and Pt isotopes, Phys.Rev. C 84, 054316 (2011).
11. D. Bonatsos, I. E. Assimakis, N. Minkov, A. Martinou,R. B. Cakirli, R. F. Casten, and K. Blaum, Proxy-SU(3)symmetry in heavy deformed nuclei, Phys. Rev. C (2017)accepted, arXiv 1706.02282 [nucl-th].
12. D. Bonatsos, I. E. Assimakis, N. Minkov, A. Martinou,S. Sarantopoulou, R. B. Cakirli, R. F. Casten, and K.Blaum, Analytic predictions for nuclear shapes, prolatedominance and the prolate-oblate shape transition in theproxy-SU(3) model, Phys. Rev. C (2017) accepted, arXiv1706.02321 [nucl-th].
13. D. Bonatsos. I. E. Assimakis, N. Minkov, A. Martinou, R.B. Cakirli, R. F. Casten, and K. Blaum, A new symmetryfor heavy nuclei: Proxy-SU(3), in the Proceedings of the4th Workshop of the Hellenic Institute of Nuclear Physics(HINPw4), ed. A. Pakou, http://hinpw4.physics.uoi.gr
14. D. Bonatsos. I. E. Assimakis, N. Minkov, A. Martinou,R. B. Cakirli, R. F. Casten, and K. Blaum, Proxy-SU(3) symmetry in heavy nuclei: Foundations, in theProceedings of the 4th Workshop of the Hellenic In-stitute of Nuclear Physics (HINPw4), ed. A. Pakou,http://hinpw4.physics.uoi.gr
15. D. Bonatsos. I. E. Assimakis, N. Minkov, A. Marti-nou, S. Sarantopoulou, R. B. Cakirli, R. F. Casten, andK. Blaum, Parameter-independent predictions for shapevariables of heavy deformed nuclei in the proxy-SU(3)model, in the Proceedings of the 4th Workshop of theHellenic Institute of Nuclear Physics (HINPw4), ed. A.Pakou, http://hinpw4.physics.uoi.gr
16. S. G. Nilsson, Binding states of individual nucleons instrongly deformed nuclei, Mat. Fys. Medd. K. Dan. Vi-densk. Selsk. 29, no. 16 (1955).
17. S. G. Nilsson and I. Ragnarsson, Shapes and Shells in Nu-clear Structure (Cambridge University Press, Cambridge,1995).
18. J. P. Elliott, Collective motion in the nuclear shell modelI. Classification schemes for states of mixed configura-tions, Proc. Roy. Soc. Ser. A 245, 128(1958).
19. J. P. Elliott, Collective motion in the nuclear shell modelII. The introduction of intrinsic wave-functions, Proc.Roy. Soc. Ser. A 245, 562 (1958).
20. J. P. Draayer, Y. Leschber, S. C. Park, and R. Lopez,Representations of U(3) in U(N), Comput. Phys. Com-mun. 56, 279 (1989).
21. F. Iachello and A. Arima, The Interacting Boson Model
(Cambridge University Press, Cambridge, 1987).22. R. D. Ratna Raju, J. P. Draayer, and K. T. Hecht, Search
for a coupling scheme in heavy deformed nuclei: Thepseudo SU(3) model, Nucl. Phys. A 202, 433 (1973).
23. Brookhaven National Laboratory ENSDF databasehttp://www.nndc.bnl.gov/ensdf/
24. A. Bohr and B. R. Mottelson, Nuclear Structure, Vol. II:Nuclear Deformations (Benjamin, New York, 1975).
25. O. Castanos, J. P. Draayer, and Y. Leschber, Shape vari-ables and the shell model, Z. Phys. A 329, 33 (1988).
26. J. P. Draayer, S. C. Park, and O. Castanos, Shell-modelinterpretation of the collective-model potential-energysurface, Phys. Rev. Lett. 62, 20 (1989).
user
Text Box
D. Bonatsos et al.: Prolate dominance and prolate-oblate shape transition in the proxy-SU(3) model 65
4 Dennis Bonatsos et al.: Prolate dominance and prolate-oblate shape transition in the proxy-SU(3) model
Table 1. Comparison between SU(3) irreps for U(6), U(10), U(15), and U(21), obtained by the code UNTOU3 [20], containedin the relevant U(n) irrep for M valence protons or M valence neutrons. Above the U(n) algebra, the relevant shell of the shellmodel and the corresponding proxy-SU(3) shell are given. The highest weight SU(3) irreps, given in the columns labelled byhw, are compared to the SU(3) irreps with the highest eigenvalue of the second order Casimir operator of SU(3), given in thecolumns labelled by C. Irreps breaking the particle-hole symmetry in the hw columns are indicated by boldface characters.Taken from Ref. [12].
8-20 8-20 28-50 28-50 50-82 50-82 82-126 82-126sd sd pf pf sdg sdg pfh pfh
M irrep U(6) U(6) U(10) U(10) U(15) U(15) U(21) U(21)hw C hw C hw C hw C
0 (0,0) (0,0) (0,0) (0,0) (0,0) (0,0) (0,0) (0,0)1 [1] (2,0) (2,0) (3,0) (3,0) (4,0) (4,0) (5,0) (5,0)2 [2] (4,0) (4,0) (6,0) (6,0) (8,0) (8,0) (10,0) (10,0)3 [21] (4,1) (4,1) (7,1) (7,1) (10,1) (10,1) (13,1) (13,1)4 [22] (4,2) (4,2) (8,2) (8,2) (12,2) (12,2) (16,2) (16,2)5 [221] (5,1) (5,1) (10,1) (10,1) (15,1) (15,1) (20,1) (20,1)6 [23] (6,0) (0,6) (12,0) (12,0) (18,0) (18,0) (24,0) (24,0)7 [231] (4,2) (1,5) (11,2) (11,2) (18,2) (18,2) (25,2) (25,2)8 [24] (2,4) (2,4) (10,4) (10,4) (18,4) (18,4) (26,4) (26,4)9 [241] (1,4) (1,4) (10,4) (10,4) (19,4) (19,4) (28,4) (28,4)
10 [25] (0,4) (0,4) (10,4) (4,10) (20,4) (20,4) (30,4) (30,4)11 [251] (0,2) (0,2) (11,2) (4,10) (22,2) (22,2) (33,2) (33,2)12 [26] (0,0) (0,0) (12,0) (4,10) (24,0) (24,0) (36,0) (36,0)13 [261] (9,3) (2,11) (22,3) (22,3) (35,3) (35,3)14 [27] (6,6) (0,12) (20,6) (20,6) (34,6) (34,6)15 [271] (4,7) (1,10) (19,7) (7,19) (34,7) (34,7)16 [28] (2,8) (2,8) (18,8) (6,20) (34,8) (34,8)17 [281] (1,7) (1,7) (18,7) (3,22) (35,7) (35,7)18 [29] (0,6) (0,6) (18,6) (0,24) (36,6) (36,6)19 [291] (0,3) (0,3) (19,3) (2,22) (38,3) (38,3)20 [210] (0,0) (0,0) (20,0) (4,20) (40,0) (40,0)21 [2101] (16,4) (4,19) (37,4) (4,37)22 [211] (12,8) (4,18) (34,8) (0,40)23 [2111] (9,10) (2,18) (32,10) (3,38)24 [212] (6,12) (0,18) (30,12) (6,36)25 [2121] (4,12) (1,15) (29,12) (7,35)26 [213] (2,12) (2,12) (28,12) (8,34)27 [2131] (1,10) (1,10) (28,10) (7,34)28 [214] (0,8) (0,8) (28,8) (6,34)29 [2141] (0,4) (0,4) (29,4) (3,35)30 [215] (0,0) (0,0) (30,0) (0,36)31 [2151] (25,5) (2,33)32 [216] (20,10) (4,30)33 [2161] (16,13) (4,28)34 [217] (12,16) (4,26)35 [2171] (9,17) (2,25)36 [218] (6,18) (0,24)37 [2181] (4,17) (1,20)38 [219] (2,16) (2,16)39 [2191] (1,13) (1,13)40 [220] (0,10) (0,10)41 [2201] (0,5) (0,5)42 [221] (0,0) (0,0)
user
Text Box
D. Bonatsos et al.: Prolate dominance and prolate-oblate shape transition in the proxy-SU(3) model 66

Dennis Bonatsos et al.: Prolate dominance and prolate-oblate shape transition in the proxy-SU(3) model 5
Table 2. Most leading SU(3) irreps [18,19] for nuclei with protons in the 50-82 shell and neutrons in the 82-126 shell. Nucleiare divided into five groups: 1) Nuclei with R4/2 = E(4+
1)/E(2+
1) ≥ 2.8 are indicated by boldface numbers. 2) Nuclei with
2.8 > R4/2 ≥ 2.5 are denoted by *. 3) A few nuclei with R4/2 ratios slightly below 2.5, shown for comparison, are labelled by**. 4) For any other nuclei with R4/2 < 2.5, no irreps are shown. 5) Nuclei for which the R4/2 ratios are still unknown [23] areshown using normal fonts and without any special signs attached . Underlined irreps correspond to oblate shapes. Based onRef. [12].
Ce Nd Sm Gd Dy Er Yb Hf W Os PtZ 58 60 62 64 66 68 70 72 74 76 78
122 (18,14) (20,14) (24,14) (20,16) (18,18) (18,16) (20,10) (12,18) (6,22) (2,22) (0,18)120 (20,20) (22,20) (26,16) (22,22) (20, 24) (20, 22) (22,16) (14, 24) (8, 28) (4, 28)∗ (2, 24) ∗ ∗
118 (24,22) (26,22) (30,18) (26,24) (24,16) (24,24) (26,18) (18, 26) (12, 30) (8, 30)∗ (6, 26) ∗ ∗
116 (30,10) (32,10) (36,6) (32,12) (30,14) (30,12) (32,6) (24,14) (18, 28)∗ (14,28) (12, 24) ∗ ∗
114 (38,14) (40,14) (44,10) (40,16) (38,18) (38,16) (40,10) (32,18) (26,22) (22,22) (20,18)**112 (48,4) (50,4) (54,0) (50,6) (48,8) (48,6) (50,0) (42,8) (36,12) (32,12) (30,8)**110 (46,12) (48,12) (52,8) (48,14) (46,16) (46,14) (48,8) (40,16) (34,20) (30,20) (28,16)*108 (46,16) (48,16) (52,12) (48,18) (46,20) (46,18) (48,12) (40,20) (34,24) (30,24) (28,20)*106 (48,16) (50,16) (54,12) (50,18) (48,20) (48,18) (50,12) (42,20) (36,24) (32,24) (30,20)*104 (52,12) (54,12) (58,8) (54,14) (52,16) (52,14) (54,8) (46,16) (40,20) (36,20) (34,16)*102 (58,4) (60,4) (64,0) (60,6) (58,8) (58,6) (60,0) (52,8) (46,12) (42,12) (40,8)*100 (54,10) (56,10) (60,6) (56,12) (54,14) (54,12) (56,6) (48,14) (42,18) (38,18) (36,14)*98 (52,12) (54,12) (58,8) (54,14) (52,16) (52,14) (54,8) (46,16) (40,20) (36,20)*96 (52,10) (54,10) (58,6) (54,12) (52,14) (52,12) (54,6) (46,14) (40,18) (36,18)*94 (54,4) (56,4) (60,0) (56,6) (54,8) (54,6) (56,0) (48,8) (42,12) (38,12)*92 (48,8) (50,8) (54,4) (50,10) (48,12) (48,10) (50,4) (42,12)*90 (44,8) (46,8) (50,4) (46,10) (44,12) (44,10)* (46,4)* (38,12)*88 (42,4)* (44,4)*
Table 3. Same as Table II, but for nuclei with both protons and neutrons in the 50-82 shell. Based on Ref. [12].
Ba Ce Nd Sm Gd Dy Er Yb Hf W Os PtZ 56 58 60 62 64 66 68 70 72 74 76 7878 (18,14) (20,8) (12, 16) (6, 20) (2, 20) (0, 16)
76 (20,16)* (22,16)* (26,12)* (22,18)* (20,20)* (20,18) (22,12) (14, 20) (8, 24) (4, 24) (2, 20)
74 (24,12)* (24,16)* (26,16)* (30,12)* (26,18)* (24,20) (24,18) (26,12) (18, 20) (12, 24) (8, 24) (6, 20)
72 (30,8)* (30,12)* (32,12) (36,8) (32,14) (30,16) (30,14) (32,8) (24,16) (18, 20) (14, 20) (12, 16)
70 (38,0)* (38,4) (40,4) (44,0) (40,6) (38,8) (38,6) (40,0) (32,8) (26,12) (22,12) (20,8)68 (36,6) (36,10) (38,10) (42,6) (38,12) (36,14) (36,12) (38,6) (30,14) (24,18) (20,18) (18,14)66 (36,8) (36,12) (38,12) (32,8) (38,14) (36,16) (36,14) (38,8) (30,16) (24,20) (20,20) (18,16)64 (38,6) (38,10) (40,10) (44,6) (40,12) (38,14) (38,12) (40,6) (32,14) (26,18) (22,18) (20,14)62 (42,0) (42,4) (44,4) (48,0) (44,6) (42,8) (42,6) (44,0) (36,8) (30,12) (26,12) (24,8)60 (28,4) (38,8) (40,8) (44,4) (40,10) (38,12) (38,10) (40,4) (32,12) (26,16) (22,16) (20,12)58 (36,4) (36,8) (38,8) (42,4) (38,10) (36,12) (36,10) (38,4) (30,12) (24,16) (20,16) (18,12)56 (36,0) (36,4) (38,4) (42,0) (38,6) (36,8) (36,6) (38,0) (30,8) (24,12) (20,12) (18,8)
Powered by TCPDF (www.tcpdf.org)Powered by TCPDF (www.tcpdf.org)Powered by TCPDF (www.tcpdf.org)Powered by TCPDF (www.tcpdf.org)Powered by TCPDF (www.tcpdf.org)
user
Text Box
D. Bonatsos et al.: Prolate dominance and prolate-oblate shape transition in the proxy-SU(3) model 67

Nuclear Physics Using Lasers A. Bonasera
Cyclotron Institute, Texas A&M University, College Station, TX-77843, USA; Laboratori Nazionali del Sud, INFN, via Santa Sofia, 62, 95123 Catania, Italy
Abstract. The plasma astrophysical S factor for the 3He(d;p)4He fusion reaction was measured for the first time at temperatures of few KeV, using the interaction of intense ultrafast laser pulses with molecular deuterium clusters mixed with 3He atoms. The experiments were performed at the Petawatt laser facility, University of Texas, Austin-USA. Different proportions of D2 and 3He or CD4 and 3He were mixed in the gas target in order to allow the measurement of the cross section. The yield of 14.7 MeV protons from the 3He(d;p)4He reaction was measured in order to extract the astrophysical S factor at low energies.
Recent results obtained at the ABC-laser facility, ENEA-Frascati, Italy on the p+11B, 6Li+6Li and d+6Li systems will be discussed.
References PRL 111, 082502 (2013); PRL 111, 055002 (2013); PHYS.REV. E 88, 033108 (2013); NIM A 720 (2013) 149–152; Progr.Theor.Phys. Supplement No. 154, 2004, 261 http://physics.aps.org/synopsis-for/10.1103/PhysRevLett.111.082502
user
Text Box
68
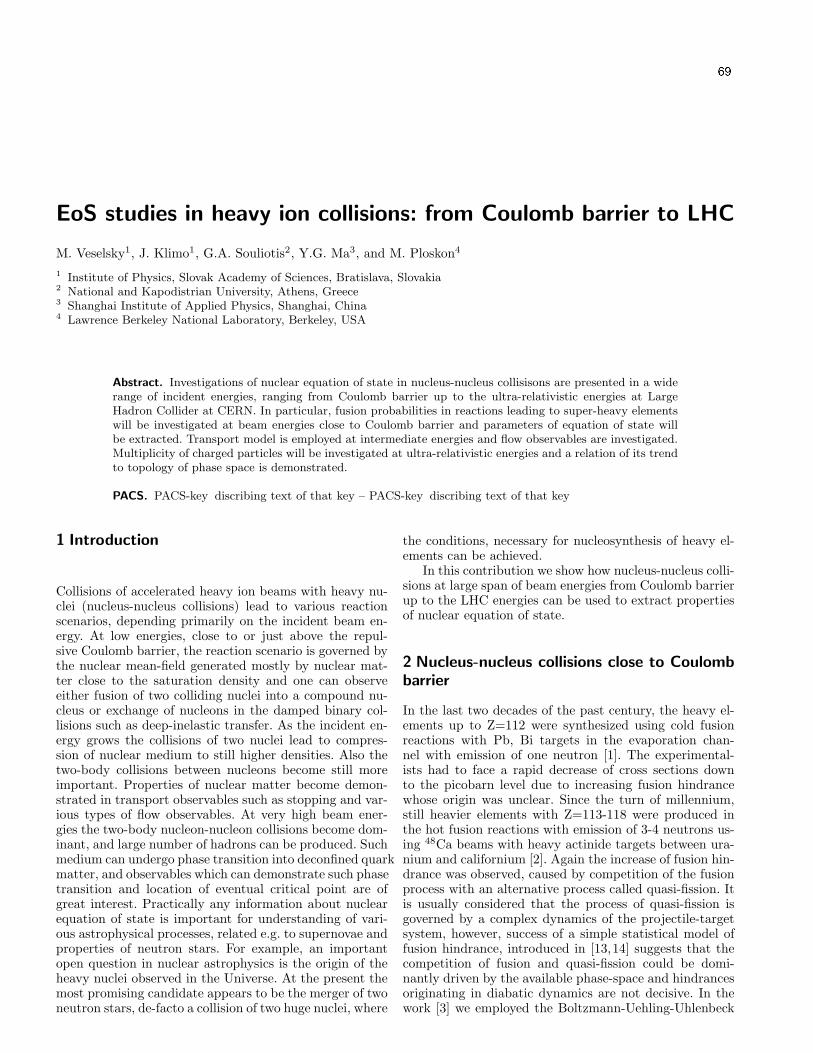
EoS studies in heavy ion collisions: from Coulomb barrier to LHC
M. Veselsky1, J. Klimo1, G.A. Souliotis2, Y.G. Ma3, and M. Ploskon4
1 Institute of Physics, Slovak Academy of Sciences, Bratislava, Slovakia2 National and Kapodistrian University, Athens, Greece3 Shanghai Institute of Applied Physics, Shanghai, China4 Lawrence Berkeley National Laboratory, Berkeley, USA
Abstract. Investigations of nuclear equation of state in nucleus-nucleus collisisons are presented in a widerange of incident energies, ranging from Coulomb barrier up to the ultra-relativistic energies at LargeHadron Collider at CERN. In particular, fusion probabilities in reactions leading to super-heavy elementswill be investigated at beam energies close to Coulomb barrier and parameters of equation of state willbe extracted. Transport model is employed at intermediate energies and flow observables are investigated.Multiplicity of charged particles will be investigated at ultra-relativistic energies and a relation of its trendto topology of phase space is demonstrated.
PACS. PACS-key discribing text of that key – PACS-key discribing text of that key
1 Introduction
Collisions of accelerated heavy ion beams with heavy nu-clei (nucleus-nucleus collisions) lead to various reactionscenarios, depending primarily on the incident beam en-ergy. At low energies, close to or just above the repul-sive Coulomb barrier, the reaction scenario is governed bythe nuclear mean-field generated mostly by nuclear mat-ter close to the saturation density and one can observeeither fusion of two colliding nuclei into a compound nu-cleus or exchange of nucleons in the damped binary col-lisions such as deep-inelastic transfer. As the incident en-ergy grows the collisions of two nuclei lead to compres-sion of nuclear medium to still higher densities. Also thetwo-body collisions between nucleons become still moreimportant. Properties of nuclear matter become demon-strated in transport observables such as stopping and var-ious types of flow observables. At very high beam ener-gies the two-body nucleon-nucleon collisions become dom-inant, and large number of hadrons can be produced. Suchmedium can undergo phase transition into deconfined quarkmatter, and observables which can demonstrate such phasetransition and location of eventual critical point are ofgreat interest. Practically any information about nuclearequation of state is important for understanding of vari-ous astrophysical processes, related e.g. to supernovae andproperties of neutron stars. For example, an importantopen question in nuclear astrophysics is the origin of theheavy nuclei observed in the Universe. At the present themost promising candidate appears to be the merger of twoneutron stars, de-facto a collision of two huge nuclei, where
the conditions, necessary for nucleosynthesis of heavy el-ements can be achieved.
In this contribution we show how nucleus-nucleus colli-sions at large span of beam energies from Coulomb barrierup to the LHC energies can be used to extract propertiesof nuclear equation of state.
2 Nucleus-nucleus collisions close to Coulomb
barrier
In the last two decades of the past century, the heavy el-ements up to Z=112 were synthesized using cold fusionreactions with Pb, Bi targets in the evaporation chan-nel with emission of one neutron [1]. The experimental-ists had to face a rapid decrease of cross sections downto the picobarn level due to increasing fusion hindrancewhose origin was unclear. Since the turn of millennium,still heavier elements with Z=113-118 were produced inthe hot fusion reactions with emission of 3-4 neutrons us-ing 48Ca beams with heavy actinide targets between ura-nium and californium [2]. Again the increase of fusion hin-drance was observed, caused by competition of the fusionprocess with an alternative process called quasi-fission. Itis usually considered that the process of quasi-fission isgoverned by a complex dynamics of the projectile-targetsystem, however, success of a simple statistical model offusion hindrance, introduced in [13,14] suggests that thecompetition of fusion and quasi-fission could be domi-nantly driven by the available phase-space and hindrancesoriginating in diabatic dynamics are not decisive. In thework [3] we employed the Boltzmann-Uehling-Uhlenbeck
user
Text Box
69

2
(BUU) equation with the Pauli principle implemented sep-arately for neutrons and protons and with the Coulombinteraction and demonstrated how various equations ofstate of nuclear matter implemented into such transportsimulation influence the competition of fusion and quasi-fission. Based on available data on reactions, leading toproduction of super-heavy nuclei, we extracted most strin-gent constraints on the stiffness of the nuclear equation ofstate and on the density-dependence of the symmetry en-ergy.
In order to describe theoretically the competition of fu-sion and quasi-fission at energies close to the Coulomb bar-rier, the evolution of nuclear mean field can be describedby solving the Boltzmann equation. One of the approxi-mations for the solution of the Boltzmann equation, theBoltzmann-Uehling-Uhlenbeck model is extensively used[4,5], which takes both the nuclear mean field and theFermionic Pauli blocking into consideration. The simplesingle-particle mean field potential with the isospin-dependentsymmetry energy term
U = aρ+ bρκ + 2as(ρ
ρ0)γτzI, (1)
was used, where I = (ρn−ρp)/ρ, ρ0 is the normal nuclearmatter density; ρ, ρn, and ρp are the nucleon, neutronand proton densities, respectively; τz assumes the value1 for neutron and -1 for proton, the coefficients a, b andexponent κ represent the properties of symmetric nuclearmatter, while the last term describes the influence of thesymmetry energy, where as represents the symmetry en-ergy at saturation density and the exponent γ describesthe density dependence.
The in-medium nucleon-nucleon cross sections are typ-ically approximated using the experimental cross sectionsof free nucleons (e.g. using the parametrization from Cugnon[6]). Alternatively, as shown in the work [7], in-mediumnucleon-nucleon cross sections can be estimated directlyusing the equation of state.
We use the version of Van der Waals Boltzmann-Uehling-Uhlenbeck model which was developed by Veselsky andMa [7]. In a system constituting of nucleons, the proper(excluded) volume b′ can be used to estimate its cross sec-tion within the nucleonic medium
σ = (9π
16)1/3b′2/3, (2)
where b′ can be expressed using single particle potentialas
b′ =bκρκ + 2γas(
ρρ0
)1+γτzI
(f5/2(z)
f3/2(z))ρT + bκρ1+κ + 2γasρ0(
ρρ0
)1+γτzI. (3)
where z = exp(µ/T ) is the fugacity value of nucleons,with ρ being particle density, µ chemical potential and T
is the temperature; andf5/2(z)
f3/2(z)is a factor, a fraction of the
Fermi integrals fn(z) = 1
Γ (n)
∫∞
0
xn−1
z−1ex+1dx. Such cross
section can be implemented into the collision term of theBoltzmann-Uehling-Uhlenbeck equation. In this way, both
-20 -10 0 10 20
x(fm
)
-10
0
10
t= 0 fm/c
z(fm)-20 -10 0 10 20
x(fm
)
-10
0
10t= 1050 fm/c -20 -10 0 10 20
-10
0
10
t= 345 fm/c
z(fm)-20 -10 0 10 20
-10
0
10t= 1395 fm/c -20 -10 0 10 20
-10
0
10
t= 690 fm/c
z(fm)-20 -10 0 10 20
-10
0
10t= 1425 fm/c
Fig. 1. Typical evolution of nucleonic density for the centralcollision 64Ni+186W at beam energy 5 MeV/nucleon, simulatedusing the soft equation of state with incompressibility K0 =202 MeV and the soft density dependence symmetry energywith γ = 0.5. Weak surface tension is overcome by Coulombinteraction and quasi-fission occurs.
isospin-dependent mean-field and nucleon-nucleon crosssections, which are correlated to each other. This is a so-called VdWBUU equation. More details can be found inRef. [7].
To account for Coulomb force, we complement the cor-responding density-dependent force ∇rU acting at a givencell of the cubic grid (with a mesh of 1 fm) with the sum-mary force generated by the all remaining protons out-side of a given cell. This approach avoids fluctuation ofthe Coulomb force due to interaction of protons at smalldistances inside the cell, and also avoids double countingsince interaction of protons within the same cell is con-sidered in the collision term. Specifically we consider onlyinteraction with the protons of the same set of test parti-cles.
In order to investigate the role of the equation of stateof nuclear matter in the competition of fusion and quasi-fission in reactions leading to heavy and superheavy nuclei,we selected a representative set of reactions, where exper-imental data exists. As one of the heaviest systems, wherefusion is still dominant, we use the reaction 48Ca+208Pb.This reaction was measured [8,9], and a typical dominantpeak at symmetric fission was observed in the mass vsTKE spectra of fission fragments, with TKE consistent tofusion-fission proceeding through formation of the com-pound nucleus 256Nb. Onset of quasi-fission was observed[10] in the reaction 64Ni+186W, leading to compound sys-tem 250No, where a prominent fusion-like peak is not ob-served anymore, however symmetric fission, which can beattributed to fusion-fission, is still observed relatively fre-quently. Quasi-fission becomes even more dominant in thereaction 48Ca+238U, nominally leading to compound nu-cleus 286Cn. Nevertheless, the symmetric fission eventsstill amount to about 10 % of fission events [11]. Com-parison with the reaction 64Ni+186W shows that the rela-tive amount of symmetric events in reaction 48Ca+238U istwice lower than in the reaction 64Ni+186W, thus implyingthe relative amount of 20 % of symmetric fission for thelatter reaction. In reactions 64Ni+208Pb [8], 48Ca+249Cf
user
Text Box
M. Veselsky et al.: EoS studies in heavy ion collisions: from Coulomb barrier to LHC 70

3
-20 -10 0 10 20
x(fm
)
-10
0
10
t= 0 fm/c
z(fm)-20 -10 0 10 20
x(fm
)
-10
0
10t= 1275 fm/c -20 -10 0 10 20
-10
0
10
t= 420 fm/c
z(fm)-20 -10 0 10 20
-10
0
10t= 1695 fm/c -20 -10 0 10 20
-10
0
10
t= 840 fm/c
z(fm)-20 -10 0 10 20
-10
0
10t= 2085 fm/c
Fig. 2. Typical evolution of nucleonic density for the centralcollision 64Ni+186W at beam energy 5 MeV/nucleon, simu-lated using the soft equation of state (K0 = 202 MeV) and thestiff density-dependence of symmetry energy (γ = 1.5). Despiteweak surface tension the stiff density-dependence of symmetryenergy prevents formation of a neck and quasi-fission is pre-vented.
[2], and 64Ni+238U [12] the quasi-fission already dominatesand fusion hindrance amounts to several orders of magni-tude (10−3 - 10−5 [13,14]).
Simulations were performed at beam energy 5 AMeV,which is above the Coulomb barrier and in all cases cor-responds to the nearest experimental point within fewMeV. Since the angular momentum range where quasi-fission events are produced is not known precisely andalso to assure that we won’t observe deep-inelastic trans-fer, which occurs at peripheral collisions, we simulate themost central events, with impact parameter set to 0.5 fm(exactly central events practically do not occur in exper-iment). Simulations were performed up to the time 3000fm/c, sufficient for formation of the final configuration inall investigated cases.
From the investigated reactions, the collisions of 64Ni+186Wexhibit highest sensitivity to the parameters of the equa-tion of state. Fig. 1 shows typical evolution of nucleonicdensity for the collision 64Ni+186W, simulated using thesoft equation of state with incompressibility K0 = 202MeV and the soft density-dependence of symmetry en-ergy γ = 0.5. One can see that the impinging projectilenucleus establishes contact with the target nucleus, how-ever the weak surface tension, caused by the soft equationof state, is not sufficient to overcome Coulomb repulsionof the projectile and target which re-separate after ap-proximately 1200 fm/c (scission time is comparable withother approaches [15–19]). Similar evolution was observedin all 20 simulated test particle sets. In the simulation ofthe same reaction with K0 = 300 MeV and γ = 0.5 thestronger surface tension generated by the stiff equation ofstate allows to overcome the Coulomb repulsion and sys-tem undergoes fusion. Strong sensitivity to the stiffness ofthe equation of state is thus demonstrated. Fig. 2 showsthe simulation with K0 = 202 MeV and γ = 1.5. One canobserve that increased stiffness of the density-dependenceof symmetry energy can also prevent system from sepa-rating into two fragments. In this case the weak surface
(MeV)0K240 245 250 255 260
γ
0.5
0.6
0.7
0.8
0.9
1
1.1
Fig. 3. Constraint on stiffness of symmetric nuclear matter(modulus of incompressibility) and on density-dependence ofthe symmetry energy (exponent γ from Eq. 1) derived from thesimulations of competition between fusion and quasi-fission.
tension allows to form elongated configuration (similar toFig. 1), however the stiffer symmetry energy prevents for-mation of a low-density neutron-rich neck and thus thecontact between the two reaction partners is preserveduntil the surface tension finally overcomes the Coulombrepulsion. Figs. 1 - 2 demonstrate a strong sensitivity ofthe system 64Ni+186W to the parameters of the equationof state.
As a result of the analysis of competition between fu-sion and quasi-fission in all above mentioned reactions, itwas possible to set a rather strict constraint on the in-compressibility of the equation of state of nuclear matterK0 = 240 − 260 MeV with softer density dependence ofthe symmetry energy with γ = 0.5− 1.0 (see Fig. 3). Thisconstraint is based on simulations of collisions, where max-imum density reaches 1.4 - 1.5 times the saturation den-sity. The shape of the constrained area reflects a trend ofsoftening the density-dependence of the symmetry energy,necessary to balance increase of incompressibility. Suchtrend stems from competition of the surface tension, re-lated to the stiffness of the equation of state of symmetricnuclear matter, with the Coulomb repulsion. This corre-sponds to the traditional picture of nuclear fission, wherefissility of the system is defined as a ratio of the Coulombrepulsion to twice the surface energy. However, the presentanalysis goes beyond this simple macroscopic picture andelucidates the crucial role of the density-dependence of thesymmetry energy in the dynamics of the system close tothe scission point. In comparison with other methods, suchas constraining the equation of state using the nuclear gi-ant resonances [20–22] or the flow observables in relativis-tic nucleus-nucleus collisions [23], in the present analysisthe effect of nuclear equation of state is manifested di-rectly, and thus it is not affected by uncertainty relatede.g. to description of underlying nuclear structure in theformer or disentangling the effect of the two-body dissipa-tion via nucleon-nucleon collisions in the latter case. Thus,by using a representative set of investigated reactions weprovide a solid base for assumption that the extractedconstraints do not depend critically on the effect of shell
user
Text Box
M. Veselsky et al.: EoS studies in heavy ion collisions: from Coulomb barrier to LHC 71

4
structure. In order to obtain even more strict constraints,in particular on the density-dependence of symmetry en-ergy, more experimental data are necessary close to theonset of quasi-fission, where the sensitivity of the neck dy-namics to the density dependence of the symmetry energyis highest.
3 Analysis of flow observables
The flow observables were introduced primarily as observ-ables directly related to the equation of state of nuclearmatter. Different flow observables can be identified withthe coefficients of the Fourier expansion of the azimuthalangular distribution in transverse direction relative to thereaction plane.
The systematics of directed flow for protons observedin the semi-peripheral collisions (b=5.5-7.5 fm) of Au+Auat various beam energies was published in [24] and thesystematics of elliptic flow for the protons observed in thesemi-peripheral collisions of Au+Au at mid-rapidity waspublished in the work [25]. When combined, these twosystematics provide a good set of experimental data fortesting of the transport codes and for determination of theparameters of the equation of the state of nuclear matter.
As described above, the new variant of the transportcode for simulation of the nucleus-nucleus collisions (Vd-WBUU) was introduced in the work [7]. At variance toprevious methods used for the solution of the Boltzmann-Uehling-Uhlenbeck equation (BUU), the nucleon-nucleoncross sections used for evaluation of the collision term,are estimated directly from the equation of state used forevaluation of the mean-field potential. The method of es-timation of the nucleon-nucleon cross sections is based onthe formal transformation of the equation of state into theform of the Van der Waals equation of state and the crosssections is obtained from excluded volume after invertingthe Van der Waals equation of state. Thus the whole calcu-lation is based on a single equation of state and there is noneed to use free or empirically estimated in-medium crosssections. Like in the work [7], particles are considered asemitted when they are separated in the phase-space fromany other particle and separation is large enough to assurethat two particles are not part of a cluster (a condition∆p∆r > 2h is implemented).
For each simulation the emitted protons were selectedas described above and the resulting flow observables werecompared to the measured values. Since the measuredvalues represent a compilation of results of many experi-ments, no specific filtering procedure, taking into accountexperimental angular and momentum coverage, was per-formed. It is simply assumed that if the calculated value,at least a maximum value of the negative elliptic flow ata given transverse momentum, approaches the measuredvalue, the corresponding choice of the parameters of theequation of the state is considered as viable, while if nei-ther the inclusive data nor the subset approach the mea-sured value, the corresponding choice of the parameters ofthe equation of the state is considered as excluded by themeasured data.
Fig. 4. Systematics of the proton directed flow (left panels,lines indicate experimentally observed slopes) and the momen-tum dependence of the calculated proton elliptic flow at mid-rapidity versus the experimental value (boxes and the dash-dotted line in right panels, respectively) in the collisions ofAu+Au at beam energies ranging from 400 AMeV to 1.25AGeV. Results were obtained using the VdWBUU simulationusing the intermediate EoS with κ = 3/2 (K0=272 MeV) andthe symmetry energy density dependence with γ = 1.
In Figure 4 are shown the results of the simulationswith the intermediate EoS (with incompressibility K0 =272 MeV). This mode of simulations leads to reasonableagreement with the measured directed flow and also theagreement with the measured elliptic flow is within thelimits preventing to disregard this variant. On the otherhand, simulations with the soft EoS (with incompressibil-ityK0 = 202 MeV) fail to reproduce both the directed flowand also elliptic flow. The directed flow is not reproducedfrom the beam energy 700 AMeV and above, the slopesof the transverse momentum are much less steep and sucha soft equation of the state appears as excluded by themeasured data on directed flow. The situation concerningthe elliptic flow is less dramatic, still the observed agree-ment is worse than in the case of stiffer equation of thestate. Another interesting observation is that simulationswith the stiff EoS K0 = 380 MeV and stiffer parametriza-tions of the density dependence of the symmetry energyγ = 1−−2 lead to results similar to Figure 4 and all thesesymmetry energy parametrizations can be considered asviable. It appears to signal that the such stiff equation
user
Text Box
M. Veselsky et al.: EoS studies in heavy ion collisions: from Coulomb barrier to LHC 72

5
Fig. 5. The area marked by solid contour in the γ vs K0 plotshows the values of the EoS and symmetry energy parameters,constrained by the analysis using the VdWBUU simulations(squares show the values where calculation was performed).Dotted contour shows the uncertainty where the values can notbe conclusively excluded. Dashed lines shows the constrainedvalues of K0 from re-analysis of giant monopole resonance data[21].
of state limits the effect of the density dependence of thesymmetry energy. It can be understood since especially athigh densities the contribution of symmetry energy to thetotal value of single particle potential is only a small partof the term corresponding to the stiff equation of state.Thus the effect of the density dependence of the symme-try energy can be expected to be more prominent whenusing the softer equations of the state.
In an attempt to obtain more strict constraints we de-cided to explore also higher beam energies up to 10 AGeV.As mentioned above, the kinematics of the particles istreated fully relativistically, and thus the code can be usedin principle. However, above 1 AGeV one can expect thatnon-elastic (non-nucleonic) channels will start to play role.Simulation, used in previous cases, considers only a dom-inant non-nucleonic channel, inelastic production and ab-sorption of the ∆-resonance, with the corresponding crosssections as given in [6]. Besides ∆, ther potentially im-portant hadronic channels are channels with productionof strange Σ and Λ hyperons, along with production ofstrange K-mesons. These channels are introduced into ourBUU simulation, using the calculated cross sections fromwork [26].
Results from the VdWBUU simulations show that thedirected flow at 10 AGeV is not reproduced neither by thesoft (K0=202 MeV) nor by the stiff (K0=380 MeV) equa-tion of state. Only the intermediate EoS with K0=272MeV allows to reproduce the directed flow. The fBUUsimulation with K0=272 MeV and with nucleon-nucleoncross sections of Cugnon et al. [6]. results in directed flowat 10 AGeV which can not reproduce experimental value.Instead of the weakly positive directed flow a strong neg-ative flow is observed, due to overestimation of stoppingin the nuclear matter.
The results of the flow analysis are summarized in theFigure 5. The range of the possible stiffness of the EoScan be identified, based on the analysis presented here, as
encompassing incompressibilities K0 = 245 − 315 MeV,in agreement with the results of recent re-analysis of thedata from giant monopole resonance [21], a process occur-ing close to saturation density, where the range of K0 =250 - 310 MeV (shown as dotted area in Figure 5) wasdetermined after modification of the fitting procedure,used to determine incompressibility, higher than earlierconstrained softer values between 200 - 240 MeV. Thusthe values of incompressibility obtained at different den-sity ranges appear to be in agreement, Also the recentre-analysis of the determination of the neutron star radiiappears to lead to larger radii with lower limit around 14km [27] and thus to favor stiffer equation of the state. Fur-thermore, also the relatively thick neutron skin of 208Pb,reported by the PREX experiment [28,29], appears to fa-vor a stiffer equation of state [30].
4 Transition from three-dimensional to
one-dimensional phase space as a signal of
phase transition and rate of entropy
production in ultra-relativistic heavy-ion
collisions
Charged particle multiplicity data from nucleus-nucleuscollisions obtained in last decades at SPS, RHIC and LHCshow an interesting feature. The dependence of chargedparticle multiplicity on number of participating nucleonsNpart does not change from
√sNN = 0.008 TeV [31] to√
sNN = 5.02 TeV [32]. Such trend suggests that despitelarge differences in centre-of-mass energy the productionof particles is governed by similar underlying productionmechanisms, characterized by Npart.
At lower energies below the onset of deconfinement,production of charged particles occurs via nucleon-nucleoncollisions. E.g. when colliding two nuclei (in center of massframe), the energy available for production of emitted par-ticles in nucleon-nucleon collisions is proportional to beamenergy in the c.m. frame
√sNN. Thus it appears natural
that their number will scale with beam energy. Of coursealso available phase space will play role, however such scal-ing is typical for statistical models, e.g statistical boot-strap model for hadron production [33,34]. This regimewith Nπ proportional to
√sNN can thus be expected for
resonant hadronic gas.Indeed, as shown in Fig. 6 the experimental data on
dNch/dη tend to follow√sNN-scaling in the region below
7 GeV, for the AGS (E802/E917) [38,39] data up to theSPS [40,41] and low-energy RHIC [31]. We acknowledgethe results from SIS by FOPI Collaboration [46] but we donot consider those as they are too close to pion emissionthreshold.
The observed√sNN scaling validates the 3D phase
space scenario described above. However, at higher en-ergies, at about 10 GeV the
√sNN-scaling clearly breaks
down and experimental multiplicity starts to grow muchslower. It appears, that scenario considering only two-body collisions is no longer valid there. As an alterna-tive to two-body collision scenario it can be assumed,
user
Text Box
M. Veselsky et al.: EoS studies in heavy ion collisions: from Coulomb barrier to LHC 73

6
Fig. 6. Excitation function of pseudorapidity density ofcharged particles per participating nucleon pair in heavy-ioncollisions [40,38,39,41,42,32,43–45,31]. Data points are formost central collisions. See text for more details.
Fig. 7. Same as Fig. 6 but shown with linear multiplicity axisemphasizing the comparison of the parametrizations of the ex-citation functions at the LHC energies.
that at high energies pions are produced by fragmenta-tion of strings between two participant quarks, in thefashion described e.g. by Lund model [35,36]. This im-plies that while available phase space does not changedramatically, it will be filled in a different way. The occu-pation of space in transverse directions is determined bythe number of participating quarks, and only the directionparallel to the beam represents the available phase space.Then one can expect that number of pions will scale with√sNN
1/3. The above trend is indeed observed experimen-tally, as shown in Fig. 6 for most central collisions. The√s1/3
scaling (solid line) is observed in the region rang-ing from the SPS, through RHIC, up to the data from
the LHC. The agreement with the simple√sNN
1/3 scal-
ing over the broad range of energies leads us to claimthat the formation of QGP is present in collisions from√sNN = 0.01 TeV on. Moreover, the transition between
the two,√sNN and
√sNN
1/3 regimes is correlated withthe deconfinement phase transition. In Fig. 6 and Fig. 7the function derived by the PHOBOS Collaboration pro-portional to ln
√sNN
2 [47] is fitted to data points from thePHENIX Collaboration [31], it however can not reproducethe data points obtained at LHC energies (see Fig. 7).
In Fig. 8 the PHENIX data points correspond to cen-trality selection of 35-40%. For CMS and ATLAS twopoints (for each) are shown: 30-35% and 35-40%, whilefor ALICE the centrality selection is 30-40%. The linefor f = 0.15 (with negligible error) is a result of a fitto RHIC data for
√sNN > 20 GeV. The line for f = 0.1
is to guide the eye - a good match at the LHC top energy.Grey dashed lines are to guide the eye and correspond tothe lines for most central events shown in Fig. 6 and Fig.
7. It is apparent that√sNN
1/3 scaling is preserved also insemi-peripheral collisions.
Taking that entropy production is proportional to par-
ticle production, the√sNN
1/3 dependence of charged par-ticle multiplicity seen in data implies that a limiting rate ofentropy production was reached in high-energy heavy-ioncollisions. In thermodynamics it is postulated that systemevolves toward maximum entropy. For instance, statisticalbootstrap model [33,34], leading to linear multiplicity de-pendence, corresponds to maximum entropy growth whiletemperature reaches limit. Instead, it is observed that themaximum achievable particle production and thus entropygrows considerably slower, possibly proportionally to timeof expansion into freezeout volume in only one dimension.In this context we note that the transverse energy follows
a trend, similar to√sNN
1/3 scaling [31]. The proportion-ality factor between ET and Nπ grows relatively slowly
(√s0.08
) and thus increase of mean energy of emitted par-ticles do not compensate for missing multiplicity. Thus thelimitation on production of entropy appears real.
Moreover, we project that the search for the end-pointat lower energies (E between 4 and 15 GeV) of the secondorder phase transition can benefit from studies of particleproduction between the multiplicity bins rather than fromtedious variations of the beam energy. On the other hand,we claim that the most interesting region is at the crossing
between the linear dependence and√sNN
1/3 of the multi-plicity density. From our investigations it lies somewherebetween
√sNN = 0.007 TeV and
√sNN = 0.015 TeV. An-
other interesting aspect is a prediction of particle pro-duction for the energies much larger than the LHC. Cur-rent considerations of a future accelerators, such as FutureCircular Collider [48], consider energies of 40 TeV in thecentre-of-mass. While such an increase in energy does notyet warrant existence of new type of QGP it will be mostinteresting how strongly the dNch/dη/Npart/2 differs from
the√sNN
1/3 dependence.
user
Text Box
M. Veselsky et al.: EoS studies in heavy ion collisions: from Coulomb barrier to LHC 74
7
Fig. 8. Excitation function of pseudorapidity density ofcharged particles per participating nucleon pair in semi-centralheavy-ion collisions [42,32,43,44,31]. See text for details.
Acknowledgements
This work is supported by the Slovak Scientific GrantAgency under contract 2/0129/17, by the Slovak Researchand Development Agency under contract APVV-15-0225(M.V.), in part by the Major State Basic Research Devel-opment Program in China under Contract No. 2014CB845400,the National Natural Science Foundation of China un-der contract Nos. 11421505 and 11520101004 (Y.G.M.),by ELKE account No 70/4/11395 of the National andKapodistrian University of Athens (G.S.), and by the U.S.Department of Energy, Office of Science, Office of NuclearPhysics, under contract DE-AC02-05CH11231.
References
1. S. Hofmann, Rep. Prog. Phys. 61, 639 (1998).2. Yu. Ts. Oganessian and V. K. Utyonkov, Rep. Prog. Phys.78, 036301 (2015).
3. M. Veselsky, J.Klimo, Y.G. Ma and G.A. Souliotis, Phys.Rev. C 94, 064608 (2016).
4. G.F. Bertsch, H. Kruse and S. Das Gupta, Phys. Rev. C29, 673 (1984).
5. H. Kruse, B. V. Jacak and H. Stocker, Phys. Rev. Lett. 54,289 (1985).
6. J. Cugnon, T. Mizutani and J. Vandermeulen, Nucl. Phys.A 352, 505 (1981).
7. M. Veselsky and Y.G. Ma, Phys. Rev. C 87, 034615 (2013).8. R. Bock et al., Nucl. Phys. A 388, 334 (1982).9. E. Prokhorova et al., Nucl. Phys. A 802, 45 (2008).10. G.N. Knyazheva et al., PEPAN Letters 5, 91 (2008).11. M.G. Itkis et al., Nucl. Phys. A 787, 150c (2007).12. E.M. Kozulin et al., Phys. Lett. B 686, 227 (2010).13. M. Veselsky, Acta Phys. Slovaca 49, 101 (1999).14. M. Veselsky, Phys. Atom. Nucl. 66, 1086 (2003); Yad. Fiz.66, 1122 (2003).
15. G.G. Adamian, N.V. Antonenko and W. Scheid, Nucl.Phys. A 618, 176 (1997).
16. V. Zagrebaev and W. Greiner, J. Phys. G 31, 825 (2005).17. Y. Aritomo et al., Phys. Rev. C 85, 044614 (2012).18. N. Wang, Z. Li, and X. Wu, Phys. Rev. C 65, 064608(2002).
19. C. Golabek and C. Simenel, Phys. Rev. Lett. 103, 042701(2009).
20. D. H. Youngblood, H. L. Clark, and Y.-W. Lui, Phys. Rev.Lett. 82, 691 (1999).
21. J.R. Stone, N.J. Stone and S.A. Moszkowski, Phys. Rev.C 89, 044316 (2014).
22. J. Piekarewicz, Eur. J. Phys. A 50, 25 (2014).23. B.A. Li, L.W. Chen, and C.M. Ko, Physics Reports 464,113 (2008).
24. N. Herrmann, J. P. Wessels, and T. Wienold, Ann. Rev.Nucl. Part. Sci. 49, 581 (1999).
25. A. Andronic, J. Lukasik, W. Reisdorf, and W. Trautmann,Eur. Phys. J. 30, 31 (2006).
26. G.Q. Li, and C.M. Ko, Nucl. Phys. A 594, 439 (1995).27. V. Suleimanov, J. Poutanen, M. Revnivtsev and K.Werner, Astrophys. J. 742, 122 (2011).
28. S. Abrahamyan et al., Phys. Rev. Lett. 108, 112502 (2012).29. C. Horowitz et al., Phys. Rev. C 85, 032501 (2012).30. F.J. Fattoyev and J. Piekarewicz, Phys. Rev. Lett. 111,162501 (2013).
31. A. Adare et al. (PHENIX), Phys. Rev. C 93, 024901(2016).
32. J. Adam et al. (ALICE), Phys. Rev. Lett. 116, 222302(2016).
33. R. Hagedorn, Nuovo Cim. Suppl. 3, 147 (1965).34. S. Frautschi, Phys. Rev. D 3, 2821 (1971).35. B. Andersson, G. Gustafson, and C. Peterson, Zeitschriftfur Physik C Particles and Fields 1, 105 (1979).
36. B. Andersson, The Lund Model, Cambridge UniversityPress, 1998.
37. K. Aamodt et al. (ALICE), Phys. Lett. B 696, 328, (2011).38. L. Ahle et al. (E-802), Phys. Rev. C 59, 2173 (1999).39. L. Ahle et al. (E917, E866), Phys. Lett. B 490, 53 (2000).40. S. V. Afanasiev et al., Nucl. Phys. A 715, 161 (2003).41. M. C. Abreu et al. (NA50), Phys. Lett. B 530, 43 (2002).42. K. Aamodt et al. (ALICE), Phys. Rev. Lett. 106, 032301(2011).
43. G. Aad et al. (ATLAS), Phys. Lett. B 710, 363 (2012).44. S. Chatrchyan et al. (CMS),JHEP 08, 141 (2011).45. S. S. Adler et al. (PHENIX), Phys. Rev. C 71, 034908(2005).
46. W. Reisdorf et al. (FOPI), Nucl. Phys. A 612, 493 (1997).47. B. Alver et al. (PHOBOS), Phys. Rev. C 83, 024913(2011).
48. A. Dainese et al., (2016), arXiv:1605.01389 [hep-ph].49. H. Fujii, and K. Itakura, Nucl. Phys. A 809, 88 (2008).
Powered by TCPDF (www.tcpdf.org)Powered by TCPDF (www.tcpdf.org)Powered by TCPDF (www.tcpdf.org)Powered by TCPDF (www.tcpdf.org)Powered by TCPDF (www.tcpdf.org)Powered by TCPDF (www.tcpdf.org)
user
Text Box
M. Veselsky et al.: EoS studies in heavy ion collisions: from Coulomb barrier to LHC 75
Production of neutron‐rich isotopes toward the astrophysical r‐process path
G.A. Souliotisa,∗, A. Papageorgioua, Y.K. Kwonb, K. Tshoob, M. Veselskyc, A. Bonaserad,e
a Laboratory of Physical Chemistry, Department of Chemistry, National and Kapodistrian University of Athens, Athens,
Greece
b The Rare Isotope Science Project (RISP), Institute for Basic Science, Daejeon, Korea
c Institute of Physics, Slovak Academy of Sciences, Bratislava, Slovakia
d Cyclotron Institute, Texas A&M University, College Station, Texas, USA e Laboratori Nazionali del Sud, INFN, Catania, Italy
∗ Corresponding author. Email: [email protected]
Abstract. The production cross sections of neutron-rich rare isotopes from collisions of 86Kr projectiles with 64,58Ni and 124,112Sn targets at 15 and 25 MeV/nucleon are pre-sented. Our experimental data are compared with calculations employing a two-step approach. The dynamical stage of the projectile-target interaction was described with either the phenomenological deep-inelastic transfer (DIT) model or the mi-croscopic constrained molecular dynamics model (CoMD). For the de-excitation of projectile-like fragments, the statistical multifragmentation model (SMM) as well as the binary-decay code GEMINI were employed. A satisfactory agreement of the calculations with the experimental data was obtained. We conclude that our current understanding of the reaction mechanism at beam energies below the Fermi energy suggests that such nuclear reactions, involving peripheral nucleon exchange, can be exploited as an effective route to access extremely neutron-rich isotopes toward the r-process path and the neutron drip-line.
1 Introduction
The limits of the nuclear landscape toward the astrophysical r-process path and the neutron drip-line have recently received special attention by the nu-clear physics community (see, e.g., [1,2] and references therein). Closely related to this development is the efficient production of very neutron-rich nuclides which constitutes a central issue in current and upcoming rare isotope beam facilities (see, e.g., [3–12]).
Neutron-rich nuclides are mainly produced by spallation, fission and projectile fragmentation [13]. Spallation is an efficient mechanism to produce rare isotopes for ISOL-type techniques [14]. Projectile fission is appropriate in the region of light and heavy fission fragments (see, e.g., [15] for recent efforts on 238U projectile fission). Finally, projectile fragmentation offers a universal approach to produce exotic nuclei at beam energies above 100 MeV/nucleon (see, e.g., [16,17]). This approach is, nevertheless, based on the fact that optimum neutron excess in the fragments is achieved by stripping the maximum possible number of protons (and a minimum possible number of neutrons).
To reach a high neutron-excess in the products, apart from proton stripping, it is necessary to capture neutrons
from the target. Such a possibility is offered by reactions of nucleon exchange at beam energies from the Coulomb barrier [18,19] to the Fermi energy (20–40 MeV/nucleon) [20,21]. Detailed experimental data in this broad energy range are scarce at present [19,22,23]. In multinucleon transfer and deep-inelastic reactions near the Coulomb barrier [19], the low velocities of the fragments and the wide angular and ionic charge state distributions may limit the collection efficiency for the most neutron-rich products. The reactions in the Fermi energy regime combine the advantages of both low-energy (i.e., near and above the Coulomb barrier) and high-energy (i.e., above 100 MeV/nucleon) reactions. At this energy, the synergy of the projectile and the target enhances the N/Z of the fragments, while the velocities are high enough to allow efficient in-flight collection and separation.
Our initial experimental studies of projectile fragments from 25 MeV/nucleon reactions of 86Kr on 64Ni [20] and 124Sn [21] indicated substantial production of neutron-rich fragments. Motivated by recent developments in several fa-cilities that will offer either very intense primary beams [5,8] at this energy range or re-accelerated rare isotope beams [4,5,8,9], we continued our experimental studies at 15 MeV/nucleon [24]. In this contribution, after a short overview of the experimental measurements, we present a
user
Text Box
76
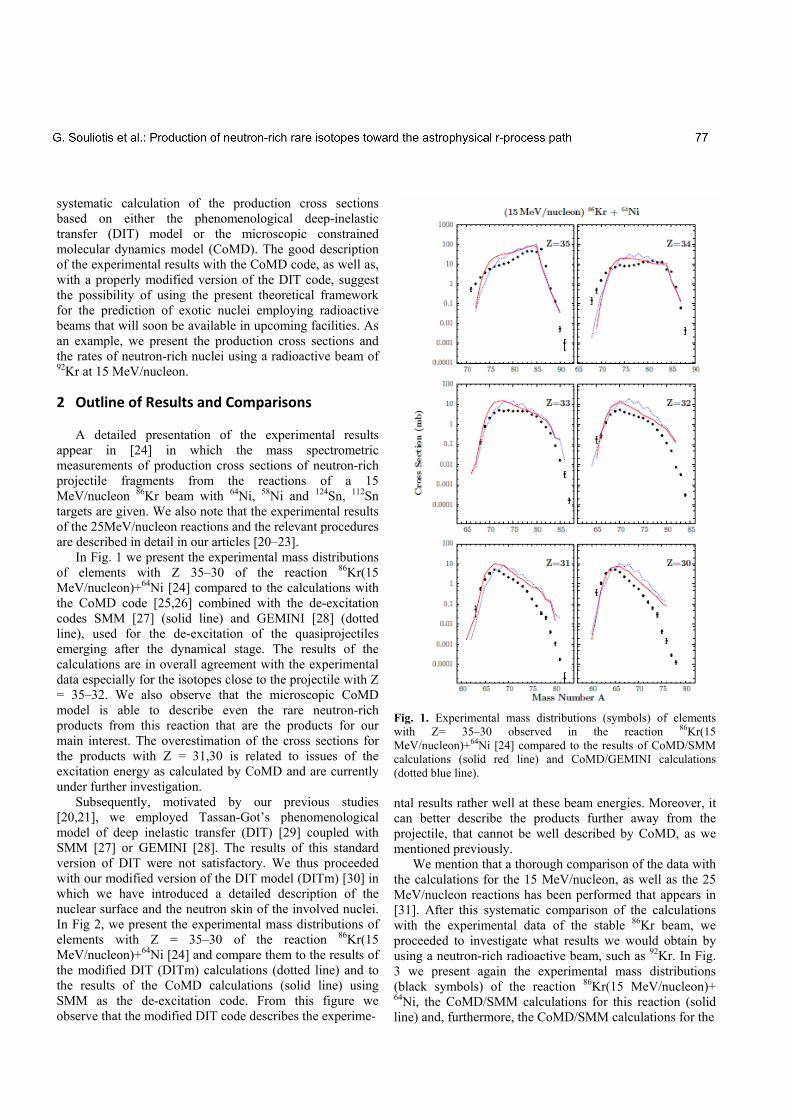
systematic calculation of the production cross sections based on either the phenomenological deep-inelastic transfer (DIT) model or the microscopic constrained molecular dynamics model (CoMD). The good description of the experimental results with the CoMD code, as well as, with a properly modified version of the DIT code, suggest the possibility of using the present theoretical framework for the prediction of exotic nuclei employing radioactive beams that will soon be available in upcoming facilities. As an example, we present the production cross sections and the rates of neutron-rich nuclei using a radioactive beam of 92Kr at 15 MeV/nucleon. 2 Outline of Results and Comparisons
A detailed presentation of the experimental results appear in [24] in which the mass spectrometric measurements of production cross sections of neutron-rich projectile fragments from the reactions of a 15 MeV/nucleon 86Kr beam with 64Ni, 58Ni and 124Sn, 112Sn targets are given. We also note that the experimental results of the 25MeV/nucleon reactions and the relevant procedures are described in detail in our articles [20–23].
In Fig. 1 we present the experimental mass distributions of elements with Z 35–30 of the reaction 86Kr(15 MeV/nucleon)+64Ni [24] compared to the calculations with the CoMD code [25,26] combined with the de-excitation codes SMM [27] (solid line) and GEMINI [28] (dotted line), used for the de-excitation of the quasiprojectiles emerging after the dynamical stage. The results of the calculations are in overall agreement with the experimental data especially for the isotopes close to the projectile with Z = 35–32. We also observe that the microscopic CoMD model is able to describe even the rare neutron-rich products from this reaction that are the products for our main interest. The overestimation of the cross sections for the products with Z = 31,30 is related to issues of the excitation energy as calculated by CoMD and are currently under further investigation.
Subsequently, motivated by our previous studies [20,21], we employed Tassan-Got’s phenomenological model of deep inelastic transfer (DIT) [29] coupled with SMM [27] or GEMINI [28]. The results of this standard version of DIT were not satisfactory. We thus proceeded with our modified version of the DIT model (DITm) [30] in which we have introduced a detailed description of the nuclear surface and the neutron skin of the involved nuclei. In Fig 2, we present the experimental mass distributions of elements with Z = 35–30 of the reaction 86Kr(15 MeV/nucleon)+64Ni [24] and compare them to the results of the modified DIT (DITm) calculations (dotted line) and to the results of the CoMD calculations (solid line) using SMM as the de-excitation code. From this figure we observe that the modified DIT code describes the experime-
Fig. 1. Experimental mass distributions (symbols) of elements with Z= 35–30 observed in the reaction 86Kr(15 MeV/nucleon)+64Ni [24] compared to the results of CoMD/SMM calculations (solid red line) and CoMD/GEMINI calculations (dotted blue line). ntal results rather well at these beam energies. Moreover, it can better describe the products further away from the projectile, that cannot be well described by CoMD, as we mentioned previously.
We mention that a thorough comparison of the data with the calculations for the 15 MeV/nucleon, as well as the 25 MeV/nucleon reactions has been performed that appears in [31]. After this systematic comparison of the calculations with the experimental data of the stable 86Kr beam, we proceeded to investigate what results we would obtain by using a neutron-rich radioactive beam, such as 92Kr. In Fig. 3 we present again the experimental mass distributions (black symbols) of the reaction 86Kr(15 MeV/nucleon)+ 64Ni, the CoMD/SMM calculations for this reaction (solid line) and, furthermore, the CoMD/SMM calculations for the
user
Text Box
G. Souliotis et al.: Production of neutron-rich rare isotopes toward the astrophysical r-process path 77
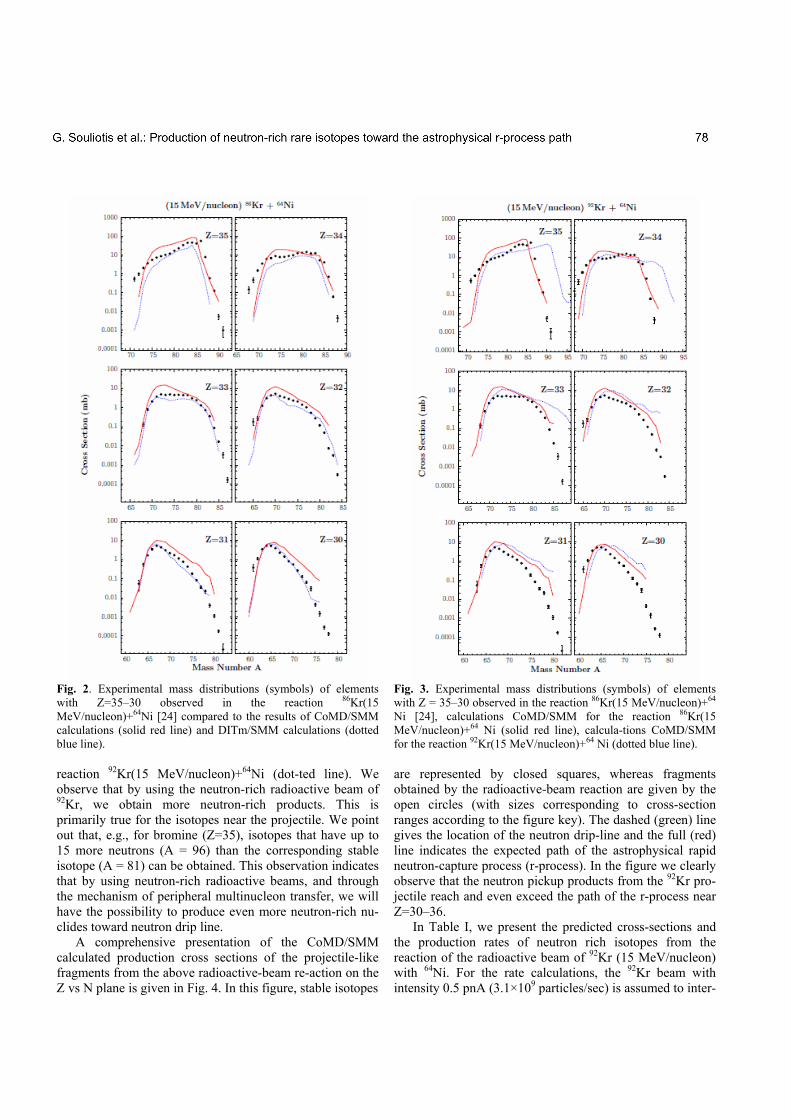
Fig. 2. Experimental mass distributions (symbols) of elements with Z=35–30 observed in the reaction 86Kr(15 MeV/nucleon)+64Ni [24] compared to the results of CoMD/SMM calculations (solid red line) and DITm/SMM calculations (dotted blue line). reaction 92Kr(15 MeV/nucleon)+64Ni (dot-ted line). We observe that by using the neutron-rich radioactive beam of 92Kr, we obtain more neutron-rich products. This is primarily true for the isotopes near the projectile. We point out that, e.g., for bromine (Z=35), isotopes that have up to 15 more neutrons (A = 96) than the corresponding stable isotope (A = 81) can be obtained. This observation indicates that by using neutron-rich radioactive beams, and through the mechanism of peripheral multinucleon transfer, we will have the possibility to produce even more neutron-rich nu-clides toward neutron drip line.
A comprehensive presentation of the CoMD/SMM calculated production cross sections of the projectile-like fragments from the above radioactive-beam re-action on the Z vs N plane is given in Fig. 4. In this figure, stable isotopes
Fig. 3. Experimental mass distributions (symbols) of elements with Z = 35–30 observed in the reaction 86Kr(15 MeV/nucleon)+64 Ni [24], calculations CoMD/SMM for the reaction 86Kr(15 MeV/nucleon)+64 Ni (solid red line), calcula-tions CoMD/SMM for the reaction 92Kr(15 MeV/nucleon)+64 Ni (dotted blue line). are represented by closed squares, whereas fragments obtained by the radioactive-beam reaction are given by the open circles (with sizes corresponding to cross-section ranges according to the figure key). The dashed (green) line gives the location of the neutron drip-line and the full (red) line indicates the expected path of the astrophysical rapid neutron-capture process (r-process). In the figure we clearly observe that the neutron pickup products from the 92Kr pro-jectile reach and even exceed the path of the r-process near Z=30–36.
In Table I, we present the predicted cross-sections and the production rates of neutron rich isotopes from the reaction of the radioactive beam of 92Kr (15 MeV/nucleon) with 64Ni. For the rate calculations, the 92Kr beam with intensity 0.5 pnA (3.1×10⁹ particles/sec) is assumed to inter-
user
Text Box
G. Souliotis et al.: Production of neutron-rich rare isotopes toward the astrophysical r-process path 78

Fig. 4. Representation of CoMD/SMM calculated production cross sections of projectile fragments from the radioactive-beam reaction 92Kr (15 MeV/nucleon) + 64Ni on the Z–N plane. The cross section ranges are shown by open circles according to the key. The closed squares show the stable isotopes. The solid (red) line shows the astrophysical r-process path and the dashed (green) line shows the location of the neutron drip-line. The horizontal and vertical dashed lines indicate, respectively, the proton and neutron number of the 92Kr projectile.
Table 1. Cross sections and rate estimates (last column) of very neutron-rich isotopes from the reaction 92Kr (15 MeV/nucleon) + 64Ni. For the rates, a radioactive beam of 92Kr with intensity 0.5 pnA (3.1×10⁹ particles/sec) is assumed to interact with a 64Ni target of 20 mg/cm2 thickness.
Rare Isotope
Reaction Channel
Cross Section (mb)
Rate (sec-1)
93Kr -0p+1n 18.8 1.1×10⁴ 94Kr -0p+2n 2.3 1.3×10³
95Kr -0p+3n 0.63 3.8×10²
96Kr -0p+4n 0.2 1.2×10²
92Br -1p+1n 4.5 2.7×10³
93Br -1p+2n 0.75 4.5×10²
94Br -1p+3n 0.078 47 95Br -1p+4n 0.040 23 96Br -1p+5n 0.008 5 90Se -2p+0n 2.7 1.6×10³
91Se -2p+1n 0.6 3.5×10²
92Se -2p+2n 0.12 70 93Se -2p+3n 0.04 23
ract with a 64Ni target of 20 mg/cm2 thickness. We see that we have the possibility to produce extremely neutron-rich isotopes in these energies with the use of re-accelerated
radioactive beams, such as 92Kr, that will be available in upcoming rare-isotope facilities (e.g. [10,11]).
In this respect, we have plans to continue the present work at Texas A&M University (with the MARS separator) at LNS/Catania (using beams from the S800 Cyclotron and the MAGNEX spectrometer) and, in the future, at RISP/Korea (employing beams from the RAON accelerator complex and the KOBRA separator).
3 Summary and Conclusions
In summary, we performed a systematic study of the production cross sections of projectile-like fragments from collisions of 86Kr projectiles with 64,58Ni and Sn targets at 15 and 25 MeV/nucleon with emphasis on the neutron-rich isotopes. We noted that neutron pick-up isotopes (with up to 6-8 neutrons picked-up from the target) were observed with large cross sections. Our experimental data were compared with systematic calculations employing a two-step approach. The calculations for the dynamical stage of the projectile-target interaction were carried out using either the phenomenological deep-inelastic transfer (DIT) model or the microscopic constrained molecular dynamics model (CoMD). For the de-excitation of the projectile-like fragments, the statistical multifragmentation model (SMM) or the binary-decay code GEMINI were employed. An overall good agreement with the experimental results was observed. With the current understanding of the reaction mechanism at these beam energies, we suggest that these nuclear reactions, involving peripheral nucleon exchange, be exploited as an efficient route to access neutron-rich rare isotopes toward the r-process path and the neutron drip-line. Therefore, future experiments in several accelerator facilities [13] can be planned that will en-able a variety of nuclear structure and nuclear reaction studies in unexplored regions of the nuclear chart. References 1. J. Erler et al, Nature 486, 509 (2001). 2. J. Aysto, W. Nazarewicz, M. Pf¨utzner, C. Signorini, eds,
Proceedings of the Fifth International Conference on Exotic Nuclei and Atomic Masses (ENAM’08), Ryn, Poland, September 7–13 (2008); Eur. Phys. J. A 42 (2009).
3. D. F. Geesaman, C. K. Gelbke, R. V. F. Janssens, B. M. Sherrill, Ann. Rev. Nucl. Part. Sci. 56, 53 (2006).
4. FRIB main page: www.frib.msu.edu 5. GANIL main page: www.ganil.fr 6. GSI main page: www.gsi.de 7. RIBF main page: www.rarf.riken.go.jp/Eng/facilities/RIBF.html 8. ATLAS main page: www.phy.anl.gov/atlas/facility/index.html 9. EURISOL main page: www.eurisol.org 10. RISP main page: www.risp.re.kr/eng/pMainPage.do 11. K. Tshoo, Y. K. Kim, Y. K. Kwon et al, Nucl. Instrum.
Methods B 317, 242 (2013).
user
Text Box
G. Souliotis et al.: Production of neutron-rich rare isotopes toward the astrophysical r-process path 79
12.K. Tshoo, H. Chae, J. Park, J.Y. Moon, Y.K. Kwon, G.A. Souliotis et al, Nucl. Instrum. Methods B 376, 188 (2016).
13.Y. Blumenfeld, T. Nilsson and P. Van Duppen, Phys. Scr. T152 014023 (2013).
14. A. Keli´c, M. V. Ricciardi, K. -H. Schmidt, BgNS Transactions 13, 98 (2009).
15. H. Alvarez-Pol et al., Phys. Rev. C 82, 041602 (2010). 16. O. B. Tarasov et al., Phys. Rev. C 80, 034609 (2009). 17. S. Lukyanov et al., Phys. Rev. C 80, 014609 (2009). 18. V. V. Volkov, Phys. Rep. 44, 93 (1978). 19. L. Corradi, G. Pollarolo, S. Szilner, J. Phys. G 36, 113101
(2009). 20. G. A. Souliotis et al., Phys. Lett. B 543, 163 (2002). 21. G. A. Souliotis et al., Phys. Rev. Lett. 91, 022701 (2003). 22. G. A. Souliotis et al., Nucl. Instrum. Methods B 204, 166
(2003). 23. G. A. Souliotis et al., Nucl. Instum. Methods B 266, 4692
(2008). 24. G. A. Souliotis et al., Phys. Rev. C 84, 064607 (2011). 25. M. Papa et al., Phys. Rev. C 64, 024612 (2001). 26. M. Papa et al, J. Comp. Phys. 208, 403 (2005). 27. J. Bondorf et al., Phys. Rep. 257, 133 (1995). 28. R. Charity et al., Nucl. Phys. A 483, 391 (1988); Phys. Rev. C
58, 1073 (1998). 29. L. Tassan-Got and C. Stephan, Nucl. Phys. A 524, 121 (1991). 30. M. Veselsky and G.A. Souliotis, Nucl. Phys. A 765, 252
(2006). 31. P.N. Fountas, G.A. Souliotis, M. Veselsky and A. Bonasera,
Phys. Rev. C 90, 064613 (2014).
user
Text Box
G. Souliotis et al.: Production of neutron-rich rare isotopes toward the astrophysical r-process path 80

Fission in High‐Energy Proton‐Induced Spallation Reactions: Recent Progress Nikolaos G. Nicolis1, A. Asimakopoulou2 and G.A. Souliotis2
1Department of Physics, The University of Ioannina, Ioannina 45110, Greece
2Laboratory of Physical Chemistry, Department of Chemistry, University of Athens, Athens, Greece
Abstract. A number of projects of current interest such as transmutation of nuclear waste, neutron sources, radiation damage in space etc. require a detailed modeling of spallation reactions induced by high-energy protons. For a phenomenological description of spallation reactions, we couple the results of the intranuclear cascade model ISABEL with evaporation calculations performed with the statistical model codes SMM and MECO incorporating symmetric fission. Preliminary results of 200, 500 and 1000MeV protons on 208Pb targets are compared with experimental data. Extension of our calculations to describe the reaction mechanism is discussed.
1 Introduction
The study of nucleon-induced spallation reactions is a topic of extensive experimental and theoretical studies due to their importance in basic and applied Nuclear Science. Spallation reactions have numerous applications in accelerator-driven systems (ADS), transmutation of nuclear waste, spallation neutron sources and the production of rare isotopes. Astrophysics and space research also benefits from this research due to implications in interaction of cosmic rays with interstellar bodies and radiation damage of electronic devices in space. Last but not least, this type of reactions provides a framework for testing high-energy nuclear reaction models in the bombarding energy range above 150-200 MeV [1].
A proton-induced spallation reaction (SR) proceeds in two stages. In the first stage, the incident particle interacts with the nucleons of the target in a sequence of collisions. As a result, we have the formation of an intranuclear cascade (INC) of high-energy (greater than 20 MeV) protons, neutrons and pions within the nucleus. This is a fast process lasting approximately 10-22s. During the intranuclear cascade, some of these energetic hadrons escape from the target. Others deposit their kinetic energy in the nucleus leaving it in an excited state. In the second stage, the produced excited nuclear species deexcite. Sequential evaporation is assumed to be the dominant process with a typical time scale of 10-8s – 10-6s. Emission of nucleons, protons, alpha-particles and gamma-rays is dominant. Emission of heavier nucleon clusters in their
ground or excited states is also possible. If the target is heavy enough, high-energy fission may compete with sequential evaporation. The deexcitation products of target-like and/or fission fragments may be radioactive. In the case of thick target experiments, the secondary high-energy particles produced in the INC phase move roughly in the same direction as the incident proton and induce secondary spallation reactions. In such a case, a hadronic cascade is observed as a result of an accumulation of all reactions initiated by the primary and secondary particles. In many applications it is desirable to have a reliable model description of the number of neutrons emitted in a spallation reaction, as well as associated observables like fission cross sections, mass and isotopic distributions of the reaction products.
In the present work we are concerned with the description of thin target experiments. Our objective is to describe proton-induced spallation reactions on 208Pb at 200, 500 and 1000 MeV. We choose a phenomenological approach in which we couple the results of an INC code with an evaporation code extended to describe high-energy symmetric fission. The employed nuclear reaction codes are briefly discussed in Section 2. In Section 3, results of preliminary calculations are compared with experimental data consisting of fission cross sections, neutron multiplicities, mass and isotopic distributions of evaporation residues and fission fragments. The results of two evaporation codes coupled to the same INC code input are compared in Section 4. A summary of our results is given in Section 5.
user
Text Box
81
2 Description of the nuclear reaction codes
For the description of the INC phase, we use the code ISABELE [2,3]. It is a well tested Monte-Carlo code with a long history of improvements. The target nucleus is simulated by a continuous medium bounded by a diffuse surface. Collisions between the incident nucleon and the nucleons of the target occur with a criterion based on the mean free path. Between successive collisions, linear trajectories are assumed. Free nucleon-nucleon cross sections are used. The code allows for elastic and inelastic N-N collisions. Furthermore, it takes full account of Pauli blocking i.e. interactions resulting in nucleon falling below the Fermi sea are forbidden. From a typical run we obtain the mass number (A), atomic number (Z) and excitation energy (E*) of the various nuclear species produced in the INC phase. The deexcitation stage is described with the codes SMM and MECO.
The SMM code [4,5,6] combines a description of sequential compound nucleus decay with a multifragmentation model. Equilibrium compound nucleus decay dominates at excitation energies E*<2-3 MeV/A. At higher energies, the importance of these processes diminishes and multifragment decay takes over. The fission decay channel is taken into account empirically, by producing fission fragment mass distributions with parameters adjusted to fit experimental data [6]. At E*>4 MeV/A, multifragmentation is expected to dominate. Thus, all possible decay processes occuring in the wide excitation energy range realized in a spallation reaction should be adequately taken into account.
The code MECO [7] is a multisequential binary decay code. It describes the equilibrium decay of excited nuclei as a sequence of binary division processes involving the emission of light particles, gamma rays and nucleon clusters in their ground, excited bound and unbound states. Emission of nucleons and progressively heavier clusters leading to symmetric mass divisions are calculated in a generalized Weisskopf evaporation formalism. The computational method is Monte-Carlo, thus allowing the simulation of experimental conditions. Also, it may accommodate any number of user-defined channels. MECO provides a complete description of compound nucleus decay of medium to low mass (A<100) systems and excitation energies E*<2-3 MeV/A.
In order to calculate the decay of heavy compound nuclei with MECO, we introduce a fission decay mode. At each decay step, we calculate the fission probability, as the ratio of the fission decay width over the sum of decay widths of all possible decay modes. We calculate the fission decay width according to the transition stage theory [8]. As
a first approximation, we assume symmetric mass divisions. The employed fission barrier heights correspond to a liquid drop model calculation including the finite range of nuclear forces [9]. It is well known that the standard theory of fission, just described underestimates the pre-fission neutron multiplicities. For this reason, we introduce a fission delay to account for the slowing effects of nuclear dissipation [10]. Our Bohr-Wheeler decay width was multiplied by the Kramer's reduction factor. The reduction parameter gamma was set equal to 5, a value suggested from fission studies of heavy-ion induced reactions [10].
Fission fragment masses are selected from a Gaussian distribution with an excitation energy dependent width, parametrized from experimental data [11]. Each fragment is assumed to have the same N/Z ratio as the parent nucleus. From the conservation of energy and linear momentum we obtain the kinetic energies of the two fragments. The excitation energy of the parent nucleus is divided among the two fragments in proportion to each fragment's mass, i.e. assuming equal temperatures. Then, we follow the particle decay of each fragment. 3 Comparisons with experimental data
Figure 1 shows the mass distributions of evaporation residues and fission fragments in 500MeV p + 208Pb spallation reactions. Experimental data (symbols) [12,13] are compared with calculations performed with the code ISABEL followed by SMM (open histogram) and MECO (solid line).
The ISABEL-SMM calculation describes well the plateau of the mass distribution of evaporation residues. However, it underpredicts the low-mass region of the distribution. The same calculation predicts two nearby broad mass peaks for the mass distribution of fission fragments, implying an excess of asymmetric fission. This is in contrast of the experimental data, which show a broad mass peak, centered at approximately A=97.
The ISABEL-MECO calculation, predicts a plateau for the evaporation residue mass distribution in agreement with the shape but a greater magnitude than the experimental data. It also underpredicts the low-mass region. For the mass distribution of the fission fragments, this calculation predicts a broad distribution with a centroid that agrees with experiment. This was expected, since the code takes only symmetric fission into account. However, the width of the experimental mass distribution is underestimated. Since the width of the mass distribution in MECO was calculated in accordance with systematics, this underprediction means that we need to consider the asymmetric mode of fission as well.
user
Text Box
N. Nicolis et al.: Fission in high-energy proton induced spallation reactions: Recent progress 82

Comparing SMM with MECO, we realize a rough agreement between the two codes in the description of the evaporation residue mass distribution. However, the two codes disagree with each other and both fail to describe fully the fission fragment mass distribution. The SMM code needs a symmetric fission component and MECO needs an asymmetric one. Charge distributions of evaporation residues and fission fragments calculated with the two codes were found consistent.
In Figure 2 we show the mass distributions of evaporation residues and fission fragments in 1000MeV p + 208Pb spallation reactions. The experimental data [14] are shown with symbols and compared with calculations performed with ISABEL-SMM (open histogram) and ISABEL-MECO (solid line).
The ISABEL-SMM calculation predicts well the plateau of the evaporation residue mass distribution but underestimates the low-mass region. The fission fragment
Fig. 1. Mass distributions of evaporation residues and fission fragments in spallation reactions of 500MeV p + 208Pb. Experimental data (symbols) are compared with calculations performed with the code ISABEL followed by SMM (open histogram) and MECO (solid line).
Fig. 2. Mass distributions of evaporation residues and fission fragments in spallation reactions of 1000MeV p + 208Pb. Experimental data (symbols) are compared with calculations performed with the code ISABEL followed by SMM (open histogram) and MECO (solid line).
user
Text Box
N. Nicolis et al.: Fission in high-energy proton induced spallation reactions: Recent progress 83
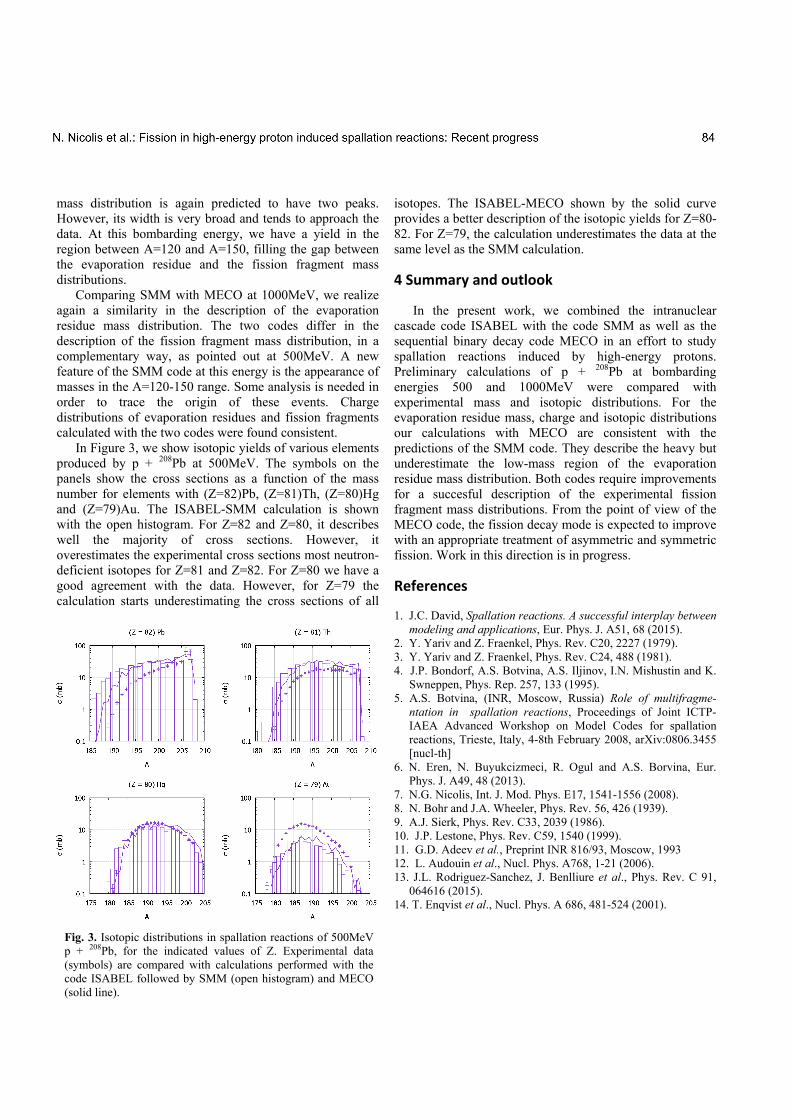
Fig. 3. Isotopic distributions in spallation reactions of 500MeV p + 208Pb, for the indicated values of Z. Experimental data (symbols) are compared with calculations performed with the code ISABEL followed by SMM (open histogram) and MECO (solid line).
mass distribution is again predicted to have two peaks. However, its width is very broad and tends to approach the data. At this bombarding energy, we have a yield in the region between A=120 and A=150, filling the gap between the evaporation residue and the fission fragment mass distributions.
Comparing SMM with MECO at 1000MeV, we realize again a similarity in the description of the evaporation residue mass distribution. The two codes differ in the description of the fission fragment mass distribution, in a complementary way, as pointed out at 500MeV. A new feature of the SMM code at this energy is the appearance of masses in the A=120-150 range. Some analysis is needed in order to trace the origin of these events. Charge distributions of evaporation residues and fission fragments calculated with the two codes were found consistent.
In Figure 3, we show isotopic yields of various elements produced by p + 208Pb at 500MeV. The symbols on the panels show the cross sections as a function of the mass number for elements with (Z=82)Pb, (Z=81)Th, (Z=80)Hg and (Z=79)Au. The ISABEL-SMM calculation is shown with the open histogram. For Z=82 and Z=80, it describes well the majority of cross sections. However, it overestimates the experimental cross sections most neutron-deficient isotopes for Z=81 and Z=82. For Z=80 we have a good agreement with the data. However, for Z=79 the calculation starts underestimating the cross sections of all
isotopes. The ISABEL-MECO shown by the solid curve provides a better description of the isotopic yields for Z=80-82. For Z=79, the calculation underestimates the data at the same level as the SMM calculation.
4 Summary and outlook
In the present work, we combined the intranuclear cascade code ISABEL with the code SMM as well as the sequential binary decay code MECO in an effort to study spallation reactions induced by high-energy protons. Preliminary calculations of p + 208Pb at bombarding energies 500 and 1000MeV were compared with experimental mass and isotopic distributions. For the evaporation residue mass, charge and isotopic distributions our calculations with MECO are consistent with the predictions of the SMM code. They describe the heavy but underestimate the low-mass region of the evaporation residue mass distribution. Both codes require improvements for a succesful description of the experimental fission fragment mass distributions. From the point of view of the MECO code, the fission decay mode is expected to improve with an appropriate treatment of asymmetric and symmetric fission. Work in this direction is in progress.
References
1. J.C. David, Spallation reactions. A successful interplay between modeling and applications, Eur. Phys. J. A51, 68 (2015).
2. Y. Yariv and Z. Fraenkel, Phys. Rev. C20, 2227 (1979). 3. Y. Yariv and Z. Fraenkel, Phys. Rev. C24, 488 (1981). 4. J.P. Bondorf, A.S. Botvina, A.S. Iljinov, I.N. Mishustin and K.
Swneppen, Phys. Rep. 257, 133 (1995). 5. A.S. Botvina, (INR, Moscow, Russia) Role of multifragme-
ntation in spallation reactions, Proceedings of Joint ICTP-IAEA Advanced Workshop on Model Codes for spallation reactions, Trieste, Italy, 4-8th February 2008, arXiv:0806.3455 [nucl-th]
6. N. Eren, N. Buyukcizmeci, R. Ogul and A.S. Borvina, Eur. Phys. J. A49, 48 (2013).
7. N.G. Nicolis, Int. J. Mod. Phys. E17, 1541-1556 (2008). 8. N. Bohr and J.A. Wheeler, Phys. Rev. 56, 426 (1939). 9. A.J. Sierk, Phys. Rev. C33, 2039 (1986). 10. J.P. Lestone, Phys. Rev. C59, 1540 (1999). 11. G.D. Adeev et al., Preprint INR 816/93, Moscow, 1993 12. L. Audouin et al., Nucl. Phys. A768, 1-21 (2006). 13. J.L. Rodriguez-Sanchez, J. Benlliure et al., Phys. Rev. C 91,
064616 (2015). 14. T. Enqvist et al., Nucl. Phys. A 686, 481-524 (2001).
user
Text Box
N. Nicolis et al.: Fission in high-energy proton induced spallation reactions: Recent progress 84

AMIAS: A Model Independent Analysis Scheme – FromHadronics to Medical Imaging
E. Stiliaris1,2 and C.N. Papanicolas1,2
1 Department of Physics, National and Kapodistrian University of Athens, Greece2 The Cyprus Institute, Nicosia, Cyprus
Abstract. AMIAS is a novel method for extracting physical parameters from experimental and simulationdata. The method is based on statistical concepts and it relies on Monte Carlo simulation techniques. Itidentifies and determines with maximal precision parameters that are sensitive to the data. The methodhas been extensively studied and it is shown to produce model independent results. It is applicable to awide range of scientific and engineering problems. The initial ideas on which the method relies and thefurther development of the model are presented. A brief review on the application of AMIAS in the analysisof experimental data in hadronic physics and of lattice QCD correlators, and most recently in the imagereconstruction of tomographic data, are introduced here.
PACS. 02.30.Zz Inverse problems – 21.60.Ka Monte Carlo methods in nuclear structure – 13.40.Gp Nuclearform factors – 13.60.Le Photoproduction of mesons – 12.38.Gc Lattice QCD calculations – 87.57.nf Medicalimage reconstruction
1 Introduction
A principal task in experimental and computational physicsconcerns the determination of the parameters of a the-ory (model) from experimental or simulation data. Exam-ples are abundant: the determination of the parametersof the Standard Model in Particle Physics, the multipoleamplitudes in Nucleon Resonance excitation in HadronicPhysics, the determination of the spectrum from correla-tors in Lattice QCD calculations, the parameters of acous-tic resonances in Cosmology, to mention a few.
The data from which information on parameters ofthe theory is to be extracted are characterized by sta-tistical uncertainties and systematic errors, are typicallyof limited dynamic range and sensitive only to a few ofthe model parameters, rendering this task difficult and of-ten intractable. Identifying which parameters of the modelcan be determined from the available data is often diffi-cult to prejudge and their extraction without bias is oftenimpossible. Particularly hard is the determination of thesystematic and model uncertainties that ought to be as-signed to the extracted values of the parameters.
We have addressed this problem via a method, which isknown as the Athens Model Independent Analysis Scheme,”AMIAS” [1]. This method is capable of extracting theory(model) parameters and their uncertainties from a set ofdata in a rigorous, precise, and unbiased way. The method-ology is first briefly presented and then subsequently ap-plied to two problems in Hadronic Physics, namely theextraction of the multipole excitation amplitudes for the
Nucleon resonances and in particular that of the first ex-cited state of the Nucleon, the ∆(1232) resonance and sec-ondly, the creation of the mass spectrum of hadrons fromEuclidean time correlators in lattice QCD simulations.In addition, the image reconstruction problem in Medi-cal Physics is also discussed in the framework of AMIAS.
2 AMIAS Methodology
The AMIAS method is applicable to problems in whichthe parameters to be determined are linked in an explicitway to the data through a theory or model. There is norequirement that this set of parameters are orthogonal;they can be subjected to constraints, e.g. by requiring thatunitarity is satisfied. The method requires that a quanti-tative criterion for the ”goodness” of a solution is chosenand thus far we have employed the χ2 criterion.
For a given theory any set of values for its parameters,satisfying its symmetries and constraints, provides a solu-tion having a finite probability of representing reality. Thisprobability can be quantified through a comparison to thedata being analyzed. Based on these concepts AMIAS canbe formulated as follows:
A set of parameters A1, A2, ..., AN ≡ Aν which com-pletely and explicitly describes a process within a the-ory, can be determined from a data set Vk ± εk,produced by this process, by noting that any arbitraryset of values aν
j for these parameters constitutes a
user
Text Box
85
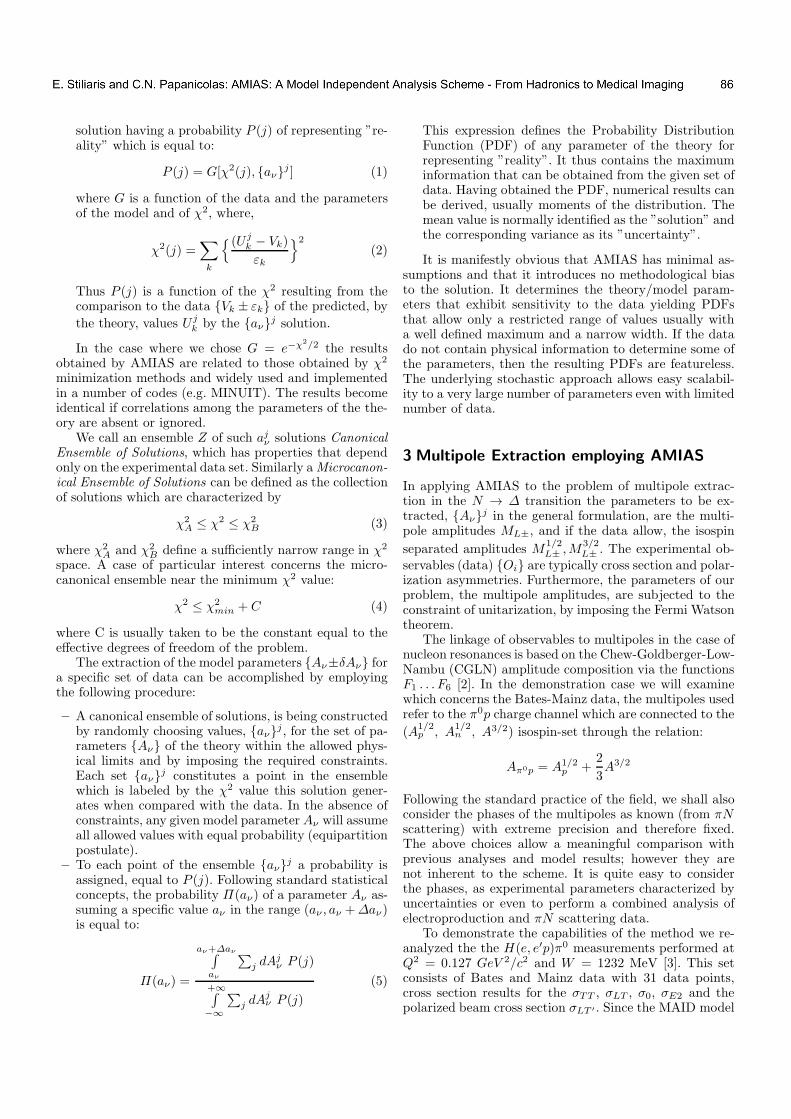
2
solution having a probability P (j) of representing ”re-ality” which is equal to:
P (j) = G[χ2(j), aνj ] (1)
where G is a function of the data and the parametersof the model and of χ2, where,
χ2(j) =∑
k
(U jk − Vk)
εk
2
(2)
Thus P (j) is a function of the χ2 resulting from thecomparison to the data Vk ± εk of the predicted, by
the theory, values U jk by the aν
j solution.
In the case where we chose G = e−χ2/2 the resultsobtained by AMIAS are related to those obtained by χ2
minimization methods and widely used and implementedin a number of codes (e.g. MINUIT). The results becomeidentical if correlations among the parameters of the the-ory are absent or ignored.
We call an ensemble Z of such ajν solutions CanonicalEnsemble of Solutions, which has properties that dependonly on the experimental data set. Similarly aMicrocanon-
ical Ensemble of Solutions can be defined as the collectionof solutions which are characterized by
χ2
A ≤ χ2 ≤ χ2
B (3)
where χ2
A and χ2
B define a sufficiently narrow range in χ2
space. A case of particular interest concerns the micro-canonical ensemble near the minimum χ2 value:
χ2 ≤ χ2
min + C (4)
where C is usually taken to be the constant equal to theeffective degrees of freedom of the problem.
The extraction of the model parameters Aν±δAν fora specific set of data can be accomplished by employingthe following procedure:
– A canonical ensemble of solutions, is being constructedby randomly choosing values, aν
j, for the set of pa-rameters Aν of the theory within the allowed phys-ical limits and by imposing the required constraints.Each set aν
j constitutes a point in the ensemblewhich is labeled by the χ2 value this solution gener-ates when compared with the data. In the absence ofconstraints, any given model parameterAν will assumeall allowed values with equal probability (equipartitionpostulate).
– To each point of the ensemble aνj a probability is
assigned, equal to P (j). Following standard statisticalconcepts, the probability Π(aν) of a parameter Aν as-suming a specific value aν in the range (aν , aν +∆aν)is equal to:
Π(aν) =
aν+∆aν∫aν
∑j dA
jν P (j)
+∞∫−∞
∑j dA
jν P (j)
(5)
This expression defines the Probability DistributionFunction (PDF) of any parameter of the theory forrepresenting ”reality”. It thus contains the maximuminformation that can be obtained from the given set ofdata. Having obtained the PDF, numerical results canbe derived, usually moments of the distribution. Themean value is normally identified as the ”solution” andthe corresponding variance as its ”uncertainty”.
It is manifestly obvious that AMIAS has minimal as-sumptions and that it introduces no methodological biasto the solution. It determines the theory/model param-eters that exhibit sensitivity to the data yielding PDFsthat allow only a restricted range of values usually witha well defined maximum and a narrow width. If the datado not contain physical information to determine some ofthe parameters, then the resulting PDFs are featureless.The underlying stochastic approach allows easy scalabil-ity to a very large number of parameters even with limitednumber of data.
3 Multipole Extraction employing AMIAS
In applying AMIAS to the problem of multipole extrac-tion in the N → ∆ transition the parameters to be ex-tracted, Aν
j in the general formulation, are the multi-pole amplitudes ML±, and if the data allow, the isospin
separated amplitudes M1/2L± ,M
3/2L± . The experimental ob-
servables (data) Oi are typically cross section and polar-ization asymmetries. Furthermore, the parameters of ourproblem, the multipole amplitudes, are subjected to theconstraint of unitarization, by imposing the Fermi Watsontheorem.
The linkage of observables to multipoles in the case ofnucleon resonances is based on the Chew-Goldberger-Low-Nambu (CGLN) amplitude composition via the functionsF1 . . . F6 [2]. In the demonstration case we will examinewhich concerns the Bates-Mainz data, the multipoles usedrefer to the π0p charge channel which are connected to the
(A1/2p , A
1/2n , A3/2) isospin-set through the relation:
Aπ0p = A1/2p +
2
3A3/2
Following the standard practice of the field, we shall alsoconsider the phases of the multipoles as known (from πNscattering) with extreme precision and therefore fixed.The above choices allow a meaningful comparison withprevious analyses and model results; however they arenot inherent to the scheme. It is quite easy to considerthe phases, as experimental parameters characterized byuncertainties or even to perform a combined analysis ofelectroproduction and πN scattering data.
To demonstrate the capabilities of the method we re-analyzed the the H(e, e′p)π0 measurements performed atQ2 = 0.127 GeV 2/c2 and W = 1232 MeV [3]. This setconsists of Bates and Mainz data with 31 data points,cross section results for the σTT , σLT , σ0, σE2 and thepolarized beam cross section σLT ′ . Since the MAID model
user
Text Box
E. Stiliaris and C.N. Papanicolas: AMIAS: A Model Independent Analysis Scheme - From Hadronics to Medical Imaging 86
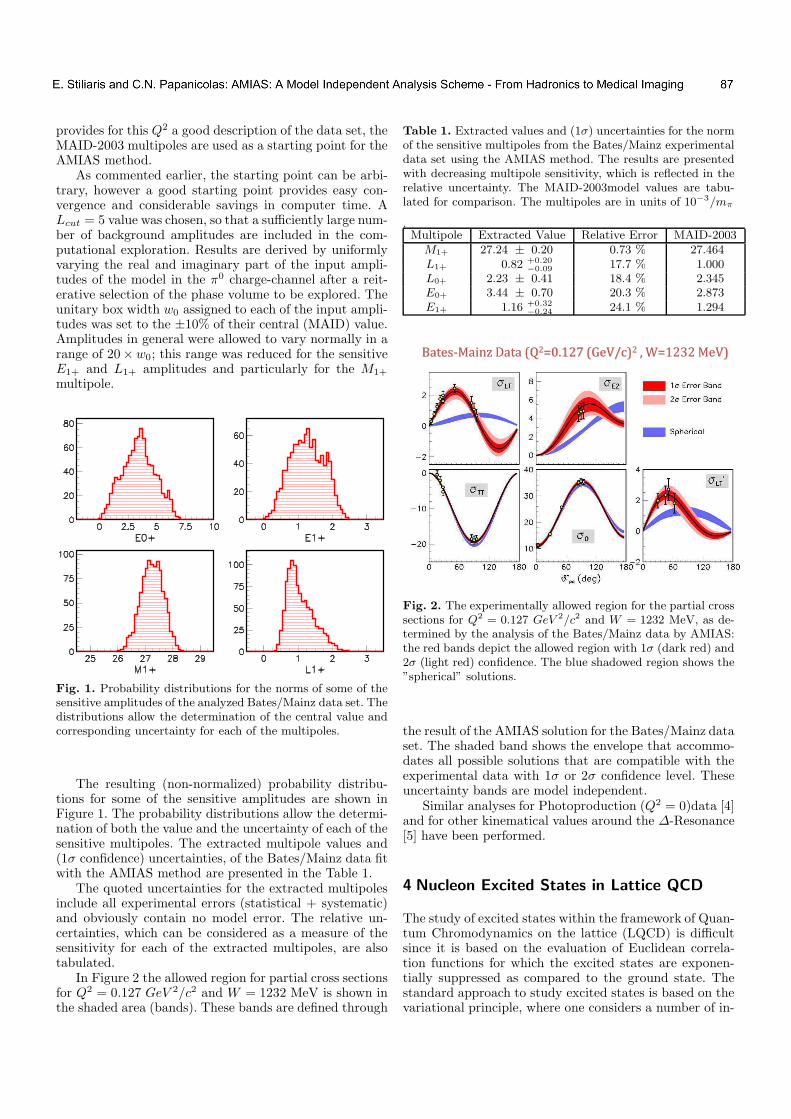
3
provides for this Q2 a good description of the data set, theMAID-2003 multipoles are used as a starting point for theAMIAS method.
As commented earlier, the starting point can be arbi-trary, however a good starting point provides easy con-vergence and considerable savings in computer time. ALcut = 5 value was chosen, so that a sufficiently large num-ber of background amplitudes are included in the com-putational exploration. Results are derived by uniformlyvarying the real and imaginary part of the input ampli-tudes of the model in the π0 charge-channel after a reit-erative selection of the phase volume to be explored. Theunitary box width w0 assigned to each of the input ampli-tudes was set to the ±10% of their central (MAID) value.Amplitudes in general were allowed to vary normally in arange of 20×w0; this range was reduced for the sensitiveE1+ and L1+ amplitudes and particularly for the M1+
multipole.
Fig. 1. Probability distributions for the norms of some of thesensitive amplitudes of the analyzed Bates/Mainz data set. Thedistributions allow the determination of the central value andcorresponding uncertainty for each of the multipoles.
The resulting (non-normalized) probability distribu-tions for some of the sensitive amplitudes are shown inFigure 1. The probability distributions allow the determi-nation of both the value and the uncertainty of each of thesensitive multipoles. The extracted multipole values and(1σ confidence) uncertainties, of the Bates/Mainz data fitwith the AMIAS method are presented in the Table 1.
The quoted uncertainties for the extracted multipolesinclude all experimental errors (statistical + systematic)and obviously contain no model error. The relative un-certainties, which can be considered as a measure of thesensitivity for each of the extracted multipoles, are alsotabulated.
In Figure 2 the allowed region for partial cross sectionsfor Q2 = 0.127 GeV 2/c2 and W = 1232 MeV is shown inthe shaded area (bands). These bands are defined through
Table 1. Extracted values and (1σ) uncertainties for the normof the sensitive multipoles from the Bates/Mainz experimentaldata set using the AMIAS method. The results are presentedwith decreasing multipole sensitivity, which is reflected in therelative uncertainty. The MAID-2003model values are tabu-lated for comparison. The multipoles are in units of 10−3/mπ
.Multipole Extracted Value Relative Error MAID-2003
M1+ 27.24 ± 0.20 0.73 % 27.464L1+ 0.82 +0.20
−0.09 17.7 % 1.000L0+ 2.23 ± 0.41 18.4 % 2.345E0+ 3.44 ± 0.70 20.3 % 2.873E1+ 1.16 +0.32
−0.24 24.1 % 1.294
Bates-Mainz Data (Q2=0.127 (GeV/c)2 , W=1232 MeV)
Fig. 2. The experimentally allowed region for the partial crosssections for Q2 = 0.127 GeV 2/c2 and W = 1232 MeV, as de-termined by the analysis of the Bates/Mainz data by AMIAS:the red bands depict the allowed region with 1σ (dark red) and2σ (light red) confidence. The blue shadowed region shows the”spherical” solutions.
the result of the AMIAS solution for the Bates/Mainz dataset. The shaded band shows the envelope that accommo-dates all possible solutions that are compatible with theexperimental data with 1σ or 2σ confidence level. Theseuncertainty bands are model independent.
Similar analyses for Photoproduction (Q2 = 0)data [4]and for other kinematical values around the ∆-Resonance[5] have been performed.
4 Nucleon Excited States in Lattice QCD
The study of excited states within the framework of Quan-tum Chromodynamics on the lattice (LQCD) is difficultsince it is based on the evaluation of Euclidean correla-tion functions for which the excited states are exponen-tially suppressed as compared to the ground state. Thestandard approach to study excited states is based on thevariational principle, where one considers a number of in-
user
Text Box
E. Stiliaris and C.N. Papanicolas: AMIAS: A Model Independent Analysis Scheme - From Hadronics to Medical Imaging 87

4
terpolating fields as a variational basis and defines a gen-eralized eigenvalue problem (GEVP) using the correlationmatrix computed within the chosen variational basis [6].
In this section, the application of AMIAS for extract-ing the excited states from Euclidean correlators to studythe nucleon spectrum is examined. A first analysis of thenucleon two-point function in Lattice QCD was carriedout with promising results [7]. Here, the method is ex-tended to analyze correlation matrices and compare theresults with those obtained in recent study using the stan-dard variational method. An advantage of AMIAS is thatit can be applied to the correlation function at small sep-aration times by allowing any number of states to con-tribute rather than to the large time-limit behavior typ-ically done in the variational method. In fact, the meritof the method is that it determines the actual numberof states on which the correlation matrix is sensitive on.Thus AMIAS does not rely on plateau identification of ef-fective masses, which are usually noisy and thus difficultto determine, but instead it utilizes all the informationencoded in the correlation function with the advantage ofexploiting the small time separations where the statisticalerrors are small.
The quantity of interest in this work is a Euclideantwo-point function computed at discrete times tj. For Lat-tice QCD correlators the spectral decomposition of thehadron propagator is given by the equation:
C(tj) =
∞∑
n=0
AneEntj (6)
where the parameters An and En are to be determined byAMIAS and the exponentials are ordered by the value ofEn (E0 < E1 < E2 . . .). For large values of the time theexponential with the smallest exponent dominates.
One of the significant advantages of AMIAS is thatit determines unambiguously the parameters to which thedata are sensitive on i.e. it determines nmax in the trunca-tion of the infinite sum in Equation 6. The results obtainedare then invariant under changes of nmax. The strategy isto increase nmax until there is no sensitivity to the addi-tional exponentials and thus no observable change in thesampled spectrum. In Fig 3 an example of such an analysisfor the nucleon correlator C(t) is shown.
Another central issue that is properly treated in AMIAS,is the handling of correlations, since all possible correla-tions are accounted for. The sampling method allows allfit parameters to randomly vary and to yield solutionswith all allowed values, including the insensitive exponen-tial terms. The visualization of the dominant correlationscan be accomplished by a two-dimensional contour plot inwhich the values of a selected pair of parameters is var-ied around the region of maximum probability, keeping allother parameters fixed.
Figure 4 presents such a correlation analysis, wherethe plane defined by the values of the parameters is colorcoded according to the χ2-value. The top-left and bottom-left parts are examples where the parameters are corre-lated, while the right part is an example of uncorrelated
1 10
E (GeV)
nmax=2
nmax=3
nmax=4
nmax=5E4E3
E2E1E0
Pro
bab
ilit
y
Fig. 3. The Probability Density Functions (PDFs) of En fordifferent values of the truncation parameter nmax. A well de-fined distribution is only present for the parameters that con-tribute to the PDF. Parameters without any contribution leadto a uniform distribution.
2,5x10⁻⁸
3,0x10⁻⁸
0,45
0,50
0,55
0,60
E0
A0
2,5x10⁻⁸
3,0x10⁻⁸
0,45
0,50
0,55
0,60
E0
A1
2,5x10⁻⁸
3,0x10⁻⁸
0,8
0,9
1,0
E1
A0
0,5 0,6
7
8
9
E4
E0
Fig. 4. Contour plots showing correlations among the param-eters. The contours are color coded according to the χ2-value.
parameters. In particular the bottom-right part is an ex-ample where sampling is insensitive to one of the param-eters, namely E4, indicating in this case the absence of afourth state (compared with Fig. 3).
5 Tomographic Image Reconstruction
In the emission and absorbtion tomography, an image canbe simply represented by a square matrix whose elementsare proportional to the intensity of each pixel. Once thismatrix is known, the projections in various angles θ, thatis the sum of all cell contributions (Figure 5) along a cer-
user
Text Box
E. Stiliaris and C.N. Papanicolas: AMIAS: A Model Independent Analysis Scheme - From Hadronics to Medical Imaging 88

5
tain ray Ri can be easily calculated. In tomography, wewould rather interested in solving the inverse problem,that is to reconstruct the square matrix from its projec-tions at different directions. By using the radiation emit-ted by an object, after the injection of radiopharmaceu-tical, we are able to obtain sectional (planar) images ofthe object. These projection data are then feeded into areconstruction algorithm. The intensity of each ray Ri at
Fig. 5. Reconstruction of an N × N square matrix from itsNP ×NR projections.
a given angle can be calculated from the projection matrixPij and the reconstructed matrix Qj . The projection ma-trix carries the information of how much the jth element ofthe matrix Q contributes to the ith ray. Let N ×N be thedimension of the square matrix, NP the number of projec-tions (angles) and NR the number of constant width raysper each projection; then the following expression holds:
Ri =
N2∑
j=1
Pij ×Qj i = 1 · · ·NP ×NR (7)
Algorithmic aspects in Computed Tomography is stilla very attractive field of investigations. Although the im-age reconstruction methodology from projections possesa variety of algorithmic techniques new approaches canbe proven useful to specific problems. It is well known,that for finite projection sets characteristic of tomographicdata, image reconstruction is an ill-posed inverse problemfor which no unique solution exists.
The inverse problem, i.e. the reconstruction of the squarematrix Q from the measured projections R (sinogram), isnot a trivial procedure due to the large matrix dimensions.Although this problem is a well studied with a numberof iterative techniques, like the Algebraic ReconstructionTechnique (ART), many other stochastic approaches ex-ist. Artificial Neural Networks have been shown to providesmart solutions especially to the problems that are other-wise difficult to model [8].
In this section an alternative method based on AMIASfor tomographic image reconstruction is presented. As it
was mentioned previously, AMIAS requires the incorpo-ration of a model to represent the physical characteristicsof the problem. In order to achieve this task, parametersof size, location, orientation and intensity were modelledin the AMIAS framework to represent the imaged object.In this study [9], the imaged object is the distribution ofa radiotracer in the physical space and it was modelledby using a series of 2-D Gaussian shapes, each one repre-senting the presence of a emitting source in the absorbingmaterial:
Fj =∑
k
Ake− 1
2(rjk
r0
jk
)2
(8)
where Ak is the amplitude of the radiation intensity andrjk is the distance between the jth element of the imagevector Fj from the center of the kth source (x0, y0). Theterm r0jk is given by using the parametric equation of anellipse:
r0jk =u · v√
(v · cos(φjk − θ))2 + (u · sin(φjk − θ))2(9)
where u and v are the major and minor axis of the ellipserespectively, and θ is the angle determining the orientationof the major axis in the tomographic plane.
AMIAS ART
Fig. 6. AMIAS tomographic reconstruction of a real phantomconsisting of three 99mTc capillaries embedded in a noisy waterbackground. Results based on the Algebraic ReconstructionTechnique (ART) are also shown for comparison.
A 3D AMIAS reconstruction example of a real phan-tom consisting of three capillaries filled with 99mTc solu-tion and measured with a small-field high-resolution γ-Camera system is shown in Figure 6. The phantom is
user
Text Box
E. Stiliaris and C.N. Papanicolas: AMIAS: A Model Independent Analysis Scheme - From Hadronics to Medical Imaging 89
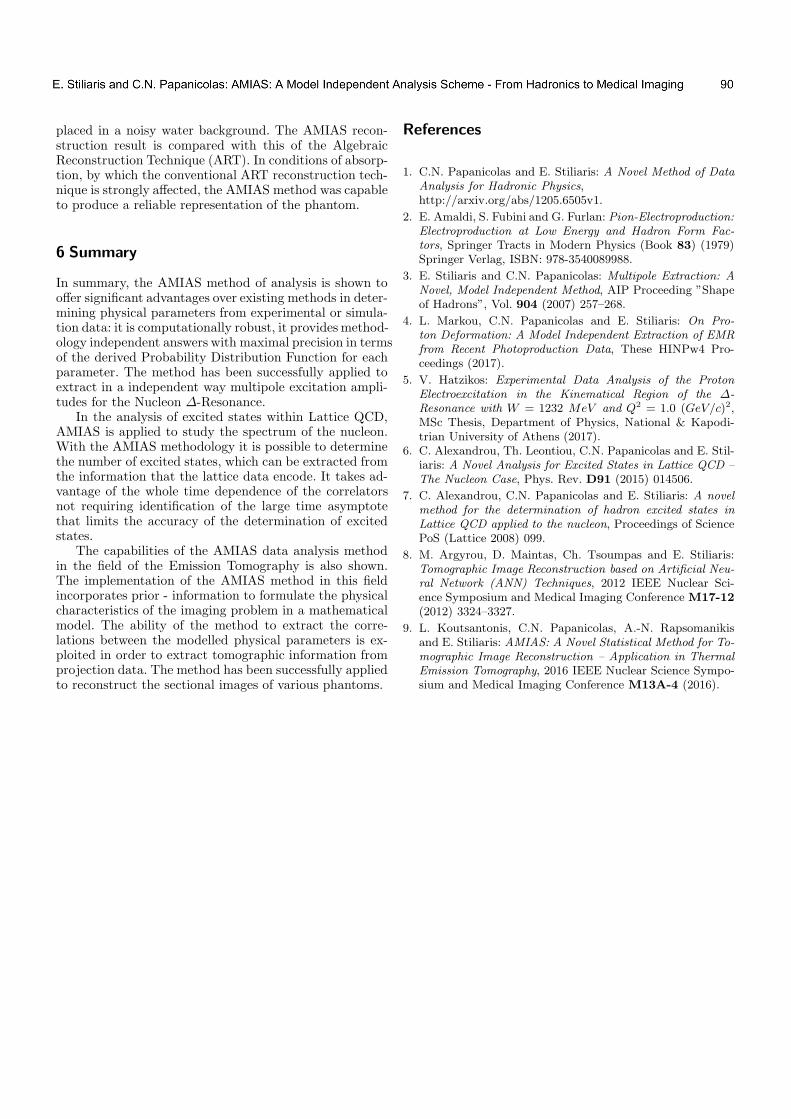
6
placed in a noisy water background. The AMIAS recon-struction result is compared with this of the AlgebraicReconstruction Technique (ART). In conditions of absorp-tion, by which the conventional ART reconstruction tech-nique is strongly affected, the AMIAS method was capableto produce a reliable representation of the phantom.
6 Summary
In summary, the AMIAS method of analysis is shown tooffer significant advantages over existing methods in deter-mining physical parameters from experimental or simula-tion data: it is computationally robust, it provides method-ology independent answers with maximal precision in termsof the derived Probability Distribution Function for eachparameter. The method has been successfully applied toextract in a independent way multipole excitation ampli-tudes for the Nucleon ∆-Resonance.
In the analysis of excited states within Lattice QCD,AMIAS is applied to study the spectrum of the nucleon.With the AMIAS methodology it is possible to determinethe number of excited states, which can be extracted fromthe information that the lattice data encode. It takes ad-vantage of the whole time dependence of the correlatorsnot requiring identification of the large time asymptotethat limits the accuracy of the determination of excitedstates.
The capabilities of the AMIAS data analysis methodin the field of the Emission Tomography is also shown.The implementation of the AMIAS method in this fieldincorporates prior - information to formulate the physicalcharacteristics of the imaging problem in a mathematicalmodel. The ability of the method to extract the corre-lations between the modelled physical parameters is ex-ploited in order to extract tomographic information fromprojection data. The method has been successfully appliedto reconstruct the sectional images of various phantoms.
References
1. C.N. Papanicolas and E. Stiliaris: A Novel Method of Data
Analysis for Hadronic Physics,http://arxiv.org/abs/1205.6505v1.
2. E. Amaldi, S. Fubini and G. Furlan: Pion-Electroproduction:Electroproduction at Low Energy and Hadron Form Fac-
tors, Springer Tracts in Modern Physics (Book 83) (1979)Springer Verlag, ISBN: 978-3540089988.
3. E. Stiliaris and C.N. Papanicolas: Multipole Extraction: A
Novel, Model Independent Method, AIP Proceeding ”Shapeof Hadrons”, Vol. 904 (2007) 257–268.
4. L. Markou, C.N. Papanicolas and E. Stiliaris: On Pro-
ton Deformation: A Model Independent Extraction of EMR
from Recent Photoproduction Data, These HINPw4 Pro-ceedings (2017).
5. V. Hatzikos: Experimental Data Analysis of the Proton
Electroexcitation in the Kinematical Region of the ∆-
Resonance with W = 1232 MeV and Q2 = 1.0 (GeV/c)2,MSc Thesis, Department of Physics, National & Kapodi-trian University of Athens (2017).
6. C. Alexandrou, Th. Leontiou, C.N. Papanicolas and E. Stil-iaris: A Novel Analysis for Excited States in Lattice QCD –
The Nucleon Case, Phys. Rev. D91 (2015) 014506.
7. C. Alexandrou, C.N. Papanicolas and E. Stiliaris: A novel
method for the determination of hadron excited states in
Lattice QCD applied to the nucleon, Proceedings of SciencePoS (Lattice 2008) 099.
8. M. Argyrou, D. Maintas, Ch. Tsoumpas and E. Stiliaris:Tomographic Image Reconstruction based on Artificial Neu-
ral Network (ANN) Techniques, 2012 IEEE Nuclear Sci-ence Symposium and Medical Imaging Conference M17-12
(2012) 3324–3327.
9. L. Koutsantonis, C.N. Papanicolas, A.-N. Rapsomanikisand E. Stiliaris: AMIAS: A Novel Statistical Method for To-
mographic Image Reconstruction – Application in Thermal
Emission Tomography, 2016 IEEE Nuclear Science Sympo-sium and Medical Imaging Conference M13A-4 (2016).
Powered by TCPDF (www.tcpdf.org)Powered by TCPDF (www.tcpdf.org)Powered by TCPDF (www.tcpdf.org)Powered by TCPDF (www.tcpdf.org)Powered by TCPDF (www.tcpdf.org)
user
Text Box
E. Stiliaris and C.N. Papanicolas: AMIAS: A Model Independent Analysis Scheme - From Hadronics to Medical Imaging 90
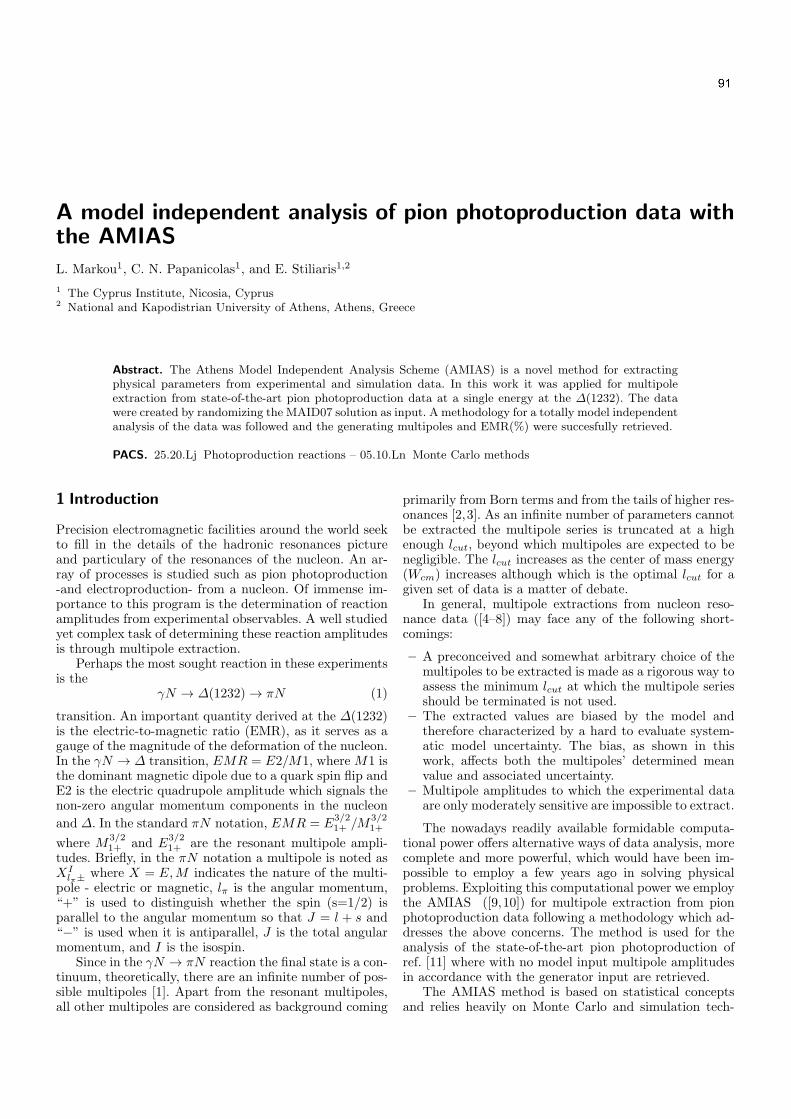
A model independent analysis of pion photoproduction data withthe AMIAS
L. Markou1, C. N. Papanicolas1, and E. Stiliaris1,2
1 The Cyprus Institute, Nicosia, Cyprus2 National and Kapodistrian University of Athens, Athens, Greece
Abstract. The Athens Model Independent Analysis Scheme (AMIAS) is a novel method for extractingphysical parameters from experimental and simulation data. In this work it was applied for multipoleextraction from state-of-the-art pion photoproduction data at a single energy at the ∆(1232). The datawere created by randomizing the MAID07 solution as input. A methodology for a totally model independentanalysis of the data was followed and the generating multipoles and EMR(%) were succesfully retrieved.
PACS. 25.20.Lj Photoproduction reactions – 05.10.Ln Monte Carlo methods
1 Introduction
Precision electromagnetic facilities around the world seekto fill in the details of the hadronic resonances pictureand particulary of the resonances of the nucleon. An ar-ray of processes is studied such as pion photoproduction-and electroproduction- from a nucleon. Of immense im-portance to this program is the determination of reactionamplitudes from experimental observables. A well studiedyet complex task of determining these reaction amplitudesis through multipole extraction.
Perhaps the most sought reaction in these experimentsis the
γN → ∆(1232) → πN (1)
transition. An important quantity derived at the ∆(1232)is the electric-to-magnetic ratio (EMR), as it serves as agauge of the magnitude of the deformation of the nucleon.In the γN → ∆ transition, EMR = E2/M1, where M1 isthe dominant magnetic dipole due to a quark spin flip andE2 is the electric quadrupole amplitude which signals thenon-zero angular momentum components in the nucleon
and ∆. In the standard πN notation, EMR = E3/21+
/M3/21+
where M3/21+
and E3/21+
are the resonant multipole ampli-tudes. Briefly, in the πN notation a multipole is noted asXI
lπ±where X = E,M indicates the nature of the multi-
pole - electric or magnetic, lπ is the angular momentum,“+” is used to distinguish whether the spin (s=1/2) isparallel to the angular momentum so that J = l + s and“−” is used when it is antiparallel, J is the total angularmomentum, and I is the isospin.
Since in the γN → πN reaction the final state is a con-tinuum, theoretically, there are an infinite number of pos-sible multipoles [1]. Apart from the resonant multipoles,all other multipoles are considered as background coming
primarily from Born terms and from the tails of higher res-onances [2,3]. As an infinite number of parameters cannotbe extracted the multipole series is truncated at a highenough lcut, beyond which multipoles are expected to benegligible. The lcut increases as the center of mass energy(Wcm) increases although which is the optimal lcut for agiven set of data is a matter of debate.
In general, multipole extractions from nucleon reso-nance data ([4–8]) may face any of the following short-comings:
– A preconceived and somewhat arbitrary choice of themultipoles to be extracted is made as a rigorous way toassess the minimum lcut at which the multipole seriesshould be terminated is not used.
– The extracted values are biased by the model andtherefore characterized by a hard to evaluate system-atic model uncertainty. The bias, as shown in thiswork, affects both the multipoles’ determined meanvalue and associated uncertainty.
– Multipole amplitudes to which the experimental dataare only moderately sensitive are impossible to extract.
The nowadays readily available formidable computa-tional power offers alternative ways of data analysis, morecomplete and more powerful, which would have been im-possible to employ a few years ago in solving physicalproblems. Exploiting this computational power we employthe AMIAS ([9,10]) for multipole extraction from pionphotoproduction data following a methodology which ad-dresses the above concerns. The method is used for theanalysis of the state-of-the-art pion photoproduction ofref. [11] where with no model input multipole amplitudesin accordance with the generator input are retrieved.
The AMIAS method is based on statistical conceptsand relies heavily on Monte Carlo and simulation tech-
user
Text Box
91

2
niques, and it thus requires High Performance Comput-ing as it is computationally intensive. It has been shown[10] that the method identifies and determines with maxi-mal precision parameters that are sensitive to the data byyielding their Probability Distribution Function (PDF).The AMIAS is computationally robust and numericallystable. It uses a Monte Carlo routine to examine the wholeparameter space and as it does not rely on any χ2 mini-mization techniques it does not get trapped in any localminima. It has been successfully applied in the analysis ofnucleon resonance data and lattice QCD ([10,12]).
2 The data
Pseudodata or simulation data are often used for the val-idation of analysis methods and methodologies [13,11,9].Their great advantage is that the true solution to the prob-lem they pose is known so results may be accepted or re-jected based on this knowledge. The underlying statisticalproperties of the parameters can also be manipulated andtherefore are known by the user.
In this work a selection of the pion photoproductiondata at a single energy at the ∆(1232), from ref. [11],were analyzed. The data were created by randomizing theMAID07 solution as input and they contain all 16 singleand double polarization observables. The data are char-acterized by a statistical precision that has become tech-nically possible only very recently at the tagged photonfacilities at ELSA (Univsersity of Bonn), CEBAF (Jeffer-son Laboratory) and MAMI (University of Mainz).
The dataset analyzed in this work consists of the differ-ential cross section (dσ0), the beam asymmetry (Σ), the
target asymmetry (T ), and the recoil baryon asymmetry
(P ) of the γp → pπ0 reaction and dσ0, Σ and T of theγp → nπ+ reaction. Each observables features 18 evenlyspread angular measurements from 5 to 175. Measure-ments at so high forward and backwards angles make thedata very sensitive to multipole amplitudes with very highlcut.
3 Methodology
The AMIAS has a minimal requirement that the parame-ters to be determined are linked in an explicit way to themeasured experimental quantities. Multipole amplitudes,do not provide an orthogonal basis for describing the ob-servables of photoproduction experiments, such as crosssections and polarization asymmetries, so we link them tothe observables via the CGLN amplitudes [14,11].
Neutral pion photoproduction data are only sensitiveto the charge amplitudes Apπ0 of eq. (2) while positivepion photoproduction data are sensitive to the Anπ+ am-plitudes
Apπ0 = A1/2p +
2
3A3/2
Anπ+ =√2
(A1/2
p −1
3A3/2
) (2)
To access isospin multipoles one can either fix the back-ground A1/2 multipoles to a model and solve for the res-onant amplitudes A3/2 or simultaneously analyze data oftwo charge channels, for instance, γp → pπ0 and γp →nπ+. The first method is applied in cases where datafrom a single channel are available and unavoidably suf-fers from hard to evaluate model error. We employ thelatter method since data measured at both proton targetreactions are available.
Compton scattering, pion photoproduction, and pion-nucleon scattering are related by unitarity through a com-mon S matrix and the Fermi-Watson [15] theorem requiresthe (γ, π) and (π, π) channels to have the same phase be-low the 2-pion threshold. Since our analysis takes placeat the ∆(1232) it is subject to this theoretical constraintwhich, in essence, forces all multipoles with different char-acter (electric or magnetic) but the same quantum num-bers I, l, J to have the same phase ±nπ. The phases forthis work were borrowed from the SAID πN analysis [16].
To employ the AMIAS for a model independent analy-sis we allowed multipole amplitudes to vary (fitted) whilegradually increasing the lcut until the χ2
min reached andthe yielded PDFs remained unchanged. In this way max-imal information was derived from the data and the lcutwas not arbitrarily chosen but rather it was also deter-mined by the data. At each step, all background ampli-tudes with l > lcut and up to all orders assumed theirtheoretically calculated Born values [17].
In single pseudoscalar production it has been estab-lished that at least eight independent measurements arerequired at each energy and at each angle to extract thefour complex CGLN amplitudes up to an unmeasurableoverall phase ([18]). In a truncated partial wave analysismultipoles can be obtained with even fewer observablesand depending on the lcut imposed ([19–21]). By imposingthe F-W theorem, as in this work, the phase of each multi-pole is fixed and the unknown parameters of the problemare halved.
4 Extracted amplitudes
The AMIAS yields the Probability Distribution Function(PDF) of each parameter. While the method treats all pa-rameters equally, parameters to which the data are highlysensitive exhibit well defined and narrow PDFs while non-sensitive parameters exhibit wider and featureless distri-butions. The shape of each PDF is not assumed, whether itis a Gaussian, a asymmetric Gaussian or a double solutiondepends solely on the data and the correlations betweenthe extracted parameters.
Following the methodology described above adequateparameters were varied until convergence was reached; the
user
Text Box
L. Markou et al.: A model independent analysis of pion photoproduction data with the AMIAS 92
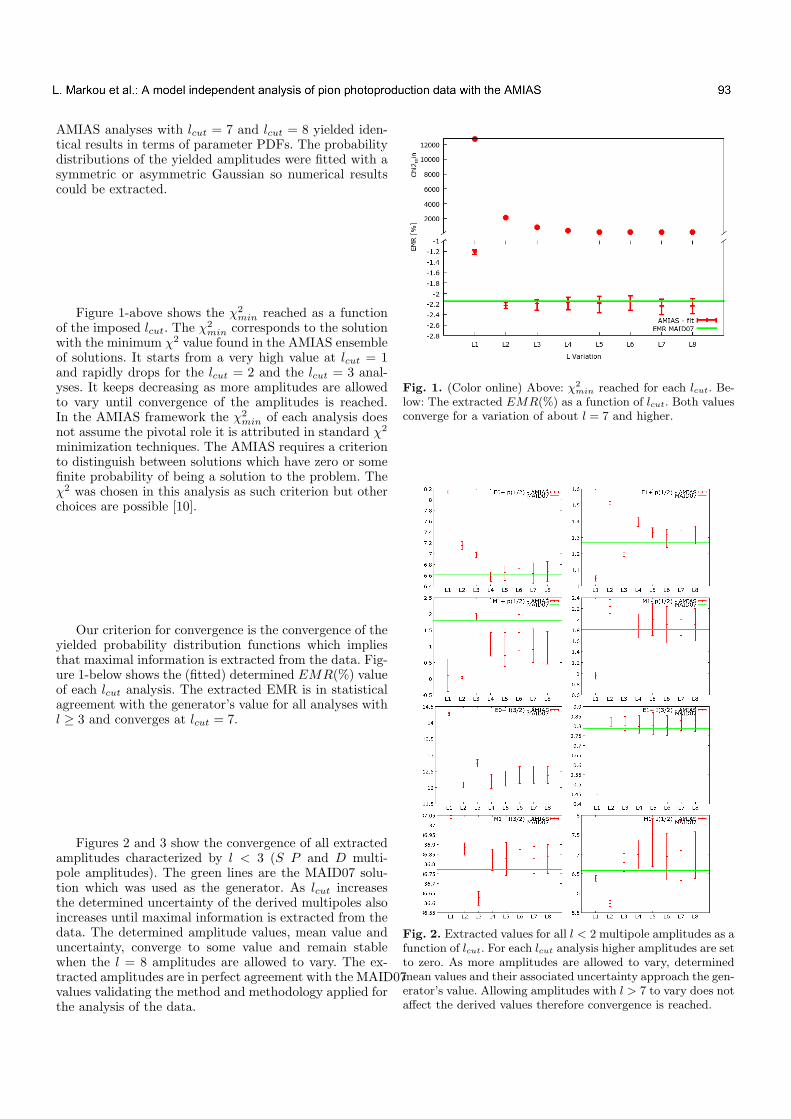
3
AMIAS analyses with lcut = 7 and lcut = 8 yielded iden-tical results in terms of parameter PDFs. The probabilitydistributions of the yielded amplitudes were fitted with asymmetric or asymmetric Gaussian so numerical resultscould be extracted.
Figure 1-above shows the χ2
min reached as a functionof the imposed lcut. The χ
2
min corresponds to the solutionwith the minimum χ2 value found in the AMIAS ensembleof solutions. It starts from a very high value at lcut = 1and rapidly drops for the lcut = 2 and the lcut = 3 anal-yses. It keeps decreasing as more amplitudes are allowedto vary until convergence of the amplitudes is reached.In the AMIAS framework the χ2
min of each analysis doesnot assume the pivotal role it is attributed in standard χ2
minimization techniques. The AMIAS requires a criterionto distinguish between solutions which have zero or somefinite probability of being a solution to the problem. Theχ2 was chosen in this analysis as such criterion but otherchoices are possible [10].
Our criterion for convergence is the convergence of theyielded probability distribution functions which impliesthat maximal information is extracted from the data. Fig-ure 1-below shows the (fitted) determined EMR(%) valueof each lcut analysis. The extracted EMR is in statisticalagreement with the generator’s value for all analyses withl ≥ 3 and converges at lcut = 7.
Figures 2 and 3 show the convergence of all extractedamplitudes characterized by l < 3 (S P and D multi-pole amplitudes). The green lines are the MAID07 solu-tion which was used as the generator. As lcut increasesthe determined uncertainty of the derived multipoles alsoincreases until maximal information is extracted from thedata. The determined amplitude values, mean value anduncertainty, converge to some value and remain stablewhen the l = 8 amplitudes are allowed to vary. The ex-tracted amplitudes are in perfect agreement with the MAID07values validating the method and methodology applied forthe analysis of the data.
Fig. 1. (Color online) Above: χ2
min reached for each lcut. Be-low: The extracted EMR(%) as a function of lcut. Both valuesconverge for a variation of about l = 7 and higher.
Fig. 2. Extracted values for all l < 2 multipole amplitudes as afunction of lcut. For each lcut analysis higher amplitudes are setto zero. As more amplitudes are allowed to vary, determinedmean values and their associated uncertainty approach the gen-erator’s value. Allowing amplitudes with l > 7 to vary does notaffect the derived values therefore convergence is reached.
user
Text Box
L. Markou et al.: A model independent analysis of pion photoproduction data with the AMIAS 93
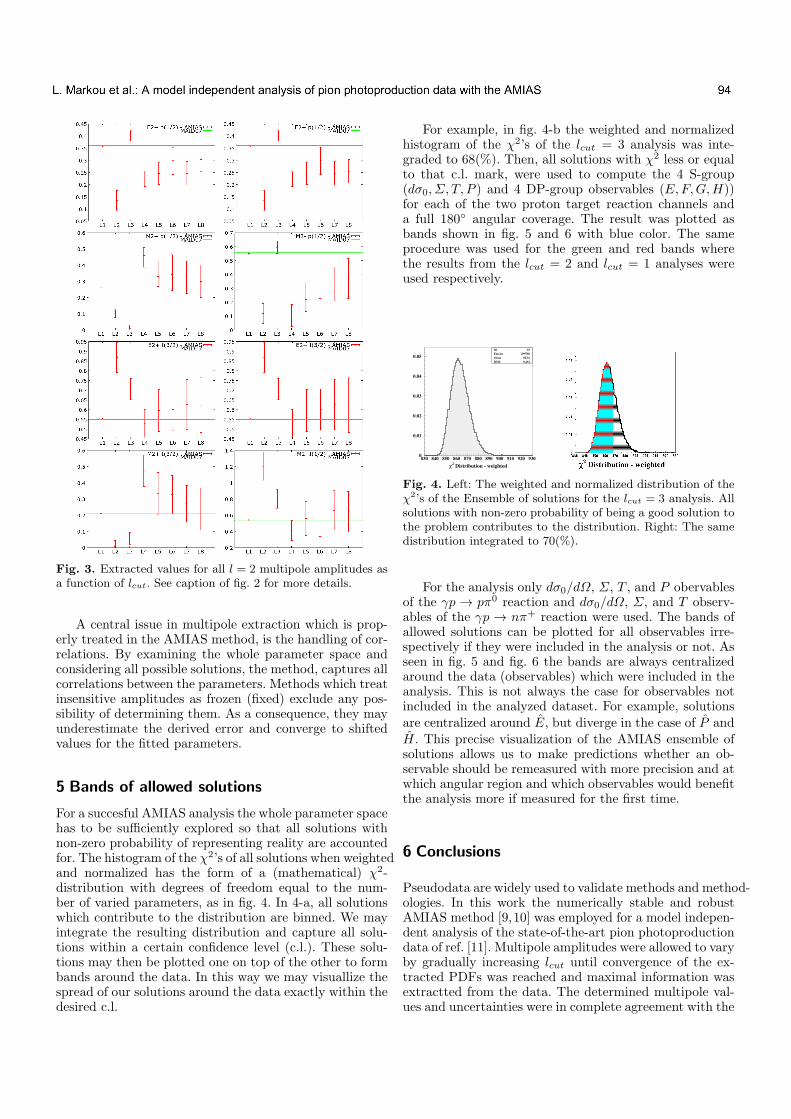
4
Fig. 3. Extracted values for all l = 2 multipole amplitudes asa function of lcut. See caption of fig. 2 for more details.
A central issue in multipole extraction which is prop-erly treated in the AMIAS method, is the handling of cor-relations. By examining the whole parameter space andconsidering all possible solutions, the method, captures allcorrelations between the parameters. Methods which treatinsensitive amplitudes as frozen (fixed) exclude any pos-sibility of determining them. As a consequence, they mayunderestimate the derived error and converge to shiftedvalues for the fitted parameters.
5 Bands of allowed solutions
For a succesful AMIAS analysis the whole parameter spacehas to be sufficiently explored so that all solutions withnon-zero probability of representing reality are accountedfor. The histogram of the χ2’s of all solutions when weightedand normalized has the form of a (mathematical) χ2-distribution with degrees of freedom equal to the num-ber of varied parameters, as in fig. 4. In 4-a, all solutionswhich contribute to the distribution are binned. We mayintegrate the resulting distribution and capture all solu-tions within a certain confidence level (c.l.). These solu-tions may then be plotted one on top of the other to formbands around the data. In this way we may visuallize thespread of our solutions around the data exactly within thedesired c.l.
For example, in fig. 4-b the weighted and normalizedhistogram of the χ2’s of the lcut = 3 analysis was inte-graded to 68(%). Then, all solutions with χ2 less or equalto that c.l. mark, were used to compute the 4 S-group(dσ0, Σ, T, P ) and 4 DP-group observables (E,F,G,H))for each of the two proton target reaction channels anda full 180 angular coverage. The result was plotted asbands shown in fig. 5 and 6 with blue color. The sameprocedure was used for the green and red bands wherethe results from the lcut = 2 and lcut = 1 analyses wereused respectively.
χ2 Distribution - weighted
0
0.01
0.02
0.03
0.04
0.05
830 840 850 860 870 880 890 900 910 920 930
ID
Entries
Mean
RMS
10
299786
863.6
8.461
Fig. 4. Left: The weighted and normalized distribution of theχ2’s of the Ensemble of solutions for the lcut = 3 analysis. Allsolutions with non-zero probability of being a good solution tothe problem contributes to the distribution. Right: The samedistribution integrated to 70(%).
For the analysis only dσ0/dΩ, Σ, T , and P obervablesof the γp → pπ0 reaction and dσ0/dΩ, Σ, and T observ-ables of the γp → nπ+ reaction were used. The bands ofallowed solutions can be plotted for all observables irre-spectively if they were included in the analysis or not. Asseen in fig. 5 and fig. 6 the bands are always centralizedaround the data (observables) which were included in theanalysis. This is not always the case for observables notincluded in the analyzed dataset. For example, solutionsare centralized around E, but diverge in the case of P andH. This precise visualization of the AMIAS ensemble ofsolutions allows us to make predictions whether an ob-servable should be remeasured with more precision and atwhich angular region and which observables would benefitthe analysis more if measured for the first time.
6 Conclusions
Pseudodata are widely used to validate methods and method-ologies. In this work the numerically stable and robustAMIAS method [9,10] was employed for a model indepen-dent analysis of the state-of-the-art pion photoproductiondata of ref. [11]. Multipole amplitudes were allowed to varyby gradually increasing lcut until convergence of the ex-tracted PDFs was reached and maximal information wasextractted from the data. The determined multipole val-ues and uncertainties were in complete agreement with the
user
Text Box
L. Markou et al.: A model independent analysis of pion photoproduction data with the AMIAS 94
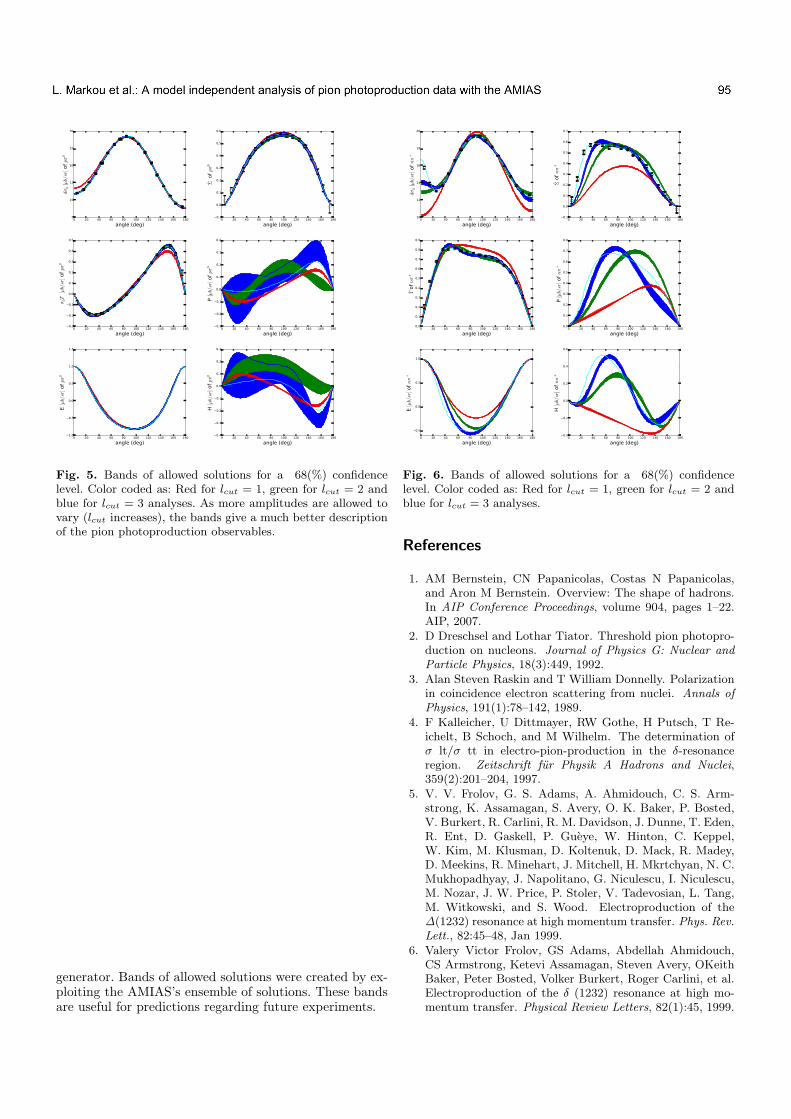
5
0 20 40 60 80 100 120 140 160 180angle (deg)
5
10
15
20
25
30
dσ
0 [µb/sr
] of p
π0
0 20 40 60 80 100 120 140 160 180angle (deg)
−0.1
0.0
0.1
0.2
0.3
0.4
0.5
0.6
Σ o
f pπ0
0 20 40 60 80 100 120 140 160 180angle (deg)
−0.3
−0.2
−0.1
0.0
0.1
0.2
0.3
0.4
0.5
σ0T
[µb/sr
] of p
π0
0 20 40 60 80 100 120 140 160 180angle (deg)
−0.3
−0.2
−0.1
0.0
0.1
0.2
0.3
0.4
P [µb/sr
] of p
π0
0 20 40 60 80 100 120 140 160 180angle (deg)
−1.0
−0.5
0.0
0.5
1.0
1.5
E [µb/sr
] of p
π0
0 20 40 60 80 100 120 140 160 180angle (deg)
−0.4
−0.3
−0.2
−0.1
0.0
0.1
0.2
0.3
H [µb/sr
] of p
π0
Fig. 5. Bands of allowed solutions for a 68(%) confidencelevel. Color coded as: Red for lcut = 1, green for lcut = 2 andblue for lcut = 3 analyses. As more amplitudes are allowed tovary (lcut increases), the bands give a much better descriptionof the pion photoproduction observables.
generator. Bands of allowed solutions were created by ex-ploiting the AMIAS’s ensemble of solutions. These bandsare useful for predictions regarding future experiments.
0 20 40 60 80 100 120 140 160 180angle (deg)
10
12
14
16
18
20
dσ0 [µb/sr
] of n
π+
0 20 40 60 80 100 120 140 160 180angle (deg)
−0.1
0.0
0.1
0.2
0.3
0.4
0.5
0.6
0.7
Σ o
f nπ+
0 20 40 60 80 100 120 140 160 180angle (deg)
0.0
0.1
0.2
0.3
0.4
0.5
0.6
0.7
0.8
0.9
T of n
π+
0 20 40 60 80 100 120 140 160 180angle (deg)
0.0
0.1
0.2
0.3
0.4
0.5
0.6
0.7
0.8
P [µb/sr
] of n
π+
0 20 40 60 80 100 120 140 160 180angle (deg)
−0.5
0.0
0.5
1.0
E [µb/sr
] of n
π+
0 20 40 60 80 100 120 140 160 180angle (deg)
−0.4
−0.2
0.0
0.2
0.4
0.6
H [µb/sr
] of n
π+
Fig. 6. Bands of allowed solutions for a 68(%) confidencelevel. Color coded as: Red for lcut = 1, green for lcut = 2 andblue for lcut = 3 analyses.
References
1. AM Bernstein, CN Papanicolas, Costas N Papanicolas,and Aron M Bernstein. Overview: The shape of hadrons.In AIP Conference Proceedings, volume 904, pages 1–22.AIP, 2007.
2. D Dreschsel and Lothar Tiator. Threshold pion photopro-duction on nucleons. Journal of Physics G: Nuclear and
Particle Physics, 18(3):449, 1992.3. Alan Steven Raskin and T William Donnelly. Polarization
in coincidence electron scattering from nuclei. Annals of
Physics, 191(1):78–142, 1989.4. F Kalleicher, U Dittmayer, RW Gothe, H Putsch, T Re-
ichelt, B Schoch, and M Wilhelm. The determination ofσ lt/σ tt in electro-pion-production in the δ-resonanceregion. Zeitschrift fur Physik A Hadrons and Nuclei,359(2):201–204, 1997.
5. V. V. Frolov, G. S. Adams, A. Ahmidouch, C. S. Arm-strong, K. Assamagan, S. Avery, O. K. Baker, P. Bosted,V. Burkert, R. Carlini, R. M. Davidson, J. Dunne, T. Eden,R. Ent, D. Gaskell, P. Gueye, W. Hinton, C. Keppel,W. Kim, M. Klusman, D. Koltenuk, D. Mack, R. Madey,D. Meekins, R. Minehart, J. Mitchell, H. Mkrtchyan, N. C.Mukhopadhyay, J. Napolitano, G. Niculescu, I. Niculescu,M. Nozar, J. W. Price, P. Stoler, V. Tadevosian, L. Tang,M. Witkowski, and S. Wood. Electroproduction of the∆(1232) resonance at high momentum transfer. Phys. Rev.Lett., 82:45–48, Jan 1999.
6. Valery Victor Frolov, GS Adams, Abdellah Ahmidouch,CS Armstrong, Ketevi Assamagan, Steven Avery, OKeithBaker, Peter Bosted, Volker Burkert, Roger Carlini, et al.Electroproduction of the δ (1232) resonance at high mo-mentum transfer. Physical Review Letters, 82(1):45, 1999.
user
Text Box
L. Markou et al.: A model independent analysis of pion photoproduction data with the AMIAS 95
6
7. C. Mertz, C. E. Vellidis, R. Alarcon, D. H. Barkhuff, A. M.Bernstein, W. Bertozzi, V. Burkert, J. Chen, J. R. Com-fort, G. Dodson, S. Dolfini, K. Dow, M. Farkhondeh, J. M.Finn, S. Gilad, R. W. Gothe, X. Jiang, K. Joo, N. I.Kaloskamis, A. Karabarbounis, J. J. Kelly, S. Kowalski,C. Kunz, R. W. Lourie, J. I. McIntyre, B. D. Milbrath,R. Miskimen, J. H. Mitchell, C. N. Papanicolas, C. F.Perdrisat, A. J. Sarty, J. Shaw, S.-B. Soong, D. Tieger,C. Tschalær, W. Turchinetz, P. E. Ulmer, S. Van Verst,G. A. Warren, L. B. Weinstein, S. Williamson, R. J. Woo,and A. Young. Search for quadrupole strength in the elec-troexcitation of the ∆+(1232). Phys. Rev. Lett., 86:2963–2966, Apr 2001.
8. NF Sparveris, R Alarcon, AM Bernstein, W Bertozzi,T Botto, P Bourgeois, J Calarco, F Casagrande, MO Dis-tler, K Dow, et al. Investigation of the conjectured nucleondeformation at low momentum transfer. Physical review
letters, 94(2):022003, 2005.9. E. Stiliaris and C.N. Papanicolas. Multipole extraction:
A novel, model independent method. arXiv preprint nucl-
ex/0703031, 2007.10. C.N. Papanicolas and E. Stiliaris. A novel method
of data analysis for hadronic physics. arXiv preprint
arXiv:1205.6505, 2012.11. R.L. Workman, M.W. Paris, W.J. Briscoe, L. Tiator,
S. Schumann, M. Ostrick, and S.S. Kamalov. Model depen-dence of single-energy fits to pion photoproduction data.The European Physical Journal A, 47(11), 2011.
12. C Alexandrou, T Leontiou, CN Papanicolas, and E Stil-iaris. Novel analysis method for excited states in latticeqcd: The nucleon case. Physical Review D, 91(1):014506,2015.
13. J Friedrich and F Lenz. Elastic electron scatteringfrom 208pb at moderate momentum transfers and model-independent description of the nuclear charge distribution.Nuclear Physics A, 183(3):523–544, 1972.
14. G. F. Chew, M. L. Goldberger, F. E. Low, and Y. Nambu.Relativistic dispersion relation approach to photomesonproduction. Phys. Rev., 106:1345–1355, Jun 1957.
15. Kenneth M. Watson. Some general relations between thephotoproduction and scattering of π mesons. Phys. Rev.,95:228–236, Jul 1954.
16. INS Data Analysis Center.17. O Hanstein. PhD thesis, Mainz, 1996.18. Wen-Tai Chiang and Frank Tabakin. Completeness rules
for spin observables in pseudoscalar meson photoproduc-tion. Physical Review C, 55(4):2054, 1997.
19. RL Workman. Extracting amplitudes from photoproduc-tion data. In Journal of Physics: Conference Series, vol-ume 312, page 032019. IOP Publishing, 2011.
20. Yannick Wunderlich. Studies on a complete experimentfor single pseudoscalar meson photoproduction. In Inter-
national Journal of Modern Physics: Conference Series,volume 26, page 1460104. World Scientific, 2014.
21. RL Workman, L Tiator, Y Wunderlich, M Doering, andH Haberzettl. Amplitude reconstruction from completeexperiments and truncated partial-wave expansions. arXiv
preprint arXiv:1611.04434, 2016.
Powered by TCPDF (www.tcpdf.org)Powered by TCPDF (www.tcpdf.org)Powered by TCPDF (www.tcpdf.org)Powered by TCPDF (www.tcpdf.org)Powered by TCPDF (www.tcpdf.org)
user
Text Box
L. Markou et al.: A model independent analysis of pion photoproduction data with the AMIAS 96
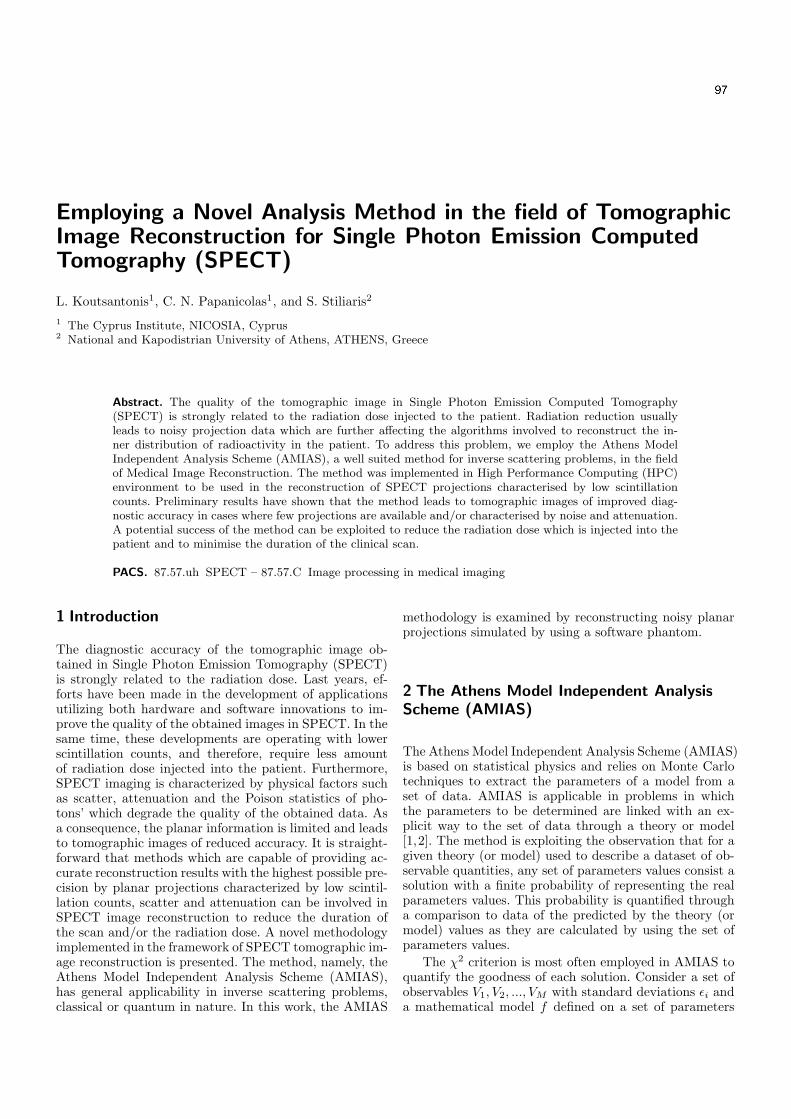
Employing a Novel Analysis Method in the field of TomographicImage Reconstruction for Single Photon Emission ComputedTomography (SPECT)
L. Koutsantonis1, C. N. Papanicolas1, and S. Stiliaris2
1 The Cyprus Institute, NICOSIA, Cyprus2 National and Kapodistrian University of Athens, ATHENS, Greece
Abstract. The quality of the tomographic image in Single Photon Emission Computed Tomography(SPECT) is strongly related to the radiation dose injected to the patient. Radiation reduction usuallyleads to noisy projection data which are further affecting the algorithms involved to reconstruct the in-ner distribution of radioactivity in the patient. To address this problem, we employ the Athens ModelIndependent Analysis Scheme (AMIAS), a well suited method for inverse scattering problems, in the fieldof Medical Image Reconstruction. The method was implemented in High Performance Computing (HPC)environment to be used in the reconstruction of SPECT projections characterised by low scintillationcounts. Preliminary results have shown that the method leads to tomographic images of improved diag-nostic accuracy in cases where few projections are available and/or characterised by noise and attenuation.A potential success of the method can be exploited to reduce the radiation dose which is injected into thepatient and to minimise the duration of the clinical scan.
PACS. 87.57.uh SPECT – 87.57.C Image processing in medical imaging
1 Introduction
The diagnostic accuracy of the tomographic image ob-tained in Single Photon Emission Tomography (SPECT)is strongly related to the radiation dose. Last years, ef-forts have been made in the development of applicationsutilizing both hardware and software innovations to im-prove the quality of the obtained images in SPECT. In thesame time, these developments are operating with lowerscintillation counts, and therefore, require less amountof radiation dose injected into the patient. Furthermore,SPECT imaging is characterized by physical factors suchas scatter, attenuation and the Poison statistics of pho-tons’ which degrade the quality of the obtained data. Asa consequence, the planar information is limited and leadsto tomographic images of reduced accuracy. It is straight-forward that methods which are capable of providing ac-curate reconstruction results with the highest possible pre-cision by planar projections characterized by low scintil-lation counts, scatter and attenuation can be involved inSPECT image reconstruction to reduce the duration ofthe scan and/or the radiation dose. A novel methodologyimplemented in the framework of SPECT tomographic im-age reconstruction is presented. The method, namely, theAthens Model Independent Analysis Scheme (AMIAS),has general applicability in inverse scattering problems,classical or quantum in nature. In this work, the AMIAS
methodology is examined by reconstructing noisy planarprojections simulated by using a software phantom.
2 The Athens Model Independent Analysis
Scheme (AMIAS)
The Athens Model Independent Analysis Scheme (AMIAS)is based on statistical physics and relies on Monte Carlotechniques to extract the parameters of a model from aset of data. AMIAS is applicable in problems in whichthe parameters to be determined are linked with an ex-plicit way to the set of data through a theory or model[1,2]. The method is exploiting the observation that for agiven theory (or model) used to describe a dataset of ob-servable quantities, any set of parameters values consist asolution with a finite probability of representing the realparameters values. This probability is quantified througha comparison to data of the predicted by the theory (ormodel) values as they are calculated by using the set ofparameters values.
The χ2 criterion is most often employed in AMIAS toquantify the goodness of each solution. Consider a set ofobservables V1, V2, ..., VM with standard deviations ǫi anda mathematical model f defined on a set of parameters
user
Text Box
97
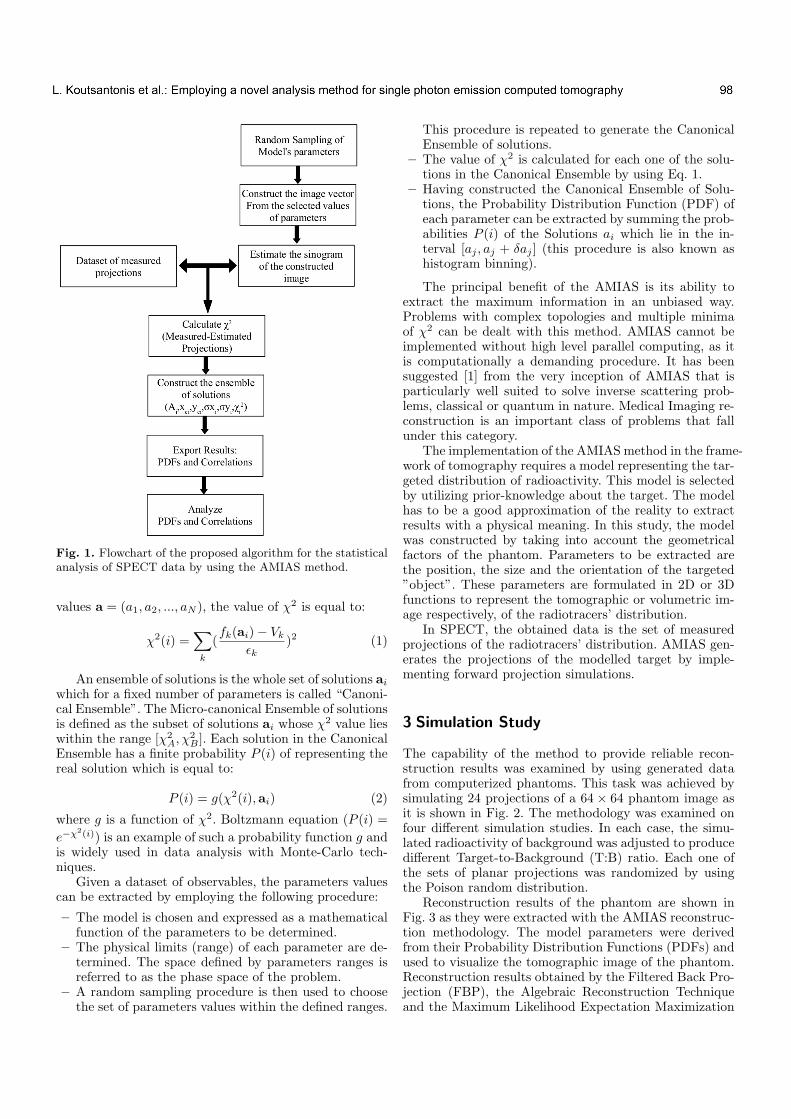
2
Fig. 1. Flowchart of the proposed algorithm for the statisticalanalysis of SPECT data by using the AMIAS method.
values a = (a1, a2, ..., aN ), the value of χ2 is equal to:
χ2(i) =∑
k
(fk(ai)− Vk
ǫk)2 (1)
An ensemble of solutions is the whole set of solutions aiwhich for a fixed number of parameters is called “Canoni-cal Ensemble”. The Micro-canonical Ensemble of solutionsis defined as the subset of solutions ai whose χ
2 value lieswithin the range [χ2
A, χ2
B ]. Each solution in the CanonicalEnsemble has a finite probability P (i) of representing thereal solution which is equal to:
P (i) = g(χ2(i),ai) (2)
where g is a function of χ2. Boltzmann equation (P (i) =
e−χ2(i)) is an example of such a probability function g and
is widely used in data analysis with Monte-Carlo tech-niques.
Given a dataset of observables, the parameters valuescan be extracted by employing the following procedure:
– The model is chosen and expressed as a mathematicalfunction of the parameters to be determined.
– The physical limits (range) of each parameter are de-termined. The space defined by parameters ranges isreferred to as the phase space of the problem.
– A random sampling procedure is then used to choosethe set of parameters values within the defined ranges.
This procedure is repeated to generate the CanonicalEnsemble of solutions.
– The value of χ2 is calculated for each one of the solu-tions in the Canonical Ensemble by using Eq. 1.
– Having constructed the Canonical Ensemble of Solu-tions, the Probability Distribution Function (PDF) ofeach parameter can be extracted by summing the prob-abilities P (i) of the Solutions ai which lie in the in-terval [aj , aj + δaj ] (this procedure is also known ashistogram binning).
The principal benefit of the AMIAS is its ability toextract the maximum information in an unbiased way.Problems with complex topologies and multiple minimaof χ2 can be dealt with this method. AMIAS cannot beimplemented without high level parallel computing, as itis computationally a demanding procedure. It has beensuggested [1] from the very inception of AMIAS that isparticularly well suited to solve inverse scattering prob-lems, classical or quantum in nature. Medical Imaging re-construction is an important class of problems that fallunder this category.
The implementation of the AMIAS method in the frame-work of tomography requires a model representing the tar-geted distribution of radioactivity. This model is selectedby utilizing prior-knowledge about the target. The modelhas to be a good approximation of the reality to extractresults with a physical meaning. In this study, the modelwas constructed by taking into account the geometricalfactors of the phantom. Parameters to be extracted arethe position, the size and the orientation of the targeted”object”. These parameters are formulated in 2D or 3Dfunctions to represent the tomographic or volumetric im-age respectively, of the radiotracers’ distribution.
In SPECT, the obtained data is the set of measuredprojections of the radiotracers’ distribution. AMIAS gen-erates the projections of the modelled target by imple-menting forward projection simulations.
3 Simulation Study
The capability of the method to provide reliable recon-struction results was examined by using generated datafrom computerized phantoms. This task was achieved bysimulating 24 projections of a 64 × 64 phantom image asit is shown in Fig. 2. The methodology was examined onfour different simulation studies. In each case, the simu-lated radioactivity of background was adjusted to producedifferent Target-to-Background (T:B) ratio. Each one ofthe sets of planar projections was randomized by usingthe Poison random distribution.
Reconstruction results of the phantom are shown inFig. 3 as they were extracted with the AMIAS reconstruc-tion methodology. The model parameters were derivedfrom their Probability Distribution Functions (PDFs) andused to visualize the tomographic image of the phantom.Reconstruction results obtained by the Filtered Back Pro-jection (FBP), the Algebraic Reconstruction Techniqueand the Maximum Likelihood Expectation Maximization
user
Text Box
L. Koutsantonis et al.: Employing a novel analysis method for single photon emission computed tomography 98
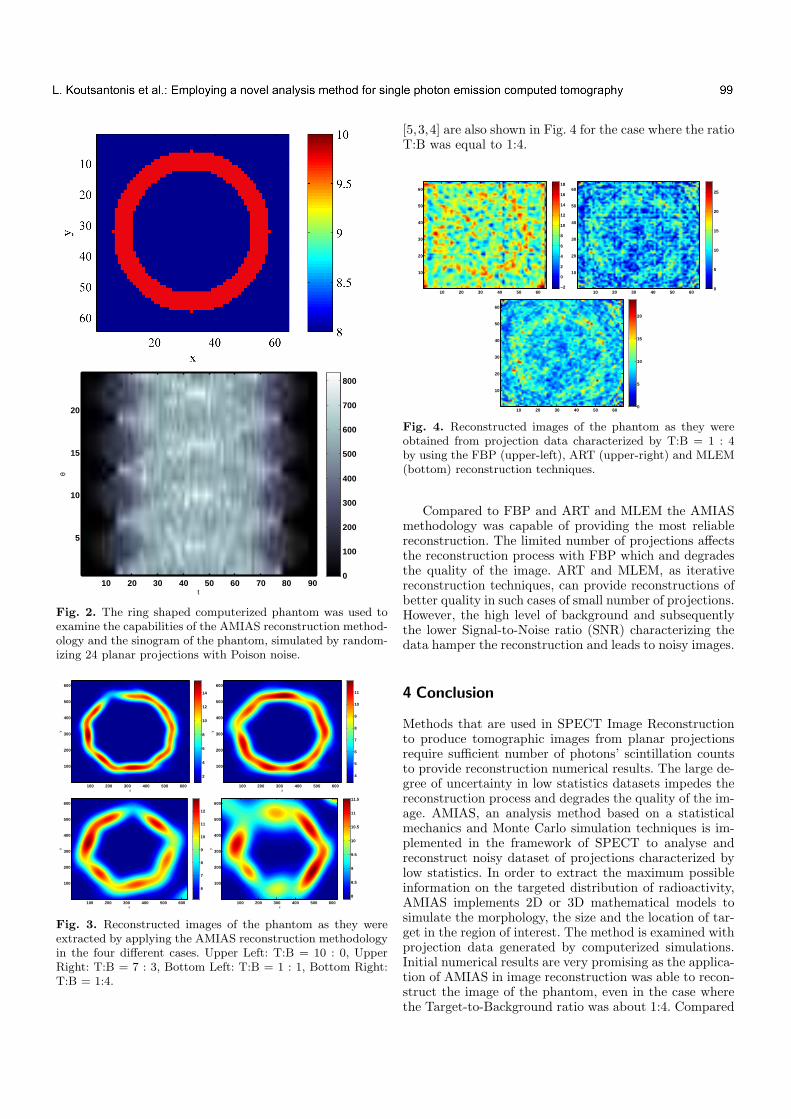
3
t
θ
10 20 30 40 50 60 70 80 90
5
10
15
20
0
100
200
300
400
500
600
700
800
Fig. 2. The ring shaped computerized phantom was used toexamine the capabilities of the AMIAS reconstruction method-ology and the sinogram of the phantom, simulated by random-izing 24 planar projections with Poison noise.
x
y
100 200 300 400 500 600
100
200
300
400
500
600
2
4
6
8
10
12
14
x
y
100 200 300 400 500 600
100
200
300
400
500
600
4
5
6
7
8
9
10
11
x
y
100 200 300 400 500 600
100
200
300
400
500
600
6
7
8
9
10
11
12
x
y
100 200 300 400 500 600
100
200
300
400
500
600
8
8.5
9
9.5
10
10.5
11
11.5
Fig. 3. Reconstructed images of the phantom as they wereextracted by applying the AMIAS reconstruction methodologyin the four different cases. Upper Left: T:B = 10 : 0, UpperRight: T:B = 7 : 3, Bottom Left: T:B = 1 : 1, Bottom Right:T:B = 1:4.
[5,3,4] are also shown in Fig. 4 for the case where the ratioT:B was equal to 1:4.
10 20 30 40 50 60
10
20
30
40
50
60
−2
0
2
4
6
8
10
12
14
16
18
10 20 30 40 50 60
10
20
30
40
50
60
0
5
10
15
20
25
10 20 30 40 50 60
10
20
30
40
50
60
0
5
10
15
20
Fig. 4. Reconstructed images of the phantom as they wereobtained from projection data characterized by T:B = 1 : 4by using the FBP (upper-left), ART (upper-right) and MLEM(bottom) reconstruction techniques.
Compared to FBP and ART and MLEM the AMIASmethodology was capable of providing the most reliablereconstruction. The limited number of projections affectsthe reconstruction process with FBP which and degradesthe quality of the image. ART and MLEM, as iterativereconstruction techniques, can provide reconstructions ofbetter quality in such cases of small number of projections.However, the high level of background and subsequentlythe lower Signal-to-Noise ratio (SNR) characterizing thedata hamper the reconstruction and leads to noisy images.
4 Conclusion
Methods that are used in SPECT Image Reconstructionto produce tomographic images from planar projectionsrequire sufficient number of photons’ scintillation countsto provide reconstruction numerical results. The large de-gree of uncertainty in low statistics datasets impedes thereconstruction process and degrades the quality of the im-age. AMIAS, an analysis method based on a statisticalmechanics and Monte Carlo simulation techniques is im-plemented in the framework of SPECT to analyse andreconstruct noisy dataset of projections characterized bylow statistics. In order to extract the maximum possibleinformation on the targeted distribution of radioactivity,AMIAS implements 2D or 3D mathematical models tosimulate the morphology, the size and the location of tar-get in the region of interest. The method is examined withprojection data generated by computerized simulations.Initial numerical results are very promising as the applica-tion of AMIAS in image reconstruction was able to recon-struct the image of the phantom, even in the case wherethe Target-to-Background ratio was about 1:4. Compared
user
Text Box
L. Koutsantonis et al.: Employing a novel analysis method for single photon emission computed tomography 99

4
to the results from conventional methods, commonly usedin SPECT, AMIAS images provide the highest detectabil-ity of the targeting distribution.
References
1. C.N. Papanicolas and E. Stiliaris, A novel methodof data analysis for hadronic physics. arXiv preprintarXiv:1205.6505, 2012.
2. E. Stiliaris and C.N. Papanicolas. Multiple extraction:A novel, model independent method. arXiv preprint nucl-ex/0703031, 2007.
3. L.A. Shepp and Y. Vardi. Maximum likelihood recon-struction for emission tomography. Med. Im., IEEE Trans.,1(2):113122, 1982.
4. D. Hwang and G. L. Zeng, Convergence study of an accel-erated ML-EM algorithm using bigger step size, Phys. Med.Biol., vol. 51, no. 2, p. 237, 2006.
5. S. Angeli and E. Stiliaris, An accelerated algebraic recon-struction technique based on the Newton-Raphson scheme,in 2009 IEEE NSS/MIC, Oct 2009, pp. 33823387.
Powered by TCPDF (www.tcpdf.org)Powered by TCPDF (www.tcpdf.org)Powered by TCPDF (www.tcpdf.org)
user
Text Box
L. Koutsantonis et al.: Employing a novel analysis method for single photon emission computed tomography 100
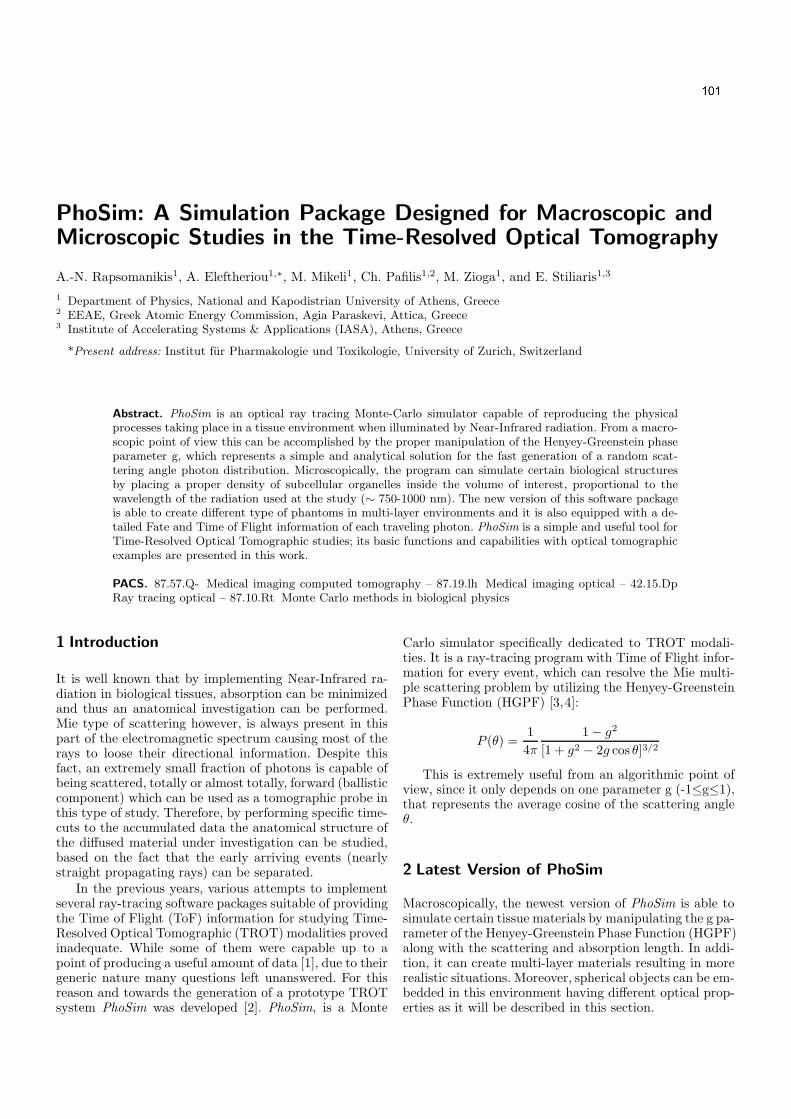
PhoSim: A Simulation Package Designed for Macroscopic andMicroscopic Studies in the Time-Resolved Optical Tomography
A.-N. Rapsomanikis1, A. Eleftheriou1,∗, M. Mikeli1, Ch. Pafilis1,2, M. Zioga1, and E. Stiliaris1,3
1 Department of Physics, National and Kapodistrian University of Athens, Greece2 EEAE, Greek Atomic Energy Commission, Agia Paraskevi, Attica, Greece3 Institute of Accelerating Systems & Applications (IASA), Athens, Greece
*Present address: Institut fur Pharmakologie und Toxikologie, University of Zurich, Switzerland
Abstract. PhoSim is an optical ray tracing Monte-Carlo simulator capable of reproducing the physicalprocesses taking place in a tissue environment when illuminated by Near-Infrared radiation. From a macro-scopic point of view this can be accomplished by the proper manipulation of the Henyey-Greenstein phaseparameter g, which represents a simple and analytical solution for the fast generation of a random scat-tering angle photon distribution. Microscopically, the program can simulate certain biological structuresby placing a proper density of subcellular organelles inside the volume of interest, proportional to thewavelength of the radiation used at the study (∼ 750-1000 nm). The new version of this software packageis able to create different type of phantoms in multi-layer environments and it is also equipped with a de-tailed Fate and Time of Flight information of each traveling photon. PhoSim is a simple and useful tool forTime-Resolved Optical Tomographic studies; its basic functions and capabilities with optical tomographicexamples are presented in this work.
PACS. 87.57.Q- Medical imaging computed tomography – 87.19.lh Medical imaging optical – 42.15.DpRay tracing optical – 87.10.Rt Monte Carlo methods in biological physics
1 Introduction
It is well known that by implementing Near-Infrared ra-diation in biological tissues, absorption can be minimizedand thus an anatomical investigation can be performed.Mie type of scattering however, is always present in thispart of the electromagnetic spectrum causing most of therays to loose their directional information. Despite thisfact, an extremely small fraction of photons is capable ofbeing scattered, totally or almost totally, forward (ballisticcomponent) which can be used as a tomographic probe inthis type of study. Therefore, by performing specific time-cuts to the accumulated data the anatomical structure ofthe diffused material under investigation can be studied,based on the fact that the early arriving events (nearlystraight propagating rays) can be separated.
In the previous years, various attempts to implementseveral ray-tracing software packages suitable of providingthe Time of Flight (ToF) information for studying Time-Resolved Optical Tomographic (TROT) modalities provedinadequate. While some of them were capable up to apoint of producing a useful amount of data [1], due to theirgeneric nature many questions left unanswered. For thisreason and towards the generation of a prototype TROTsystem PhoSim was developed [2]. PhoSim, is a Monte
Carlo simulator specifically dedicated to TROT modali-ties. It is a ray-tracing program with Time of Flight infor-mation for every event, which can resolve the Mie multi-ple scattering problem by utilizing the Henyey-GreensteinPhase Function (HGPF) [3,4]:
P (θ) =1
4π
1− g2
[1 + g2 − 2g cos θ]3/2
This is extremely useful from an algorithmic point ofview, since it only depends on one parameter g (-1≤g≤1),that represents the average cosine of the scattering angleθ.
2 Latest Version of PhoSim
Macroscopically, the newest version of PhoSim is able tosimulate certain tissue materials by manipulating the g pa-rameter of the Henyey-Greenstein Phase Function (HGPF)along with the scattering and absorption length. In addi-tion, it can create multi-layer materials resulting in morerealistic situations. Moreover, spherical objects can be em-bedded in this environment having different optical prop-erties as it will be described in this section.
user
Text Box
101

2
2.1 Generation of a Multi-Layer Environment
The generation of multi-layer environment in PhoSim canbe achieved by varying the g parameter of the HGPF andthe Scattering Length (SL) for certain propagation areasof the medium along the Z-axis as it is depicted at theexample in Figure 1. This is a simple but effective and
Z
Y
X
(g1, SL1) (g2, SL2) (g3, SL3)
Fig. 1. An example of a 3-layered medium. Each colored areahas a specific value of the Henyey-Greenstein parameter (g)and Scattering Length (SL).
also a computational ”economic” way of creating realis-tic tissue structures which enables investigation of morecomplex scenarios.
2.2 Phantom Creation and Properties
Different optical type phantoms with spherical objectscan be introduced inside the multi-layer areas defined inPhoSim. They can be (i) perfect reflectors, (ii) classical op-tical objects obeying Fresnel’s rule of reflection and trans-mission for non-polarized photons, (iii) diffusers, followingthe Snell’s law of deflection and refraction and which al-low the rays either to be reflected in a cone of angle θ0 orto be refracted (Figure 2). All these phantom objects arecharacterized by their own refraction index ni.
The program calculates in a stochastic way the path ofthe light ray on each interaction point with the sphericalobject of the phantom. The Fresnel equation is a deriva-tion of Maxwell’s equation and calculates the reflectanceRs for s-polarized and Rp for p-polarized photons:
Rs =
∣∣∣∣na cos θπ − nb cos θδna cos θπ + nb cos θδ
∣∣∣∣2
Rp =
∣∣∣∣na cos θδ − nb cos θπna cos θδ + nb cos θπ
∣∣∣∣2
The probability for unpolarized light to be reflected isgiven by the mean value of these two components and canbe expressed as a function of the incoming angle θπ andthe relative refraction index nba = nb/na in the followingway:
R =1
2
∣∣∣∣cos θπ − nba ×F
cos θπ + nba ×F
∣∣∣∣2
+
∣∣∣∣F − nba cos θπF + nba cos θπ
∣∣∣∣2
with
F =
√
1−1− cos2θπ
n2
ba
The previous expression for the calculation of the ray re-flectance includes only the cosine of the incoming angleand the refraction index of the spherical object relativeto the medium. Total reflection inside a phantom’s ob-ject is possible; the fate of the ray is decided alone on apredefined maximum absorption length for the simulatedpath.
2.3 Ray Tracing and Time of Flight Information inPhoSim
PhoSim can ray-trace every event throughout the differentsimulated tissue materials (Figure 3) and can provide the
Fig. 3. Left : Profile image of Ray-Tracing (XZ-Plane) insidea multi-layer, scattering medium containing a phantom withfour out-of-plane spherical objects. Right : 3D Ray-Tracing forthe same phantom.
Fate (absorbed by the phantom, absorbed by the tissue,escaped, timed out, detected) on a event-by-event basis.However, the most important aspect of this algorithm is
Time of Flight Spectrum
Fig. 4. The Time of Flight information (in arbitrary units) ofa case study for all the detected photons. With red is indicatedthe ballistic component, which represents the forward scatteredevents. The vertical axis corresponds to the detected numberof photons.
user
Text Box
A.-N. Rapsomanikis et al.: PhoSim: A Simulation Package designed for Studies in the Time-Resolved Optical Tomography 102

3
Fig. 2. The basic mechanisms for the light interaction with the phantom spherical objects incorporated in PhoSim. Left : Aperfect reflecting spherical object (θπ = θα). Middle: A classic spherical optical object obeying the Snell law of reflection andrefraction (θπ = θα and na sin θπ = nb sin θδ). Right : A diffusing spherical object which allows the reflected ray to be inside acone of angle θ0 and the refracted ray to follow Snell’s law.
the ability to calculate the Time of Flight (ToF) informa-tion for each traveling photon using its optical path seg-ments and the refraction index of the medium (Figure 4).This information is extremely useful; by applying propertime filtering on the collected data one can extract the im-portant ballistic component, which provides the anatom-ical information of the simulated biological tissue.
2.4 Planar Imaging and Tomographic Capabilities
Since the Time of Flight information provided for simu-lated rays allows a proper event filtering, planar imagingdetection can be achieved in PhoSim. This functionality ishere demonstrated with a software phantom consisting offour out-of-plane and totaly absorbing spherical objects.
Fig. 5. Left : Detected raw image of a case study phantom ina three-layered medium with dimensions 10x10x5 in arbitrarylength units. The phantom consists of four out-of-plane, totalyabsorbing spherical objects with a diameter of 0.8 a.u. Right :Detected planar image of the phantom after proper time filter-ing.
This geometry was embedded in a three-layered, highlyscattering medium and a collimated beam light, parallelto Z-axis, was utilized to probe the sample. The planarimage of all the detected events without any filtering canbe recorded, providing no anatomical information at all, as
shown in the left part of Figure 5. However, the phantom’spattern can be obtained after performing the necessarytime-cuts on the collected data. The right part of Figure 5shows clearly the planar image profile of the phantom inthe time-filtered image.
The clear structure of the planar images further allowsa tomographic reconstruction of the phantom’s geometryon the three-dimensional space. A total of 24 projectionswith a step of 15o in the full angle range 0o − 360o wererecorded. Results are obtained for each projection withtime-filtering up to an optimal level. Every projection wassliced 80 times along the X-axis (the rotation axis) and fur-ther analyzed to reconstruct the tomographic images usingiterative reconstruction algorithms developed in our labo-ratory, which are mainly based on accelerated algorithmswithin the Algebraic Reconstruction Technique (ART) [5].
Finally, all the two-dimensional tomograms (80 slices)were appropriately stacked and interpolated creating a 3Dtomographic image in the form of an iso-surface plot. Forthe simulated phantom the reconstructed result is shownin Figure 6.
Fig. 6. The iso-surfaced 3D image of the original phantomafter stacking all the sliced two-dimensional reconstructed to-mograms.
user
Text Box
A.-N. Rapsomanikis et al.: PhoSim: A Simulation Package designed for Studies in the Time-Resolved Optical Tomography 103

4
Fig. 7. Left Row : Detection efficiency as a function of the Scattering Length (SL) for different values of the Henyey-Greensteing parameter in both linear and logarithmic scale. Right Row : Detection efficiency as a function of the Henyey-Greenstein gparameter for different Scattering Length (SL) values in both linear and logarithmic scale.
3 System Efficiency Validation
A highly diffused medium allows only a small part ofthe transmitted photons to be detected. For a simple tis-sue medium of specific dimensions 10x10x5 (in arbitrarylength units) the response of the system was here studied.The ratio of the emitted photons from a point source tothe number of the detected events defines the efficiency ofthe system:
ε =Ndetected
Ninitiated
This quantity was examined for two opposite cases. First,by maintaining constant the Scattering Length SL of themedium and varying the Henyey-Greenstein g parame-ter and second, by maintaining constant the g parameterand varying the Scattering Length SL. The g parameter isvarying in the typical range 0.80 < g < 0.95 covering real-istic tissue values, while the Scattering Length SL variesin the range 0.1 < SL < 1.0 of the arbitrary length unit.Results are depicted in the Figure 7.
In order to examine the effect of the ordering of thediffuse media in the system’s detection efficiency, follow-ing case study has been performed. In this investigation,simple phantoms consisting of two different iso-volumetricmaterials were placed in contact; the efficiency was eval-uated by commutating the two volumes for various com-binations of g and Scattering Lengths SL. The results aresummarized in the tables I and II.
The results indicate that, if a biological tissue is to betime resolve investigated, the efficient way to proceed isby illuminating first (if possible in a real case) the area ofgrater g parameter, larger Scattering Length SL or bothat the same time and by detecting the arriving photons
Table 1. Efficiency for g=0.95
Material 1 (au) Material 2 (au) Efficiency %
SL = 0.1 SL = 0.2 2.11SL = 0.2 SL = 0.1 2.47SL = 0.1 SL = 0.3 3.26SL = 0.3 SL = 0.1 4.27SL = 0.1 SL = 0.5 4.72SL = 0.5 SL = 0.1 7.81SL = 0.1 SL = 0.8 6.25SL = 0.8 SL = 0.1 13.10
Table 2. Efficiency for SL=0.30 au
Material 1 Material 2 Efficiency %
g = 0.80 g = 0.99 8.06g = 0.99 g = 0.80 11.52g = 0.81 g = 0.98 7.17g = 0.98 g = 0.81 9.64g = 0.83 g = 0.96 6.32g = 0.96 g = 0.83 7.83g = 0.86 g = 0.93 5.86g = 0.93 g = 0.86 6.53
at the more diffusive area. This can be explained by con-sidering the fact that the rays which begin to travel in avolume with lower scattering properties tend to keep theirdirectional information longer than the ones in a turbitenvironment. Hence, it is less likely to loose that ”knowl-edge” by entering a low scattering medium and exiting ata higher one, rather than following the opposite direction.
user
Text Box
A.-N. Rapsomanikis et al.: PhoSim: A Simulation Package designed for Studies in the Time-Resolved Optical Tomography 104

5
4 Microscopic Mode in PhoSim
From a microscopic point of view PhoSim can introducea specific density of subcellular organelles in the form ofspherical objects in a cubic grid formation. The programallows for a given material the input of an externally calcu-lated scattering angle spectrum based on the microscopicMie theory. In addition, the canonically repeated stereo-metric structure can be described with software parame-ters allowing the creation of the proper environment suit-able for microscopic studies. The diameter of the equidis-tant spherical objects must be of the same size as thewavelength of the Near-Infrared radiation used to probethe biological material under investigation. However, thecomputational time and processing power for a typical mi-croscopic study is by far more time consuming comparedto the Henyey-Greenstein Monte-Carlo approach.
5 Conclusions
It is clear that PhoSim in its current version can be usedfor Time-Resolved Optical Tomography (TROT) studiesof complicated materials for biological purposes. More-over, the characteristics of the software along with theaforementioned properties and its simplicity make it an at-tractive tool for investigating light transmission in a vari-ety of turbit environments, such as atmospherical, oceanicor stelar. The future versions of PhoSim will extend to dif-ferent phantom geometries (cones, cylinders, ellipsoids) in
order to simulate organs as well as other, more compli-cated phantoms. They will be able to behave as diffusingstructures following the same procedure as the outer tissueenvironment described earlier.
References
1. A.-N. Rapsomanikis, A. Eleftheriou, M. Mikeli, M. Ziogaand E. Stiliaris: Time Resolved Optical Tomographic Imag-
ing: A Simulation Study, 2014 IEEE Nuclear Science Sym-posium and Medical Imaging Conference M19-95 (2014).
2. A.-N. Rapsomanikis, A. Eleftheriou, M. Mikeli, Ch. Pafilis,M. Zioga and E. Stiliaris: A Monte Carlo Simulator Ded-
icated to a Time-Resolved Optical Tomographic Modality
Based on Henyey-Greenstein Phase Function, 2015 IEEENuclear Science Symposium and Medical Imaging Confer-ence M5BP-163 (2015).
3. L.G. Henyey and J.L. Greenstein: Diffuse radiation in the
galaxy, Astrophys. J. 93 (1941) 70–83.
4. T. Binzoni, T.S. Leung, A.H. Gandjbakhche, D. Ruefenachtand D.T. Delpy: The use of the Henyey-Greenstein phase
function in Monte Carlo simulations in biomedical optics,Phys. Med. Biol. 51 (2006) N313–N322.
5. S. Angeli and E. Stiliaris: An Accelerated Algebraic Recon-
struction Technique based on the Newton-Raphson Scheme,2009 IEEE Nuclear Science Symposium and Medical Imag-ing Conference M09-323 (2009) 3382–3387.
Powered by TCPDF (www.tcpdf.org)Powered by TCPDF (www.tcpdf.org)Powered by TCPDF (www.tcpdf.org)Powered by TCPDF (www.tcpdf.org)
user
Text Box
A.-N. Rapsomanikis et al.: PhoSim: A Simulation Package designed for Studies in the Time-Resolved Optical Tomography 105

Mastering Conic Sections for a Direct 3D Compton ImageReconstruction
M. Mikeli1, M. Zioga1, A. Eleftheriou1,∗, Ch. Pafilis1,2, A.-N. Rapsomanikis1, and E. Stiliaris1,3
1 Department of Physics, National and Kapodistrian University of Athens, Greece2 EEAE, Greek Atomic Energy Commission, Agia Paraskevi, Attica, Greece3 Institute of Accelerating Systems & Applications (IASA), Athens, Greece
*Present address: Institut fur Pharmakologie und Toxikologie, University of Zurich, Switzerland
Abstract. Given the complexity of the image reconstruction procedures for Compton Camera events, es-pecially when a 3D image is required for distributed sources in space, a simple, direct algorithmic approachis presented in this work. The recently developed ComptonRec package carefully handles the geometryof the conic sections to accumulate ray density distribution in a user defined voxelized volume inside thespecified field of interest. Prior to planar reconstruction, the event selection part of the program filtersout misidentified coincidence events and other physical background events with unbalanced total energyor inverse interaction sequence with the cameras subsystems. For each accepted event a series of planarreconstructions is performed, where the density distribution is the accumulation product of the conic in-tersection with all the affected pixels. A 3D image is finally reconstructed by assembling the partial planarinformation and by taking into account volume effects. The efficiency of this reconstruction method ischecked with a plethora of simulated phantoms and results are presented and discussed.
PACS. 87.57.Q- Medical imaging computed tomography – 34.50.-s Compton scattering in atoms – 07.85.FvGamma-ray detectors – 07.05.Tp Computer modeling and simulation – 87.64.Aa Spectroscopy in medicalphysics
1 Introduction
In Nuclear Medicine a general purpose γ-Camera deviceis commonly used. Since its introduction, it has become astandard choice for clinical in vivo tests. Mechanical col-limation is used by the γ-Camera in order to localize thephoton source. This unfortunately leads to intrinsic lim-itations in sensitivity and spatial resolution, which couldbe overcame by the equivalent usage of electronic collima-tion in the configuration of a Compton Camera [1]. Thiskind of collimation is able to define the locus of a γ-ray byusing a geometrical interpretation of the Compton Scat-tering. One major drawback of the Compton Camera isthe difficulty of its image reconstruction. The algorithmicapproach presented in this work in the fashion of a stan-dalone program, the ComptonRec package, is assumingto serve as a simple, direct geometrical solution based onthe appropriate handling of the conic sections involved inthe 3D image reconstruction of a Compton Camera.
2 Principle of Operation
A Compton Camera consists of two detectors that operateusing time coincidence, the Scatterer and the Absorber,
where the latter replaces the mechanical collimator [2] [3].The Camera’s functionality relies on the Compton Scat-tering effect. An initial photon of the source interacts withthe first thin detector and then it is absorbed by the sec-ond thicker one. The interaction point at each detectorand the energy deposited in the Absorber are detected forevery single event.
-Camera
Initial Photon
After
Compton Scattering
-Source
Fig. 1. Schematic explanation of the Compton Camera oper-ation with a single layer Scatterer.
user
Text Box
106

2
A conical surface (Figure 1) is formed with its ver-tex defined by the first interaction point, while its axis isdetermined by the two interaction location points in bothdetectors. The cone angle θ is determined by the Comptonequation as
θ = cos−1
[1 +m0c
2
(1
Eγ−
1
E′γ
)](1)
where Eγ is the initial gamma energy of the radiotracerand E′
γ the detected energy in the Absorber. This coni-cal surface defines the locus of the emitted initial gammaphoton from the source.
3 Reconstruction Techniques
As in conventional SPECT and PET, reconstruction al-gorithms for Compton Camera imaging may be broadlyclassified as either analytical or iterative methods. Themost commonly used reconstruction algorithms show, notonly for the Compton Camera modality, known and sig-nificant disadvantages.
– Analytical algorithms: Require large number of dataand need to solve complex mathematical problems.They have proven to be unstable and also they cannot handle complicated factors, present in the Comp-ton Camera, mainly induced by the spatial intensityvariation.
– Iterative algorithms: Need the use of spherical harmon-ics and due to the above mentioned variation are lessefficient.
Compton Imaging in 3D is complicated by the fact thatthe point spread function varies from event to event, de-pending on the location of the interaction. Any reconstruc-tion procedure for this modality is seeking to optimallydetermine the intersection points for all conical surfacescorresponding to all measured events [4]. In order to min-imize computational time and to achieve optimum imagequality an event based reconstruction technique is prefer-able.
4 The ComptonRec Program
A novel, simple and direct algorithmic approach, that mas-ters conic sections in a user defined voxelized volume ishere proposed. The main action in the event loop is theconical surface calculation for a selected event and itsconic section with the corresponding Z plane inside thecameras Field of View (Figure 2). Accumulated informa-tion is stored pixelwise in each of the predefined Z planes.The final 3D image is assembled by taking into accountvolume effects. In order to reduce background events var-ious cuts must be implemented.
Fig. 2. Reconstruction of a point source in a planar ComptonCamera image based on conical intersections.
4.1 Conic Sections
Supposing that the two interaction points in the Scat-terer and the Absorber are defined by the coordinates(x1, y1, z1) and (x2, y2, z2) respectively as shown in Fig-ure 3 and that through the measured energy depositionE′
γ in the Absorber the cone angle θ is reconstructed as in(1), the analytic equation for the associated conic sectionof this event with the projection plane ZL can be foundfollowing next steps.
The basic analytic equation which defines the eventcone is the scalar product
u · d = |u||d|cosθ (2)
where u is the vector which describes the location of allpoints on the event cone surface and d is the vector definedby the two measured interaction points:
u = (x− x1, y − y1, z − z1) (3)
d = (x1 − x2, y1 − y2, z1 − z2) (4)
By squaring equation (2) the event cone definition throughthe inner product now reads:
(u · d)2− (u · u)(d · d)cos2θ = 0 (5)
and by taking into account that the conic section with agiven plane z = ZL specifies the scalar products to the
user
Text Box
M. Mikeli, M. Zioga et al.: Mastering Conic Sections for a Direct 3D Compton Image Reconstruction 107
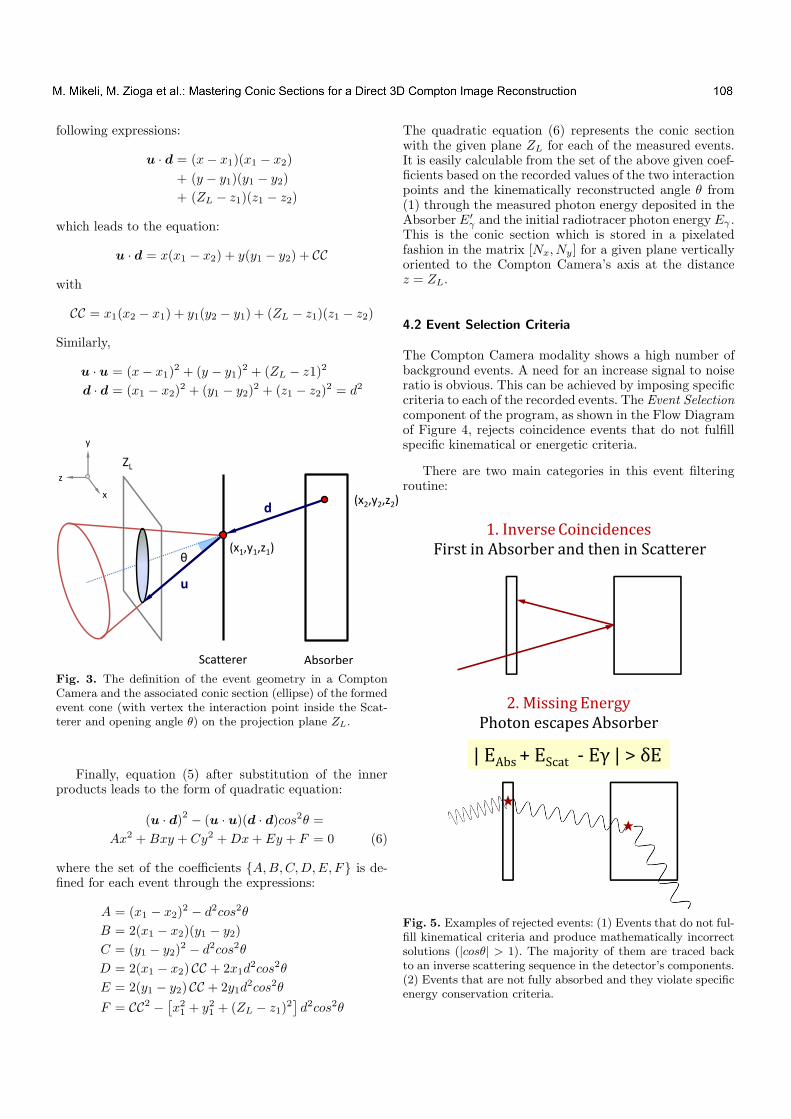
3
following expressions:
u · d = (x− x1)(x1 − x2)
+ (y − y1)(y1 − y2)
+ (ZL − z1)(z1 − z2)
which leads to the equation:
u · d = x(x1 − x2) + y(y1 − y2) + CC
with
CC = x1(x2 − x1) + y1(y2 − y1) + (ZL − z1)(z1 − z2)
Similarly,
u · u = (x− x1)2 + (y − y1)
2 + (ZL − z1)2
d · d = (x1 − x2)2 + (y1 − y2)
2 + (z1 − z2)2 = d2
(x2,y2,z2)
(x1,y1,z1)
d
u
ZL
Scatterer Absorber
x
y
z
Fig. 3. The definition of the event geometry in a ComptonCamera and the associated conic section (ellipse) of the formedevent cone (with vertex the interaction point inside the Scat-terer and opening angle θ) on the projection plane ZL.
Finally, equation (5) after substitution of the innerproducts leads to the form of quadratic equation:
(u · d)2− (u · u)(d · d)cos2θ =
Ax2 + Bxy + Cy2 +Dx+ Ey + F = 0 (6)
where the set of the coefficients A,B,C,D,E, F is de-fined for each event through the expressions:
A = (x1 − x2)2 − d2cos2θ
B = 2(x1 − x2)(y1 − y2)
C = (y1 − y2)2 − d2cos2θ
D = 2(x1 − x2) CC + 2x1d2cos2θ
E = 2(y1 − y2) CC + 2y1d2cos2θ
F = CC2 −[x2
1+ y2
1+ (ZL − z1)
2]d2cos2θ
The quadratic equation (6) represents the conic sectionwith the given plane ZL for each of the measured events.It is easily calculable from the set of the above given coef-ficients based on the recorded values of the two interactionpoints and the kinematically reconstructed angle θ from(1) through the measured photon energy deposited in theAbsorber E′
γ and the initial radiotracer photon energy Eγ .This is the conic section which is stored in a pixelatedfashion in the matrix [Nx, Ny] for a given plane verticallyoriented to the Compton Camera’s axis at the distancez = ZL.
4.2 Event Selection Criteria
The Compton Camera modality shows a high number ofbackground events. A need for an increase signal to noiseratio is obvious. This can be achieved by imposing specificcriteria to each of the recorded events. The Event Selectioncomponent of the program, as shown in the Flow Diagramof Figure 4, rejects coincidence events that do not fulfillspecific kinematical or energetic criteria.
There are two main categories in this event filteringroutine:
Fig. 5. Examples of rejected events: (1) Events that do not ful-fill kinematical criteria and produce mathematically incorrectsolutions (|cosθ| > 1). The majority of them are traced backto an inverse scattering sequence in the detector’s components.(2) Events that are not fully absorbed and they violate specificenergy conservation criteria.
user
Text Box
M. Mikeli, M. Zioga et al.: Mastering Conic Sections for a Direct 3D Compton Image Reconstruction 108
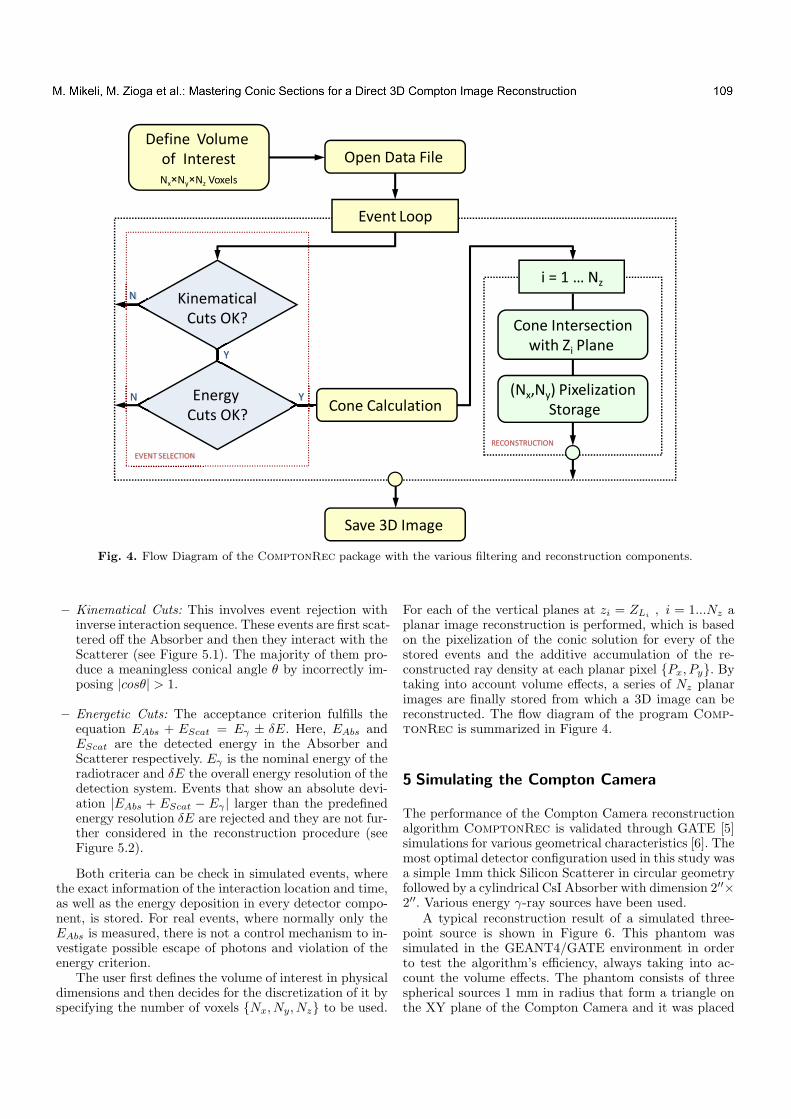
4
Cone Intersection
with Zi Plane
(Nx,Ny) Pixelization
Storage
z
RECONSTRUCTION
Energy
Cuts OK?
Kinematical
Cuts OK?
Cone Calculation
EVENT SELECTION
Y
Y
N
N
Define Volume
of Interest
Nx Ny Nz Voxels
Open Data File
Event Loop
Save 3D Image
Fig. 4. Flow Diagram of the ComptonRec package with the various filtering and reconstruction components.
– Kinematical Cuts: This involves event rejection withinverse interaction sequence. These events are first scat-tered off the Absorber and then they interact with theScatterer (see Figure 5.1). The majority of them pro-duce a meaningless conical angle θ by incorrectly im-posing |cosθ| > 1.
– Energetic Cuts: The acceptance criterion fulfills theequation EAbs + EScat = Eγ ± δE. Here, EAbs andEScat are the detected energy in the Absorber andScatterer respectively. Eγ is the nominal energy of theradiotracer and δE the overall energy resolution of thedetection system. Events that show an absolute devi-ation |EAbs + EScat − Eγ | larger than the predefinedenergy resolution δE are rejected and they are not fur-ther considered in the reconstruction procedure (seeFigure 5.2).
Both criteria can be check in simulated events, wherethe exact information of the interaction location and time,as well as the energy deposition in every detector compo-nent, is stored. For real events, where normally only theEAbs is measured, there is not a control mechanism to in-vestigate possible escape of photons and violation of theenergy criterion.
The user first defines the volume of interest in physicaldimensions and then decides for the discretization of it byspecifying the number of voxels Nx, Ny, Nz to be used.
For each of the vertical planes at zi = ZLi, i = 1...Nz a
planar image reconstruction is performed, which is basedon the pixelization of the conic solution for every of thestored events and the additive accumulation of the re-constructed ray density at each planar pixel Px, Py. Bytaking into account volume effects, a series of Nz planarimages are finally stored from which a 3D image can bereconstructed. The flow diagram of the program Comp-
tonRec is summarized in Figure 4.
5 Simulating the Compton Camera
The performance of the Compton Camera reconstructionalgorithm ComptonRec is validated through GATE [5]simulations for various geometrical characteristics [6]. Themost optimal detector configuration used in this study wasa simple 1mm thick Silicon Scatterer in circular geometryfollowed by a cylindrical CsI Absorber with dimension 2′′×2′′. Various energy γ-ray sources have been used.
A typical reconstruction result of a simulated three-point source is shown in Figure 6. This phantom wassimulated in the GEANT4/GATE environment in orderto test the algorithm’s efficiency, always taking into ac-count the volume effects. The phantom consists of threespherical sources 1 mm in radius that form a triangle onthe XY plane of the Compton Camera and it was placed
user
Text Box
M. Mikeli, M. Zioga et al.: Mastering Conic Sections for a Direct 3D Compton Image Reconstruction 109

5
Fig. 6. Reconstruction with the ComptonRec program of asimple coplanar three-point source phantom. Upper Part: In-tersection of the conical surfaces with the reconstruction planefor some of the accumulated events. The location of the threeγsources is indicated with closed circles Lower Part: Contourplot of the reconstructed planar image for the same phantomwith full statistics.
at a distance of 60 mm away from the Scatterer. Theexact location of the three sources was S1(−15mm, 0),S2(+15mm, 0) and S2(0,+15mm). The reconstructed pla-nar image with the ComptonRec package in the form ofa contour plot is shown in the lower part of Figure 6.
However, the reconstructed image is normally affectedby the strong solid angle variation with the distance ofthe Compton Camera system and thus characterized withdeformation errors. In order to overcome these effects, thedetection efficiency is extensively studied and a correc-tion procedure to optimize the previously described recon-struction technique is proposed. It takes into account allpossible factors that potentially cause the non-uniformityin the angular acceptance of the system and influence itsperformance, such as the interaction probability of theincoming γ-photon of a given energy with both detectorsubsystems.
6 The Correction Model
The basic methodology, how the non-uniformity in theangular acceptance of a simple Compton Camera is deter-mined by means of a Monte Carlo study, is described inthis section. The geometrical characteristics of the Scat-terer and the Absorber define in a complicated way theangular acceptance of a Compton Camera. This complica-tion enhanced by the angular dependence of the ComptonEffect requires an extensive simulation of all electromag-netic interactions for a given detector geometry and for afixed energy of the emitted photons [7].
6.1 A Membrane Source
A two stage Compton Camera is modeled using the GATEMonte Carlo simulation package. For reasons of simplicity,the Scatterer is simulated as a 2 mm thick Silicon homo-geneous cylinder with a diameter of 50 mm. Similarly, theAbsorber is a 50 mm × 50 mm CsI cylinder.
In order to investigate and quantify the detection effi-ciency of the system, a plane phantom source (membrane)with the same dimensions 50 mm × 50 mm as the detectorwindow is simulated. This plane source, emitting isotrop-ically photons of a constant energy Eγ , is placed at a dis-tance D from the Scatterer. Due to the angular and phys-ical acceptance of the system, the reconstructed planarimage has no more a uniformly distributed intensity butit exhibits a symmetrical Gauss form. A sufficient numberof simulation studies at different distances D which coverthe whole area of interest inside the Field of View (FoV)of the system has been performed.
6.2 The Fitting Procedure
For a given distance D between the plane γ-source (mem-brane) and the head of the Compton Camera a matrixthat contains the amount of the detected and acceptedsource photons is formed. Although the phantom sourceis of homogeneous nature, due to the angular variation ofthe efficiency mentioned above, this matrix exhibits a non-uniform but symmetrical character. This effect is clearlydepicted in Figure 7, where the number of the detectedsource photons are shown in the form of a Lego plot.
The symmetric around the camera’s axis intensity dis-tribution in the (x,y)-plane can be approached by a two-dimensional Gaussian distribution in the form of:
I(x, y,D) = A(D)exp
[−(R−R0)
2
2σ2(D)
](7)
where, R =√x2 + y2 is the radial distance from the axis
and A(D) and σ(D) are two free fit parameters depend-ing on the distance D of the plane source. The parameterA(D) corresponds to the maximum γ-ray intensity accu-mulated at the center of the image, while σ(D) represents
user
Text Box
M. Mikeli, M. Zioga et al.: Mastering Conic Sections for a Direct 3D Compton Image Reconstruction 110
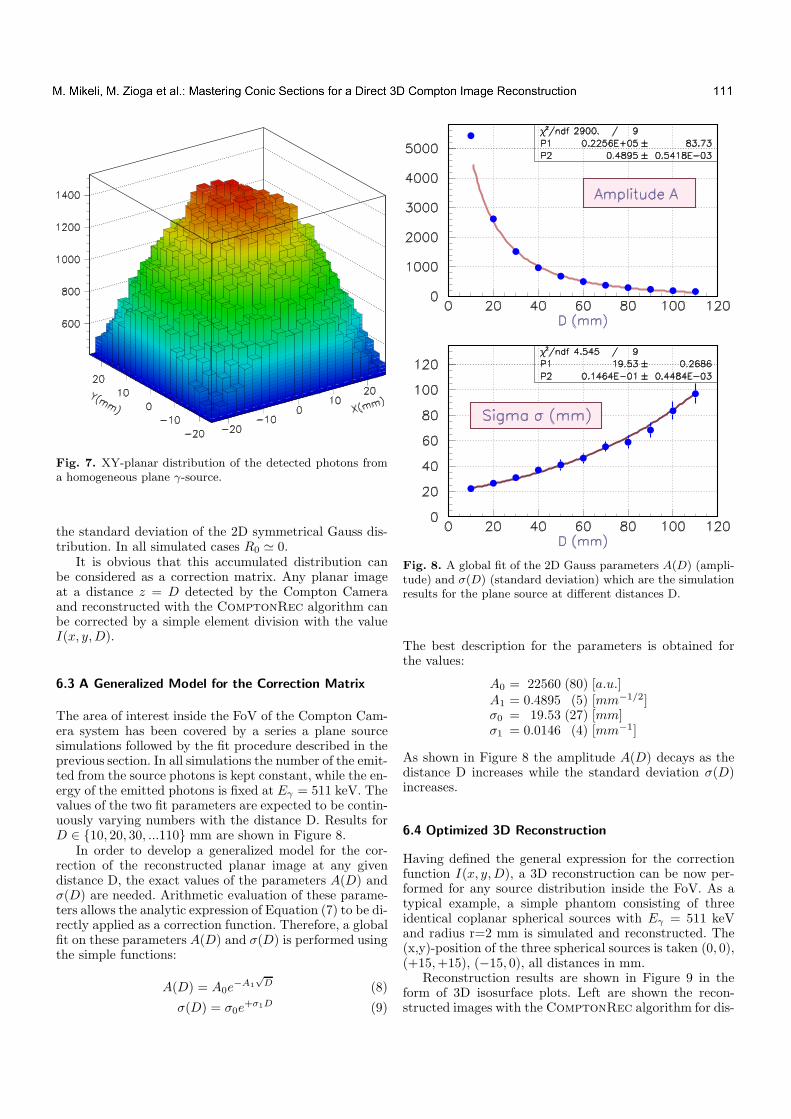
6
Fig. 7. XY-planar distribution of the detected photons froma homogeneous plane γ-source.
the standard deviation of the 2D symmetrical Gauss dis-tribution. In all simulated cases R0 ≃ 0.
It is obvious that this accumulated distribution canbe considered as a correction matrix. Any planar imageat a distance z = D detected by the Compton Cameraand reconstructed with the ComptonRec algorithm canbe corrected by a simple element division with the valueI(x, y,D).
6.3 A Generalized Model for the Correction Matrix
The area of interest inside the FoV of the Compton Cam-era system has been covered by a series a plane sourcesimulations followed by the fit procedure described in theprevious section. In all simulations the number of the emit-ted from the source photons is kept constant, while the en-ergy of the emitted photons is fixed at Eγ = 511 keV. Thevalues of the two fit parameters are expected to be contin-uously varying numbers with the distance D. Results forD ∈ 10, 20, 30, ...110 mm are shown in Figure 8.
In order to develop a generalized model for the cor-rection of the reconstructed planar image at any givendistance D, the exact values of the parameters A(D) andσ(D) are needed. Arithmetic evaluation of these parame-ters allows the analytic expression of Equation (7) to be di-rectly applied as a correction function. Therefore, a globalfit on these parameters A(D) and σ(D) is performed usingthe simple functions:
A(D) = A0e−A1
√D (8)
σ(D) = σ0e+σ1D (9)
Fig. 8. A global fit of the 2D Gauss parameters A(D) (ampli-tude) and σ(D) (standard deviation) which are the simulationresults for the plane source at different distances D.
The best description for the parameters is obtained forthe values:
A0 = 22560 (80) [a.u.]A1 = 0.4895 (5) [mm−1/2]σ0 = 19.53 (27) [mm]σ1 = 0.0146 (4) [mm−1]
As shown in Figure 8 the amplitude A(D) decays as thedistance D increases while the standard deviation σ(D)increases.
6.4 Optimized 3D Reconstruction
Having defined the general expression for the correctionfunction I(x, y,D), a 3D reconstruction can be now per-formed for any source distribution inside the FoV. As atypical example, a simple phantom consisting of threeidentical coplanar spherical sources with Eγ = 511 keVand radius r=2 mm is simulated and reconstructed. The(x,y)-position of the three spherical sources is taken (0, 0),(+15,+15), (−15, 0), all distances in mm.
Reconstruction results are shown in Figure 9 in theform of 3D isosurface plots. Left are shown the recon-structed images with the ComptonRec algorithm for dis-
user
Text Box
M. Mikeli, M. Zioga et al.: Mastering Conic Sections for a Direct 3D Compton Image Reconstruction 111

7
UUNNCCOORRRREECCTTEEDD CCOORRRREECCTTEEDD
ZZ ==
2200
mmmm
ZZ ==
4400
mmmm
Fig. 9. 3D reconstruction results in the form of isosurface plots for the three coplanar spheres phantom without applying (left)and with the optimization procedure (right) described in this work. The correction algorithm has been implemented in theComptonRec package used in the 3D reconstruction. Each grid dimension is 100×100×100 units, where 1 mm = 2 grid units.
tances 20 mm and 40 mm from the Compton Camera en-trance without applying any correction method. In theright are the same reconstruction images with the opti-mization procedure proposed in this work. The analyticalexpression for the I(x, y,D) function with the best fit pa-rameters is implemented in the reconstruction algorithm.The best result is obtained for the Z=20 mm distance.
7 Summary
In summary, the architecture and functionality of the pack-age ComptonRec, which handles the geometry of theconic sections to accumulate ray density distribution ina user defined voxelized volume inside a specified field
of interest for Compton Camera image reconstruction, ishere presented. The planar image reconstruction is exam-ined with GEANT4/GATE simulated γ-rays by filteringout misidentified coincidence or energetically mismatchedevents. Reconstruction results are shown for a typical sim-ple geometry source configuration.
Non-uniformity of the system’s efficiency caused by theangular acceptance and the angular dependence of theCompton Effect for distributed γ-sources is extensivelystudied and improved with a correction matrix expressedin the form of an analytical 2D symmetric Gauss func-tion with parameters obtained from the analysis of thedetected events of uniformly emitting homogeneous planesources in space and covering the whole Field of View ofthe Compton Camera
user
Text Box
M. Mikeli, M. Zioga et al.: Mastering Conic Sections for a Direct 3D Compton Image Reconstruction 112

8
References
1. R. Todd, J. Nightingale and D. Everett: A proposed Gamma
Camera, Nature 251 (1974) 132–134.2. J. Krimmer et al.: Development of a Compton Camera for
Medical Applications based on Silicon Strip and Scintillation
Detectors, Nucl. Instr. and Methods A 787 (2015) 98–101.3. M.A. Alnaaimi et al.: Performance Evaluation of a Pixel-
lated Ge Compton Camera, Phys. Med. Biol. 56 (2011)3473–3486.
4. A. Andreyev, A. Sitek and A. Celler: Fast Image Recon-
struction for Compton Camera using Stochastic Origin En-
semble Approach, Med. Phys. 38 (2011) 429–438.
5. S. Jan et al.: GATE: A Simulation Toolkit for PET and
SPECT, Phys. Med. Biol. 49 (2004) 4543–4561 and TheOpenGATE Collaboration
6. M. Zioga, M. Mikeli, A. Eleftheriou, Ch. Pafilis, A.-N. Rap-somanikis and E. Stiliaris: ComptonRec: Mastering Conic
Sections for a Direct 3D Compton Image Reconstruction,2015 IEEE Nuclear Science Symposium and Medical Imag-ing Conference M4CP-266 (2015).
7. M. Mikeli, M. Zioga, A. Eleftheriou, Ch. Pafilis, A.-N. Rap-somanikis and E. Stiliaris: 3D Reconstruction Optimization
for Compton Camera Events, 2015 IEEE Nuclear ScienceSymposium and Medical Imaging Conference M4CP-210
(2015).
Powered by TCPDF (www.tcpdf.org)Powered by TCPDF (www.tcpdf.org)Powered by TCPDF (www.tcpdf.org)Powered by TCPDF (www.tcpdf.org)Powered by TCPDF (www.tcpdf.org)Powered by TCPDF (www.tcpdf.org)Powered by TCPDF (www.tcpdf.org)
user
Text Box
M. Mikeli, M. Zioga et al.: Mastering Conic Sections for a Direct 3D Compton Image Reconstruction 113

Nuclear and atomic techniques to the study of U‐ bearing formation of Epirus region1 I. T. Tzifas and P. Misaelides Department of Chemistry, Aristotle University of Thessaloniki, GR-54124 Thessaloniki, Greece.
Abstract. Sedimentary Mesozoic rocks from Epirus region and particularly tectonized/re-processed organic rich limestones, were examined for their actinide content. Gamma-ray measurements using HPGe detector showed that the above geological materials exhibit enhanced radioactivity mainly attributed to the 238U-series. Bulk geochemical analyses using ICP-OES/MS showed variable U concentrations with a notable value of 648 ppm in the case of dark organic-rich material hosted into the tectonized/reprocessed phosphatized limestones. SEM-EDS combined with XRD showed that the main phases were apatite (fluoroapatite and carbonate apatite) calcite and organic matter. Synchrotron radiation (µ-XRF) revealed uranium accumulation in areas of the material containing, among others, carbonate apatite and organic matter. Uranium-bearing carbonate apatite crystals were separated from the rock and characterized by Raman spectroscopy and microprobe analysis. The analysis of these crystals also indicated the presence of sodium and sulfur. The ULIII-edge of µ-XANES spectra showed that uranium is present in tetravalent form. The uranium presence in the crystals was also visualized, after neutron irradiation and etching, by the observation of the fission tracks. Epirus samples are classified among the richest U-bearing phosphatized limestones and/or sedimentary phosphorites in the world.
References Tzifas, I.T., et al., "Uranium-bearing phosphatized limestones of NW Greece." Journalof Geochemical Exploration 143 (2014) 62. Tzifas, I.T., et al., Uranium-bearing francolites present in organic-rich limestones of NW Greece: a preliminary study using synchrotron radiation and fission track techniques. Journal ofRadioanalytical andNuclearChemistry311 (2017) 465.
1Part of I.T. Tzifas’ PhD Dissertation (in preparation)
user
Text Box
114
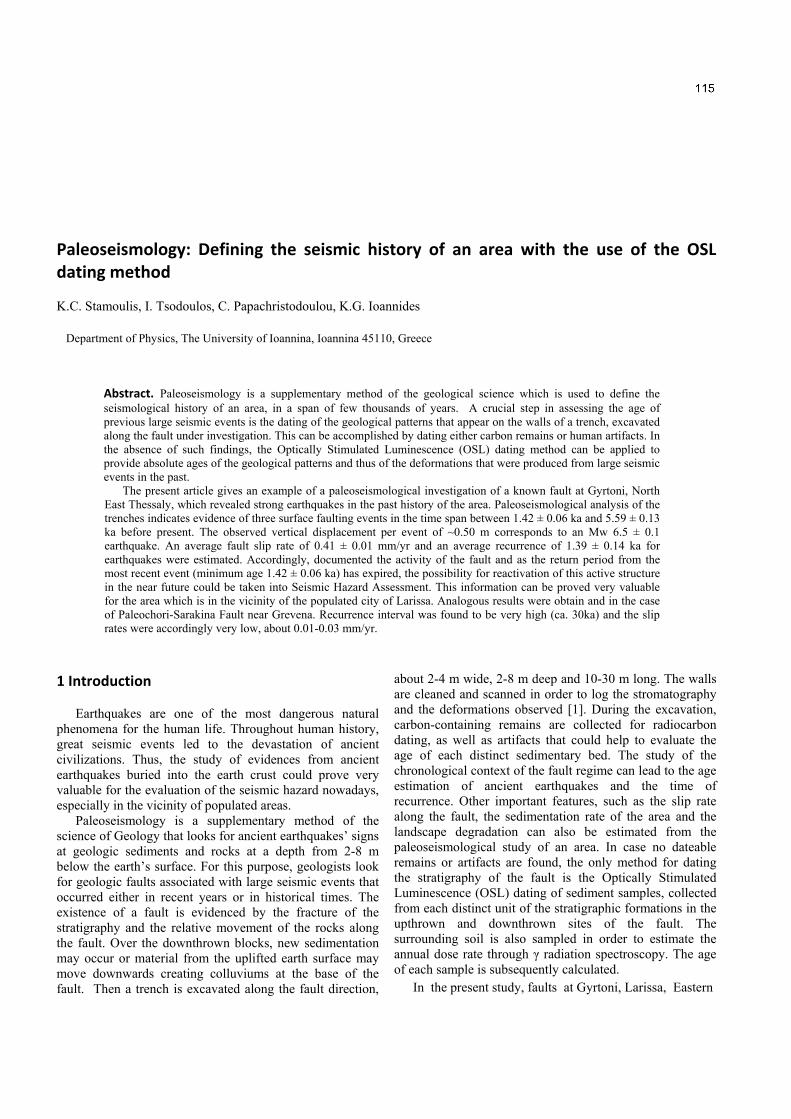
Paleoseismology: Defining the seismic history of an area with the use of the OSL dating method K.C. Stamoulis, I. Tsodoulos, C. Papachristodoulou, K.G. Ioannides
Department of Physics, The University of Ioannina, Ioannina 45110, Greece
Abstract. Paleoseismology is a supplementary method of the geological science which is used to define the seismological history of an area, in a span of few thousands of years. A crucial step in assessing the age of previous large seismic events is the dating of the geological patterns that appear on the walls of a trench, excavated along the fault under investigation. This can be accomplished by dating either carbon remains or human artifacts. In the absence of such findings, the Optically Stimulated Luminescence (OSL) dating method can be applied to provide absolute ages of the geological patterns and thus of the deformations that were produced from large seismic events in the past.
The present article gives an example of a paleoseismological investigation of a known fault at Gyrtoni, North East Thessaly, which revealed strong earthquakes in the past history of the area. Paleoseismological analysis of the trenches indicates evidence of three surface faulting events in the time span between 1.42 ± 0.06 ka and 5.59 ± 0.13 ka before present. The observed vertical displacement per event of ~0.50 m corresponds to an Mw 6.5 ± 0.1 earthquake. An average fault slip rate of 0.41 ± 0.01 mm/yr and an average recurrence of 1.39 ± 0.14 ka for earthquakes were estimated. Accordingly, documented the activity of the fault and as the return period from the most recent event (minimum age 1.42 ± 0.06 ka) has expired, the possibility for reactivation of this active structure in the near future could be taken into Seismic Hazard Assessment. This information can be proved very valuable for the area which is in the vicinity of the populated city of Larissa. Analogous results were obtain and in the case of Paleochori-Sarakina Fault near Grevena. Recurrence interval was found to be very high (ca. 30ka) and the slip rates were accordingly very low, about 0.01-0.03 mm/yr.
1 Introduction Earthquakes are one of the most dangerous natural
phenomena for the human life. Throughout human history, great seismic events led to the devastation of ancient civilizations. Thus, the study of evidences from ancient earthquakes buried into the earth crust could prove very valuable for the evaluation of the seismic hazard nowadays, especially in the vicinity of populated areas.
Paleoseismology is a supplementary method of the science of Geology that looks for ancient earthquakes’ signs at geologic sediments and rocks at a depth from 2-8 m below the earth’s surface. For this purpose, geologists look for geologic faults associated with large seismic events that occurred either in recent years or in historical times. The existence of a fault is evidenced by the fracture of the stratigraphy and the relative movement of the rocks along the fault. Over the downthrown blocks, new sedimentation may occur or material from the uplifted earth surface may move downwards creating colluviums at the base of the fault. Then a trench is excavated along the fault direction,
about 2-4 m wide, 2-8 m deep and 10-30 m long. The walls are cleaned and scanned in order to log the stromatography and the deformations observed [1]. During the excavation, carbon-containing remains are collected for radiocarbon dating, as well as artifacts that could help to evaluate the age of each distinct sedimentary bed. The study of the chronological context of the fault regime can lead to the age estimation of ancient earthquakes and the time of recurrence. Other important features, such as the slip rate along the fault, the sedimentation rate of the area and the landscape degradation can also be estimated from the paleoseismological study of an area. In case no dateable remains or artifacts are found, the only method for dating the stratigraphy of the fault is the Optically Stimulated Luminescence (OSL) dating of sediment samples, collected from each distinct unit of the stratigraphic formations in the upthrown and downthrown sites of the fault. The surrounding soil is also sampled in order to estimate the annual dose rate through γ radiation spectroscopy. The age of each sample is subsequently calculated.
In the present study, faults at Gyrtoni, Larissa, Eastern
user
Text Box
115

Thessaly, and at Paleochori-Sarakina, Grevena, Western Macedonia, where strong earthquakes occurred in the recent years, were investigated. Trenches were excavated along the faults and samples were collected and delivered at the Archaeometry Center of the University of Ioannina, to be processed and measured with the OSL method. The calculated ages were analyzed in order to estimate the age of ancient earthquakes, evidenced from the geological study of the trenches. Ages and mean recurrence time, as well as slip rates for the faults were estimated. The results are presented here. 2 Materials and Methods
Paleoseismological trenches were excavated perpendi-
cular to the trace of the faults at Gyrtoni (Fig. 1) and Paleochori-Sarakina. The trench at Gyrtoni Fault was 30m long, 4m deep and 2m wide. The walls were cleaned, gridded with a 1 m x 1 m string grid and mapped in detail. The trench excavated near the village of Paleochori, was 17m long and 3m deep and was gridded in a similar way. Several soil cores were collected perpendicular to the trench walls and were brought to the Archaeometry Center of the University of Ioannina for OSL measurements. Special care was taken to collect samples from each of the stromatographic units revealed on the trench walls, in order to construct an accurate age context and to assess the age of ancient earthquakes, the evidences of which were observed.
The OSL dating method involves measurement of the luminescence signal of quartz grains and radioactivity measurements of the surrounding soils. In the first step, the dose that is absorbed was estimated. The sample preparation consists of drying and sieving, followed by chemical treatment in order to enrich the soil in quartz grains. The soil cores were unpacked under subdued red light and the outer 2 cm of the cores were discarded. Four to 8 cm of the inner parts was transferred to plastic containers, dried to 50o C for a day, grounded and sieved. The 125-250 µm fractions of the grains were transferred to small tubes and were chemically treated. Solutions of HCl (8%) to eliminate carbonates, of H2O2 (30%) to eliminate organic content and finally of HF (40%) to dissolve feldspars and etch the quartz grains, were added to the selected fractions [2]. The last step of chemical treatment was performed to discard the surface of the grains at 20 µm depth where the α-particles energy is absorbed.
For each sample, a number of aliquots were prepared by pouring few mg of enriched quartz grains on stainless steel disks. The disks were measured for luminescence signal on a TL/OSL Reader (Riso model DA-20). The Single Aliquot Regenerative dose protocol (SAR) was used to measure the
Fig. 1. Gyrtoni Fault near the city of Larissa.
dose absorbed by the quartz grains during the burial time, or since the time they were bleached, either exposed to sun or to high temperature heat [3, 4]. The protocol was slightly changed by adding a step of Infrared Stimulated Luminescence (IRSL) to check for feldspar impurities [5]. Each cycle of the protocol involved a natural dose (N) measurement under IRSL and OSL mode and an irradiation of the aliquot with a test dose (T) followed again by IRSL and OSL measurements. Following this first step, the aliquots were irradiated with raising doses and the same cycle for luminescence measurements was repeated to calculate the ratio of the given dose to test dose (Li/Ti). Finally, the growth curves for each aliquot were constructed using the ratios Li/Ti and N/T, was interpolated with the fit of the growth curve giving the equivalent dose ED or paleodose (see Fig. 2).
Fig. 2. Typical dose-response curve and natural OSL signal decay curve (inset) from sample Pal2OSL7 collected from the Paleochori -Sarakina trench.
user
Text Box
K.C. Stamoulis et al.: Paleoseismology: Defining the seismic history of an area with the OSL dating method 116
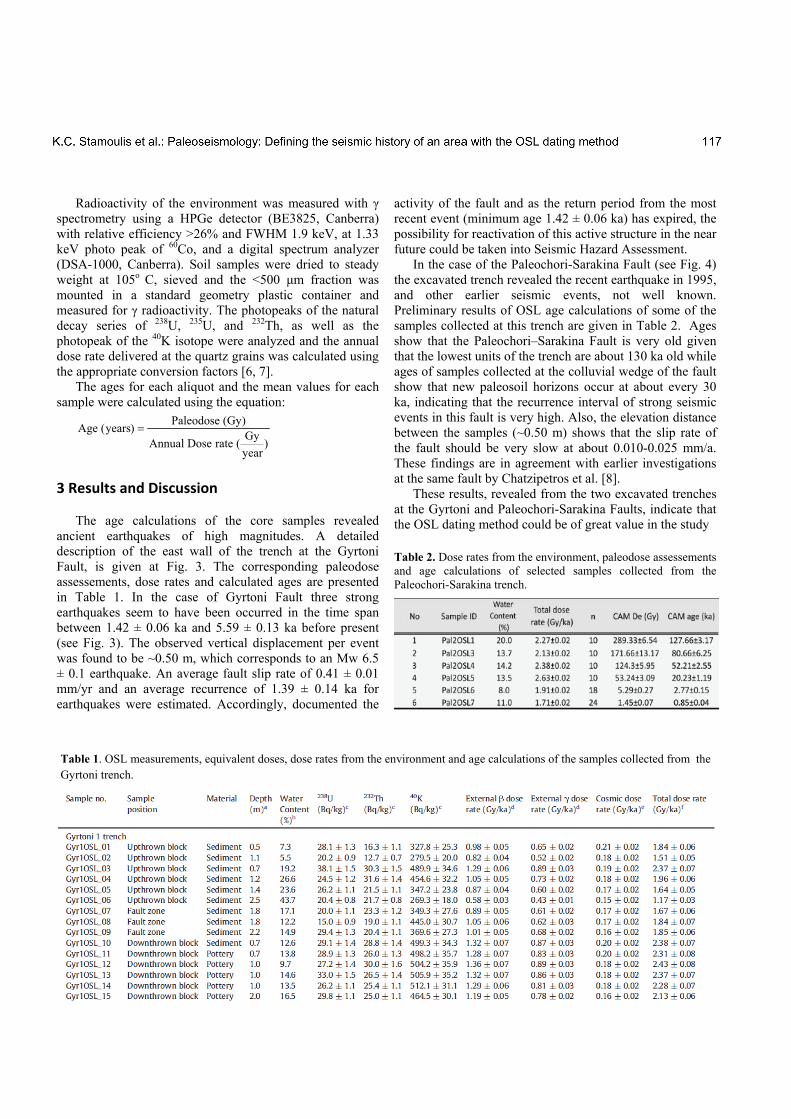
Radioactivity of the environment was measured with γ spectrometry using a HPGe detector (BE3825, Canberra) with relative efficiency >26% and FWHM 1.9 keV, at 1.33 keV photo peak of 60Co, and a digital spectrum analyzer (DSA-1000, Canberra). Soil samples were dried to steady weight at 105o C, sieved and the <500 µm fraction was mounted in a standard geometry plastic container and measured for γ radioactivity. The photopeaks of the natural decay series of 238U, 235U, and 232Th, as well as the photopeak of the 40K isotope were analyzed and the annual dose rate delivered at the quartz grains was calculated using the appropriate conversion factors [6, 7].
The ages for each aliquot and the mean values for each sample were calculated using the equation:
)yearGy(rateDoseAnnual
)Gy(Paleodose)years(Age =
3 Results and Discussion
The age calculations of the core samples revealed
ancient earthquakes of high magnitudes. A detailed description of the east wall of the trench at the Gyrtoni Fault, is given at Fig. 3. The corresponding paleodose assessements, dose rates and calculated ages are presented in Table 1. In the case of Gyrtoni Fault three strong earthquakes seem to have been occurred in the time span between 1.42 ± 0.06 ka and 5.59 ± 0.13 ka before present (see Fig. 3). The observed vertical displacement per event was found to be ~0.50 m, which corresponds to an Mw 6.5 ± 0.1 earthquake. An average fault slip rate of 0.41 ± 0.01 mm/yr and an average recurrence of 1.39 ± 0.14 ka for earthquakes were estimated. Accordingly, documented the
activity of the fault and as the return period from the most recent event (minimum age 1.42 ± 0.06 ka) has expired, the possibility for reactivation of this active structure in the near future could be taken into Seismic Hazard Assessment.
In the case of the Paleochori-Sarakina Fault (see Fig. 4) the excavated trench revealed the recent earthquake in 1995, and other earlier seismic events, not well known. Preliminary results of OSL age calculations of some of the samples collected at this trench are given in Table 2. Ages show that the Paleochori–Sarakina Fault is very old given that the lowest units of the trench are about 130 ka old while ages of samples collected at the colluvial wedge of the fault show that new paleosoil horizons occur at about every 30 ka, indicating that the recurrence interval of strong seismic events in this fault is very high. Also, the elevation distance between the samples (~0.50 m) shows that the slip rate of the fault should be very slow at about 0.010-0.025 mm/a. These findings are in agreement with earlier investigations at the same fault by Chatzipetros et al. [8].
These results, revealed from the two excavated trenches at the Gyrtoni and Paleochori-Sarakina Faults, indicate that the OSL dating method could be of great value in the study
Table 2. Dose rates from the environment, paleodose assessements and age calculations of selected samples collected from the Paleochori-Sarakina trench.
Table 1. OSL measurements, equivalent doses, dose rates from the environment and age calculations of the samples collected from the Gyrtoni trench.
user
Text Box
K.C. Stamoulis et al.: Paleoseismology: Defining the seismic history of an area with the OSL dating method 117

Fig. 4. Gyrtoni trench, east wall. The distinct units of the stratigraphy of the area are shown with different colors. The three paleoseismic events mentioned in the text are also presented (red stars and labels).
Fig. 3. Paleochori-Sarakina, west wall (preliminary interpretation). The paleoseismic events are noted with red lines.
user
Text Box
K.C. Stamoulis et al.: Paleoseismology: Defining the seismic history of an area with the OSL dating method 118

of recurrence intervals and slip rates of ancient strong earthquakes. Improving our knowledge about the seismic history of an area could be very valuable for a better evaluation of the seismic hazard potential of the regions. References 1. McCalpin J.P., 2009. Field techniques in paleoseismo-logy.
Paleoseismology in extensional tectonic environ-ments. In: McCalpin, J.P. (Ed.), Paleoseismology. Academic Press, San Diego, pp. 161–269.
2. Aitken M. J., 1998. “An Introduction to Optical Dating”. Oxford University Press, Oxford.
3. Murray A.S., Wintle A.G., 2000. Luminescence dating of quartz using an improved single-aliquot regenerative-dose protocol. Radiation Measurements 32, 57-73.
4. Murray A.S., Wintle A.G., 2003. The single aliquot regenerative dose protocol: potential for improvements in reliability. Radiation Measurements 37, 377–381.
5. Duller G.A.T., 2003. Distinguishing quartz and feldspar in single grain luminescence measurements. Radiation Measurements 37, 161-165.
6. Liritzis I., Stamoulis K., Papachristodoulou C., Ioannides K. A re-evaluation of radiation dose-rate conversion factors, Med. Archaeology and Archaeometry, 2013, V13, 3, 1-15.
7. Adamiec G., Aitken M.J., 1998. Dose-rate conversion factors: update. Ancient TL 16, 37-50.
8. Chatzipetros A.A., Pavlides S.B., Mountrakis D.M., 1998. Understanding the 13 May 1995 western Macedonia earthquake: a paleoseismological approach. J. Geodynamics 26, 327–339.
user
Text Box
K.C. Stamoulis et al.: Paleoseismology: Defining the seismic history of an area with the OSL dating method 119
210Pb and 7Be concentrations in moss samples from the region ofNorthern Greece
Ch. Betsou1,3, E. Tsakiri2, J. Hansman3, M. Krmar3, and A. Ioannidou1
1 Physics Department, Nuclear Physics Lab., Aristotle University of Thessaloniki, Thessaloniki, 54124, Greece2 Biology Department, Division of Botany, Aristotle University of Thessaloniki, Thessaloniki, 54124, Greece3 Physics Department, Faculty of Science, University of Novi Sad, Trg Dositeja Obradovica 4, Novi Sad, 21000, Serbia
Abstract. Terrestrial mosses obtain most of their nutrients directly from precipitation and dry deposition.They can be used for monitoring of airborne radionuclide depositions. Ninety five samples of HypnumCupressiforme were collected in Northern Greece during the end of summer 2016. After the preparation,mosses were measured in a low-background HPGe detector with relative efficiency 32%. The activityconcentrations of 7Be ranged from 69 to 1280 Bq kg−1, and the concentrations of 210Pb were between147 and 1920 Bq kg−1. Differences have been observed in the activity concentrations between the mossescollected from different surface types (ground surface, rocks, branches and near roots). No correlationbetween the concentrations of 7Be and 210Pb has been found.
PACS. 92.60.Mt Aerosols in atmosphere
1 Introduction
Using biological indicators is a quite interesting and re-liable method for detecting radioactive contamination ofan ecosystem [1]. Mosses have been used as bioindicatorsof atmospheric deposition of radionuclides and for atmo-spheric assessments since the late 1960s in Scandinaviancountries [2-4]. Carpet-forming moss species can be usedas biomonitors providing a number of advantages. Mossesobtain most of their nutrients directly from precipitationand dry deposition. The absence or strong reduction ofthe cuticle and thin leaves allows easy uptake from the at-mosphere. Lack of an elaborate rooting system also meansthat uptake from the substrate is normally insignificant.These properties make mosses an ideal sampling mediumfor metals and airborne radionuclides deposited from theatmosphere, as they are accumulated by the moss, produc-ing concentrations much higher than those in the originalwet or dry deposition [5-6]. Another advantage of mosstechnique is that the sample collection is so simple, thata high sampling density can be achieved, in contrast tothe conventional precipitation analysis and the air sam-pling. High resolution gamma spectrometry measurementscan be carried out with the moss technique, without anychemical treatment of the samples. Naturally occurring ra-dionuclides 7Be and 210Pb are useful tools in studying theenvironmental processes. It is expected that the contentof radionuclides that are deposited from the atmospherecan vary from place to place, depending on several factors.7Be is formed by spallation reaction between cosmic raysand nuclei of oxygen and nitrogen in the stratosphere and
upper troposphere [7-11]. After production, the 7Be atomsare attached to aerosol particles and the fate of 7Be willbecome the fate of the carrier aerosols. Since aerosol par-ticles contain most of the air pollutants, the transport ofthe last ones can be investigated by tracking the 7Be path-way. The production rate of cosmogenic isotopes dependson the intensity of the geomagnetic field. The concentra-tions of 7Be in surface air are decreasing with the increaseof latitude [12-14]. The radionuclide 210Pb is widely foundin the terrestrial environment and it is present in the at-mosphere due to the decay of 222Rn diffusing from theground. The presence of 210Pb in the atmosphere dependson the emanation rate of 222Rn. The last one depends ondifferent factors such as the geological properties of theground, the ability of radon to leak from the ground andenters in the atmosphere and the conditions of the groundsurface layer (the humidity of the soil, the presence or noof the snow cover, the thickness of the frozen soil crust)[15]. Once 210Pb is formed in the atmosphere, it is at-tached to aerosol particles and follows their path. So itcan be used for tracking the aerosols deposition and theirresidence time in the atmosphere. The aim of this study isto measure activities of the radionuclides 7Be and 210Pbin mosses and investigate their possible variabilities overdifferent places in Northern Greece. The different meteo-rological conditions, the wind direction and precipitationcan influence the deposition of airborne radionuclides, aswell as their activities in mosses.
user
Text Box
120

2
2 Sampling and measurements
Ninety five (95) samples of Hypnum Cupressiforme Hedw.were collected in the region of Northern Greece. The sam-pling sites were located from 39.97o North to 41.65o Northand from 20.97o East to 26.26o East. The samples werecollected from different altitudes, from 30 m to 1450 mabove the mean sea level. All samples of fresh plant mate-rial were collected in a short time interval during the endof summer 2016. During the sampling there was no rain,thus avoiding the exposure to additional precipitation andextra component of airborne radionuclides by rain wash-ing of the atmosphere [6]. The regions from where sam-ples were collected were open regions far from treetopsin most of the sampling sites. All sampling sites were se-lected avoiding possible contact of mosses with surfacewater. All the samples were collected according to the in-structions of the Protocol of the European Survey ICPVegetation [16], in which Greece is the first time that isincluded. After sampling, mosses were dried at 105 oC for2 hours to a constant weight. Soil and all other mechani-cal impurities were removed manually. After the prepara-tion, mosses were put in two cylindrical plastic contain-ers, diameter 67 mm and height 31 mm. The minimummass of dry moss was 8.9 g and the maximum was 58 g.Low-background extended range HPGe detector equippedwith a Be window was used in order to get evidence about210Pb. Relative efficiency of detector is 32%. Backgroundcount was reduced by passive shield (18 cm of lead, 1 mmof tin and 1.5 mm of copper) which does not interfere withgamma photons emitted from samples. Gamma spectrumof each sample was collected until statistical uncertaintyof the 477.6 keV 7Be line up to 5% was achieved andstatistical uncertainty of 46.5 keV 210Pb line was up to5%. The detection efficiency was established using NISTStandard Reference Material 4350B (Columbia River sed-iment) packed in same geometry. Accuracy of efficiencycalibration was tested using IAEA source made from drygrass [6].
3 Results and discussion
In the gamma spectrum several prominent peaks appeared.After the subtraction of the background and peak analy-sis, the intensities of 7Be (477.6 keV) and 210Pb (46.5 keV)were obtained. The activity concentrations of the radionu-clides 7Be and 210Pb were calculated and are presented inTable 1. The mean value of each radioisotope is presentedin parenthesis in Table 1. The lowest measured value of7Be activity per unit mass of dry plant material is 69 Bqkg−1 and the highest one is 1280 Bq kg−1. The activityconcentrations of 210Pb range between 147 and 1920 Bqkg−1. The values of the activity concentrations of 210Pbradionuclide referred in literature present great variability.210Pb concentrations measured in Belarus were between141 to 575 Bq kg−1 (mean value 312 Bq kg−1), while inSlovakia the activity concentration of 210Pb ranged be-tween 330 to 1521 Bq kg−1 (mean value 771 Bq kg−1)[17]. The values of 210Pb in Serbia were measured from
Table 1. Activity concentrations of the radioisotopes 7Be and210Pb in Bq kg−1 in moss samples collected from the region ofNorthern Greece during the summer of 2016.
Radionuclide Range (mean value) Bq kg−1
7Be 69-1280 (388)210Pb 147-1920 (817)
Fig. 1. Differences in the activity concentrations of the ra-dioisotope 7Be in moss samples collected from different surfacetypes. .
347 to 885 Bq kg−1 [5]. There are differences among 210Pbconcentrations due to the different soil characteristics andstructure. Values of 7Be activity concentrations measuredin other surveys in Serbia show also variability dependingon the season when moss samples were collected. In au-tumn, the lowest values of 7Be were found between 95-360Bq kg−1, with mean value of 195 Bq kg−1 [18], while dur-ing the summer period 7Be concentrations ranged between201 to 920 Bq kg−1 [18]. The concentrations of 7Be in thiscurrent survey are higher (the mean value is almost 20%higher) than those in Serbia during the summer period.This is due to the fact that the cosmogenic radionuclide7Be presents higher concentrations in regions with lowerlatitude than those with higher latitude [19]. There areseasonal variances in 7Be activity concentrations for thesame region (Serbia), but in the current survey the sam-pling was conducted only during the summer period, sothis could not be observed.
Differences have been observed in the activity concen-trations between mosses collected from different surfacetypes such as ground surface, rocks, branches and roots(Fig.1 and Fig.2). 7Be and 210Pb activity concentrationsare higher in moss samples from the ground surface androcks than those near roots. The ratio of the activity con-centrations of 7Be between mosses collected from the sur-face and those collected near roots is around 1.5. Thisratio is logical, if someone can expect that the majorityof 7Be should be found in mosses collected in open areasand not under trees.
user
Text Box
Ch. Betsou et al.: Pb-210 and Be-7 concentrations in moss samples from the region of Northern Greece 121
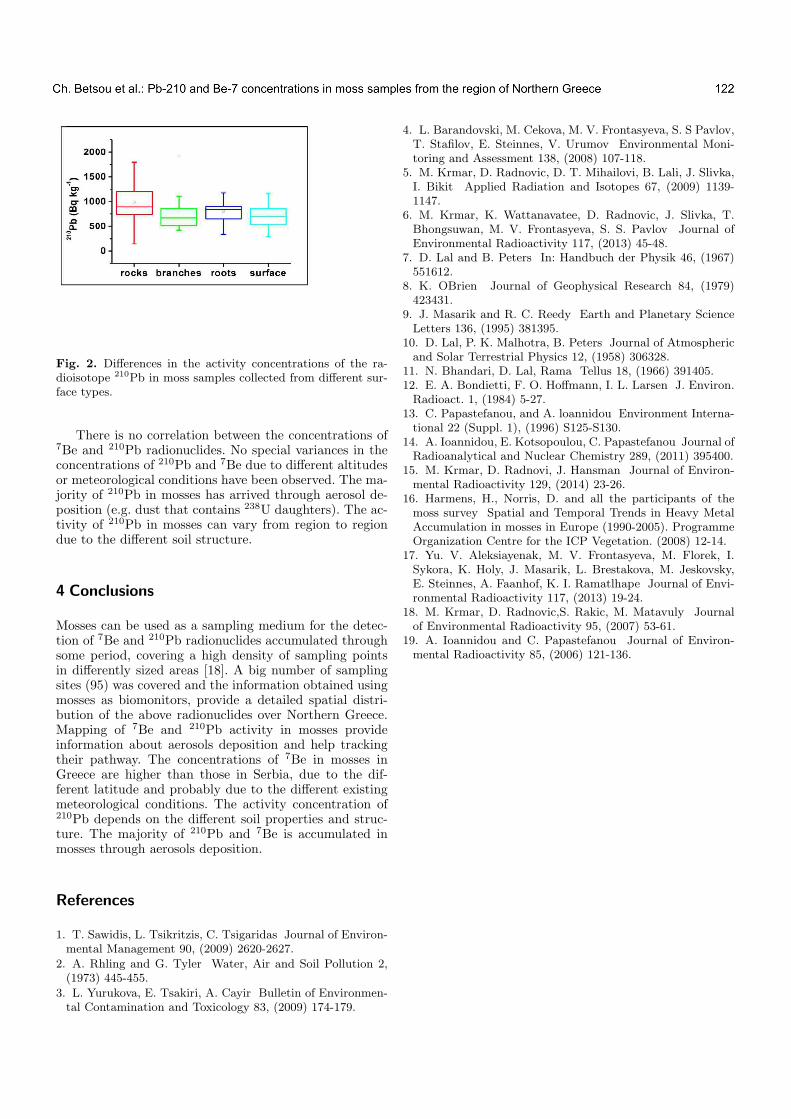
3
Fig. 2. Differences in the activity concentrations of the ra-dioisotope 210Pb in moss samples collected from different sur-face types.
There is no correlation between the concentrations of7Be and 210Pb radionuclides. No special variances in theconcentrations of 210Pb and 7Be due to different altitudesor meteorological conditions have been observed. The ma-jority of 210Pb in mosses has arrived through aerosol de-position (e.g. dust that contains 238U daughters). The ac-tivity of 210Pb in mosses can vary from region to regiondue to the different soil structure.
4 Conclusions
Mosses can be used as a sampling medium for the detec-tion of 7Be and 210Pb radionuclides accumulated throughsome period, covering a high density of sampling pointsin differently sized areas [18]. A big number of samplingsites (95) was covered and the information obtained usingmosses as biomonitors, provide a detailed spatial distri-bution of the above radionuclides over Northern Greece.Mapping of 7Be and 210Pb activity in mosses provideinformation about aerosols deposition and help trackingtheir pathway. The concentrations of 7Be in mosses inGreece are higher than those in Serbia, due to the dif-ferent latitude and probably due to the different existingmeteorological conditions. The activity concentration of210Pb depends on the different soil properties and struc-ture. The majority of 210Pb and 7Be is accumulated inmosses through aerosols deposition.
References
1. T. Sawidis, L. Tsikritzis, C. Tsigaridas Journal of Environ-mental Management 90, (2009) 2620-2627.
2. A. Rhling and G. Tyler Water, Air and Soil Pollution 2,(1973) 445-455.
3. L. Yurukova, E. Tsakiri, A. Cayir Bulletin of Environmen-tal Contamination and Toxicology 83, (2009) 174-179.
4. L. Barandovski, M. Cekova, M. V. Frontasyeva, S. S Pavlov,T. Stafilov, E. Steinnes, V. Urumov Environmental Moni-toring and Assessment 138, (2008) 107-118.
5. M. Krmar, D. Radnovic, D. T. Mihailovi, B. Lali, J. Slivka,I. Bikit Applied Radiation and Isotopes 67, (2009) 1139-1147.
6. M. Krmar, K. Wattanavatee, D. Radnovic, J. Slivka, T.Bhongsuwan, M. V. Frontasyeva, S. S. Pavlov Journal ofEnvironmental Radioactivity 117, (2013) 45-48.
7. D. Lal and B. Peters In: Handbuch der Physik 46, (1967)551612.
8. K. OBrien Journal of Geophysical Research 84, (1979)423431.
9. J. Masarik and R. C. Reedy Earth and Planetary ScienceLetters 136, (1995) 381395.
10. D. Lal, P. K. Malhotra, B. Peters Journal of Atmosphericand Solar Terrestrial Physics 12, (1958) 306328.
11. N. Bhandari, D. Lal, Rama Tellus 18, (1966) 391405.12. E. A. Bondietti, F. O. Hoffmann, I. L. Larsen J. Environ.Radioact. 1, (1984) 5-27.
13. C. Papastefanou, and A. loannidou Environment Interna-tional 22 (Suppl. 1), (1996) S125-S130.
14. A. Ioannidou, E. Kotsopoulou, C. Papastefanou Journal ofRadioanalytical and Nuclear Chemistry 289, (2011) 395400.
15. M. Krmar, D. Radnovi, J. Hansman Journal of Environ-mental Radioactivity 129, (2014) 23-26.
16. Harmens, H., Norris, D. and all the participants of themoss survey Spatial and Temporal Trends in Heavy MetalAccumulation in mosses in Europe (1990-2005). ProgrammeOrganization Centre for the ICP Vegetation. (2008) 12-14.
17. Yu. V. Aleksiayenak, M. V. Frontasyeva, M. Florek, I.Sykora, K. Holy, J. Masarik, L. Brestakova, M. Jeskovsky,E. Steinnes, A. Faanhof, K. I. Ramatlhape Journal of Envi-ronmental Radioactivity 117, (2013) 19-24.
18. M. Krmar, D. Radnovic,S. Rakic, M. Matavuly Journalof Environmental Radioactivity 95, (2007) 53-61.
19. A. Ioannidou and C. Papastefanou Journal of Environ-mental Radioactivity 85, (2006) 121-136.
Powered by TCPDF (www.tcpdf.org)Powered by TCPDF (www.tcpdf.org)
user
Text Box
Ch. Betsou et al.: Pb-210 and Be-7 concentrations in moss samples from the region of Northern Greece 122

Systematic study of proton‐induced spallation reactions with microscopic and phenomenological models A. Assimakopoulou1, G.A. Souliotis1,*, N. Nicolis2, M. Veselsky3 and A. Bonasera4,5
1 Laboratory of Physical Chemistry, Department of Chemistry, National and Kapodistrian University of Athens, Athens 15771, Greece 2 Department of Physics, The University of Ioannina, Ioannina 45110, Greece 3 Institute of Physics, Slovak Academy of Sciences, Bratislava 84511, Slovakia 4 Cyclotron Institute, Texas A & M University, College Station, Texas, USA 5 Laboratori Nazionali del Sud, INFN, Catania, Italy ∗ Corresponding author. Email: [email protected]
Abstract. Proton induced spallation reactions on 238U, 208Pb, 181Ta and 197Au targets at high energies were investigated using the microscopic Contrained Molecular Dynamics (CoMD) model and the phenomenological models INC and SMM. We have calculated the total fission cross sections, the ratio fission cross section to residue cross section, the mass yield curves and the excitation energy after the intranuclear cascade using the CoMD model and the INC/SMM phenomenological models. We made a comparison between the models and the experimental data from the literature. Our calculations showed satisfactory agreement with available experimental data and suggest further improvements in the models. Our study with the CoMD code represents the first complete dynamical description of the spallation process with a microscopic code based on an effective nucleon-nucleon interaction.
1 Introduction
Spallation reactions induced by high-energy protons are of importance for fundamental research and technical applications in nuclear physics, as for in- stance, medical physics applications and nuclear-reactor technologies. The most important applications of these reactions are the spallation neutron sources [1,2], energy production techniques based on accelerator driven systems (ADS) [3, 4], transmutation of radioactive wastes [5-7] and radiation shield design for accelerators and cosmic devices [8]. Other applications are the production of radioactive ion-beams [9], in ISOL-type facilities and radio- pharmacological production [10,11]. All these applications require the total fission cross section to be known with high accuracy in a wide proton energy range.
Many efforts have been made in providing experimental data on interactions in the energy range (100 –1000 MeV) protons and neutrons with targets that are used in the various applications. Because of the variety of target nuclei and the wide range of energy of the beam particles, theoretical models and nuclear-reaction codes are needed.
Since the available experimental data on spallation reactions are rather poor and fragmentary, an experimental and theoretical work started at GSI Darmstadt [12]. In
particular, the production of individual nuclides from charged-particle induced spallation reactions were measured, using the inverse kinematics technique with the high resolution magnetic spectrometer FRS. Also improved codes, such as INCL [13], were developed. However, there are still uncertainties concerning measured total fission cross sections and other observables. Most of the models describe the spallation reaction as a two-stage process. A code that has been extensively used is the Liege Intranuclear Cascade Model, INCL++ [14], which describes the first (fast) stage of the intranuclear cascade. Another code that describes the intranuclear cascade is the Monte Carlo simulation code CRISP [17]. The second stage is described by an evaporation-fission model like GEMINI, GEMINI++ [15], ABRA07 [16] or the generalized evaporation model (GEM) [18]. Moreover, the Statistical Multifragmentation Model (SMM) [20–24] is a deexcitation code which com- bines the compound nucleus processes at low energies and multifragmentation at high energies.
In the present work we used the CoMD model, which is described in the references [25–29] and the phenomenological models INC [19] and SMM. With the CoMD model we obtained (p,f) cross sections, mass yield curves, fission to residue cross sections, and neutron multiplicities for the targets 238U, 208Pb,181Ta at 200, 500,
user
Text Box
123

1000 MeV and 197Au at 800 MeV. We chose these targets because they are important especially for accelerator-driven systems (ADS). For example tantalum alloys and leadbismuth eutectic are optimum materials for the construction of spallation neutron sources. In our work, we compared our CoMD calculations with experimental data taken from refs. [31, 32, 34, 35, 37– 40]. With the INC model we calculated the excitation energy of 208Pb nucleus after the intranuclear cascade and with the combination of INC/SMM models we obtained the mass distributions of 208Pb and 238U targets as well as the total fission cross sections. 2 Theoretical Model
The Constrained Molecular Dynamics (CoMD) code is based on the gereral approach of molecular dynamics as applied to nuclear systems [29, 30]. The nucleons are assumed to be localized gaussian wavepackets in coordinate and momentum space. A simplified effective nucleon-nucleon interaction is implemented with a nuclear-matter compressibility of K=200 (soft EOS) with several forms of the density dependence of the nucleon-nucleon symmetry potential. In addition, a constraint is imposed in the phase space occupation for each nucleon, restoring the Pauli principle at each time step of the collision. Proper choice of the surface parameter of the effective interaction was made to describe fission.
In the calculations of the present work, the CoMD code was used essentially with its standard parameters. The soft density-dependent isoscalar potential was chosen (K=200). For the isovector part, two forms were used: the “standard” symmetry potential [red (solid) lines] and the “soft” symmetry potential [blue (dotted) lines] in the figures that follow. These forms correspond to a dependence of the symmetry potential on the 1 and the 1/2 power of the density, respectively [26]. The surface term of the potential was set to zero to describe fission. For a given reaction, a total of approximately 5000 events were collected. For each event, the impact parameter of the collision was chosen in the range b = 0–7 fm, following a triangular distribution. Each event was followed up to 15000 fm/c and the phase space coordinates were registered every 100 fm/c. At each time step, fragments were recognized with the minimum spanning tree method [25, 28] and their properties were reported. Thus, information on the evolution of the fissioning system and the properties of the resulting fission fragments were obtained. In this way, the moment of scission of the deformed heavy nucleus could be determined. We allowed 5000 fm/c after scission for the nascent fission fragments to deexcite and we reported and analyzed their properties. We mention that the effective nucleon-nucleon interaction employed in the code has no spin dependence and thus the result- ing mean field has no spin-orbit contribution. We are exploring possibilities of adding
such a dependence on the potential to give us the ability to adequately describe the characteristics of fission at lower excitation energies i.e. E* < 50 MeV. 3 Results and Comparisons
The present work was based on the use of the microscopic CoMD model and the combination INC and SMM models in order to simulate the p-induced spallation reactions at intermediate and high enegies on heavy targets (238U, 208Pb, 181Ta and 197Au). In the following, we present the excitation energy distribution of 208Pb nucleus, the mass yield curve of the reaction p (1000 MeV) + 208Pb and p (1000 MeV) +238U, the total fission cross section of 208Pb and finally the ratio fission to residue cross section for the targets 238U, 208Pb, 181Ta and 197Au. We compare our theoretical calculations with available experimental data as it is shown on the corresponding figures.
In Fig. 1, we present the excitation energy distribution as a function of the cross section after the intranuclear cascade for the 208Pb target at 200, 500 and 1000 MeV, calculated with the INC model. We also calculated the mean excitation energy, which is about 55 MeV at Ep=200 MeV, about 85 MeV at Ep=500 MeV and about 130 MeV at Ep=1000 MeV.
In Fig. 2, we show the mass distribution of proton induced spallation of 208Pb at 1000 MeV. We compare our theoretical results with the experimental data of [37], which are indicated with black triangles. The (red) solid circles with the solid
Fig. 1. Excitation energy distribution as a function of the cross section for 208Pb target at 200, 500 and 1000 MeV calculated with the INC model. The solid circles represent the Ep=200 MeV, the solid squares represent the energy beam at 500 MeV and the solid triangles represent the energy beam at 1000 MeV.
user
Text Box
A. Assimakopoulou et al.: Study of p-induced spallation reactions with microscopic and phenomenological models 124
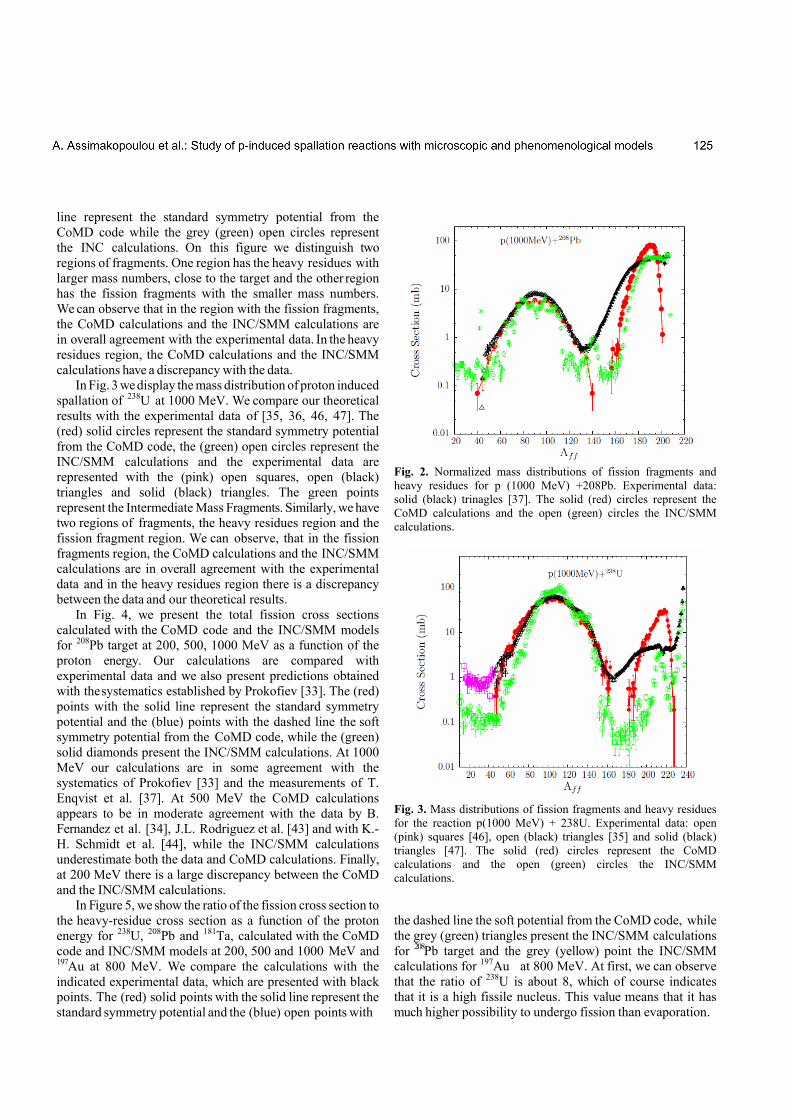
line represent the standard symmetry potential from the CoMD code while the grey (green) open circles represent the INC calculations. On this figure we distinguish two regions of fragments. One region has the heavy residues with larger mass numbers, close to the target and the other region has the fission fragments with the smaller mass numbers. We can observe that in the region with the fission fragments, the CoMD calculations and the INC/SMM calculations are in overall agreement with the experimental data. In the heavy residues region, the CoMD calculations and the INC/SMM calculations have a discrepancy with the data.
In Fig. 3 we display the mass distribution of proton induced spallation of 238U at 1000 MeV. We compare our theoretical results with the experimental data of [35, 36, 46, 47]. The (red) solid circles represent the standard symmetry potential from the CoMD code, the (green) open circles represent the INC/SMM calculations and the experimental data are represented with the (pink) open squares, open (black) triangles and solid (black) triangles. The green points represent the Intermediate Mass Fragments. Similarly, we have two regions of fragments, the heavy residues region and the fission fragment region. We can observe, that in the fission fragments region, the CoMD calculations and the INC/SMM calculations are in overall agreement with the experimental data and in the heavy residues region there is a discrepancy between the data and our theoretical results.
In Fig. 4, we present the total fission cross sections calculated with the CoMD code and the INC/SMM models for 208Pb target at 200, 500, 1000 MeV as a function of the proton energy. Our calculations are compared with experimental data and we also present predictions obtained with the systematics established by Prokofiev [33]. The (red) points with the solid line represent the standard symmetry potential and the (blue) points with the dashed line the soft symmetry potential from the CoMD code, while the (green) solid diamonds present the INC/SMM calculations. At 1000 MeV our calculations are in some agreement with the systematics of Prokofiev [33] and the measurements of T. Enqvist et al. [37]. At 500 MeV the CoMD calculations appears to be in moderate agreement with the data by B. Fernandez et al. [34], J.L. Rodriguez et al. [43] and with K.-H. Schmidt et al. [44], while the INC/SMM calculations underestimate both the data and CoMD calculations. Finally, at 200 MeV there is a large discrepancy between the CoMD and the INC/SMM calculations.
In Figure 5, we show the ratio of the fission cross section to the heavy-residue cross section as a function of the proton energy for 238U, 208Pb and 181Ta, calculated with the CoMD code and INC/SMM models at 200, 500 and 1000 MeV and 197Au at 800 MeV. We compare the calculations with the indicated experimental data, which are presented with black points. The (red) solid points with the solid line represent the standard symmetry potential and the (blue) open points with
Fig. 2. Normalized mass distributions of fission fragments and heavy residues for p (1000 MeV) +208Pb. Experimental data: solid (black) trinagles [37]. The solid (red) circles represent the CoMD calculations and the open (green) circles the INC/SMM calculations.
Fig. 3. Mass distributions of fission fragments and heavy residues for the reaction p(1000 MeV) + 238U. Experimental data: open (pink) squares [46], open (black) triangles [35] and solid (black) triangles [47]. The solid (red) circles represent the CoMD calculations and the open (green) circles the INC/SMM calculations.
the dashed line the soft potential from the CoMD code, while the grey (green) triangles present the INC/SMM calculations for 208Pb target and the grey (yellow) point the INC/SMM calculations for 197Au at 800 MeV. At first, we can observe that the ratio of 238U is about 8, which of course indicates that it is a high fissile nucleus. This value means that it has much higher possibility to undergo fission than evaporation.
user
Text Box
A. Assimakopoulou et al.: Study of p-induced spallation reactions with microscopic and phenomenological models 125

We notice also that the CoMD calculations at 1000 MeV are in good agreement with the data of Bernas et al. [35]. The ratio of
Fig. 4. Fission cross section as a function of the proton energy at 200, 500 and 1000 MeV for 208Pb target. Experimental data: solid triangle [43], open triangle [37], open square [44], open circle [44], open circle [34] and open diamond [33]. CoMD calculations: standard symmetry potential full (red) circles with solid line and soft symmetry potential full (blue) circles with dashed line. INC/SMM calculations: solid (green) diamonds.
Fig. 5. Ratio of the fission to residue cross section as a function of the proton energy at 200, 500 and 1000 MeV for the targets 238U, 208Pb, 181Ta and 197Au at 800 MeV. Experimental data: open square [35], open triangle [34], rhombus [37], star [38, 39] CoMD calculations: standard symmetry potential full (red) points and soft symmetry potential full (blue) points. INC/SMM calculations for 208Pb target: solid (green) triangles.
fission cross section to residue cross section for 208Pb calculated with the CoMD calculations is about 10%. This indicates that the lead target has a modest fissility. It appears that our calculations are in good agreement with the data of Fernandez et al. [34] at 500 MeV, especially our results with the soft symmetry potential. At 1000 MeV, the CoMD calculations with the standard potential are in good agreement with the data of Enqvist et al. [37]. Next, we present the ratio of 197Au at 800 MeV which is 4%. This suggests an intermediate fissility in relation with tantalum and lead. We also compare our results with experimental data [38, 39] for 197Au, which are displaced by 20 MeV for viewing purposes. The CoMD calculations with the soft symmetry potential are in very good agreement with the data. For 181Ta, the ratio is only about 1%, as calculated from the CoMD. This low value suggests that 181Ta has a low fissility and thus, has a tendency to undergo mostly evaporation. In general, we observe that the CoMD calculations with the soft potential are higher than the standard potential. 4 Discussion and Conclusions
In the present work we employed the semi-classical microscopic code CoMD to describe proton induced spallation in a variety of energies on 238U, 208Pb,197Au and 181Ta nuclei. In addition we used the phenomenological models INC and SMM in the standard two-stage scenario. In our study we chose these nuclei because of the availability of recent literature data and because of their significance in current applications of spallation. We observe that the fission of 208Pb and 238U target is symmetric due to the high excitation energy at which the shell effects are fully washed out [48]. Also we reproduced well the total fission cross sections and the ratio of fission over residue cross sections. In general, we point out that the CoMD code gives results that are not dependent on the specific dynamics being explored and, thus, offers valuable predictive power for the different modes of fission. A comparison of our calculations with some of the available experimental data from the literature showed satisfactory agreement. It appears that the microscopic code CoMD is able to describe the complicated N-body dynamics of the fission/spallation process. In closing, we suggest the systematic study of the above observables of spallation reactions and further comparison with experimental data. Moreover, apart from the microscopic CoMD code, we used the phenomenological models INC and SMM. Both the microscopic CoMD and the two phenomenological models de- cribe well the fission process, while it seems that the spallation/evaporation process they cannot describe it well. We are planning to use the statistical model MECO for better description of the evaporation process and we will compare the models with each other.
user
Text Box
A. Assimakopoulou et al.: Study of p-induced spallation reactions with microscopic and phenomenological models 126

Acknowledgements
We are thankful to M. Papa for his version of the CoMD code, and to Hua Zheng for his rewritten version of the CoMD. We are also thankful to W. Loveland for his enlighting comments and suggestions on this work and G.Giuliani for discussions on recent CoMD implementations. References 1. K.N Clausen, in Proceedings of the 16th Meeting of the
International Collaboration on Advanced neutron Sources, ICANS-XVI, edited by G.Mank and H.Conrad (Forshungszentrum Jlich GmbH,Jlich, Germany, 2003), Vol. 1,2 and 3.
2. The European Spallation Source Study, The ESS Technical Study, Vol.III, 1996, Report ESS-96-53-M.
3. H. Daniel, Y. Petrov, Subcritical fission reactor driven by the low power accelerator, Nucl. Instrum. Methods Phys. Res.A 373, (1), 131-134 (1996)
4. H. Nifenecker, S. David, J. Loiseaux, A. Giorni, Prog. Part. Nucl. Phys. 43, 683-827 (1999)
5. C.D. Bowman, Ann. Rev. Nucl. Part. Sci.48, 505 (1998). 6. C. Rubbia et al., CERN report,1995, CERN/AT/95-44(ET). 7. H. Nifenecker et al., Nucl. Instrum. Methods A 463, 428
(2001). 8. A.J. Koning, J.-P.Delaroche, and O. Bersillon, Nucl. Instrum.
Methods Phys. Res. A 414, 49 (1998). 9. M. Lewitowicz, J. Phys.:Conf. Ser.312, 052014 (2011). 10. W. Uyttenhove, P. Baeten, G.V. den Eynde et al., Ann. Nucl.
Energy 38 (7), 1519-1526 (2011). 11. K. Abbas, S. Buono, N. Burgio et al., Nucl.Instrum. Methods
Phys. Res.A 601 (3), 223-228 (2009). 12. https://www-win.gsi.de/charms. 13. A. Boudard, J. Cugnon, S. Leray, and C. Volant, Phys. Rev. C
66, 044615 (2002). 14. A. Boudard et al., Phys. Rev. C 87, 014606 (2013). 15. D. Mancusi, R.J. Charity, J. Cugnon, Phys. Rev. C C 82,
044610 (2010). 16. A. Kelic et al., in: D. Filges et al.(Eds.), Proceedings of the
Joint ICTP-IAEA Advanced Workshop on Model Codes for Spallation Reactions, ICTP Trieste, Vienna, Italy, 4-8 February 2008,IAEA report INDC(NDS)-530,2008,p.181.
17. A. Deppman et al., Phys.Rev. C 88, 024608 (2013). 18. S. Furihata, Nucl.Instrum. Methods B 171, 251 (2000). 19. Y. Yariv, Z. Fraenkel, Phys. Rev. C 24, 488-494 (1981). 20. N. Eren, N. Buyukcizmeci, R. Ogul, and A.S. Botvina, Eur.
Phys.J. A 49, 48 (2013). 21. J. Bondorf et al., Phys. Rep. 257, 133 (1995). 22. A.S. Botvina and I. N. Mishustin, Phys Rev. C 63, 061601
(2001). 23. G.A. Souliotis et al. Phys. Rev. C 75, 011601 (2007). 24. N. Buyukcizmeci, R. Ogul, and A. S. Botvina, Eur. Phys. J. A
25, 57 (2005) 25. M. Papa et al., Phys. Rev. C 64, 024612 (2001). 26. M. Papa, Phys. Rev. C 87, 014001 (2013). 27. N. Vonta, G. A. Souliotis, M. Veselsky, A. Bonasera, Phys.
Rev. C 92, 024616 (2015).
28. M. Papa et al, J. Comp. Phys. 208, 403 (2005). 29. J. Aichelin, Phys. Rep. 202, 233 (1991). 30. A. Bonasera, F. Gulminelli, J. Molitoris, Phys. Rep. 243, 1
(1994). 31. J.L. Rodriguez-Sanchez, J. Benlliure et al., Phys. Rev. C 91,
064616 (2015). 32. L. Audouin et al., Nucl. Phys. A 768, 1-21 (2006). 33. A. V. Prokofiev, Nucl. Instrum. and Methods in Phys. Res.
A 463, 557-575 (2001). 34. B. Fernandez et al., Nucl. Phys. A 747, 227-267 (2005). 35. M. Bernas et al., Nucl. Phys. A 725, 213-253 (2003). 36. M. Bernas et al., Nucl. Phys. A 765, 197 (2006). 37. T. Enqvist et al., Nucl. Phys.A 686, 481-524 (2001). 38. J. Benlliure, P. Armbruster et al., Nucl. Phys. A 700, 469-491
(2002). 39. F. Rejmund et al., Nucl. Phys. A 683, 540-565 (2001). 40. S. Leray et al., Phys. Rev.C 65, 044621 (2002). 41. J. Benlliure, P. Armbruster et al., Nucl. Phys. A 683, 513-539
(2001). 42. Y. Ayyad, J. Benlliure et al., Phys. Rev. C 89, 054610
(2014). 43. J. L. Rodriguez et al., Phys. Rev. C 90, 064606 (2014). 44. K. -H. Schmidt et al., Phys. Rev. C 87, 034601 (2013). 45. A. A. Kotov et al. Phys. Rev.C 74, 034605 (2006). 46. M. V. Ricciardi et al., Phys. Rev.C 73, 014607 (2006). 47. J. Taieb et al., Nucl. Phys. A 724, 413-430 (2003). 48. A. Chaudhuri et al., Phys. Rev. C 91, 044620 (2015).
user
Text Box
A. Assimakopoulou et al.: Study of p-induced spallation reactions with microscopic and phenomenological models 127
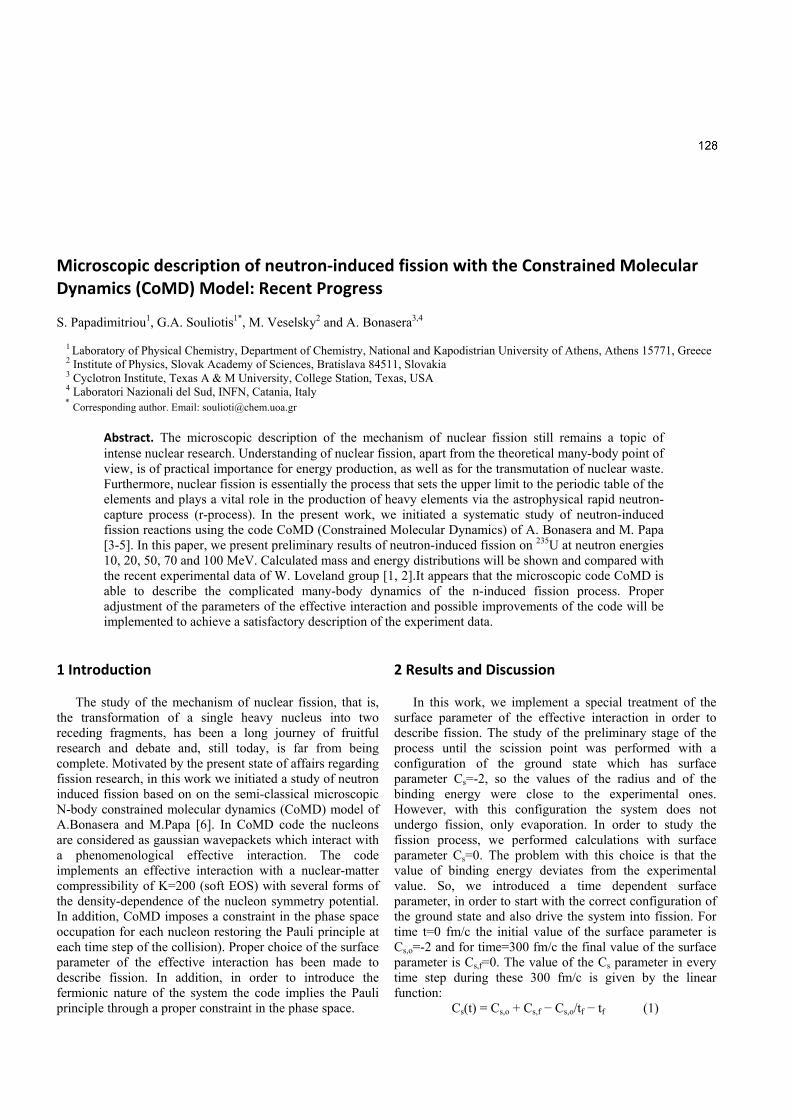
Microscopic description of neutron‐induced fission with the Constrained Molecular Dynamics (CoMD) Model: Recent Progress S. Papadimitriou1, G.A. Souliotis1*, M. Veselsky2 and A. Bonasera3,4
1 Laboratory of Physical Chemistry, Department of Chemistry, National and Kapodistrian University of Athens, Athens 15771, Greece 2 Institute of Physics, Slovak Academy of Sciences, Bratislava 84511, Slovakia 3 Cyclotron Institute, Texas A & M University, College Station, Texas, USA 4 Laboratori Nazionali del Sud, INFN, Catania, Italy
* Corresponding author. Email: [email protected]
Abstract. The microscopic description of the mechanism of nuclear fission still remains a topic of intense nuclear research. Understanding of nuclear fission, apart from the theoretical many-body point of view, is of practical importance for energy production, as well as for the transmutation of nuclear waste. Furthermore, nuclear fission is essentially the process that sets the upper limit to the periodic table of the elements and plays a vital role in the production of heavy elements via the astrophysical rapid neutron-capture process (r-process). In the present work, we initiated a systematic study of neutron-induced fission reactions using the code CoMD (Constrained Molecular Dynamics) of A. Bonasera and M. Papa [3-5]. In this paper, we present preliminary results of neutron-induced fission on 235U at neutron energies 10, 20, 50, 70 and 100 MeV. Calculated mass and energy distributions will be shown and compared with the recent experimental data of W. Loveland group [1, 2].It appears that the microscopic code CoMD is able to describe the complicated many-body dynamics of the n-induced fission process. Proper adjustment of the parameters of the effective interaction and possible improvements of the code will be implemented to achieve a satisfactory description of the experiment data.
1 Introduction
The study of the mechanism of nuclear fission, that is,
the transformation of a single heavy nucleus into two receding fragments, has been a long journey of fruitful research and debate and, still today, is far from being complete. Motivated by the present state of affairs regarding fission research, in this work we initiated a study of neutron induced fission based on on the semi-classical microscopic N-body constrained molecular dynamics (CoMD) model of A.Bonasera and M.Papa [6]. In CoMD code the nucleons are considered as gaussian wavepackets which interact with a phenomenological effective interaction. The code implements an effective interaction with a nuclear-matter compressibility of K=200 (soft EOS) with several forms of the density-dependence of the nucleon symmetry potential. In addition, CoMD imposes a constraint in the phase space occupation for each nucleon restoring the Pauli principle at each time step of the collision). Proper choice of the surface parameter of the effective interaction has been made to describe fission. In addition, in order to introduce the fermionic nature of the system the code implies the Pauli principle through a proper constraint in the phase space.
2 Results and Discussion
In this work, we implement a special treatment of the surface parameter of the effective interaction in order to describe fission. The study of the preliminary stage of the process until the scission point was performed with a configuration of the ground state which has surface parameter Cs=-2, so the values of the radius and of the binding energy were close to the experimental ones. However, with this configuration the system does not undergo fission, only evaporation. In order to study the fission process, we performed calculations with surface parameter Cs=0. The problem with this choice is that the value of binding energy deviates from the experimental value. So, we introduced a time dependent surface parameter, in order to start with the correct configuration of the ground state and also drive the system into fission. For time t=0 fm/c the initial value of the surface parameter is Cs,o=-2 and for time=300 fm/c the final value of the surface parameter is Cs,f=0. The value of the Cs parameter in every time step during these 300 fm/c is given by the linear function:
Cs(t) = Cs,o + Cs,f − Cs,o/tf − tf (1)
user
Text Box
128
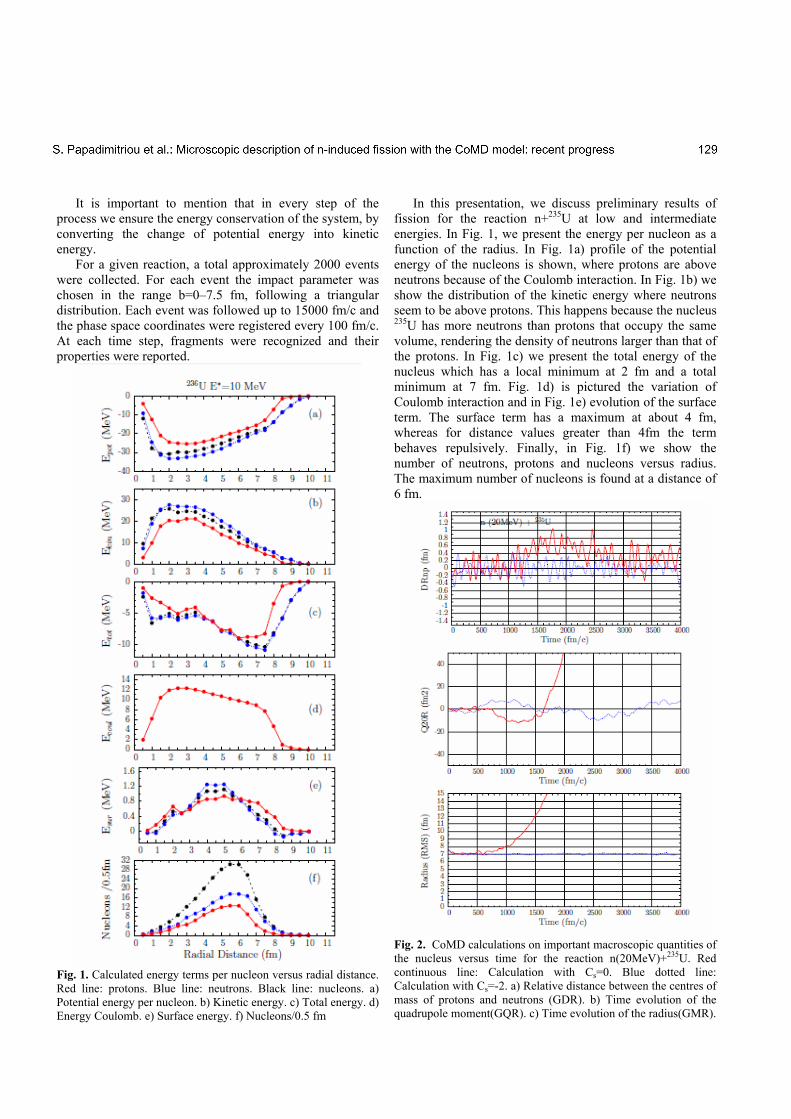
It is important to mention that in every step of the process we ensure the energy conservation of the system, by converting the change of potential energy into kinetic energy.
For a given reaction, a total approximately 2000 events were collected. For each event the impact parameter was chosen in the range b=0–7.5 fm, following a triangular distribution. Each event was followed up to 15000 fm/c and the phase space coordinates were registered every 100 fm/c. At each time step, fragments were recognized and their properties were reported.
Fig. 1. Calculated energy terms per nucleon versus radial distance. Red line: protons. Blue line: neutrons. Black line: nucleons. a) Potential energy per nucleon. b) Kinetic energy. c) Total energy. d) Energy Coulomb. e) Surface energy. f) Nucleons/0.5 fm
In this presentation, we discuss preliminary results of fission for the reaction n+235U at low and intermediate energies. In Fig. 1, we present the energy per nucleon as a function of the radius. In Fig. 1a) profile of the potential energy of the nucleons is shown, where protons are above neutrons because of the Coulomb interaction. In Fig. 1b) we show the distribution of the kinetic energy where neutrons seem to be above protons. This happens because the nucleus 235U has more neutrons than protons that occupy the same volume, rendering the density of neutrons larger than that of the protons. In Fig. 1c) we present the total energy of the nucleus which has a local minimum at 2 fm and a total minimum at 7 fm. Fig. 1d) is pictured the variation of Coulomb interaction and in Fig. 1e) evolution of the surface term. The surface term has a maximum at about 4 fm, whereas for distance values greater than 4fm the term behaves repulsively. Finally, in Fig. 1f) we show the number of neutrons, protons and nucleons versus radius. The maximum number of nucleons is found at a distance of 6 fm.
Fig. 2. CoMD calculations on important macroscopic quantities of the nucleus versus time for the reaction n(20MeV)+235U. Red continuous line: Calculation with Cs=0. Blue dotted line: Calculation with Cs=-2. a) Relative distance between the centres of mass of protons and neutrons (GDR). b) Time evolution of the quadrupole moment(GQR). c) Time evolution of the radius(GMR).
user
Text Box
S. Papadimitriou et al.: Microscopic description of n-induced fission with the CoMD model: recent progress 129
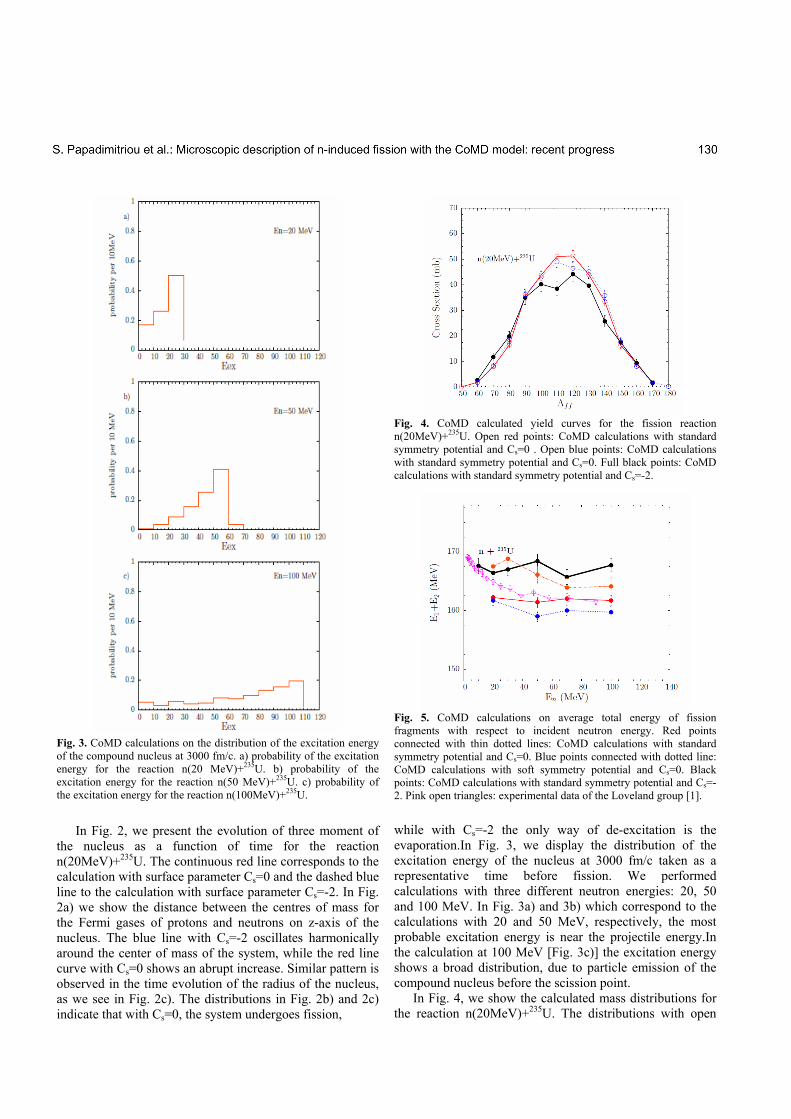
Fig. 3. CoMD calculations on the distribution of the excitation energy of the compound nucleus at 3000 fm/c. a) probability of the excitation energy for the reaction n(20 MeV)+235U. b) probability of the excitation energy for the reaction n(50 MeV)+235U. c) probability of the excitation energy for the reaction n(100MeV)+235U.
In Fig. 2, we present the evolution of three moment of
the nucleus as a function of time for the reaction n(20MeV)+235U. The continuous red line corresponds to the calculation with surface parameter Cs=0 and the dashed blue line to the calculation with surface parameter Cs=-2. In Fig. 2a) we show the distance between the centres of mass for the Fermi gases of protons and neutrons on z-axis of the nucleus. The blue line with Cs=-2 oscillates harmonically around the center of mass of the system, while the red line curve with Cs=0 shows an abrupt increase. Similar pattern is observed in the time evolution of the radius of the nucleus, as we see in Fig. 2c). The distributions in Fig. 2b) and 2c) indicate that with Cs=0, the system undergoes fission,
Fig. 4. CoMD calculated yield curves for the fission reaction n(20MeV)+235U. Open red points: CoMD calculations with standard symmetry potential and Cs=0 . Open blue points: CoMD calculations with standard symmetry potential and Cs=0. Full black points: CoMD calculations with standard symmetry potential and Cs=-2.
Fig. 5. CoMD calculations on average total energy of fission fragments with respect to incident neutron energy. Red points connected with thin dotted lines: CoMD calculations with standard symmetry potential and Cs=0. Blue points connected with dotted line: CoMD calculations with soft symmetry potential and Cs=0. Black points: CoMD calculations with standard symmetry potential and Cs=-2. Pink open triangles: experimental data of the Loveland group [1].
while with Cs=-2 the only way of de-excitation is the evaporation.In Fig. 3, we display the distribution of the excitation energy of the nucleus at 3000 fm/c taken as a representative time before fission. We performed calculations with three different neutron energies: 20, 50 and 100 MeV. In Fig. 3a) and 3b) which correspond to the calculations with 20 and 50 MeV, respectively, the most probable excitation energy is near the projectile energy.In the calculation at 100 MeV [Fig. 3c)] the excitation energy shows a broad distribution, due to particle emission of the compound nucleus before the scission point.
In Fig. 4, we show the calculated mass distributions for the reaction n(20MeV)+235U. The distributions with open
user
Text Box
S. Papadimitriou et al.: Microscopic description of n-induced fission with the CoMD model: recent progress 130

symbols connected with dotted (blue) and solid (red) lines have surface parameter Cs=0 and show a quite symmetric fission [7]. The calculations shown by the full points connected with black line have time dependent surface parameter Cs(t) and suggest a rather asymmetric fission as expected for this low-energy fission reaction [2].
In Fig. 5 we present the total kinetic energy of the fission fragments versus the kinetic energy of the neutron projectile. Our calculations with the CoMD model were performed with the soft and the standard symmetry potential and they were compared with the experimental data at the corresponding energies of Loveland and al. [1]. The calculation with time dependent surface parameter Cs(t) describe better the experimental data at low energies, while the calculations with Cs=0 describe better the experimental values for higher neutron energies. 3 Conclusions In the present work we employed the semi-classical microscopic code CoMD to describe neutron induced fission, at several energies on 235U. We intend to study systematically the neutron induced fission by calculating a number of representative observables such as: mass yield curves, cross sections, energy distributions, the fission time scale and the pre-fission and post-fission neutron and proton emission. We mention that the code does not include the effect of spin-orbit interaction in the mean filed, as a result of the absence of spin dependence in the effective nucleon-nucleon interaction. We intend to add such a dependence in order to improve our ability to examine low energy fission. References 1. R. Yanez, W. Loveland, J. Kind, J.S. Barett, Total kinetic
energy release in the fast neutron induced fission of 235U arXiv:1605.09690v2 [nucl-ex] (2016)
2. W. Loveland, J. King, Total kinetic energy release in the fast neutron induced fission of 232Th and 235U, arXiv:1702.01790v1 [nucl-ex] (2017).
3. M. Papa, T. Maruyama, and A. Bonasera, Constrained Molecular dynamics approach to fermionic systems, Phys. Rev. C64, (2001) 024612.
4. M.Papa, G.Guluilani, and A. Bonasera, Constrained Molecular Dynamics II: a N-body approach to fermionic systems, J. Comp. Phys. 208 (2005) 403.
5. A. Bonasera, M. Bruno, C.O. Dorso and P.F. Mastinu, Critical phenomena in nuclear fragmentation, Riv. Nuovo Cimento 23 (2000) 1.
6. M. Papa, Many-body in semiclassical molecular dynamics and Skyrme interaction, Phys. Rev. C87 (2013) 014001.
7. N.Vonta, G.A. Souliotis, M. Veselsky, and A. Bonasera, Microscopic dynamical description of proton induced fission with the constrained molecular dynamics model, Phys. Rev. C 92 (2015) 024616.
user
Text Box
S. Papadimitriou et al.: Microscopic description of n-induced fission with the CoMD model: recent progress 131

Neutron‐rich rare isotope production with stable and radioactive beams in the mass range A ∼ 40‐60 at 15 MeV/nucleon A. Papageorgiou1, G.A. Souliotis1*, Y.K. Kwon2, K. Tshoo2, A. Bonasera3,4, M. Veselsky5
1 Laboratory of Physical Chemistry, Department of Chemistry, University of Athens, Athens 15771, Greece. 2 The Rare Isotope Science Project (RISP), Institute for Basic Science, Daejeon 305-811, Korea. 3 Cyclotron Institute, Texas A&M University, College Station, Texas, USA. 4 Laboratori Nazionali del Sud, INFN, via Santa Sofia 62, I95123 Catania, Italy. 5 Institute of Physics, Slovak Academy of Sciences, Bratislava, Slovakia.
* Corresponding author. Email: [email protected]
Abstract. This work reports on our continued efforts to study the production of rare isotopes with heavy-ion beams at energy 15 MeV/nucleon. Our calculations are based on a two-step approach: the dynamical stage of the collision is described with either the phenomenological Deep-Inelastic Transfer model (DIT) [1], or with the microscopic Constrained Molecular Dynamics model (CoMD) [2,3,4]. The de-excitation of the hot heavy projectile fragments is performed with the Statistical Multifragmentation Model (SMM) [4]. We first present experimentally acquired production cross sections of neutron-rich nuclides from collisions of a 40Ar stable beam with targets of 58Ni, 64Ni and 27Al [5] and we compare them with our calculations. Then we performed calculations for the same beam (15 MeV/nucleon) with other neutron rich targets such as 48Ca and 238U and find that the multinucleon transfer mechanism leads to very neutron-rich nuclides in mass range A ~ 40-60. Motivated by the high production cross section of target 238U, we performed calculation with beam of 48Ca (15 MeV/nucleon). We found that we can produce radioactive beams of 46Ar and 54Ca which can be separated and hit another target of 238U, participating in reactions of multinucleon transfer which can produce extremely neutron-rich and even new isotopes.
1 Introduction
The study of the nuclear landscape toward the astrophysical r-process path and the neutron drip-line have received special attention by the nuclear physics community (see, e.g., [1]). To reach a high neutron-excess in the products, apart from proton stripping, capture of neutrons may be necessary from the target. Such a possibility is offered by reactions of nucleon exchange at beam energies from the Coulomb barrier [2,3] to the Fermi energy (20-40 MeV/nucleon) [4,5].
In this section we present the results of the calculation of peripheral heavy ion reactions. We compare our results with experimental data from the reaction 40Ar + 64Ni at beam energy 15 MeV/A, which were acquired as described in [6], as well as from the reactions 40Ar + 181Ta [7] and 48Ca + 181Ta [8] found in the literature. The calculation were performed with the phenomenological model DIT [9] and the microscopic CoMD [10], which describe the dynamical stage of the nucleon exchange, and the statistical de-excitation model SMM [11].
2 Calculations for stable beams of 40Ar and 48Ca at 15 MeV/A
In Fig. 1, we show the calculated mass distributions of projectile-like fragments with Z=12-19 from the reaction 40Ar (15 MeV/A) + 64Ni performed by CoMD/SMM (dashed red line) and DIT/SMM (solid green line) compared with the experimental data (black points). We observe that in the isotopes close to the projectile (Z=16-19), the results of the two models are almost identical, while they are in good agreement with the data. Subsequently, the largest part of the calculations will be performed with the DIT model, as it can conduct results of higher statistics in less time than the CoMD model.
After the presentation of the comparisons between our calculations with the experimental data, we can feel certain that the results of both DIT and CoMD can be considered as valid. Hence, they can be used to predict the results of reactions that have not taken place yet.
Motivated by these results, we performed calculations with a beam of the same mass range, but far more neutron
user
Text Box
132

Fig. 1. Calculated mass distributions of projectile-like fragments with Z=12-19 from the reaction 40Ar (15 MeV/A) + 64Ni performed by CoMD/SMM (dashed red line) and DIT/SMM (solid green line) compared with the experimental data (black points) [6]. rich, 48Ca (15 MeV/A). In Fig. 2, we show our calculations for the reactions 48Ca (15 MeV/A) + 64Ni (solid red line), 48Ca (15 MeV/A) + 238U (dashed green line) and 48Ca (15 MeV/A) + 208Pb (dashed-dotted yellow line) compared the data we found in the literature from the reaction 48Ca (140 MeV/A) + 181Ta [8] (open blue points). Our calculations for the low energy reactions seem to favor the production of neutron-rich isotopes in contrast with the data of the high energy reaction, where neutron capture is rather unlikely to happen. If we examine the distribution of the calcium isotopes we can see that with the use of 238U as a target, we can produce nuclei that have captured up to 6-7 neutrons, like 54Ca.
Fig. 2. Calculations for the reactions 48Ca (15 MeV/A) + 64Ni (solid red line), 48Ca (15 MeV/A) + 238U (dashed green line) and 48Ca (15 MeV/A) + 208Pb (dashed-dotted yellow line) compared with the data we found in the literature from the reaction 48Ca (140 MeV/A) + 181Ta [3] (open blue points). 3 Calculations for radioactive beam (RIB) of 54Ca (15 MeV/A)
Radioactive beams are a very useful tool in the investigation of reaction mechanisms and nuclear stability. By using them, we are able to produce very rare isotopes near the neutron drip line. Motivated by the relatively high production cross section of the 54Ca isotope from the reaction 48Ca (15 MeV/A) + 238U, we decided to perform calculations with this RIB. In Fig. 3, we show the DIT/SMM calculations for the reactions 54Ca (15 MeV/A) + 64Ni (solid red line) and 54Ca (15 MeV/A) + 238U (dashed green line). These calculations are, in our opinion, the most
user
Text Box
A. Papageorgiou et al.: Neutron-rich rare isotope production with stable and radioactive beams at 15 MeV/nucleon 133

Table 1. Predicted cross sections and production rate estimates of some isotopes from the reaction 48Ca (15 MeV/A) + 238U Rare isotope t1/2
Reaction Channel
Cross Section (mb) Rates (s-1)
54Ca 0.09 s (expt) -0p+6n 0.03 4.6×10³ 46Ar 8.4 s (expt) -2p-0n 2.88 4.4×10⁵ 55Sc 0.09 s (expt) +1p+6n 0.051 7.8×10³ 52K 105 ms (expt) -1p+5n 0.05 17.6×10³
Table 2. Predicted cross sections and production rate estimates of some isotopes from the reaction 54Ca (15 MeV/A) + 238U Rare isotope t1/2
Reaction Channel
Cross Section (mb) Rates (s-1)
57Ca 7 ms (expt) -0p+3n 0.59 1.4×10⁻⁴ (12 day-1) 58Ca 12 ms (theo) -0p+4n 0.16 3.75×10⁻⁵ (3 day-1) 59Ca 6 ms (theo) -0p+5n 0.04 9.75×10⁻⁶ (6 week-1)60Ca 4 ms (theo) -0p+6n 0.008 1.9×10⁻⁶ (1 week-1) 54K 10 ms (expt) -1p+1n 0.58 1.4×10⁻⁴ (12 day-1) 55K 4 ms (expt) -1p+4n 0.04 9.4×10⁻⁶ (6 week-1)
Fig. 3. DIT/SMM calculations for the reactions 54Ca (15 MeV/A) + 64Ni (solid red line) and 54Ca (15 MeV/A) + 238U (dashed green line).
interesting result of this work, as it seems that with this RIB and this neutron-rich target we can produce very rare and even new isotopes up to 60Ca, or even beyond.
After the presentation of the yields, we proceed to the presentation of the production rates of some important isotopes. In Table 1, we show the predicted cross sections and production rate estimates of some isotopes from the reaction 48Ca (15 MeV/A) + 238U. We have assumed a relatively high beam intensity of 500 pnA (3x10¹² particles/s) and target thickness 20 mg/cm2. In this table we report the cross sections and production rates of the radioactive isotopes 46Ar and 54Ca, which were used as RIB. Also, we show the experimentally measured (expt) or theoretically predicted (theo) half life time [12,13] of each isotope.
In Table 2, we show the predicted cross sections and production rate estimates of some isotopes from the reaction 54Ca (15 MeV/A) + 238U. As before, we have assumed that the beam intensity is the production rate of 54Ca from the reaction 48Ca (15 MeV/A) + 238U, which is about 4600 particles/s, and a target thickness of 20 mg/cm2. We see that production of very rare and even new isotopes, like 59Ca and 60Ca, is predicted in peripheral low energy collisions of the radioactive beam 54Ca. 4 Summarry and conclusions
In this work we performed a series of calculations of cross sections of projectile fragments from peripheral heavy ion reactions with beam energy 15 MeV/A. More specifically, we presented calculation for the reactions with the stable beams 40Ar (15 MeV/A) and 48Ca (15 MeV/A) + 64Ni, 208Pb, 238U and with the radioactive beam 54Ca (15 MeV/A) + 64Ni, 238U, using the phenomenological model DIT [9], the microscopic model CoMD [10] and the statistical de-excitation model SMM [11]. We saw that our calculations came to a satisfactory agreement with the available experimental data. Then, we predicted the production of very rare and even new isotopes toward the region of 60Ca, which has not been produced yet. References 1. J. Erler et al, Nature 486, 509 (2011). 2. V. V. Volkov, Phys. Rep. 44, 93 (1978). 3. L. Corradi, G. Pollarolo, S. Szilner, J. Phys. G 36, 113101
(2009). 4. G. A. Souliotis et al., Phys. Lett. B 543, 163 (2002). 5. G. A. Souliotis et al., Phys. Rev. Lett. 91, 022701 (2003). 6. G.A. Souliotis, M. Veselsky, S. Galanopoulos et al.,
Approaching neutron rich nuclei toward the r-process path in peripheral heavy ion collisions at 15 MeV/nucleon, Phys. Rev. C 84, 064607 (2011).
7. Mashiro Notani, Projectile Fragmentation reactions and
user
Text Box
A. Papageorgiou et al.: Neutron-rich rare isotope production with stable and radioactive beams at 15 MeV/nucleon 134
production of nuclei near the neutron drip line, University of Tokyo (Phd thesis).
8. M. Mocko et al., Projectile fragmentation of 40Ca, 48Ca, 58Ni and 64Ni at 140 MeV/nucleon, Phys. Rev. C 74, 05612 (2006).
9. L. Tassan-Got and C. Stefan, Deep inelastic transfers. A way to dissipate energy and angular momentum for reactions in the Fermi energy domain, Nucl. Phys. A 524, 121 (1991).
10. M. Papa et al., Constrained molecular dynamics approach to fermionic systems, Phys. Rev. C 64, 024612 (2001).
11. J.P Bondorf et al., Statistical multifragmentaition of nuclei, Phys. Rep. 257, 133 (1995).
12. P. Moller, J.R. Nix et al., Nuclear ground state masses and deformations, Atomic Data Nucl. Data Tables 59, 185-381 (1995).
13. P. Moller, J.R. Nix et al., Nuclear properties for astrophysical applications, Atomic Data Nucl. Data Tables 66, 131-345 (1997).
user
Text Box
A. Papageorgiou et al.: Neutron-rich rare isotope production with stable and radioactive beams at 15 MeV/nucleon 135
Study of the 7Be + 28Si at near barrier energies: Elasticscattering and alpha production
O. Sgouros1, A. Pakou1, D. Pierroutsakou2, M. Mazzocco3,4, L. Acosta5,6, X. Aslanoglou1, Ch. Betsou1, A.Boiano2, C. Boiano7, D. Carbone8, M. Cavallaro8, J. Grebosz9, N. Keeley10, M. La Commara2,11, C. Manea4, G.Marquınez-Duran12, I. Martel12, N. G. Nicolis1, C. Parascandolo2, K. Rusek13, A. M. Sanchez-Benıtez12,14, C.Signorini15, F. Soramel3,4, V. Soukeras1, C. Stefanini3, E. Stiliaris16, E. Strano3,4, I. Strojek10, and D. Torresi3,4
1 Department of Physics and HINP, The University of Ioannina, Ioannina, Greece2 INFN, Sezione di Napoli, via Cinthia, Napoli, Italy3 Dipartimento di Fisica e Astronomia, Universita di Padova, via Marzolo 8, Padova, Italy4 INFN, Sezione di Padova, via Marzolo 8, Padova, Italy5 Instituto de Fisica, Universidad Nacional Autonoma de Mexico, Mexico D.F, Mexico6 INFN, Sezione di Catania, via Santa Sofia 64, Catania, Italy7 INFN, Sezione di Milano, via Celoria 16, Milano, Italy8 INFN Laboratori Nazionali del Sud, via Santa Sofia 62, Catania, Italy9 The Henryk Niewodniczanski Institute of Nuclear Physics (IFJ PAN), Krakow, Poland
10 National Centre for Nuclear Research, ul. Andrzeja Soltana 7, Otwock, Poland11 Dipartimento di Scienze Fisiche, Universita di Napoli Federico II, Napoli, Italy12 Departamento de Ciencias Integradas, Universidad de Huelva, Huelva, Spain13 Heavy Ion Laboratory, University of Warsaw, Pasteura 5a, Warsaw, Poland14 Centro de Fisica Nuclear da Universidade de Lisboa, Lisboa, Portugal15 INFN, LNL, viale dell’ Universita 2, Legnaro, Italy16 Institute of Accelerating Systems and Applications and Department of Physics, University of Athens, Athens, Greece
Abstract. The 7Be + 28Si system was studied at four near barrier energies: 13.2, 17.2, 19.8 and 22.0MeV. Angular distribution measurements for the elastically scattered 7Be ions as well as the α and 3Hereaction products were performed with the multidetector array EXPADES. The elastic scattering data wereanalyzed in a double-folding framework and the energy evolution of the Optical Potential was deduced. Thereaction data were analyzed in both statistical model and Distorted Wave Born Approximation frameworks(DWBA) in order to disentangle the degree of competition between direct and compound channels. Theenergy evolution of the ratio of direct to total reaction cross section was mapped in comparison withsimilar data for 6Li and 7Li projectiles on a 28Si target, indicating larger transfer contributions for 7Beand 7Li that in the 6Li case. Fusion cross sections for the system under study were deduced and werefound to be compatible with systematic. Comparison with previous fusion data for 6Li and 7Li indicatefusion hindrance for 7Li and 7Be compared to 6Li, starting from the barrier and below it. This hindranceis attributed to the existence of large transfer channels.
PACS. 25.70.Bc Heavy-ion reactions – 24.10.Ht Optical and diffraction models – 24.10.Eq Coupled-channel methods – 24.10.Lx Nuclear reaction models
1 Introduction
Over the past decades, elastic scattering has been es-tablished as the traditional tool for probing the OpticalPotential. In this respect, many studies have been de-voted so far to study the energy dependence of the Op-tical Potential through elastic scattering measurements.For tightly bound projectiles, it was well demonstratedthat the imaginary part of the Optical Potential sharplydecreases at barrier and the real part connected with it
via dispersion relations develops a localized peak. Thisanomalous behavior was named potential Threshold Anomaly(TA) [1–3]. On the other hand, the situation for weaklybound encounters is very different with an imaginary partexhibiting either an increasing trend approaching the bar-rier from higher to lower energies or a decreasing one butwhich occurs well below barrier. Elastic scattering mea-surements with 6Li and 7Li on low mass targets (27Al,28Si) have shown that their energy dependence of the Op-tical Potential deviates from the standard TA but also
user
Text Box
136
2
that, the situation is different for the two ions [4–8]. Whilefor 6Li an increasing trend of the imaginary potential ap-proaching the barrier from higher to lower energies is met,for 7Li the energy dependence resembles more the oneseen for well bound projectiles but where the flat imag-inary potential persist till very low sub-barrier energies.In principle the variations of TA for the Optical Poten-tial should be connected with variations in reaction mech-anisms appearing strong at near and below barrier. In-vestigations of collisions involving weakly bound nucleicreate an interesting field to study reaction mechanismsand coupling effects, since direct reactions like breakupor transfer are enhanced. In this respect several studieson inclusive and exclusive measurements of light reactionproducts has been undertaken. Amongst them outstand-ing role hold the studies for the determination of fusioncross sections and the evolution of competition betweendirect and compound nucleus formation. Into this con-text, we have proposed the present study involving theradioactive projectile 7Be on a 28Si target. This systemwas chosen because comprehensive studies already existfor the related systems 6,7Li + 28Si and it will be an in-teresting point to investigate simiarities between weaklybound but stable projectiles with a radioactive one. Fur-ther on it will be interesting to investigate whether the 7Beresembles more its mirror nucleus, 7Li, or the 6Li one, us-ing the information from both elastic as well as reactionchannels.
2 Experimental details and data reduction
The 7Be secondary beam was produced at the EX-OTIC facility [9–12] at the Laboratori Nazionali di Leg-naro (LNL), Italy, by means of the In Flight (IF) techniqueand the 1H(7Li,7Be)n reaction. The 7Li+3 primary beamwas delivered by the LNL XTU Tandem Van de Graaffaccelerator with an intensity of ∼150 pnA and energies of26 to 33 MeV. The primary beam was directed onto a 5cm long gas cell with 2.2 m thick Havar foil windows filledwith H2 gas at a pressure of ∼1000 mbar and a temper-ature of 93 K, corresponding to an effective thickness of1.35 mg/cm2. The 7Be beam was produced at 4 energiesnamely 13.2, 17.2, 19.8 and 22.0 MeV and it was impingedon a silicon target placed in the middle of the scatteringchamber. The various ejectiles were collected by six ∆E-E telescopes of the detector array of the EXOTIC facil-ity, EXPADES (EXotic PArticle DEtection System) [12],placed at symmetrical position to balance any beam diver-gence and to improve the statistics of the measurement.The ∆E stage of the telescopes was a Double Sided Sil-icon Strip Detector (DSSSD) (45-60)µm thick, while theE stage was a DSSSD ∼300µm thick. Also, our experi-mental setup included two X-Y position sensitive ParallelPlate Avalanche Counters (PPAC’s) [12] for monitoringthe secondary beam profile and providing information foran event by event reconstruction of the beam particle tra-jectories.
The elastically scattered 7Be ions were stopped in thefirst stage of the telescope and therefore, the identifica-
tion of the elastic peak was performed by analyzing singleenergy spectra. Furthermore, the reduction of the elas-tic scattering events was performed by means of an eventby event code [13] which developed for the needs of thepresent study. This code handles the information providedby the two PPAC’s and the DSSSD detectors in order todefine in a more accurate way the scattering angle for eachevent. Briefly we can refer on that as following. Experi-mentally the coordinates for each beam particle are deter-mined in two places via the information collected by thetwo PPAC’s. This information is implemented in our codeand via analytic geometry, the beam particle trajectoriesare reconstructed. In this respect, the reaction positionon the target is defined for each event. Subsequently, theDSSSD telescopes provide the position of each elasticallyscattered particle, since each event is detected in a uniquepixel of the detector. By using the coordinates of the reac-tion position on the target together with the coordinatesof the events detected in the DSSSDs, the scattering anglefor each event can be determined.
Data concerning both the elastic scattering of 7Be on28Si and 208Pb, the last used for the determination of thedetector solid angles, were treated in an event by eventframework. Events with the same angle or with an angleinside an angular range corresponding to a particular stripof each EXPADES detector (∆θ∼ 2o) were summed up.The ratios σ/σSi
Ruth were deduced according to the follow-ing expression:
Ratio ≡σ
σSiRuth
=NSi
NPb
∗K (1)
where NSi and NPb are the event by event counts corre-sponding to every strip collected with the silicon and leadtargets respectively and the constant K corresponds to
K =TPbΦPb
TSiΦSi
σPb
Ruth
σSiRuth
(2)
where TSi and TPb are the scattering centers of the siliconand lead targets respectively, ΦSi and ΦPb are the beamfluxes during the runs with the silicon and lead targets re-spectively and σSi
Ruth and σPbRuth are the calculated Ruther-
ford cross sections for the elastic scattering of 7Be on 28Siand 208Pb respectively. The constant K is determined as-suming that at small scattering angles the ratio σ/σSi
Ruthbetween elastic scattering cross sections and Rutherfordcross sections is 1.0. This assumption is valid only at thelowest energy of 13.2 MeV. For the rest of the energies theratio was assumed to be closed to 1, according to the the-oretical calculations. The results of this analysis are alsoreported in Ref. [14].
The reaction products, that is the α and 3He particleswhich are under study in this work, were well separatedby the ∆E-E technique and their yield was obtained byapplying the appropriate energy windows on the two di-mensional ∆E-E plots. Missing counts, due to the energythreshold of each telescope where retrieved by compar-ing the experimental energy spectra with simulated ones.
user
Text Box
O. Sgouros et al.: Study of 7Be + 28Si at near barrier energies: elastic scattering and alpha production 137
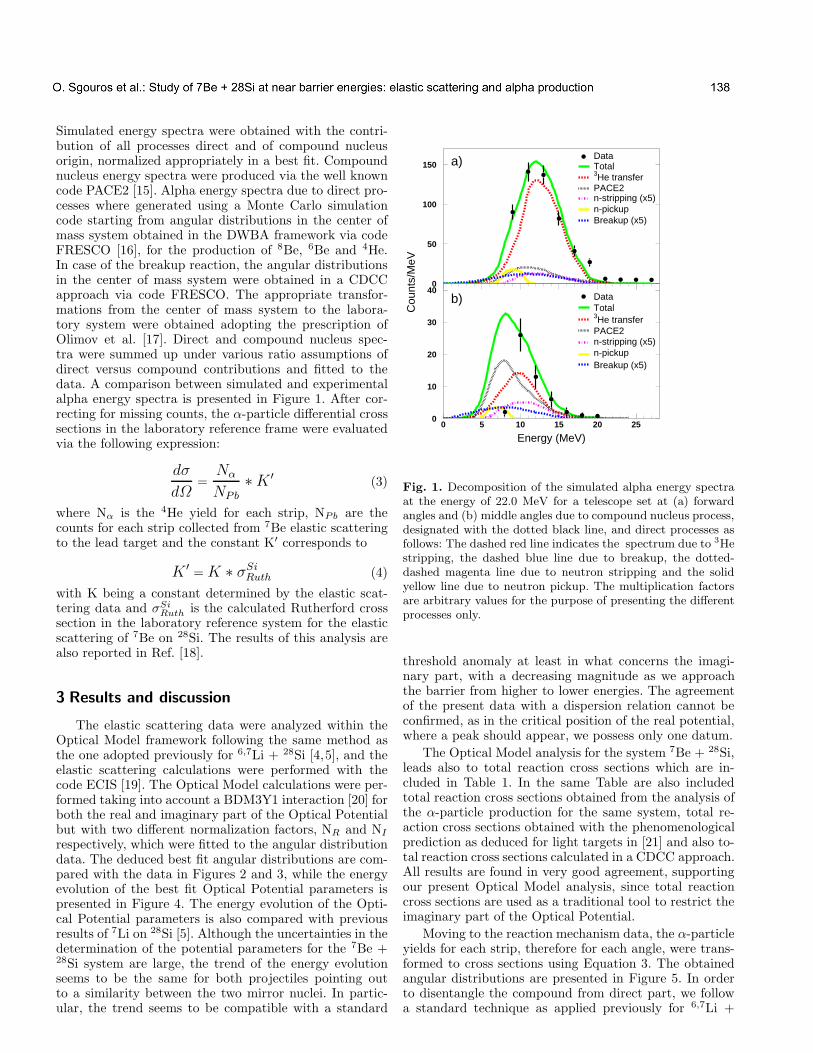
3
Simulated energy spectra were obtained with the contri-bution of all processes direct and of compound nucleusorigin, normalized appropriately in a best fit. Compoundnucleus energy spectra were produced via the well knowncode PACE2 [15]. Alpha energy spectra due to direct pro-cesses where generated using a Monte Carlo simulationcode starting from angular distributions in the center ofmass system obtained in the DWBA framework via codeFRESCO [16], for the production of 8Be, 6Be and 4He.In case of the breakup reaction, the angular distributionsin the center of mass system were obtained in a CDCCapproach via code FRESCO. The appropriate transfor-mations from the center of mass system to the labora-tory system were obtained adopting the prescription ofOlimov et al. [17]. Direct and compound nucleus spec-tra were summed up under various ratio assumptions ofdirect versus compound contributions and fitted to thedata. A comparison between simulated and experimentalalpha energy spectra is presented in Figure 1. After cor-recting for missing counts, the α-particle differential crosssections in the laboratory reference frame were evaluatedvia the following expression:
dσ
dΩ=
Nα
NPb
∗K ′ (3)
where Nα is the 4He yield for each strip, NPb are thecounts for each strip collected from 7Be elastic scatteringto the lead target and the constant K′ corresponds to
K ′= K ∗ σSi
Ruth (4)
with K being a constant determined by the elastic scat-tering data and σSi
Ruth is the calculated Rutherford crosssection in the laboratory reference system for the elasticscattering of 7Be on 28Si. The results of this analysis arealso reported in Ref. [18].
3 Results and discussion
The elastic scattering data were analyzed within theOptical Model framework following the same method asthe one adopted previously for 6,7Li + 28Si [4,5], and theelastic scattering calculations were performed with thecode ECIS [19]. The Optical Model calculations were per-formed taking into account a BDM3Y1 interaction [20] forboth the real and imaginary part of the Optical Potentialbut with two different normalization factors, NR and NI
respectively, which were fitted to the angular distributiondata. The deduced best fit angular distributions are com-pared with the data in Figures 2 and 3, while the energyevolution of the best fit Optical Potential parameters ispresented in Figure 4. The energy evolution of the Opti-cal Potential parameters is also compared with previousresults of 7Li on 28Si [5]. Although the uncertainties in thedetermination of the potential parameters for the 7Be +28Si system are large, the trend of the energy evolutionseems to be the same for both projectiles pointing outto a similarity between the two mirror nuclei. In partic-ular, the trend seems to be compatible with a standard
a) Total3He transferPACE2n-stripping (x5)n-pickupBreakup (x5)
Data
Cou
nts/
MeV
Energy (MeV)
b)Total3He transferPACE2n-stripping (x5)n-pickupBreakup (x5)
Data0
50
100
150
0 5 10 15 20 25
0
10
20
30
40
0 5 10 15 20 25
Fig. 1. Decomposition of the simulated alpha energy spectraat the energy of 22.0 MeV for a telescope set at (a) forwardangles and (b) middle angles due to compound nucleus process,designated with the dotted black line, and direct processes asfollows: The dashed red line indicates the spectrum due to 3Hestripping, the dashed blue line due to breakup, the dotted-dashed magenta line due to neutron stripping and the solidyellow line due to neutron pickup. The multiplication factorsare arbitrary values for the purpose of presenting the differentprocesses only.
threshold anomaly at least in what concerns the imagi-nary part, with a decreasing magnitude as we approachthe barrier from higher to lower energies. The agreementof the present data with a dispersion relation cannot beconfirmed, as in the critical position of the real potential,where a peak should appear, we possess only one datum.
The Optical Model analysis for the system 7Be + 28Si,leads also to total reaction cross sections which are in-cluded in Table 1. In the same Table are also includedtotal reaction cross sections obtained from the analysis ofthe α-particle production for the same system, total re-action cross sections obtained with the phenomenologicalprediction as deduced for light targets in [21] and also to-tal reaction cross sections calculated in a CDCC approach.All results are found in very good agreement, supportingour present Optical Model analysis, since total reactioncross sections are used as a traditional tool to restrict theimaginary part of the Optical Potential.
Moving to the reaction mechanism data, the α-particleyields for each strip, therefore for each angle, were trans-formed to cross sections using Equation 3. The obtainedangular distributions are presented in Figure 5. In orderto disentangle the compound from direct part, we followa standard technique as applied previously for 6,7Li +
user
Text Box
O. Sgouros et al.: Study of 7Be + 28Si at near barrier energies: elastic scattering and alpha production 138

4
CDCCOMP
OMPCDCC
σ/σ R
uth
θc.m.(deg)
10-2
10-1
1
0 20 40 60 80
10-1
1
0 20 40 60 80
Fig. 2. Top panel: Present angular distribution data for theelastic scattering of 7Be + 28Si at the energy of 22.0 MeV,designated with the red stars, are compared with our best fitOptical Model calculation denoted with the dashed red line aswell as with a CDCC calculation denoted with the solid blueline. Bottom panel: Same but for the energy of 19.8 MeV.
OMPCDCC
OMPCDCC
σ/σ R
uth
θc.m.(deg)
10-1
1
0 20 40 60 80
10-1
1
0 20 40 60 80
Fig. 3. Top panel: Present angular distribution data for theelastic scattering of 7Be + 28Si at the energy of 17.2 MeV,designated with the red stars, are compared with our best fitOptical Model calculation denoted with the dashed red line aswell as with a CDCC calculation denoted with the solid blueline. Bottom panel: Same but for the energy of 13.2 MeV.
NR
7Be7Li
NI
E/VC.b.
7Be7Li
0.5
1
0.5 1 1.5 2 2.5 3
0
0.5
1
1.5
0.5 1 1.5 2 2.5 3
Fig. 4. The energy evolution of the Optical Potential param-eters, NR and NI , obtained in a BDM3Y1 framework for the7Be + 28Si - present data, designated with the red stars, arecompared with Optical Potential parameters for the system7Li + 28Si - previous data [5], designated with the green cir-cles. The dotted-dashed blue line corresponds to a dispersionrelation analysis performed previously for 7Li [5], while thedashed black line corresponds to a dispersion relation analysisperformed for the 7Be. The solid green lines correspond to theresults of a barrier distribution analysis for 7Li [6], where anenergy independent real potential is suggested, without obey-ing dispersion relations.
Table 1. Total reaction cross sections for 7Be + 28Si obtainedin the present work via an Optical Model analysis, σopt, arecompared with values deduced in the α-production analysis[18], σα, as well as with a theoretical value extracted from ourCDCC calculations, σcdcc and a phenomenological predictionfor light targets, σp, outlined in Ref. [21]. The first columnincludes projectile energies incident in front of the target, Elab.
Elab (MeV) σopt (mb) σα (mb) σcdcc (mb) σpred (mb)
22.0 1124±148 1206±195 1130 111819.8 1072±163 1103±242 1020 99017.2 738±190 - 831 77913.2 355±95 250±63 401 347
28Si [22,23]. For that we have calculated in a statisticalmodel approach, via code PACE2, the angular distribu-tion of evaporated α particles, which was renormalized tothe backward detectors data. Both angular distributions,the total (experimental) and of compound nucleus origin(theoretical renormalized to experimental data), were in-tegrated. The so obtained compound nucleus α-particleproduction cross sections were transformed to fusion crosssections taking into account the α-particle multiplicitiesdeduced from our statistical model approach. The fusioncross sections, for the system under study, were consideredin a systematic involving other, stable, weakly bound andradioactive projectiles on the same or similar mass targets(27Al, 28Si). All the data sets were reduced to the so calledfusion functions according to the prescription presented inRef. [24]. Looking at Figure 6, we may see that all datasets show good consistency between each other as well as
user
Text Box
O. Sgouros et al.: Study of 7Be + 28Si at near barrier energies: elastic scattering and alpha production 139
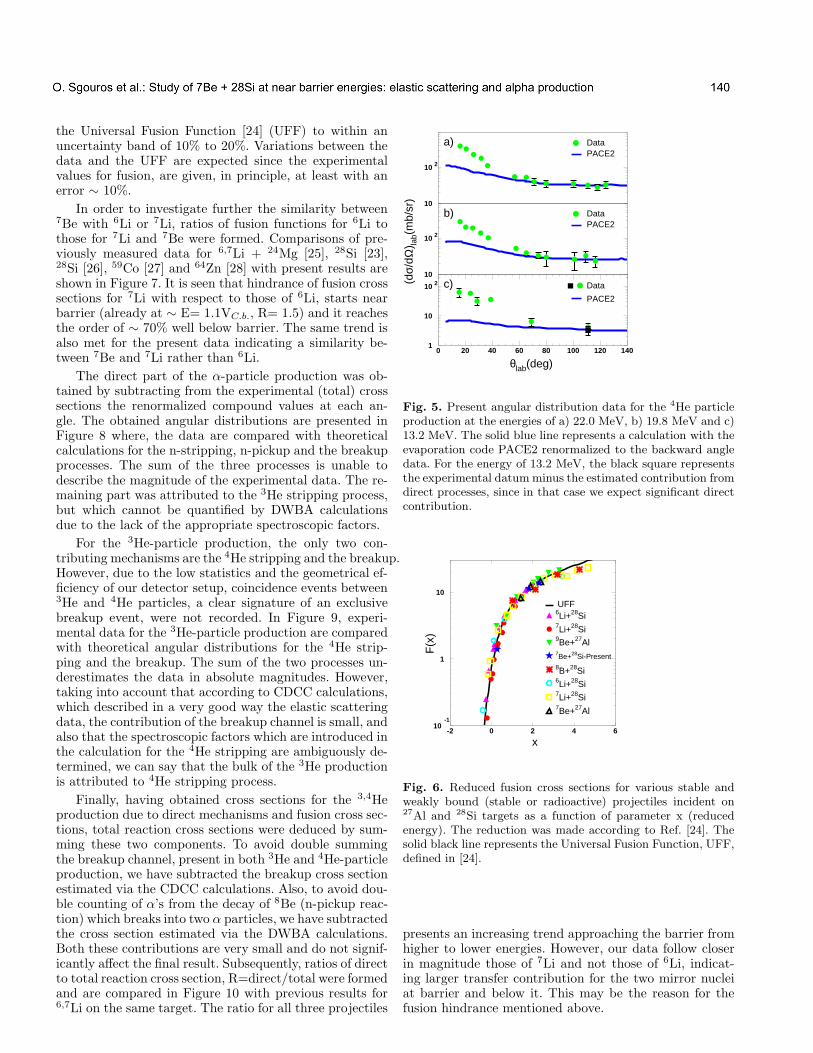
5
the Universal Fusion Function [24] (UFF) to within anuncertainty band of 10% to 20%. Variations between thedata and the UFF are expected since the experimentalvalues for fusion, are given, in principle, at least with anerror ∼ 10%.
In order to investigate further the similarity between7Be with 6Li or 7Li, ratios of fusion functions for 6Li tothose for 7Li and 7Be were formed. Comparisons of pre-viously measured data for 6,7Li + 24Mg [25], 28Si [23],28Si [26], 59Co [27] and 64Zn [28] with present results areshown in Figure 7. It is seen that hindrance of fusion crosssections for 7Li with respect to those of 6Li, starts nearbarrier (already at ∼ E= 1.1VC.b., R= 1.5) and it reachesthe order of ∼ 70% well below barrier. The same trend isalso met for the present data indicating a similarity be-tween 7Be and 7Li rather than 6Li.
The direct part of the α-particle production was ob-tained by subtracting from the experimental (total) crosssections the renormalized compound values at each an-gle. The obtained angular distributions are presented inFigure 8 where, the data are compared with theoreticalcalculations for the n-stripping, n-pickup and the breakupprocesses. The sum of the three processes is unable todescribe the magnitude of the experimental data. The re-maining part was attributed to the 3He stripping process,but which cannot be quantified by DWBA calculationsdue to the lack of the appropriate spectroscopic factors.
For the 3He-particle production, the only two con-tributing mechanisms are the 4He stripping and the breakup.However, due to the low statistics and the geometrical ef-ficiency of our detector setup, coincidence events between3He and 4He particles, a clear signature of an exclusivebreakup event, were not recorded. In Figure 9, experi-mental data for the 3He-particle production are comparedwith theoretical angular distributions for the 4He strip-ping and the breakup. The sum of the two processes un-derestimates the data in absolute magnitudes. However,taking into account that according to CDCC calculations,which described in a very good way the elastic scatteringdata, the contribution of the breakup channel is small, andalso that the spectroscopic factors which are introduced inthe calculation for the 4He stripping are ambiguously de-termined, we can say that the bulk of the 3He productionis attributed to 4He stripping process.
Finally, having obtained cross sections for the 3,4Heproduction due to direct mechanisms and fusion cross sec-tions, total reaction cross sections were deduced by sum-ming these two components. To avoid double summingthe breakup channel, present in both 3He and 4He-particleproduction, we have subtracted the breakup cross sectionestimated via the CDCC calculations. Also, to avoid dou-ble counting of α’s from the decay of 8Be (n-pickup reac-tion) which breaks into two α particles, we have subtractedthe cross section estimated via the DWBA calculations.Both these contributions are very small and do not signif-icantly affect the final result. Subsequently, ratios of directto total reaction cross section, R=direct/total were formedand are compared in Figure 10 with previous results for6,7Li on the same target. The ratio for all three projectiles
a)PACE2Data
(dσ/
dΩ) la
b(m
b/sr
)
b)PACE2Data
θlab(deg)
c)PACE2
Data
10
10 2
0 20 40 60 80 100 120 140
10
10 2
0 20 40 60 80 100 120 140
1
10
10 2
0 20 40 60 80 100 120 140
Fig. 5. Present angular distribution data for the 4He particleproduction at the energies of a) 22.0 MeV, b) 19.8 MeV and c)13.2 MeV. The solid blue line represents a calculation with theevaporation code PACE2 renormalized to the backward angledata. For the energy of 13.2 MeV, the black square representsthe experimental datumminus the estimated contribution fromdirect processes, since in that case we expect significant directcontribution.
F(x
)
x
UFF6Li+28Si7Li+28Si9Be+27Al
6Li+28Si7Li+28Si7Be+27Al
8B+28Si
7Be+28Si-Present
10-1
1
10
-2 0 2 4 6
Fig. 6. Reduced fusion cross sections for various stable andweakly bound (stable or radioactive) projectiles incident on27Al and 28Si targets as a function of parameter x (reducedenergy). The reduction was made according to Ref. [24]. Thesolid black line represents the Universal Fusion Function, UFF,defined in [24].
presents an increasing trend approaching the barrier fromhigher to lower energies. However, our data follow closerin magnitude those of 7Li and not those of 6Li, indicat-ing larger transfer contribution for the two mirror nucleiat barrier and below it. This may be the reason for thefusion hindrance mentioned above.
user
Text Box
O. Sgouros et al.: Study of 7Be + 28Si at near barrier energies: elastic scattering and alpha production 140
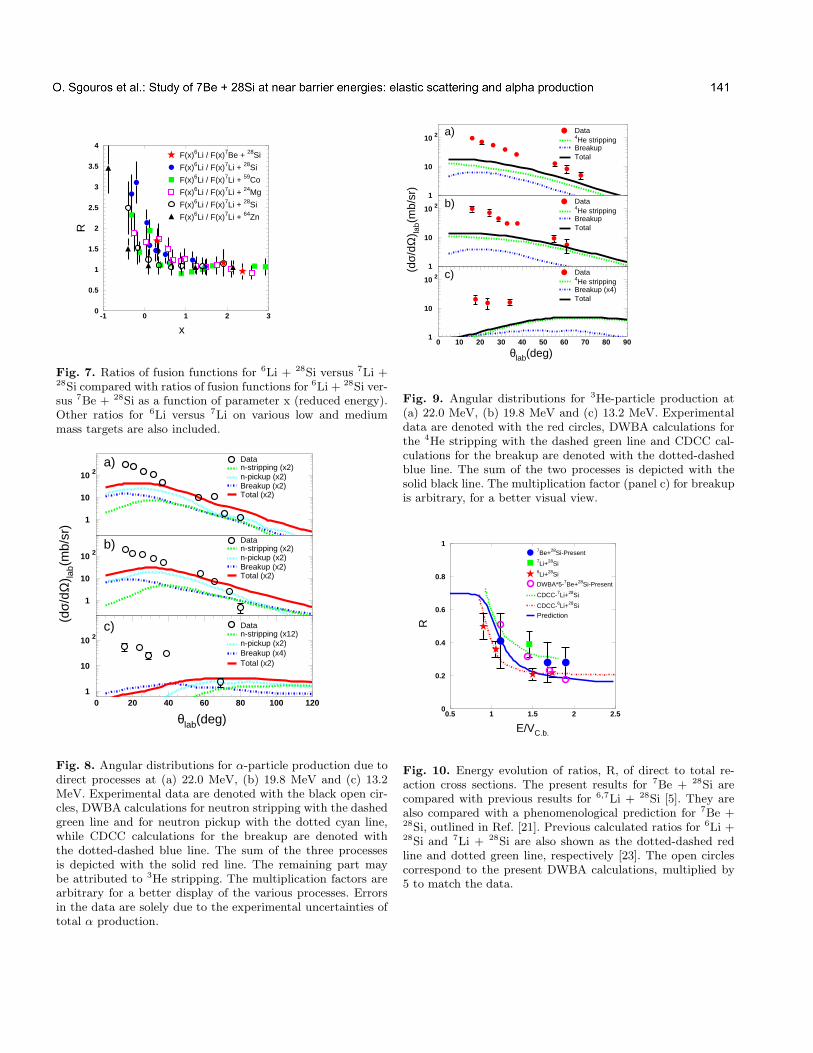
6R
x
F(x)6Li / F(x)7Li + 28Si
F(x)6Li / F(x)7Li + 59Co
F(x)6Li / F(x)7Li + 24Mg
F(x)6Li / F(x)7Li + 28Si
F(x)6Li / F(x)7Li + 64Zn
F(x)6Li / F(x)7Be + 28Si
0
0.5
1
1.5
2
2.5
3
3.5
4
-1 0 1 2 3
Fig. 7. Ratios of fusion functions for 6Li + 28Si versus 7Li +28Si compared with ratios of fusion functions for 6Li + 28Si ver-sus 7Be + 28Si as a function of parameter x (reduced energy).Other ratios for 6Li versus 7Li on various low and mediummass targets are also included.
a)
Breakup (x2)Total (x2)
n-stripping (x2)n-pickup (x2)
Data
(dσ/
dΩ) la
b(m
b/sr
)
b)
Breakup (x2)Total (x2)
n-stripping (x2)n-pickup (x2)
Data
θlab(deg)
c)
Breakup (x4)Total (x2)
n-stripping (x12)n-pickup (x2)
Data
1
10
10 2
0 20 40 60 80 100 120
1
10
10 2
0 20 40 60 80 100 120
1
10
10 2
0 20 40 60 80 100 120
Fig. 8. Angular distributions for α-particle production due todirect processes at (a) 22.0 MeV, (b) 19.8 MeV and (c) 13.2MeV. Experimental data are denoted with the black open cir-cles, DWBA calculations for neutron stripping with the dashedgreen line and for neutron pickup with the dotted cyan line,while CDCC calculations for the breakup are denoted withthe dotted-dashed blue line. The sum of the three processesis depicted with the solid red line. The remaining part maybe attributed to 3He stripping. The multiplication factors arearbitrary for a better display of the various processes. Errorsin the data are solely due to the experimental uncertainties oftotal α production.
Dataa)Breakup
4He stripping
Total
(dσ/
dΩ) la
b(m
b/sr
)
Datab)Breakup
4He stripping
Total
θlab(deg)
Datac)Breakup (x4)
4He stripping
Total
1
10
10 2
0 10 20 30 40 50 60 70 80 90
1
10
10 2
0 10 20 30 40 50 60 70 80 90
1
10
10 2
0 10 20 30 40 50 60 70 80 90
Fig. 9. Angular distributions for 3He-particle production at(a) 22.0 MeV, (b) 19.8 MeV and (c) 13.2 MeV. Experimentaldata are denoted with the red circles, DWBA calculations forthe 4He stripping with the dashed green line and CDCC cal-culations for the breakup are denoted with the dotted-dashedblue line. The sum of the two processes is depicted with thesolid black line. The multiplication factor (panel c) for breakupis arbitrary, for a better visual view.
R
E/VC.b.
Prediction
CDCC-7Li+28Si
CDCC-6Li+28Si
7Be+28Si-Present7Li+28Si6Li+28Si
DWBA*5-7Be+28Si-Present
0
0.2
0.4
0.6
0.8
1
0.5 1 1.5 2 2.5
Fig. 10. Energy evolution of ratios, R, of direct to total re-action cross sections. The present results for 7Be + 28Si arecompared with previous results for 6,7Li + 28Si [5]. They arealso compared with a phenomenological prediction for 7Be +28Si, outlined in Ref. [21]. Previous calculated ratios for 6Li +28Si and 7Li + 28Si are also shown as the dotted-dashed redline and dotted green line, respectively [23]. The open circlescorrespond to the present DWBA calculations, multiplied by5 to match the data.
user
Text Box
O. Sgouros et al.: Study of 7Be + 28Si at near barrier energies: elastic scattering and alpha production 141
7
4 Summary
The energy dependence of the Optical Potential wassought for the system 7Be + 28Si at near barrier ener-gies via elastic scattering measurements. Comparisons be-tween 7Be -present data and 7Li -previous data on thesame target showed that, 7Be resembles its mirror nu-cleus and not the 6Li one. The behavior of imaginary partof the Optical Potential is compatible with the standardthreshold anomaly, while the real part cannot be definitelyinterpreted into dispersion relations framework, due to thelimited data points around Coulomb barrier. It should benoted that the similarity between 7Be and 7Li is also val-idated from the analysis of fusion data, where fusion hin-drance is indicated below barrier for both 7Be and 7Linuclei. This may be related to the large transfer cross sec-tions, observed for the two mirror nuclei, which act atexpense of the fusion ones. In our case, the bulk of thetransfer cross sections is attributed to 3He and 4He strip-ping reactions.
References
1. M. A. Nagarajan, C. C. Mahaux and G. R. Satchler, Phys.Rev. Lett. 54, 1136 (1985).
2. C. Mahaux, H. Ngo, G. R. Satchler, Nucl. Phys. A 449, 354(1986).
3. G. R. Satchler, Phys. Rep. 199, 147 (1991).4. A. Pakou, N. Alamanos, A. Lagoyannis et al., Phys. Lett.B 556, 21 (2003).
5. A. Pakou, N. Alamanos, G. Doukelis et al., Phys. Rev. C69, 054602 (2004).
6. K. Zerva, A. Pakou, N. Patronis et al., Eur. Phys. JournalA 48, 102 (2012).
7. J. M. Figueira, D. Abriola, J. O. Fernandez Niello et al.,Phys. Rev. C 73, 054603 (2006).
8. J. M. Figueira, J. O. Fernandez Niello, D. Abriola et al.,Phys. Rev. C 75, 017602 (2007).
9. V. Z. Maidikov, T. Glodariu, M. La Commara et al., Nucl.Phys. A 746, 389c (2004).
10. D. Pierroutsakou, B. Martin, T. Glodariu et al., Eur. Phys.J. Special Topics 150, 47 (2007).
11. F. Farinon, T. Glodariu, M. Mazzocco et al., Nucl. Instr.and Meth. B 266, 4097 (2008).
12. D. Pierroutsakou, A. Boiano, C. Boiano et al., Nucl. Instr.and Meth. A 834, 46 (2016).
13. O. Sgouros, PhD thesis, University of Ioannina, 4 May 2017(http://hinp.physics.uoi.gr/Theses.htm).
14. O. Sgouros, A. Pakou, D. Pierroutsakou et al., Phys. Rev.C 95, 054609 (2017).
15. A. Gavron, Phys. Rev. C 21, 230 (1980).16. I. J. Thompson, Comput. Phys. Rep. 7, 167 (1988).17. K. K. Olimov, K. Olimov, V. V. Lugovoi et al., Int. Jour.Mod. Phys. E 25, 1650021 (2016).
18. O. Sgouros, A. Pakou, D. Pierroutsakou et al., Phys. Rev.C 94, 044623 (2016).
19. J. Raynal, Phys. Rev. C 23, 2571 (1981).20. D. T. Khoa and W. von Oertzen, Phys. Lett. B 342, 6(1995).
21. A. Pakou, D. Pierroutsakou, M. Mazzocco et al., Eur.Phys. Journal A 51, 55 (2015).
22. A. Pakou, K. Rusek, N. Alamanos et al., Phys. Rev. C 76,054601 (2007).
23. A. Pakou, K. Rusek N. Alamanos et al., Eur. Phys. JournalA 39, 187 (2009).
24. L. F. Canto, P. R. S. Gomes, J. Lubian et al., Nucl. Phys.A 821, 51 (2009).
25. M. Ray, A. Mukherjee, M. K. Pradhan et al., Phys. Rev.C 78, 064617 (2008).
26. M. Sinha, H. Majumdar, P. Basu et al., Eur. Phys. JournalA 44, 403 (2010).
27. C. Beck, F. A. Souza, N. Rowley et al., Phys. Rev. C 67,054602 (2003).
28. A. Di Pietro, P. Figuera, E. Strano et al., Phys. Rev. C87, 064614 (2013).
Powered by TCPDF (www.tcpdf.org)Powered by TCPDF (www.tcpdf.org)Powered by TCPDF (www.tcpdf.org)Powered by TCPDF (www.tcpdf.org)Powered by TCPDF (www.tcpdf.org)Powered by TCPDF (www.tcpdf.org)
user
Text Box
O. Sgouros et al.: Study of 7Be + 28Si at near barrier energies: elastic scattering and alpha production 142
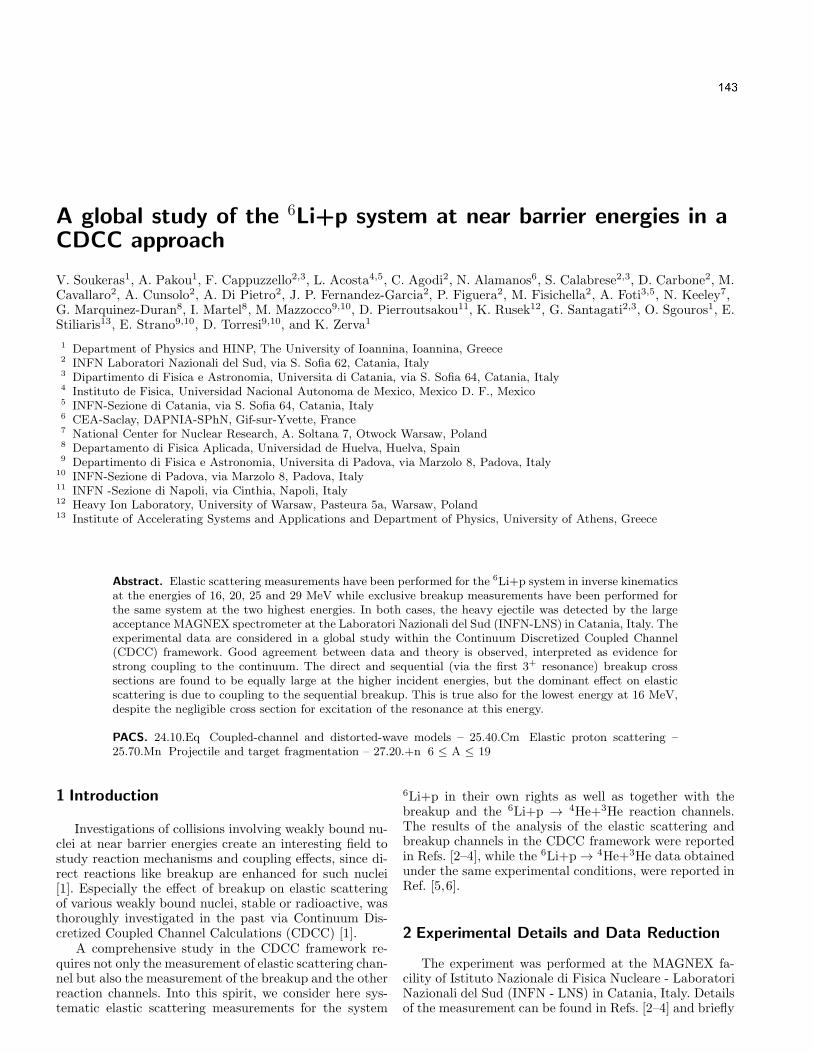
A global study of the 6Li+p system at near barrier energies in aCDCC approach
V. Soukeras1, A. Pakou1, F. Cappuzzello2,3, L. Acosta4,5, C. Agodi2, N. Alamanos6, S. Calabrese2,3, D. Carbone2, M.Cavallaro2, A. Cunsolo2, A. Di Pietro2, J. P. Fernandez-Garcia2, P. Figuera2, M. Fisichella2, A. Foti3,5, N. Keeley7,G. Marquinez-Duran8, I. Martel8, M. Mazzocco9,10, D. Pierroutsakou11, K. Rusek12, G. Santagati2,3, O. Sgouros1, E.Stiliaris13, E. Strano9,10, D. Torresi9,10, and K. Zerva1
1 Department of Physics and HINP, The University of Ioannina, Ioannina, Greece2 INFN Laboratori Nazionali del Sud, via S. Sofia 62, Catania, Italy3 Dipartimento di Fisica e Astronomia, Universita di Catania, via S. Sofia 64, Catania, Italy4 Instituto de Fisica, Universidad Nacional Autonoma de Mexico, Mexico D. F., Mexico5 INFN-Sezione di Catania, via S. Sofia 64, Catania, Italy6 CEA-Saclay, DAPNIA-SPhN, Gif-sur-Yvette, France7 National Center for Nuclear Research, A. Soltana 7, Otwock Warsaw, Poland8 Departamento di Fisica Aplicada, Universidad de Huelva, Huelva, Spain9 Departimento di Fisica e Astronomia, Universita di Padova, via Marzolo 8, Padova, Italy
10 INFN-Sezione di Padova, via Marzolo 8, Padova, Italy11 INFN -Sezione di Napoli, via Cinthia, Napoli, Italy12 Heavy Ion Laboratory, University of Warsaw, Pasteura 5a, Warsaw, Poland13 Institute of Accelerating Systems and Applications and Department of Physics, University of Athens, Greece
Abstract. Elastic scattering measurements have been performed for the 6Li+p system in inverse kinematicsat the energies of 16, 20, 25 and 29 MeV while exclusive breakup measurements have been performed forthe same system at the two highest energies. In both cases, the heavy ejectile was detected by the largeacceptance MAGNEX spectrometer at the Laboratori Nazionali del Sud (INFN-LNS) in Catania, Italy. Theexperimental data are considered in a global study within the Continuum Discretized Coupled Channel(CDCC) framework. Good agreement between data and theory is observed, interpreted as evidence forstrong coupling to the continuum. The direct and sequential (via the first 3+ resonance) breakup crosssections are found to be equally large at the higher incident energies, but the dominant effect on elasticscattering is due to coupling to the sequential breakup. This is true also for the lowest energy at 16 MeV,despite the negligible cross section for excitation of the resonance at this energy.
PACS. 24.10.Eq Coupled-channel and distorted-wave models – 25.40.Cm Elastic proton scattering –25.70.Mn Projectile and target fragmentation – 27.20.+n 6 ≤ A ≤ 19
1 Introduction
Investigations of collisions involving weakly bound nu-clei at near barrier energies create an interesting field tostudy reaction mechanisms and coupling effects, since di-rect reactions like breakup are enhanced for such nuclei[1]. Especially the effect of breakup on elastic scatteringof various weakly bound nuclei, stable or radioactive, wasthoroughly investigated in the past via Continuum Dis-cretized Coupled Channel Calculations (CDCC) [1].
A comprehensive study in the CDCC framework re-quires not only the measurement of elastic scattering chan-nel but also the measurement of the breakup and the otherreaction channels. Into this spirit, we consider here sys-tematic elastic scattering measurements for the system
6Li+p in their own rights as well as together with thebreakup and the 6Li+p → 4He+3He reaction channels.The results of the analysis of the elastic scattering andbreakup channels in the CDCC framework were reportedin Refs. [2–4], while the 6Li+p → 4He+3He data obtainedunder the same experimental conditions, were reported inRef. [5,6].
2 Experimental Details and Data Reduction
The experiment was performed at the MAGNEX fa-cility of Istituto Nazionale di Fisica Nucleare - LaboratoriNazionali del Sud (INFN - LNS) in Catania, Italy. Detailsof the measurement can be found in Refs. [2–4] and briefly
user
Text Box
143

2
we will give some points here. Beams of 6Li3+ were accel-erated by the TANDEM accelerator for elastic scatteringmeasurement at energies of 16, 20, 25 and 29 MeV andimpinged on a 240 µm/cm2 CH2 target. The elasticallyscattered lithium ions were momentum analyzed by theMAGNEX spectrometer [7] whose optical axis was set atθopt=4o, subtending an angular range between 2o to 10o
and were detected by its focal plane detector (FPD) [8,9].The exclusive breakup measurements were performed
at the two highest energies, namely 25 and 29 MeV, re-quiring a coincidence between alpha fragments detectedin MAGNEX and deuterons recorded in a silicon detectorset at 5o. The detector was masked with tantalum foils ofappropriate thicknesses such as to stop the elastical scat-tered lithium ions but to allow deuterons to go through.Exclusive yields were determined for pairs of angles ev-ery 0.5 for alpha particles observed in MAGNEX overthe angular range 0 to 10, combined with deuterons ob-served in the fixed angle detector at 5. A representativetwo-dimensional spectrum for the 25 MeV run, displayingthe energy of alpha particles recorded in MAGNEX ver-sus the energy of deuterons or recoiling protons detectedin the 5 detector, is shown in Fig. 1. A representativeone-dimensional coincidence spectrum from the 5 detec-tor is shown in Fig. 2 for the same energy. It is evidentthat the recoiling protons are well discriminated from thedeuterons while, the background due to carbon was lessthan 15 % and hardly affected the main breakup mea-surement. It should be also pointed out that, due to thespecific experimental conditions, events with energies cor-responding to the second kinematical solution were notobserved and the angular range of the measurement waslimited to forward angles.
The exclusive yields were transferred to laboratory dou-ble differential cross sections (d2σ/dΩα dΩd) using a de-tection efficiency estimated through a Monte Carlo simula-tion code based on the CDCC binning of the continuum,details of which are presented in Refs. [3,4,10–12]. Theresults of our simulation for the energy distributions arepresented in Figs. 1 and 2. The very good agreement be-tween the experimental data and the simulation based onthe CDCC binning of the continuum confirms the realistic“philosophy” behind this theoretical approach. It shouldbe noted that another process which could contribute toα-d and α-p coincidences is the neutron-stripping reac-tion: 6Li + p → 5Li + d → α + p + d, with a Q valueof −3.44 MeV, which, however, according to preliminarycalculations is expected to have very low probability. Theresult of a simulation of this process is shown on Fig. 2with the dashed blue line and it does not affect greatlyour breakup data.
3 Theoretical Details: CDCC Calculations
Continuum Discretized Coupled Channel (CDCC) cal-culations were performed in order to explain the presentexperimental data in a global framework. For these cal-culations we follow the same technique as in [13], where
Ene
rgy
- α
(MeV
)
α - p →
α - d→
Carbon
→→
Energy - d(p) (MeV)
8
10
12
14
4 6 8 10 12 14
8
10
12
14
4 6 8 10 12 14
Fig. 1. Top Figure: Representative two dimensional plot ofthe measured energy of alpha particles (Energy - α) versusmeasured energy of deuterons or protons (Energy - d(p)) atthe beam energy of 25 MeV (4.17 MeV/u). The observed locifor α - p coincidences, α - d coincidences due to breakup of 6Lion hydrogen and α - d coincidences due to breakup on carbonare indicated in this Figure. Bottom Figure: Superimposed onthe experimental top spectrum, designed in black, simulatedevents of the first kinematical solution for the resonant anddirect breakup can be observed, designated with red and greendots respectively.
CDCC calculations were presented for the same system at155 MeV (25.8 MeV/u).
A cluster α + d model of 6Li was adopted, with allthe parameters of the model including discretization andtruncation described in detail in Refs. [2,3,14]. The rel-ative orbital angular momentum between the α particleand the deuteron was limited to the values L= 0, 1, 2 [14–16]. The first 3+ resonance was taken into account andwas treated as a momentum bin, with a width of 100 keV.Other resonant states were not taken into account sincethe available energy was such that it was not possible toexcite them.
The central part of the entrance potentials for α - pand d - p, was derived as previously [13] from empiricalp - α and p - d potentials by means of a single - foldingmethod. The empirical potentials were obtained from p +d and p + α elastic scattering studies at E = 2.52 to 5
user
Text Box
V. Soukeras et al.: A global study of the 6Li+p system at near barrier energies in a CDCC approach 144
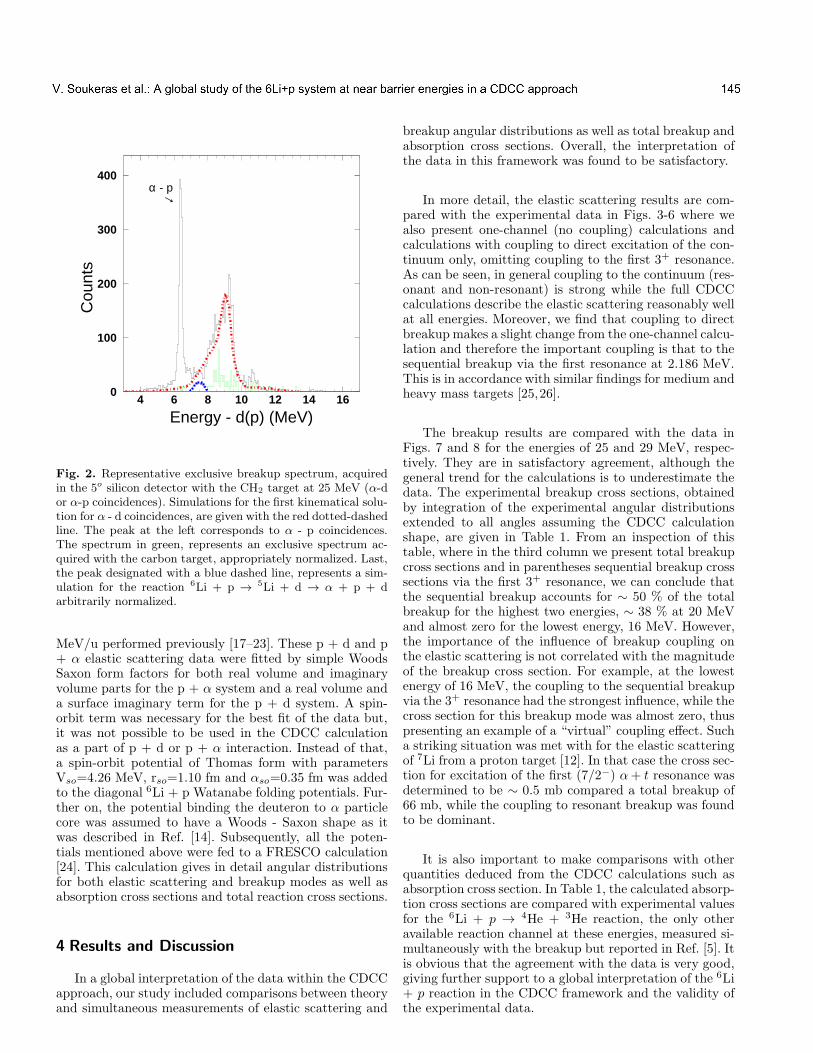
3C
ount
s
Energy - d(p) (MeV)
α - p→
0
100
200
300
400
4 6 8 10 12 14 16
Fig. 2. Representative exclusive breakup spectrum, acquiredin the 5o silicon detector with the CH2 target at 25 MeV (α-dor α-p coincidences). Simulations for the first kinematical solu-tion for α - d coincidences, are given with the red dotted-dashedline. The peak at the left corresponds to α - p coincidences.The spectrum in green, represents an exclusive spectrum ac-quired with the carbon target, appropriately normalized. Last,the peak designated with a blue dashed line, represents a sim-ulation for the reaction 6Li + p →
5Li + d → α + p + darbitrarily normalized.
MeV/u performed previously [17–23]. These p + d and p+ α elastic scattering data were fitted by simple WoodsSaxon form factors for both real volume and imaginaryvolume parts for the p + α system and a real volume anda surface imaginary term for the p + d system. A spin-orbit term was necessary for the best fit of the data but,it was not possible to be used in the CDCC calculationas a part of p + d or p + α interaction. Instead of that,a spin-orbit potential of Thomas form with parametersVso=4.26 MeV, rso=1.10 fm and αso=0.35 fm was addedto the diagonal 6Li + p Watanabe folding potentials. Fur-ther on, the potential binding the deuteron to α particlecore was assumed to have a Woods - Saxon shape as itwas described in Ref. [14]. Subsequently, all the poten-tials mentioned above were fed to a FRESCO calculation[24]. This calculation gives in detail angular distributionsfor both elastic scattering and breakup modes as well asabsorption cross sections and total reaction cross sections.
4 Results and Discussion
In a global interpretation of the data within the CDCCapproach, our study included comparisons between theoryand simultaneous measurements of elastic scattering and
breakup angular distributions as well as total breakup andabsorption cross sections. Overall, the interpretation ofthe data in this framework was found to be satisfactory.
In more detail, the elastic scattering results are com-pared with the experimental data in Figs. 3-6 where wealso present one-channel (no coupling) calculations andcalculations with coupling to direct excitation of the con-tinuum only, omitting coupling to the first 3+ resonance.As can be seen, in general coupling to the continuum (res-onant and non-resonant) is strong while the full CDCCcalculations describe the elastic scattering reasonably wellat all energies. Moreover, we find that coupling to directbreakup makes a slight change from the one-channel calcu-lation and therefore the important coupling is that to thesequential breakup via the first resonance at 2.186 MeV.This is in accordance with similar findings for medium andheavy mass targets [25,26].
The breakup results are compared with the data inFigs. 7 and 8 for the energies of 25 and 29 MeV, respec-tively. They are in satisfactory agreement, although thegeneral trend for the calculations is to underestimate thedata. The experimental breakup cross sections, obtainedby integration of the experimental angular distributionsextended to all angles assuming the CDCC calculationshape, are given in Table 1. From an inspection of thistable, where in the third column we present total breakupcross sections and in parentheses sequential breakup crosssections via the first 3+ resonance, we can conclude thatthe sequential breakup accounts for ∼ 50 % of the totalbreakup for the highest two energies, ∼ 38 % at 20 MeVand almost zero for the lowest energy, 16 MeV. However,the importance of the influence of breakup coupling onthe elastic scattering is not correlated with the magnitudeof the breakup cross section. For example, at the lowestenergy of 16 MeV, the coupling to the sequential breakupvia the 3+ resonance had the strongest influence, while thecross section for this breakup mode was almost zero, thuspresenting an example of a “virtual” coupling effect. Sucha striking situation was met with for the elastic scatteringof 7Li from a proton target [12]. In that case the cross sec-tion for excitation of the first (7/2−) α+ t resonance wasdetermined to be ∼ 0.5 mb compared a total breakup of66 mb, while the coupling to resonant breakup was foundto be dominant.
It is also important to make comparisons with otherquantities deduced from the CDCC calculations such asabsorption cross section. In Table 1, the calculated absorp-tion cross sections are compared with experimental valuesfor the 6Li + p → 4He + 3He reaction, the only otheravailable reaction channel at these energies, measured si-multaneously with the breakup but reported in Ref. [5]. Itis obvious that the agreement with the data is very good,giving further support to a global interpretation of the 6Li+ p reaction in the CDCC framework and the validity ofthe experimental data.
user
Text Box
V. Soukeras et al.: A global study of the 6Li+p system at near barrier energies in a CDCC approach 145

4dσ
/dΩ
c.m
.(mb/
sr)
θc.m.(deg)
p(6Li,6Li)p, E=16 MeV
CDCC1 - channelCDCC - only direct couplingpresent data
1
10
10 2
10 3
10 4
0 20 40 60 80 100 120 140 160 180
Fig. 3. Present elastic scattering data for 6Li+p at 16 MeV(2.67 MeV/u). The data are compared with full CDCC cal-culations (solid black line), one-channel calculations (dotted-dashed blue line), and calculations with coupling only to directbreakup (dashed green line).
dσ/d
Ωc.
m.(m
b/sr
)
θc.m.(deg)
p(6Li,6Li)p, E=20 MeV
CDCC1 - channelCDCC - only direct couplingpresent data
1
10
10 2
10 3
10 4
0 20 40 60 80 100 120 140 160 180
Fig. 4. Same as in Figure 3 but at the energy of 20 MeV (3.33MeV/u).
dσ/d
Ωc.
m.(m
b/sr
)θc.m.(deg)
p(6Li,6Li)p, E=25 MeV
CDCC1 - channelCDCC - only direct couplingpresent data
1
10
10 2
10 3
10 4
0 20 40 60 80 100 120 140 160 180
Fig. 5. Same as in Figure 3 but at the energy of 25 MeV (4.17MeV/u).
dσ/d
Ωc.
m.(m
b/sr
)
θc.m.(deg)
p(6Li,6Li)p, E=29 MeV
CDCC1 - channelCDCC - only direct couplingpresent data
1
10
10 2
10 3
10 4
0 20 40 60 80 100 120 140 160 180
Fig. 6. Same as in Figure 3 but at the energy of 29 MeV (4.83MeV/u).
user
Text Box
V. Soukeras et al.: A global study of the 6Li+p system at near barrier energies in a CDCC approach 146
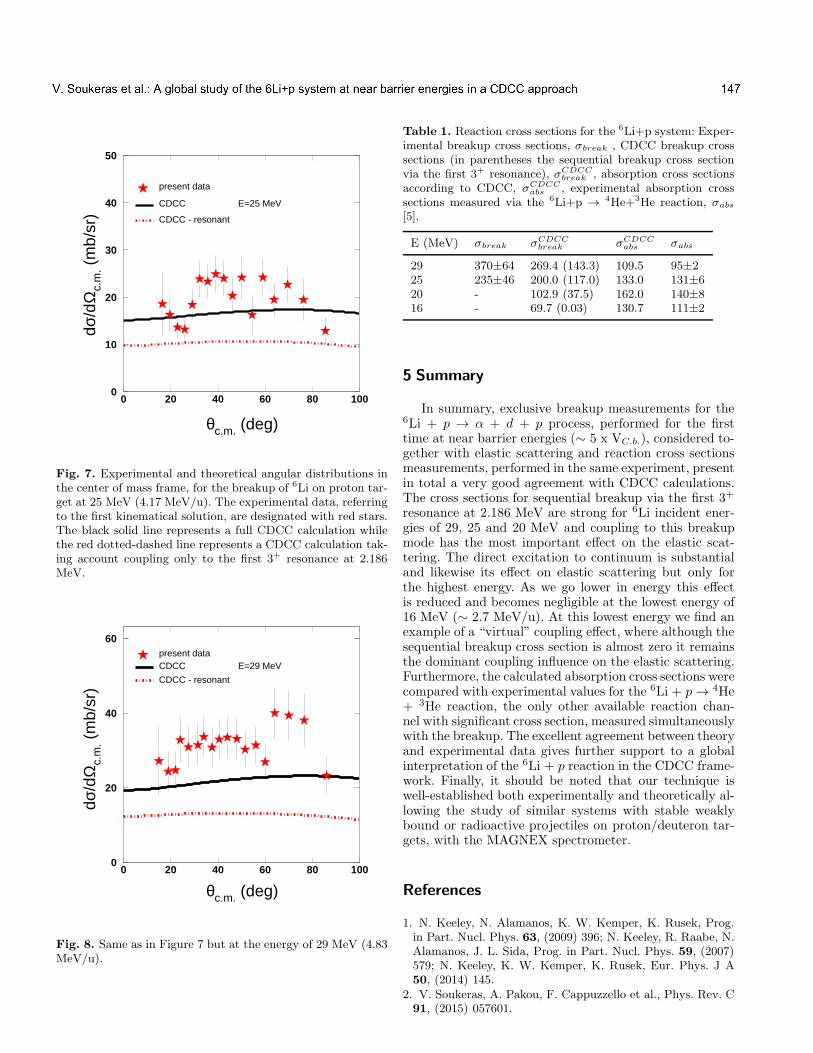
5dσ
/dΩ
c.m
. (m
b/sr
)
θc.m. (deg)
E=25 MeVCDCC
CDCC - resonant
present data
0
10
20
30
40
50
0 20 40 60 80 100
Fig. 7. Experimental and theoretical angular distributions inthe center of mass frame, for the breakup of 6Li on proton tar-get at 25 MeV (4.17 MeV/u). The experimental data, referringto the first kinematical solution, are designated with red stars.The black solid line represents a full CDCC calculation whilethe red dotted-dashed line represents a CDCC calculation tak-ing account coupling only to the first 3+ resonance at 2.186MeV.
dσ/d
Ωc.
m. (
mb/
sr)
θc.m. (deg)
E=29 MeVCDCC
CDCC - resonant
present data
0
20
40
60
0 20 40 60 80 100
Fig. 8. Same as in Figure 7 but at the energy of 29 MeV (4.83MeV/u).
Table 1. Reaction cross sections for the 6Li+p system: Exper-imental breakup cross sections, σbreak , CDCC breakup crosssections (in parentheses the sequential breakup cross sectionvia the first 3+ resonance), σCDCC
break , absorption cross sectionsaccording to CDCC, σCDCC
abs , experimental absorption crosssections measured via the 6Li+p →
4He+3He reaction, σabs
[5].
E (MeV) σbreak σCDCCbreak σCDCC
abs σabs
29 370±64 269.4 (143.3) 109.5 95±225 235±46 200.0 (117.0) 133.0 131±620 - 102.9 (37.5) 162.0 140±816 - 69.7 (0.03) 130.7 111±2
5 Summary
In summary, exclusive breakup measurements for the6Li + p → α + d + p process, performed for the firsttime at near barrier energies (∼ 5 x VC.b.), considered to-gether with elastic scattering and reaction cross sectionsmeasurements, performed in the same experiment, presentin total a very good agreement with CDCC calculations.The cross sections for sequential breakup via the first 3+
resonance at 2.186 MeV are strong for 6Li incident ener-gies of 29, 25 and 20 MeV and coupling to this breakupmode has the most important effect on the elastic scat-tering. The direct excitation to continuum is substantialand likewise its effect on elastic scattering but only forthe highest energy. As we go lower in energy this effectis reduced and becomes negligible at the lowest energy of16 MeV (∼ 2.7 MeV/u). At this lowest energy we find anexample of a “virtual” coupling effect, where although thesequential breakup cross section is almost zero it remainsthe dominant coupling influence on the elastic scattering.Furthermore, the calculated absorption cross sections werecompared with experimental values for the 6Li + p → 4He+ 3He reaction, the only other available reaction chan-nel with significant cross section, measured simultaneouslywith the breakup. The excellent agreement between theoryand experimental data gives further support to a globalinterpretation of the 6Li + p reaction in the CDCC frame-work. Finally, it should be noted that our technique iswell-established both experimentally and theoretically al-lowing the study of similar systems with stable weaklybound or radioactive projectiles on proton/deuteron tar-gets, with the MAGNEX spectrometer.
References
1. N. Keeley, N. Alamanos, K. W. Kemper, K. Rusek, Prog.in Part. Nucl. Phys. 63, (2009) 396; N. Keeley, R. Raabe, N.Alamanos, J. L. Sida, Prog. in Part. Nucl. Phys. 59, (2007)579; N. Keeley, K. W. Kemper, K. Rusek, Eur. Phys. J A50, (2014) 145.
2. V. Soukeras, A. Pakou, F. Cappuzzello et al., Phys. Rev. C91, (2015) 057601.
user
Text Box
V. Soukeras et al.: A global study of the 6Li+p system at near barrier energies in a CDCC approach 147
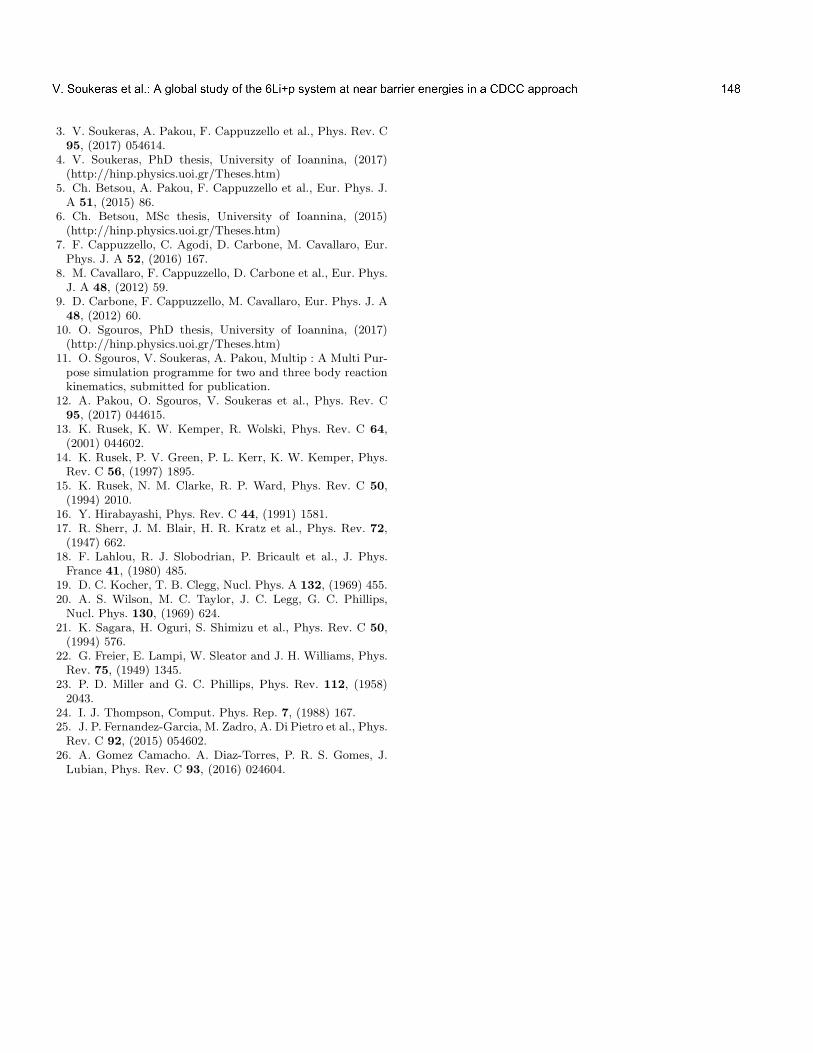
6
3. V. Soukeras, A. Pakou, F. Cappuzzello et al., Phys. Rev. C95, (2017) 054614.
4. V. Soukeras, PhD thesis, University of Ioannina, (2017)(http://hinp.physics.uoi.gr/Theses.htm)
5. Ch. Betsou, A. Pakou, F. Cappuzzello et al., Eur. Phys. J.A 51, (2015) 86.
6. Ch. Betsou, MSc thesis, University of Ioannina, (2015)(http://hinp.physics.uoi.gr/Theses.htm)
7. F. Cappuzzello, C. Agodi, D. Carbone, M. Cavallaro, Eur.Phys. J. A 52, (2016) 167.
8. M. Cavallaro, F. Cappuzzello, D. Carbone et al., Eur. Phys.J. A 48, (2012) 59.
9. D. Carbone, F. Cappuzzello, M. Cavallaro, Eur. Phys. J. A48, (2012) 60.
10. O. Sgouros, PhD thesis, University of Ioannina, (2017)(http://hinp.physics.uoi.gr/Theses.htm)
11. O. Sgouros, V. Soukeras, A. Pakou, Multip : A Multi Pur-pose simulation programme for two and three body reactionkinematics, submitted for publication.
12. A. Pakou, O. Sgouros, V. Soukeras et al., Phys. Rev. C95, (2017) 044615.
13. K. Rusek, K. W. Kemper, R. Wolski, Phys. Rev. C 64,(2001) 044602.
14. K. Rusek, P. V. Green, P. L. Kerr, K. W. Kemper, Phys.Rev. C 56, (1997) 1895.
15. K. Rusek, N. M. Clarke, R. P. Ward, Phys. Rev. C 50,(1994) 2010.
16. Y. Hirabayashi, Phys. Rev. C 44, (1991) 1581.17. R. Sherr, J. M. Blair, H. R. Kratz et al., Phys. Rev. 72,(1947) 662.
18. F. Lahlou, R. J. Slobodrian, P. Bricault et al., J. Phys.France 41, (1980) 485.
19. D. C. Kocher, T. B. Clegg, Nucl. Phys. A 132, (1969) 455.20. A. S. Wilson, M. C. Taylor, J. C. Legg, G. C. Phillips,Nucl. Phys. 130, (1969) 624.
21. K. Sagara, H. Oguri, S. Shimizu et al., Phys. Rev. C 50,(1994) 576.
22. G. Freier, E. Lampi, W. Sleator and J. H. Williams, Phys.Rev. 75, (1949) 1345.
23. P. D. Miller and G. C. Phillips, Phys. Rev. 112, (1958)2043.
24. I. J. Thompson, Comput. Phys. Rep. 7, (1988) 167.25. J. P. Fernandez-Garcia, M. Zadro, A. Di Pietro et al., Phys.Rev. C 92, (2015) 054602.
26. A. Gomez Camacho. A. Diaz-Torres, P. R. S. Gomes, J.Lubian, Phys. Rev. C 93, (2016) 024604.
Powered by TCPDF (www.tcpdf.org)Powered by TCPDF (www.tcpdf.org)Powered by TCPDF (www.tcpdf.org)Powered by TCPDF (www.tcpdf.org)Powered by TCPDF (www.tcpdf.org)
user
Text Box
V. Soukeras et al.: A global study of the 6Li+p system at near barrier energies in a CDCC approach 148

I N H O N O R O F P R O F E S S O R A T H E N A P A K O U

Honor plaque awarded to professor Athena Pakou
by the Hellenic Institute of Nuclear Physics

N. Alamanos’ closing speech Dear Athena, I was delighted to participate in the HINPW4 conference and express during my talk and later on during the lecture of my notes, my deep appreciation for your scientific achievements. I was also happy to come a day before and discuss with Akis and Vassilis and have a first presentation of their thesis. I hope that this early arrival did not disturb your plans. My participation to the conference was also a testimony to our old friendship. Before leaving Ioannina, I would like to send you the “Hokusai-Athena” text that I have read during the lecture of my notes. When he was seventy-four, he wrote:
“At seventy-three years, I partly understood the structure of animals, birds, insects and fishes, and the life of grasses and plants. And so, at eighty-six I shall progress further; at ninety I shall even further penetrate their secret meaning, and by one hundred I shall perhaps truly have reached the level of the marvelous and divine. When I am one hundred and ten, each dot, each line will possess a life of its own”.
I think that this sentence could be adapted to Athena’s scientific carrier. Her work and publications are getting better and better. In the near future, she will further penetrate the secret meaning of the reactions with exotic nuclei and in the far future, she will reach the level of the marvelous and divine. I would like to wish to Athena a marvelous continuation of her scientific career. Athena, I wish you a brilliant continuation of your scientific career. If time allows, I will continue reading with interest your future articles. My warmest regards Nicolas Alamanos

LIST OF PARTICIPANTS INVITED SPEAKERS Alamanos Nicolas IRFU/CEA/Saclay, FRANCE [email protected] Bonasera Aldo Texas A&M University, USA [email protected] Cappuzzello Francesco Istituto Nazionale di Fisica Nucleare - Laboratori Nazionali del Sud (INFN-LNS), Catania, ITALY [email protected] Keeley Nicholas National Center for Nuclear Research (NCNR), POLAND [email protected]
Pierroutsakou Dimitra Istituto Nazionale di Fisica Nucleare (INFN) - Sezione di Napoli, ITALY [email protected] Ring Peter Technical University of Munich (TUM), GERMANY [email protected] Rusek Krzysztof Heavy Ion Laboratory, University of Warsaw, POLAND [email protected] Veselsky Martin Institute of Physics, Slovak Academy of Sciences (SAS), SLOVAKIA [email protected]
PARTICIPANTS Alexandropoulou Matina University of Ioannina (UOI), GREECE [email protected] Aslanoglou Xenofon University of Ioannina (UOI), GREECE [email protected] Asimakopoulou Aggeliki National and Kapodistrian University of Athens (NKUA), GREECE [email protected] Assimakis Ioannis National Centre for Scientific Research (NCSR) "Demokritos", GREECE [email protected] Betsou Chryssoula Aristotle University of Thessaloniki (AUTH), GREECE [email protected] Bonatsos Dennis National Centre for Scientific Research (NCSR) "Demokritos", GREECE [email protected] Eleme Zinovia University of Ioannina (UOI), GREECE [email protected] Gaitanos Theodoros Aristotle University of Thessaloniki (AUTH), GREECE [email protected]
Georvassili Stefania University of Ioannina (UOI), GREECE [email protected] Georgali Efstathia University of Ioannina (UOI), GREECE [email protected] Hatzikos Vassileios National and Kapodistrian University of Athens (NKUA), GREECE [email protected] Ioannides Konstantinos University of Ioannina (UOI), GREECE [email protected] Karakatsanis Konstantinos Aristotle University of Thessaloniki (AUTH), GREECE [email protected] Koutsantonis Loizos The Cyprus Institute (CyI), CYPRUS [email protected] Lalazissis Georgios Aristotle University of Thessaloniki (AUTH), GREECE [email protected] Lykiardopoulou Marilena National and Kapodistrian University of Athens (NKUA), GREECE
Margaritis Chryssovalantis Aristotle University of Thessaloniki (AUTH), GREECE [email protected] Markou Lefteris The Cyprus Institute (CyI), CYPRUS [email protected] Martinou Andriana National Centre for Scientific Research (NCSR) "Demokritos", GREECE [email protected] Mikeli Maria National and Kapodistrian University of Athens (NKUA), GREECE [email protected] Misaelides Panagiotis Aristotle University of Thessaloniki (AUTH), GREECE [email protected] Moustakidis Charalampos Aristotle University of Thessaloniki (AUTH), GREECE [email protected] Nikolis Nikolaos University of Ioannina (UOI), GREECE [email protected] Pakou Athena University of Ioannina (UOI), GREECE [email protected] Papachristodoulou Christina University of Ioannina (UOI), GREECE [email protected] Papadimitriou Sofia National and Kapodistrian University of Athens (NKUA), GREECE [email protected] Papageorgiou Athanassios National and Kapodistrian University of Athens (NKUA), GREECE [email protected] Patronis Nikolaos University of Ioannina (UOI), GREECE [email protected] Rapsomanikis Aristotelis-Nikolaos National and Kapodistrian University of Athens (NKUA), GREECE [email protected]
Sarantopoulou Smaragda National Centre for Scientific Research (NCSR) "Demokritos", GREECE [email protected] Sgouros Onoufrios University of Ioannina (UOI), GREECE [email protected] Soukeras Vasileios University of Ioannina (UOI), GREECE [email protected] Souliotis George National and Kapodistrian University of Athens (NKUA), GREECE [email protected] Stamoulis Konstantinos University of Ioannina (UOI), GREECE [email protected] Stiliaris Efstathios National and Kapodistrian University of Athens (NKUA), GREECE [email protected] Zerva Konstantina University of Ioannina (UOI), GREECE [email protected] Zioga Maria National and Kapodistrian University of Athens (NKUA), GREECE [email protected]
AUTHOR INDEX A Aciksoz E, 23 Acosta L, 23, 136, 143 Agodi C, 23, 143 Alamanos N, 8, 143 Aslanoglou X, 136 Assimakis I, 46, 50, 57, 63 Assimakopoulou A, 81, 123 Auerbach N, 23 B Bellone J, 23 Betsou Ch, 120, 136 Bianco S, 23 Bijker R, 23 Blaum K, 46, 50, 57, 63 Boiano A, 18, 136 Boiano C, 18, 136 Bonanno D, 23 Bonasera A, 68, 76, 123, 128, 132 Bonatsos D, 46, 50, 57, 63 Bongiovanni D, 23 Borelli T, 23 Boztosun I, 23 Branchina V, 23 Bussa MP, 23 Busso L, 23 C Cakirli RB, 46, 50, 57, 63 Calabrese S, 23, 143 Calabretta L, 23 Calanna A, 23 Calvo D, 23 Cappuzzello F, 23, 143 Carbone D, 23, 136, 143 Casten RF, 46, 50, 57, 63 Cavallaro M, 23, 143 Chávez Lomelí ER, 23 Colonna M, 23 Cunsolo A, 143 D D’ Agostino G, 23 de Faria PN, 23 Deshmukh N, 23 Di Pietro A, 143
E Eleftheriou A, 101, 106 F Fernandez-Garcia JP, 143 Ferraresi C, 23 Ferreira JL, 23 Figuera P, 143 Finocchiaro P, 23 Fisichella M, 23, 143 Foti A, 23, 143 G Gaitanos Th, 26, 33 Gallo G, 23 Garcia U, 23 Giraudo G, 23 Grebosz J, 136 Greco V, 23 H Hacisalihoglu A, 23 Hansman J, 120 I Iazzi F, 23 Introzzi R, 23 Ioannides K, 115 Ioannidou A, 120 K Karakatsanis K, 39 Keeley N, 12, 136, 143 Klimo J, 69 Kotila J, 23 Koutsantonis L, 97 Krmar M, 120 Kwon YK, 76, 132 L La Commara M, 18, 136 Lalazissis G, 26, 39 Lanzalone G, 23 La Rana G, 18 Lavagno A, 23 La Via F, 23 Lay JA, 23 Lenske H, 23

Linares R, 23 Litrico G, 23 Litvinova E, 39 Longhitano F, 23 Lo Presti D, 23 Lubian J, 23 M Ma YG, 69 Manea C, 136 Margaritis Ch, 26 Markou, Lefteris, 91 Marquínez-Durán G, 136, 143 Martel I, 136, 143 Martinou A, 46, 50, 57, 63 Mazzocco M, 18, 136, 143 Medina N, 23 Mendes DR, 23 Mikeli, Maria, 101, 106 Minkov N, 46, 50, 57, 63 Misaelides P, 114 Moustakidis Ch, 26 Muoio A, 23 N Nicolis N, 81, 123, 136 O Oliveira JRB, 23 P Pafilis Ch, 101, 106 Pakou A, 23, 136, 143 Pandola L, 23 Papachristodoulou C, 115 Papadimitriou S, 128 Papageorgiou A, 76, 132 Papanicolas CN, 85, 91, 97 Parascandolo C, 18, 136 Petrascu H, 23 Pierroutsakou D, 18, 136, 143 Pinna F, 23 Pirri F, 23 Ploskon M, 69 R Rapsomanikis A-N, 101, 106 Reito S, 23 Rifuggiato D, 23
Ring, Peter, 1, 39 Rodrigues MRD, 23 Rusek K, 9, 136, 143 Russo AD, 23 Russo G, 23 S Sánchez-Benítez AM, 136 Santagati G, 23, 143 Santopinto E, 23 Sarantopoulou S, 57, 63 Sgouros O, 23, 136, 143 Signorini C, 18, 136 Solakci SO, 23 Soramel F, 18, 136 Soukeras V, 23, 136, 143 Souliotis G, 23, 69, 76, 81, 123, 128, 132 Stamoulis K, 115 Stefanini C, 136 Stiliaris E, 85, 91, 97, 101, 106, 136, 143 Strano E, 18, 136, 143 Strojek I, 136 T Torresi D, 23, 136, 143 Tsakiri E, 120 Tshoo K, 76, 132 Tsodoulos I, 115 Tudisco S, 23 Tzifas IT, 114 V Veselsky M, 69, 76, 123, 128, 132 Violaris A, 33 Vsevolodovna RIM, 23 W Wheadon RJ, 23 Z Zagatto V, 23 Zerva K, 143 Zioga M, 101, 106