Regional-scale benthic monitoring for ecosystem-based fisheries management (EBFM) using an...
11
Regional-scale benthic monitoring for ecosystem-based fisheries management (EBFM) using an autonomous underwater vehicle (AUV) Dan A. Smale 1 *, Gary A. Kendrick 1 , Euan S. Harvey 1 , Timothy J. Langlois 1 , Renae K. Hovey 2 , Kimberly P. Van Niel 2 , Kris I. Waddington 3 , Lynda M. Bellchambers 4 , Matthew B. Pember 4 , Russ C. Babcock 5 , Mathew A. Vanderklift 5 , Damian P. Thomson 5 , Michael V. Jakuba 6 , Oscar Pizarro 6 , and Stefan B. Williams 6 1 School of Plant Biology and Oceans Institute, University of Western Australia, Crawley, WA 6009, Australia 2 School of Earth and Environment and Oceans Institute, University of Western Australia, Crawley, WA 6009, Australia 3 Centre for Marine Futures and Oceans Institute, University of Western Australia, Crawley, WA 6009, Australia 4 Department of Fisheries, Western Australian Fisheries and Marine Research Laboratories, PO Box 20, North Beach, WA 6920, Australia 5 CSIRO Marine and Atmospheric Research, Underwood Avenue, Floreat, WA 6014, Australia 6 Australian Centre for Field Robotics, University of Sydney, Sydney, NSW 2006, Australia *Corresponding author: tel: +61 8 6488 2219; fax: +61 8 6488 1126; e-mail: [email protected] Smale, D. A., Kendrick, G. A., Harvey, E. S., Langlois, T. J., Hovey, R. K., Van Niel, K. P., Waddington, K. I., Bellchambers, L. M., Pember, M. B., Babcock, R. C., Vanderklift, M. A., Thomson, D. P., Jakuba, M. V., Pizarro, O., and Williams, S. B. Regional-scale benthic monitoring for ecosystem-based fisheries management (EBFM) using an autonomous underwater vehicle (AUV). – ICES Journal of Marine Science, doi:10.1093/icesjms/fss082. Received 13 January 2012; accepted 7 April 2012. Monitoring marine habitats and biodiversity is critical for understanding ecological processes, conserving natural resources, and achiev- ing ecosystem-based fisheries management (EBFM). Here, we describe the application of autonomous underwater vehicle (AUV) tech- nology to conduct ongoing monitoring of benthic habitats at two key locations in Western Australia. Benthic assemblages on rocky reefs were sampled with an AUV, which captured .200 000 geo-referenced images. Surveys were designed to obtain 100% coverage of 25 × 25 m patches of benthic habitat. In 2010, multiple patches were surveyed at 15–40-m depths at three reference sites at the Houtman Abrolhos Islands and at six reference sites at Rottnest Island. The following year, repeat surveys of the same geo-referenced patches were conducted. Benthic assemblages at the Houtman Abrolhos Islands were varied in that one reference site was dominated by hard corals, whereas the other two were macroalgae dominated. Conversely, assemblages at Rottnest Island were dominated by the kelp Ecklonia radiata. The AUV resurveyed each patch with high precision and demonstrated adequate power to detect change. Repeated observations at the reference sites will track natural variability in benthic habitat structure, which in turn will facilitate the detection of ecological change and ultimately feed back into EBFM processes. Keywords: biodiversity monitoring, coastal management, community structure, marine habitats, remote technology, underwater surveys. Introduction Over the past decade, the management of fishing activities in marine ecosystems has shifted from a traditional single-species ap- proach towards ecosystem-based fisheries management (EBFM), which considers multiple biological, physical, and socio-economic components of complex systems. In essence, the transition to EBFM represents an increase in the complexity of ecosystem pro- cesses and pressures that must be considered by managers. There is now widespread agreement that the management of fisheries and marine resources must be ecosystem-based. This is because al- though the maintenance of target stocks has long been the primary management goal for fisheries agencies, non-target # 2012 International Council for the Exploration of the Sea. Published by Oxford University Press. All rights reserved. For Permissions, please email: [email protected] ICES Journal of Marine Science ICES Journal of Marine Science; doi:10.1093/icesjms/fss082 ICES Journal of Marine Science Advance Access published May 18, 2012 at University of Western Australia on May 20, 2012 http://icesjms.oxfordjournals.org/ Downloaded from
Transcript of Regional-scale benthic monitoring for ecosystem-based fisheries management (EBFM) using an...

Regional-scale benthic monitoring for ecosystem-basedfisheries management (EBFM) using an autonomousunderwater vehicle (AUV)
Dan A. Smale1*, Gary A. Kendrick1, Euan S. Harvey1, Timothy J. Langlois1, Renae K. Hovey2,Kimberly P. Van Niel2, Kris I. Waddington3, Lynda M. Bellchambers4, Matthew B. Pember4,Russ C. Babcock5, Mathew A. Vanderklift5, Damian P. Thomson5, Michael V. Jakuba6,Oscar Pizarro6, and Stefan B. Williams6
1School of Plant Biology and Oceans Institute, University of Western Australia, Crawley, WA 6009, Australia2School of Earth and Environment and Oceans Institute, University of Western Australia, Crawley, WA 6009, Australia3Centre for Marine Futures and Oceans Institute, University of Western Australia, Crawley, WA 6009, Australia4Department of Fisheries, Western Australian Fisheries and Marine Research Laboratories, PO Box 20, North Beach, WA 6920, Australia5CSIRO Marine and Atmospheric Research, Underwood Avenue, Floreat, WA 6014, Australia6Australian Centre for Field Robotics, University of Sydney, Sydney, NSW 2006, Australia
*Corresponding author: tel: +61 8 6488 2219; fax: +61 8 6488 1126; e-mail: [email protected]
Smale, D. A., Kendrick, G. A., Harvey, E. S., Langlois, T. J., Hovey, R. K., Van Niel, K. P., Waddington, K. I., Bellchambers, L. M., Pember, M. B.,Babcock, R. C., Vanderklift, M. A., Thomson, D. P., Jakuba, M. V., Pizarro, O., and Williams, S. B. Regional-scale benthic monitoring forecosystem-based fisheries management (EBFM) using an autonomous underwater vehicle (AUV). – ICES Journal of Marine Science,doi:10.1093/icesjms/fss082.
Received 13 January 2012; accepted 7 April 2012.
Monitoring marine habitats and biodiversity is critical for understanding ecological processes, conserving natural resources, and achiev-ing ecosystem-based fisheries management (EBFM). Here, we describe the application of autonomous underwater vehicle (AUV) tech-nology to conduct ongoing monitoring of benthic habitats at two key locations in Western Australia. Benthic assemblages on rockyreefs were sampled with an AUV, which captured .200 000 geo-referenced images. Surveys were designed to obtain 100% coverage of25 × 25 m patches of benthic habitat. In 2010, multiple patches were surveyed at 15–40-m depths at three reference sites at theHoutman Abrolhos Islands and at six reference sites at Rottnest Island. The following year, repeat surveys of the same geo-referencedpatches were conducted. Benthic assemblages at the Houtman Abrolhos Islands were varied in that one reference site was dominatedby hard corals, whereas the other two were macroalgae dominated. Conversely, assemblages at Rottnest Island were dominated by thekelp Ecklonia radiata. The AUV resurveyed each patch with high precision and demonstrated adequate power to detect change.Repeated observations at the reference sites will track natural variability in benthic habitat structure, which in turn will facilitatethe detection of ecological change and ultimately feed back into EBFM processes.
Keywords: biodiversity monitoring, coastal management, community structure, marine habitats, remote technology, underwater surveys.
IntroductionOver the past decade, the management of fishing activities inmarine ecosystems has shifted from a traditional single-species ap-proach towards ecosystem-based fisheries management (EBFM),which considers multiple biological, physical, and socio-economiccomponents of complex systems. In essence, the transition to
EBFM represents an increase in the complexity of ecosystem pro-cesses and pressures that must be considered by managers. There isnow widespread agreement that the management of fisheries andmarine resources must be ecosystem-based. This is because al-though the maintenance of target stocks has long been theprimary management goal for fisheries agencies, non-target
# 2012 International Council for the Exploration of the Sea. Published by Oxford University Press. All rights reserved.For Permissions, please email: [email protected]
ICES Journal of
Marine ScienceICES Journal of Marine Science; doi:10.1093/icesjms/fss082
ICES Journal of Marine Science Advance Access published May 18, 2012 at U
niversity of Western A
ustralia on May 20, 2012
http://icesjms.oxfordjournals.org/
Dow
nloaded from

stocks and the broader ecosystem must also be maintained at ac-ceptable levels to achieve stock sustainability (Pikitch et al.,2004). However, the “nuts and bolts” of implementing EBFM atlarge spatial scales and across contrasting regions has generatedmuch debate (Smith et al., 2007; Ray, 2011), and the rate of tran-sition to EBFM has generally been inadequate (Pitcher et al.,2009).
Documenting the status of marine habitats and biodiversityand tracking changes in the “health” of such biological assetsover time are key activities in the EBFM process (Pikitch et al.,2004). Marine ecosystems are both complex and dynamic, sothat measuring absolute changes in biodiversity, structure, orfunction is often unrealistic and impractical. Instead, it is possibleto employ a suite of ecological indicators which can be used totrack the health of the overall system or specific resources. Inthis way, indicators act as early warning systems of environmentalchange (Niemi and McDonald, 2004). In this case, indicators areoften “surrogates” for another measure (most commonly bio-diversity, but also measures of ecosystem function, communitystructure, or productivity) that is either impractical or too costlyto quantify in absolute form (e.g. Oliver and Beattie, 1996;Olsgard et al., 2003).
The choice of methodology and sampling design employed tomeasure ecological indicators has implications for the effectivenessof all monitoring efforts (Hewitt et al., 2001; Langlois et al., 2010).The range of sampling tools and techniques available for marineresearch has rapidly increased in recent years, following wide-spread advances in underwater technologies. Traditionally, sam-pling for long-term subtidal monitoring has been conductedeither by scuba divers (e.g. Dayton et al., 1984) or by deploying de-structive sampling equipment, such as trawls and grabs (e.g.Blomqvist, 1991). More recently, remotely deployed photographicsampling (e.g. with towed video or drop-cameras) has been con-ducted (e.g. Smale et al., 2010a).
The deployment of autonomous underwater vehicles (AUVs) formapping and sampling the deep-sea environment is a furthertechnological development. In recent years, AUVs have been usedto survey invasive pest species (Barrett et al., 2010), describebenthic community structure at depths of .1000s m (Shermanand Smith, 2009), examine coral mound morphology (Grasmuecket al., 2006), and assess environmental impacts of the DeepwaterHorizon oil spill (Camilli et al., 2010). Within the context of re-source management, AUVs have facilitated surveys of groundfishand their associated habitat (Clarke et al., 2009), as well as sensitivecoral-dominated habitats (Singh et al., 2004; Armstrong et al., 2006).AUVs are emerging as highly effective tools for sampling marineenvironments, because they (i) are untethered and can conductnon-destructive sampling in remote marine habitats (i.e. underice shelves, over untrawlable terrain, and in depths .1000 m);(ii) can repeat spatial surveys to detect change over time; and(iii) are fitted with a range of instrumentation to facilitate the sim-ultaneous acquisition of a variety of physical and biological data.Here, we describe the use of an AUV for conducting long-termmonitoring of benthic habitats in temperate Western Australia(WA) to support EBFM activities within the “West CoastBioregion” (as defined by the Department of Fisheries, WA).
In temperate WA, coastal marine ecosystems are impacted byfishing for targeted species such as the Western Rock Lobster,Panulirus cygnus (Australia’s most valuable single-species fishery)and Pink Snapper, Pagrus auratus. Widespread commercial andrecreational fishing activities have influenced trophic processes
(e.g. through the addition of bait, see Waddington and Meeuwig,2009), population structure of targeted species (Langlois et al., inpress-a), and fish community structure (Watson et al., 2007).Moreover, fragile habitats, such as some coral reefs around theHoutman Abrolhos Islands, have been physical perturbed by thedeployment of lobster pots (Webster et al., 2002). Concurrently,the most pressing environmental change factors influencingmarine ecosystems in WA are thought to include variability inocean currents (Gaughan, 2007), changes in land run-off (Loughand Hobday, 2011), introduced marine pests (Sliwa et al., 2009;Smale and Childs, 2012), and seawater acidification and warming(Orr et al., 2005; Pearce and Feng, 2007; Wernberg et al., 2011a).However, specific ecological responses to fishing and environmen-tal change are not well known and the ability to predict (and miti-gate for) changes in ecosystem structure is poor. A majorimpediment to marine research is the lack of historical baseline in-formation against which to detect change, and many regions alongthe vast, remote coastline of WA are “data-poor” (Wernberg et al.,2011a). However, the old, climatically buffered, infertile seascapeof southwestern Australia with its limited environmental hetero-geneity (Langlois et al., 2012) has been shown to provide asimple model system in which to investigate the impacts ofpressures.
Management of marine ecosystems in temperate WA is current-ly shifting from a single species to an ecosystem-based approach.To provide a framework for this transition, a decision-making/as-sessment process has been developed by the Department ofFisheries WA (Fletcher et al., 2010) which defines assets thatmust be considered for ecosystem-based management.Environmental, ecological, social, and economic assets associatedwith the marine ecosystems of WA are included in componenttrees, and each asset has been assigned a risk rating to prioritizemanagement efforts and to identify knowledge gaps (Fletcheret al., 2010). However, to validate and (if necessary) alter individ-ual risk ratings, information on the status of assets over time mustbe collected and fed back into the component trees. Submergedrocky reefs are key assets within the EBFM approach, as theysupport rich and abundant assemblages of macroalgae, inverte-brates, and reef fish (see Smale et al., 2011, for recent review).Reef assemblages are highly productive and generate food andhabitat for economically important species such as the WesternRock Lobster and Pink Snapper. To achieve a cost-effective ap-proach to monitoring these assets, several key indicators thatcapture the quality, extent, and composition of benthic habitatshave been proposed. These include the relative abundance ofwarm and cool water habitat-forming species (e.g. reef-buildingcorals vs. canopy forming macroalgae), the spatial coverage ofspecies that may be particularly sensitive to ocean warming (e.g.the brown macroalgae Scytothalia dorycarpa), and multivariate as-semblage structure at coarse taxonomic levels (Smale et al., 2010a,2011; Wernberg et al., 2011b)
Here, we report on the commencement of a monitoring pro-gramme to quantify the structure of benthic habitats in temperateWA. The goals of the monitoring efforts are to (i) improve theunderstanding of natural variability in benthic assemblages, (ii) fa-cilitate the detection of significant ecological change driven by, forexample, ocean warming, and (iii) generate time-series data thatcan be used to validate and/or amend the risk ratings associatedwith ecological assets identified through the EBFM process. Toachieve these goals, an AUV was deployed to conduct ongoing,repeat sampling at two key locations. To our knowledge, this
Page 2 of 11 D. A. Smale et al.
at University of W
estern Australia on M
ay 20, 2012http://icesjm
s.oxfordjournals.org/D
ownloaded from
represents the first application of the AUV technology for con-ducting routine monitoring of benthic habitat indicators tosupport EBFM. The work reported here also forms part of a na-tionwide programme of AUV surveys of benthic ecosystems imple-mented as one of the biological components of Australia’sIntegrated Marine Observing System (IMOS).
MethodsAUV “Sirius”Surveys were conducted with an AUV “Sirius”, which is operatedby the Australian Centre for Field Robotics (ACFR, University ofSydney) and supported by the IMOS. The vehicle is a modifiedSeabed class AUV, similar to that first described by Singh et al.(2004) and recently detailed in Williams et al. (2012). The AUVis equipped with a full suite of oceanographic instruments, includ-ing a high-resolution stereo camera pair and strobes, multibeamsonar, depth, conductivity, and temperature sensors, DopplerVelocity Log including a compass with integrated roll and pitchsensors, Ultra Short Baseline Acoustic Positioning System(USBL), and a forward-looking obstacle avoidance sonar(Supplementary ESM 1). Images were collected with a synchro-nized pair of high sensitivity 12 bit, 1.4 megapixel cameras (AVTProsilica GC1380 and GC1380C; one monochrome and onecolour. The “flight path” for each AUV dive can be precisely pre-programmed with a range of sampling designs, depending on thepurpose of the survey. For the current surveys, the AUV trackedthe seabed at an altitude of 2 m at a cruising speed of 0.5 m s– 1.The AUV was capable of conducting dives of up to 3 h (limitedby battery-life) and three or four dives per day. The vehicle wasoperated and deployed by a team of four scientists/techniciansfrom ACFR. All surveys were conducted during daytime, inApril 2010 and April 2011.
Survey locations and designLong-term monitoring was established at two key locations alongthe Western Australian coastline; the Houtman Abrolhos Islands(“Abrolhos”) and Rottnest Island (“Rottnest”; Figure 1). Theselocations have been identified as key indicator regions because oftheir ecological sensitivity and socio-economic importance. TheAbrolhos Islands, 80 km off mainland Australia, form a remotearchipelago with only seasonal human habitation and are therefore“relatively” not impacted by anthropogenic pressures (but seeWatson et al., 2007). The islands play a key role in Australia’sbiggest single-species fishery (Western Rock Lobster). At theAbrolhos, patches of hard corals and Ecklonia radiata bedscoexist to form mixed habitats (Hatcher, 1985). This unusualjuxtaposition is primarily a consequence of the long environmen-tal stability and the unique oceanography of the region. Theislands are situated within the main flow of the LeeuwinCurrent, a geologically old, poleward flowing boundary currentwhich ameliorates ocean conditions and transports tropical organ-isms and warm-water southwards (Smith et al., 1991; Pearce,1997). As such, many temperate species, including E. radiata, arefound towards the northern “warm” edge of their ranges,whereas many tropical species are found towards the southern“cool” extreme of their distributions. The juxtaposition of coralsand kelps is thought to represent a useful early warning signalfor detecting ecological effects of increased seawater temperaturein the region (Smale et al., 2010a). Rottnest Island is a majorasset for tourism and recreational fishing in the region and
supports a highly diverse and abundant marine life, whichincludes warm-water fish and coral species at the southern limitof their distributions as well as extensive stands of the kelp, E.radiata. Kelp bed communities may be sensitive to both local an-thropogenic impacts and longer-term physical forcing from sea-water warming and changes in storm patterns (Wernberg et al.,2011a). Moreover, sensitive hard corals at both locations may beparticularly prone to physical damage from fishing practices,such as the deployment of lobster pots.
The key objective of the sampling was to survey predominantlyrocky reef/coral habitat that could be established as “referencesites” and revisited as a part of monitoring efforts. As such, siteswere selected based on bathymetry maps and existing knowledge,to target moderate to high relief reef (i.e. with vertical extent oftopographic features .1 m) rather than low-lying, low-complexity reef platforms. The Abrolhos support a unique anddiverse array of marine organisms and assemblages and representthe highest latitude extensive coral reef system in the southernhemisphere (Hatcher, 1985). The islands also support extensivestands of the kelp E. radiata, which represent the “warm”extreme of its distribution. At the Abrolhos, three reference siteswere chosen to encompass both kelp-dominated (15 m CoralPatches and 25 m Geebank) and coral-dominated habitat types(15 m Geebank). At Rottnest Island, replicate sites were positionedalong a depth gradient, with two sites at 15, 25, and 40 m depth(Figure 1). At Rottnest, the sites “15 m South” and “25 mNorth” were positioned within a protected area (the “West EndDemersal Sanctuary Zone”, where all fishing activities on theseabed are prohibited). This design, with fished and unfishedareas also allows for more accurate attribution of observed
Figure 1. Locations and sites sampled by AUV in 2010 and 2011.The satellite map on the right indicates the locations of Rottnest andAbrolhos along the Western Australian coastline, with an inset mapof the Australian continent. Expanded maps on the left indicateapproximate position of each reference site at each location.
Regional-scale benthic monitoring for EBFM using an AUV Page 3 of 11
at University of W
estern Australia on M
ay 20, 2012http://icesjm
s.oxfordjournals.org/D
ownloaded from

variation between fishing and other environmental sources of vari-ation. Further site details are provided in Supplementary ESM 2.
Within each site, three replicate “grids” were initially surveyedby the AUV in 2010. The submersible conducted a series of paral-lel, overlapping 25 m long transects, which covered a combinedarea of 625 m2 of seabed (i.e. 25 × 25 m). Replicate grids withina site were situated 50–200 m apart to encapsulate spatial hetero-geneity within each site and achieve spatial independence (sensuHurlbert, 1984). During the dive, the AUV captured overlappinggeo-referenced stereo images of the benthos, as well as multibeamdata at two resolutions and physiochemical data (temperature, sal-inity, light, chlorophyll). The only exception was the “25 mGeebank” site at the Abrolhos, where only one grid on suitablehard substrata was surveyed. In 2011, the AUV resurveyed(usually) three or (in a few cases) two grids at every referencesite (Supplementary ESM 2). The only exception was again the“25 m Geebank” site at the Abrolhos, which was relocated tomore suitable substrata for long-term monitoring and, as such,the previously surveyed grid was not revisited. Finally, in situloggers were deployed at the monitoring sites by scuba divers toobtain continuous temperature readings (every 30 min).
Post-processing and analysisOver 1000 geo-referenced stereo image pairs were collected at eachgrid within the reference sites. Stereo image pairs were stitched
together to generate composite “meshes” of the entire 25 ×25 m patch of seabed (see Johnson-Roberson et al., 2010, for pro-cedural details). These meshes provided a complete overview ofeach reference site and were used to assess broad-scale ecologicalstructure, such as kelp canopy cover and coral bleaching(Figure 2). For this study, individual high-resolution images(each capturing �1.5 × 1.0 m of seabed) were subsampled fromeach grid to quantify all taxa .50 mm in size using the standardimage analysis techniques. Subsamples were selected at 20 s inter-vals from each AUV dive, to generate a sample set of 101–129 non-overlapping images that maximized spatial coverage of each grid.In this way, benthic assemblage structure was characterized at 28grids spread across nine reference sites by analysing �5200 high-resolution images. Representative images of the common assem-blage types are shown in Figure 2.
For image analysis, 50 random points were digitally overlaidonto each sample, and the number of points covering eachbenthic category was counted (using CPCe software, see Kohlerand Gill, 2006). This value was then doubled to give a proxy ofper cent cover. Forty benthic categories (Supplementary ESM 3)representing flora, fauna and substratum characteristics weredetermined a priori based on previous research (Smale et al.,2010a) and used to classify each image. Care was taken toinclude conspicuous species of considerable ecological import-ance, such as the canopy-forming brown algae E. radiata and S.
Figure 2. Representative meshes of 25 × 25 m grids sampled at (a) Abrolhos and (b) Rottnest, showing both coral- and kelp-dominatedbenthic assemblages. Individual images are representative of assemblages dominated by (c) kelp, (d) sessile invertebrates, and (e) hard coral(including bleached corals). Individual images captured �1.5 × 1.0 m of seabed.
Page 4 of 11 D. A. Smale et al.
at University of W
estern Australia on M
ay 20, 2012http://icesjm
s.oxfordjournals.org/D
ownloaded from

dorycarpa, while also using functional/morphological groups toachieve a broad, holistic approach to describing the benthos.Bleached coral was considered “alive”, but additional informationon the spatial extent of any bleaching was recorded. It was evidentfrom the images that the methods were inappropriate for samplingmobile fauna (i.e. echinoids, gastropod molluscs), which generallyhave low abundances and highly patchy distributions, and utilizecryptic habitats (i.e. reef ledges and crevices) in WA (Vanderkliftand Kendrick, 2004). Therefore, mobile invertebrates—whichwere markedly low in abundance—were excluded from the ana-lysis, and assemblage composition was derived from macroalgaeand sessile invertebrates. However, in other ecosystems that arecharacterized by less complex physical habitat structure andhigher densities of mobile invertebrates, AUVs have been shownto sample this component of the fauna effectively (e.g. Barrettet al., 2010)
Subsamples were pooled for each grid (means of 101–129 indi-vidual images), and analysis of benthic assemblages was conductedusing the grids as spatially independent replicated units.Assemblage structure at each reference site was quantified by cal-culating the per cent cover of dominant benthic groupings. Plotsof mean per cent covers of dominant benthic categories at eachsite were constructed to examine the variability between grids,sites, and years, whereas the significance of differences betweenyears was tested with one-way ANOVA at each location. Datafrom all sites were pooled and transformed as necessary toreduce homogeneity of variance and improve normality. Thepower to detect change in the per cent cover of dominanthabitat formers at the Abrolhos and Rottnest was also examined.Here, means and standard deviations for dominant benthicgroups were used to calculate the power of a hypothetical
monitoring programme, where reference sites were surveyed bien-nially for 8 years (i.e. four subsequent sampling events, withcurrent data representing t ¼ 0). The likely power (a ¼ 0.05)from a simple linear regression to detect changes in the cover(5–50%) of dominant space occupiers at each depth stratum atRottnest and at each site at the Abrolhos was calculated usingthe method of Dupont and Plummer (1998). The power calcula-tions were performed using the PS power and sample size pro-gramme (Dupont and Plummer, 1998).
Finally, at each location, multivariate assemblage structure wasvisualized with MDS ordinations, constructed from Bray–Curtissimilarity matrices based on square-root transformed per centcover data. Centroids in MDS plots represent averages for eachsite, derived from two or three grids (except for “25 mGeebank” in 2010, see above). Statistical differences in multivariateassemblage structure between years were tested with ANOSIMusing Primer 6.0 software (Clarke and Warwick, 2001).
ResultsIn 11 days at sea, the AUV captured over 200 000 benthic images,plus data on bathymetry, and a wide range of physiochemical vari-ables which will form the basis of an ongoing time-series.Crucially, using differential GPS, USBL, and image registrationtechnology, the AUV was able to relocate and survey the exactsame patch of seabed in both years. For example, comparison ofactual AUV flight paths for both years at an Abrolhos site indicatedvery high spatial overlap between years (Figure 3). Similar spatialoverlap between years was observed at all reference sites (except“25 m Geebank”, see Methods).
The Abrolhos were characterized by rich, mixed assemblagesdominated by both hard corals and large macroalgae. The “15 mGeebank” site was dominated by hard corals (primarily withbranched, tabulate, and plate morphologies) which, on average,covered �80% of the seabed (Figure 4). In contrast, the othersites were dominated by macroalgae, particularly the kelp E.radiata and red foliose algae (Figure 4). For all the dominantspace occupiers at the Abrolhos, variability in per cent coverbetween years was minimal and no significant differencesbetween years were detected (Table 1). At the coral-dominated“15 m Geebank” site, high levels of coral bleaching were recordedin 2011. The per cent cover of bleached corals, derived from bothsubsampled individual images and composite meshes, rangedfrom 4 to 19% across the three grids surveyed at “15 mGeebank”. In stark contrast, no coral bleaching was observed atthe Abrolhos in 2010 (Figure 4).
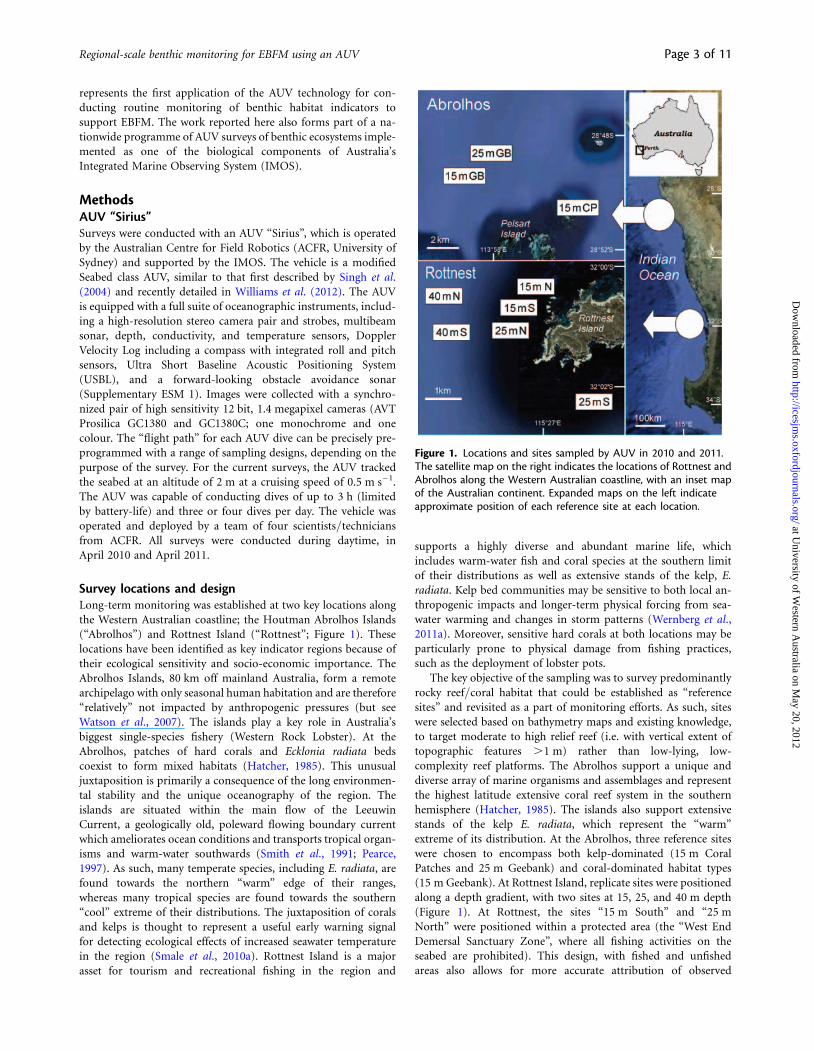
At Rottnest, E. radiata was the dominant space occupier at allsites and depths (Figure 5) and covered over 50% of the entireseabed surveyed at three sites. Although its relative dominancedecreased with depth, the areal coverage of E. radiata still exceeded30% at 40-m depth. Other prevalent components of the benthicassemblage included the large brown macroalgae S. dorycarpa,red foliose algae, turfing algae, and encrusting coralline algae(Figure 5). Within-site variability in the per cent cover of thesegroups was generally low, although variability was markedlyhigher at the deeper sites. For the dominant space occupiers E.radiata, S. dorycarpa, red foliose algae, and sponges, variabilitybetween years was very low and no significant differencesbetween years were detected (Table 1). For example, on averagethe per cent cover of E. radiata varied by less than 7% betweenyears.
Figure 3. Actual AUV flight paths at the “15 m Coral Patches”reference site at Abrolhos during the 2010 (white) and 2011 (grey)surveys. Each survey grid covered an area of 0.0625 m2.
Regional-scale benthic monitoring for EBFM using an AUV Page 5 of 11
at University of W
estern Australia on M
ay 20, 2012http://icesjm
s.oxfordjournals.org/D
ownloaded from

Likely power to detect change in benthic assemblages variedamong taxa, and in relation to variables such as depth. At theAbrolhos, the monitoring programme would have adequatepower from simple linear regression to detect a 20% change inthe cover of E. radiata, a 35% change in branched corals, and a50% change in tabulate corals after 8 years (Figure 6). AtRottnest, adequate power to detect a 20–25% change in thecover of E. radiata was estimated for the 15 and 25 m deep refer-ence sites, whereas at 45 m depth, the monitoring would detect a45% change in cover of E. radiata. Intuitively, greatest power wasestimated for indicators with the highest mean values and lowestvariability between replicate grids and years (i.e. E. radiata).
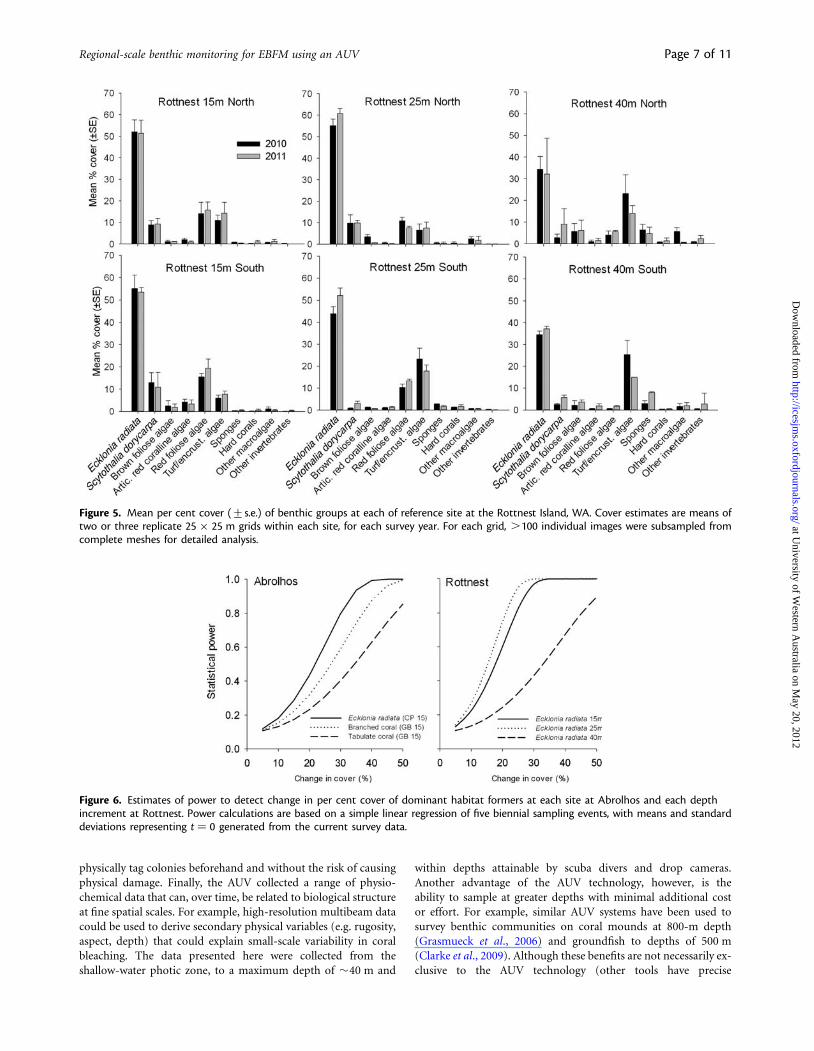
Multivariate community structure varied considerably betweensites at the Abrolhos, with each site supporting very distinctbenthic communities (Figure 7). However, variability betweenyears was minimal, and a one-way ANOSIM detected no signifi-cant difference in multivariate assemblage between 2010 and2011 (ANOSIM, R ¼ 0.00, p ¼ 0.95). At Rottnest, MDS ordin-ation indicated a general shift in assemblage structure along thedepth gradient, with moderate variability between sites and years(Figure 7). A one-way ANOSIM between year groups showedthat variability in multivariate assemblage structure betweenyears was not significant (ANOSIM, R ¼ 0.01, p ¼ 0.54), princi-pally because variability within years (and within sites) was rela-tively pronounced.
In situ temperature loggers showed that daily mean tempera-ture ranged from �20 to 278C at the Abrolhos and 18–268C atRottnest during the 13 months of continuous observation(Figure 8). Peak temperatures of 27.58C at the Abrolhos and26.18C at Rottnest were recorded on 1 March 2011. Finally, tem-peratures in May 2011 were �28C higher compared with thoserecorded in May 2010 at both locations (Figure 8).
DiscussionThe surveys described here are the first to be conducted by an AUVsystem in temperate WA and represent the commencement of along-term monitoring programme that will inform EBFM in the
region. There were four key benefits of the application of theAUV technology for sustained ecological observation. First, eachreference site is precisely geo-referenced and can be revisited bypre-programming the flight path of the AUV. Second, each long-term monitoring grid is surveyed at �100% areal coverage, gener-ating precise ecological information for each 625 m2 patch ofseabed. The amount of data collected allows small-scale patchi-ness, which is pronounced in these ecosystems (Smale et al.,2010b), to be accounted for, thereby facilitating monitoring ofcommunity structure at relevant spatial scales (i.e. scale of“patch”). Third, the AUV can resample the same specific organ-isms over time, with minimal risk of causing physical disturbanceduring the sampling procedure. This is particularly relevant tocoral reef monitoring, where tagged colonies are revisited byscuba divers to monitor bleaching and mortality rates (Hill andWilkinson, 2004). This procedure can be time consuming, whilescuba divers may damage tagged corals and are severely restrictedby depth and time. Using an AUV, specific organisms can besampled over time at a range of depths, without the need to
Table 1. One-way ANOVAs on the per cent cover of majorbenthic groupings at both locations, to test for differences betweenyears.
Abrolhos Trans. MS F1,13 p-value
Ecklonia radiata ln(x + 1) 0.14 0.03 0.852Brown foliose algae ln(x + 1) 0.01 0.01 0.958Red foliose algae ln(x + 1) 0.68 0.45 0.511Branched corala ln(x + 1) 0.08 0.02 0.874Tabulate coral ln(x + 1) 0.19 0.08 0.779Plate corala ln(x + 1) 0.01 0.01 0.968
Rottnest Trans. MS F1,30 p-value
Ecklonia radiata None 50.15 0.35 0.555Scytothalia dorycarpa ln(x + 1) 0.93 1.53 0.226Red foliose algae None 28.10 0.62 0.434Turf/encrust. algae ln(x + 1) 0.02 0.07 0.794Sponges ln(x + 1) 0.03 0.06 0.805aTaxa that did not pass normality tests after transformation.
Figure 4. Mean per cent cover (+s.e.) of benthic groups at each of reference site at the Houtman Abrolhos Islands, WA. Cover estimates aremeans of two or three replicate 25 × 25 m grids within each site, for each survey year. For each grid, .100 individual images were subsampledfrom complete meshes for detailed analysis. Note that at the “25 m Geebank” site, only one grid was surveyed in 2010 and the three gridssurveyed in 2011 did not overlap with the 2010 grid (see Methods).
Page 6 of 11 D. A. Smale et al.
at University of W
estern Australia on M
ay 20, 2012http://icesjm
s.oxfordjournals.org/D
ownloaded from
physically tag colonies beforehand and without the risk of causingphysical damage. Finally, the AUV collected a range of physio-chemical data that can, over time, be related to biological structureat fine spatial scales. For example, high-resolution multibeam datacould be used to derive secondary physical variables (e.g. rugosity,aspect, depth) that could explain small-scale variability in coralbleaching. The data presented here were collected from theshallow-water photic zone, to a maximum depth of �40 m and
within depths attainable by scuba divers and drop cameras.Another advantage of the AUV technology, however, is theability to sample at greater depths with minimal additional costor effort. For example, similar AUV systems have been used tosurvey benthic communities on coral mounds at 800-m depth(Grasmueck et al., 2006) and groundfish to depths of 500 m(Clarke et al., 2009). Although these benefits are not necessarily ex-clusive to the AUV technology (other tools have precise
Figure 5. Mean per cent cover (+s.e.) of benthic groups at each of reference site at the Rottnest Island, WA. Cover estimates are means oftwo or three replicate 25 × 25 m grids within each site, for each survey year. For each grid, .100 individual images were subsampled fromcomplete meshes for detailed analysis.
Figure 6. Estimates of power to detect change in per cent cover of dominant habitat formers at each site at Abrolhos and each depthincrement at Rottnest. Power calculations are based on a simple linear regression of five biennial sampling events, with means and standarddeviations representing t ¼ 0 generated from the current survey data.
Regional-scale benthic monitoring for EBFM using an AUV Page 7 of 11
at University of W
estern Australia on M
ay 20, 2012http://icesjm
s.oxfordjournals.org/D
ownloaded from
geo-referencing capabilities, for example), it is the combination ofthese benefits and the efficiency and flexibility of sampling by AUVthat will facilitate sustained ecological observations.
The AUV is a powerful tool for assessing the quantity andquality of benthic habitat for fisheries management, and farexceeds the ability of other commonly used methods to obtainlarge amounts of quantitative photographic data of the benthos.For example, photographic samples have been collected previouslyfrom submerged reefs in the region, by scuba divers (Bellchamberset al., 2008), “drop” cameras (Smale et al., 2010a), and towed videosystems. In a single day in the field, a team of divers can typicallycollect �400 individual (non-overlapping) images and a remotelydeployed “drop” camera can collect �700 images, depending onweather conditions and sampling protocol. During the surveysdescribed here, the AUV collected .15 000 stereo image pairseach day, a considerable increase in efficiency. Therefore, whileinitial expenditure on an AUV is greater (an AUV suitable toconduct the monitoring programme would cost a total of�$300 000), there are considerable reductions in cost relating totime at sea and personnel training (i.e. for scientific divers).Conversely, additional costs relating to expertise needed tooperate the vehicle and maintenance may be higher than thoseassociated with the other methods and would need to be consid-ered in any formal analysis of cost-effectiveness.
Benthic assemblage structure at the Abrolhos and Rottnest wasquantified to provide a benchmark against which to detect futureecological change. The coexistence of coral- and kelp-dominatedassemblages at the Abrolhos and, to a lesser extent, Rottnest pro-vides a rare opportunity to test ecological hypotheses related tospecies interactions and oceanic warming, whereas the relativedominance of these habitat formers may represent a useful earlywarning signal for detecting ecological effects of seawaterwarming (Smale et al., 2010a). Here, continued sampling at theAbrolhos will have adequate power (.0.80) to detect ,35%change in cover of kelps and branching corals (i.e. principallyAcroporids) over time. As such, the power of AUV sampling todetect change in the cover of these key indicators bodes well foreffective monitoring of these sensitive and important habitats.
The AUV surveys detected high rates of coral bleaching (.10%of the entire seabed area) at one of the Abrolhos sites 2011,
whereas no bleached corals were recorded in 2010. In early 2011,most of the Western Australian coastline experienced a “marineheat wave”, in that seawater temperatures were 2–48C higherthan normal for up to 8 weeks (Pearce et al., 2011; Smale andWernberg, 2012). Satellite-derived SSTs were the highest onrecord (i.e. for 30 years), while in situ loggers recorded warminganomalies of up to 58C in inshore waters (Pearce et al., 2011).Over 2000 km of coastline was subjected to the warming event,which was principally driven by strong La Nina conditions super-imposed onto a decadal-scale seawater warming trend (Pearceet al., 2011). At the Abrolhos, surface seawater temperaturepeaked at 28.78C in March, which is �58C higher than the long-term monthly mean for the region. Even at 25-m depth at theGeebank monitoring site, seawater temperature exceeded 278C.The high incidence of bleached corals was a direct consequenceof persistent seawater warming, and ongoing regular AUV
Figure 7. MDS ordinations, based on Bray–Curtis similarity matrices generated from square-root transformed per cent cover data, to indicateassemblage structure at each reference site and each sampling year at Abrolhos (left) and Rottnest (right), WA. Each centroid represents theaverage of two or three grids (25 × 25 m) sampled at each site (except “25 m Geebank” in 2010, see Methods). Low stress values (,0.1)indicate adequate representation of multidimensional distance in the two-dimensional MDS plots.
Figure 8. Daily mean temperature at monitoring sites at Abrolhosand Rottnest during 2010 and 2011. Temperature data werecollected (every 30 min) by in situ loggers deployed onto rocky reefsat �25 m depth.
Page 8 of 11 D. A. Smale et al.
at University of W
estern Australia on M
ay 20, 2012http://icesjm
s.oxfordjournals.org/D
ownloaded from
surveys will facilitate assessments of the longer-term ecologicalconsequences of the bleaching event. Understanding the levels ofresilience and rates of recovery of these coral assemblages willbecome critically important, if, as predicted, the frequency and in-tensity of short-term extreme warming events increases (Solomonet al., 2007).
At Rottnest Island, rocky reefs are dominated by E. radiata,which decreases in cover with depth and consequently drivesdepth-related changes in overall assemblage structure. Even at40-m depth, however, the kelp was the dominant space occupier,which highlights the importance of this primary producer in near-shore benthic habitats. Crucially, the analysis of a large number ofsubsamples (i.e. .100) at each grid generated realistic and preciseestimates of the per cent cover for dominant, conspicuous spaceoccupiers, which can be tracked over time to provide powerfultests of ecological change. By monitoring at the scale of grid or“patch” along a depth gradient, changes in kelp canopy structurecan be assessed. Given the possible interactive effects of seawaterwarming and increased physical disturbance (through enhancedstorm frequency and/or intensity) on kelp beds and local biodiver-sity (Wernberg et al., 2010, 2011a), observations at the spatial scaleof patch will be most appropriate in detecting the effects of climatechange in the region.
Rottnest Island was also affected by the 2011 marine heat wave,with in situ measurements confirming temperatures were up to48C higher (maximum ¼ 26.48C) than the long-term monthlyaverage (21.78C) for 20 weeks before surveys (Thomson et al.,2011). Ecological observations attributed to the temperatureanomaly included restricted coral bleaching (Thomson et al.,2011) and the possible enhanced recruitment of tropical fishspecies (Pearce et al., 2011). No significant changes in the coverof dominant space occupiers were recorded in the AUV surveys,although, based on their distribution patterns, some cool-watermacroalgae species (e.g. S. dorycarpa) are thought to be useful eco-logical indicators of seawater warming in the region (Smale et al.,2010a; Wernberg et al., 2011b). However, as these species are not atthe “warm” extreme of their distributions at Rottnest Island, itseems likely that they were able to tolerate the warming event,and there is some evidence that marginal populations of cool-affinity macroalgae further north did exhibit a response towarming (D.A. Smale, unpublished data).
Indicators of ecosystem change derived from multivariate as-semblage composition are often more sensitive to ecologically rele-vant change than univariate indicators (Anderson and Thompson,2004) and provide a more holistic view of ecological structure thanwould be gained by targeting individual indicators species or taxa(Clarke and Warwick, 2001). At the Abrolhos, differences in multi-variate structure between sites were pronounced, with each refer-ence site supporting very distinct assemblages. Interannualvariability was negligible, indicating that short-term variabilityin benthic assemblage structure was minimal and providing arobust “baseline” against which to monitor change. At Rottnest,MDS ordination suggested a general shift in assemblage structurealong the depth gradient, which was driven by decreasing domin-ance of E. radiata and greater occurrence of invertebrate taxa, suchas sponges, with increased depth. Over time, multivariate data canbe used to develop powerful statistical tools such as “controlcharts” (Anderson and Thompson, 2004), which can be used toinform resource managers of acceptable levels of natural variabilityand to trigger an “alarm bell” on the detection of unacceptablelevels of ecological change. The detection of change could
subsequently invoke various adaptation and mitigation strategies(see Koehn et al., 2011, for further discussion).
Without long-term data, short-term natural variability canmask chronic or cumulative impacts, often until critical levelsare reached (Hewitt et al., 2001). The necessity of long-term mon-itoring for understanding ecological variation and processes hasbeen acknowledged for decades (Bernstein and Zalinski, 1983).Monitoring for EBFM is essential because of the uncertaintyinvolved in predicting the response of ecosystems to particularimpacts or environmental change. Sustained AUV surveys atthese locations will facilitate greater understanding of temporalvariability in benthic community structure and population dy-namics of key habitat-forming species, such as kelps and corals.In the immediate term, sampling each year is desirable to deter-mine the magnitude of interannual variability, but eventually sam-pling frequency could be reduced or nested (e.g. Hewitt andThrush, 2007) to achieve cost-effectiveness while retaining suffi-cient power to detect change. Ultimately, the monitoring pro-gramme described here for WA will form part of a nationalincentive to establish reference sites around the entire .25000 km of coastline (Williams et al., 2012). This will facilitategreater understanding of the ecological pattern and process in sub-tidal habitats and provide better information for resource man-agers on ecosystem responses to key drivers such as fishing andclimate change.
Supplementary dataSupplementary data are available at ICESJMS online.
AcknowledgementsThis work forms part of a large, collaborative effort involving theUniversity of Western Australia (UWA), CSIRO, the Departmentof Fisheries (Western Australia), and the University of Sydney’sAustralian Centre for Field Robotics (ACFR). The WesternAustralian Marine Science Institute (WAMSI) and the IntegratedMarine Observing System (IMOS) marine facility providedfunding. The field surveys would not have been possible withoutthe expertise and commitment of a number of scientists and tech-nicians; we are especially grateful to the skippers and crews of the“RV Linnaeus” and the “RV Naturaliste”.
ReferencesAnderson, M. J., and Thompson, A. A. 2004. Multivariate control
charts for ecological and environmental monitoring. EcologicalApplications, 14: 1921–1935.
Armstrong, R. A., Singh, H., Torres, J., Nemeth, R. S., Can, A., Roman,C., Eustice, R., et al. 2006. Characterizing the deep insular shelfcoral reef habitat of the Hind Bank marine conservation district(US Virgin Islands) using the Seabed autonomous underwatervehicle. Continental Shelf Research, 26: 194–205.
Barrett, N., Seiler, J., Anderson, T., Williams, S., Nichol, S., and Hill,S. N. 2010. Autonomous Underwater Vehicle (AUV) formapping marine biodiversity in coastal and shelf waters: implica-tions for marine management. OCEANS 2010 IEEE Conference,Sydney, pp. 1–6.
Bellchambers, L., Bridgwood, S., How, J., Lewis, P., de Lestang, S.,Mackie, M., and Coutts, T. 2008. Development of a long-termprogram to monitor coastal communities within the Swanregion. Fisheries Research Report, 183. Department of Fisheries,Western Australia.
Bernstein, B. B., and Zalinski, J. 1983. Optimum sampling design andpower tests for environmental biologists. Journal of EnvironmentalManagement, 16: 35–43.
Regional-scale benthic monitoring for EBFM using an AUV Page 9 of 11
at University of W
estern Australia on M
ay 20, 2012http://icesjm
s.oxfordjournals.org/D
ownloaded from

Blomqvist, S. 1991. Quantitative sampling of soft-bottom sediments:problems and solutions. Marine Ecology Progress Series, 72:295–304.
Camilli, R., Reddy, C. M., Yoerger, D. R., Van Mooy, B. A. S., Jakuba,M. V., Kinsey, J. C., McIntyre, C. P., et al. 2010. Tracking hydrocar-bon plume transport and biodegradation at Deepwater Horizon.Science, 330: 201–204.
Clarke, K. R., and Warwick, R. M. 2001. Change in MarineCommunities: an Approach to Statistical Analysis andInterpretation. PRIMER-E Ltd, Plymouth, UK.
Clarke, M. E., Tolimieri, N., Singh, H., Beamish, R. J., and Rothschild,B. J. 2009. Using the seabed AUV to assess populations of ground-fish in untrawlable areas. In The Future of Fisheries Science inNorth America, pp. 357–372. Springer, Netherlands.
Dayton, P. K., Currie, V., Gerrodette, T., Keller, B. D., Rosenthal, R.,and Ven Tresca, D. 1984. Patch dynamics and stability of someCalifornia kelp communities. Ecological Monographs, 54:253–289.
Dupont, W. D., and Plummer, W. D. 1998. Power and sampling sizecalculations for studies involving linear regression. ControlledClinical Trials, 19: 589–601.
Fletcher, W. J., Shaw, J., Metcalf, S. J., and Gaughan, D. J. 2010. Anecosystem based fisheries management framework: the efficient,regional-level planning tool for management agencies. MarinePolicy, 34: 1226–1238.
Gaughan, D. J. 2007. Potential mechanisms of influence of theLeeuwin Current eddy system on teleost recruitment to the WestAustralian continental shelf. Deep Sea Research Part II: TopicalStudies in Oceanography, 54: 1129–1140.
Grasmueck, M., Eberli, G. P., Viggiano, D. A., Correa, T., Rathwell, G.,and Luo, J. 2006. Autonomous underwater vehicle (AUV) mappingreveals coral mound distribution, morphology, and oceanographyin deep water of the Straits of Florida. Geophysical ResearchLetters, 33: L23616.
Hatcher, B. G. 1985. Ecological research at the Houtman AbrolhosIslands: High latitude reefs of Western Australia. In Proceedingsof the 5th International Coral Reef Congress, Tahiti, 6, pp.291–297. Ed. by C. Gabrie, and M. Harmelin Vivien. Tahiti,French Polynesia: Antenne Museum-EPHE.
Hewitt, J., and Thrush, S. 2007. Effective long-term ecological moni-toring using spatially and temporally nested sampling.Environmental Monitoring and Assessment, 133: 295–307.
Hewitt, J. E., Thrush, S. E., and Cummings, V. J. 2001. Assessing en-vironmental impacts: effects of spatial and temporal variability atlikely impact scales. Ecological Applications, 11: 1502–1516.
Hill, J., and Wilkinson, C. 2004. Methods for Ecological Monitoring ofCoral Reefs. Australian Institute of Marine Science, Townsville,117pp.
Hurlbert, S. H. 1984. Pseudoreplication and the design of ecologicalfield experiments. Ecological Monographs, 54: 187–211.
Johnson-Roberson, M., Pizarro, O., Williams, S. B., and Mahon, I.2010. Generation and visualization of large-scale three-dimensional reconstructions from underwater robotic surveys.Journal of Field Robotics, 27: 21–51.
Koehn, J. D., Hobday, A. J., Pratchett, M. S., and Gillanders, B. M.2011. Climate change and Australian marine and freshwater envir-onments, fishes and fisheries: synthesis and options for adaptation.Marine and Freshwater Research, 62: 1148–1164.
Kohler, K. E., and Gill, S. M. 2006. Coral Point Count with Excelextensions (CPCe): a Visual Basic program for the determinationof coral and substrate coverage using random point count method-ology. Computers and Geosciences, 32: 1259–1269.
Langlois, T. J., Harvey, E. S., Fitzpatrick, B., Shedrawi, J. J. M. G., andWatson, D. L. 2010. Cost-efficient sampling of fish assemblages:comparison of baited video stations and diver video transects.Aquatic Biology, 9: 155–168.
Langlois, T. J., Harvey, E. S., and Meeuwig, J. J. Strong direct and in-consistent indirect effects of fishing found using stereo-video:testing indicators from fisheries closures. Ecological Indicators(In press.)
Langlois, T. J., Radford, B., Van Niel, K. P., Meeuwig, J. J., Pearce, A.,Rousseaux, C. S. G., Kendrick, G. A., et al. 2012. Consistent abun-dance distributions of marine fishes in an old, climatically buffered,infertile seascape. Global Ecology and Biogeography. doi: 10.1111/j.1466-8238.2011.00734.x.
Lough, J. M., and Hobday, A. J. 2011. Observed climate change inAustralian marine and freshwater environments. Marine andFreshwater Research, 62: 984–999.
Niemi, G. J., and McDonald, M. E. 2004. Application of ecologicalindicators. Annual Review of Ecology, Evolution, andSystematics, 35: 89–111.
Oliver, I., and Beattie, A. J. 1996. Designing a cost-effective inverte-brate survey: a test of methods for rapid assessment of biodiversity.Ecological Applications, 6: 594–607.
Olsgard, F., Brattegard, T., and Holthe, T. 2003. Polychaetes as surro-gates for marine biodiversity: lower taxonomic resolution and in-dicator groups. Biodiversity and Conservation, 12: 1033–1049.
Orr, J. C., Fabry, V. J., Aumont, O., Bopp, L., Doney, S. C., Feely, R. A.,Gnanadesikan, A., et al. 2005. Anthropogenic ocean acidificationover the twenty-first century and its impact on calcifying organ-isms. Nature, 437: 681–686.
Pearce, A. 1997. The Leeuwin Current and the Houtman AbrolhosIslands. In The Marine Flora and Fauna of the HoutmanAbrolhos Islands, Western Australia. Ed. by F. E. Wells. WesternAustralian Museum, Perth.
Pearce, A., and Feng, M. 2007. Observations of warming on theWestern Australian continental shelf. Marine and FreshwaterResearch, 58: 914–920.
Pearce, A., Lenanton, R., Jackson, G., Moore, J., Feng, M., andGaughan, D. 2011. The “marine heat wave” off Western Australiaduring the summer of 2010/11. Fisheries Research Report, 222.Department of Fisheries, Perth, Australia.
Pikitch, E. K., Santora, C., Babcock, E. A., Bakun, A., Bonfil, R.,Conover, D. O., Dayton, P., et al. 2004. Ecosystem-based fisherymanagement. Science, 305: 346–347.
Pitcher, T. J., Kalikoski, D., Short, K., Varkey, D., and Pramod, G.2009. An evaluation of progress in implementing ecosystem-basedmanagement of fisheries in 33 countries. Marine Policy, 33:223–232.
Ray, H. 2011. Future directions in ecosystem based fisheries manage-ment: a personal perspective. Fisheries Research, 108: 235–239.
Sherman, A. D., and Smith, K. L., Jr. 2009. Deep-sea benthic boundarylayer communities and food supply: a long-term monitoring strat-egy. Deep Sea Research Part II: Topical Studies in Oceanography,56: 1754–1762.
Singh, H., Armstrong, R., Gilbes, F., Eustice, R., Roman, C., Pizarro,O., and Torres, J. 2004. Imaging coral I: imaging coral habitatswith the SeaBED AUV. Subsurface Sensing Technologies andApplications, 5: 25–42.
Sliwa, C., Migus, S., McEnnulty, F., Hayes, K. R., Rilov, G., andCrooks, J. A. 2009. Marine bioinvasions in Australia. InBiological Invasions in Marine Ecosystems, pp. 425–437. Ed. byM. M. Caldwell, G. Heldmaier, R. B. Jackson, O. L. Lange, H. A.Mooney, E. D. Schulze, and U. Sommer. Springer, Berlin.
Smale, D. A., and Childs, S. 2012. The occurrence of a widespreadmarine invader, Didemnum perlucidum (Tunicata, Ascidiacea) inWestern Australia. Biological Invasions, doi: 10.1007/s10530-011-0167-8.
Smale, D. A., Kendrick, G. A., Waddington, K. I., Van Niel, K. P.,Meeuwig, J. J., and Harvey, E. S. 2010a. Benthic assemblage com-position on subtidal reefs along a latitudinal gradient in WesternAustralia. Estuarine Coastal and Shelf Science, 86: 83–92.
Page 10 of 11 D. A. Smale et al.
at University of W
estern Australia on M
ay 20, 2012http://icesjm
s.oxfordjournals.org/D
ownloaded from

Smale, D. A., Kendrick, G. A., and Wernberg, T. 2010b. Assemblageturnover and taxonomic sufficiency of subtidal macroalgae at mul-tiple spatial scales. Journal of Experimental Marine Biology andEcology, 384: 76–86.
Smale, D. A., Langlois, T. J., Kendrick, G. A., Meeuwig, J. J., andHarvey, E. S. 2011. From fronds to fish: the use of indicators forecological monitoring in marine benthic ecosystems, with particu-lar reference to the temperate nearshore system of WesternAustralia. Reviews in Fish Biology and Fisheries, 21: 311–337.
Smale, D. A., and Wernberg, T. 2012. Ecological observations asso-ciated with an anomalous warming event at the HoutmanAbrolhos Islands, Western Australia. Coral Reefs, DOI: 10.1007/s00338-012-0873-4.
Smith, A. D. M., Fulton, E. J., Hobday, A. J., Smith, D. C., andShoulder, P. 2007. Scientific tools to support the practical imple-mentation of ecosystem-based fisheries management. ICESJournal of Marine Science, 64: 633–639.
Smith, R. L., Huyer, A., Godfrey, J. S., and Church, J. A. 1991. TheLeeuwin Current off Western Australia. Journal of PhysicalOceanography, 21: 323–345.
Solomon, S., Qin, D., Manning, M., Chen, Z., Marquis, M., Averyt,K. B., Tignor, M., et al. 2007. Contribution of Working Group 1to the Fourth Assessment Report of the IPCC. CambridgeUniversity Press, Cambridge, UK and New York, USA.
Thomson, D. P., Bearham, D., Graham, F., and Eagle, J. V. 2011. Highlatitude, deeper water coral bleaching at Rottnest Island, WesternAustralia. Coral Reefs, 30: 1107.
Vanderklift, M. A., and Kendrick, G. A. 2004. Variations in abun-dances of herbivorous invertebrates in temperate subtidal rockyreef habitats. Marine and Freshwater Research, 55: 93–103.
Waddington, K. I., and Meeuwig, J. J. 2009. Contribution of bait tolobster production in an oligotrophic marine ecosystem as deter-mined using a mass balance model. Fisheries Research, 99: 1–6.
Watson, D. L., Harvey, E. S., Kendrick, G. A., Nardi, K., and Anderson,M. J. 2007. Protection from fishing alters the species compositionof fish assemblages in a temperate-tropical transition zone. MarineBiology, 152: 1197–1206.
Webster, F. J., Dibden, C. J., Weir, K. E., and Chubb, C. F. 2002.Towards an assessment of the natural and human use impacts onthe marine environment of the Abrolhos Islands, vol. 1. FisheriesResearch Report, 134. Department of Fisheries, WesternAustralia. 120 pp.
Wernberg, T., Russell, B. D., Moore, P. J., Ling, S. D., Smale, D. A.,Coleman, M., Steinberg, P. D., et al. 2011a. Impacts of climatechange in a global hotspot for temperate marine biodiversity andocean warming. Journal of Experimental Marine Biology andEcology, 400: 7–16.
Wernberg, T., Thomsen, M. S., Tuya, F., and Kendrick, G. A. 2011b.Biogenic habitat structure of seaweeds change along a latitudinalgradient in ocean temperature. Journal of Experimental MarineBiology and Ecology, 400: 264–271.
Wernberg, T., Thomsen, M. S., Tuya, F., Kendrick, G. A., Staehr, P. A.,and Toohey, B. D. 2010. Decreasing resilience of kelp beds along alatitudinal temperature gradient: potential implications for awarmer future. Ecology Letters, 13: 685–694.
Williams, S. B., Pizarro, O., Jakuba, M. V., Johnson, C. R., Barrett, N.,Babcock, R. C., Kendrick, G. A., et al. 2012. Monitoring of benthicreference sites. IEEE Robotics and Automation Magazine, 19:73–84.
Handling editor: David Demer
Regional-scale benthic monitoring for EBFM using an AUV Page 11 of 11
at University of W
estern Australia on M
ay 20, 2012http://icesjm
s.oxfordjournals.org/D
ownloaded from