Recovery of frog and lizard communities following primary habitat alteration in Mizoram, Northeast...
18
BioMed Central Page 1 of 18 (page number not for citation purposes) BMC Ecology Open Access Research article Recovery of frog and lizard communities following primary habitat alteration in Mizoram, Northeast India Samraat S Pawar* 1,2 , Gopal S Rawat 1 and Binod C Choudhury 1 Address: 1 Wildlife Institute of India, Chandrabani, Dehradun 248 001, India and 2 Section of Integrative Biology, University of Texas, Austin, TX 78712, USA Email: Samraat S Pawar* - [email protected]; Gopal S Rawat - [email protected]; Binod C Choudhury - [email protected] * Corresponding author Abstract Background: Community recovery following primary habitat alteration can provide tests for various hypotheses in ecology and conservation biology. Prominent among these are questions related to the manner and rate of community assembly after habitat perturbation. Here we use space-for-time substitution to analyse frog and lizard community assembly along two gradients of habitat recovery following slash and burn agriculture (jhum) in Mizoram, Northeast India. One recovery gradient undergoes natural succession to mature tropical rainforest, while the other involves plantation of jhum fallows with teak Tectona grandis monoculture. Results: Frog and lizard communities accumulated species steadily during natural succession, attaining characteristics similar to those from mature forest after 30 years of regeneration. Lizards showed higher turnover and lower augmentation of species relative to frogs. Niche based classification identified a number of guilds, some of which contained both frogs and lizards. Successional change in species richness was due to increase in the number of guilds as well as the number of species per guild. Phylogenetic structure increased with succession for some guilds. Communities along the teak plantation gradient on the other hand, did not show any sign of change with chronosere age. Factor analysis revealed sets of habitat variables that independently determined changes in community and guild composition during habitat recovery. Conclusions: The timescale of frog and lizard community recovery was comparable with that reported by previous studies on different faunal groups in other tropical regions. Both communities converged on primary habitat attributes during natural vegetation succession, the recovery being driven by deterministic, nonlinear changes in habitat characteristics. On the other hand, very little faunal recovery was seen even in relatively old teak plantation. In general, tree monocultures are unlikely to support recovery of natural forest communities and the combined effect of shortened jhum cultivation cycles and plantation forestry could result in landscapes without mature forest. Lack of source pools of genetic diversity will then lead to altered vegetation succession and faunal community reassembly. It is therefore important that the value of habitat mosaics containing even patches of primary forest and successional secondary habitats be taken into account. Published: 06 August 2004 BMC Ecology 2004, 4:10 doi:10.1186/1472-6785-4-10 Received: 28 January 2004 Accepted: 06 August 2004 This article is available from: http://www.biomedcentral.com/1472-6785/4/10 © 2004 Pawar et al; licensee BioMed Central Ltd. This is an open-access article distributed under the terms of the Creative Commons Attribution License (http://creativecommons.org/licenses/by/2.0 ), which permits unrestricted use, distribution, and reproduction in any medium, provided the original work is properly cited.
-
Upload
independent -
Category
Documents
-
view
1 -
download
0
Transcript of Recovery of frog and lizard communities following primary habitat alteration in Mizoram, Northeast...
BioMed CentralBMC Ecology
ss
Open AcceResearch articleRecovery of frog and lizard communities following primary habitat alteration in Mizoram, Northeast IndiaSamraat S Pawar*1,2, Gopal S Rawat1 and Binod C Choudhury1Address: 1Wildlife Institute of India, Chandrabani, Dehradun 248 001, India and 2Section of Integrative Biology, University of Texas, Austin, TX 78712, USA
Email: Samraat S Pawar* - [email protected]; Gopal S Rawat - [email protected]; Binod C Choudhury - [email protected]
* Corresponding author
AbstractBackground: Community recovery following primary habitat alteration can provide tests forvarious hypotheses in ecology and conservation biology. Prominent among these are questionsrelated to the manner and rate of community assembly after habitat perturbation. Here we usespace-for-time substitution to analyse frog and lizard community assembly along two gradients ofhabitat recovery following slash and burn agriculture (jhum) in Mizoram, Northeast India. Onerecovery gradient undergoes natural succession to mature tropical rainforest, while the otherinvolves plantation of jhum fallows with teak Tectona grandis monoculture.
Results: Frog and lizard communities accumulated species steadily during natural succession,attaining characteristics similar to those from mature forest after 30 years of regeneration. Lizardsshowed higher turnover and lower augmentation of species relative to frogs. Niche basedclassification identified a number of guilds, some of which contained both frogs and lizards.Successional change in species richness was due to increase in the number of guilds as well as thenumber of species per guild. Phylogenetic structure increased with succession for some guilds.Communities along the teak plantation gradient on the other hand, did not show any sign of changewith chronosere age. Factor analysis revealed sets of habitat variables that independentlydetermined changes in community and guild composition during habitat recovery.
Conclusions: The timescale of frog and lizard community recovery was comparable with thatreported by previous studies on different faunal groups in other tropical regions. Both communitiesconverged on primary habitat attributes during natural vegetation succession, the recovery beingdriven by deterministic, nonlinear changes in habitat characteristics. On the other hand, very littlefaunal recovery was seen even in relatively old teak plantation. In general, tree monocultures areunlikely to support recovery of natural forest communities and the combined effect of shortenedjhum cultivation cycles and plantation forestry could result in landscapes without mature forest.Lack of source pools of genetic diversity will then lead to altered vegetation succession and faunalcommunity reassembly. It is therefore important that the value of habitat mosaics containing evenpatches of primary forest and successional secondary habitats be taken into account.
Published: 06 August 2004
BMC Ecology 2004, 4:10 doi:10.1186/1472-6785-4-10
Received: 28 January 2004Accepted: 06 August 2004
This article is available from: http://www.biomedcentral.com/1472-6785/4/10
© 2004 Pawar et al; licensee BioMed Central Ltd. This is an open-access article distributed under the terms of the Creative Commons Attribution License (http://creativecommons.org/licenses/by/2.0), which permits unrestricted use, distribution, and reproduction in any medium, provided the original work is properly cited.
Page 1 of 18(page number not for citation purposes)
BMC Ecology 2004, 4:10 http://www.biomedcentral.com/1472-6785/4/10
BackgroundEvaluation of the importance of various processes deter-mining community structure and function is an impor-tant topic in ecology. Unlike just a decade or so ago, fewstudies today question whether or not community assem-bly is strictly random, recognizing the role of both sto-chastic and deterministic processes [1]. This change can beattributed to accumulating data on organisation in exper-imental and natural communities, and new perspectivesgained from the fields of evolutionary population ecologyand phylogenetics ([2] e.g., [3,4]). It is worth noting thatempirical tests for much of this theory have beenattempted relatively recently in experimental microcosmsresearch in particular, yielding valuable insights into therole of processes in driving long-term community dynam-ics [5].
This newfound view of community ecology is an excit-ingly realistic one, and has the potential to make valuablecontributions to conservation biology as well [6,7]. How-ever, though studies on long term dynamics of communi-ties are obviously important, they are extremely difficultto implement. A vast majority of field studies are restrictedto exploring correlates and predictors of species diversityand other emergent community properties. This is in partdue to the problems associated with studying complexnatural communities. But to a great extent, difficulties alsoarise because community ecology studies have tradition-ally been skewed towards relatively long-lived vertebrategroups, or are restricted to short study periods due tologistical constraints, especially in the tropics [8,9].Although these studies yield valuable information, theyare carried out at timescales that at best, give insight intoshort-term processes, providing limited informationabout community organization, persistence, or assembly.
Circumventing this problem is obviously very difficult.One possible approach is to study communities along gra-dients of habitat succession using space-for-time substitu-tion (SFT) to obtain chronosequential communities [10].Thus, instead of studying changes in a single communityover time, successional habitats of known ages that can bearranged on a temporal gradient are compared. Thismethod can reveal changes in community structure, envi-ronmental predictors of these changes, and provide esti-mates of the rate of community change [11-14]. Althoughmany studies have examined recovery of faunal commu-nities with tropical forest regeneration, a vast majorityhave been restricted to one or two vertebrate (birds, smallmammals) and invertebrate (ants, beetles) groups [10].For example, 19 of the 33 studies reviewed by Dunn [10],were on vertebrates, out of which only two were onamphibians and/or reptiles. Considering that amphibiansand reptiles are ectothermic and have life history traits dif-ferent from mammals and birds [9], more data on these
taxonomic groups is important to test the generality ofconclusions about effects of tropical habitat alteration onfauna.
This study takes an SFT approach to compare changes infrog and lizard community structure in two contrastinghabitat succession gradients: (a) 1-yr jhum fallows givingway to mature forest, and (b) 1-yr jhum fallows plantedover with teak, leading to monoculture stands. Slash-and-burn or shifting cultivation (jhum) agriculture involvesclearing and burning of forest patches, so the originalrainforest communities are effectively obliterated, andsuccession involves recovery of communities fromscratch. The following questions were addressed in thisstudy:
1. How much does frog and lizard community successiondiffer between the two gradients of habitat recovery?
2. Does composition of the entire community change insynchrony, or does the recovery pattern differ betweensubcommunities such as frogs vs. lizards and guilds?
3. What aspects of habitat change influence frog and lizardcommunity recovery, and if habitat parameters are linkedto niche axes, do they predict changes in guildcomposition?
4. Do successional changes in guilds also show trends inphylogenetic structure? This last question is expected toyield interesting insights into possible evolutionary mech-anisms underlying changes in community composition[15], but has not explicitly been addressed in previouswork on faunal recovery during tropical forest regenera-tion (cf. [10], and references therein).
In this paper, a chronosere is defined as a habitat that hasrecovered from perturbation for a known length of time,and can be assigned a place in the SFT. An assemblage isthe set of all species of a taxonomic group in a landscapeof interest. Ecological groups (EGs) are species' subsets ofthe assemblage with similar niche characteristics. Com-munities comprise species of the assemblage which sharea habitat stratum (i.e., chronosere) in the landscape.Guilds are members of the EGs that actually coexist in thesame chronosere i.e., belong to the same community, andare thus likely to have ecological and evolutionary interac-tions (cf. [16]).
To draw inferences about what aspects of habitat changedetermine sequential communities, habitat and frog-liz-ard community data were analysed hierarchically. As afirst step, species richness and turnover of frog and lizardcommunities along habitat recovery gradients was sum-marised, and the entire assemblage classified into
Page 2 of 18(page number not for citation purposes)

BMC Ecology 2004, 4:10 http://www.biomedcentral.com/1472-6785/4/10
ecological groups (EGs) based on niche similarities.Guilds identified from this classification were then exam-ined for phylogenetic structure. Using factor analysis,orthogonal combinations of variables that describedbiotic and abiotic aspects of habitat transition wereextracted. We then tested for correspondence betweenthese composite variables and composition of frogs andlizard communities and guilds. Based upon the relation-ships between different habitat factors and frog and lizardcommunities, variables were interpreted as compositeadaptive zones, and we tested whether they predicted suc-cessional changes at different levels of communityorganization.
Results and DiscussionGradients of vegetation recoveryTable 1 shows details of the chronosere sampling plots(see Additional file 2 for photographs of chronoseres).Both the 1-yr post-jhum fallows (plots jh1A and B) weredominated by herbaceous plants, tall grass, shrubs andwild bananas, along with saplings and surviving cropplants. The 4 to 5-yr post-jhum plot (jh5) was dominatedby almost homogeneous stands of the bamboo Melocannabaccifera, interspersed with a few shrubs and trees. Herbswere rare, and the understorey sparse. The 7 to 10-yr post-jhum plot (jh10) was very similar to jh5. However, herethe bamboo culms were more sparsely distributed, andalong with M. baccifera, two other bamboos- Dendrocala-mus longispathus and Bambusa tulda were in greater abun-dance, and woody plants were relatively more common.Compared to the other plots, a larger area was included inthe 30 to 35-yr jhum plot (jh35) because it contained agreater range of ages and hence perhaps more variability.Also, this was the only accessible site in the study area thatrepresented a chronosere aged between 30–50 years.Although M. baccifera was common, this site had a greaterabundance of other bamboos and trees than any of theprevious stages. Though most trees were small, woodyvegetation formed a significant part of the canopy. Herbsand shrubs were rare, and the understorey generallysparse.
The three mature forest plots (matA, B, and C) were ofuntraceable age (probably >100 years old; [12]). Theywere characterized by high tree density, canopy cover, anda sparse understorey with few herbs or true shrubs (nottree saplings). One of the sites (matA) was slightly dis-turbed by dead wood and palm leaf extraction, and had arelatively dense understorey in places. Bamboos weremainly restricted to moist gullies, and occasionally in theunderstorey.
The 4-yr teak plot (tk4) was a young plantation character-ized by a monodominant stand of teak trees. The under-storey was sparse, with some tall grass, shrubs (mainly
Lantana camara) and occasional herbs. The 22-yr teakplantation site (tk22) had a monotonous, uniform struc-ture characteristic of a mature, managed teak monocul-ture. Undergrowth was sparse, consisting mostly of tallgrass and Lantana sp. Table 2 summarises differences infour habitat parameters that show broad contrastsbetween chronoseres. These results are very similar tothose of a another study in the same region [12]. For thepurposes of these comparisons, data for the two undis-turbed mature forest plots matB and matC are presentedtogether because they are were very similar in macrohabi-tat characteristics.
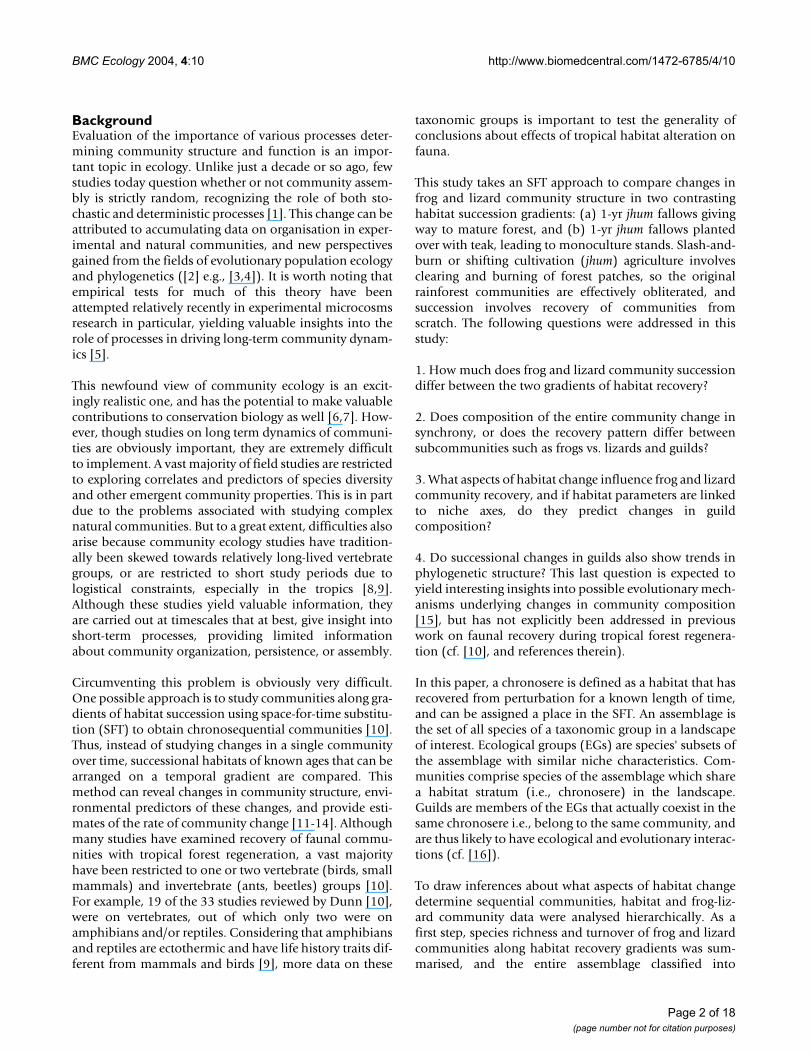
Eight factors were extracted after Principal ComponentAnalysis (PCA), and by Varimax rotation of the factorstructure, which explained a cumulative 85.8% of the var-iation (see methods). Eigenvalues, factor loadings andfactor scores are given in Additional file 3. The ordinationof the sampling plots based on scores of the first two PCAfactors is shown in Figure 1. This ordination was very sim-ilar to one obtained by non-metric multidimensionalscaling (NMDS) [17]. The two gradients of vegetationrecovery have very different trajectories of change in hab-itat attributes. The predominant macro-habitat character-istic along the factor 1 axis is high bamboo abundance,while high positive loading on the factor 2 axis indicatestree-forest dominated habitat. The gradient towardsmature forest succession includes intermediate stagesdominated by bamboo, which are succeeded by a treedominated forest.
In general, although there is a change towards a tree dom-inated habitat in both recovery gradients, the end result isvery different because the 22 year teak plantation is amonoculture, whereas the mature forest consists of adiverse tree community.
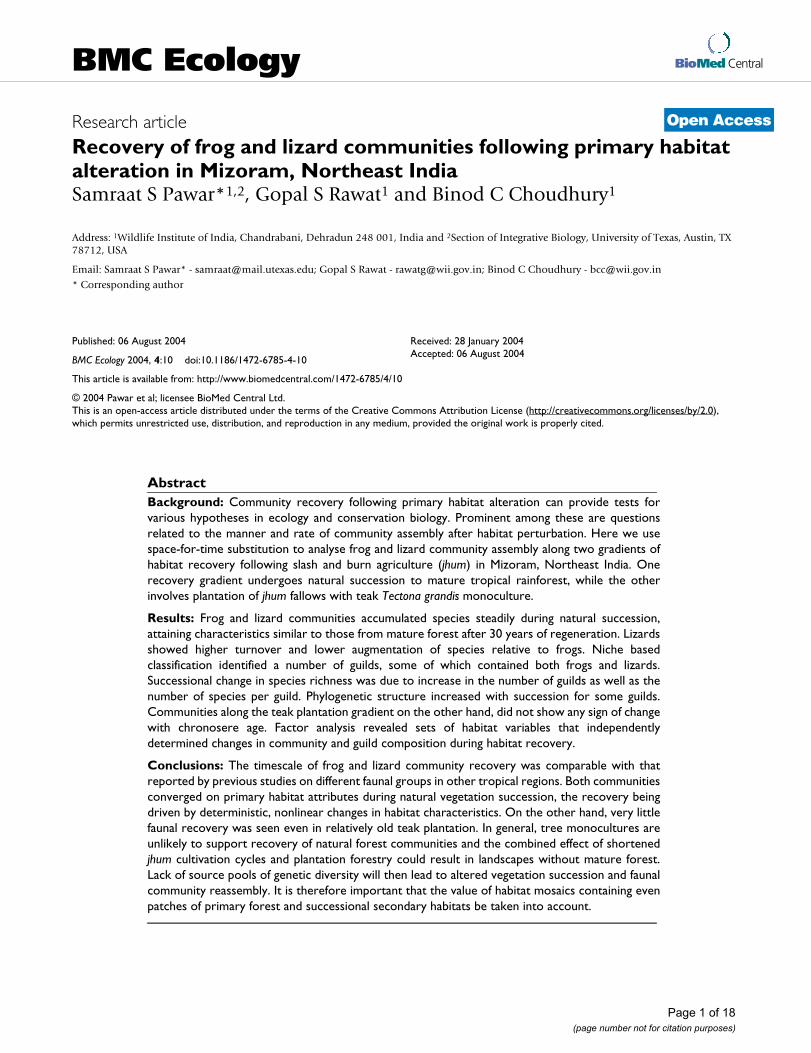
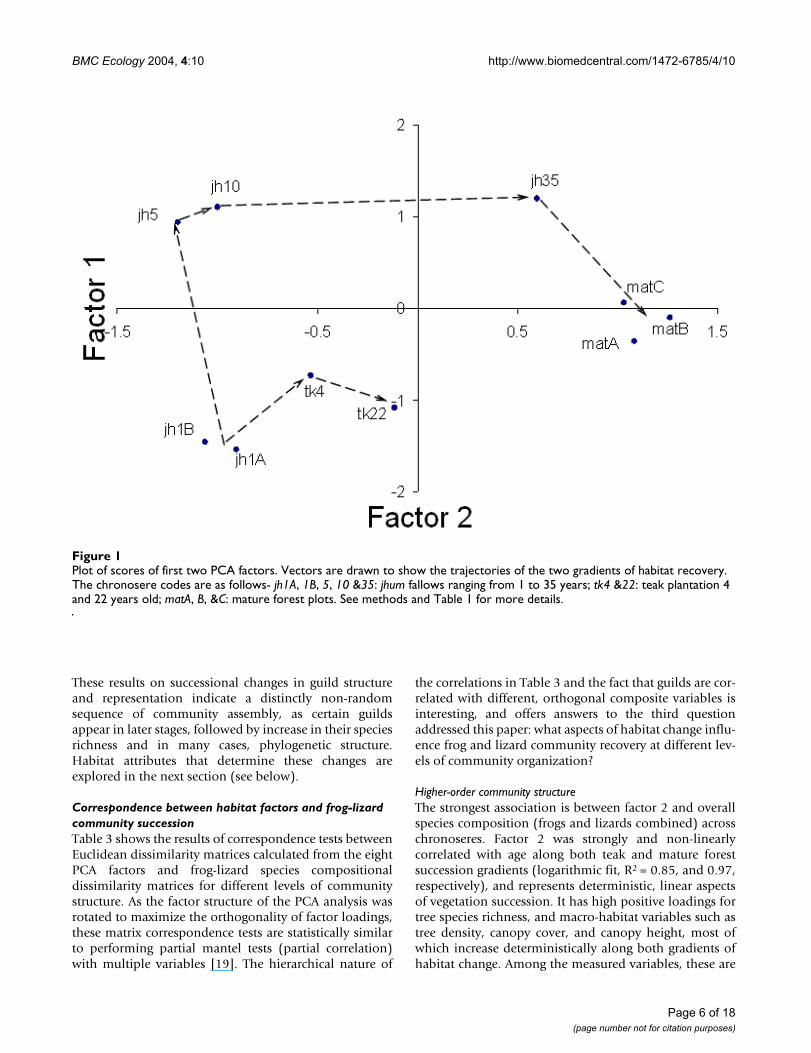
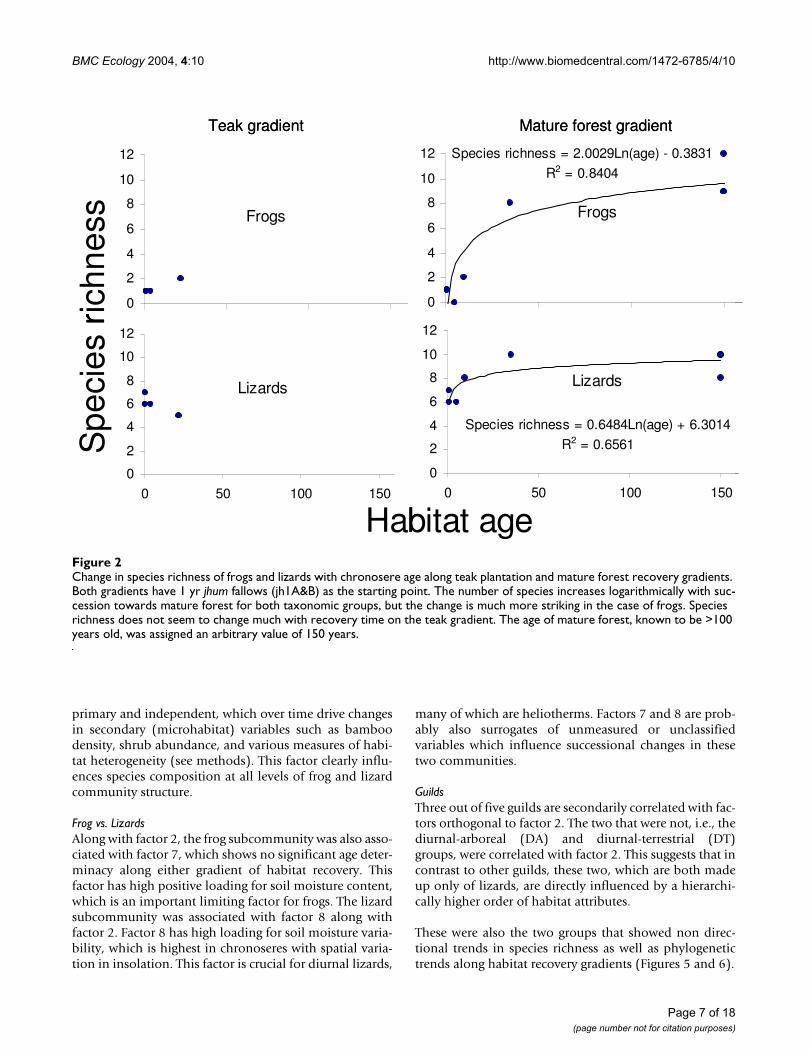
Successional changes in frog and lizard communitiesThe three sampling techniques used in conjunction dur-ing the study (see methods) yielded sixteen frog and sev-enteen lizard species. Figure 2 shows changes in speciesrichness, and Figure 3 differences in community composi-tion for frogs and lizards along the two recovery gradients.Clearly, there are distinct similarities in overall commu-nity composition between the early jhum fallows and teakplantation communities on one hand, and the mature for-est and the 35 year jhum fallows on the other.
The pattern of recovery is very different for the two gradi-ents. For the mature forest succession gradient, the rate offrog and lizard community recovery is similar to thatfound for birds by Raman [12] in the same region inNortheast India, with the community approachingmature forest characteristics after about 30 years. Evenmore remarkably, this timescale is also comparable with
Page 3 of 18(page number not for citation purposes)

BMC Ecology 2004, 4:10 http://www.biomedcentral.com/1472-6785/4/10
those reported by similar studies on other fauna elsewherein the tropics [10]. The gradient from jhum to mature teakplantations on the other hand, seems to show littlechange in species richness or composition even after 22years of plantation growth.
It is worth noting that there are dissimilarities in the man-ner of species accumulation for frogs vs. lizards. There ismuch less augmentation of species number in the case ofthe latter, the main reason for this being that youngerchronoseres support more lizard than frog species rich-ness. Species accumulation curves (see Additional file 4)show that these differences are not sampling artefacts.Moreover, across chronosere species turnover (see meth-ods) for lizards is significantly higher than that for frogs(Student's t-test, two tail p < 0.05), indicating that lizardcommunity succession was characterized by relativelyhigh replacement and low accumulation of species.
GuildsEcological groups defined by non-metric multidimen-sional scaling (NMDS) of the niche based dissimilaritymatrix for the entire assemblage are shown in Figure 4.The NMDS configuration was derived in 2 dimensionswith low stress and high RSQ values, indicating a verygood representation of actual niche dissimilarities [18].On dimension 1, the dominant niche characteristic deter-mining high negative loadings is arboreality, and highpositive values indicate that the species is predominantlyterrestrial. On dimension 2, higher positive values indi-cate predominantly diurnal diel activity pattern, and neg-ative values indicate crepuscular and/or nocturnal activitypattern. Identities of species in each group are in Addi-tional file 4. Of the five EGs, two consist of both frogs andlizards: the nocturnal arboreal (NA) group with eight spe-cies of frogs (mostly tree frogs) and four species of lizards(all gekkonid lizards), and the crepuscular-nocturnal ter-restrial (CT) group, which consists of seven frogs and onecrepuscular-nocturnal lizard. The diurnal arboreal group
(DA) consists of five agamid lizards, some of whom areoccasionally terrestrial. The diurnal terrestrial (DT) groupconsists of six skinks and one lacertid lizard. Moredetailed natural history descriptions of these species canbe found in Pawar [17].
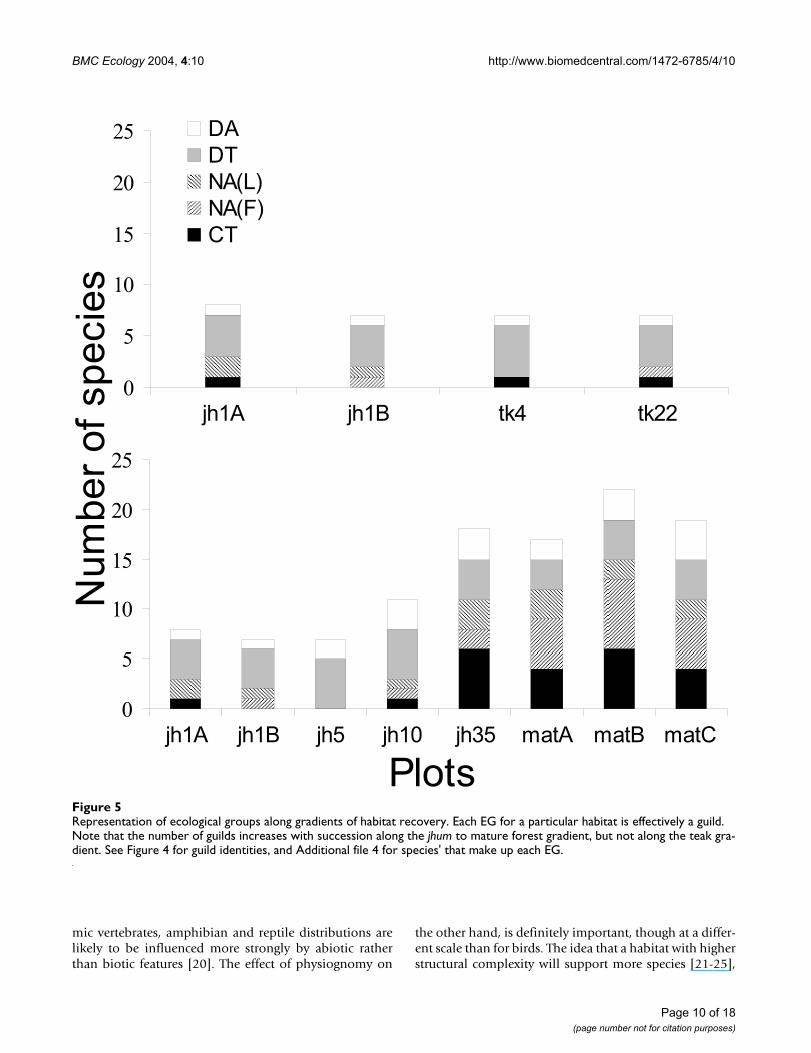
Figure 5 shows how EGs are represented along the tworecovery gradients. In this paper, representatives of eachEG in a sampling plot are considered guilds of that chron-osere. Clearly, the number of guilds as well as number ofspecies per guild increases with succession along the gra-dient leading to mature forest, but not along the one lead-ing to teak monoculture. The species accumulation duringnatural forest succession is mainly due to augmentation ofcrepuscular and nocturnal guilds. It is also worth notingthat the DT and DA groups, which are consistently presentalong both gradients of recovery, also have the maximumniche overlap (distance between pairs of species is thesmallest for these groups in the NMDS niche space). Theimplication of this fact is discussed below. It is due tothese two guilds that successional lizard communitiesshow the high species turnover and low accumulationnoted above.
Phylogenetic structureFigure 6 shows the ratio of species to genera (S/G ratio) ofguilds in different chronoseres. The S/G ratio increasedwith succession towards mature forest in the NA guild,and to a lesser extent, in the CT guild. The S/G ratio of theNA, DT and DA guilds was variable, and did not changedirectionally with habitat recovery. In general, across allchronoseres irrespective of which recovery gradient theybelonged to, the number of guilds represented in eachchronosere was positively correlated with phylogeneticstructure (S/G ratio averaged across guilds; Spearman R =0.92, p < 0.0002) and the species richness of the chron-osere (R = 0.88, p < 0.01). This suggests that the ability ofchronoseres to support a larger number of guilds predictsspecies number as well as phylogenetic structure.
Table 1: Details of sampling plots. Plot ages were determined by consultation with local people. The labels in the first column are used to identify plots throughout the rest of the paper.
Plot Details Size (ha.)
jh1A 1 year jhum fallows, cultivated and abandoned in 1998 3–4jh1B 1 year jhum fallows, cultivated and abandoned in 1998 3–4jh5 Two adjoining, indistinguishable 4–5 year jhum fields cultivated and abandoned in 1994 & 1996 respectively 4–6jh10 Three adjoining, indistinguishable 7–10 year jhum fields cultivated and abandoned between 1988 & 1991 4–6jh35 Five adjoining, indistinguishable 30–35 year post-jhum fields cultivated and abandoned between 1963 & 1969 8–10tk4 4 year old teak plantation, planted in 1994 3–4tk 22 Subset of a 22 year old teak plantation, planted in 1977 4–6matA Subset of slightly disturbed contiguous mature forest 4–6matB Subset of undisturbed contiguous mature forest 4–6matC Subset of undisturbed contiguous mature forest 4–6
Page 4 of 18(page number not for citation purposes)

BMC Ecology 2004, 4:10 http://www.biomedcentral.com/1472-6785/4/10
Table 2: Differences in four macro-habitat parameters across plots. All variables were normally distributed, but not homoscedastic (Levene's test, p < 0.001), so Tamhane's T2 (a conservative pair wise comparisons test based on a t test) was used as a post-hoc multiple range test (F ⇒ F-ratio of one-way parametric ANOVA; ** ⇒ p < .005; * ⇒ p < .05; – ⇒ Not significant;).
(a) Tree density (F = 79.232)
Plot Mean / 250 m2 ± S.E. jh1A&B jh5 jh10 tk4 tk22 jh35 matA
jh1A&B 00.41 ± 0.26jh5 01.52 ± 0.96 -
jh10 03.38 ± 0.95 - -tk4 34.05 ± 3.04 ** ** **
tk22 24.45 ± 0.87 ** ** ** **jh35 15.32 ± 1.30 ** ** ** ** **
matA 27.67 ± 2.05 ** ** ** - - **matB+C 20.33 ± 1.76 ** ** ** ** - - -
(c) Bamboo culm density (F = 194.30)
Plot Mean / 25 m2 ± S.E. jh1A&B jh5 jh10 tk4 tk22 jh35 matA
jh1A&B 00.00jh5 96.36 ± 5.05 **
jh10 62.86 ± 4.85 ** **tk4 00.00 - ** **
tk22 00.00 - ** ** -jh35 30.26 ± 3.85 ** ** ** ** **
matA 00.01 ± 0.21 - ** ** - - **matB+C 01.14 ± 0.15 - ** ** - - ** -
(b) Canopy cover (F = 139.38)
Plot Mean (%) ± S.E. jh1A&B jh5 jh10 tk4 tk22 jh35 matA
jh1A&B 12.07 ± 1.67jh5 67.91 ± 2.79 **
jh10 69.79 ± 1.71 ** -tk4 37.25 ± 2.58 ** ** **
tk22 51.33 ± 4.61 ** ** ** **jh35 76.70 ± 1.62 ** - - ** **
matA 72.64 ± 2.03 ** - - ** ** -matB+C 80.68 ± 1.86 ** ** * ** ** - -
(d) Shrub density (F = 12.21)
Plot Mean / 25 m2 ± S.E. jh1A&B jh5 jh10 tk4 tk22 jh35 matA
jh1A&B 25.85 ± 2.86jh5 25.59 ± 3.31 -
jh10 19.58 ± 2.29 - -tk4 11.28 ± 1.19 ** - -
tk22 13.99 ± 2.08 ** - - -jh35 27.58 ± 3.21 - - - * -
matA 45.24 ± 4.26 ** ** ** ** ** *matB+C 39.37 ± 4.04 * - ** ** ** - -
Page 5 of 18(page number not for citation purposes)
BMC Ecology 2004, 4:10 http://www.biomedcentral.com/1472-6785/4/10
These results on successional changes in guild structureand representation indicate a distinctly non-randomsequence of community assembly, as certain guildsappear in later stages, followed by increase in their speciesrichness and in many cases, phylogenetic structure.Habitat attributes that determine these changes areexplored in the next section (see below).
Correspondence between habitat factors and frog-lizard community successionTable 3 shows the results of correspondence tests betweenEuclidean dissimilarity matrices calculated from the eightPCA factors and frog-lizard species compositionaldissimilarity matrices for different levels of communitystructure. As the factor structure of the PCA analysis wasrotated to maximize the orthogonality of factor loadings,these matrix correspondence tests are statistically similarto performing partial mantel tests (partial correlation)with multiple variables [19]. The hierarchical nature of
the correlations in Table 3 and the fact that guilds are cor-related with different, orthogonal composite variables isinteresting, and offers answers to the third questionaddressed this paper: what aspects of habitat change influ-ence frog and lizard community recovery at different lev-els of community organization?
Higher-order community structureThe strongest association is between factor 2 and overallspecies composition (frogs and lizards combined) acrosschronoseres. Factor 2 was strongly and non-linearlycorrelated with age along both teak and mature forestsuccession gradients (logarithmic fit, R2 = 0.85, and 0.97,respectively), and represents deterministic, linear aspectsof vegetation succession. It has high positive loadings fortree species richness, and macro-habitat variables such astree density, canopy cover, and canopy height, most ofwhich increase deterministically along both gradients ofhabitat change. Among the measured variables, these are
Plot of scores of first two PCA factorsFigure 1Plot of scores of first two PCA factors. Vectors are drawn to show the trajectories of the two gradients of habitat recovery. The chronosere codes are as follows- jh1A, 1B, 5, 10 &35: jhum fallows ranging from 1 to 35 years; tk4 &22: teak plantation 4 and 22 years old; matA, B, &C: mature forest plots. See methods and Table 1 for more details.
Page 6 of 18(page number not for citation purposes)
BMC Ecology 2004, 4:10 http://www.biomedcentral.com/1472-6785/4/10
primary and independent, which over time drive changesin secondary (microhabitat) variables such as bamboodensity, shrub abundance, and various measures of habi-tat heterogeneity (see methods). This factor clearly influ-ences species composition at all levels of frog and lizardcommunity structure.
Frog vs. LizardsAlong with factor 2, the frog subcommunity was also asso-ciated with factor 7, which shows no significant age deter-minacy along either gradient of habitat recovery. Thisfactor has high positive loading for soil moisture content,which is an important limiting factor for frogs. The lizardsubcommunity was associated with factor 8 along withfactor 2. Factor 8 has high loading for soil moisture varia-bility, which is highest in chronoseres with spatial varia-tion in insolation. This factor is crucial for diurnal lizards,
many of which are heliotherms. Factors 7 and 8 are prob-ably also surrogates of unmeasured or unclassifiedvariables which influence successional changes in thesetwo communities.
GuildsThree out of five guilds are secondarily correlated with fac-tors orthogonal to factor 2. The two that were not, i.e., thediurnal-arboreal (DA) and diurnal-terrestrial (DT)groups, were correlated with factor 2. This suggests that incontrast to other guilds, these two, which are both madeup only of lizards, are directly influenced by a hierarchi-cally higher order of habitat attributes.
These were also the two groups that showed non direc-tional trends in species richness as well as phylogenetictrends along habitat recovery gradients (Figures 5 and 6).
Change in species richness of frogs and lizards with chronosere age along teak plantation and mature forest recovery gradientsFigure 2Change in species richness of frogs and lizards with chronosere age along teak plantation and mature forest recovery gradients. Both gradients have 1 yr jhum fallows (jh1A&B) as the starting point. The number of species increases logarithmically with suc-cession towards mature forest for both taxonomic groups, but the change is much more striking in the case of frogs. Species richness does not seem to change much with recovery time on the teak gradient. The age of mature forest, known to be >100 years old, was assigned an arbitrary value of 150 years.
0
2
4
6
8
10
12 Species richness = 2.0029Ln(age) - 0.3831
R2 = 0.8404
0
2
4
6
8
10
12
Species richness = 0.6484Ln(age) + 6.3014
R2 = 0.6561
0
2
4
6
8
10
12
0 50 100 1500
2
4
6
8
10
12
0 50 100 150
Habitat age
Spe
cies
ric
hnes
s Frogs
Lizards
Frogs
Lizards
Teak gradient Mature forest gradient
0
2
4
6
8
10
12 Species richness = 2.0029Ln(age) - 0.3831
R2 = 0.8404
0
2
4
6
8
10
12
Species richness = 0.6484Ln(age) + 6.3014
R2 = 0.6561
0
2
4
6
8
10
12
0 50 100 1500
2
4
6
8
10
12
0 50 100 150
Habitat age
Spe
cies
ric
hnes
s Frogs
Lizards
Frogs
Lizards
Teak gradient Mature forest gradient
Page 7 of 18(page number not for citation purposes)
BMC Ecology 2004, 4:10 http://www.biomedcentral.com/1472-6785/4/10
Along with factor 2, the crepuscular-nocturnal terrestrial(CT) group was correlated with factor 1 and 4. Factor 1scores increase and then decrease with plot age along bothhabitat recovery gradients (2nd order polynomial fit, R2=0.99, and 0.82, respectively). This factor had high loading(defined as ≥ ± 0.65; see Additional file 3) positive forboth macro- and micro-habitat variables such as bamboodensity canopy cover, leaf litter cover and depth andnegative loadings for many habitat heterogeneity varia-bles such as CVs of canopy cover and litter cover. Thesevariables are interpretable as ones that are associated with,or influence ground microhabitat conditions. Factor 4decreased logarithmically with age along both teak andmature forest gradients (R2 = 0.62, and 0.34, respectively).This factor had no strong loadings, but is associated withshrub density, canopy height variability and tree density,all of which also affect ground cover, and can be consid-ered macrohabitat variables.
The nocturnal arboreal frog group (NA(F)), was correlatedwith factor 7, which is non-deterministic with respect tochronosere age. This factor as a high loading for soil mois-ture, which by itself is difficult to interpret as a variabledirectly affecting this ecomorphological group. It is likelythat this factor is a surrogate for an unmeasured or unclas-sified variable. Lastly, the nocturnal arboreal lizard group(NA(L)) is correlated with factor 8 along with factor 2.Factor 8 shows a weak negative linear relationship withrecovery age along both gradients gradient (R2 = 0.209and 0.18 for teak and mature forest gradients, respec-tively). It has high positive loading for CV of soil mois-ture, which as mentioned above, is highest in chronosereswith spatial and/or temporal variation in insolation.Among the measured variables, factor 2 probably sub-sumes most habitat parameters that affect both NA groupsdirectly (see next section).
Dendrogram of similarities in frog and lizard (combined) communities across plotsFigure 3Dendrogram of similarities in frog and lizard (combined) communities across plots. See text for explanation. Community over-lap was calculated with the Bray-Curtis measure, and sites clustered using the UPGMA algorithm.
Linkage Distance
matB
matA
matC
jh35
jh10
tk4
jh5
tk22
jh1B
jh1A
0.0 0.1 0.2 0.3 0.4 0.5 0.6 0.7 0.8
Page 8 of 18(page number not for citation purposes)

BMC Ecology 2004, 4:10 http://www.biomedcentral.com/1472-6785/4/10
Adaptive zones?Can biologically meaningful adaptive zones be inter-preted from these associations? As each factor is orthogo-nal with respect to the others, factors subsume differenthabitat variables, or their variability in the same variable.Note that the composite variable represented by eachfactor consists of negative as well as positive loadings ofvariables. This means that if a guild was associated with afactor, both positive and negative trends in different vari-ables affected it simultaneously, together representing acomposite adaptive zone. However, an important fact toconsider here is that these "adaptive zones" thus identi-fied may actually be surrogates for actual sets of unmeas-ured variables. Raman [12] inferred that floristics (treespecies composition) and physiognomy (vertical stratifi-cation) were the dominant habitat attributes that inde-
pendently predicted changes in bird species compositionat the level of communities, but not at much at the levelof guilds. In the case of frogs and lizards, factor 2, whichincludes a measure of floristic attributes (tree speciesdiversity), is a strong predictor of frog and lizard commu-nity composition at all levels. But factor 2 also includesnumerous structural attributes that are correlated with treespecies diversity, from canopy height to understorey andground habitat structure, all of which have equal or higherpositive loadings. Also, Figure 7 shows that understoreyhabitat complexity increases with post-jhum successiontowards mature forest.
Thus, it is difficult to infer the extent to which tree speciesdiversity per se influences frog and lizard communitystructure. Previous work has shown that unlike endother-
NMDS configuration showing ecological groups (EGs) of frogs and lizards in the assemblageFigure 4NMDS configuration showing ecological groups (EGs) of frogs and lizards in the assemblage. Each point represents a species. For this configuration, stress = 0.14712 and RSQ =.90076 [17]. Broad characteristics of EGs are as follows: DA= Diurnal, arbo-real; NA(L)= Nocturnal, arboreal, all lizards; NA(F)= Nocturnal, arboreal, all frogs; CT= Crepuscular-nocturnal, terrestrial; DT= Diurnal, terrestrial. See Additional file 4 for EG species' identities.
-2
-1
0
1
2
-2 -1 0 1 2
Dimension 1
Dim
ensio
n 2
DA
DT
NA(L)
CT
NA(F)
NA
Diurnal Nocturnal
Terr
estr
ial
Arb
ore
al
Page 9 of 18(page number not for citation purposes)
BMC Ecology 2004, 4:10 http://www.biomedcentral.com/1472-6785/4/10
mic vertebrates, amphibian and reptile distributions arelikely to be influenced more strongly by abiotic ratherthan biotic features [20]. The effect of physiognomy on
the other hand, is definitely important, though at a differ-ent scale than for birds. The idea that a habitat with higherstructural complexity will support more species [21-25],
Representation of ecological groups along gradients of habitat recoveryFigure 5Representation of ecological groups along gradients of habitat recovery. Each EG for a particular habitat is effectively a guild. Note that the number of guilds increases with succession along the jhum to mature forest gradient, but not along the teak gra-dient. See Figure 4 for guild identities, and Additional file 4 for species' that make up each EG.
0
5
10
15
20
25
jh1A jh1B jh5 jh10 jh35 matA matB matC
Plots
0
5
10
15
20
25
jh1A jh1B tk4 tk22
DA
DT
NA(L)
NA(F)
CT
Nu
mb
er
of
sp
ecie
s
Page 10 of 18(page number not for citation purposes)

BMC Ecology 2004, 4:10 http://www.biomedcentral.com/1472-6785/4/10
and have a strong influence on re-colonisation success[26], has been shown for amphibians and reptiles (but see[27]). It can therefore be inferred that factor 2 subsumesnested subsets of biotic and abiotic variables that directlyaffect the (mean) fitnesses of species' populations in dif-ferent guilds. Also, it is clear that guilds are also associatedwith other, independent variables sets that can be
considered to comprise additional aspects of each mem-ber species' adaptive zone.
Factors 3, 5, and 6 showed no significant association withany level of community composition. The obvious reasonfor this appears to be that unlike other factors, these arecompletely non-deterministic with respect to age of suc-
Trends in phylogenetic structure (species/genus ratio) in five guilds across chronoseresFigure 6Trends in phylogenetic structure (species/genus ratio) in five guilds across chronoseres. An "x" indicates that a guild is absent. The S/G ratio increases with time of habitat recovery in the nocturnal guilds, but not for the diurnal guilds. See text for discussion.
Table 3: Correlation between dissimilarity matrices based on eight PCA factors (unsquared Euclidean distances), and different levels of community organisation (Jaccard's index). The correlation coefficients are followed by significance (p) values in parentheses. The p-values were estimated by 1000 Monte Carlo randomizations of each pair of matrices. Correlations with p values >0.05 not reported. See the text and Additional file 3 to see loadings of habitat variables for the PCA factors.
Community/guild Factor 1 Factor 2 Factor 3 Factor 4 Factor 5 Factor 6 Factor 7 Factor 8
Frogs + Lizards 0.762 (0.003)Frogs 0.5031 (0.003) 0.467 (0.019)
Lizards 0.672 (0.005) 0.375 (0.033)CT 0.331 (0.035) 0.417 (0.016) 0.402 (0.016)DA 0.630 (0.008)DT 0.608 (0.003)
NA(F) 0.347 (0.025) 0.482 (0.037)NA(L) 0.362 (0.004) 0.417 (0.030)
0
0.5
1
1.5
2
2.5
3
3.5
jh1A jh1B jh5 jh10 tk4 tk22 jh35 matA matB matC
Plots
Specie
s/G
enus r
atio CT NA(F) NA(L) DT DA
x x xx xx xx
Page 11 of 18(page number not for citation purposes)

BMC Ecology 2004, 4:10 http://www.biomedcentral.com/1472-6785/4/10
The relationship between transect sampling time and habitat complexityFigure 7The relationship between transect sampling time and habitat complexity. The NAW time varies across habitat, and increases with habitat complexity, whereas DAW is constant. The reason for this is that more complex habitats needed more searching time. The index of complexity was calculated by summing the coefficients of variance for various understorey habitat structure variables. Sample sizes of transects were: jh1A = 15, jh1B = 13, jh5 = 14, jh10 = 16, tk4 = 15, tk22 = 15, jh35 = 38, matA = 17, matB = 28, matC = 21.
R2 = 0.7048
0
10
20
30
40
50
60
5 7 9 11 13 15
Habitat complexity
DA
W
R2 = 0.826
0
10
20
30
40
50
60
NA
W
Mean t
ime s
pent
(min
ute
s)
Page 12 of 18(page number not for citation purposes)
BMC Ecology 2004, 4:10 http://www.biomedcentral.com/1472-6785/4/10
cession, thus representing temporally and/or spatially sto-chastic attributes that were unlikely to show any influenceon the conspicuously deterministic nature of frog and liz-ard community and guild (except for the DT and DAgroups) succession (See Figures 2,3,5 and 6). At this reso-lution, it is impossible to say whether these variables areadaptively significant for certain subgroups/species offrogs and lizards or not. Nevertheless, this complex,nested pattern of these alleged adaptive zones, isecologically realistic (see [28]). Although difficult to inter-pret at this level of resolution, this hierarchical partition-ing of variables is an indicator of which attributes ofhabitat change influence community assembly and turno-ver with such gradients of vegetation succession.
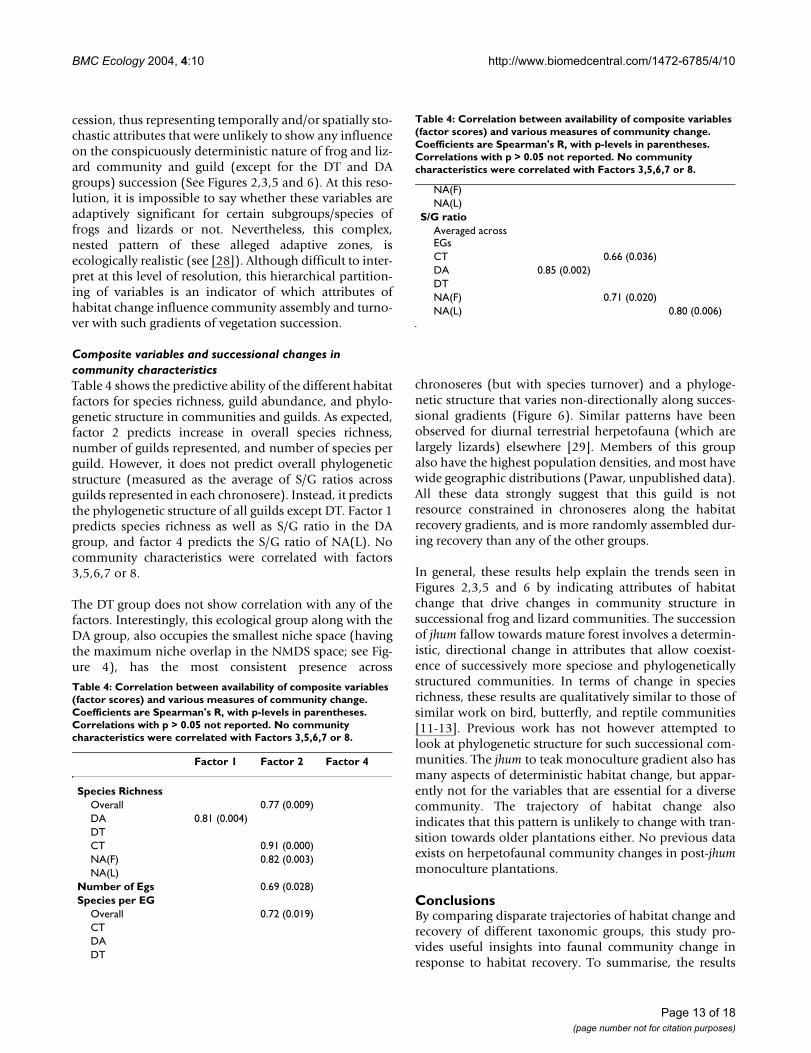
Composite variables and successional changes in community characteristicsTable 4 shows the predictive ability of the different habitatfactors for species richness, guild abundance, and phylo-genetic structure in communities and guilds. As expected,factor 2 predicts increase in overall species richness,number of guilds represented, and number of species perguild. However, it does not predict overall phylogeneticstructure (measured as the average of S/G ratios acrossguilds represented in each chronosere). Instead, it predictsthe phylogenetic structure of all guilds except DT. Factor 1predicts species richness as well as S/G ratio in the DAgroup, and factor 4 predicts the S/G ratio of NA(L). Nocommunity characteristics were correlated with factors3,5,6,7 or 8.
The DT group does not show correlation with any of thefactors. Interestingly, this ecological group along with theDA group, also occupies the smallest niche space (havingthe maximum niche overlap in the NMDS space; see Fig-ure 4), has the most consistent presence across
chronoseres (but with species turnover) and a phyloge-netic structure that varies non-directionally along succes-sional gradients (Figure 6). Similar patterns have beenobserved for diurnal terrestrial herpetofauna (which arelargely lizards) elsewhere [29]. Members of this groupalso have the highest population densities, and most havewide geographic distributions (Pawar, unpublished data).All these data strongly suggest that this guild is notresource constrained in chronoseres along the habitatrecovery gradients, and is more randomly assembled dur-ing recovery than any of the other groups.
In general, these results help explain the trends seen inFigures 2,3,5 and 6 by indicating attributes of habitatchange that drive changes in community structure insuccessional frog and lizard communities. The successionof jhum fallow towards mature forest involves a determin-istic, directional change in attributes that allow coexist-ence of successively more speciose and phylogeneticallystructured communities. In terms of change in speciesrichness, these results are qualitatively similar to those ofsimilar work on bird, butterfly, and reptile communities[11-13]. Previous work has not however attempted tolook at phylogenetic structure for such successional com-munities. The jhum to teak monoculture gradient also hasmany aspects of deterministic habitat change, but appar-ently not for the variables that are essential for a diversecommunity. The trajectory of habitat change alsoindicates that this pattern is unlikely to change with tran-sition towards older plantations either. No previous dataexists on herpetofaunal community changes in post-jhummonoculture plantations.
ConclusionsBy comparing disparate trajectories of habitat change andrecovery of different taxonomic groups, this study pro-vides useful insights into faunal community change inresponse to habitat recovery. To summarise, the results
Table 4: Correlation between availability of composite variables (factor scores) and various measures of community change. Coefficients are Spearman's R, with p-levels in parentheses. Correlations with p > 0.05 not reported. No community characteristics were correlated with Factors 3,5,6,7 or 8.
Factor 1 Factor 2 Factor 4
Species RichnessOverall 0.77 (0.009)DA 0.81 (0.004)DTCT 0.91 (0.000)NA(F) 0.82 (0.003)NA(L)
Number of Egs 0.69 (0.028)Species per EG
Overall 0.72 (0.019)CTDADT
NA(F)NA(L)
S/G ratioAveraged across EGsCT 0.66 (0.036)DA 0.85 (0.002)DTNA(F) 0.71 (0.020)NA(L) 0.80 (0.006)
Table 4: Correlation between availability of composite variables (factor scores) and various measures of community change. Coefficients are Spearman's R, with p-levels in parentheses. Correlations with p > 0.05 not reported. No community characteristics were correlated with Factors 3,5,6,7 or 8.
Page 13 of 18(page number not for citation purposes)
BMC Ecology 2004, 4:10 http://www.biomedcentral.com/1472-6785/4/10
show that (1) The two gradients of habitat recovery arevery different and accordingly affect frog and lizard com-munity assembly differently, (2) Although both groupsincreased in species richness with habitat recovery, lizardshad higher species turnover, combined with lower speciesaugmentation within each recovery gradient (3) Lookingat a finer scale of community organization, assemblyappears to be driven by changes in guild representationand composition, where some guilds change directionallywith age of habitat recovery by species augmentation,while others change by species turnover (4) Guilds thatshowed directional increase in species richness alsoincreased in phylogenetic structure (5) Hierarchies ofcommunity organisation were affected by composite,nested habitat attributes that correspond to particularniche axes, and (6) the increase in species richness alongthe mature forest gradient in contrast to lack of changealong the teak gradient was due to availability (or lackthereof) of variables that comprise these complex adap-tive zones. Also, the results show that a niche-based guildclassification reveals patterns that would have beenhidden in the gross response pattern of the entirecommunity.
Some indication of the qualitative nature of potential evo-lutionary and ecological processes in community turnovercomes from the fact that changes in phylogenetic structureare tied to guild structure in the communities. Using phy-logenetic techniques, recent work has demonstrated theimportance of evolutionary adaptation in assembling eco-logical communities [4]. It is clear that specialisation ondifferent subsets of resources, in a habitat drive the originand as well as persistence of diversity [30]. Frogs and liz-ards have incongruent patterns of community succession,mainly because they generally differ in fundamental nichedimensions axes such as diel activity [31]. However,although most lizards are diurnal and most frogs noctur-nal, there are many sub-lineages that are an exception,and species do share niche space transcending taxonomicboundaries (ecological groups in this paper). Such sub-groups probably have congruent ecological and evolu-tionary dynamics.
It is an open question as to what extent vegetation succes-sion leads to changes in the number of adaptive peaks andcorresponding changes in mean fitnesses of species' pop-ulations such that multiple species can persist in the samehabitat. In more ecological terms this is same as askinghow habitat succession leads to changes in niche availa-bility, occupancy, and overlap (due to character displace-ment, for example). Another related question, that waspartly explored using the S/G ratios in this paper, iswhether similar adaptive zones (or niches or adaptivepeaks) tend to be occupied by more closely related taxa.The results here do indicate that this may be true for such
gradients of community change, as phylogenetic andguild structure increase directionally and in tandem withsuccession towards mature forest. Whether this change isdriven by immigration from the regional gene pool or dueto local divergent adaptation is an interesting question[15]. Reptiles, and to a greater extent amphibians, havelimited dispersal ability compared to most vertebrates.This distinction in itself may drive differences in localadaptation and community assembly from other bioticgroups.
Conservation issuesThe time scale of recovery on the jhum-rainforest succes-sion gradient, which is about 30 years for both frogs andlizards, and suggests that recovery of diverse communitiescan be relatively fast, as has been reported for other fauna[10]. However, this pattern of community recovery (or re-assembly) is tightly coupled to changes in certain sets ofhabitat attributes, which in turn are dependent upon veg-etation succession wherein post-jhum chronoseres aregradually replaced by trees. This vegetation succession isobviously reliant on seed rain/dispersal from nearbymature forests. In this region and many other areas South-east Asia, apart from continued pressure from shifting cul-tivation and shortening cultivation cycles, it has alsobecome popular practice to plant and maintain monocul-tures of timber species. As the results of this study indi-cate, such plantations are unlikely to support naturalrecovery of faunal communities, and will harbour lowerbiological diversity compared to primary forest.
It is possible that the combined effects of short jhumcycles, plantation forestry and invasion by non-native spe-cies such as Lantana and Eupatorium will lead to the localextirpation of even remnant forest patches. This loss ofrecolonisation pools for flora and fauna, will alter naturaltrajectories of succession, and strongly impact the biolog-ical diversity supported by the landscape. It is thereforeimportant that conservation and prioritisation agencies inthese areas consider the value of habitat mosaics contain-ing even small patches of primary forest vegetation.
MethodsThe study was carried out from November 1998 to April1999 in and around Ngengpui Wildlife Sanctuary (WLS;21°56'N – 24°31'N and 92°16'E – 93°26'E) in southMizoram, Northeast India. The study area covers about200 sq. km. (see Additional file 1 for maps). A combina-tion of high annual precipitation and temperature, andlow elevation supports a predominantly tropical ever-green [32] climax vegetation in the area. Shifting cultiva-tion is the primary mode of agriculture here. While mostof the area within Ngengpui WLS is mature or primary for-est, the surrounding areas are a mosaic of bamboo-domi-nated sites, mature forest fragments, teak Tectona grandis
Page 14 of 18(page number not for citation purposes)
BMC Ecology 2004, 4:10 http://www.biomedcentral.com/1472-6785/4/10
plantations and abandoned shifting cultivation (jhum)fallows of varying ages. All primary forest is referred to as"mature forest" throughout the paper because it is oftendifficult to determine the age of ostensibly primary tropi-cal forest, especially in areas with poorly known history ofland use and recovery [12,33]. Further details andsupporting literature about the geology, vegetation, andland use patterns in the study area can be found in Pawar[17].
Sampling plotsTen sampling plots representing mature and successionalvegetation stages of known ages were established [17](Table 1). To control for recolonisation potential, all sec-ondary plots were selected such that at least 50% of theperimeter abutted mature forest, and the edge was within100 m from contiguous mature forest. All plots had aslope of 0–20° and were within an altitudinal range of ca.150–350 m above sea level. As the study was focused onterrestrial frogs and lizards, all plots were at least 100 maway from large perennial water bodies. To minimize spa-tial autocorrelation, all plots were at least 2 km (straightdistance) from each other, with the replicates (e.g., thetwo 1 yr fallows) being the furthest apart (ca. 10 km).
Vegetation sampling, habitat variables and gradients of habitat recoveryVegetation composition and habitat structure variableswere sampled on randomly located 10 × 25 m belttransects [13,17]. Transects were cut short whenever anedge of the site was reached. The number of transectssampled were, six each in Jh1A, Jh1B, Jh5, Jh10, and Jh35,and five each in tk4, tk22, matA, matB and matC. Treedensity and tree species richness was sampled on thewhole area of each transect. All trees >20 cm GBH wereenumerated, while the rest were classified as 'shrubs'.Density of bamboo culms, shrubs, palms, bananas, andtall grass clumps was estimated in each of six 2 m radiuscircular plots laid at 5 m intervals on the transect, begin-ning from the starting point of the transect. Percentagecover of herbaceous forms and leaf litter, dead woodymatter abundance and liana abundance in each circularplot were estimated visually. Percentage canopy coverfrom ground level was estimated with a hand-held canopydensiometer from the centre of each circular plot. Litterdepth was gauged by pressing a blunt rod of 0.5-cm diam-eter at 5 random points in each circular plot, and countingthe number of leaves pinned under it.
Principal Components Analysis (PCA) was used to iden-tify different aspects of habitat change with vegetationsuccession and collapse the list of raw variables intocomposite factors that could potentially predict frog andlizard community structure. The factor structure wasrotated using the Varimax method to obtain clear loading
patterns [18]. As additional variables, within-habitat coef-ficient of variation (CV) of variables was also used alongwith the raw data as measures of habitat heterogeneity.Within habitat variation was considered potentiallyinformative as it is an important feature of the adaptivelandscape [30]. Habitat data were collected at comparabletimes of each month for all plots, and these CVs areunlikely to be due to temporal fluctuations. Data weresquare root transformed if they deviated from normality.For a list of variables used in the analyses, see Additionalfile 3.
As the objective of the analysis was to combine variablesinto composite, orthogonal factors that could potentiallyaccount for community and guild structure, all factorswith eigenvalues = 0.8 were extracted, irrespective of thenumber of factors thus extracted. Although somewhatarbitrary, in essence this eigenvalue threshold ensuredthat a factor was included only if it extracted approxi-mately as much as one raw variable [18]. Although allextracted factors were used as predictors of communitystructure (see below), in order to obtain a graphic, lowdimensional representation of the two gradients ofhabitat recovery, scores of only the first two factors wereplotted. Deterministic sets of variables that changeddirectionally with chronosere age were identified byregressing scores of each factor against chronosere ages.
Frog and lizard samplingThe low abundance of amphibians and reptiles andunstandardised sampling methodology in tropical Asiareduces the reliability of species diversity estimates andhence community structure analyses [8]. Taking this prob-lem into consideration, three techniques were used inconjunction to maximize inventorying effort – (i) belttransects, (ii) pitfall trapping and (iii) systematic search-ing. All these techniques are oriented towards samplingterrestrial, and non-canopy arboreal species, and to fur-ther increase the sampling efficiency, the study wasrestricted to terrestrial, non-fossorial, and non-canopyfrogs (Amphibia: Anura) and lizards (Reptilia: Sauria,excluding family Varanidae). Although this excluded afew amphibian and reptile groups, it ensured that taxo-nomic groups unsuited for the chosen sampling tech-niques were not unnecessarily included, thus augmentingthe reliability of the data. To distribute sampling efforteffectively among the ten plots, sampling was carried outin sampling 'sessions' of ten days each. Eleven such ses-sions (= 110 days) were completed, starting from 15thDecember 1998, to the end of April 1999. Sufficient timewas allocated to all three sampling techniques during eachsession.
Page 15 of 18(page number not for citation purposes)
BMC Ecology 2004, 4:10 http://www.biomedcentral.com/1472-6785/4/10
Belt transectsTo improve detection and gather information for delinea-tion of EGs (see below), the traditional transect methodwas modified by eliminating pseudoreplication and sam-pling both nocturnal and diurnal species on the sametransect [34,35]. The former was achieved by establishingfresh 50(length) × 3(width) × 3(height) m transects dur-ing each session, which were sampled only once. To detectboth nocturnal and diurnal taxa, each transect was walkedin both directions (to and fro) by two observers. The diur-nal animal walk (DAW) was first, and was conducted at asteady pace fixed for all plots (ca. 20 min/50 m). Any ani-mal seen leaving the transect area was recorded as beingpresent on it. Care was taken to cause minimal distur-bance to the habitat, and no active searches were done.The nocturnal animal walk (NAW), conducted in thedirection opposite to the DAW, was focused on intensivemicrohabitat searching within the same 50 × 3 × 3 m area.All nocturnal animals found on the DAW were includedin the analyses, but to reduce the possibility of re-record-ing the same animal, diurnal animals found on the NAWwere not. Behavioural and microhabitat data wererecorded for every animal detected (see below). Alltransects were sampled immediately after they wereestablished, between 1000–1400 hrs during winter (mid-December to February) and 0900–1300 during summer(March and April). There was no noticeable species turn-over with season, so winter and summer data were notanalyzed separately [17]. The belt transects also yieldedabundance data, which are not used in this paper [17].
Although time taken for the NAW was more or less con-stant within a chronosere, it varied considerably acrossplots. The DAW time on the other hand, was more or lessconsistent. This strategy was used because just as samplingeffort needs to be proportional to habitat heterogeneity,higher microhabitat complexity calls for proportionallygreater searching effort. Figure 7 shows how well this sam-pling strategy was implemented. There is a strong positivecorrelation between an index of microhabitat complexity(calculated as the sum of the coefficients of variance forvarious understorey habitat structure variables listed inAdditional file 3) and time spent on the NAW, but not theDAW. Thus, though no extra time was needed to sightactive (diurnal) animals in more complex habitats, thetime needed for microhabitat searching (and hence NAWtime) increased along a gradient of increasing habitatcomplexity from the 1-yr fallows and teak plots to matureforest. A total of 192 belt transects were completed, froma minimum of thirteen in jh1B to thirty-eight in jh35 (SeeFigure 7 for sample sizes).
Pitfall trappingThis technique was used to supplement species inventory-ing from the belt transects, and for an unbiased measure
of the effects of weather on herpetofaunal activity andhence sampling efficiency. Comparisons of trapping fre-quency across plots over the study period are not used inthis paper. Each pitfall array was, 'Y'-shaped, with threeterminal (30 cm diam. × 60 cm depth) and one central(50 cm diam. × 70 cm depth) cylindrical aluminium fun-nel pitfall traps buried in the ground. The traps were con-nected with three opaque plastic-sheet fences (the arms ofthe 'Y') 0.4 m high and 5 m long, held up by bamboostakes. In all, 22 arrays were placed, with two in each plotexcept for the large Jh35, which had four. Arrays were atcomparable distance from plot edges, and on similarslope. Systematic trapping was initiated ten days after trapwere established. Traps were opened for 5–10 consecutivedays, and checked according to habitat characteristics, tak-ing into consideration the level of exposure trapped ani-mals were likely to be subjected to; plots with openhabitat, such as jh1A were checked most (every alternateday) and those with relatively closed habitat such as matAwere checked least frequently (every third day). Most spec-imens (95.2 %) obtained from pitfall trapping werereleased a minimum of 100 m away from the array, eitherin the same site, or in similar habitat elsewhere. A fewwere retained as voucher specimens.
Systematic searchingAt the end of a sampling session in a plot, far rangingsearches were carried out. This augmented species inven-torying, and provided information crucial for EG classifi-cation (see below). Periodically, nocturnal searches werealso made to collect information about the refuge ofdiurnally active animals, and also to confirm the presenceor absence of species in different chronoseres.
Identification of taxaIrrespective of the sampling technique, animals detectedwere caught whenever possible, and identified in hand.All those that escaped were identified to a justifiable levelor excluded from the analyses. A few individuals of taxo-nomically problematic species or taxa were preserved forlater identification.
Sampling efficiencyThe effectiveness of sampling was evaluated by speciesaccumulation curves (see Additional file 4), and the effortadjusted after a mid-fieldwork examination of speciesrichness data across chronoseres. While all the early suc-cession stages and teak plantations reach an asymptotevery soon, the 30–35 year fallow stopped yielding newspecies only by the eighth sampling session, while matureforest continued to yield new species till the final sam-pling session.
Page 16 of 18(page number not for citation purposes)
BMC Ecology 2004, 4:10 http://www.biomedcentral.com/1472-6785/4/10
Characterization of frog and lizard community successionOverlap between recovering frog and lizard communitieswas measured with the Bray-Curtis measure between allpossible pairs of chronoseres using presence absence dataof all species (see Additional file 4). The resultant dissim-ilarity matrix was then used to generate a dendrogramusing the UPGMA clustering algorithm [18]. Species turn-over in sequential frog vs. lizard communities wascompared using the mean Jaccard's dissimilarity valuebetween all chronosere pairs calculated from separatepresence absence data for the two groups [36].
Ecological group classification and phylogenetic structureLife history and behavioural traits were used to group spe-cies. These are often called guilds (e.g., [37]), but arereferred to as ecological groups (EGs) here because theclassification covers species from all chronoseres, includ-ing those that belonged to separate, non-interactingcommunities. The representatives of each EG in a particu-lar community or chronosere on the other hand, can beconsidered a guild of that habitat's community. The lifehistory and behavioural traits used for the EG classifica-tion were: diel activity period, habitat use when active,habitat use when resting, substrate temperature whenactive, air temperature when active, relative humiditywhen active, substrate moisture when active, resting ref-uge, resting refuge temperature, resting refuge substratemoisture and foraging tactic. To validate this data, infor-mation from literature and consultations with regionalherpetologists was also used. These data, collected at dif-ferent measurement scales, were rescaled to discrete cate-gories to which species were allocated as absent orpresent. From this binary data, a dissimilarity matrix wascalculated between all species using the Bray-Curtis meas-ure [19]. The dissimilarity matrix was then scaled usingnon-metric multidimensional scaling (NMDS). NMDSgeometrically represents dissimilarities in a graphical,low-dimensional space, and is a robust method torepresent ecological distance [18,19]. See Additional file 4for the list of species included in the EG classification.
Phylogenetic structure was measured as the ratio ofnumber of species to the number of genera (S/G ratio) ineach EG. A similar approach has been used in studiesaddressing questions about phylogenetic structure in eco-logical communities [15].
Community – Habitat interrelationshipsTo test which habitat attributes influenced communitystructure, Mantel tests of correspondence between dissim-ilarity (distance) matrices [18,19,38,39] were used. Dis-similarity matrices between sites were generated based ondifferences in set of composite variables (factors)extracted by the PCA analysis (unsquared Euclidean dis-tances), and for different levels of frog and lizard commu-
nity composition (from entire community to guildsdefined by the EG classification using Jaccard's index)[18,19]. Significance of correlation coefficients was testedby 1000 row-column Monte Carlo randomizations foreach pair of matrices.
To test whether the availability of composite variables(PCA factors) that predicted community and guild struc-ture identified by the matrix correspondence tests didindeed influence community succession and phylogeneticstructure along gradients of habitat recovery, correlationsbetween sums of factor scores and species richness, ratioof species number/guild number and S/G ratios acrosschronoseres were tested.
Authors' contributionsSSP conceived the study, carried out the fieldwork, per-formed the data analyses, and drafted the manuscript.BCC and GSR participated in design and coordination ofthe study. GSR also supervised the vegetation identifica-tion and habitat classification. All authors read andapproved the final manuscript.
Additional material
AcknowledgementsThis study was funded by a fellowship from the Ministry of Environments and Forests, Government of India and a grant from the Bombay Natural History Society, to SP. The Mizoram forest department kindly gave
Additional File 2Photographs of habitat types. Representative photographs of habitat typesClick here for file[http://www.biomedcentral.com/content/supplementary/1472-6785-4-10-S2.pdf]
Additional File 3Results of PCA along with list of habitat variables used. PCA ResultsClick here for file[http://www.biomedcentral.com/content/supplementary/1472-6785-4-10-S3.pdf]
Additional File 4Species accumulation curves and frog and lizard species' lists. Species accumulation curves and listsClick here for file[http://www.biomedcentral.com/content/supplementary/1472-6785-4-10-S4.pdf]
Additional File 1Maps of study area. Location map of study area sampling plots with respect to vegetation typesClick here for file[http://www.biomedcentral.com/content/supplementary/1472-6785-4-10-S1.pdf]
Page 17 of 18(page number not for citation purposes)

BMC Ecology 2004, 4:10 http://www.biomedcentral.com/1472-6785/4/10
Publish with BioMed Central and every scientist can read your work free of charge
"BioMed Central will be the most significant development for disseminating the results of biomedical research in our lifetime."
Sir Paul Nurse, Cancer Research UK
Your research papers will be:
available free of charge to the entire biomedical community
peer reviewed and published immediately upon acceptance
cited in PubMed and archived on PubMed Central
yours — you keep the copyright
Submit your manuscript here:http://www.biomedcentral.com/info/publishing_adv.asp
BioMedcentral
research permits and logistical support to work in Ngengpui WLS. We are particularly grateful to Pu Lal Fala, Mr. N.R. Pradhan, Pu Lathlamuana Pachuau, Rijkzova (Zokima) and the people of Kawrthindeng village for their wonderful enthusiasm and kind support. We also thank C. Estrada and two anonymous reviewers for constructive critique and helpful suggestions, which vastly improved the quality of the manuscript.
References1. Hubbell SP: The Unified Neutral Theory of Biodiversity and
Biogeography,. Princeton, NJ: Princeton University Press; 2001. 2. Thompson JN, Reichman OJ, Morin PJ, Polis GA, Power ME, Sterner
RW, Couch CA, Gough L, Holt R, Hooper DU, et al.: Frontiers ofecology. BioScience 2001, 51:15-24.
3. Tofts R, Silvertown J: A phylogenetic approach to communityassembly from a local species pool. Proc R Soc Lond B 2000,267:363-369.
4. Gillespie R: Community assembly through adaptive radiationin Hawaiian spiders. Science 2004, 303:356-359.
5. Jessup CM, Kassen R, Forde SE, Kerr B, Buckling A, Rainey PB, Bohan-nan BJM: Big questions, small worlds: microbial model sys-tems in ecology. Trends Ecol Evol 2004, 19:189-197.
6. Crandall KA, Bininda-Emonds ORP, Mace GM, Wayne RK: Consid-ering evolutionary processes in conservation biology. TrendsEcol Evol 2000, 15:290-295.
7. Stockwell CA, Hendry AP, Kinnison MT: Contemporary evolutionmeets conservation biology. Trends Ecol Evol 2003, 18:94-101.
8. Pawar S: Taxonomic chauvinism and the methodologicallychallenged. BioScience 2003, 53:861-864.
9. Bonnet X, Shine R, Lourdais O: Taxonomic chauvinism. TrendsEcol Evol 2002, 17:1-3.
10. Dunn RR: Recovery of faunal communities during tropical for-est regeneration. Conserv Biol 2004, 18:302-309.
11. Raman TRS: Effect of slash-and-burn shifting cultivation onrainforest birds in Mizoram, North-east India. Conserv Biol2001, 15:685-698.
12. Raman TRS, Rawat GS, Johnsingh AJT: Recovery of tropical forestavifauna in relation to vegetation succession following shift-ing cultivation in Mizoram, North-east India. J App Ecol 1998,35:214-231.
13. Bowman DMJS, Woinarski JCZ, Sands DPA, Wells A, McShane VJ:Slash-and-burn agriculture in the wet coastal lowlands ofPapua New Guinea: response of birds, butterflies andreptiles. J Biogeog 1990, 17:227-239.
14. Borges SH, Stouffer PC: Bird communities in two types ofanthropogenic successional vegetation in central Amazonia.Condor 1999, 101:529-536.
15. Webb CO, Ackerly DD, Mcpeek MA, Donoghue MJ: Phylogeniesand community ecology. Ann Rev Ecol Syst 2002, 33:475-505.
16. Wilson JB: Guilds, functional types and ecological groups. Oikos1999, 8:507-522.
17. Pawar SS: Effect of habitat alteration on herpetofaunal assem-blages of evergreen forest in Mizoram, North-East India.M.Sc. thesis Saurashtra University, Wildlife Institute of India,Dehradun; 1999.
18. Jongman RHG, Ter Braak CJF, Van Tongeren OFR: Data Analysis inCommunity and Landscape Ecology,. Biddles: Cambridge Uni-versity Press; 1995.
19. Clarke KR, Warwick RM: Change in Marine Communities: anApproach to Statistical Analysis and Interpretation,. UK: EPrimer – E Ltd; 1994.
20. Hofer U, Bersier LF, Borcard D: Spatial organization of a her-petofauna on an elevational gradient revealed by null modeltests. Ecology 1999, 80:976-988.
21. Pianka ER: Ecology and Natural History of Desert Lizards:Analyses of the Ecological Niche and Community Structure,.New Jersey: Princeton University Press; 1986.
22. Schoener TW: Competition and the niche. In Biology Of TheReptilia Edited by: Gans C. London: Academic Press,Inc; 1977:35-136.
23. Schoener TW: Resource partitioning in ecologicalcommunities. Science 1974, 185:27-39.
24. Sexton OJ, Heatwole H, Knight D: Correlation of microdistribu-tion of some Panamanian reptiles and amphibians withstructural organization of the habitat. Caribbean J Sci 1964,4:261-295.
25. Scott NJ: The abundance and diversity of herpetofauna oftropical forest litter. Biotropica 1976, 8:41-58.
26. Petren K, Case TJ: Habitat structure determines competitionintensity and invasion success in gecko lizards. PNAS 1998,95:11739-11744.
27. Tews J, Brose U, Grimm V, Tielborger K, Wichmann MC, SchwagerM, Jeltsch F: Animal species diversity driven by habitat heter-ogeneity/diversity: the importance of keystone structures. JBiogeog 2004, 31:79-92.
28. Bellehumeur C, Legendre P: Multiscale sources of variation inecological variables: modeling spatial dispersion, elaboratingsampling designs. Landscape Ecol 1998, 13:15-25.
29. Heatwole H: Habitat selection in reptiles. In Biology Of The ReptiliaEdited by: Gans C, Tinkle DW. London: Academic Press, Inc.;1977:137-155.
30. Seligmann H: Resource partition history and evolutionary spe-cialization of subunits in complex systems. Biosystems 1999,51:31-39.
31. Duellman WE, Pianka ER: Biogeography of nocturnal insecti-vores: Historical events and ecological filters. Ann Rev Ecol Syst1990, 21:57-68.
32. Wikramanayake E, Dinerstein E, Olson D: Terrestrial eco-regionsof the Indo-Pacific. W.W.F./W.C.M.C., Washington D.C., U.S.A. 1998.
33. Finegan B: Pattern and process in Neotropical secondary rainforests: the first 100 years of succession. Trends Ecol Evol 1996,11:119-124.
34. Pearman PB, Velasco AM, L¢pez A: Tropical amphibian monitor-ing: A comparision of methods for detecting inter-site varia-tion in species' composition. Herpetologica 1995, 51:325-337.
35. Heyer WR, Donnelly MA, McDiarmid RW, Hayek LC, Foster MS:Measuring and Monitoring Biologial Diversity: StandardMethods for Amphibians,. Washington: Smithsonian InstitutionPress; 1994.
36. Legendre L, Legendre P: Numerical Ecology,. Amsterdam, Nether-lands: Elsevier Scientific Publications; 1998.
37. Williams SE, Hero JM: Rain forest frogs of the Australian wettropics: guild classification and the ecological similarity ofdeclining species. Proc R Soc Lond B 1998, 265(1396):597-602.
38. Manly BJF: Randomization and Monte Carlo Methods inBiology,. London: Chapman and Hall; 1991.
39. Dutilleul P, Stockwell JD, Frigon D, Legendre P: The Mantel testversus Pearson's correlation analysis: Assessment of the dif-ferences for biological and environmental studies. J Agric BiolEnviron Stat 2000, 5:131-150.
Page 18 of 18(page number not for citation purposes)
http://www.ncbi.nlm.nih.gov/entrez/query.fcgi?cmd=Retrieve&db=PubMed&dopt=Abstract&list_uids=9751735