
The influence of photodynamic therapy on the immune response
Real-time, in vivo measurement oftissular pO2 through the delayedfluorescence of endogenousprotoporphyrin IX during photodynamictherapy
Filippo PiffarettiAnna Maria NovelloRajendran Senthil KumarEddy ForteCédric PaulouPatrycja Nowak-SliwinskaHubert van den BerghGeorges Wagnières
Downloaded From: http://biomedicaloptics.spiedigitallibrary.org/ on 12/06/2012 Terms of Use: http://spiedl.org/terms

Real-time, in vivo measurement of tissular pO2through the delayed fluorescence of endogenousprotoporphyrin IX during photodynamic therapy
Filippo Piffaretti, Anna Maria Novello, Rajendran Senthil Kumar, Eddy Forte, Cédric Paulou, Patrycja Nowak-Sliwinska,Hubert van den Bergh, and Georges WagnièresMedical Photonics Group, Swiss Federal Institute of Technology, SB-ISIC, Station 6, Lausanne, Switzerland
Abstract. Tissular oxygen concentration plays a key role during photodynamic therapy (PDT). Therefore, monitor-ing its local oxygen partial pressure (pO2) may help predict and/or control the outcome of a PDT treatment. The firstreal-time, in vivo measurements of the pO2 in the chicken egg’s chorioallantoic membrane, using the delayedfluorescence of photoactivable porphyrins (PAPs), including protoporphyrin IX (PpIX), as monitored with a dedi-cated optical, fiber-based, time-resolved spectrometer, are reported here. The formation of PAPs/PpIX, photo-sensitizers of extensive clinical use, was induced in the chicken egg’s chorioallantoic membrane (CAM) withaminolevulinic acid. An excellent correlation between the vascular damage induced by PDT and the reductionin tissular pO2 is found. This study suggests that clinical measurement of the pO2 using the PAPs’/PpIX’s delayedfluorescence (DF) may be used to individualize in real time the PDT light dose applied. © 2012 Society of Photo-Optical
Instrumentation Engineers (SPIE). [DOI: 10.1117/1.JBO.17.11.115007]
Keywords: delayed fluorescence; oxygen partial pressure; protoporphyrin IX; photodynamic therapy; tumor.
Paper 12244 received Apr. 21, 2012; revised manuscript received Oct. 9, 2012; accepted for publication Oct. 10, 2012; published onlineNov. 9, 2012.
1 IntroductionDue to its partial selectivity and minimally invasive character,photodynamic therapy (PDT) is often chosen for treating earlystages of local, superficial cancers in hollow organs and otherregions of the body accessible to light application.1,2 PDT is alsoconsidered as the treatment of choice for, among others, actinickeratosis (in dermatology), and wet age-related macular degen-eration (in ophthalmology). To obtain the desired cytotoxic andhealing effects, PDT relies on the presence in the target tissueof a photosensitizer (PS), molecular oxygen (O2), and adminis-tration of light at wavelengths absorbed by the PS. In this work,a time-tested method involving a biochemical precursor of thePS is used: topical or systemic administration of 5-aminolevu-linic acid (ALA) leads, after a suitable drug-light interval, tobiosynthesis and accumulation of photoactivable porphyrins(PAPs), including protoporphyrin IX (PpIX), the actual PS inthe cells of the target tissue.3 Note that ALA-derivative-basedPDT procedures are now approved for the treatment of pre-malignant and malignant conditions in dermatology.1
Despite encouraging results, some clinicians avoid using thistherapy due to observed fluctuations in intra- and inter-patienttherapeutic outcomes.4 These fluctuations, generally linked touneven PS and/or O2 tissular distribution, might in principlebe counterbalanced by monitoring in real time the local PSand/or O2 concentrations and then adjusting the light dosi-metry.5,6 Measuring the local pO2 is also of interest for othertypes of treatments, such as radiotherapy, as it is well establishedthat tissue oxygenation plays an important role in the outcome of
such treatments.7 Note that previous studies8,9 have providedstrong evidence that singlet oxygen (1O2) and other active oxy-gen species are the major active cytotoxic particles within thetarget tissues, which induce cell apoptosis. Therefore, accuratemonitoring of 1O2, though quite difficult to do, might lead to abetter prediction of the clinical outcome than other monitoringtechniques. However, optimizing the treatment dosimetryobviously remains a challenge.10–13
Different approaches have been proposed to monitor PDTefficiently, with the goal of improving its clinical outcome.14,15
One of them is explicit dosimetry, in which the quantities oflight, drugs, and oxygen are continuously and separately mon-itored during treatment. Alternatively, implicit dosimetry usesan indirect estimator of the biological damages, such as thedegree of bleaching (photodegradation) of the photosensitizer,to predict the clinical outcome.5,16,17
This study uses the chicken embryo chorioallantoic mem-brane (CAM), an in vivo model well suited to characterizePDT’s vascular effects,18–20 to study the relationship betweenthe evolution of tissular oxygen concentration during PDT andthe resulting vascular damage. For this purpose, the quenchingof PpIXs (from here on, the abbreviation PpIX encompassesboth PpIX itself and the other photoactivable porphyrins) anddelayed fluorescence (DF) by molecular oxygen21 are measuredon the one hand by a fiber-based spectrometer22 to estimate pO2,and on the other hand, on a simple, microphotographic-basedevaluation index of the amount of vessel damage. The resultsof this study show that a robust, positive correlation exists be-tween the reduction of tissular oxygen and PDT-created tissulardamage.
Address all correspondence to: Georges Wagnières, Medical Photonics Group,Swiss Federal Institute of Technology, SB-ISIC, Station 6, Lausanne,Switzerland. Tel: +4121 693 3120; Fax: +4121 693 3626; E-mail: [email protected] 0091-3286/2012/$25.00 © 2012 SPIE
Journal of Biomedical Optics 115007-1 November 2012 • Vol. 17(11)
Journal of Biomedical Optics 17(11), 115007 (November 2012)
Downloaded From: http://biomedicaloptics.spiedigitallibrary.org/ on 12/06/2012 Terms of Use: http://spiedl.org/terms

2 Materials and Methods
2.1 PpIX Photodynamics and Diffusional PropertiesWhen Used as the PS
A summary of the photochemically induced reactions (type-IIphotochemical reaction pathway) can be represented by thefollowing chemical scheme:
S0 þ hν→ S1 Photon absorption by thePS
S1 → T1 Intersystem crossing
T1 þ 3O2 → S0 þ 1O2 Collisional energy transfer between
PS and molecular O2
S0 is the singlet ground state of the PS, which is excited (uponabsorption of a photon of energy hν) to the first excited singletstate S1. The latter can undergo intersystem crossing with a cer-tain quantum yield (approx. 60% for PpIX, measured in in vitroconditions)23 to the long-lived triplet state T1, which has a life-time ranging from a few microseconds up to a few milliseconds.This is why the tissular oxygen in the triplet ground state (3O2)has enough time to undergo a collision with the PS in the T1
state, to form the highly reactive and cytotoxic singlet molec-ular oxygen 1O2. Once generated, 1O2 undergoes deexcitationthrough several pathways, among which a low-probabilityradiative decay with emission of an infrared photon at 1270 nm.This 1O2 luminescence is in fact characterized by a very weaksignal, making its measurement not easily applicable in the clin-ical context (the luminescence emission of 1O2 has a probabilityof 10−8 and a characteristic lifetime of approx. 100 ns underin vivo conditions).10,24 These fast and weak signals from 1O2
at 1270 nm are difficult to work with, especially under clinicalconditions.
The idea was developed to measure the production of excitedsinglet oxygen via the “consumption” of the PpIX’s tripletstate (T1 in the above chemical scheme), which is efficientlyquenched by the molecular oxygen found in the tissue. Indeed,a fraction ranging from 55% to 80% of the PpIX T1 populationis quenched by 3O2, depending on the actual conditions.23
Therefore, measuring the photosensitizer’s luminescence life-time offers an alternative to measuring the radiative decay of1O2.
25 Furthermore, in contrast to intensity measurementmethods, lifetime measurement methods have the advantage ofbeing inherently self-referential and more robust.26
PpIX’s phosphorescence signal, from the radiative path con-necting T1 to S0, may not be detected easily in vivo because thephosphorescence quantum yield is much too low and becausethis luminescence takes place at wavelengths too long to beeasily detected.27 This difficulty can be overcome by measuringPpIX’s DF lifetime as a substitute for its phosphorescencelifetime.
2.2 Principles and Experimental Setup for pO2Determination Through the Measurement ofthe PS’s DF Lifetime
Tissular pO2 can be determined by measuring the lifetime τ ofthe PS’s triplet state, thanks to the Stern-Volmer relationship:
I0∕I ¼ τ0∕τ ¼ 1þ Kq · pO2; (1)
where I and τ refer to the intensity and lifetime of the PS’s phos-phorescence for a given tissue pO2, while Io and τo refer to
the values measured in the absence of oxygen and Kq is theStern-Volmer constant. In this study, tissular oxygen concentra-tions are given as values of pO2 in units of percent (%), meaningthat the tissue is assumed to be saturated and in equilibrium withan oxygen-containing gaseous mixture (usually air or calibratednitrogen/oxygen mixtures) at a pressure of 1 atm. The lifetime τis determined indirectly, by detecting the DF of the PS’s excitedtriplet state. For this purpose, a fiber-based, time-resolved spec-trofluorometer was used. It is described in details in Ref. 28,including the setup’s temporal resolution and level of back-ground optical noise. The schematics of the experimental setupare shown in Fig. 1.
The plano-convex lens (3) is mounted on a 5-degrees-of-free-dom holder, allowing for easy focusing of the laser beam on apredefined point (5) (for specific details about the setup or partsthereof, see Ref. 28). The luminescence emitted from the irra-diated sample is collected by the distal end of the optical fiber(6) and returned to the enclosure, where a large fraction (prob-ably more than 80%) of this light falls on the parabolic metalmirror (4) and is reflected and focused by it on a gateable photo-multiplier (PMT) (7). The reflected laser light and unwantedoptical background noise are filtered out by a band-pass filterin the filter wheel (8; center wavelength: 645 nm, full width athalf maximum: 75 nm). The PpIX DF signal is recorded with adigital storage oscilloscope (DSO) connected to a PC (9), wherethe data processing and analysis takes place (see the next sectionfor more detail). The signal delay generator (10) is used to syn-chronize the gating of the PMTwith the laser pulses and to trig-ger the DSO with the DF signals. The advantages of this opticaldesign include (a) the absence of spectral distortions becauseonly reflections take place in the scrutinized part of the opticalpath; (b) no autoluminescence is induced in the parabolic mirrorwhich, due to its metallic nature, does not interact with the exci-tation pulse; (c) the solid angle of acceptance of the parabolicmirror (≈0.6 sr) is larger than the entrance solid angle of theoptical fiber (≈0.15 sr), which leads to a high light recoveryfraction; (d) the mirror’s parabolic shape eliminates the need ofan additional lens to focus the luminescence emitted by the fibertip (or the quartz cuvette) on the detector.
The time-resolved detection of the weak DF signal requiresgating to avoid saturation of the detector by the much strongerprompt fluorescence (PF) signal. The photomultiplier tube isswitched on about 3 μs after the laser pulse, allowing the inten-sity of any PF to decrease to the noise level.
Fig. 1 Schematic of DF experimental setup. Its components are(1) pulsed (≈0.5 ns) dye laser; (2) experimental enclosure with a 3 0 dia-phragm; (3) lens, (4) parabolic mirror with cylindrical hole; (5) focusinglocation; (6) optical fiber; (6) thermostabilized cell holder; (7) gateablephotomultiplier; (8) optical filters holder; (9) digital storage oscilloscopeand PC; and (10) pulse and delay generator.
Journal of Biomedical Optics 115007-2 November 2012 • Vol. 17(11)
Piffaretti et al.: Real-time, in vivo measurement of tissular pO2 . . .
Downloaded From: http://biomedicaloptics.spiedigitallibrary.org/ on 12/06/2012 Terms of Use: http://spiedl.org/terms
2.3 Data Acquisition and Analysis
The PMT’s analog signal is supplied to the DSO for averaging(about 30 transients are used), and the averaged values are trans-ferred to the PC for analysis. The luminescence decay is fitted toa sum (usually one or two components are retained) of exponen-tial functions:
fðtÞ ¼Xn
i¼1
Ai expðt∕τiÞ: (2)
The Levenberg-Marquardt method was chosen for these non-linear least-squares fits,25,29–31 using a self-written algorithmimplementation. The calculated mathematical fits were graphi-cally checked by plotting the residuals of each fit and the auto-correlation of the residuals,32,33 as shown in previous research.28
2.4 Handling of the CAMs and ALA Administration
The procurement and processing of the eggs to prepare the CAMhas been described in previous research (such as Ref. 20). Inbrief, fertilized chicken eggs are transferred (blunt end up) intoan automatic turn-incubator, set at 37°C, 65% relative humidity(RH), and normal atmospheric pO2 conditions (i.e., 21%).Given the geographical location (400 m above sea level) ofthe experimental setup, this corresponds to a partial pressureof approximately 150 mmHg of O2. On embryo developmentday 3 (EDD 3), a portion of the eggshell is removed at thepointed end of the egg, creating a hole of approximately 3 mmin diameter, which is covered with Parafilm cling film, and thepointed end is always kept pointing up. This procedure causesthe embryo and its enveloping CAM to retract locally from thisartificial opening, exposing at its surface a flattened portion ofthe membrane, and providing an access to observe and treat theCAM’s capillary plexus and vasculature. The eggs are thenreturned to the incubator (blunt end down) and kept in a staticposition. At EDD 11, the eggs are removed from the incubatorfor topical ALA administration: a zone of the CAM character-ized by homogeneous vascularization is visually selected and a20 μl droplet of a 0.15 M (20 mg∕ml) ALA aqueous solution in0.9% NaCl, adjusted to pH 6 with NaOH, is deposited in thecenter of this zone. The eggs are then returned to the incubatorand kept static until further use. As a rule, any manipulation ofthe CAM after ALA application is performed in total darknessor under subdued light.
2.5 PpIX Buildup Kinetics After ALA TopicalAdministration
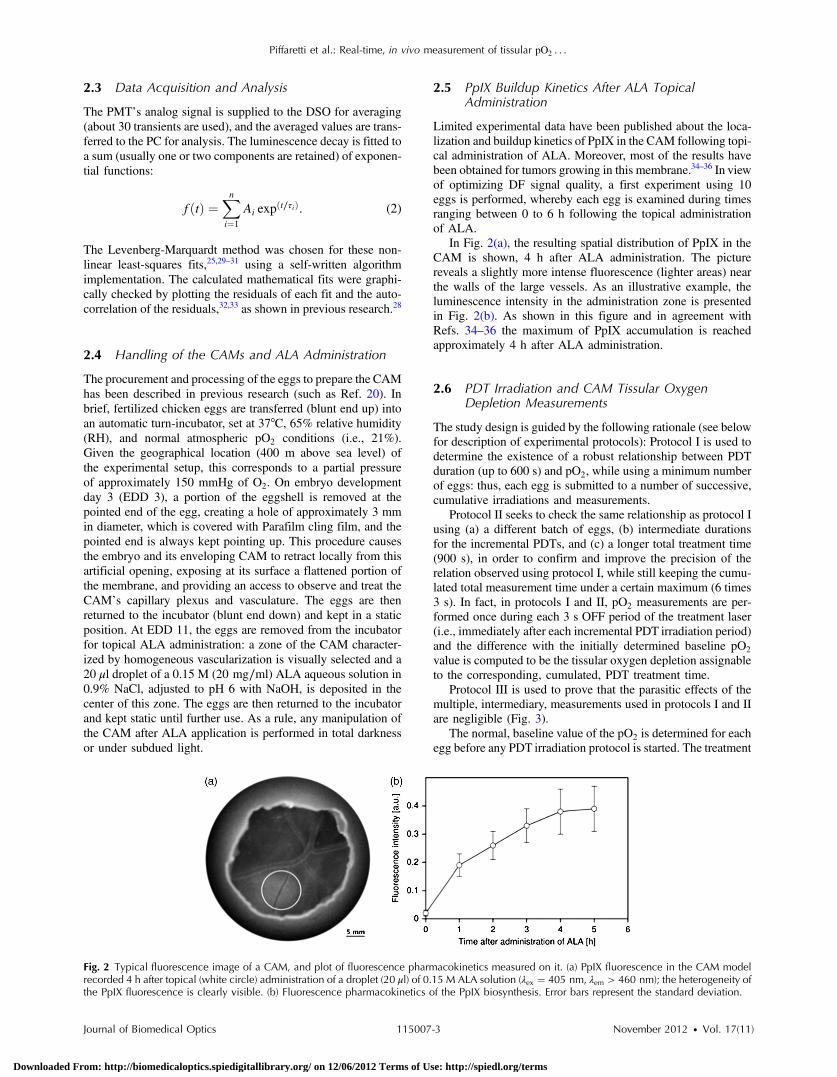
Limited experimental data have been published about the loca-lization and buildup kinetics of PpIX in the CAM following topi-cal administration of ALA. Moreover, most of the results havebeen obtained for tumors growing in this membrane.34–36 In viewof optimizing DF signal quality, a first experiment using 10eggs is performed, whereby each egg is examined during timesranging between 0 to 6 h following the topical administrationof ALA.
In Fig. 2(a), the resulting spatial distribution of PpIX in theCAM is shown, 4 h after ALA administration. The picturereveals a slightly more intense fluorescence (lighter areas) nearthe walls of the large vessels. As an illustrative example, theluminescence intensity in the administration zone is presentedin Fig. 2(b). As shown in this figure and in agreement withRefs. 34–36 the maximum of PpIX accumulation is reachedapproximately 4 h after ALA administration.
2.6 PDT Irradiation and CAM Tissular OxygenDepletion Measurements
The study design is guided by the following rationale (see belowfor description of experimental protocols): Protocol I is used todetermine the existence of a robust relationship between PDTduration (up to 600 s) and pO2, while using a minimum numberof eggs: thus, each egg is submitted to a number of successive,cumulative irradiations and measurements.
Protocol II seeks to check the same relationship as protocol Iusing (a) a different batch of eggs, (b) intermediate durationsfor the incremental PDTs, and (c) a longer total treatment time(900 s), in order to confirm and improve the precision of therelation observed using protocol I, while still keeping the cumu-lated total measurement time under a certain maximum (6 times3 s). In fact, in protocols I and II, pO2 measurements are per-formed once during each 3 s OFF period of the treatment laser(i.e., immediately after each incremental PDT irradiation period)and the difference with the initially determined baseline pO2
value is computed to be the tissular oxygen depletion assignableto the corresponding, cumulated, PDT treatment time.
Protocol III is used to prove that the parasitic effects of themultiple, intermediary, measurements used in protocols I and IIare negligible (Fig. 3).
The normal, baseline value of the pO2 is determined for eachegg before any PDT irradiation protocol is started. The treatment
Fig. 2 Typical fluorescence image of a CAM, and plot of fluorescence pharmacokinetics measured on it. (a) PpIX fluorescence in the CAM modelrecorded 4 h after topical (white circle) administration of a droplet (20 μl) of 0.15 M ALA solution (λex ¼ 405 nm, λem > 460 nm); the heterogeneity ofthe PpIX fluorescence is clearly visible. (b) Fluorescence pharmacokinetics of the PpIX biosynthesis. Error bars represent the standard deviation.
Journal of Biomedical Optics 115007-3 November 2012 • Vol. 17(11)
Piffaretti et al.: Real-time, in vivo measurement of tissular pO2 . . .
Downloaded From: http://biomedicaloptics.spiedigitallibrary.org/ on 12/06/2012 Terms of Use: http://spiedl.org/terms

laser is then switched on and off and pO2 measurements per-formed according to one of the three experimental protocolsdescribed above. In protocol III, pO2 measurements are per-formed just once before and once after a continuous, predeter-mined irradiation period. The difference between those two pO2
values is computed to be the tissular oxygen depletion assign-able to the corresponding, uninterrupted, PDT treatment time.
Details of the PDT irradiation and tissular oxygen measure-ment procedures are as follows: At EDD 11, 4 h after ALAadministration, the egg is taken out of the incubator and placedunder the combined PDT-irradiation/DF-measurement setup.The drug-light interval of 4 h allows time for the cells to producesufficient tissular PpIX. In order to minimize re-oxygenation ofthe tissue during PDT by atmospheric oxygen, a round, 20-mm,0.15-mm-thick microscope cover-glass (3) is gently floated onthe CAM’s surface (1) after depositing two drops (2) of humanphysiologic serum (≈80 μl of 0.9% NaCl; see Fig. 4). Thisliquid layer, acting as a cushion, is essential to avoid any adher-ence between the cover-glass and the CAM and possible sub-sequent injury to the CAM surface. Therefore, during PDT ortissular oxygen measurement, oxygen may diffuse only fromthe CAM vasculature and from the tissues adjacent to the treatedzone, not from the shielded surface of the treated zone.
A PDT treatment zone, featuring blood vessels and capil-laries with diameters ranging from 5 to 300 μm, is visuallychosen, approximately in the middle of the zone under thecover-glass. The tip of the optical fiber (5) is aimed towardthe center of this zone and held at a distance of ≈100 μmabove the cover-glass. It is kept in place by a metal fiber holder(6). The PDT light is provided by a CW solid-state diode laser(2) (Oxxius, 405 nm, 1.3 mW total power at the distal end of
the fiber) and administered through a light distributor providinga homogenous spot (4) (MedLight Frontal light distributor,NA ¼ 0.37, core diameter 600 μm). This treatment fiber waschosen and its distance to the CAM adjusted so as to delivera homogeneous PDT treatment spot (diameter 8 mm) on theselected zone of the CAM vasculature. Small irradiances(≈2.5 mW∕cm2) are preferred to avoid significant photothermaleffects. The period during which the eggs are kept out of theincubator is limited to about 15 min. To keep the DF measure-ment durations small with respect to PDT exposure times, only30 consecutive laser sweeps on the same area are used and aver-aged for the oxygen measurements. Thus, the total acquisitiontime for one measurement is 3 s, compared to a minimum PDTexposure time of 75 s, and the corresponding total light dosedelivered by the probing laser is limited to ≈100 mJ∕cm2, ascompared to a minimum PDT light dose of ≈190 mJ∕cm2,both at 405 nm. A light dose of 100 mJ∕cm2 is found to havea barely detectable PDT vascular effect. Therefore, the minimalPDT light dose is set to approximately double this value. At theend of the PDT treatment, the cover-glass is carefully removedfrom the treated zone. Only very small iatrogenic damages areidentified after these mechanical operations. The eggs then arereturned to the incubator while waiting for the vascular damageassessment.
2.7 Vascular Damage Assessment
The treated eggs are taken out of the incubator 16 to 18 h aftertermination of the PDT irradiation protocol. This standard timeperiod has been in use in our laboratory for several years, partlyfor practical reasons, as the measurements are performed over-night.37 Although it was not methodically optimized, it corre-sponds to a state of the CAM where PDT damage has hadthe time to develop further while the counteracting processesof vessel repair and neo-angiogenesis have not yet interferedsignificantly with the PDT results.37
An intravenous (IV) injection of 20 μl of a 150 μM solutionof fluorescein isothiocyanate-dextran (FITC-dextran, 150 kDa,25 mg∕ml in NaCl 0.9%, Sigma Aldrich) is administered intoone of the large CAM veins, while 0.1 ml of India ink (Parker-Quink) is injected under the CAM into the extraembryoniccavity to increase contrast and screen out the continuously chan-ging background fluorescence.38 Vascular damage due to PDT isthen examined and recorded photographically with an epifluo-rescence microscope (Nikon E600FN, excitation wavelengthbetween 450 and 490 nm, emission wavelength >520 nm). Thedamage extent is classified on the basis of blood vessel closure:The diameter of the largest blood vessels closed by the PDT
Fig. 3 Chronograms of the illumination and measurement protocols.Shown here are the cumulative PDT irradiations, interspersed withO2 measurements during which the PDT source is suppressed. PDT irra-diation times were: a ¼ 150 s, b ¼ 75 s, c ¼ 375 s, d ¼ 150–900 s,while the O2 measurement duration was m ¼ 3 s.
Fig. 4 Description of the CAM study experimental apparatus. (a) Top view of a CAMmembrane ready for an experiment. (b) Details of a tissular oxygenmeasurement: (1) CAMmembrane; (2) protective drop of aqueous serum; (3) 0.19-mm cover-glass; (4) PDT treatment fiber; (5) excitation/probing fiber;(6) fiber holder. (c) (1) CAM in the open egg; (2) PDT treatment laser; (3) fiber used for PDT irradiation; (4) time-resolved spectrofluorometer with dyelaser excitation source; (5) excitation and probing fiber; and (6) fiber holder.
Journal of Biomedical Optics 115007-4 November 2012 • Vol. 17(11)
Piffaretti et al.: Real-time, in vivo measurement of tissular pO2 . . .
Downloaded From: http://biomedicaloptics.spiedigitallibrary.org/ on 12/06/2012 Terms of Use: http://spiedl.org/terms

treatment is used as an arbitrary index of vascular damage.Figure 5 shows examples of actual micrographs.
A drug-light interval of 4 h was chosen for the PDT proce-dure and used throughout this study [see Fig. 3(a) and 3(b) forthe experimental determination of this time interval]. The zonewhere ALA is topically administered then is selected to performDF measurements, as this results in an adequate signal-to-noiseratio. The treatment laser delivers 2.5 mW∕cm2 at 405 nm.
3 Results
3.1 In Vivo Measurement of Tissular pO2 as aFunction of PDT Irradiation Time
In a first series of experiments, DF-based O2 measurementswere performed on a number of egg batches (each one compris-ing 12 to 20 eggs), subjected to increasing cumulated PDTirradiation times. Three slightly different illumination protocolswere used (see Fig. 4 and PMGQ3PMGQ and Sec. 2 of thispaper).
The left vertical scale of Fig. 6 shows the measured recipro-cal lifetime of PpIX’s DF plotted against the total illuminationtime (horizontal axis). The right vertical scale of the figure givesthe corresponding (computed) tissular pO2, using the Stern-Volmer equation, in which Kq was derived from previousexperiments.22
Clearly, the tissular oxygen concentration decreases duringthe first 500 s of cumulated PDT time, for a cumulated lightdose of 1.25 J∕cm2. At longer treatment times, it reaches anasymptotic residual value, close to zero. The relatively largeerror bars (�1 standard deviation) probably relate to inhomo-geneities in the distribution of the PS and/or local differencesin the aptitude of CAM tissues to renew the O2 consumed bythe PDT process, depending on their level of metabolism and
degree of vascularization. It can be seen that differencesascribable to illumination protocol, if any, are negligible inthis experimental context.
3.2 Tissular Oxygen Depletion as an Index of PDTEfficiency
A second experiment was then performed on five lots of 20eggs, submitted to different PDT optical doses, using illumina-tion Protocol III (see above for details of egg/CAM handling).
The baseline value of tissular pO2 was first determined foreach untreated egg before starting the chosen PDT irradiationprotocol, using the described PpIX DF reciprocal lifetime deter-mination. The eggs were then submitted to PDT illumination
Fig. 5 Fluorescence images of CAM vessels at various magnification factors. PDT-induced vessel damages in the CAM model made visible by an IVinjection of FITC-dextran, drug-light interval of 4 h. (a) and (b) before any PDT irradiation, intact vessels; (c) and (d) vascular damage observed 17 h afterirradiation with 2.25 J∕cm2 at 405 nm, 2.5 mW∕cm2, laser spot diameter: 5 mm. (a) and (c): objective 4×; (b, d) objective 10×.
Fig. 6 Plot of DF and oxygen partial pressure in tissue during PDT treat-ment. DF reciprocal lifetime of PpIX in the in vivo CAM model as afunction of PDT duration. Protocol I (○), Protocol II (•), Protocol III(▪). The curve is presented for visual assistance only.
Journal of Biomedical Optics 115007-5 November 2012 • Vol. 17(11)
Piffaretti et al.: Real-time, in vivo measurement of tissular pO2 . . .
Downloaded From: http://biomedicaloptics.spiedigitallibrary.org/ on 12/06/2012 Terms of Use: http://spiedl.org/terms

under a constant irradiance of 2.5 mW∕cm2 at 405 nm for dif-ferent durations (150, 300, 450, 600, 900 s), corresponding tooptical light doses of 0.38, 0.75, 1.14, 1.50, and 2.25 J∕cm2,respectively.
Immediately after treatment, each egg’s tissular O2 concen-tration was again measured with the same method. The differ-ence between the initial and final DF reciprocal lifetimes wasused as a measure of tissular O2 depletion ascribable to the PDTtreatment. Figure 7 illustrates this increasing oxygen depletionas a function of PDT illumination time.
The eggs were then returned to the incubator for 16 to 18 h.Finally, the extent of vascular damage caused by the PDT wasdetermined using a simple arbitrary damage index describedabove.
In Fig. 8(a), the vascular damage index is plotted as a func-tion of the PDT treatment duration. As expected, the data showsa clear, positive correlation between those two parameters.Although, as already noted, the tissular pO2 does not decreasesignificantly anymore for PDT illumination periods longer thanabout 500 s (Fig. 6), the observed tissular damage does continueto increase with increasing light doses, at least until the irradia-tion time of 900 s. This suggests that the PDT mechanism is stilloperating at very low oxygen concentrations.
Figure 8(b) shows the vascular damage index as a function ofthe reciprocal lifetime difference, a measure of tissular oxygenreduction during the treatment. Here again, a strong, positivecorrelation between the two parameters is clearly visible.
4 DiscussionThis paper reports a first study aiming at measuring, in vivo andin real time, the level of molecular oxygen contained in tissue,using the DF of a PS, in order to optimize PDT. The resultsdemonstrate a clear correlation between the PDT-induced vas-cular damage and the reduction in tissular oxygen concentration,as assessed by the change in DF lifetime. This agrees with pre-vious works8,9,39,40 regarding the role played by oxygen in PDT-induced tissue damage. Thus, adjusting the PDT light dosebased on a real-time estimate of tissular pO2 monitored throughthe PS’s DF appears feasible. This approach then might enablecontrolling the efficacy of PDT, and reducing intra- and inter-patient fluctuations in this treatment’s clinical outcome.
The method presented here does not require the use of exo-genous oxygen sensors since it is based on detecting the DF ofthe PS itself. This feature is important because, besides ALA,several other precursors of PpIX are now approved by the med-ical authorities of a number of countries. This is an implicit lightdosimetry method because the pO2 value (or its reduction, bothbeing related to the production of singlet oxygen) is measuredclose to the PS (about 1 μm). Such a method is likely to be muchmore directly related to PDT’s tissular effects than approachesrelying on explicit light dosimetry (light dose, PS global con-centration, etc.).5,16,41–43 In addition, most of these other meth-ods for quantifying the outcome of PDT suffer from the fact thatthe pO2 is not measured at a subcellular or tissular scale.
In similar research, Mik et al. report in vitro and in vivoexperiments using PpIX’s DF lifetime signals, to assess theamount of oxygen in tissues.27,44 However, as compared to otheroxygen-sensing techniques, DF measurements have the advan-tage that they record the oxygen concentration in close proxi-mity to the photosensitizer. In fact, given the diffusivity ofmolecular oxygen (3O2) in tissue (D ≈ 1.7 · 10−5 cm2∕s),45,46and using PpIX’s triplet state maximum lifetime in vivo(τ ≈ 60 μs), the distance reachable by anO2 molecule to interactwith excited PpIX molecules is calculated to be on the orderof ≈1 μm (δ ¼ pð6DτÞ.47 If the same computation is donefor singlet oxygen (1O2), characterized by much shorter lifetime
Fig. 7 Reciprocal lifetime difference as a function of PDT illuminationtime. Error bars represent standard deviations. The curve is presentedfor visual assistance.
Fig. 8 Plot of PDT-induced vessel damages in the CAM model. (a) As a function of PDT duration; (b) as a function of tissular oxygen reduction, takenas the difference between final and initial reciprocal PpIX DF lifetimes. Error bars are standard deviations.
Journal of Biomedical Optics 115007-6 November 2012 • Vol. 17(11)
Piffaretti et al.: Real-time, in vivo measurement of tissular pO2 . . .
Downloaded From: http://biomedicaloptics.spiedigitallibrary.org/ on 12/06/2012 Terms of Use: http://spiedl.org/terms

of approximately 250 ns, the reachable radius is less than40 nm,24 indicating that the photo-damages are induced atthe close vicinity of the photosensitizing molecule. On theother hand, the critical oxygen diffusion distance, usuallydefined as the distance between a hypoxic tissue (i.e., a tissuein a situation of critically low oxygen level) and the nearest ves-sel was measured by Grote et al. to be on the order of 100 μm ina tumoral tissue.45 It is therefore clear that this DF-based oxygensensing method is able to spatially discriminate betweenhypoxic zones and normally oxygenated tissue, providingthat the excitation and/or emission light are administered and/or detected with the appropriate resolution. It is also worth not-ing that during the several hours of incubation, ALA is absorbedby the vasculature, where it circulates, and then diffuses out ofthe vasculature into almost all egg tissues. This is why PpIX areformed and accumulated apparently with different concentra-tions in most of the tissues of the chicken embryo.
Since in this study both the light used to excite the DF and thelight used for PDT have the same wavelength, the DF excitationmight itself induce some level of pO2 reduction, PpIX photo-bleaching, and vascular damage, thus leading to artifacts. How-ever, the DF excitation light dose used here is much smaller thanthe one used to induce the smallest detectable PDT effect, and ina previous study,22 it was demonstrated that, in the absence ofPDT irradiation, the DF excitation light does not induce anydetectable vascular effect in similar conditions. Finally, the DFlifetimes measured with the three different illumination proto-cols confirm that the contribution to vessel closure of this exci-tation light (which differs according to the protocol used) isnegligible (see Fig. 6).
A drug-light interval of 4 h was used for the present study. Itshould be noted that other incubation periods may lead to othervalues of the DF lifetimes, even if all other conditions are iden-tical, since it is well known that the PpIX buildup, which takesplace in specific tissue/cellular compartments, is followed by adiffusion of the PS to other compartments that present othermicroenvironments.48 The changed microenvironments thenmay lead to changed local pO2 and hence change in DF lifetime,as well as changed vascular occlusion efficiency. As a conse-quence, it could be that the results reported in Figs. 6 and 8may differ if longer or shorter drug-light intervals are used.
The relatively large error bars affecting the DF lifetimes pre-sented in Figs. 6–8 may well be due to local differences in tissueoxygen renewal during PDT. These local differences could, forexample, be due to spatial and/or temporal differences in themetabolic activity, blood perfusion, inhomogeneous distributionof the PS, etc. Therefore, one approach to reducing these fluc-tuations would consist of probing a larger area (typically 1–2 cmin diameter) so that the measurement is averaged over a largersurface. These observations furthermore suggest that it might beof interest to image the PS’s DF lifetime at “high” spatial reso-lution in the hope of getting information regarding the changesof tissue oxygenation at a tissular and even a cellular level.Recording such images at different times after the beginning ofPDT and at different drug-light intervals would certainly help toidentify treatment strategies to target specific tissue structures(vessels versus stroma, for instance).
Finally, it should be noted that due to the instrumentationand the shot noise, the fluctuations affecting the DF lifetimemeasurements are negligible compared to the other factorsmentioned above. Indeed, repeated measurements performedin identical conditions, at the same location and on the same
sample, confirm this. Nevertheless, if necessary, the shot noisecan be improved further by reducing the time during which thedetector is blinded to reject the prompt fluorescence. The result-ing increase of DF radiant energy detected will decrease the shotnoise, but it also will increase the risk of detecting (a) the emis-sion of other endogenous luminophores presenting “long” (i.e.,between 100 ns and 1 μs) luminescence lifetimes; and (b) lumi-nescence emitted by the instrumentation (laser spontaneousemission, luminescence from the optics in the setup). This iswhy, in this study, a time delay of 3 μs was selected to “blind”the detector, which corresponds to an optimal tradeoff betweenthis delay and the observed signal-to-noise ratio.
The error bars affecting the measurements of the diameter ofthe largest occluded blood vessels, which are shown in Fig. 8 arelikely to be due to various factors, including the following:
(a) The selection of the area treated by PDT. Indeed,somewhat different results may be obtained if therelative density of large and small vessels, or of veinsversus arteries, differs from place to place. Althoughthe relative importance of this source of fluctuationsis difficult to assess quantitatively, it probably plays aminor role, as described by Lange et al.20 who used asimilar metric to quantify the vascular effects inducedby PDT in the CAM model.
(b) The inhomogeneous distribution of PpIX, as reportedby many studies.49,50
(c) Intrinsic errors while measuring the vessels diameter.The fluctuations due to this last element could bereduced using quantitative image analysis programsto characterize the vascular network, as proposed byRef. 51. One may conclude, considering the above-mentioned factors, which are possibly responsible forthe rather large fluctuations affecting measurementsof the DF lifetime and blood vessel closure efficacy,that probing of larger well-selected areas, as indi-cated above, most likely will help to reduce thesefluctuations.
The results presented in Fig. 8(b) indicate that the vascularocclusion effects of PDT and the differences in reciprocal DFlifetime, which is a metric for the tissular oxygen reduction,are correlated. For illumination periods longer than 500 s(1.25 J∕cm2), it is noteworthy that the vascular damage con-tinues to increase, despite the fact that the measured residualpO2 does not decrease significantly anymore after 500 s (it isthen already very close to 0%, as shown in Fig. 6). This indicatesthat some PDT-related mechanism continues to be effective atvery low pO2. One possible explanation is that all the oxygenprovided by the bloodstream is consumed immediately duringthe PDT illumination. This hypothesis is realistic since the bloodvessels affected by PDT, depending on their size among others,will close to a large extent, after the end of the illumination,52 atthe applied conditions. Consequently, in such conditions, thePDT effect would be “oxygen supply dependent,” as reportedelsewhere.53–55 Other phototoxic mechanisms that do not in-volve molecular oxygen, as suggested by Plaetzer et al.,56 couldalso cause a PDT effect in the absence of a significant pO2. It ispossible that experiments similar to those presented in thispaper, but performed at different fluence rates, may help toreveal the nature of these effects.
Finally, note that the approach presented here is of interest,not only for PpIX-based PDT, but also when other PSs with a
Journal of Biomedical Optics 115007-7 November 2012 • Vol. 17(11)
Piffaretti et al.: Real-time, in vivo measurement of tissular pO2 . . .
Downloaded From: http://biomedicaloptics.spiedigitallibrary.org/ on 12/06/2012 Terms of Use: http://spiedl.org/terms

detectable DF or a difficult-to-detect phosphorescence is used.One may even suggest that the technique presented in this paperbe used to monitor the pO2 during the treatment of age-relatedmacular degeneration (AMD) with Visudyne®. Indeed, applica-tion of the DF measurements to the retina may be helped by theunique optical properties of the eye, and using such measure-ments may help compensate, to some extent, for the inter-patientfluctuations observed during AMD-PDT.57
In conclusion, the present work has demonstrated in vivo thatthe DF of a photosensitizer can be used to determine the pO2 intissues and help to predict PDT’s tissular effects. Applicationsof this approach to other systems are numerous, and this tech-nology may help improve understanding of the mechanismsinvolved in the oxygenation and photosensitization of variousmaterials, including biological tissues.
AcknowledgmentsThis work was supported by the Swiss National Science Foun-dation (Grant No. 205320-130518) and funded in part by theJ. Jacobi Trust. We gratefully acknowledge editorial support byMatthieu Zellweger.
References1. P. Agostinis et al., “Photodynamic therapy of cancer: an update,” CA
Cancer J. Clin. 61(4), 250–281 (2011).2. A. Weiss et al., “Angiogenesis inhibition for the improvement of photo-
dynamic therapy: the revival of a promising idea,” BBA Rev. Cancer1826(1), 53–70 (2012).
3. N. Fotinos et al., “5-Aminolevulinic acid derivatives in photomedicine:characteristics, application and perspectives,” Photochem. Photobiol.82(4), 994–1015 (2006).
4. S. Radakovic-Fijan et al., “Efficacy of three different light doses in thetreatment of actinic keratosis with 5-aminolevulinic acid photodynamictherapy: a randomized, observer-blinded, intrapatient, comparisonstudy,” J. Am. Acad. Dermatol. 53(5), 823–827 (2005).
5. T. Glanzmann et al., “Pharmacokinetics of tetra(m-hydroxyphenyl)chlorin in human plasma and individualized light dosimetry in photo-dynamic therapy,” Photochem. Photobiol. 67(5), 596–602 (1998).
6. T. M. Busch, “Local physiological changes during photodynamic ther-apy,” Lasers Surg. Med. 38(5), 494–499 (2006).
7. M. Arabi andM. Piert, “Hypoxia PET/CT imaging: implications for radia-tion oncology,” Q. J. Nucl. Med. Mol. Imaging 54(5), 500–509 (2010).
8. J. Moan and P. Juzenas, “Singlet oxygen in photosensitization,”J. Environ. Pathol. Toxicol. Oncol. 25(1–2), 29–50 (2006).
9. R. Schmidt, “Photosensitized generation of singlet oxygen,” Photo-chem. Photobiol. 82(5), 1161–1177 (2006).
10. M. J. Niedre et al., “Singlet oxygen luminescence as an in vivo photo-dynamic therapy dose metric: validation in normal mouse skin withtopical aminolevulinic acid,” Br. J. Cancer 92(2), 298–304 (2005).
11. B. Kruijt et al., “Monitoring ALA-induced PpIX photodynamic therapyin the rat esophagus using fluorescence and reflectance spectroscopy,”Photochem. Photobiol. 84(6), 1515–1527 (2008).
12. C. Sheng et al., “Photobleaching-based dosimetry predicts depositeddose in ALA-PpIX PDT of rodent esophagus,” Photochem. Photobiol.83(3), 738–748 (2007).
13. Z. Huang, “A review of progress in clinical photodynamic therapy,”Technol. Cancer Res. Treat. 4(3), 283–293 (2005).
14. B. C. Wilson, M. S. Patterson, and L. Lilge, “Implicit and explicit dosi-metry in photodynamic therapy: a new paradigm,” Lasers Med. Sci.12(3), 182–199 (1997).
15. P. Nowak-Sliwinska et al., “Study of the pO2-sensitivity of the dendri-meric and free forms of Pd-meso-tetra(4-carboxyphenyl)porphyrin,incorporated or not in chitosan-based nanoparticles,” Chimia 65(9),691–695 (2011).
16. K. K. Wang et al., “Simulations of measured photobleaching kinetics inhuman basal cell carcinomas suggest blood flow reductions duringALA-PDT,” Lasers Surg. Med. 41(9), 686–696 (2009).
17. M. Forrer et al., “In-vivo measurement of fluorescence bleaching ofmeso-tetra hydroxy phenyl chlorin (mthpc) in the oesophagus andthe oral cavity,” Proc. SPIE 2627(1), 33–39 (1995).
18. R. Hornung et al., “Systemic application of photosensitizers in the chickchorioallantoic membrane (CAM) model: photodynamic response ofCAM vessels and 5-aminolevulinic acid uptake kinetics by transplan-table tumors,” J. Photochem. Photobiol. B 49(1), 41–49 (1999).
19. P. Nowak-Sliwinska et al., “Vascular regrowth following photodynamictherapy in the chicken embryo chorioallantoic membrane,” Angiogen-esis 13(4), 281–292 (2010).
20. N. Lange et al., “A new drug-screening procedure for photosensitizingagents used in photodynamic therapy for CNV,” Invest. Ophthalmol.Vis. Sci. 42(1), 38–46 (2001).
21. E. G. Mik et al., “Mitochondrial pO2 measured by delayed fluorescenceof endogenous protoporphyrin IX,” Nat. Meth. 3(11), 939–945 (2006).
22. F. Piffaretti et al., “Optical fiber-based setup for in vivo measurement ofthe delayed fluorescence lifetime of oxygen sensors,” J. Biomed. Opt.16(3), 037005 (2011).
23. R. W. Redmond and J. N. Gamlin, “A compilation of singlet oxygenyields from biologically relevant molecules,” Photochem. Photobiol.70(4), 391–475 (1999).
24. M. J. Niedre et al., “Imaging of photodynamically generated singletoxygen luminescence in vivo,” Photochem. Photobiol. 81(4), 941–943(2005).
25. T. K. Stepinac et al., “Light-induced retinal vascular damage by Pd-porphyrin luminescent oxygen probes,” Invest. Ophth. Vis. Sci. 46(3),956–966 (2005).
26. T. Glanzmann et al., “Time-resolved spectrofluorometer for clinicaltissue characterization during endoscopy,” Rev. Sci. Instr. 70(10),4067–4077 (1999).
27. E. G. Mik et al., “Mitochondrial pO2 measured by delayed fluorescenceof endogenous protoporphyrin IX,” Nat. Meth. 3(11), 939–945 (2006).
28. F. Piffaretti et al., “Optical fiber-based setup for in vivo measurement ofthe delayed fluorescence lifetime of oxygen sensors,” J. Biomed. Opt.16(3), 037005 (2011).
29. D. W. Marquardt, “An algorithm for least-squares estimation of non-linear parameters,” J. Soc. Indus. Appl. Math. 11(2), 431–441 (1963).
30. J. More, “The Levenberg-Marquardt algorithm: implementation andtheory,” Numerl. Anal. 630(105–116), (1978).
31. E. G. Mik et al., “Excitation pulse deconvolution in luminescence life-time analysis for oxygen measurements in vivo,” Photochem. Photobiol.76(1), 12–21 (2002).
32. G. E. P. Box, G. M. Jenkins, and G. C. Reinsel, “Time series analysis,” inForecasting and Control, N. J. W. Hoboken, Ed., pp. 746–755 (2008).
33. A. Fasso, “Residual autocorrelation distribution in the validation dataset,” J. Time Ser. Anal. 21(2), 143–153 (2000).
34. C. Hoppenheit et al., “Pharmacokinetics of the photosensitizers amino-levulinic acid and aminolevulinic acid hexylester in oro-facial tumorsembedded in the chorioallantois membrane of a hen’s egg,” CancerBiother. Radiopharm. 21(6), 569–578 (2006).
35. R. Hornung et al., “Systemic application of photosensitizers in the chickchorioallantoic membrane (CAM) model: photodynamic response ofCAM vessels and 5-aminolevulinic acid uptake kinetics by transplan-table tumors,” J. Photochem. Photobiol. B 49(1), 41–49 (1999).
36. M. J. Hammer-Wilson et al., “Photodynamic parameters in the chickchorioallantoic membrane (CAM) bioassay for photosensitizers admi-nistered intraperitoneally (IP) into the chick embryo,” Photochem.Photobiol. Sci. 1(9), 721–728 (2002).
37. N. Lange et al., “A new drug-screening procedure for photosensitizingagents used in photodynamic therapy for CNV,” Invest. Ophthalmol.Vis. Sci. 42(1), 38–46 (2001).
38. S. H. Lim et al., “The neovessel occlusion efficacy of 15-hydroxy-purpurin-7-lactone dimethyl ester induced with photodynamic therapy,”Photochem. Photobiol. 86(2), 397–402 (2010).
39. S. Lee et al., “Pulsed diode laser-based singlet oxygen monitor forphotodynamic therapy: In vivo studies of tumor-laden rats,” J. Biomed.Opt. 13(6), 064035 (2008).
40. B. C. Wilson and M. S. Patterson, “The physics, biophysics, and tech-nology of photodynamic therapy,” Phys Med Biol 53(9), R61–109 (2008).
41. M. T. Jarvi et al., “Singlet oxygen luminescence dosimetry (SOLD) forphotodynamic therapy: current status, challenges and future prospects,”Photochem. Photobiol. 82(5), 1198–1210 (2006).
Journal of Biomedical Optics 115007-8 November 2012 • Vol. 17(11)
Piffaretti et al.: Real-time, in vivo measurement of tissular pO2 . . .
Downloaded From: http://biomedicaloptics.spiedigitallibrary.org/ on 12/06/2012 Terms of Use: http://spiedl.org/terms

42. I. Georgakoudi and T. H. Foster, “Singlet oxygen- versus nonsingletoxygen-mediated mechanisms of sensitizer photobleaching and theireffects on photodynamic dosimetry,” Photochem. Photobiol. 67(6),612–625, (1998).
43. A. P. Castano, T. N. Demidova, and M. R. Hamblin, “Mechanisms inphotodynamic therapy: Part 1—Photosensitizers, photochemistry, andcellular localization,” Photodiag. Photodyn. Ther. 1(4), 279–293 (2004)
44. E. G. Mik et al., “In vivo mitochondrial oxygen tension measured by adelayed fluorescence lifetime technique,” Biophys J. 95(8), 3977–3990(2008).
45. J. Grote, R. Susskind, and P. Vaupel, “Oxygen diffusivity in tumor tissue(DS-carcinosarcoma) under temperature conditions within the range of20–40°C,” Pflugers Arch. 372(1), 37–42 (1977).
46. J. Moan and K. Berg, “The photodegradation of porphyrins in cells canbe used to estimate the lifetime of singlet oxygen,” Photochem. Photo-biol. 53(4), 549–553 (1991).
47. K. Plaetzer et al., “Photophysics and photochemistry of photodynamictherapy: fundamental aspects,” Lasers Med. Sci. 24(2), 259–268 (2009).
48. M. Ascencio et al., “Comparison of continuous and fractionated illumi-nation during hexaminolaevulinate-photodynamic therapy,” Photodiag.Photodyn. Ther. 5(3), 210–216 (2008).
49. K. K. Wang et al., “Irradiation-induced enhancement of Pc 4 fluores-cence and changes in light scattering are potential dosimeters forPc 4-PDT,” Photochem. Photobiol. 83(5), 1056–1062 (2007).
50. P. Uehlinger et al., “On the role of iron and one of its chelating agents inthe production of protoporphyrin IX generated by 5-aminolevulinic acidand its hexyl ester derivative tested on an epidermal equivalent of humanskin,” Photochem. Photobiol. 82(4), 1069–1076 (2006).
51. P. Nowak-Sliwinska et al., “Processing of fluorescence angiograms forthe quantification of vascular effects induced by anti-angiogenic agentsin the CAM model,” Microvasc. Res. 79(1), 21–28 (2010).
52. E. Debefve et al., “Video monitoring of neovessel occlusion induced byphotodynamic therapy with verteporfin (Visudyne), in the CAMmodel,” Angiogenesis 11(3), 235–243 (2008).
53. T. H. Foster et al., “Oxygen consumption and diffusion effects in photo-dynamic therapy,” Radiat. Res. 126(3), 296–303 (1991).
54. A. T. Nathan and M. Singer, “The oxygen trail: tissue oxygenation,”Br. Med. Bull. 55(1), 96–108 (1999).
55. T. Schunck and P. Poulet, “Oxygen consumption through metabolismand photodynamic reactions in cells cultured on microbeads,” Phys.Med. Biol. 45(1), 103–119 (2000).
56. K. Plaetzer et al., “Photophysics and photochemistry of photodyna-mic therapy: fundamental aspects,” Lasers Med. Sci. 24(2), 259–268(2009).
57. A. F. Cruess et al., “Photodynamic therapy with verteporfin in age-related macular degeneration: a systematic review of efficacy, safety,treatment modifications, and pharmacoeconomic properties,” Acta.Ophthalmol. 87(2), 118–132 (2009).
Journal of Biomedical Optics 115007-9 November 2012 • Vol. 17(11)
Piffaretti et al.: Real-time, in vivo measurement of tissular pO2 . . .
Downloaded From: http://biomedicaloptics.spiedigitallibrary.org/ on 12/06/2012 Terms of Use: http://spiedl.org/terms
Copyright © 2022 FDOKUMEN