Detection of the location of pneumothorax in chest X-rays ...
Upload
independentCategory
view
5download
0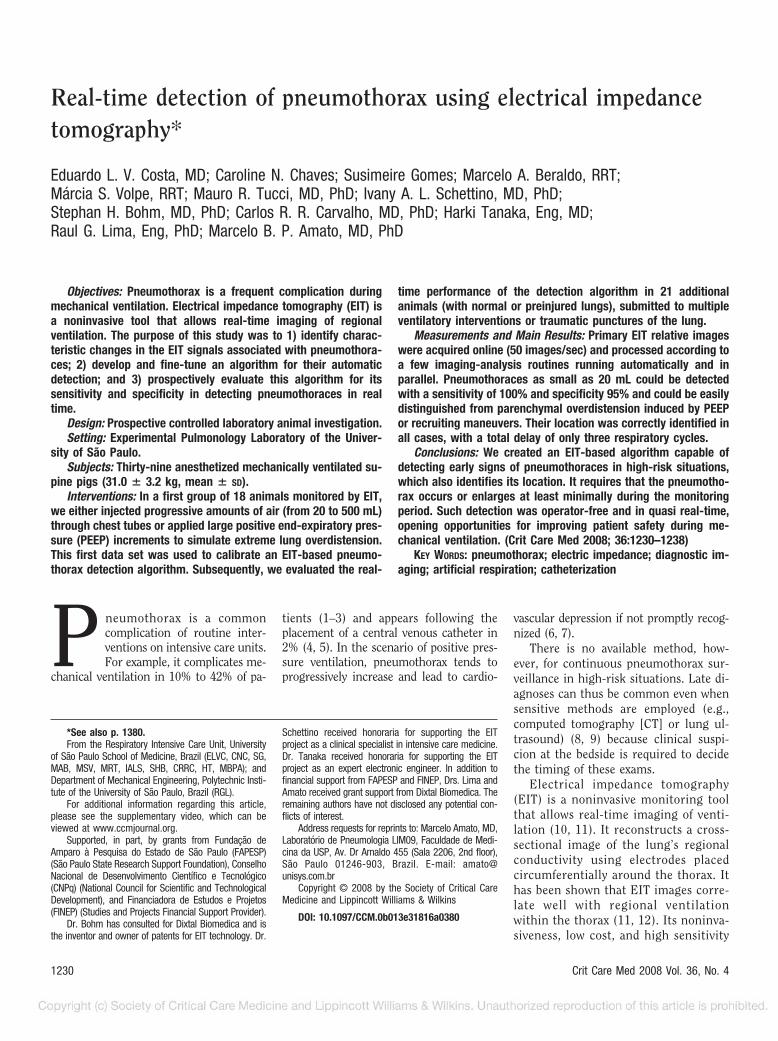
Real-time detection of pneumothorax using electrical impedancetomography*
Eduardo L. V. Costa, MD; Caroline N. Chaves; Susimeire Gomes; Marcelo A. Beraldo, RRT;Márcia S. Volpe, RRT; Mauro R. Tucci, MD, PhD; Ivany A. L. Schettino, MD, PhD;Stephan H. Bohm, MD, PhD; Carlos R. R. Carvalho, MD, PhD; Harki Tanaka, Eng, MD;Raul G. Lima, Eng, PhD; Marcelo B. P. Amato, MD, PhD
Pneumothorax is a commoncomplication of routine inter-ventions on intensive care units.For example, it complicates me-
chanical ventilation in 10% to 42% of pa-
tients (1–3) and appears following theplacement of a central venous catheter in2% (4, 5). In the scenario of positive pres-sure ventilation, pneumothorax tends toprogressively increase and lead to cardio-
vascular depression if not promptly recog-nized (6, 7).
There is no available method, how-ever, for continuous pneumothorax sur-veillance in high-risk situations. Late di-agnoses can thus be common even whensensitive methods are employed (e.g.,computed tomography [CT] or lung ul-trasound) (8, 9) because clinical suspi-cion at the bedside is required to decidethe timing of these exams.
Electrical impedance tomography(EIT) is a noninvasive monitoring toolthat allows real-time imaging of venti-lation (10, 11). It reconstructs a cross-sectional image of the lung’s regionalconductivity using electrodes placedcircumferentially around the thorax. Ithas been shown that EIT images corre-late well with regional ventilationwithin the thorax (11, 12). Its noninva-siveness, low cost, and high sensitivity
Objectives: Pneumothorax is a frequent complication duringmechanical ventilation. Electrical impedance tomography (EIT) isa noninvasive tool that allows real-time imaging of regionalventilation. The purpose of this study was to 1) identify charac-teristic changes in the EIT signals associated with pneumothora-ces; 2) develop and fine-tune an algorithm for their automaticdetection; and 3) prospectively evaluate this algorithm for itssensitivity and specificity in detecting pneumothoraces in realtime.
Design: Prospective controlled laboratory animal investigation.Setting: Experimental Pulmonology Laboratory of the Univer-
sity of São Paulo.Subjects: Thirty-nine anesthetized mechanically ventilated su-
pine pigs (31.0 � 3.2 kg, mean � SD).Interventions: In a first group of 18 animals monitored by EIT,
we either injected progressive amounts of air (from 20 to 500 mL)through chest tubes or applied large positive end-expiratory pres-sure (PEEP) increments to simulate extreme lung overdistension.This first data set was used to calibrate an EIT-based pneumo-thorax detection algorithm. Subsequently, we evaluated the real-
time performance of the detection algorithm in 21 additionalanimals (with normal or preinjured lungs), submitted to multipleventilatory interventions or traumatic punctures of the lung.
Measurements and Main Results: Primary EIT relative imageswere acquired online (50 images/sec) and processed according toa few imaging-analysis routines running automatically and inparallel. Pneumothoraces as small as 20 mL could be detectedwith a sensitivity of 100% and specificity 95% and could be easilydistinguished from parenchymal overdistension induced by PEEPor recruiting maneuvers. Their location was correctly identified inall cases, with a total delay of only three respiratory cycles.
Conclusions: We created an EIT-based algorithm capable ofdetecting early signs of pneumothoraces in high-risk situations,which also identifies its location. It requires that the pneumotho-rax occurs or enlarges at least minimally during the monitoringperiod. Such detection was operator-free and in quasi real-time,opening opportunities for improving patient safety during me-chanical ventilation. (Crit Care Med 2008; 36:1230–1238)
KEY WORDS: pneumothorax; electric impedance; diagnostic im-aging; artificial respiration; catheterization
*See also p. 1380.From the Respiratory Intensive Care Unit, University
of São Paulo School of Medicine, Brazil (ELVC, CNC, SG,MAB, MSV, MRT, IALS, SHB, CRRC, HT, MBPA); andDepartment of Mechanical Engineering, Polytechnic Insti-tute of the University of São Paulo, Brazil (RGL).
For additional information regarding this article,please see the supplementary video, which can beviewed at www.ccmjournal.org.
Supported, in part, by grants from Fundação deAmparo à Pesquisa do Estado de São Paulo (FAPESP)(São Paulo State Research Support Foundation), ConselhoNacional de Desenvolvimento Científico e Tecnológico(CNPq) (National Council for Scientific and TechnologicalDevelopment), and Financiadora de Estudos e Projetos(FINEP) (Studies and Projects Financial Support Provider).
Dr. Bohm has consulted for Dixtal Biomedica and isthe inventor and owner of patents for EIT technology. Dr.
Schettino received honoraria for supporting the EITproject as a clinical specialist in intensive care medicine.Dr. Tanaka received honoraria for supporting the EITproject as an expert electronic engineer. In addition tofinancial support from FAPESP and FINEP, Drs. Lima andAmato received grant support from Dixtal Biomedica. Theremaining authors have not disclosed any potential con-flicts of interest.
Address requests for reprints to: Marcelo Amato, MD,Laboratório de Pneumologia LIM09, Faculdade de Medi-cina da USP, Av. Dr Arnaldo 455 (Sala 2206, 2nd floor),São Paulo 01246-903, Brazil. E-mail: [email protected]
Copyright © 2008 by the Society of Critical CareMedicine and Lippincott Williams & Wilkins
DOI: 10.1097/CCM.0b013e31816a0380
1230 Crit Care Med 2008 Vol. 36, No. 4

to changes in thoracic air content makeEIT a promising real-time screeningmethod for pneumothoraces in high-risk situations.
The purpose of this study was to 1)identify characteristic changes in EIT sig-nals associated with pneumothoraces; 2)develop and fine-tune an algorithm fortheir automatic detection; and 3) pro-spectively evaluate the algorithm for itssensitivity and specificity in detectingpneumothoraces in real time.
MATERIALS AND METHODS
Experimental Setup
Experiments were performed on 39 anes-thetized supine Landrace pigs (31.0 � 3.2 kg,mean body weight � SD) following the guide-lines of animal experimentation after approvalby the local animal care committee (details inAppendix).
Electric Impedance Tomography
EIT data were acquired using the imped-ance tomography platform called enlight,which was developed by our group (Experi-mental Pulmonology Laboratory, PolytechnicInstitute of the University of São Paulo andDixtal Biomedica Ltd, São Paulo, Brazil) capa-ble of producing 50 online images per second.After measuring the thoracic perimeter, 32self-adhesive electrodes were placed equidis-tantly around the circumference of the thoraxjust below the level of the axilla. Smallamounts of electrical currents (5–8 mA; 125kHz) were injected in a rotating sequencethrough pairs of electrodes, with one nonin-jecting electrode interposed between the in-jecting electrodes. During an injection pat-tern, the noninjecting electrodes were used tomeasure 29 differential voltages between elec-trode pairs. One complete acquisition cycle of32 current patterns produced 928 voltagemeasurements comprising one “raw voltageframe” used as an input for a relative EITimage. These images were generated by a re-construction algorithm for a cross section ofthe thorax, which is based on a sensitivitymatrix derived from a three-dimensional finiteelement model (14) (Appendix). A “primaryrelative image” is created by comparing themost recent raw voltage frame with a refer-ence or baseline frame chosen by the investi-gator. Output pixel values represent percent-age changes in local tissue impedance, fromreference to present time.
As shown previously, the average (or sim-ple sum) of all pixel values within each outputimage can be plotted against the timeline,producing a global EIT plethysmographic sig-nal. Such signal is linearly related to changes
in parenchymal air content (11, 15). This con-cept can be applied regionally, within regionsof interest, producing regional EIT plethysmo-graphic signals. Details about the resolution/precision and noise of our EIT device can befound in the Appendix.
Concept of PneumothoraxDetection by EIT
Ventilation Maps. Victorino et al. (11)showed that tidal oscillations in pixel valuesare proportional to tidal oscillations in tissueaeration. By calculating the amplitude of theseoscillations (tidal �Z � delta impedance)along a sequence of primary relative imagesfor a fixed pixel, one can estimate the local rateof ventilation and represent it by a color code.Such a procedure generates yet another de-rived image henceforth called a ventilationmap, which is similar to the concept of func-tional images introduced by Frerichs (16)(Fig. 1).
During this study, ventilation maps wererepeatedly refreshed every 9 secs, correspond-ing to the accumulation of 450 new primaryrelative images in an accrual image buffer.Perturbations caused by perfusion artifactswere attenuated in such maps by frequency-dependent filtering (Appendix).
Aeration Change Maps. Similarly to theimage buffers described previously, the mostrecent raw voltages frames were also sent toan accrual voltage buffer containing 9 secsof data. Aeration change maps can be con-sidered as secondary relative images derivedfrom the comparison between one currentraw voltage buffer, still in the random accessmemory, and a reference buffer previouslystored. Voltages within both buffers wereaveraged along the time, producing two sin-gle averaged-voltage frames representing
current and baseline conditions, respec-tively, which then served as inputs for arelative-image reconstruction. The currentbuffer was constantly refreshed, while thereference was maintained to represent themoment just before any intervention orpneumothorax induction. The relative im-age produced by such inputs representedsustained changes in thoracic impedanceand easily identified regional changes infunctional residual capacity. The averagingprocess filtered out transient changes in im-pedance produced by tidal breathing.
Interpreting the Maps and DetectingPneumothoraces. Our algorithm for detectingpneumothoraces is based on the online anal-ysis of ventilation maps and aeration changemaps repeatedly refreshed after the accumu-lation of new image/voltage buffers (typicallyencompassing the last two to three completerespiratory cycles). In preliminary experi-ments, we observed that pneumothoracescaused characteristic perturbations in bothmaps: a localized bright spot in the aerationchange map—close to the site of air injec-tion—with a corresponding defect in the ven-tilation map (Figs. 1 and 2; see also supple-mental online video). We reasoned that theformer perturbation reflected a localized fixedincrement in impedance caused by air pocketsforming in the pleural space, whereas the lat-ter represented the diminution of tidal venti-lation and local compliance in this area due tothe extrapulmonary air.
After computing the magnitude of suchperturbations in each quadrant of the maps(see Experimental Protocol Section, part 1),we created a quasi online algorithm for de-termining the presence/absence of a pneu-mothorax as well as its location (Appendix).After some brief data collection during sta-ble baseline conditions, the algorithm was
Figure 1. Computed tomography (CT), ventilation map, and aeration change map obtained at baseline(top) and after injecting 100 mL of air into the pleural space of the left upper quadrant (bottom). Thearrow points to the induced pneumothorax (left, bottom).
1231Crit Care Med 2008 Vol. 36, No. 4
ready to run in real time and the animalswere submitted to multiple interventions.Every two breaths, after processing the re-cently buffered information, the algorithmhad to display a refreshed message and, incase of positive detection, to indicate thequadrant in which the pneumothorax wasdeveloping.
Experimental Protocol
Throughout the protocol, ventilation wasdelivered in pressure control mode, inspiratory-to-expiratory ratio of 1:2, FIO2 of 1.0, respira-tory rate of 20–30 cycles/min, and drivingpressure of 15 cm H2O.
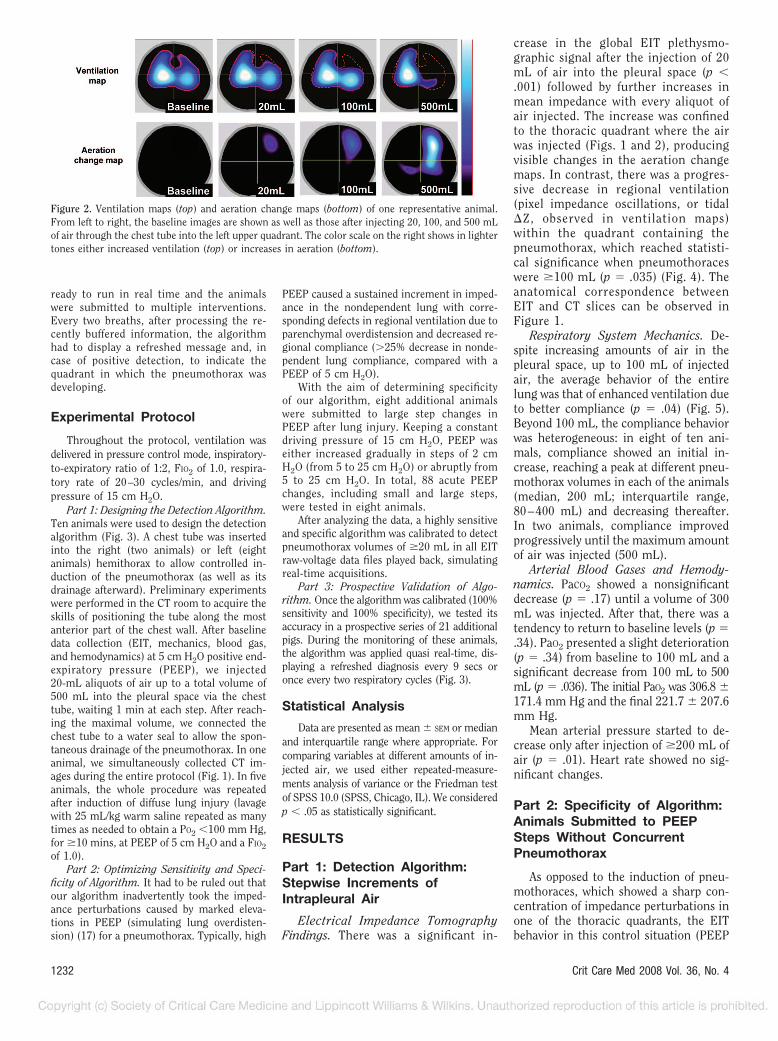
Part 1: Designing the Detection Algorithm.Ten animals were used to design the detectionalgorithm (Fig. 3). A chest tube was insertedinto the right (two animals) or left (eightanimals) hemithorax to allow controlled in-duction of the pneumothorax (as well as itsdrainage afterward). Preliminary experimentswere performed in the CT room to acquire theskills of positioning the tube along the mostanterior part of the chest wall. After baselinedata collection (EIT, mechanics, blood gas,and hemodynamics) at 5 cm H2O positive end-expiratory pressure (PEEP), we injected20-mL aliquots of air up to a total volume of500 mL into the pleural space via the chesttube, waiting 1 min at each step. After reach-ing the maximal volume, we connected thechest tube to a water seal to allow the spon-taneous drainage of the pneumothorax. In oneanimal, we simultaneously collected CT im-ages during the entire protocol (Fig. 1). In fiveanimals, the whole procedure was repeatedafter induction of diffuse lung injury (lavagewith 25 mL/kg warm saline repeated as manytimes as needed to obtain a PO2 �100 mm Hg,for �10 mins, at PEEP of 5 cm H2O and a FIO2
of 1.0).Part 2: Optimizing Sensitivity and Speci-
ficity of Algorithm. It had to be ruled out thatour algorithm inadvertently took the imped-ance perturbations caused by marked eleva-tions in PEEP (simulating lung overdisten-sion) (17) for a pneumothorax. Typically, high
PEEP caused a sustained increment in imped-ance in the nondependent lung with corre-sponding defects in regional ventilation due toparenchymal overdistension and decreased re-gional compliance (�25% decrease in nonde-pendent lung compliance, compared with aPEEP of 5 cm H2O).
With the aim of determining specificityof our algorithm, eight additional animalswere submitted to large step changes inPEEP after lung injury. Keeping a constantdriving pressure of 15 cm H2O, PEEP waseither increased gradually in steps of 2 cmH2O (from 5 to 25 cm H2O) or abruptly from5 to 25 cm H2O. In total, 88 acute PEEPchanges, including small and large steps,were tested in eight animals.
After analyzing the data, a highly sensitiveand specific algorithm was calibrated to detectpneumothorax volumes of �20 mL in all EITraw-voltage data files played back, simulatingreal-time acquisitions.
Part 3: Prospective Validation of Algo-rithm. Once the algorithm was calibrated (100%sensitivity and 100% specificity), we tested itsaccuracy in a prospective series of 21 additionalpigs. During the monitoring of these animals,the algorithm was applied quasi real-time, dis-playing a refreshed diagnosis every 9 secs oronce every two respiratory cycles (Fig. 3).
Statistical Analysis
Data are presented as mean � SEM or medianand interquartile range where appropriate. Forcomparing variables at different amounts of in-jected air, we used either repeated-measure-ments analysis of variance or the Friedman testof SPSS 10.0 (SPSS, Chicago, IL). We consideredp � .05 as statistically significant.
RESULTS
Part 1: Detection Algorithm:Stepwise Increments ofIntrapleural Air
Electrical Impedance TomographyFindings. There was a significant in-
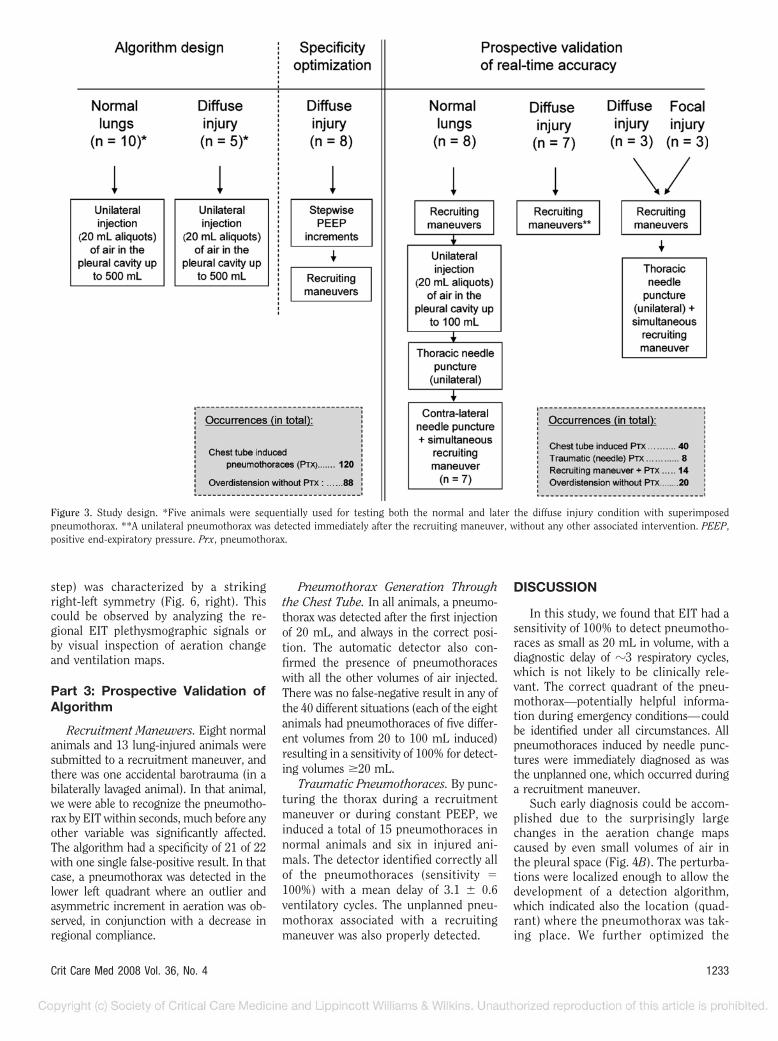
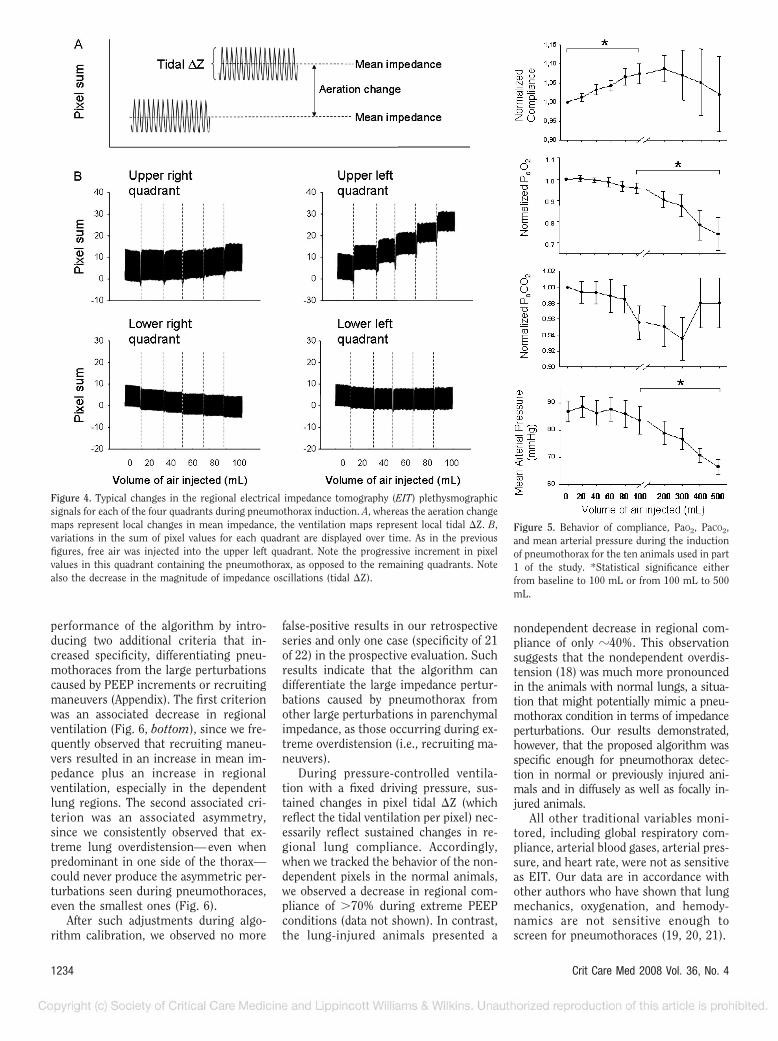
crease in the global EIT plethysmo-graphic signal after the injection of 20mL of air into the pleural space (p �.001) followed by further increases inmean impedance with every aliquot ofair injected. The increase was confinedto the thoracic quadrant where the airwas injected (Figs. 1 and 2), producingvisible changes in the aeration changemaps. In contrast, there was a progres-sive decrease in regional ventilation(pixel impedance oscillations, or tidal�Z, observed in ventilation maps)within the quadrant containing thepneumothorax, which reached statisti-cal significance when pneumothoraceswere �100 mL (p � .035) (Fig. 4). Theanatomical correspondence betweenEIT and CT slices can be observed inFigure 1.
Respiratory System Mechanics. De-spite increasing amounts of air in thepleural space, up to 100 mL of injectedair, the average behavior of the entirelung was that of enhanced ventilation dueto better compliance (p � .04) (Fig. 5).Beyond 100 mL, the compliance behaviorwas heterogeneous: in eight of ten ani-mals, compliance showed an initial in-crease, reaching a peak at different pneu-mothorax volumes in each of the animals(median, 200 mL; interquartile range,80–400 mL) and decreasing thereafter.In two animals, compliance improvedprogressively until the maximum amountof air was injected (500 mL).
Arterial Blood Gases and Hemody-namics. PaCO2 showed a nonsignificantdecrease (p � .17) until a volume of 300mL was injected. After that, there was atendency to return to baseline levels (p �.34). PaO2 presented a slight deterioration(p � .34) from baseline to 100 mL and asignificant decrease from 100 mL to 500mL (p � .036). The initial PaO2 was 306.8 �171.4 mm Hg and the final 221.7 � 207.6mm Hg.
Mean arterial pressure started to de-crease only after injection of �200 mL ofair (p � .01). Heart rate showed no sig-nificant changes.
Part 2: Specificity of Algorithm:Animals Submitted to PEEPSteps Without ConcurrentPneumothorax
As opposed to the induction of pneu-mothoraces, which showed a sharp con-centration of impedance perturbations inone of the thoracic quadrants, the EITbehavior in this control situation (PEEP
Figure 2. Ventilation maps (top) and aeration change maps (bottom) of one representative animal.From left to right, the baseline images are shown as well as those after injecting 20, 100, and 500 mLof air through the chest tube into the left upper quadrant. The color scale on the right shows in lightertones either increased ventilation (top) or increases in aeration (bottom).
1232 Crit Care Med 2008 Vol. 36, No. 4
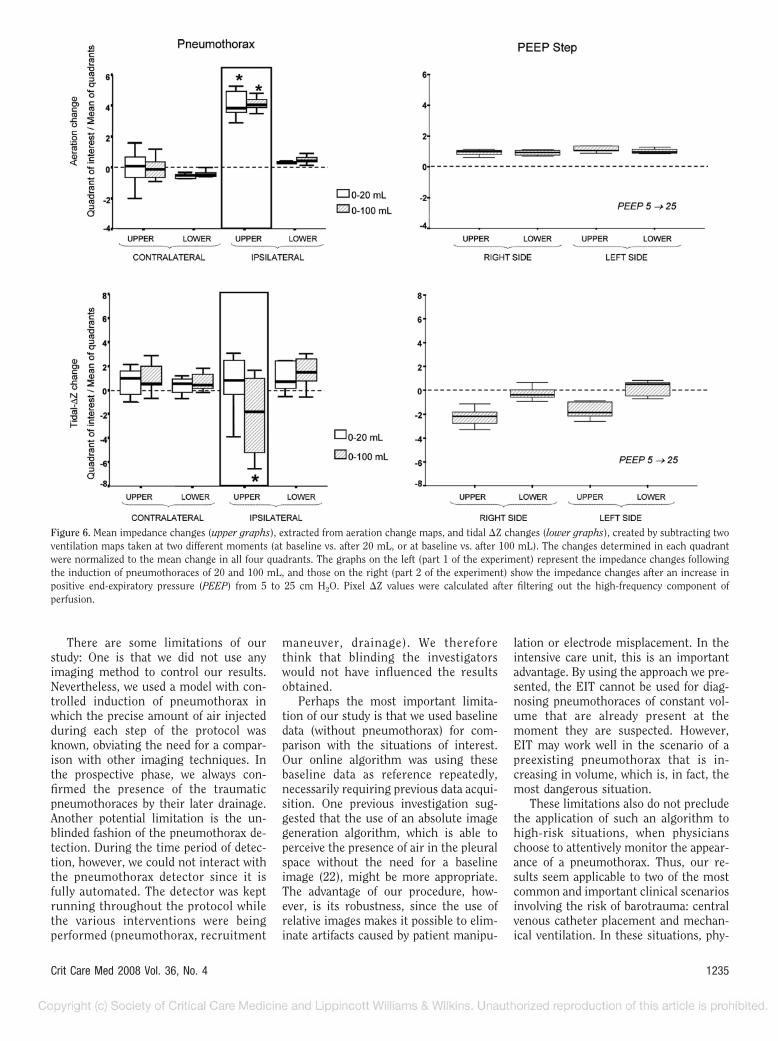
step) was characterized by a strikingright-left symmetry (Fig. 6, right). Thiscould be observed by analyzing the re-gional EIT plethysmographic signals orby visual inspection of aeration changeand ventilation maps.
Part 3: Prospective Validation ofAlgorithm
Recruitment Maneuvers. Eight normalanimals and 13 lung-injured animals weresubmitted to a recruitment maneuver, andthere was one accidental barotrauma (in abilaterally lavaged animal). In that animal,we were able to recognize the pneumotho-rax by EIT within seconds, much before anyother variable was significantly affected.The algorithm had a specificity of 21 of 22with one single false-positive result. In thatcase, a pneumothorax was detected in thelower left quadrant where an outlier andasymmetric increment in aeration was ob-served, in conjunction with a decrease inregional compliance.
Pneumothorax Generation Throughthe Chest Tube. In all animals, a pneumo-thorax was detected after the first injectionof 20 mL, and always in the correct posi-tion. The automatic detector also con-firmed the presence of pneumothoraceswith all the other volumes of air injected.There was no false-negative result in any ofthe 40 different situations (each of the eightanimals had pneumothoraces of five differ-ent volumes from 20 to 100 mL induced)resulting in a sensitivity of 100% for detect-ing volumes �20 mL.
Traumatic Pneumothoraces. By punc-turing the thorax during a recruitmentmaneuver or during constant PEEP, weinduced a total of 15 pneumothoraces innormal animals and six in injured ani-mals. The detector identified correctly allof the pneumothoraces (sensitivity �100%) with a mean delay of 3.1 � 0.6ventilatory cycles. The unplanned pneu-mothorax associated with a recruitingmaneuver was also properly detected.
DISCUSSION
In this study, we found that EIT had asensitivity of 100% to detect pneumotho-races as small as 20 mL in volume, with adiagnostic delay of �3 respiratory cycles,which is not likely to be clinically rele-vant. The correct quadrant of the pneu-mothorax—potentially helpful informa-tion during emergency conditions—couldbe identified under all circumstances. Allpneumothoraces induced by needle punc-tures were immediately diagnosed as wasthe unplanned one, which occurred duringa recruitment maneuver.
Such early diagnosis could be accom-plished due to the surprisingly largechanges in the aeration change mapscaused by even small volumes of air inthe pleural space (Fig. 4B). The perturba-tions were localized enough to allow thedevelopment of a detection algorithm,which indicated also the location (quad-rant) where the pneumothorax was tak-ing place. We further optimized the
Figure 3. Study design. *Five animals were sequentially used for testing both the normal and later the diffuse injury condition with superimposedpneumothorax. **A unilateral pneumothorax was detected immediately after the recruiting maneuver, without any other associated intervention. PEEP,positive end-expiratory pressure. Prx, pneumothorax.
1233Crit Care Med 2008 Vol. 36, No. 4
performance of the algorithm by intro-ducing two additional criteria that in-creased specificity, differentiating pneu-mothoraces from the large perturbationscaused by PEEP increments or recruitingmaneuvers (Appendix). The first criterionwas an associated decrease in regionalventilation (Fig. 6, bottom), since we fre-quently observed that recruiting maneu-vers resulted in an increase in mean im-pedance plus an increase in regionalventilation, especially in the dependentlung regions. The second associated cri-terion was an associated asymmetry,since we consistently observed that ex-treme lung overdistension—even whenpredominant in one side of the thorax—could never produce the asymmetric per-turbations seen during pneumothoraces,even the smallest ones (Fig. 6).
After such adjustments during algo-rithm calibration, we observed no more
false-positive results in our retrospectiveseries and only one case (specificity of 21of 22) in the prospective evaluation. Suchresults indicate that the algorithm candifferentiate the large impedance pertur-bations caused by pneumothorax fromother large perturbations in parenchymalimpedance, as those occurring during ex-treme overdistension (i.e., recruiting ma-neuvers).
During pressure-controlled ventila-tion with a fixed driving pressure, sus-tained changes in pixel tidal �Z (whichreflect the tidal ventilation per pixel) nec-essarily reflect sustained changes in re-gional lung compliance. Accordingly,when we tracked the behavior of the non-dependent pixels in the normal animals,we observed a decrease in regional com-pliance of �70% during extreme PEEPconditions (data not shown). In contrast,the lung-injured animals presented a
nondependent decrease in regional com-pliance of only �40%. This observationsuggests that the nondependent overdis-tension (18) was much more pronouncedin the animals with normal lungs, a situa-tion that might potentially mimic a pneu-mothorax condition in terms of impedanceperturbations. Our results demonstrated,however, that the proposed algorithm wasspecific enough for pneumothorax detec-tion in normal or previously injured ani-mals and in diffusely as well as focally in-jured animals.
All other traditional variables moni-tored, including global respiratory com-pliance, arterial blood gases, arterial pres-sure, and heart rate, were not as sensitiveas EIT. Our data are in accordance withother authors who have shown that lungmechanics, oxygenation, and hemody-namics are not sensitive enough toscreen for pneumothoraces (19, 20, 21).
Figure 4. Typical changes in the regional electrical impedance tomography (EIT) plethysmographicsignals for each of the four quadrants during pneumothorax induction. A, whereas the aeration changemaps represent local changes in mean impedance, the ventilation maps represent local tidal �Z. B,variations in the sum of pixel values for each quadrant are displayed over time. As in the previousfigures, free air was injected into the upper left quadrant. Note the progressive increment in pixelvalues in this quadrant containing the pneumothorax, as opposed to the remaining quadrants. Notealso the decrease in the magnitude of impedance oscillations (tidal �Z).
Figure 5. Behavior of compliance, PaO2, PaCO2,and mean arterial pressure during the inductionof pneumothorax for the ten animals used in part1 of the study. *Statistical significance eitherfrom baseline to 100 mL or from 100 mL to 500mL.
1234 Crit Care Med 2008 Vol. 36, No. 4
There are some limitations of ourstudy: One is that we did not use anyimaging method to control our results.Nevertheless, we used a model with con-trolled induction of pneumothorax inwhich the precise amount of air injectedduring each step of the protocol wasknown, obviating the need for a compar-ison with other imaging techniques. Inthe prospective phase, we always con-firmed the presence of the traumaticpneumothoraces by their later drainage.Another potential limitation is the un-blinded fashion of the pneumothorax de-tection. During the time period of detec-tion, however, we could not interact withthe pneumothorax detector since it isfully automated. The detector was keptrunning throughout the protocol whilethe various interventions were beingperformed (pneumothorax, recruitment
maneuver, drainage). We thereforethink that blinding the investigatorswould not have influenced the resultsobtained.
Perhaps the most important limita-tion of our study is that we used baselinedata (without pneumothorax) for com-parison with the situations of interest.Our online algorithm was using thesebaseline data as reference repeatedly,necessarily requiring previous data acqui-sition. One previous investigation sug-gested that the use of an absolute imagegeneration algorithm, which is able toperceive the presence of air in the pleuralspace without the need for a baselineimage (22), might be more appropriate.The advantage of our procedure, how-ever, is its robustness, since the use ofrelative images makes it possible to elim-inate artifacts caused by patient manipu-
lation or electrode misplacement. In theintensive care unit, this is an importantadvantage. By using the approach we pre-sented, the EIT cannot be used for diag-nosing pneumothoraces of constant vol-ume that are already present at themoment they are suspected. However,EIT may work well in the scenario of apreexisting pneumothorax that is in-creasing in volume, which is, in fact, themost dangerous situation.
These limitations also do not precludethe application of such an algorithm tohigh-risk situations, when physicianschoose to attentively monitor the appear-ance of a pneumothorax. Thus, our re-sults seem applicable to two of the mostcommon and important clinical scenariosinvolving the risk of barotrauma: centralvenous catheter placement and mechan-ical ventilation. In these situations, phy-
Figure 6. Mean impedance changes (upper graphs), extracted from aeration change maps, and tidal �Z changes (lower graphs), created by subtracting twoventilation maps taken at two different moments (at baseline vs. after 20 mL, or at baseline vs. after 100 mL). The changes determined in each quadrantwere normalized to the mean change in all four quadrants. The graphs on the left (part 1 of the experiment) represent the impedance changes followingthe induction of pneumothoraces of 20 and 100 mL, and those on the right (part 2 of the experiment) show the impedance changes after an increase inpositive end-expiratory pressure (PEEP) from 5 to 25 cm H2O. Pixel �Z values were calculated after filtering out the high-frequency component ofperfusion.
1235Crit Care Med 2008 Vol. 36, No. 4
sicians could easily start the EIT moni-toring before proceeding with theirinterventions, automatically collectingthe baseline data.
The placement of central venouscatheters carries an important risk ofdeveloping a pneumothorax (4, 23).This is especially important when thepatient is under positive-pressure ven-tilation or when he or she has a lowrespiratory reserve. In these situations,the progression of a pneumothorax canbe lethal if not promptly treated. We arestarting a clinical trial testing whethersuch an EIT-based algorithm might al-low early detection of pneumothorax inhigh-risk selected patients, obviatingthe need for routine radiographic imag-ing.
Recruitment maneuvers are widelyused to reverse hypoxemia, especially inthe context of acute lung injury andacute respiratory distress syndrome(24 –26). The lung is submitted to highpressures in an attempt to reopen col-lapsed alveoli, carrying the risk forbarotrauma. EIT monitoring could,therefore, be very useful to increase thesafety of such maneuvers, making itpossible to abort the maneuver once apneumothorax has been detected. Thisstudy intentionally tested such specificsituation, demonstrating the good sen-sitivity of the algorithm to detect pneu-mothoraces during recruiting maneu-vers.
CONCLUSION
We created an algorithm based onelectrical impedance tomography thatwas operator-free and capable of detect-ing early signs of pneumothoraces inhigh-risk situations, such as central ve-nous catheterization or mechanicalventilation. We could also indicate thequadrant of occurrence, which mightbe particularly helpful in emergencyconditions requiring prompt drainage.Pneumothoraces could be clearly dis-tinguished from lung overdistensionand PEEP-induced changes in intratho-racic air.
ACKNOWLEDGMENTS
We are indebted to Dr. João BatistaBorges, Júlio César Ceballos Aya, and Fer-nando Souza Moura for their contribu-tion in the theoretical background of al-gorithms.
REFERENCES
1. Schnapp LM, Chin DP, Szaflarski N, et al:Frequency and importance of barotrauma in100 patients with acute lung injury. CritCare Med 1995; 23:272–278
2. Amato MB, Barbas CS, Medeiros DM, et al:Effect of a protective-ventilation strategy onmortality in the acute respiratory distresssyndrome. N Engl J Med 1998; 338:347–354
3. Weg JG, Anzueto A, Balk RA, et al: The rela-tion of pneumothorax and other air leaks tomortality in the acute respiratory distresssyndrome. N Engl J Med 1998; 338:341–346
4. de Lassence A, Timsit JF, Tafflet M, et al:Pneumothorax in the intensive care unit:Incidence, risk factors, and outcome. Anes-thesiology 2006; 104:5–13
5. Eisen LA, Narasimhan M, Berger JS, et al:Mechanical complications of central venouscatheters. J Intensive Care Med 2006; 21:40–46
6. Moss HA, Roe PG, Flower CD: Clinical dete-rioration in ARDS—An unchanged chest ra-diograph and functioning chest drains do notexclude an acute tension pneumothorax.Clin Radiol 2000; 55:637–639
7. Rankine JJ, Thomas AN, Fluechter D: Diag-nosis of pneumothorax in critically ill adults.Postgrad Med J 2000; 76:399–404
8. Pelosi P, Brazzi L, Gattinoni L: Diagnosticimaging in acute respiratory distress syn-drome. Curr Opin Crit Care 1999; 5:9–16
9. Rowan KR, Kirkpatrick AW, Liu D, et al:Traumatic pneumothorax detection withthoracic US: Correlation with chest radiog-raphy and CT—Initial experience. Radiology2002; 225:210–214
10. Brown BH, Barber DC, Seagar AD: Appliedpotential tomography: Possible clinical appli-cations. Clin Phys Physiol Meas 1985;6:109–121
11. Victorino JA, Borges JB, Okamoto VN, et al:Imbalances in regional lung ventilation: Avalidation study on electrical impedance to-mography. Am J Respir Crit Care Med 2004;169:791–800
12. Wolf GK, Arnold JH: Noninvasive assessmentof lung volume: Respiratory inductanceplethysmography and electrical impedancetomography. Crit Care Med 2005; 33:S163–S169
13. Caramez MP, Borges JB, Tucci MR, et al:Paradoxical responses to positive end-expiratory pressure in patients with airwayobstruction during controlled ventilation.Crit Care Med 2005; 33:1519–1528
14. Pai C, Mirandola L, Scweder R, et al: A black-box back-projection algorithm for electricalimpedance tomography. In: Proceedings ofthe 18th International Congress of Me-chanical Engineering; 2005; Ouro Preto,MG, Brazil
15. Nopp P, Harris ND, Zhao TX, et al: Model forthe dielectric properties of human lung tis-sue against frequency and air content. MedBiol Eng Comput 1997; 35:695–702
16. Frerichs I, Hahn G, Schroder T, et al: Elec-
trical impedance tomography in monitoringexperimental lung injury. Intensive CareMed 1998; 24:829–836
17. Rouby JJ, Lu Q, Goldstein I: Selecting theright level of positive end-expiratory pressurein patients with acute respiratory distresssyndrome. Am J Respir Crit Care Med 2002;165:1182–1186
18. Adler A, Shinozuka N, Berthiaume Y, et al:Electrical impedance tomography can mon-itor dynamic hyperinflation in dogs. J ApplPhysiol 1998; 84:726–732
19. Murray JM, Seaberg DC, Menegazzi JJ: De-mand valve ventilation in a swine pneumo-thorax model. Am J Emerg Med 1996; 14:13–15
20. Bitto T, Mannion JD, Stephenson LW, et al:Pneumothorax during positive-pressure me-chanical ventilation. J Thorac CardiovascSurg 1985; 89:585–591
21. Barton ED, Rhee P, Hutton KC, et al: Thepathophysiology of tension pneumothorax inventilated swine. J Emerg Med 1997; 15:147–153
22. Hahn G, Just A, Dudykevych T, et al: Imagingpathologic pulmonary air and fluid accumu-lation by functional and absolute EIT.Physiol Meas 2006; 27:S187–S198
23. Mansfield PF, Hohn DC, Fornage BD, et al:Complications and failures of subclavian-vein catheterization. N Engl J Med 1994;331:1735–1738
24. Barbas CS, de Matos GF, Okamoto V, et al:Lung recruitment maneuvers in acute respi-ratory distress syndrome. Respir Care Clin NAm 2003; 9:401–418, vii
25. Barbas CS, de Matos GF, Pincelli MP, et al:Mechanical ventilation in acute respiratoryfailure: Recruitment and high positive end-expiratory pressure are necessary. Curr OpinCrit Care 2005; 11:18–28
26. Borges JB, Okamoto VN, Matos GF, et al:Reversibility of lung collapse and hypoxemiain early acute respiratory distress syndrome.Am J Respir Crit Care Med 2006; 174:268–278
APPENDIX
Experimental Setup
Animals were initially sedated (aceproma-zin 0.1 mg/kg, midazolam 0.5 mg/kg,and ketamine 5.0 mg/kg) while receivingoxygen via facial mask, subsequently tra-cheostomized, and maintained with con-tinuous intravenous anesthesia (ket-amine 2.0 mg/kg/hr, pancuronium 0.35mg/kg/hr, midazolam 0.45 mg/kg/hr, andthiopental 2.0 mg/kg/hr). Controlled me-chanical ventilation was initiated withpressure-controlled mode (Servo 300 A,Siemens-Elema, Sweden). All animalswere monitored with a continuous arte-rial blood gas sensor inserted through thecarotid artery (Paratrend MPM7000, Dia-
1236 Crit Care Med 2008 Vol. 36, No. 4
metrics Medical, Roseville, MN). Invasivesystemic arterial and central venous pres-sures were monitored (Portal DX 2020Monitor, Dixtal, Manaus, Brazil). Proxi-mal airway pressures were measured witha differential pressure transducer open toatmosphere (Validyne MP45; �100 cmH2O; Validyne, Northridge, CA). Airwayflow was measured by a differential pres-sure pneumotachograph (Hans Rudolph;0 –160 L/min; Kansas City, MO; con-nected to a Validyne MP30; �2 cm H2Otransducer) placed between the ventilatorcircuit and the tracheal tube. A custom-ized software calculated respiratory sys-tem mechanics breath by breath (13).
EIT Image ReconstructionAlgorithm
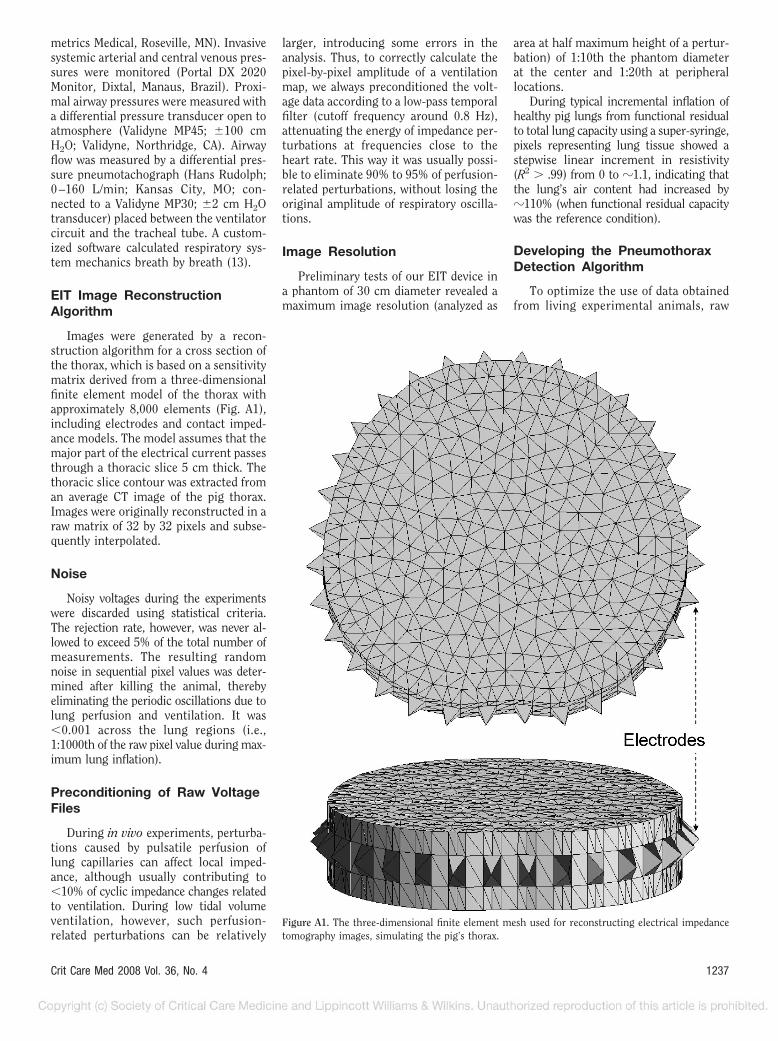
Images were generated by a recon-struction algorithm for a cross section ofthe thorax, which is based on a sensitivitymatrix derived from a three-dimensionalfinite element model of the thorax withapproximately 8,000 elements (Fig. A1),including electrodes and contact imped-ance models. The model assumes that themajor part of the electrical current passesthrough a thoracic slice 5 cm thick. Thethoracic slice contour was extracted froman average CT image of the pig thorax.Images were originally reconstructed in araw matrix of 32 by 32 pixels and subse-quently interpolated.
Noise
Noisy voltages during the experimentswere discarded using statistical criteria.The rejection rate, however, was never al-lowed to exceed 5% of the total number ofmeasurements. The resulting randomnoise in sequential pixel values was deter-mined after killing the animal, therebyeliminating the periodic oscillations due tolung perfusion and ventilation. It was�0.001 across the lung regions (i.e.,1:1000th of the raw pixel value during max-imum lung inflation).
Preconditioning of Raw VoltageFiles
During in vivo experiments, perturba-tions caused by pulsatile perfusion oflung capillaries can affect local imped-ance, although usually contributing to�10% of cyclic impedance changes relatedto ventilation. During low tidal volumeventilation, however, such perfusion-related perturbations can be relatively
larger, introducing some errors in theanalysis. Thus, to correctly calculate thepixel-by-pixel amplitude of a ventilationmap, we always preconditioned the volt-age data according to a low-pass temporalfilter (cutoff frequency around 0.8 Hz),attenuating the energy of impedance per-turbations at frequencies close to theheart rate. This way it was usually possi-ble to eliminate 90% to 95% of perfusion-related perturbations, without losing theoriginal amplitude of respiratory oscilla-tions.
Image Resolution
Preliminary tests of our EIT device ina phantom of 30 cm diameter revealed amaximum image resolution (analyzed as
area at half maximum height of a pertur-bation) of 1:10th the phantom diameterat the center and 1:20th at peripherallocations.
During typical incremental inflation ofhealthy pig lungs from functional residualto total lung capacity using a super-syringe,pixels representing lung tissue showed astepwise linear increment in resistivity(R2 � .99) from 0 to �1.1, indicating thatthe lung’s air content had increased by�110% (when functional residual capacitywas the reference condition).
Developing the PneumothoraxDetection Algorithm
To optimize the use of data obtainedfrom living experimental animals, raw
Figure A1. The three-dimensional finite element mesh used for reconstructing electrical impedancetomography images, simulating the pig’s thorax.
1237Crit Care Med 2008 Vol. 36, No. 4

EIT data were continuously recordedduring the first phase of the study (18animals) and later used for designingand bench testing different versions ofthe algorithm. Files of acquired datawere repeatedly used to simulate real-time conditions: Instead of receivingvoltage inputs from an acquisition sys-tem, the EIT microprocessor receivedvoltage inputs from the hard disk at thesame frame rate as during acquisition.This way, modifications of the algo-rithm could be tested reproduciblywithout having to use more animalsthan necessary.
Through repeated analysis of thedata gathered in the first two parts ofthe experimental protocol, we were ableto iteratively define thresholds for aer-ation changes and for tidal �Z changesthat could best differentiate a pneumo-thorax from the control situations(lung distension/overdistension). Toimprove the specificity of the algorithm,we later included an additional symmetrycriterion (Fig. A2).Figure A2. The final pneumothorax (Ptx) detection algorithm.
1238 Crit Care Med 2008 Vol. 36, No. 4
Copyright © 2022 FDOKUMEN