Rates of nitrification and ammonium dynamics in northeastern Chukchi Sea shelf waters
Upload
independentCategory
view
2download
0
Marine Chemistry, 16 (1985) 317--327 317 Elsevier Science Publishers B.V., Amsterdam -- Printed in The Netherlands
RATES OF NITRIFICATION AND NITRATE REDUCTION IN NEARSHORE MARINE SEDIMENTS AT NEAR AMBIENT SUBSTRATE CONCENTRATIONS
SARAH G. HORRIGAN and DOUGLAS G. CAPONE
Marine Sciences Research Center, State University of New York, Stony Brook, N Y 11794 (U.S.A.)
(Received April 10, 1984; accepted September 11, 1984)
ABSTRACT
Horrigan, S.G. and Capone, D.G., 1985. Rates of nitrification and nitrate reduction in nearshore marine sediments at near ambient substrate concentrations. Mar. Chem., 16: 317--327.
Nitrification and nitrate reduction were measured simultaneously by a lSN-isotope dilution technique in the top 2 cm of sandy sediments in Great South Bay, Long Island, New York. Experiments were done at three times, under three different sets of environ- mental conditions. Nitrification rates remained between 0.010 and 0.015pg-at N (g dry wt) -1 (24 h) -1 despite decreasing temperature. Nitrate reduction ranged from 0.02 to 0.11pg-at N (g dry wt) -1 (24h) -1 . Nitrate reduction exceeded nitrification in two experiments. In the third, at low temperature and apparently high oxygen levels, rates of nitrification and nitrate reduction were comparable. We conclude that there is not a constant relationship between nitrification and nitrate reduction in this environment. Attempts to measure rates of nitrification by using the inhibitor chlorate were not successful.
INTRODUCTION
Nitrogen cycling in coastal marine sediments involves several different transformations, some of which are microbially mediated. The microbial processes which are important in a given environment depend on the physical and chemical conditions prevailing in that environment. Two important activities which occur in the sediments are nitrification and dentrification. Nitrification, the process by which reduced forms of nitrogen (ammonium and nitrite) are oxidized to nitrite and nitrate, is mediated by a specific group of aerobic, chemoautotrophic bacteria called nitrifiers. Dissimilatory nitrate reduction, the transformation of nitrate to nitrite (and ultimately to ammonium or to gaseous end products) is mediated by a diverse group of facultatively or strictly anaerobic, heterotrophic bacteria. Nitrification thus supplies the necessary substrate for nitrate reduction. In the absence of other sources of nitrate, and with adequate organic substrates available, one might expect these processes to be closely coupled (Knowles, 1982).
In several studies, the extent of coupling between nitrate production by nitrification and nitrate consumption has been considered. Capone and
0304-4203/85/$03.30 © 1985 Elsevier Science Publishers B.V.
318
Taylor (1980) speculated that nitrification rates might limit denitrification rates in a seagrass community , after observing that denitrification could be stimulated by addition of nitrate. Iizumi et al. (1980) found that denitrifi- cation and nitrification occurred at similar rates in sediments of a Zostera bed. They did not, however, measure dissimilatory nitrate reduction ~o ammonium, which may account for some 30--70% of nitrate reduction (Koike and Hattori, 1978). Kaplan et al. (1979) noted rates of nitrification sufficient to sustain over 6 times their maximum measured denitrification rate in a salt marsh sediment. The rates of nitrification that were measured represented a 'potential ' due to the strictly aerobic nature of the incubations and the possible overestimation of actual rates of nitrification. In addition, because nitrate reduction to ammonium was not considered in this study, nitrate reduction may have been underestimated. More recently, Jenkins and Kemp (1984) conducted l SN_tracer experiments which demonstrated that, in spring (but not in summer), estuarine sediments have a capacity for the rapid conversion of exogenously supplied ammonium to N2 gas, an indication of periodic coupling of these processes.
In the present study, we measured the rates of nitrification and nitrate reduction simultaneously in a sandy coastal sediment using the isotope dilution technique of Koike and Hattori (1978). With this technique, Koike and Hattori distinguished three types of coastal marine sediment: one in which nitrate reduction predominates, a second in which nitrification pre- dominates and a third in which both processes occur at comparable levels. They cited sediment texture and organic detritus levels as the probable factors which determined the relative importance of these activities in a given sediment. Our measurements, made at a single site, but at three different times, show that the extent of coupling between these two processes can vary in time. Because the phasing of our experiments covered a range of environmental conditions (temperature, and presumably oxygen and organic substrate levels), we can speculate on some of the environmental factors which may regulate the degree of coupling of these two processes.
MATERIALS AND METHODS
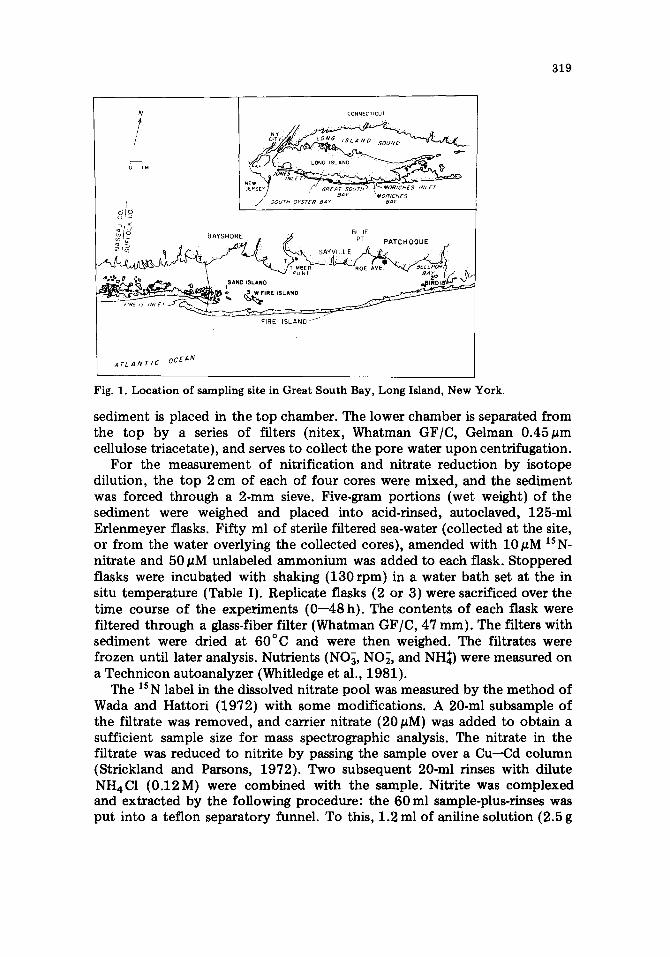
The sampling site is located in Great South Bay, Long Island, New York, at a distance approximately 15 m from shore where the water depth is about 1 m (Fig. 1). Cores were taken by hand using plexiglass core tubes (5.5 cm in diameter) and returned to the laboratory on ice for sectioning and analysis. Temperature and salinity were measured in the field. The sediments consist of coarse sand with sparse Zostera growth, and have low organic content (0.5% loss on ignition). Samples were taken on three dates: 21 September, 19 October, and 6 December 1983. Rates of nitrification and nitrate reduction were measured simultaneously by a lS N--NO~ isotope dilution technique (Koike and Hattori, 1978) on the 0--2cm section. Additional cores were sectioned and pore waters were extracted from the sections by centrifugation using two-chambered delrin centrifuge bottles in which the
319
N
/ O I ML
CONNECTICUT
C~TY L O N G / • '
jON;),CLr¢ • T
JERSEY MOR/CHES /NLET
/ SOUT 0 STER B B
g d A BLUE ~[~ s YS"°~L / / P~ PATCHOOUE
~ "0 T: ~ (~IRE ISLANDT : :" .
FIRE ISLAND / ~
A T L A N T I C o c E A N
Fig. 1. Location of sampling site in Great South Bay, Long Island, New York.
sediment is placed in the top chamber. The lower chamber is separated from the top by a series of filters (nitex, Whatman GF/C, Gelman 0 .45#m cellulose triacetate), and serves to collect the pore water upon centrifugation.
For the measurement of nitrification and nitrate reduction by isotope dilution, the top 2 cm of each of four cores were mixed, and the sediment was forced through a 2-mm sieve. Five-gram portions (wet weight) of the sediment were weighed and placed into acid-rinsed, autoclaved, 125-ml Erlenmeyer flasks. Fifty ml of sterile filtered sea-water (collected at the site, or from the water overlying the collected cores), amended with 10#M lSN- nitrate and 50 #M unlabeled ammonium was added to each flask. Stoppered flasks were incubated with shaking (130rpm) in a water bath set at the in situ temperature (Table I). Replicate flasks (2 or 3) were sacrificed over the time course of the experiments (0--48 h). The contents of each flask were filtered through a glass-fiber filter (Whatman GF/C, 47 ram). The filters with sediment were dried at 60°C and were then weighed. The filtrates were frozen until later analysis. Nutrients (NO~, NO~, and NH~) were measured on a Technicon autoanalyzer (Whitledge et al., 1981).
The lSN label in the dissolved nitrate pool was measured by the method of Wada and Hattori (1972) with some modifications. A 20-ml subsample of the filtrate was removed, and carrier nitrate (20 #M) was added to obtain a sufficient sample size for mass spectrographic analysis. The nitrate in the filtrate was reduced to nitrite by passing the sample over a Cu--Cd column (Strickland and Parsons, 1972). Two subsequent 20-ml rinses with dilute NH4C1 (0.12M) were combined with the sample. Nitrite was complexed and extracted by the following procedure: the 60 ml sample-plus-rinses was put into a teflon separatory funnel. To this, 1.2 ml of aniline solution (2.5 g
320
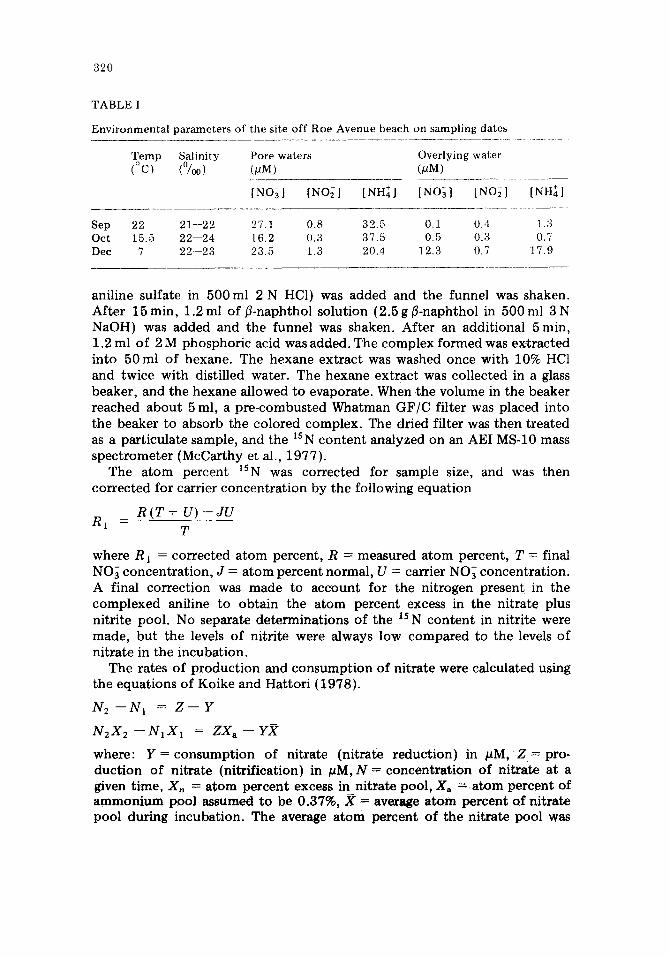
TABLE I
Environmental parameters of the site off Roe Avenue beach on sampling dates
Temp Salinity Pore waters Overlying water (°C) (°/00) (~M) (pM)
[NOel [NO2] [NH~] [NO~] [NO2] [NH~]
Sep 22 21--22 27.1 0.8 32.5 0.1 0.4 1.3 Oct 15.5 22--24 16.2 0.3 37.5 0.5 0.3 0.7 Dec 7 22--23 23.5 1.3 20.4 12.3 0.7 17.9
anil ine sulfa te in 500 ml 2 N HC1) was added and the funne l was shaken. Af t e r 15 min , 1.2 ml o f f l -naphthol so lu t ion (2.5 g f l -naphthol in 5 0 0 m l 3 N N a O H ) was added and the funnel was shaken. Af t e r an addi t iona l 5 m i n , 1.2 ml o f 2 M p h o s p h o r i c acid was added . The c o m p l e x f o r m e d was e x t r a c t e d in to 5 0 m l o f hexane . The h e x a n e ex t r ac t was washed once wi th 10% HCt and twice wi th disti l led water . The h e x a n e e x t r a c t was co l lec ted in a glass beaker , and the hexane a l lowed to evapora te . When the v o l u m e in the beake r r eached a b o u t 5 ml, a p r e - c o m b u s t e d W h a t m a n G F / C f i l ter was p laced into the beake r to abso rb the co lo red c o m p l e x . The dr ied f i l ter was t h e n t r ea t ed as a pa r t i cu la te sample , and the lSN c o n t e n t ana lyzed on an AEI MS-10 mass s p e c t r o m e t e r (McCar thy et al., 1977) .
The a t o m pe rcen t lSN was cor rec ted fo r sample size, and was t hen co r r ec t ed fo r carr ier c o n c e n t r a t i o n by the fo l lowing equa t ion
R ( T + U) - - J V R 1
T
where R I = co r r ec t ed a t o m pe rcen t , R = measu red a t o m pe rcen t , T = final NO~ c o n c e n t r a t i o n , J = a t o m pe rcen t no rma l , U = carr ier NO~ concen t r a t i on . A final co r rec t ion was m a d e to a c c o u n t fo r the n i t rogen p resen t in the c o m p l e x e d aniline to ob ta in the a t o m pe rcen t excess in the n i t ra te plus ni t r i te pool . No separa te d e t e r m i n a t i o n s o f the is N c o n t e n t in ni t r i te were made , bu t the levels o f n i t r i te were a lways low c o m p a r e d to the levels o f n i t ra te in the incuba t ion .
The ra tes o f p r o d u c t i o n and c o n s u m p t i o n o f n i t ra te were ca lcula ted using the equa t ions of Ko ike and Ha t t o r i (1978) .
N2 - - N l = Z - - Y
N 2 X 2 - - N I X 1 -~ Z X a - - y ~
where : Y = c o n s u m p t i o n o f n i t ra te (n i t ra te r educ t ion ) in /aM, Z = pro- d u c t i o n o f n i t ra te (n i t r i f ica t ion) in /aM, N = c o n c e n t r a t i o n o f n i t ra te a t a given t ime , X , = a t o m p e r c e n t excess in n i t ra te poo l , Xa = a t o m p e r c e n t o f a m m o n i u m poo l a s sumed to be 0.37%, ,~ = average a t o m pe rcen t o f n i t r a te poo l dur ing incuba t ion . The average a t o m pe rcen t o f t he n i t ra te p o o l was
321
assumed to be the exponential average, calculated according to the (corrected) equations of Glibert et al. (1982).
On the sampling dates in October and December, we also a t tempted to measure rates of nitrification using the inhibitor chlorate, which selectively inhibits nitrite oxidation (Belser and Mays, 1980). Five-gram portions of the sieved sediment were placed in acid-washed, autoclaved 125-ml Erlenmeyer flasks, and a supernatant of 50 ml of sterile filtered water from the site was added. Additions of chlorate (0.5 ml of a 1 M solution) or distilled water (0.5 ml) were made to chlorate-amended and control flasks, respectively. Flasks were incubated as above, and sacrificed over a time course of 48 h. Nitrite in the filtrate was measured using a Technicon autoanalyzer (Whitledge et al. 1981).
RESULTS
Characteristics of the site at the three sampling times are summarized in Table I. Note that the concentrations of nitrate (the substrate for nitrate reduction) and ammonium (the substrate for nitrification) were measureable in pore waters. The high NO~ concentrations may be a result of ground- water intrusions into these sediments (Capone and Bautista, 1985). Temperature decreased over the three sampling times. Although oxygen levels in the cores were not measured, the core taken in December appeared to be oxidized to a greater depth than cores taken throughout the summer and fall months.
The addition of is N--NO~ and unlabeled NH~ raised the nutrient levels in the incubation flasks to approximately those found in the pore waters from the 0--2 cm sections (Figs. 2b, 3b and 4b). Nitrogenous nutrient levels would not have been limiting to the processes of nitrification or nitrate reduction,
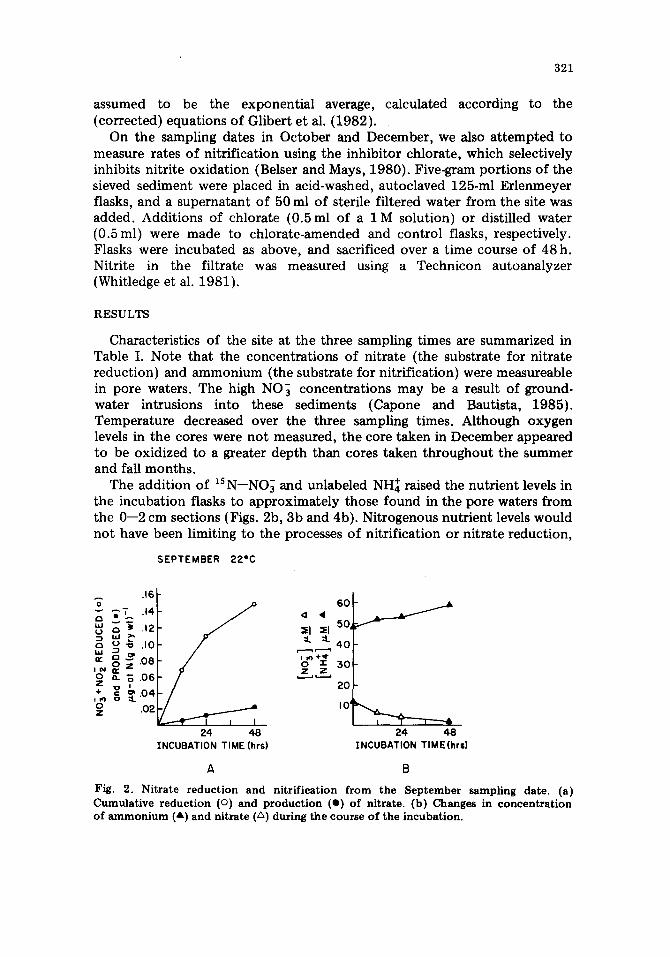
SEPTEMBER 22°C
.16 +; ~ T .14
o ~ ~ ~ .,o I,I,I , ~
OB
o o. S .06
+z ~= ~. .04
z .02
6O 4 • =El =El 50~
:L 40 ~ r - - - . 1
b ~ 30 Z Z
2O
I 0 ~
24 48 INCUBATION TIME (hrs)
24 48 INCUBATION TIME(hrs)
A B
Fig. 2. Nitrate reduction and nitrification from the September sampling date. (a) Cumulative reduction (o) and production (o) of nitrate. (b) Changes in concentration of ammonium (a) and nitrate (A) during the course o f the incubation.
3 2 2
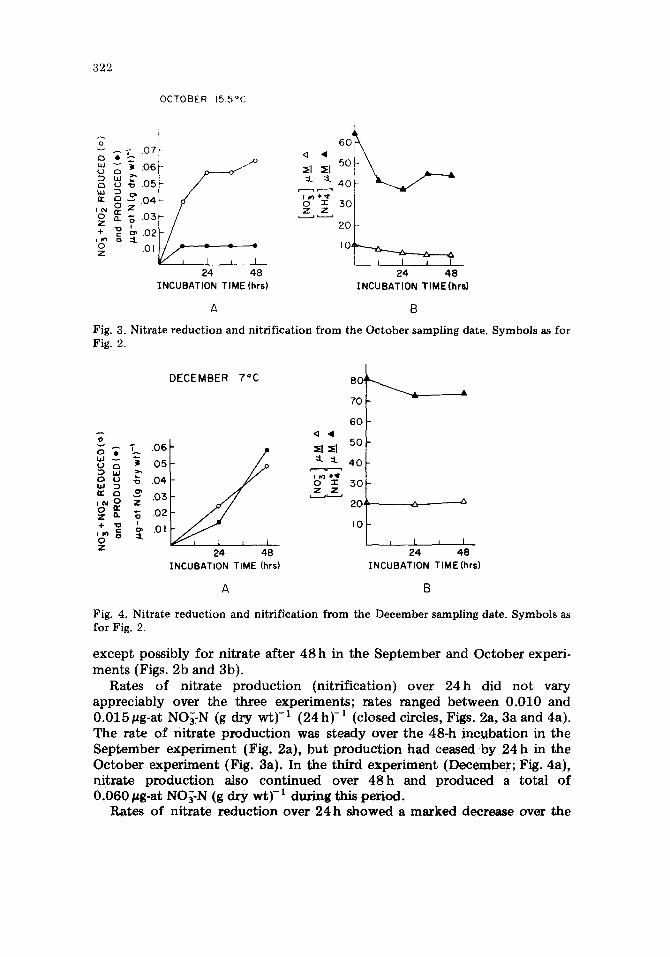
OCTOBER t5.5°(:
o • .~ .07
v
~ .05
z I ,+ 0 2 o .01 Z
/ i , ] l i
24 48 INCUBATION TIME ( h r s )
~&l 50
Z Z L__ .J ~- - . -J
2O
I0
24 48 INCUBATION TIME(hrs)
A B
Fig. 3. Nitrate reduction and nitrification from the October sampling date. Symbols as for Fig. 2.
v • T . 06
o ~ .05
o u .04 w Q: a ~ . 0 3
,,,~ ~ .ol b z
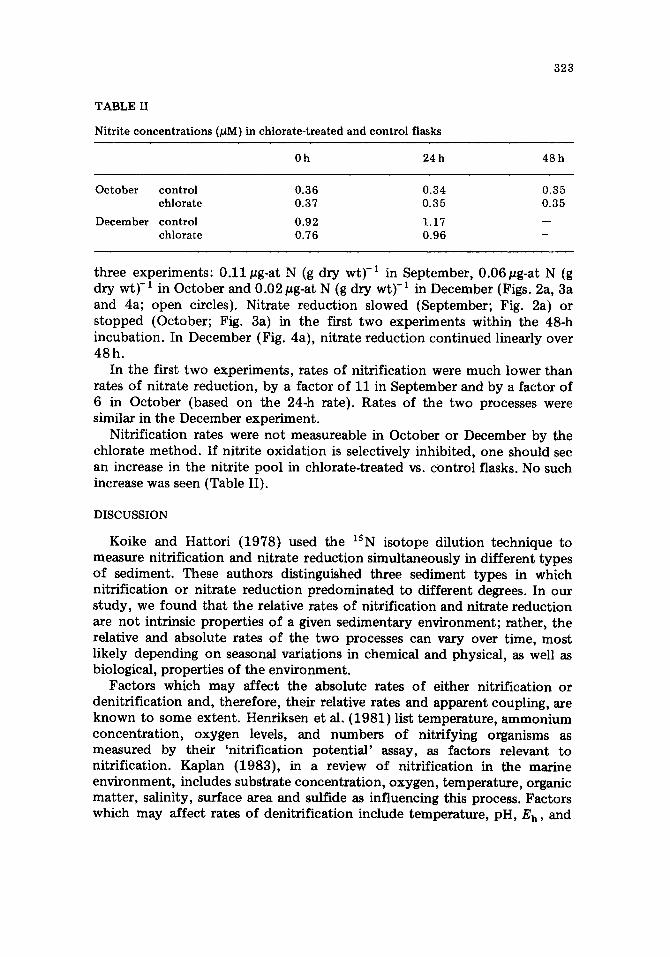
DECEMBER 7 ° C
24 48 INCUBATION TIME ( h r s )
8 0 '
70
60 4 •
50 :El :El =t. =L 4 0
o ~ 30 Z Z
20 -~
IO
.... i I I I 24 48
INCUBATION TIME ( h r s )
A B
Fig. 4. Nitrate reduction and nitrification from the December sampling date. Symbols as for Fig. 2.
except possibly for nitrate after 48h in the September and October experi- ments (Figs. 2b and 3b).
Rates of nitrate production (nitrification) over 24h did not vary appreciably over the three experiments; rates ranged between 0.010 and 0.015#g-at NO~-N (g dry wt) -1 (24h) -1 (closed circles, Figs, 2a, 3a and 4a). The rate of nitrate production was steady over the 48-h incubation in the September experiment (Fig. 2a), but production had ceased by 24 h in the October experiment (Fig. 3a). In the third experiment (December; Fig. 4a), nitrate production also continued over 48h and produced a total of 0.060 pg-at NO~-N (g dry wt)-1 during this period.
Rates of nitrate reduction over 24h showed a marked decrease over the
323
TABLE II
Nitr i te concen t r a t ions (pM) in ch lora te - t rea ted and con t ro l flasks
Oh 2 4 h 4 8 h
Oc tobe r con t ro l 0.36 0.34 0.35 ch lora te 0.37 0.35 0.35
December con t ro l 0.92 1.17 - - ch lora te 0.76 0.96 - -
three experiments: 0.11 #g-at N (g dry wt)-1 in September, 0.06/~g-at N (g dry w t y I in October and 0.02/~g-at N (g dry wt) -1 in December (Figs. 2a, 3a and 4a; open circles). Nitrate reduction slowed (September; Fig. 2a) or s topped (October; Fig. 3a) in the first two experiments within the 48-h incubation. In December (Fig. 4a), nitrate reduction continued linearly over 48h .
In the first two experiments, rates of nitrification were much lower than rates of nitrate reduction, by a factor of 11 in September and by a factor of 6 in October (based on the 24-h rate). Rates of the two processes were similar in the December experiment.
Nitrification rates were not measureable in October or December by the chlorate method. If nitrite oxidation is selectively inhibited, one should see an increase in the nitrite pool in chlorate-treated vs. control flasks. No such increase was seen (Table II).
DISCUSSION
Koike and Hattori (1978) used the lSN isotope dilution technique to measure nitrification and nitrate reduction simultaneously in different types of sediment. These authors distinguished three sediment types in which nitrification or nitrate reduction predominated to different degrees. In our study, we found that the relative rates of nitrification and nitrate reduction are not intrinsic properties of a given sedimentary environment; rather, the relative and absolute rates of the two processes can vary over time, most likely depending on seasonal variations in chemical and physical, as well as biological, properties of the environment.
Factors which may affect the absolute rates of either nitrification or denitrification and, therefore, their relative rates and apparent coupling, are known to some extent. Henriksen et al. (1981) list temperature, ammonium concentrat ion, oxygen levels, and numbers of nitrifying organisms as measured by their 'nitrification potential ' assay, as factors relevant to nitrification. Kaplan (1983), in a review of nitrification in the marine environment, includes substrate concentration, oxygen, temperature, organic matter, salinity, surface area and sulfide as influencing this process. Factors which may affect rates of denitrification include temperature, pH, Eh, and
324
concentrations of oxygen, nitrate and organic matter (Hattori, 1983). These factors are not, however, independent of one another. For example, decreasing temperature results in increased oxygen solubility. Furthermore, seasonal changes may affect more than one factor; as the temperature decreases in the fall, one would expect activity m the sediments and, henct~, sulfide levels to fall (Hansen et al. 1981). Finally, some of these factors may have opposing effects on the two processes (nitrification and nitrate reduction). Oxygen inhibits nitrate reduction but is required for nitrification. Higher levels of organic matter should stimulate nitrate reduction and inhibit nitrification (Matin, 1978). Coupling of the two processes, with nitrification supplying nitrate for nitrate reduction, may not be simple. Rather, one might expect an observed coupling to be the result of a multi tude of interacting factors which happen to balance each other at a given point in time.
Rates of both nitrate production (Fig. 3a) and nitrate reduction (Figs. 2a and 3a) slow or stop during the 24--48h time period. A factor which may have affected the 24--48 h rate of nitrification in the October experiment is lowering of oxygen levels which could affect nitrification (Kaplan, 1983). Oxygen levels in the headspaces of the flasks were measured periodically in the September and October experiments, and were found to be no different from air, but headspace oxygen levels may not reflect the actual oxygen levels experienced by the relevant organisms within the sediments. It is unlikely that lowered concentrations of substrate (NH~) could have been the cause of the decrease in nitrate production rate, because the ammonium added to the incubation flask was sufficiently high so as not to be limiting (compare Table I with Figs. 2b and 3b (closed triangles)). Jenkins and Kemp (1984) have also speculated that the reduction they observed in nitrification during the summer (compared to spring} was also a result of lower 02 concentrations.
The decrease in rate of nitrate reduction over the 24--48h period in September and October may reflect substrate (NO~) limitation. Note that, despite the addition of ISN--NO~ to the incubation flasks, the NO~ levels fall well below those present in the 0--2 cm pore waters. (Compare Table I with Figs. 2b and 3b (open triangles)). Another possibility is that suitable, readily oxidizable organic carbon substrates for nitrate reduction are depleted, but we have no way of assessing this at present. The organic content of these sediments is low (0.5% loss on ignition).
An alternative explanation is that the high initial rates of nitrification and nitrate reduction were artifacts of the sampling and incubation procedure. In this case, the negligible rate of nitrate production seen over the 24--48 h period might be more realistic. However, containment of samples in incubation flasks for long periods of time may itself be detrimental. There- fore, we have considered the rates of nitrate production and consumption over the initial 24-h period.
The rates of nitrate production over 24h as measured by the isotope dilution technique are remarkably similar, ranging from 0.010 to 0.015 ttg-at
325
N (g dry w t y I (24h) -1, despite the decrease in temperature, from 22°C in September to 7°C in December. It is well known that rates of enzyme- catalyzed reactions, and rates of biological processes in general, tend to increase as temperature increases, up to the point at which the enzymes are heat-inactivated (Lehninger, 1975). Nitrifying activity in softs is reported to follow this pattern: nitrification rates are greatly reduced at low temperatures (see Belser, 1979). In order for the observed rates of nitrate production at the Roe Ave site to remain constant over decreasing temperatures, other factors must interact to compensate for the expected lowered activity due to temperature. The most obvious factors are increases in dissolved oxygen levels and decreases in possibly inhibitory levels of sulfide and/or organic matter. We did not measure oxygen levels in situ, but casual observation of the cores at sampling showed a greater extent of the oxidized layer in the December cores. Because oxygen solubility increases and heterotrophic oxygen consumption decreases at lowered temperatures, increased oxygen levels could compensate for decreased rates at lower temperatures.
Higher than expected rates of nitrification in winter months, with decreasing temperatures, is not wi thout precedent. Hansen et al. (1981) reported higher levels of nitrifying activity as measured by 'nitrification potential ' in winter in coastal marine sediments in Denmark. They at tr ibuted this to a greater number of nitrifying organisms. We have no assessment of the numbers of organisms at the Roe Ave site. Nixon et al. (1976) reported increased fluxes of nitrate from Narragansett Bay sediments in the winter months, presumably reflecting increased nitrification or decreased utilization of nitrate.
Rates of nitrate reduction measured over a 24-h period by the isotope dilution method decreased with the decrease in temperature over the three sampling times. Rates of nitrate reduction have been observed to follow temperature patterns in Sippewissett Marsh (Kaplan et al., 1979). In addition, increases in oxygen levels and decreases in organic supply which co-occur with a decrease in temperature, would all contr ibute to the decrease in rates of nitrate reduction.
Our measured rates of nitrate product ion are not sufficient to sustain the measured rates of nitrate reduction at the Roe Ave site. Furthermore, denitrification occurs in layers deeper in the sediment core (Slater and Capone, 1984) and nitrification presumably occurs only in the upper oxidized layers (approximately the 0 - -2cm section we used in our incubations) (see Billen, 1976, 1978; Vanderborght and Billen 1975). This situation requires additional nitrate as a substrate for the observed nitrate reduction. We speculate that this need is met by influx of groundwater containing high levels of NO~.
In retrospect, our inability to measure rates of nitrification by the chlorate method is not surprising. Our isotope dilution experiments demon- strate that other processes which may affect the nitrite pool, such as nitrate reduction, are occurring simultaneously. Thus, changes in the level of nitrite

326
due to se lect ive i nh ib i t i on of n i t r i t e o x i d a t i o n m a y be obscured . We c a u t i on
agains t using the i n h i b i t o r m e t h o d when the poss ib i l i t y exists t ha t o t h e r processes which can a f fec t the n i t r i t e poo l m a y be occur r ing c o n c u r r e n t l y wi th n i t r i f i ca t ion .
ACKNOWLEDGMENTS
Mark Bau t i s t a ass is ted in the f ie ld and J .J . M c C a r t h y and J o h n Nevins he lped in mass s p e c t r o g r a p h i c analyses . We t h a n k t h e m . F inanc ia l ass is tance for this work was p r o v i d e d by N S F Gran t s OCE 82-00157 and OCE 82- 14932. Dr. Hor r igan was s u p p o r t e d dur ing this p e r i o d as a Coasta l Mar ine Scho la r o f the Mar ine Sciences Research Center , SUNY, S t o n y Brook . This is c o n t r i b u t i o n No. 445 of t he Mar ine Sciences Research Center .
REFERENCES
Belser, L.W., 1979. Population ecology of nitrifying bacteria. Ann. Rev. Micro., 33: 309-- 333.
Belser, L.W. and Mays, E.L., 1980. Specific inhibition of nitrite oxidation by chlorate and its use in assessing nitrification in soils and sediments. Appt. Environ. MicrobioL, 39: 505--510.
Billen, G., 1976. A method for evaluating nitrifying activity in sediments by dark 14C- bicarbonate incorporation. Water Res., 10: 51--57.
Billen, G., 1978. A budget of nitrogen recycling in North Sea sediments off the Belgian coast. Estuarine Coastal Mar. Sci., 7: 127--146.
Capone, D.G. and Bautista, M.F., 1985. A groundwater source of nitrate in nearshore marine sediments. Nature (London), 313: 214--216.
Capone, D.G. and Taylor, B.F., 1980. Microbial nitrogen cycling in a seagrass com- munity. In: V.S. Kennedy (Editor), Estuarine Perspectives. Academic Press, New York, pp. 153--161.
Gilbert, P.M., Lipschultz, F., McCarthy, J.J. and Altabet, M.A., i982. Isotope dilution models of uptake and remineralization of ammonium by marine plankton. Limnol. Oceanogr., 27 : 639--650.
Hansen, J.I., Henriksen, K. and Blackburn, T.H., 1981. Seasonal distribution of nitrifying bacteria and rates of nitrification in coastal marine sediments. Microb. Ecol., 7: 297--304.
Hattori, A., 1983. Denitrification and dissimilatory nitrate reduction. In: E.J. Carpenter and D.G. Capone (Editors), Nitrogen in the Marine Environment, Academic Press, New York, pp. 191--232.
Henriksen, K., Hansen, J.I. and Blackburn, T.H., 1981. Rates of nitrification, distribution of nitrifying bacteria, and nitrate fluxes in different types of sediment from Danish waters. Mar. Biol., 61: 299--304.
Iizumi, H., Hattori, A. and McRoy, C.P. 1980. Nitrate and nitrite in interstitial waters of eelgrass beds in relation to the rhizosphere. J. Exp. Mar. Biol. Ecol., 47: 191--201.
Jenkins, M.C. and Kemp, W.M., 1984. The coupling of nitrification and denitrification in two estuarine sediments. Limnol. Oceanogr., 29: 609--619.
Kaplan, W.A., 1983. Nitrification. In: E.J. Carpenter and D.G. Capone (Editors), Nitrogen in the Marine Environment. Academic Press, New York, pp. 139--190.
Kaplan, W., Valiela, I. and Teal, J.M., 1979. Denitrification in a salt marsh ecosystem. Limnol. Oceanogr., 24: 726--734.
327
Knowles, R., 1982. Denitrification. Microb. Rev., 46: 43--70. Koike, I . and Hattori, A., 1978. Simultaneous determinations of nitrification and nitrate
reduction in coastal sediments by a lSN-dilution technique. Appl. Environ. Micro- biol., 35: 853--857.
Lehninger, A.L., 1975. Biochemistry. 2nd edn., Worth Publishers, New York, 1104 pp. Matin, A., 1978. Organic nutri t ion of chemili thotrophic bacteria. Ann. Rev. Microbiol.,
32: 433--468. McCarthy, J.J., Taylor, W.R. and Taft, J.L., 1977. Nitrogenous nutri t ion of the plankton
in Chesapeake Bay. I. Nutrient availability and phytoplankton preferences. Limnol. Oceanogr., 22: 996--1011.
Nixon, S.W., Oviatt, C.A. and Hale, S.S., 1976. Nitrogen regeneration and the metabolism of coastal marine bo t tom communities. In: J.M. Anderson and A. Macfayden (Editors), The Role of Terrestrial and Aquatic Organisms in Decomposit ion Processes. Blackwell, Oxford, pp. 269--283.
Slater, J. and Capone, D.G., 1984. Abstract, Annu. Meet. Limnol. Oceanogr., and work in preparation.
Strickland, J.D.H. and Parsons, T.R., 1972. A practical handbook for seawater analysis. Bull. Fish Res. Board Can., 167.
Vanderborght, J.-P. and Billen, G., 1975. Vertical distribution of nitrate concentration in interstitial water of marine sediments with nitrification and denitrification. Limnol. Oceanogr., 20: 953--961.
Wada, E. and Hattori, A., 1972. Nitrite distribution and nitrate reduction in deep sea waters. Deep-Sea Res., 19: 123--132.
Whitledge, T.E., Malloy, S.C., Patton, C.J. and Wirick, C.D., 1981. Automated nutrient analysis in sea water. BNL 51398, UC-11 (Environmental Control Technology and Earth Sciences, TIC-4500), National Technical Information Service.
Copyright © 2022 FDOKUMEN