Systematic model development for partial nitrification of landfill leachate in a SBR
12
Systematic model development for partial nitrification of landfill leachate in a SBR R. Ganigue ´ , E. I. P. Volcke, S. Puig, M. D. Balaguer, J. Colprim and G. Sin ABSTRACT R. Ganigue ´ (corresponding author) M. D. Balaguer J. Colprim Laboratory of Chemical and Environmental Engineering (LEQUIA), Institute of the Environment, University of Girona, Campus Montilivi s/n, Facultat de Cie ` ncies, E-17071 Girona, Catalonia, Spain E-mail: [email protected]; [email protected]; [email protected] E. I. P. Volcke Department of Applied Mathematics, Biometrics and Process Control, Ghent University, Coupure links 653, 9000 Gent, Belgium E-mail: [email protected] S. Puig Catalan Institute for Water research (ICRA). Parc Cientı ´fic i Tecnolo ` gic de la Universitat de Girona, C/Emili Grahit, 101. Edifici H2O, E-17003 Girona, Catalonia, Spain E-mail: [email protected] G. Sin CAPEC-Department of Chemical and Biochemical Engineering, Technical University of Denmark, Building 229, DK-2800 Kgs Lyngby, Denmark E-mail: [email protected] This study deals with partial nitrification in a sequencing batch reactor (PN-SBR) treating raw urban landfill leachate. In order to enhance process insight (e.g. quantify interactions between aeration, CO 2 stripping, alkalinity, pH, nitrification kinetics), a mathematical model has been set up. Following a systematic procedure, the model was successfully constructed, calibrated and validated using data from short-term (one cycle) operation of the PN-SBR. The evaluation of the model revealed a good fit to the main physical-chemical measurements (ammonium, nitrite, nitrate and inorganic carbon), confirmed by statistical tests. Good model fits were also obtained for pH, despite a slight bias in pH prediction, probably caused by the high salinity of the leachate. Future work will be addressed to the model-based evaluation of the interaction of different factors (aeration, stripping, pH, inhibitions, among others) and their impact on the process performance. Key words | anammox, calibration, identifiability, modelling, partial nitrification, SBR INTRODUCTION During partial nitrification, ammonium is oxidised to nitrite while further nitrification to nitrate is suppressed. This reaction plays an important role during biological nitrogen removal from streams with high ammonium concentrations (e.g. sludge digester supernatant, landfill leachate), when aiming at lower oxygen and organic matter consumption, in comparison with conventional nitrification/denitrification treatments. For instance, partial nitrification reactors can be coupled with an anammox process, ending up in a fully autotrophic system capable of removing high nitrogen loads in a more sustainable way (Van Dongen et al. 2001). Previous studies (Lai et al. 2004; Ganigue ´ et al. 2007) demonstrated the feasibility of achieving a successful nitritation using the Sequencing Batch Reactor (SBR) tech- nology for the treatment of nitrogen high-loaded streams. However, despite the experience acquired, the reactor’s response to changes in the operational conditions and influent characteristics is not always easy to understand or predict, given the complexity of the system, e.g. interactions between oxygen supply, CO 2 stripping, alkalinity, pH, inhibition effects, nitrification kinetics, among others. Mathematical models can be a useful tool to increase the process knowledge and help to better understand doi: 10.2166/wst.2010.979 2199 Q IWA Publishing 2010 Water Science & Technology—WST | 61.9 | 2010
-
Upload
independent -
Category
Documents
-
view
0 -
download
0
Transcript of Systematic model development for partial nitrification of landfill leachate in a SBR

Systematic model development for partial nitrification
of landfill leachate in a SBR
R. Ganigue, E. I. P. Volcke, S. Puig, M. D. Balaguer, J. Colprim and G. Sin
ABSTRACT
R. Ganigue (corresponding author)
M. D. Balaguer
J. Colprim
Laboratory of Chemical and Environmental
Engineering (LEQUIA),
Institute of the Environment, University of Girona,
Campus Montilivi s/n, Facultat de Ciencies,
E-17071 Girona, Catalonia,
Spain
E-mail: [email protected];
E. I. P. Volcke
Department of Applied Mathematics,
Biometrics and Process Control, Ghent University,
Coupure links 653, 9000 Gent,
Belgium
E-mail: [email protected]
S. Puig
Catalan Institute for Water research (ICRA).
Parc Cientıfic i Tecnologic de la Universitat de
Girona, C/Emili Grahit, 101. Edifici H2O,
E-17003 Girona, Catalonia,
Spain
E-mail: [email protected]
G. Sin
CAPEC-Department of Chemical and Biochemical
Engineering, Technical University of Denmark,
Building 229, DK-2800 Kgs Lyngby,
Denmark
E-mail: [email protected]
This study deals with partial nitrification in a sequencing batch reactor (PN-SBR) treating raw
urban landfill leachate. In order to enhance process insight (e.g. quantify interactions between
aeration, CO2 stripping, alkalinity, pH, nitrification kinetics), a mathematical model has been set
up. Following a systematic procedure, the model was successfully constructed, calibrated and
validated using data from short-term (one cycle) operation of the PN-SBR. The evaluation of the
model revealed a good fit to the main physical-chemical measurements (ammonium, nitrite,
nitrate and inorganic carbon), confirmed by statistical tests. Good model fits were also obtained
for pH, despite a slight bias in pH prediction, probably caused by the high salinity of the leachate.
Future work will be addressed to the model-based evaluation of the interaction of different
factors (aeration, stripping, pH, inhibitions, among others) and their impact on the process
performance.
Key words | anammox, calibration, identifiability, modelling, partial nitrification, SBR
INTRODUCTION
During partial nitrification, ammonium is oxidised to
nitrite while further nitrification to nitrate is suppressed.
This reaction plays an important role during biological
nitrogen removal from streams with high ammonium
concentrations (e.g. sludge digester supernatant, landfill
leachate), when aiming at lower oxygen and organic
matter consumption, in comparison with conventional
nitrification/denitrification treatments. For instance, partial
nitrification reactors can be coupled with an anammox
process, ending up in a fully autotrophic system capable
of removing high nitrogen loads in a more sustainable
way (Van Dongen et al. 2001).
Previous studies (Lai et al. 2004; Ganigue et al. 2007)
demonstrated the feasibility of achieving a successful
nitritation using the Sequencing Batch Reactor (SBR) tech-
nology for the treatment of nitrogen high-loaded streams.
However, despite the experience acquired, the reactor’s
response to changes in the operational conditions and
influent characteristics is not always easy to understand or
predict, given the complexity of the system, e.g. interactions
between oxygen supply, CO2 stripping, alkalinity, pH,
inhibition effects, nitrification kinetics, among others.
Mathematical models can be a useful tool to increase
the process knowledge and help to better understand
doi: 10.2166/wst.2010.979
2199 Q IWA Publishing 2010 Water Science & Technology—WST | 61.9 | 2010

biological processes and the physical phenomena taking
place in a partial nitrification-sequencing batch reactor
(PN-SBR). Traditional modelling has assumed nitrification
and denitrification as single-step processes (Henze et al.
2000). Nevertheless, when modelling a partial nitrification
system it is necessary to consider nitrite as an intermediary
step of nitrification and denitrification. Nowadays there are
several biological models describing nitrite build-up, as
reviewed by Sin et al. (2008). Some of these models focus on
the treatment of nitrogen high loaded-streams (Hellinga
et al. 1999; Volcke et al. 2002; Wett & Rauch 2003; among
others) and can be used as a basis when modelling specific
processes. It is clear that existing models may need to be
modified or extended to include all relevant physical-
chemical processes and biochemical transformations for a
given application. Besides, the model needs to be calibrated
for influent and process specific parameters. This is high-
lighted in this study for partial nitrification of landfill
leachate in a SBR, aiming at increased process knowledge
(e.g. quantify interactions between aeration, CO2 stripping,
alkalinity, pH, nitrification kinetics) and focusing on the
short-term dynamics (cycle basis). This work also deals
with the usefulness of a systematic calibration guideline and
its refinement.
MATERIALS AND METHODS
Reactor set-up and operation
The reactor under study concerns a 20L lab-scale SBR
treating raw urban landfill leachate. The reactor tempera-
ture was controlled at 36 ^ 18C through a water jacket.
Dissolved oxygen was kept at a set-point value of
2.0mgO2L21 by an on-off controller acting on the airflow.
The SBR was equipped with a monitoring and control
system including on-line probes measuring dissolved
oxygen (DO), pH, oxidation-reduction potential (ORP)
and temperature (T). A more detailed description of the
experimental set-up can be found in Ganigue et al. (2007).
The SBR was operated for more than 400 days with a
constant cycle length of 8 h. During a first period (day 0
to 245), a fed-batch operating strategy was applied,
characterised by one long feeding phase. Afterwards, the
operation strategy was switched to a step-feeding, with
multiple feeding events (days 245 to 410). Figure 1 presents
both strategies in a schematic way.
After a transition period (of 58 and 27 days, respect-
ively), each of these operational periods was characterised
by fixed cyclic concentration profiles. The model calibration
has been based on the steady-state profiles of the fed-
batch phase, while the data of the step-feed phase have
been used for model validation. During both phases, the
nitrogen loading rate (NLR) was 1.3 kgNm23 d21. Despite
the variations in influent ammonium, the NLR was
kept constant by adjusting the inflow, ending up in
different hydraulic retention times (HRT) for each phase
(fed-batch: HRT ¼ 1.35 days; step-feed: HRT ¼ 1.53
days). In both phases the sludge retention time (SRT) was
around 3–5 days.
Calibration guideline
In order to perform the modelling procedure in a systematic
and organised way, the guideline presented in Corominas
(2006) for the SBR systems was followed. Nevertheless, due
to specific features of the PN-SBR system, minor modifi-
cations were introduced to this guideline. These changes
AerationFeeding+aeration DrawSettling
Time (min)
0 60 120 180 240 300 360 420 480
Fed-batch (calibration)
Step-feed (validation)(b)
(a)
Figure 1 | SBR cycle definition in both periods. a) fed-batch and b) step-feed. (Ganigue et al. 2008).
2200 R. Ganigue et al. | Modelling SBR nitrification of landfill leachate Water Science & Technology—WST | 61.9 | 2010

included: (i) the adaptation of the influent wastewater
characterisation to the available historical data, (ii) the
inclusion of an identifiability analysis to find an identifiable
parameter subset for model fine-tuning (Ruano et al. 2007)
and (iii) the use of additional statistical tests for the
evaluation of the model fits to data.
Wastewater characterisation
Four state variables involving nitrogen fractionation
were considered in Corominas (2006): SNH (linked to
ammonium), SNO (equivalent to the sum of nitrites and
nitrates), and SND and XND (which accounted for the
soluble and particulate nitrogen fractions of soluble and
particulate organic matter, respectively). In our partial
nitrification model, nitrite and nitrate are considered
separately. On the other hand, SND and XND are not
taken up, since organic nitrogen is considered as a fraction
of the organic matter (SS, SI, XS and XI).
Regarding the organic matter, the available historical
data sets did not contain soluble chemical oxygen demand
(CODS) measurements, essential for the organic matter
fractionation. Nevertheless, dissolved organic carbon
(DOC) measurements were available. In this way, CODS
at the influent and effluent were calculated from the DOC
values, applying empirical ratios. These ratios were exper-
imentally found to be 1.86mg CODS per mg DOC at the
influent, and 2.3mg CODS per mg DOC at the effluent.
Identifiability analysis
The methodology defined in Brun et al. (2002), based on a
local sensitivity analysis, was used to find an identifiable
subset of parameters to calibrate the PN-SBR model. To be
identifiable, a parameter subset has to fulfil two conditions.
First, a model output, y, has to be sufficiently sensitive to
individual changes of each parameter, j. This is addressed by
the sensitivity measure dyjmsqr. Secondly, variations in the
model output due to changes in single parameters may
not be approximately cancelled by appropriate changes
in other parameters. This analysis of the parameter
interdependences is addressed by the collinearity index,
gK. The determinant value, rK, takes into account both
identifiability conditions simultaneously and is, therefore,
particularly suited for the assessment of identifiability of
parameter subsets. The identifiability analysis has been
carried out following the different steps gathered in Table 1.
Statistical tests for model evaluation
To support the visual evaluation, the quality of the fits was
assessed also by statistical tests (Table 2, see Power 1993).
MAE and RMSE are statistical tests directly related to
each output, accounting for the same units. On the other
hand, ARD is a test that informs about relative deviations.
Finally, the Janus coefficient measures the predictive
accuracy of the model, and its value should be close to 1.
Table 1 | Different steps of the identifiability methodology of Brun et al. (2002)
Non-dimensional sensitivity (Sij) Sensitivity measure (dyjmsqr) Collinearity index (gK) Determinant value (rK)
Sij ¼›yi›uj
·ujyi
dmsqryj ¼
ffiffiffiffiffiffiffiffiffiffiffiffi1n
Pni¼1 S
2ij
qgK ¼ 1ffiffiffiffiffiffi
min ~lkp rK ¼ det ST
KSK
� �1=2k
where dyi/duj is defined as the absolute sensitivity of the model output yi to the parameter uj; n the number of measurements (at different time instants); min lk is the smallest eigenvalue of
the normalised subset matrix ~STK~SK , and det ST
KSk� �1=2k
is the determinant function of the n £ K subset matrix of S.
Table 2 | Statistical tests
Mean absolute error (MAE) Root mean squared error (RMSE) Average relative deviation (ARD) Janus coefficient (J 2)
MAE ¼ 1n
Pni¼1 ymeas;i 2 yðtiÞ
�� �� RMSE ¼ffiffiffiffiffiffiffiffiffiffiffiffiffiffiffiffiffiffiffiffiffiffiffiffiffiffiffiffiffi1n
Pni¼1 ðymeas;i 2 yðtiÞÞ
2q
ARD ¼
ffiffiffiffiffiffiffiffiffiffiffiffiffiffiffiffiffiffiffiffiffiffiffiffiffi1n
Pni¼1
ymeas;i2yðtiÞj jymeas;i
� �sJ2 ¼
1n_val
Pn_val
i¼1ðymeas;i2yðtiÞÞ
2
1n_cal
Pn_cal
i¼1ðymeas;i2yðtiÞÞ
2
n is the total number of observations of the variable y; ymeas,i is the ith measurement of the variable y, and y(ti) is the corresponding model output at time i; n_cal and n_val are the total
number of measurements in calibration and validation period, respectively.
2201 R. Ganigue et al. | Modelling SBR nitrification of landfill leachate Water Science & Technology—WST | 61.9 | 2010

THE PARTIAL NITRIFICATION MODEL
The partial nitrification SBR model (implemented in
Matlab-Simulinkw) was based on the SHARON model
developed by Volcke et al. (2002). This model was adapted
from state variables expressed on a molar basis to the same
units as the Activated Sludge Models (ASM, Henze et al.
2000). Firstly, the hydraulic model was changed from a
continuous stirred-tank reactor (CSTR) to a SBR, by
implementing a cycle that was repeated over time.
Biological reactions took place during feeding and reaction
phases. Settling and draw phases were ideally modelled,
assuming that no biological reactions were taking place.
Furthermore, settling was modelled considering the SBR as
a point settler. The total suspended solids in the effluent
were assumed to be the non-settlable fraction ( fns).
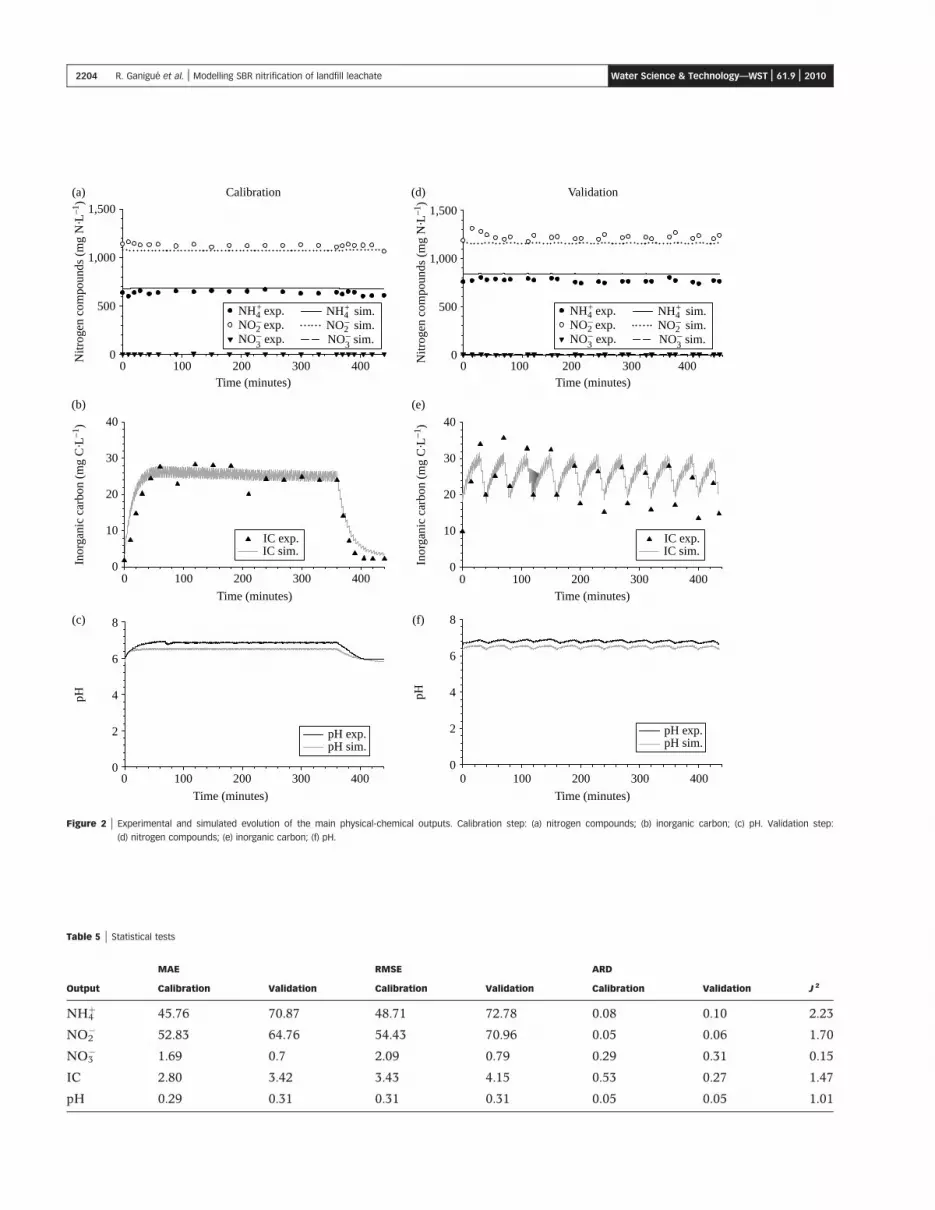
Regarding the biokinetic model (given as appendix in
matrix format), reversible inhibition kinetics were included
for free ammonia and free nitrous acid for both ammonium
and nitrite oxidation processes (the original model only
contained nitrous acid inhibition of ammonium oxidation).
In addition, bicarbonate limitation was taken up. Focusing
on the heterotrophic conversions, a general readily bio-
degradable organic matter component (SS) was considered
as a substrate for heterotrophic biomass, instead of
methanol. Besides, the following biokinetic conversions
were added: hydrolysis of the slowly biodegradable organic
matter and the endogenous respiration processes (nine in
total) of each biomass type (XAOB, XNOB, XH) on each
possible electron acceptor (O2, NO22 and NO3
2). As a result,
this model considers 15 different microbial transformation
processes, all taking place in the liquid phase. The
stoichiometry and kinetics for the biological conversion
reactions can be found in the appendix (Table A.1), as well
as the kinetic and stoichiometric parameters (Tables A.2
and A.3). Temperature dependency was also taken into
account on the kinetic parameters by an Arrhenius type
expression, despite the reactor being operated at a constant
temperature. In this way, temperature correction coeffi-
cients are also included in the appendix (Table A.4).
Besides the reactor liquid phase, in which the biological
reactions take place, the model also considers a gas phase
(i.e. the bubbles in the liquid phase). Between these phases,
which are both assumed to be perfectly mixed, transport
of oxygen, carbon dioxide, nitrogen and ammonia occurs.
Volcke et al. (2002) did not take up interphase transport
(stripping) of ammonia, but it is considered in this study
due to the very high influent concentration of ammonium
(about 2 gNL21).
Nitrification of wastewater streams with high
ammonium concentrations combined with CO2 stripping
causes high pH variations. In its turn, pH affects the
chemical equilibrium of substrates and inhibitory com-
pounds. It is therefore essential to take up pH as a model
variable. Nevertheless pH is not a state variable. Its
concentration is not calculated from a mass balance
(which would result in a differential equation) but from a
charge balance over the reactor, expressing that the sum of
all charges must be zero (Equation (1)).
Dch ¼ ½Hþ�2 ½OH2� þ ½NHþ4 �2 ½NO2
2 �2 ½NO23 �
2 ½HCO23 �2 2·½CO22
3 �2 ½H2PO24 �2 2·½HPO22
4 �
þ ½Zþ� ð1Þ
In this equation, Zþ represents the concentration of net
positive charges which are not involved in chemical
equilibrium reactions, and do not take part in biological
conversions. Note that the concentration of Zþ can be
negative if there are more negative than positive charges.
A detailed description of pH calculation by means of a
charge balance can be found in Volcke et al. (2002).
MODEL CALIBRATION AND VALIDATION
Identifiability analysis
An identifiability analysis was performed to determine an
identifiable subset of parameters to calibrate the model.
For this purpose, 30 parameters (all kinetic parameters
plus the temperature correction coefficients) have been
considered, as well as five different outputs (NH4þ, NO2
2,
NO32, IC and pH).
First, the total sensitivity of each parameter, d jmsqr, was
calculated, taking into account the sensitivity measures for
all the outputs. High d jmsqr values imply high parameter
significance. In this way, all parameters were ranked
according to their importance. From this ranking, only the
2202 R. Ganigue et al. | Modelling SBR nitrification of landfill leachate Water Science & Technology—WST | 61.9 | 2010

more sensitive parameters could be considered identifiable.
There is not a clear cut-off value for the d jmsqr (Ruano et al.
2007). Nevertheless, based on experience, a threshold value
of 0.05 was chosen as a cut-off value to select the more
significant parameters, and reduce the computational time
for further collinearity index and determinant measures
calculation. As a result, a subset containing the 12
parameters presenting the higher d jmsqr was selected.
Subsequently, the collinearity index (g) and the deter-
minant measures (r) for each output variable were
calculated for all possible subsets containing two to 12 of
the 12 most significant parameters. From these results, the
larger parameter subsets satisfying the identifiability
threshold (taken as g ¼ 5 in this study, based on previously
reported experiences) were selected (see Table 3). Note that
no subset is presented for NO32, since no parameter subset
yielded a collinearity index lower than the threshold value
(g , 5) for this output.
Calibration and validation
The calibration step was conducted in two stages, as
proposed in Corominas (2006). First, the model was
simulated with a constant influent to reach quasi steady-
state, and the volatile suspended solids (VSS) concentration
inside the reactor was adjusted by tuning the fns. Once
achieved proper conditions, the cycle evolution calibration
was performed following a step-wise procedure. The
process dynamics were fitted by manually fine-tuning
the identifiable parameter subsets previously found in the
identifiability analysis (see Table 3). A maximum of 10%
variation on the parameter, in respect to its default
value, was considered acceptable. The model fitting to the
respective output was visually assessed. In this sense,
only mmaxAOB, mmax
NOB and pHopt (accounting for the higher
d jmsqr values) gave a significant response. The initial
and final values of the tuned parameters are presented
in Table 4.
After finishing the calibration step, the model was
validated using an independent data set, in this case cyclic
profiles corresponding to step-feed operation (Figure 1).
Figure 2 presents the results of the calibration (2.a, 2.b
and 2.c) and the validation (2.d, 2.e and 2.f) for the nitrogen
compounds, inorganic carbon and pH.
Figure 2 shows a good model fit to the data in both
calibration and validation steps. The model accurately
follows the dynamic trends in the nitrogen compounds
(nitrite build-up, without nitrate production) and inorganic
carbon. On the other hand, Figure 2(c,f) present the
experimental and simulated pH profiles. As it can be seen,
the model is capable of forecasting the pH dynamics,
despite a slight bias (an off-set of about 0.3–0.4 pH units)
between the simulated and experimental values. Taking into
account the high sensitivity of pH in non-buffered systems,
this deviation is deemed acceptable. One of the main
hypotheses for this deviation may be the effect of salinity.
Raw leachate used in this study presented a conductivity
above 35,000mS cm21. In this sense, elevated ionic
strengths may affect pH calculation. Under such a high
value, it is recommended to use activities instead of
concentrations (Smith & Chen 2006).
Statistical tests for model evaluation
Besides the visual judgement described above, the model
fit for the calibration and validation data sets was also
quantified on the basis of statistical tests. Results are
summarised in Table 5.
As can be seen in Table 5, ammonium and nitrite
present MAE and RMSE values higher than 40. This is due
to the elevated concentration of these compounds, and may
not imply poor fittings. In this way, ARD could be useful to
Table 3 | Parameter subsets selected on the identifiability analysis
Output Parameter subset g r
NH4þ mmax
AOB, mmaxNOB, mmax
H , bH, KNOBI;HNO2
4.77 3.5
NO22 bAOB, bH, KSS
H 4.23 8.57
IC mmaxH , h, bAOB, bH, KNOB
I;HNO2, pHopt 4.28 120.50
pH mmaxNOB, mmax
HET, h, bAOB, bH, KIC, KSSH , KI,O2
4.7 1.29
Table 4 | Initial and calibrated values
Parameter Initial Calibrated
mmaxAOB 2.1 2.31
mmaxNOB 1.05 0.945
pHopt 7.23 7.63
2203 R. Ganigue et al. | Modelling SBR nitrification of landfill leachate Water Science & Technology—WST | 61.9 | 2010
Calibration
Nitr
ogen
com
poun
ds (
mg
N·L
–1)
0
500
1,000
1,500(a)
NH4+ exp.
NO2– exp.
NO3– exp.
NH4+ sim.
NO2– sim.
NO3– sim.
Time (minutes)0 100 200 300 400
Inor
gani
c ca
rbon
(m
g C
·L–1
)
0
10
20
30
40
(e)
IC sim.IC exp.
Time (minutes)0 100 200 300 400
Validation
NH4+ exp.
NO2– exp.
NO3– exp.
NH4+ sim.
NO2– sim.
NO3– sim.
Time (minutes)0 100 200 300 400N
itrog
en c
ompo
unds
(m
g N
·L–1
)
0
500
1,000
1,500
(d)
pH
0
2
4
6
8(f)
pH exp.pH sim.
Time (minutes)
0 100 200 300 400
IC sim.IC exp.
Inor
gani
c ca
rbon
(m
g C
·L–1
)
0
10
20
30
40
(b)
Time (minutes)
0 100 200 300 400
pH
0
2
4
6
8(c)
pH exp.pH sim.
Time (minutes)
0 100 200 300 400
Figure 2 | Experimental and simulated evolution of the main physical-chemical outputs. Calibration step: (a) nitrogen compounds; (b) inorganic carbon; (c) pH. Validation step:
(d) nitrogen compounds; (e) inorganic carbon; (f) pH.
Table 5 | Statistical tests
MAE RMSE ARD
Output Calibration Validation Calibration Validation Calibration Validation J 2
NH4þ 45.76 70.87 48.71 72.78 0.08 0.10 2.23
NO22 52.83 64.76 54.43 70.96 0.05 0.06 1.70
NO32 1.69 0.7 2.09 0.79 0.29 0.31 0.15
IC 2.80 3.42 3.43 4.15 0.53 0.27 1.47
pH 0.29 0.31 0.31 0.31 0.05 0.05 1.01
2204 R. Ganigue et al. | Modelling SBR nitrification of landfill leachate Water Science & Technology—WST | 61.9 | 2010

assess the adjustment of such concentrated compounds.
Thus, average relative deviations of NH4þ and NO2
2 are
lower than 10%, pointing out a good adjustment of the
model to the experimental data. The higher values of these
statistics for the validation could be related to the higher
nitrogen concentration at the influent of the validation
cycle (200–300mgN-NH4þL21). Regarding nitrate and
inorganic carbon, both outputs present low MAE and
RMSE values. On the contrary, the ARD statistic points out
poor adjustments. Figure 2 has revealed a good fitting for
the NO32 and IC; in this sense these high ARD values may
be caused by a magnification of the deviation due to the
low concentration of these compounds. Finally, results of
the different statistics for the pH reveal a similar fitting
on the calibration and validation step, presenting low
MAE, RMSE and ARD values. Focusing on the Janus
coefficient, values obtained for the PN-SBR model are not
so far from 1, implying that the model structure has
remained unchanged during calibration and validation
periods. In this sense the predictive accuracy of the
model has been verified.
CONCLUSIONS
A mathematical model of a partial nitrification SBR treating
raw urban landfill leachate has been successfully con-
structed, calibrated and validated using historical data. The
development of this model has been carried out following
a systematic guideline, which has been upgraded through
the inclusion of an identifiability analysis step as well
as additional statistical tests for the evaluation of the
model fitting.
The calibrated PN-SBR model is capable of predicting
the behaviour of the main physical-chemical outputs (NH4þ,
NO22, NO3
2 and IC) with a good accuracy. Good results
were also obtained for pH, despite a slight bias on pH
forecasting, probably caused by the high salinity of the
leachate. In this way, the refinement on the prediction of
this output should be taken into account for further model
upgrading. Future work will be also addressed to the
evaluation of the interaction of different factors (aeration,
stripping, pH, inhibitions, among others) and their impact
on the process.
ACKNOWLEDGEMENTS
The authors thank the Catalan Government (Postdoctoral
fellowship “Beatriu de Pinos” BP-B1-00193-2007), CESPA-
GR, the PANAMMOX project (CIT-310200-2007-90,
PET-2006-0604) and the NOVEDAR CONSOLIDER
project (CSD-2007-0055) for their financial support in this
study. Also, the authors gratefully acknowledge the valuable
contributions made by G. Rustullet and A. Cabezas during
the experimental study. Eveline Volcke is a post-doctoral
research fellow of the Research Foundation - Flanders
(Belgium) (FWO).
REFERENCES
Brun, R., Kuhni, M., Siegrist, H., Gujer, W. & Reichert, P. 2002
Practical identifiability of ASM2d parameters-systematic
selection and tuning of parameter subsets. Water Res. 36(16),
4113–4127.
Corominas, Ll. 2006 Control and optimization of an SBR for
nitrogen removal: From model calibration to plant operation.
PhD thesis, University of Girona, Girona, Spain. Available on:
http://www.tesisenxarxa.net/TESIS_UdG/AVAILABLE/TDX-
0720106-115017//tlct.pdf
Ganigue, R., Lopez, H., Balaguer, M. D. & Colprim, J. 2007 Partial
ammonium oxidation to nitrite of high ammonium content
urban landfill leachates. Water Res. 41(15), 3317–3326.
Ganigue, R., Lopez, H., Ruscalleda, M., Balaguer, M. D. & Colprim,
J. 2008 Operational strategy for a partial nitritation-SBR
(PN-SBR) treating urban landfill leachate to achieve a stable
influent for an anammox reactor. J. Chem. Technol.
Biotechnol. 83(3), 365–371.
Hellinga, C., van Loosdrecht, M. C. M. & Heijnen, J. J. 1999 Model
based design of a novel process for nitrogen removal from
concentrated flows. Math. Comput. Model. Dyn. Syst. 5(4),
351–371.
Henze, M., Gujer, W., Mino, T. & van Loosdrecht, M. C. M. 2000
Activated Sludge Models ASM1, ASM2, ASM2d and ASM3.
Scientific and Technical Report. IWA Publishing, London,
UK, p. 121.
Lai, E., Senkpiel, S., Solley, D. & Keller, J. 2004 Nitrogen removal
of high strength wastewater via nitritation/denitritation using
a sequencing batch reactor. Water Sci. Technol. 50(10), 27–33.
Lochtman, S. F. W. 1995 Proceskeuze en -optimalisatie van het
SHARON process voor slibverwerkingsbedrijf Sluisjesdijk
(Process choice and optimisation of the SHARON process
for the sludge treatment plant Sluisjesdijk). BODL report.
TU Delft.
Magrı, A., Corominas, Ll., Lopez, H., Campos, E., Balaguer, M. D.,
Colprim, J. & Flotats, X. 2007 A model for the simulation of
the SHARON process: pH as a key factor. Environ. Technol.
28(3), 255–265.
2205 R. Ganigue et al. | Modelling SBR nitrification of landfill leachate Water Science & Technology—WST | 61.9 | 2010

Muller, A., Wentzel, M. C., Loewenthal, R. E. & Ekama, G. A. 2003
Heterotroph anoxic yield in anoxic aerobic activated sludge
systems treating municipal wastewater. Water Res. 37,
2435–2441.
Power, M. 1993 The predictive validation of ecological and
environmental models. Ecol. Model. 68, 33–50.
Ruano, M. V., Ribes, J., De Pauw, D. J. W. & Sin, G. 2007
Parameter subset selection for the dynamic calibration
of activated sludge models (ASMs): experience
versus systems analysis. Water Sci. Technol. 56(8),
107–115.
Sin, G., Kaelin, D., Kampschreur, M. J., Takacs, I., Wett, B.,
Gernaey, K., Rieger, L., Siegrist, H. & van Loosdrecht, M. C.
M. 2008 Modelling nitrite in wastewater treatment systems: a
discussion of different modelling concepts. Water Sci. Technol.
58(6), 1155–1171.
Smith, S. A. & Chen, S. 2006 Activity corrections for ionization
constants in defined media. Water Sci. Technol. 54(4),
21–29.
Van Dongen, U., Jetten, M. S. M. & van Loosdrecht, M. C. M. 2001
The SHARON-ANAMMOX process for treatment of
ammonium rich wastewater. Water Sci. Technol. 44(1),
153–160.
Van Hulle, S. W. H., Volcke, E. I. P., Lopez-Teruel, J., Donckels, B.,
van Loosdrecht, M. C. M. & Vanrolleghem, P. A. 2007
Influence of temperature and pH on the kinetics of the
SHARON nitritation process. J. Chem. Technol. Biotechnol.
82(5), 471–480.
Volcke, E. I. P. 2006 Modelling, analysis and control of partial
nitritation in a SHARON reactor. PhD thesis, Ghent
University, Ghent, Belgium, p. 300. Available on: http://
biomath.ugent.be/publications/download/
VolckeEveline_PhD.pdf
Volcke, E. I. P., Hellinga, C., Van Den Broeck, S., van Loosdrecht,
M. C. M. & Vanrolleghem, P. A. 2002 Modelling the SHARON
process in view of coupling with Anammox. Proceedings 1st
IFAC International Scientific and Technical Conference on
Technology, Automation and Control of Wastewater and
Drinking Water Systems (TiASWiK’02). Gdansk-Sobieszewo,
Poland, June 19–21 2002, pp. 65–72.
Wett, B. & Rauch, W. 2003 The role of inorganic carbon limitation
in biological nitrogen removal of extremely ammonia
concentrated wastewater. Water Res. 37(5), 1100–1110.
Wiesmann U. 1994 Advances in Biochemical Engineering/
Biotechnology (Vol. 51). Springer-Verlag, Berlin, Germany,
pp. 113–154.
2206 R. Ganigue et al. | Modelling SBR nitrification of landfill leachate Water Science & Technology—WST | 61.9 | 2010

APPENDIX
Table A.1 | Stoichiometric matrix, including reaction rates
SNH SNO2SNO3
SN2SIC SO2
SIP
Process gNm23 gNm23 gNm23 gNm23 gCm23 gO2m23 gPm23
Aerobic ammonium oxidation 2 1YAOB
2 iNBM1
YAOB– – 2iCBM 2 3:432YAOB
YAOB2 iPBM
Aerobic nitrite oxidation 2iNBM 2 1YNOB
1YNOB
– 2iCBM 2 1:142YNOB
YNOB2 iPBM
Aerobic organic matter oxidation 1YH
·iNSS 2 iNBM – – – 1YH
·iCSS 2 iCBM 2 12YH
YH
1YH
·iPSS 2 iPBM
Denitrification of nitrite 1YH;NO2
·iNSS 2 iNBM 212YH;NO2
1:71·YH;NO2–
12YH;NO2
1:71·YH;NO2
1YH;NO2
·iCSS 2 iCBM – 1YH;NO2
·iPSS 2 iPBM
Denitrification of nitrate 1YH;NO3
·iNSS 2 iNBM12YH;NO3
1:14·YH;NO32
12YH;NO3
1:14·YH;NO3– 1
YH;NO3·iCSS 2 iCBM – 1
YH;NO3·iPSS 2 iPBM
Hydrolysis of XS iNXS 2 iNSS – – – iCXS 2 iCSS – iPXS 2 iPSS
Aerobic endogenous respiration of XAOB iNBM 2 fxI·iNXI – – – iCBM 2 fxI·iCXI 2(1 2 fxI) iPBM 2 fxI·iPXI
Anoxic endogenous respiration of XAOB on NO32 iNBM 2 fxI·iNXI
12fxI1:14 2 12fxI
1:14 – iCBM 2 fxI·iCXI – iPBM 2 fxI·iPXI
Anoxic endogenous respiration of XAOB on NO22 iNBM 2 fxI·iNXI 2 12fxI
1:71 – 12fxI1:71 iCBM 2 fxI·iCXI – iPBM 2 fxI·iPXI
Aerobic endogenous respiration of XNOB iNBM 2 fxI·iNXI – – – iCBM 2 fxI·iCXI 2(1 2 fxI) iPBM 2 fxI·iPXI
Anoxic endogenous respiration of XNOB on NO32 iNBM 2 fxI·iNXI
12fxI1:14 2 12fxI
1:14 – iCBM 2 fxI·iCXI – iPBM 2 fxI·iPXI
Anoxic endogenous respiration of XNOB on NO22 iNBM 2 fxI·iNXI 2 12fxI
1:71 – 12fxI1:71 iCBM 2 fxI·iCXI – iPBM 2 fxI·iPXI
Aerobic endogenous respiration of XH iNBM 2 fxI·iNXI – – – iCBM 2 fxI·iCXI –(1 2 fxI) iPBM 2 fxI·iPXI
Anoxic endogenous respiration of XH on NO32 iNBM 2 fxI·iNXI
12fxI1:14 2 12fxI
1:14 – iCBM 2 fxI·iCXI – iPBM 2 fxI·iPXI
Anoxic endogenous respiration of XH on NO22 iNBM 2 fxI·iNXI 2 12fxI
1:71 – 12fxI1:71 iCBM 2 fxI·iCXI – iPBM 2 fxI·iPXI
XAOB XNOB XH SS XS XI
Process gCODm23 gCODm23 gCODm23 gCODm23 gCODm23 gCODm23 Process rates
Aerobic ammonium oxidation 1 – – – – –mAOBmax ·
SNH3
KAOBNH3
þSNH3
·SO2
KAOBO2
þSO2
·KAOB
I;NH3
KAOBI;NH3
þSNH3
·KAOB
I;HNO2
KAOBI;HNO2
þSHNO2
·SHCO2
3
KHCO23þSHCO2
3
·KpH
KpH21þ10pHopt2pHj j
·XAOB
Aerobic nitrite oxidation – 1 – – – – mNOBmax ·
SHNO2
KNOBHNO2
þSHNO2
·SO2
KNOBO2
þSO2
·KNOB
I;HNO2
KNOBI;HNO2
þSHNO2
·KNOB
I;NH3
KNOBI;NH3
þSNH3
·SHCO2
3
KHCO23þSHCO2
3
·KpH
KpH21þ10pHopt2pHj j
·XNOB
Aerobic organic matter oxidation – – 1 2 1YH
– – mHmax·
SO2
KHO2
þSO2
· SSKH
SSþSS
·KpH
KpH21þ10pHopt2pHj j
·XH
Denitrification of nitrite – – 1 2 1YH;NO2
– – mHmax·h·
SNO2
KdNO2NO2
þSNO2
· SSKH
SSþSS
·SNO2
SNO3þSNO2
·KI;O2
KI;O2þSO2
·KpH
KpH21þ10pHopt2pHj j
·XH
22
07
R.
Gan
igu
eetal. |
Mo
dellin
gSB
Rn
itrifica
tion
of
lan
dfill
leach
ate
Wate
rS
cien
ce&
Te
chn
olo
gy—
WS
T|
61
.9|
20
10
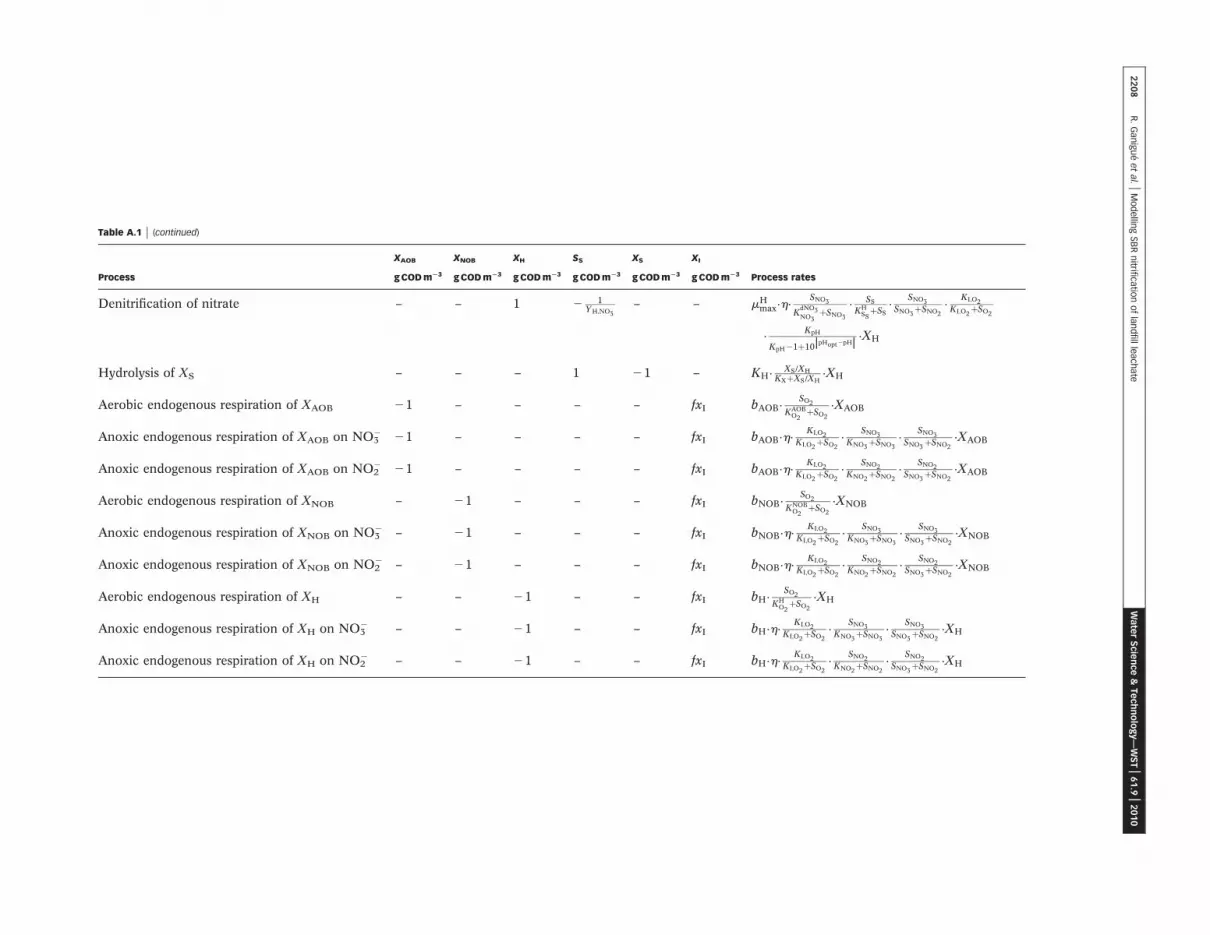
Table A.1 | (continued)
XAOB XNOB XH SS XS XI
Process gCODm23 gCODm23 gCODm23 gCODm23 gCODm23 gCODm23 Process rates
Denitrification of nitrate – – 1 2 1YH;NO3
– – mHmax·h·
SNO3
KdNO3NO3
þSNO3
· SS
KHSS
þSS·
SNO3
SNO3þSNO2
·KI;O2
KI;O2þSO2
·KpH
KpH21þ10pHopt2pHj j
·XH
Hydrolysis of XS – – – 1 21 – KH·XS=XH
KXþXS =XH·XH
Aerobic endogenous respiration of XAOB 21 – – – – fxI bAOB·SO2
KAOBO2
þSO2
·XAOB
Anoxic endogenous respiration of XAOB on NO32 21 – – – – fxI bAOB·h·
KI;O2
KI;O2þSO2
·SNO3
KNO3þSNO3
·SNO3
SNO3þSNO2
·XAOB
Anoxic endogenous respiration of XAOB on NO22 21 – – – – fxI bAOB·h·
KI;O2
KI;O2þSO2
·SNO2
KNO2þSNO2
·SNO2
SNO3þSNO2
·XAOB
Aerobic endogenous respiration of XNOB – 21 – – – fxI bNOB·SO2
KNOBO2
þSO2
·XNOB
Anoxic endogenous respiration of XNOB on NO32 – 21 – – – fxI bNOB·h·
KI;O2
KI;O2þSO2
·SNO3
KNO3þSNO3
·SNO3
SNO3þSNO2
·XNOB
Anoxic endogenous respiration of XNOB on NO22 – 21 – – – fxI bNOB·h·
KI;O2
KI;O2þSO2
·SNO2
KNO2þSNO2
·SNO2
SNO3þSNO2
·XNOB
Aerobic endogenous respiration of XH – – 21 – – fxI bH·SO2
KHO2
þSO2
·XH
Anoxic endogenous respiration of XH on NO32 – – 21 – – fxI bH·h·
KI;O2
KI;O2þSO2
·SNO3
KNO3þSNO3
·SNO3
SNO3þSNO2
·XH
Anoxic endogenous respiration of XH on NO22 – – 21 – – fxI bH·h·
KI;O2
KI;O2þSO2
·SNO2
KNO2þSNO2
·SNO2
SNO3þSNO2
·XH
22
08
R.
Gan
igu
eetal. |
Mo
dellin
gSB
Rn
itrifica
tion
of
lan
dfill
leach
ate
Wate
rS
cien
ce&
Te
chn
olo
gy—
WS
T|
61
.9|
20
10

Table A.2 | Stoichiometric parameters
Symbol Definition Value Units Reference
YAOB Yield of ammonia oxidation 0.15 gCOD(gN)21 Wiesmann (1994)
YNOB Yield of nitrite oxidation 0.041 mgCOD(gN)21 Wiesmann (1994)
YH Yield of aerobic organic matter oxidation 0.67 gCOD(gCOD)21 Henze et al. (2000); ASM1
YH,NO2Yield of denitrification via nitrite 0.53 gCOD(gCOD)21 adapted from Muller et al. (2003)
YH,NO3Yield of denitrification via nitrate 0.53 gCOD(gCOD)21 Muller et al. (2003)
iNBM Nitrogen content of the biomass 0.070 gN (gCOD)21 Henze et al. (2000); ASM3
iPBM Phosphorus content of the biomass 0.021 gP (gCOD)21 Volcke (2006)
iCBM Carbon content of the biomass 0.36 gC (gCOD)21 Volcke (2006)
iNXS Nitrogen content of XS 0.04 gN (gCOD)21 Henze et al. (2000); ASM3
iPXS Phosphorus content of XS 0.0089 gP (gCOD)21 Volcke (2006)
iCXS Carbon content of XS 0.3 gC (gCOD)21 Volcke (2006)
iNSS Nitrogen content of SS 0.03 gN (gCOD)21 Henze et al. (2000); ASM3
iPSS Phosphorus content of SS 0.0089 gC (gCOD)21 Volcke (2006)
iCSS Carbon content of SS 0.3 gC (gCOD)21 Volcke (2006)
fxI Production of XI in endogenous respiration 0.08 gCOD (gCOD)21 Henze et al. (2000); ASM1
iNXI Nitrogen fraction in XI 0.02 gN (gCOD)21 Henze et al. (2000); ASM3
iPXI Phosphorus fraction in XI 0.00064 gP (gCOD)21 Volcke (2006)
iCXI Carbon fraction in XI 0.36 gC (gCOD)21 Volcke (2006)
2209 R. Ganigue et al. | Modelling SBR nitrification of landfill leachate Water Science & Technology—WST | 61.9 | 2010

Table A.4 | Temperature correction factors
Symbol Characterization Value (8C21)
u AOB Theta value for AOB 0.086
u NOB Theta value for NOB 0.056
uH Theta value for heterotrophic organisms 0.104
Table A.3 | Kinetic parameters
Symbol Characterization Value (T 5 358C) Units Reference
mmaxAOB Maximum growth rate AOB 2.1 d21 Lochtman (1995)
b AOB Aerobic endogenous respiration rate for AOB 0.1944 d21 Wiesmann (1994)
KNH3
AOB Ammonia substrate saturation for AOB 0.75 gNm23 Van Hulle et al. (2007)
KO2
AOB Oxygen substrate saturation for AOB 0.3 gNm23 Wiesmann (1994)
KI,NH3
AOB Free ammonia inhibition constant for AOB 605.48 gNm23 Ganigue et al. (2007)
KI,HNO2
AOB Nitrous acid inhibition constant for AOB 0.49 gNm23 Ganigue et al. (2007)
KHCO32 Inorganic carbon substrate saturation 0.01 gCm23 Ganigue et al. (2007)
KpH Saturation constant for pH 8.21 – Van Hulle et al. (2007)
pHopt Optimum pH 7.23 – Van Hulle et al. (2007)
mmaxNOB Maximum growth rate NOB 1.05 d21 Lochtman (1995)
b NOB Aerobic endogenous respiration rate for NOB 0.0795 d21 Wiesmann (1994)
KHNO2
NOB Nitrite substrate saturation for NOB 3.2 £ 1025 gNm23 Wiesmann (1994)
KO2
NOB Oxygen substrate saturation for NOB 1.1 gO2m23 Wiesmann (1994)
KI,HNO2
NOB Nitrous acid inhibition constant for NOB 0.26 gNm23 Wiesmann (1994)
KI,NH3NOB Free ammonia inhibition constant for NOB 14.8 gNm23 Magrı et al. (2007)
mmaxH Maximum growth rate for heterotrophic biomass 16.97 d21 Henze et al. (2000); ASM1
bH Aerobic endogenous respiration rate for heterotrophic
biomass
3.18 d21 Henze et al. (2000); ASM1
KO2
H Oxygen saturation for heterotrophic biomass 0.2 gO2m23 Henze et al. (2000); ASM1
KSS Substrate saturation for heterotrophic biomass 20 gCODm23 Henze et al. (2000); ASM1
KNO2
dNO2 Nitrite substrate saturation for nitrite denitrifiers 0.119 gNm23 Wiesmann (1994)
KNO3
dNO3 Nitrate substrate saturation for nitrate denitrifiers 0.14 gNm23 Wiesmann (1994)
KNO2Saturation constant of SNO2 for endogenous respiration 0.5 gNm23 Henze et al. (2000); ASM1
KNO3Saturation constant of SNO3 for endogenous respiration 0.5 gNm23 Henze et al. (2000); ASM1
KI,O2Oxygen inhibition constant for denitrifiers 0.20 gO2m
23 Henze et al. (2000); ASM1
h Anoxic reduction factor 0.6 – Henze et al. (2000); ASM3
KH Maximum specific hydrolysis rate 15.59 gCOD(gCODd)21 Henze et al. (2000); ASM1
KX Saturation constant for slowly biodegradable substrate 0.1559 gCODgCOD21 Henze et al. (2000); ASM1
2210 R. Ganigue et al. | Modelling SBR nitrification of landfill leachate Water Science & Technology—WST | 61.9 | 2010