Seasonal variation in nitrification and nitrate-reduction pathways in coastal sediments in the Gulf...
11
AQUATIC MICROBIAL ECOLOGY Aquat Microb Ecol Vol. 63: 171–181, 2011 doi: 10.3354/ame01492 Published online April 15 INTRODUCTION Anthropogenic eutrophication of the Baltic Sea is of great concern. Of the Baltic Sea sub-basins, the Gulf of Finland is the most eutrophicated and has been suffer- ing from severe cyanobacterial blooms caused by excessive nutrient loading (Pitkänen & Tamminen 1995). Nitrogen loading in particular is difficult to con- trol, and the total nitrogen (TN) load per area in the Gulf of Finland is the highest in the entire Baltic Sea (HELCOM 2009). Nitrogen is removed from aquatic systems by microbially mediated anaerobic ammo- nium oxidation (anammox) and denitrification pro- cesses that convert the available forms of fixed nitro- gen to dinitrogen gas (N 2 ). Coastal sediments are important sites for denitrification and often control the degree of eutrophication by acting as natural nitrogen- removal filters (Voss et al. 2005, Seitzinger et al. 2006). In previous measurements it was estimated that ben- thic denitrification in the Gulf of Finland is an impor- tant sink for fixed nitrogen (Tuominen et al. 1998, Hietanen & Kuparinen 2008), but the controlling fac- tors for denitrification have remained poorly under- stood. Before fixed nitrogen can be removed by deni- trification or anammox, it must be converted to nitrite (NO 2 – ) or nitrate (NO 3 – ) by the nitrification process. In nitrification, ammonium (NH 4 + ) is oxidized to NO 2 – by ammonia-oxidizing bacteria (AOB), or by the recently discovered ammonia-oxidizing archaea (AOA; Kön- neke et al. 2005), and thereafter to NO 3 – by nitrite- © Inter-Research 2011 · www.int-res.com *Email: [email protected] Seasonal variation in nitrification and nitrate- reduction pathways in coastal sediments in the Gulf of Finland, Baltic Sea Helena Jäntti 1, 2, *, Florian Stange 3, 4 , Elina Leskinen 1 , Susanna Hietanen 1, 2 1 Department of Environmental Sciences, Division of Aquatic Sciences, 00014 University of Helsinki, Finland 2 Tvärminne Zoological Station, University of Helsinki, 10900 Hanko, Finland 3 Helmholtz Centre for Environmental Research – UFZ, Department Soil Physics, 06120 Halle/Saale, Germany 4 Present address: Federal Institute for Geosciences and Natural Resources, 30655 Hannover, Germany ABSTRACT: The Baltic Sea is one of the most eutrophic marine areas in the world. The role of nitro- gen as a eutrophicating nutrient in the Baltic Sea has remained controversial owing to a lack of understanding of nitrogen cycling in the area. We investigated the seasonal variation in sediment nitrification, denitrification, anaerobic ammonium oxidation (anammox), and dissimilatory nitrate reduction to ammonium (DNRA) at 2 coastal sites in the Gulf of Finland. In addition to the estimation of in situ rates, we assessed the potential for nitrification and denitrification in different seasons. The nitrification and nitrogen removal processes were maximal during the warm summer months, when the sediment organic content was highest. In colder seasons, the rates of nitrification and nitrate reduction measured under in situ conditions decreased, but the potential for nitrification remained equal to, or higher than, that during the warm months. The rates of denitrification and nitrification were usually higher in the accumulation basin, where the organic content of the sediment was higher, but the transportation area, despite lower denitrification rates and potential, typically had a higher potential for nitrification than the accumulation basin. Anammox and DNRA were not impor- tant nitrate sinks in any of the seasons sampled. The results also show that the rates of denitrification in the coastal Gulf of Finland sediment have decreased, and that benthic denitrification might be a less important sink for fixed nitrogen than previously assumed. KEY WORDS: Sediment · Nitrification · Denitrification · Anammox · DNRA · Baltic Sea · Gulf of Finland Resale or republication not permitted without written consent of the publisher OPEN PEN ACCESS CCESS
Transcript of Seasonal variation in nitrification and nitrate-reduction pathways in coastal sediments in the Gulf...

AQUATIC MICROBIAL ECOLOGYAquat Microb Ecol
Vol. 63: 171–181, 2011doi: 10.3354/ame01492
Published online April 15
INTRODUCTION
Anthropogenic eutrophication of the Baltic Sea is ofgreat concern. Of the Baltic Sea sub-basins, the Gulf ofFinland is the most eutrophicated and has been suffer-ing from severe cyanobacterial blooms caused byexcessive nutrient loading (Pitkänen & Tamminen1995). Nitrogen loading in particular is difficult to con-trol, and the total nitrogen (TN) load per area in theGulf of Finland is the highest in the entire Baltic Sea(HELCOM 2009). Nitrogen is removed from aquaticsystems by microbially mediated anaerobic ammo-nium oxidation (anammox) and denitrification pro -cesses that convert the available forms of fixed nitro-gen to dinitrogen gas (N2). Coastal sediments are
important sites for denitrification and often control thedegree of eutrophication by acting as natural nitrogen-removal filters (Voss et al. 2005, Seitzinger et al. 2006).In previous measurements it was estimated that ben-thic denitrification in the Gulf of Finland is an impor-tant sink for fixed nitrogen (Tuominen et al. 1998,Hietanen & Kuparinen 2008), but the controlling fac-tors for denitrification have remained poorly under-stood. Before fixed nitrogen can be removed by deni-trification or anammox, it must be converted to nitrite(NO2
–) or nitrate (NO3–) by the nitrification process. In
nitrification, ammonium (NH4+) is oxidized to NO2
– byammonia-oxidizing bacteria (AOB), or by the recentlydiscovered ammonia-oxidizing archaea (AOA; Kön-neke et al. 2005), and thereafter to NO3
– by nitrite-
© Inter-Research 2011 · www.int-res.com*Email: [email protected]
Seasonal variation in nitrification and nitrate-reduction pathways in coastal sediments in the
Gulf of Finland, Baltic Sea
Helena Jäntti1, 2,*, Florian Stange3, 4, Elina Leskinen1, Susanna Hietanen1, 2
1Department of Environmental Sciences, Division of Aquatic Sciences, 00014 University of Helsinki, Finland2Tvärminne Zoological Station, University of Helsinki, 10900 Hanko, Finland
3Helmholtz Centre for Environmental Research – UFZ, Department Soil Physics, 06120 Halle/Saale, Germany
4Present address: Federal Institute for Geosciences and Natural Resources, 30655 Hannover, Germany
ABSTRACT: The Baltic Sea is one of the most eutrophic marine areas in the world. The role of nitro-gen as a eutrophicating nutrient in the Baltic Sea has remained controversial owing to a lack ofunderstanding of nitrogen cycling in the area. We investigated the seasonal variation in sedimentnitrification, denitrification, anaerobic ammonium oxidation (anammox), and dissimilatory nitratereduction to ammonium (DNRA) at 2 coastal sites in the Gulf of Finland. In addition to the estimationof in situ rates, we assessed the potential for nitrification and denitrification in different seasons. Thenitrification and nitrogen removal processes were maximal during the warm summer months, whenthe sediment organic content was highest. In colder seasons, the rates of nitrification and nitratereduction measured under in situ conditions decreased, but the potential for nitrification remainedequal to, or higher than, that during the warm months. The rates of denitrification and nitrificationwere usually higher in the accumulation basin, where the organic content of the sediment washigher, but the transportation area, despite lower denitrification rates and potential, typically had ahigher potential for nitrification than the accumulation basin. Anammox and DNRA were not impor-tant nitrate sinks in any of the seasons sampled. The results also show that the rates of denitrificationin the coastal Gulf of Finland sediment have decreased, and that benthic denitrification might be aless important sink for fixed nitrogen than previously assumed.
KEY WORDS: Sediment · Nitrification · Denitrification · Anammox · DNRA · Baltic Sea · Gulf of Finland
Resale or republication not permitted without written consent of the publisher
OPENPEN ACCESSCCESS

Aquat Microb Ecol 63: 171–181, 2011
oxidizing bacteria (NOB). Nitrification is often one ofthe most important factors controlling the rates ofnitrogen removal.
Sediments are important sites for nitrogen cycling be-cause the sharp gradient of O2 in the sediment allowsoxic nitrification and anoxic denitrification and anam-mox to operate in close proximity (Jenkins & Kemp1984, Jensen et al. 1993, 1994). Anoxic conditions,which commonly prevail at the sediment surface in theGulf of Finland (HELCOM 2009), decrease nitrogen re-moval by closing down the coupled nitrification–deni-trification pathway, which is the most important path-way for nitrogen removal (Tuominen et al. 1998,Hietanen & Kuparinen 2008). When the sulfide oxida-tion rates and/or organic loading are high, and the con-centrations of O2 and NO3
– are low, dissimilatory nitratereduction to ammonium (DNRA) can become an impor-tant pathway for nitrate reduction (Tiedje et al. 1982,Rysgaard et al. 1996, Christensen et al. 2000, Burgin &Hamilton 2007). In terms of eutrophication, DNRA is aharmful process because it maintains nitrogen in abioavailable form. Karlsson et al. (2005) studied lami-nated Baltic Sea sediment and observed NO3
–-con-sumption in the sediment that could not be explainedby denitrification, suggesting that DNRA could be animportant nitrate-reduction pathway enhancing the vicious cycle of eutrophication in the Baltic Sea.
To expand our understanding of nitrogen cycling inthe Gulf of Finland, we investigated the seasonal vari-ability in nitrification, nitrification potentials, and theNO3
–-reduction pathways in the coastal Gulf of Finlandaccumulation basin and shallow transportation area.
MATERIALS AND METHODS
Study area. Two coastal stations in the north- western Gulf of Finland, Storfjärden (59° 51.31’ N,23° 18.81’ E) and Muncken (59° 51.14’ N, 23° 14.70’ E),were sampled for sediment nitrification and nitrate-reduction pathways in September 2007 (only Storfjär-den), April, August, and November 2008, and April,
August, and December 2009. Storfjärden represents atypical outer archipelago accumulation basin (Niemi1975) in which the sediment is soft mud. It is 33 m indepth and is typically thermally stratified from June toSeptember. The highest temperatures in the bottomwater are measured in late autumn, when the thermalstratification breaks, and lowest in early spring, afterthe break-up of ice. Muncken is located ~1 km fromStorfjärden and is closer to the river outflow from PojoBay. It is a shallow (11 m) transportation area wherethe sediment is soft mud mixed with a small proportionof fine-grained sand. The highest sedimentation ratesin the area occur in May after the spring bloom, when~80% of the sedimenting carbon reaches the bottom(Tallberg & Heiskanen 1998).
Sampling and incubation. The temperature andsalinity were recorded using a CTD probe (SIS CTDplus 100). The sediment was collected in acrylic cores,using a Gemini (∅ 80 mm, height 80 cm) or Gemax(∅ 90 mm, height 80 cm) twin corer with sediment andwater in each core. The concentrations of O2, NO3
– andNH4
+ in the bottom water were measured by with-drawing a water sample from ~5 cm above the sedi-ment surface in a core. The sediment’s organic content(as a loss on ignition, LOI, in %) and porosity weredetermined from the topmost 1 cm of the sediment.Each large core was sub-sampled into 3 or 4 smalleracrylic plastic cores (∅ 26 mm, height 20 cm), so thatthere was ~5 cm of sediment and 13 cm of water ineach sub-sample. The remaining volume in the corewas filled by caps, leaving no air in the cores. The sub-samples were transported in cooler boxes to the shorewithin 2 h for further treatments.
The intact sediment cores for measuring denitrifica-tion, anammox and DNRA were enriched with potas-sium nitrate (K15NO3
–, 99% 15N) to final concentrationsof 40, 80, 120 and 160 μM 15NO3
– in the overlying water(n = 4 per concentration; Table 1).
The intact sediment cores for measuring nitrifi cationwere enriched with ammonium chloride (15NH4Cl,99% 15N) to final concentrations of 100 μM, 200 and300 μM 15NH4
+ (n = 4 per concen tration; Table 1).
172
Processes measured Dw, Dn, anammox Nw, 15N2 DNRA
Method IPT, r-IPT 15NH4+ oxidation 15NO3
– reduction to 15NH4+
Substrate tracer added 15NO3– 15NH4
+ 15NO3–
Products measured 29N2 & 30N215NO3
–, 29N2 & 30N215NH4
+
Analysis methods IRMS SPINMAS, IRMS NH3 diffusion combined with IRMS
Table 1. Experimental set-up. Dw = denitrification based on NO3– from the overlying water; Dn = denitrification coupled to nitri -
fication; anammox = anaerobic ammonium oxidation; Nw = nitrification producing NO3– to the water column; 15N2 = potential cou-
pled nitrification–denitrification; DNRA = dissimilatory nitrate reduction to ammonium; IPT = isotope-pairing technique; r-IPT =revised isotope-pairing technique; IRMS = isotope ratio mass spectrometry; SPINMAS = an automated sample preparation unit
for inorganic nitrogen species coupled to a quadrupole mass spectrometer

Jäntti et al.: Nitrogen cycling in the sediment
All cores were incubated for 4 h at the in situ temper-ature with mixing provided by magnetic stirring barsin the caps. After incubation, the sediment was mixedwith the overlying water and the cores were sub-merged in ice-cold water and allowed to settle for~3 min. A water sample (12 ml) for isotopic analysis ofN2 was withdrawn from the top of the core into a gas-tight glass vial (Exetainer, Labco Scientific) containing0.5 ml zinc chloride (ZnCl2) (100% w/v). The N2 sam-ples from September 2007 were analyzed at Iso-Ana-lytical Laboratories in Crewe, Cheshire, UK, and thesamples from 2008 and 2009 were analyzed at theNational Environmental Research Institute (NERI),University of Aarhus, Silkeborg, Denmark. Theremainder of the core content was centrifuged (237 × g,10 min) and the supernatant was filtered (pre-washed0.2 μm syringe filter, Acrodisc) and frozen immediatelyat –20°C for 15NH4
+ analysis (DNRA samples) and15NO3
– analysis (nitrification samples). If mussels(Macoma balthica) or mussel shells were present(observed on average in 1 or 2 cores per sampling), thecores were marked and discarded from the calcula-tions if the rates deviated substantially from those ofthe other cores. However, this had to be done veryrarely. DNRA and 15NO3
– production were not mea-sured in April 2009 (Muncken only) or December 2009(both stations).
15NH4+ analysis. 15NH4
+ analysis from the September2007 samples was done in NERI, using a combinedmicrodiffusion–hypobromite oxidation method (Ris-gaard-Petersen et al. 1995). For the remaining sam-ples, the 15NH4
+ analysis was modified from the 15NO3–
analysis presented in Sigman et al. (1997) by excludingthe dissolved organic nitrogen (DON) and NH4
+
removals, and the conversion of NO3– to NH4
+. Theconcentration of NH4
+ in the samples was determinedusing the method of Solorzano (1969) to ensure an opti-mal amount of NH4
+ (1 to 7 μmol N) for the extraction.The samples were then placed in 100 ml bottles; salin-ity was adjusted to 30 with sodium chloride (NaCl), 1 gof magnesium oxide (MgO) was added to each 100 mlof sample, and the pH was set at 11 with 10% sodiumhydroxide (NaOH). The NH4
+ was extracted in diffu-sion packets (~90% NH4
+ recovery) that were con-structed by packing an acidified (30 μl 4 N phosphoricacid (H3PO4)) fiberglass filter (Whatman, GF/D, ∅ 5mm), between membrane filters (Millipore LCWP02500). After increasing the pH, and the addition of thediffusion pack, the bottles were immediately closedand sealed with Parafilm® and polytetrafluoroethylene(PTFE)-coated screw caps. The bottles were incubatedupside down for 14 d at room temperature on a shakertable (150 rpm). Thereafter, the diffusion packets wereremoved from the bottles, rinsed with 10% hydrochlo-ric acid (HCl) and MilliQ-water, and placed on a desic-
cator to dry. After 2 d of drying, the packets were dis-assembled and the fiberglass filters were packed intosilver foil cups (Elemental Microanalyses). The isotopicratio of the extracted nitrogen was analyzed in Iso-Analytical Laboratories.
15NO3– analysis. The 15NO3
– analysis was done byusing the SPINMAS (an automated sample prepara-tion unit for inorganic nitrogen species coupled to aquadrupole mass spectrometer) method. The protocolfollowed Stange et al. (2007), and the measurementswere done in 2 replicates at the Helmholtz Centre forEnvironmental Research in Halle/Saale, Germany.Approximately 1 ml of sample was mixed in a reactionvial (22 ml, capped with a 2 mm septum) with 3 ml ofacidic vanadium chloride (V[III]Cl3) solution (15.7 gVCl3 and 160 ml 32% HCl in 1000 ml) at 85°C for 1 minto form nitric oxide (NO). The NO produced was trans-ported with helium as a carrier gas (10 ml min–1) to theinlet capillary (open split) of a quadrupole mass spec-trometer (GAM 400, InProcess Instruments), in whichthe 15N abundance of the NO was analyzed. H2Oand CO2 were removed prior to the 15N analysis with acryotrap (–120°C).
Calculations and statistical analyses. Becauseprocesses were measured by adding excess substrate,the process rates had to be extrapolated for in situ con-ditions, and represent estimates of process rates underin situ conditions. The total sediment nitrification rateincludes the nitrification providing NO3
– to the watercolumn (Nw; 15NH4
+ oxidation samples) and the nitrifi-cation coupled to denitrification (Dn; isotope-pairingtechnique [IPT], see below). Dn was used as an esti-mate of coupled nitrification–denitrification instead of15N2 (29N2 + 2 × 30N2) production from the 15NH4
+ oxida-tion samples because the IPT was less prone to biasescaused by substrate limitation. Nw was calculated byplotting the 15NO3
– production from 15NH4+ oxidation
samples against the total NH4+ concentration and
extrapolating linearly the NO3– production to the ambi-
ent NH4+ level. If no linear significant correlation was
found, Nw was the average of 15NO3– productions. The
denitrification rate was calculated using the IPT(Nielsen 1992). The total nitrate-reduction rates werecalculated by combining denitrification based on NO3
–
from nitrification (Dn; IPT), denitrification based onNO3
– in the sediment-overlying water (Dw; IPT), andthe DNRA rate (Dong et al. 2009). The traditional IPT isnot a reliable denitrification measurement technique ifanammox is present. Anammox produces 29N2 by com-bining the added 15NO3
– and ambient 14NH4+. This vio-
lates the binomial distribution of 28N2, 29N2 and 30N2
productions, which is the fundamental assumption ofIPT. When anammox was detected (November 2008and December 2009), denitrification and anammoxwere calculated according to the revised IPT (r-IPT;
173

Aquat Microb Ecol 63: 171–181, 2011
Risgaard-Petersen et al. 2003, 2004). The results of theIPT data are also unreliable when denitrification is notnitrate-limited (Nielsen 1992, Steingruber et al. 2001).On these occasions (Muncken, April 2008 and 2009;Storfjärden, April 2009) denitrification coupled to nitri-fication was calculated from nitrification samples, inwhich we assumed that the NO3
– produced by nitrifica-tion diffused at similar 15/14N ratios to the bottom waterand to the denitrification layer so that coupled nitrifica-tion–denitrification could be expressed as:
(1)
where r is the 15/14N ratio of the NO3– effluxing from the
sediment (Jäntti et al. unpubl.). By using this method,the assessment of Dw is not possible, and consequentlyDw data are not available when this method wasapplied. The nitrification potential was assessed fromthe nitrification samples by combining the productionof 15NO3
– and 15N2 at the given 15NH4+ concentration,
assuming that the added 15NH4+ was the only substrate
for nitrification. This assumption was made becausethe concentration of 15NH4
+ added was at least 20-foldhigher than the ambient NH4
+ concentration in thewater. Statistical analyses were done with the SPSSstatistical package. Correlations between the environ-mental variables and the process rates were done byusing the non-parametric Spearman correlation coeffi-cient (rS) analysis and were defined as significant whenp < 0.05.
RESULTS
The physical and chemical environmental character-istics in the bottom water followed a seasonal cycle atboth stations. High temperatures in August co-occurred with maximum NH4
+ concentration andLOI% as well as the year’s lowest O2 and NO3
– concen-trations. When the temperatures began to decrease,the LOI% and NH4
+ concentrations decreased andboth NO3
– and O2 concentrations increased. With theexception of December 2009, the LOI% was alwayshigher at Storfjärden than at Muncken (Table 2). Twoexceptional environmental variations occurred duringthe sampling period: the period January–April 2008was unusually warm and no ice cover formed in theGulf of Finland, and in December 2009, an upwellingevent on the day before sampling increased the bottomwater salinity from 6.4 to 7.0, and decreased the temperature of the bottom water from 7.0 to 6.3°C atStorfjärden.
In spring, nitrification and denitrification typicallyshowed low rates that nearly doubled in late summerand again decreased during the winter (Figs. 1 & 2). Anexception to this pattern was observed in Storfjärden
in April 2009 when the highest nitrification rate of theentire sampling period was observed (689.1 μmol Nm–2 d–1; Fig. 1). Although 15NO3
– was not measured inApril 2009 (Muncken only) or December 2009 (bothstations), assessment of Nw was possible from the totalNO3
– fluxes because, in April 2009, NO3– was effluxing
in Muncken from all 15NH4+ concentrations indicating
Coupled nitrification denitrification = d–Nr
174
Temp Salinity O2 NH4+ NO3
– LOI(°C) (mg l–1) (μM) (μM) (%)
StorfjärdenSept 07 8.9 6.3 5.3 4.5 2.8 22.0Apr 08 2.4 5.4 13.2 2.5 2.6 17.7Aug 08 16.2 5.9 6.5 6.2 1.0 21.0Nov 08 6.4 6.5 13.6 0.3 5.3 10.8Apr 09 0.8 5.3 12.5 0.1 6.9 13.2Aug 09 5.7 6.6 5.7 1.8 3.5 31.6Dec 09 6.3 7.0 9.3 1.4 4.0 8.6
MunckenApr 08 2.7 5.3 13.1 0 1.1 7.5Aug 08 16.6 5.9 7.2 4.9 0.7 9.3Nov 08 6.3 6.5 11.6 0.2 5.4 7.6Apr 09 1.7 5.2 13.6 0.2 4.0 5.2Aug 09 14.3 5.8 8.5 1.4 2.2 7.8Dec 09 4.6 5.5 11.5 0.1 4.3 8.6
Table 2. Physical and chemical characteristics in the bottomwater and sediment surface
Fig. 1. Total nitrification rates and SE, comprising nitrificationcoupled to denitrification (Dn; isotope-pairing technique) andnitrification producing NO3
– to the water column (Nw; 15NH4+
oxidation). NA = data not available

Jäntti et al.: Nitrogen cycling in the sediment
nitrification of the added 15NH4+. In December 2009,
NO3– was influxing to the sediment in all 15NH4
+ con-centrations indicating that all NO3
– produced by nitrifi-cation was consumed by NO3
– reduction. Conse-quently no 15NO3
– efflux was assumed (Figs. 1 & 3).The denitrification rates were typically higher at Stor-fjärden than at Muncken, and denitrification was, withthe exception of August 2009 in Storfjärden, tightlycoupled with nitrification, nitrification providing morethan 95% of the NO3
– for the process (Fig. 2). Anam-mox was detected in November 2008 at both samplingstations, and in December 2009 at Storfjärden. InNovember 2008, anammox totalled 18% (Storfjärden)and 26% (Muncken) of the N2 production and inDecember 2009 27% of the N2 production. At the timeswhen anammox was detected, the total N2 productionwas low, and consequently the anammox rates werelow (Fig. 2). DNRA was always detected when mea-sured and, with the exception of April 2008 inMuncken, comprised 5 to 20% of the total NO3
– reduc-tion (Fig. 2). Although the DNRA comprised nearly halfof the total NO3
– reduction in April 2008 in Muncken,the overall nitrate-reduction rates were low, hence theDNRA rates were not high.
Production of 15N2 from 15NH4+ oxidation samples
was typically equal to, or higher than, the Dn valuesmeasured from the denitrification samples. In April2008 and December 2009 at Storfjärden, and inNovember 2008 and August 2009 in Muncken, the 15N2
production from 15NH4+ oxidation samples increased
significantly linearly with 15NH4+ availability, indicat-
ing NH4+ limitation of the first step of the coupled nitri-
fication–denitrification pathway. A similar trend wasalso observed in both April samplings in Muncken, butthe increase was not significantly linear (Fig. 3). Theonly sampling time when Dn measured with the IPTwas significantly higher than the 15N2 production from15NH4
+ oxidation samples was August 2008 at both sta-tions (Fig. 3). At that time the 15N labeling of the NH4
+
pool in the nitrification layer was probably not com-plete owing to high NH4
+ availability in the sediment,as indicated by the relatively high NH4
+ concentrationin bottom water and the LOI% value compared to othervalues observed in the area (Table 2). As a conse-quence, the 15NH4
+ added was not the only substratefor nitrification, which reduced the 15NO3
– and subse-quent 15N2 production from 15NH4
+ oxidation samples.Nw occurred more commonly in Muncken than in Stor-fjärden, and when Nw occurred in Storfjärden, the pro-duction of 15NO3
– did not increase with increasing15NH4
+ availability, whereas at Muncken, the produc-tion of 15NO3
– increased linearly with 15NH4+ availabil-
ity in April 2008, November 2008 and April 2009. InAugust 2009, the increase was almost significantly lin-ear (p = 0.058; Fig. 3).
In Storfjärden, there was a significant positive corre-lation between total denitrification and LOI% (rS =0.893), bottom water NH4
+ concentration and total de -nitrification (rS = 0.786), and temperature and Dn (rS =0.829) — indicating that denitrification was stimulatedwhen the sediment organic content and water temper-atures increased. In Muncken, neither LOI% nor tem-perature correlated with denitrification. There was anegative correlation in Storfjärden between anammoxand denitrification (rS = –0.757) and anammox andLOI% (rS = –0.757), suggesting that anammox wasinhibited when denitrification rates and sedimentorganic content were high. Also, a significant negativecorrelation (rS = –0.829) was found between O2 con-centration and DNRA rates in Storfjärden.
DISCUSSION
The highest nitrification potentials always occurredin April and late autumn (Fig. 3) when the primary pro-duction rates are lower than in August. This is in linewith several previous studies that report high nitrifica-tion rates during low primary production (Focht & Ver-straete 1977, Kemp et al. 1990, Caffrey et al. 2007). Theclearest reasons for the high nitrification potential arelow sedimentation rates causing low decompositionand subsequent low O2 consumption rates, which inturn increase O2 availability for nitrification. However,
175
Fig. 2. NO3–-reduction pathways comprising coupled nitrifica-
tion–denitrification (Dn), denitrification based on NO3– in the
bottom water (Dw), dissimilatory nitrate reduction to ammonia(DNRA), and anammox. NA = data not available. DNRA dataare not available for April 2009 in Muncken, and for Decem-ber 2009 at both stations, and Dw is not available for April
2008 in Muncken and for April 2009 at both stations
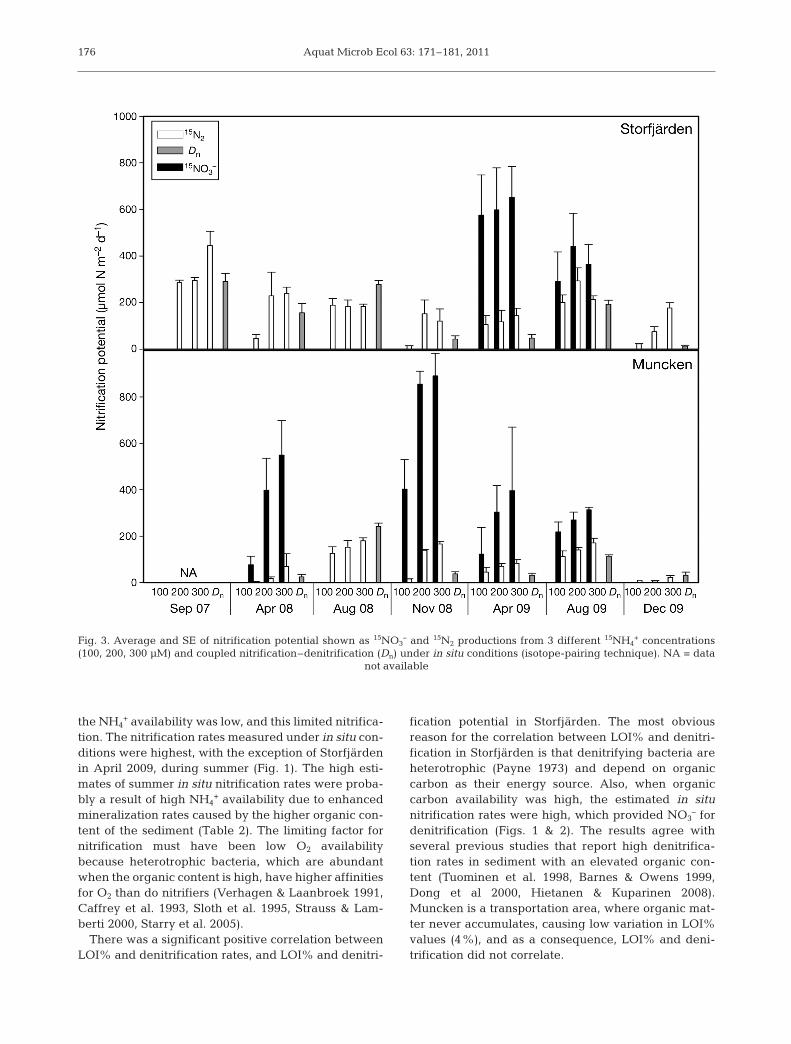
the NH4+ availability was low, and this limited nitrifica-
tion. The nitrification rates measured under in situ con-ditions were highest, with the exception of Storfjärdenin April 2009, during summer (Fig. 1). The high esti-mates of summer in situ nitrification rates were proba-bly a result of high NH4
+ availability due to enhancedmineralization rates caused by the higher organic con-tent of the sediment (Table 2). The limiting factor fornitrification must have been low O2 availabilitybecause heterotrophic bacteria, which are abundantwhen the organic content is high, have higher affinitiesfor O2 than do nitrifiers (Verhagen & Laanbroek 1991,Caffrey et al. 1993, Sloth et al. 1995, Strauss & Lam-berti 2000, Starry et al. 2005).
There was a significant positive correlation betweenLOI% and denitrification rates, and LOI% and denitri-
fication potential in Storfjärden. The most obviousreason for the correlation between LOI% and denitri-fication in Storfjärden is that denitrifying bacteria areheterotrophic (Payne 1973) and depend on organiccarbon as their energy source. Also, when organiccarbon availability was high, the estimated in situnitrification rates were high, which provided NO3
– fordenitrification (Figs. 1 & 2). The results agree withseveral previous studies that report high denitrifica-tion rates in sediment with an elevated organic con-tent (Tuominen et al. 1998, Barnes & Owens 1999,Dong et al 2000, Hietanen & Kuparinen 2008).Muncken is a transportation area, where organic mat-ter never accumulates, causing low variation in LOI%values (4%), and as a consequence, LOI% and deni-trification did not correlate.
Aquat Microb Ecol 63: 171–181, 2011176
Fig. 3. Average and SE of nitrification potential shown as 15NO3– and 15N2 productions from 3 different 15NH4
+ concentrations(100, 200, 300 μM) and coupled nitrification–denitrification (Dn) under in situ conditions (isotope-pairing technique). NA = data
not available

Jäntti et al.: Nitrogen cycling in the sediment
Denitrification was more frequently limited by theavailability of NO3
– in Storjärden than was the case inMuncken. When 15NO3
– was produced in the nitrifica-tion samples at Storfjärden, it was, with the exceptionof April and August 2009, immediately taken up bydenitrification and, as a result, no 15NO3
– diffused intothe water column (Fig. 3). At Muncken, denitrificationwas more saturated by the availability of NO3
–; thiswas indicated by the fact that 15NO3
– from the nitrifica-tion samples diffused frequently into the bottom waterrather than being reduced by denitrification (Fig. 3).Instead of NO3
– limitation, denitrification was probablylimited by carbon availability, because less carbon wasavailable in Muncken than in Storfjärden (Table 2).
The nitrification potentials at Storfjärden werehigher in 2009 than in 2008 (Fig. 3). One factor causinginterannual variation in the nitrogen processes was alack of ice cover in the winter of 2008 due to an excep-tionally warm winter; this possibly caused the earlierdevelopment and sedimentation of a spring bloom, in-creasing the organic content of the sediment and possi-bly favoring heterotrophic bacteria over nitrifying bac-teria in April 2008. In December 2009, the day beforesampling, Storfjärden experienced a minor upwellingevent which may have influenced nitrification. Suddenincreases in salinity can cause an efflux of NH4
+ fromthe sediment — due to ion pairing of NH4
+ with salt-water anions, and the blocking of ion-exchange sitesby seawater cations (Gardner et al. 1991, Seitzinger etal. 1991) — which would increase the availability ofNH4
+ to nitrifiers and stimulate nitrification.There are no data available for direct comparison of
nitrification rates in the Baltic Sea sediments and, over-all, we found only a few nitrification measurementsmade with intact sediment cores quantifying both nitri-fication producing NO3
– to the water column and nitri-fication coupled to denitrification. Of the studies thatwere, to some extent, comparable in terms of measure-ment technique, the nitrification rates measured at theDanish coasts were at least 10-fold higher (Henriksenet al. 1981, Sloth et al. 1992), and at the Island of Sylt,Germany (Jensen et al. 1996) and a Danish lake (Rys-gaard et al. 1993) ~2-fold higher than those measuredhere (Fig. 1). At Chesapeake Bay (USA), the rates werenearly 20-fold higher in spring, but decreased to zeroduring the summer months (Jenkins & Kemp 1984). Allin all, the nitrification rates in the coastal Gulf of Fin-land were low, compared with rates measured in moresoutherly locations.
Although the nitrification rates and nitrification po-tentials, particularly at Storfjärden, were higher in 2009(Figs. 1 & 3), the denitrification rates at both stationswere slightly lower in 2009 than in 2008 (Fig. 2). Theexplanation for the lower rates in 2009 might be lowerwater temperature. The lack of ice cover in 2008 al-
lowed earlier penetration of light to the surface water,and a faster warm-up of the water, stimulating all bio-logical processes very early in the spring of that year.Also, in August 2009, the water column in Storfjärdenhad not yet mixed by the sampling time (unlike the sit-uation in 2008), causing an almost 10ºC difference inthe bottom water temperatures (Table 2); this may havedecreased the denitrification rates. This is also sup-ported by the significant positive correlation betweentemperature and denitrification. Compared to the ratesmeasured in Storfjärden in the period 2003 to 2004 (Hi-etanen & Kuparinen 2008), denitrification was almost50% lower. However, because the previous data hadnot been gathered using r-IPT in all seasons, they aredirectly comparable only for spring and summer rates.Still, even assuming that anammox would have con-tributed 10% to the N2 production during those seasonswhen r-IPT was not applied, the denitrification rateshad decreased (Hietanen & Kuparinen 2008). We foundno apparent reason for the decreased rates from thelong-term monitoring data (2002 to 2009; O2, tempera-ture, salinity, chlorophyll a) of the area, but we discov-ered a high abundance of the in vasive polychaeteworm Marenzelleria spp. (Bick & Burckhardt 2008) inthe samples at all times. Marenzelleria spp. are recentinvaders in the Gulf of Finland and were not present insuch high numbers in the period 2003 to 2004, com-pared with the present study. These animals do nothave a major impact on denitrification (Hietanen etal. 2007) but they tolerate low-oxygen conditions(Schiedek 1997, Hahlbeck et al.2000), and the increasein their abundance might be an indication that the sam-pling area has recently experienced hypoxia to an ex-tent greater than that seen in the period 2003 to 2004.
In general, the rates of denitrification in the coastalGulf of Finland are low compared to more southerlylocations. For example, the rates were 20-fold lowerthan in the Colne estuary, UK (Dong et al 2000, 2009),and approximately 100-fold lower than in the RowleyRiver estuary, USA (Tobias et al. 2003), Humber estu-ary, UK (Barnes & Owens 1999) and Thames estuary,UK (Trimmer et al. 2000). However, in most of thesesites the NO3
– concentrations were substantiallyhigher, which may explain the large difference in therates. When compared to sites in the same latitude, ourrates were lower than the denitrification rates mea-sured in the open Gulf of Finland sediments (Tuomi-nen et al. 1998) and in the Archipelago Sea (Silven-noinen et al. 2007), but higher than in the eastern Gulfof Finland (Gran & Pitkänen 1999) and in the Gulf ofBothnia (Stockenberg & Johnstone 1997).
Anammox was previously reported in the samplingarea in May and August 2003 (Hietanen & Kuparinen2008). In the present study, we tested for anammox atall sampling times, and it was detected only in late
177

autumn when the total N2 production rates and theanammox rates were very low. Anammox rates nega-tively correlated with LOI% and denitrification, hencethe appearance of anammox may have been due to adecrease in the availability of organic carbon neededfor denitrification, when anammox did not have tocompete for NO3
– with denitrifying bacteria (Tham-drup & Dalsgaard 2002, Dalsgaard et al. 2005,Engström et al. 2005). The presence of anammox canalso be explained by low water temperatures becauseanammox appears to be favored in colder environ-ments (Rysgaard et al. 2004, Trimmer et al. 2005).Overall, the present study confirms the previousresults by Hietanen & Kuparinen (2008) that anammoxhas a minor role as a nitrogen-removing process in thecoastal Gulf of Finland.
Direct measurements of coupled nitrification– DNRAare impossible with stable isotope-based methodsbecause the substrate and the end product of thepathway are the same. DNRA is typically measuredby adding 15NO3
– and monitoring the production of15NH4
+, as was also done in the present study. How-ever, due to the addition of 15NO3
–, the substrateavailability for DNRA increased and the 15NH4
+ pro-duction is only a measure of DNRA potential. Scalingthe DNRA rate to the ambient NO3
– levels is chal-lenging. The actual 15/14N ratio of the NO3
– consumedby DNRA is difficult to estimate because the 15Nlabel of the NO3
– pool is constantly diluted by 14NO3–
produced by nitrification. In the calculations pre-sented by Christensen et al. (2000), the 15/14N ratio ofthe NO3
– consumed was proposed to be similar to the15/14N ratio of the N2 produced by denitrification,because DNRA and denitrification occur at the sameanoxic sediment depth right below the oxic layer. Toestimate DNRA rates accurately with this technique,the 15NH4
+ production should increase in parallelwith the 15N content of the N2 produced by denitrifi-cation, which was not the case in the present study.Alternatively, Dong et al. (2009) proposed that the15/14N ratio of the NO3
– consumed is simply the ratioof the ambient 14NO3
– and the added 15NO3–, and the
isotopes are consumed by DNRA in the same ratio asthey are available in the water phase. Because theDNRA was not nitrate-limited, and the IPT calcula-tion formulas could not be applied in all seasons dueto lack of NO3
– limitation in denitrification, we usedthe calculation scheme of Dong et al. (2009). TheDNRA rates measured were comparable to those in 2lowland lakes (Nizzoli et al. 2010) and a wetland(Scott et al. 2008), but were at least 10-fold lower incomparison to marine sediments (Jørgensen 1989,Rysgaard et al. 1996). High rates of DNRA have beenreported from sediments that have high concentra-tions of sulfide and/or a high organic content, caus-
ing a low redox potential (Burgin & Hamilton 2007),and a negative correlation between O2 concentrationand DNRA rates was also found in the present study.The low rates of DNRA measured in this study wereprobably a result of a permanently oxidized top layerof sediment, creating an environment with low con-centrations of sulfide and a high redox potential atthe sediment layer where NO3
– is available.The results shown here emphasize the limited
capacity of the coastal Gulf of Finland sediments topurify the nitrogen load from the land. It has beenestimated that the total nitrogen load from thedrainage basin to the sampling area is 40 to 50 tonnesof nitrogen in each month (Malve et al. 2000). Byassuming that the denitrification rates in the entireriver outflow area (22.5 km2) are equal to denitrifica-tion rates measured in Muncken, denitrificationremoves ~2% of the nitrogen load. If the denitrifica-tion rates in the river outflow area are approximatelythe same as those in Storfjärden, denitrificationremoves 2.8% of the nitrogen load. Depositionalareas, similar to Storfjärden, have been estimated tocover only 25 to 35% of the Gulf of Finland (H.Kankaanpää & H. Vallius pers. comm.); hence the for-mer estimate might be more accurate. If the rates areexpanded to the entire Gulf of Finland (29 600 km2) —assuming the 25% areal coverage of the depositionalareas and 75% coverage of transportation areas —denitrification and anammox removed ~16 kt N yr–1,which is substantially less than the 39 to 45 kt esti-mates of Tuominen et al. (1998) and Hietanen &Kuparinen (2008). Moreover, the 16 kt N yr–1 is proba-bly an overestimate because, in the period 2008 to2009, the Gulf of Finland had vast anoxic areas. Thebottom-water O2 conditions in the Gulf of Finland arehighly regulated by salt water inflows from the BalticSea main basins that strengthen the stagnation of thewater column, which, in turn, prevents mixing of thewater column. In the period 2008 to 2009 the watercolumn stagnation was strong, which may alsoexplain the decreased denitrification rates.
It is noteworthy that when the loading from land ishighest, during spring, the natural capacity of the sed-iments to purify the nitrogen load is at its lowest. Theincreasing winter rains predicted for the northernBaltic Sea, due to climate change (HELCOM 2007),can increase the annual nitrogen load substantially.High nitrogen loading, particularly during winter, cre-ates more intense spring blooms, which, in turn, canincrease the area of anoxic seafloor because most ofthe sedimenting material in the Gulf of Finland origi-nates from the spring bloom (Tallberg & Heiskanen1998, Conley et al. 2009). Therefore, the control ofnitrogen loading from the entire drainage basin isessential in the battle against eutrophication.
Aquat Microb Ecol 63: 171–181, 2011178

CONCLUSION
Nitrification and denitrification in the coastal Gulf ofFinland follows a seasonal pattern, with the highestrates occurring during late summer and low rates dur-ing late fall and spring. When the denitrification rateswere at their highest, denitrification was limited by thenitrification rate but the NH4
+ availability did not limitnitrification. In the accumulation basin, nitrificationwas occasionally limited by NH4
+ availability, and thenitrification potentials were typically lower than in thetransportation area. When nitrification was stimulatedby adding excess NH4
+ to the bottom water, denitrifica-tion generally reduced all of the NO3
– that was pro-duced to N2. In the transportation area, nitrificationwas frequently limited by NH4
+ availability, and whennitrification was stimulated by adding NH4
+, the NO3–
produced could not be utilized by denitrification, caus-ing NO3
– to efflux to the bottom water. The magnitudesof the alternative NO3
– reduction pathways, anammoxand DNRA, in the area were small. The rates of DNRAremained low in all seasons, and anammox appearedonly in late autumn when the nitrate-reduction ratesaltogether were low. The denitrification rates in theGulf of Finland have decreased from the values mea-sured in the early 2000s; this suggests that sedimentdenitrification might be a less important sink for fixednitrogen than was previously assumed. It is also note-worthy that the natural capacity of the coastal sedi-ments to mitigate the nitrogen load was at its lowestduring spring, when the flux of nitrogen from thedrainage basin is highest.
Acknowledgements. We thank A. Vetterli, H. Holmroos andJ. Horppila at the Department of Environmental Sciences,University of Helsinki, Finland, for helpful comments duringthe writing process, and K. Kähkönen at the Department ofEnvironmental Sciences (Lahti Campus), University ofHelsinki, Finland for help during the sample collection. Weacknowledge grants from the Onni Talas Foundation, Acad-emy of Finland (116477), BONUS+ project Assessment andModelling of Baltic Ecosystem Response (AMBER) and Maa-ja vesitekniikan tuki ry.
LITERATURE CITED
Barnes J, Owens NJP (1999) Denitrification and nitrous oxideconcentrations in the Humber estuary, UK, and adjacentcoastal zones. Mar Pollut Bull 37:247–260
Bick A, Burckhardt R (2008) Erstnachweis von Marenzelleriaviridis (Polychaeta, Spionidae) für den Ostseeraum, miteinem Bestimmungsschlüssel der Spioniden der Ostsee.Mitt Zool Mus Berl 65:237–247
Burgin AJ, Hamilton SK (2007) Have we overemphasizedthe role of denitrification in aquatic ecosystems? A re -view of nitrate removal pathways. Front Ecol Environ 5:89–96
Caffrey J, Sloth N, Kaspar H, Balckburn T (1993) Effect oforganic loading on nitrification and denitrification inmarine sediment microcosm. FEMS Microbiol Ecol 12:159–167
Caffrey J, Bano N, Kalanetra K, Hollibaugh J (2007) Ammoniaoxidation and ammonia-oxidizing bacteria and archaeafrom estuaries with different histories of hypoxia. ISME J1:660–662
Christensen PB, Rysgaard S, Sloth NP, Dalsgaard T,Schwærter S (2000) Sediment mineralization, nutrientfluxes, denitrification and dissimilatory nitrate reductionto ammonium in an estuarine fjord with sea cage troutfarms. Aquat Microb Ecol 21:73–84
Conley DJ, Paerl HW, Howarth RW, Boesch DF and others(2009) Controlling eutrophication: nitrogen and phospho-rus. Science 323:1014–1015
Dalsgaard T, Thamdrup B, Canfield DE (2005) Anaerobicammonium oxidation (anammox) in the marine environ-ment. Res Microbiol 156:457–464
Dong LF, Thornton DCO, Nedwell DB, Underwood GJC(2000) Denitrification in sediments of the River Colne estuary, England. Mar Ecol Prog Ser 203:109–122
Dong LF, Smith CJ, Papaspyrou S, Stott A, Osborn AM, DavidB, Nedwell DB (2009) Changes in benthic denitrification,nitrate ammonification, and anammox process rates andnitrate and nitrite reductase gene abundances along anestuarine nutrient gradient (the Colne estuary, UnitedKingdom). Appl Environ Microbiol 75:3171–3179
Engström P, Dalsgaard T, Hulth S, Aller RC (2005) Anaerobicammonium oxidation by nitrite (anammox): implicationsfor N2 production in coastal marine sediments. GeochimCosmochim Acta 69:2057–2065
Focht DD, Verstraete W (1977) Biochemical ecology of nitrifi-cation and denitrification. Adv Microb Ecol 1:135–214
Gardner WS, Seitzinger SP, Malczyk JM (1991) The effects ofsea salts on the forms of nitrogen released from estuarineand freshwater sediments: Does ion pairing affect ammo-nium flux? Estuar Coast 14:157–166
Gran V, Pitkänen H (1999) Denitrification in estuarine sedi-ments in the eastern Gulf of Finland, Baltic Sea. Hydro -biologia 393:107–115
Hahlbeck E, Arndt C, Schiedek D (2000) Sulphide detoxifica-tion in Hediste diversicolor and Marenzelleria viridis, twodominant polychaete worms within the shallow coastalwaters of the southern Baltic Sea. Comp Biochem PhysiolPart B Biochem Mol Biol 125:457–471
HELCOM (Helsinki Commission) (2007) Climate change inthe Baltic Sea area. Baltic Sea Environment ProceedingsNo. 111
HELCOM (Helsinki Commission) (2009) Eutrophication in theBaltic Sea: an integrated thematic assessment of theeffects of nutrient enrichment in the Baltic Sea region.Baltic Sea Environment Proceedings No. 115
Henriksen K, Hansen IJ, Blackburn TH (1981) Rates of nitrifi-cation, distribution of nitrifying bacteria, and nitrate fluxesin different types of sediment from Danish waters. MarBiol 61:299–304
Hietanen S, Kuparinen J (2008) Seasonal and short-term vari-ation in denitrification and anammox at coastal station inthe Gulf of Finland, Baltic Sea. Hydrobiologia 596:67–77
Hietanen S, Lainen AO, Lukkari K (2007) The complex effectsof the invasive polychaetes Marenzelleria spp. on benthicnutrient dynamics. J Exp Mar Biol Ecol 352:89–102
Jenkins M, Kemp W (1984) The coupling of nitrification anddenitrification in two estuarine sediments. LimnolOceanogr 29:609–619
Jensen K, Revsbech N, Nielsen N (1993) Microscale distribu-
Jäntti et al.: Nitrogen cycling in the sediment 179

Aquat Microb Ecol 63: 171–181, 2011
tion of nitrification activity in sediment determined with ashielded microsensor for nitrate. Appl Environ Microbiol59:3287–3296
Jensen K, Sloth N, Risgaard-Petersen N, Rysgaard S, Revs-bech N (1994) Estimation of nitrification and denitrifica-tion from microprofiles of oxygen and nitrate in modelsediment systems. Appl Environ Microbiol 60:2094–2100
Jensen KM, Jensen MH, Kristensen E (1996) Nitrification anddenitrification in Wadden Sea sediments (Königshafen,Island of Sylt, Germany) as measured by nitrogen isotopepairing and isotope dilution. Aquat Microb Ecol 11:181–191
Jørgensen KS (1989) Annual pattern of denitrification andnitrate ammonification in estuarine sediment. Appl Envi-ron Microbiol 55:1841–1847
Karlsson K, Hulth S, Ringdahl K, Rosenberg R (2005) Experi-mental recolonisation of Baltic Sea reduced sediments:survival of benthic macrofauna and effects on nutrientcycling. Mar Ecol Prog Ser 294:35–49
Kemp W, Sampou P, Caffrey J, Mayer M, Henriksen K, Boyn-ton W (1990) Ammonium recycling versus denitrificationin Chesapeake Bay sediments. Limnol Oceanogr 35:1545–1563
Könneke M, Bernhart AE, de la Torre JR, Walker CB, Water-bury JB, Stahl DA (2005) Isolation of an autotrophic ammo-nia-oxidizing marine archaeon. Nature 437: 543–546
Malve O, Virtanen M, Villa L, Karonen M and others (2000)Pohjanpitäjänlahden syvänteessä vuosina 1995 ja 1996toteutettu hapetuskokeilu. (Oxidation experiment in deepwaters of Pojo Bay in 1995–1996.) Suomen ympäristoSeries No 377.
Nielsen LP (1992) Denitrification in sediment determinedfrom nitrogen isotope pairing. FEMS Microbiol Ecol 86:357–362
Niemi Å (1975) Ecology of phytoplankton in the Tvärminnearea SW coast of Finland. II. Primary production and envi-ronmental conditions in the archipelago zone and seazone. Acta Bot Fenn 105:1–73
Nizzoli D, Carraro E, Nigro V, Viaroli P (2010) Effect oforganic enrichment and thermal regime on denitrificationand dissimilatory nitrate reduction to ammonium (DNRA)in hypolimnetic sediments of two lowland lakes. WaterRes 44:2715–2724
Payne WJ (1973) Reduction of nitrogenous oxides by micro -organisms. Bacteriol Rev 37:409–452
Pitkänen H, Tamminen T (1995) Nitrogen and phosphorusas production limiting factors in the estuarine waters ofthe eastern Gulf of Finland. Mar Ecol Prog Ser 129:283–294
Risgaard-Petersen N, Rysgaard S, Revsbech NP (1995) Com-bined microdiffusion-hypobromite oxidation method fordetermining nitrogen-15 isotope in ammonium. Soil SciSoc Am J 59:1077–1080
Risgaard-Petersen N, Nielsen LP, Rysgaard S, Dalsgaard T,Meyer RL (2003) Application of the isotope pairing tech-nique in sediments where anammox and denitrificationcoexist. Limnol Oceanogr Methods 1:63–73
Risgaard-Petersen N, Nielsen LP, Rysgaard S, Dalsgaard T,Meyer RL (2004) Erratum: Application of the isotope pair-ing technique in sediments where anammox and denitrifi-cation coexist. Limnol Oceanogr Methods 2:315
Rysgaard S, Risgaard-Petersen N, Nielsen LP, Revsbech NP(1993) Nitrification and denitrification in lake and estuar-ine sediments measured by the 15N dilution technique andisotope pairing. Appl Environ Microbiol 59:2093–2098
Rysgaard S, Risgaard-Petersen N, Sloth NP (1996) Nitri -fication, denitrification, and nitrate ammonification in
sediments of two coastal lagoons in Southern France.Hydrobiologia 329:133–141
Rysgaard S, Glud RN, Risgaard-Petersen N, Dalsgaard T(2004) Denitrification and anammox activity in Arcticmarine sediments. Limnol Oceanogr 49:1493–1502
Schiedek D (1997) Marenzelleria cf. viridis (Polychaeta: Spi-onidae) — ecophysiological adaptions to a life in thecoastal waters of the Baltic Sea. Aquat Ecol 31:199–210
Scott J, McCarthy M, Gardner W, Doyle R (2008) Denitrifica-tion, dissimilatory nitrate reduction to ammonium, andnitrogen fixation along a nitrate concentration gradient ina created freshwater wetland. Biogeochemistry 87: 99–111
Seitzinger SP, Gardner WS, Spratt AK (1991) The effect ofsalinity on ammonium sorption in aquatic sediments:Implications for benthic nutrient recycling. EstuariesCoasts 14:167–174
Seitzinger S, Harrison JA, Böhlke JK, Bouwman AF and oth-ers (2006) Denitrification across landscapes and water-scapes: a synthesis. Ecol Soc Am 16:2064–2090
Sigman DM, Altabet MA, Michener R, McCorcle DC, Fry B,Holmes RM (1997) Natural abundance-level measurementof nitrogen isotopic composition of oceanic nitrate: anadaptation of the ammonia diffusion method. Mar Chem57:227–242
Silvennoinen H, Hietanen S, Liikanen A, Stange CF, RussowR, Kuparinen J, Martikainen PJ (2007) Denitrification inthe river estuaries of the Northern Baltic Sea. Ambio 36:134–140
Sloth NP, Nielsen LP, Blackburn TH (1992) Nitrification insediment cores measured with acetylene inhibition. Limnol Oceanogr 37:1108–1112
Sloth NP, Blackburn H, Hansen LS, Risgaard-Petersen N,Lomstein BA (1995) Nitrogen cycling in sediments withdifferent organic loading. Mar Ecol Prog Ser 116:163–170
Solorzano L (1969) Determination of ammonia in naturalwater by the phenolhypochlorite method. LimnolOceanogr 14:799–801
Stange CF, Spott O, Apelt B, Russow RWB (2007) Automatedrapid online determination of 15N abundance and concen-tration of ammonium, nitrite, or nitrate in aqueous samplesby the SPINMAS technique. Isotopes Environ Health Stud43:227–236
Starry O, Valett M, Schreiber M (2005) Nitrification rates inheadwater stream: influences of seasonal variation in Cand N supply. J N Am Benthol Soc 24:753–761
Steingruber SM, Friedrich J, Gächter R, Wehrli B (2001) Mea-surement of denitrification in sediments with the 15N iso-tope pairing technique. Appl Environ Microbiol 67:3771–3778
Stockenberg A, Johnstone RW (1997) Benthic denitrificationin the Gulf of Bothnia. Estuar Coast Shelf Sci 45:835–843
Strauss E, Lamberti G (2000) Regulation of nitrification inaquatic sediments by organic carbon. Limnol Oceanogr45:1854–1859
Tallberg P, Heiskanen A (1998) Species-specific phytoplank-ton sedimentation in relation to primary production alongan inshore-offshore gradient in the Baltic Sea. J PlanktonRes 20:2053–2070
Thamdrup B, Dalsgaard T (2002) Production of N2 throughanaerobic ammonium oxidation coupled to nitrate reduc-tion in marine sediments. Appl Environ Microbiol 68:1312–1318
Tiedje JM, Sexstone AJ, Myrold DD, Robinson JA (1982) Den-itrification: ecological niches, competition and survival.Antonie van Leeuwenhoek 48:569–583
Tobias C, Giblin A, McClelland J, Tucker J, Peterson B (2003)Sediment DIN fluxes and preferential recycling of benthic
180

Jäntti et al.: Nitrogen cycling in the sediment
microalgal nitrogen in a shallow macrotidal estuary. MarEcol Prog Ser 257:25–36
Trimmer M, Nedwell DB, Sivyer DB, Malcolm SJ (2000) Sea-sonal benthic organic matter mineralisation measured byoxygen uptake and denitrification along a transect of theinner and outer River Thames estuary, UK. Mar Ecol ProgSer 197:103–119
Trimmer M, Nicholls JC, Morley N, Davies CA, Aldridge J(2005) Biphasic behavior of anammox regulated by nitriteand nitrate in an estuarine sediment. Appl Environ Micro-biol 71:1923–1930
Tuominen L, Heinnen A, Kuparinen J, Nielsen N (1998) Spatialand temporal variability of denitrification in the sediments ofnorthern Baltic Proper. Mar Ecol Prog Ser 172: 13–24
Verhagen FJM, Laanbroek HJ (1991) Competition for ammo-nium between nitrifying and heterotrophic bacteria indual energy-limited chemostats. Appl Environ Microbiol57:3255–3263
Voss M, Emeis K-C, Hille S, Neumann T, Dippner JW (2005)Nitrogen cycle of the Baltic Sea from an isotopic perspec-tive. Global Biogeochem Cycles 19:GB 3001 doi:10.1029/2004GB 002338
181
Editorial responsibility: Patricia Glibert,Cambridge, Maryland, USA
Submitted: May 12, 2010; Accepted: January 10, 2011 Proofs received from author(s): April 5, 2011