Rapid climate change from north Andean Lake Fúquene pollen records driven by obliquity:...
17
Rapid climate change from north Andean Lake Fúquene pollen records driven by obliquity: implications for a basin-wide biostratigraphic zonation for the last 284 ka R.G. Bogotá-A a, b, * , M.H.M. Groot a , H. Hooghiemstra a, ** , L.J. Lourens c , M. Van der Linden a , J.C. Berrio a, d a Institute for Biodiversity and Ecosystem Dynamics (IBED), Dept. of Paleoecology and Landscape-ecology, Faculty of Science, University of Amsterdam, Science Park 904, 1098 XH Amsterdam, The Netherlands b Facultad del Medio Ambiente y Recursos Naturales, Universidad Distrital Francisco José de Caldas, Bogotá D.C., Colombia c Geosciences, University of Utrecht, The Netherlands d Department of Geography, University of Leicester, UK article info Article history: Received 22 April 2011 Received in revised form 3 August 2011 Accepted 3 August 2011 Available online 6 September 2011 Keywords: Fúquene basin Pollen records Frequency analysis Late Pleistocene DansgaardeOeschger cycles Rapid climate change Lake level change Biostratigraphic zonation abstract This paper compares a new super-high resolution pollen record from a central location in Lake Fúquene (4 N) with 3 pollen records from marginal sites from the same lake basin, located at 2540 m elevation in the Eastern Cordillera of Colombia. We harmonized the pollen sum of all records, and provided previously published records of climate change with an improved age model using a new approach for long continental pollen records. We dissociated from subjective curve matching and applied a more objective procedure including radiocarbon ages, cyclostratigraphy, and orbital tuning using the new 284 ka long Fúquene Basin Composite record (Fq-BC) as the backbone (Groot et al., 2011). We showed that a common w9 m cycle in the arboreal pollen percentage (AP%) records reflects obliquity forcing and drives vegetational and climatic change. The AP% records were tuned to the 41 kyr component filtered from standard benthic d 18 O LR04 record. Changes in sediment supply to the lake are reflected in concert by the four records making frequency analysis in the depth domain an adequate method to compare records from the same basin. We calibrated the original 14 C ages and used where necessary biostrati- graphic correlation, i.e. for records shorter than one obliquity cycle. Pollen records from the periphery of the lake showed changes in the abundance of Alnus and Weinmannia forests more clearly while centrally located record Fq-9C shows a more integrated signal of regional vegetation change. The revised age models show that core Fq-2 reflects the last 44 ka and composite record Fq-7C the last 85.5 ka. Marginally located core Fq-3 has an age of 133 ka at 32 m core depth and the lowermost 11 m of sediments appear of older but unknown age. The longest record Fq-BC shows w60 yr resolution over the period of 284-27 ka. All pollen records are in support of a common regional vegetation development leading to a robust reconstruction of long series of submillennial climate oscillations reflecting DansgaardeOeschger (DO) cycles. Reconstructed climate variability in the tropical Andes since marine isotope stage (MIS) 8 compares well with NGRIP (d 18 O based), Epica Dome C (dD based) and the Mediterranean sea surface temperature record MD01-2443/44 (U K` 37 based) underpinning the global significance of the climate record from this tropical Andean lake. A basin-wide biostratigraphy is presented and we concluded although with varying robustness that each core is representative of regional vegetational and climatic change. Ó 2011 Elsevier Ltd. All rights reserved. 1. Introduction In many lakes and mires environmental reconstructions are based on one core, due to the time consuming character of pollen analysis (Dumayne-Peaty and Barber, 1998). It is thereby often assumed that sedimentation patterns across a lake are close to homogeneous (Moore and Webb, 1978; Fritz et al., 2006). This assumption may be valid for relatively small lakes which lack * Corresponding author. Facultad del Medio Ambiente y Recursos Naturales, Universidad Distrital Francisco José de Caldas, Bogotá D.C., Colombia. Tel.: þ57 313 8062326. ** Corresponding author. Institute for Biodiversity and Ecosystem Dynamics (IBED), Dept. of Paleoecology and Landscape-ecology, University of Amsterdam, Science Park 904, 1098 XH Amsterdam, The Netherlands.Tel.: þ31 205257857. E-mail addresses: [email protected] (R.G. Bogotá-A), H.Hooghiemstra@ uva.nl (H. Hooghiemstra). Contents lists available at SciVerse ScienceDirect Quaternary Science Reviews journal homepage: www.elsevier.com/locate/quascirev 0277-3791/$ e see front matter Ó 2011 Elsevier Ltd. All rights reserved. doi:10.1016/j.quascirev.2011.08.003 Quaternary Science Reviews 30 (2011) 3321e3337
-
Upload
independent -
Category
Documents
-
view
2 -
download
0
Transcript of Rapid climate change from north Andean Lake Fúquene pollen records driven by obliquity:...
at SciVerse ScienceDirect
Quaternary Science Reviews 30 (2011) 3321e3337
Contents lists available
Quaternary Science Reviews
journal homepage: www.elsevier .com/locate/quascirev
Rapid climate change from north Andean Lake Fúquene pollen records drivenby obliquity: implications for a basin-wide biostratigraphic zonationfor the last 284 ka
R.G. Bogotá-A a,b,*, M.H.M. Groot a, H. Hooghiemstra a,**, L.J. Lourens c, M. Van der Linden a, J.C. Berrio a,d
a Institute for Biodiversity and Ecosystem Dynamics (IBED), Dept. of Paleoecology and Landscape-ecology, Faculty of Science, University of Amsterdam, Science Park 904,1098 XH Amsterdam, The Netherlandsb Facultad del Medio Ambiente y Recursos Naturales, Universidad Distrital Francisco José de Caldas, Bogotá D.C., ColombiacGeosciences, University of Utrecht, The NetherlandsdDepartment of Geography, University of Leicester, UK
a r t i c l e i n f o
Article history:Received 22 April 2011Received in revised form3 August 2011Accepted 3 August 2011Available online 6 September 2011
Keywords:Fúquene basinPollen recordsFrequency analysisLate PleistoceneDansgaardeOeschger cyclesRapid climate changeLake level changeBiostratigraphic zonation
* Corresponding author. Facultad del Medio AmbUniversidad Distrital Francisco José de Caldas, Bogotá8062326.** Corresponding author. Institute for Biodiversit(IBED), Dept. of Paleoecology and Landscape-ecologScience Park 904, 1098 XH Amsterdam, The Netherla
E-mail addresses: [email protected] (R.G.uva.nl (H. Hooghiemstra).
0277-3791/$ e see front matter � 2011 Elsevier Ltd.doi:10.1016/j.quascirev.2011.08.003
a b s t r a c t
This paper compares a new super-high resolution pollen record from a central location in Lake Fúquene(4�N) with 3 pollen records from marginal sites from the same lake basin, located at 2540 m elevation inthe Eastern Cordillera of Colombia. We harmonized the pollen sum of all records, and providedpreviously published records of climate change with an improved age model using a new approach forlong continental pollen records. We dissociated from subjective curve matching and applied a moreobjective procedure including radiocarbon ages, cyclostratigraphy, and orbital tuning using the new 284ka long Fúquene Basin Composite record (Fq-BC) as the backbone (Groot et al., 2011). We showed thata common w9 m cycle in the arboreal pollen percentage (AP%) records reflects obliquity forcing anddrives vegetational and climatic change. The AP% records were tuned to the 41 kyr component filteredfrom standard benthic d18O LR04 record. Changes in sediment supply to the lake are reflected in concertby the four records making frequency analysis in the depth domain an adequate method to comparerecords from the same basin. We calibrated the original 14C ages and used where necessary biostrati-graphic correlation, i.e. for records shorter than one obliquity cycle. Pollen records from the periphery ofthe lake showed changes in the abundance of Alnus and Weinmannia forests more clearly while centrallylocated record Fq-9C shows a more integrated signal of regional vegetation change.
The revised age models show that core Fq-2 reflects the last 44 ka and composite record Fq-7C the last85.5 ka. Marginally located core Fq-3 has an age of 133 ka at 32 m core depth and the lowermost 11 m ofsediments appear of older but unknown age. The longest record Fq-BC showsw60 yr resolution over theperiod of 284-27 ka. All pollen records are in support of a common regional vegetation developmentleading to a robust reconstruction of long series of submillennial climate oscillations reflectingDansgaardeOeschger (DO) cycles. Reconstructed climate variability in the tropical Andes since marineisotope stage (MIS) 8 compares well with NGRIP (d18O based), Epica Dome C (dD based) and theMediterranean sea surface temperature record MD01-2443/44 (UK`37 based) underpinning the globalsignificance of the climate record from this tropical Andean lake. A basin-wide biostratigraphy ispresented and we concluded although with varying robustness that each core is representative ofregional vegetational and climatic change.
� 2011 Elsevier Ltd. All rights reserved.
iente y Recursos Naturales,D.C., Colombia. Tel.: þ57 313
y and Ecosystem Dynamicsy, University of Amsterdam,nds.Tel.: þ31 205257857.Bogotá-A), H.Hooghiemstra@
All rights reserved.
1. Introduction
In many lakes and mires environmental reconstructions arebased on one core, due to the time consuming character of pollenanalysis (Dumayne-Peaty and Barber, 1998). It is thereby oftenassumed that sedimentation patterns across a lake are close tohomogeneous (Moore and Webb, 1978; Fritz et al., 2006). Thisassumption may be valid for relatively small lakes which lack
R.G. Bogotá-A et al. / Quaternary Science Reviews 30 (2011) 3321e33373322
signficant inflow and outflow, but such conditions are often notmet. Differences in sediment accumulation regimes may occurbetween pollen records (Turner et al., 1989; Whittington et al.,1991). Such variations may result from lake level fluctuations,causing specific species distribution patterns of pollen grains(Jacobson and Bradshaw, 1981; Chen, 1987; Dumayne-Peaty andBarber, 1998; Kangur, 2009). Palaeolimnological studies from largebasins have shown that variation between cores increases due tomarked morphometric characters of the basin, variations inwatershed geology and vegetation, and physical processes mixingand distributing chemical constituents differently (Fritz et al.,2006). Good examples are the 68,800 km2 large Lake Victoriawhere variation in diatom and geochemical proxies among threecores covering the past 17.5 ka were explained by influence ofdirection and strength of wind and variation in the lake size (Talbotand Laerdal, 2000). In the 8500 km2 large Lake Titicaca variabilitybetween three palaeolimnological records covering the last 13 kawas explained by climate change driven varying influence of thefluvial system. Fritz et al. (2006) also suggest that major and minorintercore variability is explained by varying accuracy of the chro-nological control and varying sampling resolution between cores.High similarity between multiple cores from the same basin is alsoreported. From Lake Titicaca (Cross et al., 2000; Tapia et al., 2003)and the 26,900 km2 large Lake Malawi (Johnson et al., 2002)limnological proxies from piston cores show high correspondencefor the last 30 and 25 ka, respectively. Examples of a high degree ofsimilarity between three pollen-based records of regional climatechange come from 0.55 km2 Lago Grande de Monticchio, reflectingthe period 15.7e11.3 ka (Huntley et al., 1999; Watts et al., 2000),and 31,500 km2 large Lake Baikal during the last 15.5 ka (Demskeet al., 2005).
Here, we elaborate onprevious palynological investigations fromLake Fúquene, a land slide-dammed lake at 2540 m elevation in thenorthern Andes (Sarmiento et al., 2008). Pollen records from thisregion are well known for their rich information about regionalvegetation change (Van der Hammen and González, 1960; Van derHammen, 1974; Van’t Veer and Hooghiemstra, 2000). In particular,past proportions of cool montane forest and páramo vegetation incombination with more specific information on the plant associa-tions and records of individual plant taxa with distinct ecologicalranges allow estimating the elevation of the upper forest line (UFL).Lake Fúquene is centrally located in the altitudinally 900mwide beltof cool Andean forest that stretches from w2300 mew3200 melevation. During Pleistocene times Lake Fúquene lies halfway thealtitudinal interval of w1500 m over which the UFL has migratedbetween full glacial stages and interglacial episodes (e.g. Van’t Veerand Hooghiemstra, 2000). The UFL was at w2000 m during thelast glacialmaximum (LGM) (Van derHammen,1974; Hooghiemstraand Van der Hammen, 1993) and at w3500 m during the Eemianthermal maximum (Hooghiemstra, 1984). Temperature changes areconsidered to be the most important driver of forest dynamics onshort (<millennial) and long (Milankovitch) time scales (e.g. Van derHammen and González, 1960; Hooghiemstra, 1984; Marchant et al.,2001; Van’t Veer and Hooghiemstra, 2000; Groot et al., 2011). Inaddition, climate modelling experiments showed that the meanannual temperature (MAT) changes in the high northern Andes areprimarily driven byglobal ice volume and atmospheric CO2 changes,although the modelled temperature changes still significantlyunderestimate the reconstructed variations, probably due to thecoarse resolution of the applied model, i.e., thereby excluding localfeedbackmechanisms and changes in lapse rates (Groot et al., 2011).
The upper 60 m of sediments in the deepest part of the present-day Lake Fúquene have a sediment accumulation rate ofw1 cm per60 years, allowing the analysis of high temporal resolution proxyrecords (Groot et al., 2011). Cores from the border of the lake are
generally thought to contain hiatusses during periods of low lakelevel stands (Sarmiento et al., 2008). The main objectives of thepresent paper are to assess the temporal and spatial differences andsimilarities between pollen records of several cores derived fromcentral tomarginal locations of the lake to test the robustness of thevegetation response to climate changewithin the basin, to asses therepresentativeness of each core to reflect regional climate change,and to develop a basin-wide biostratigraphic framework. Finally,we compare the pollen-based record of rapid climate change withselected marine and ice core records to place the record from LakeFúquene in a global perspective.
2. Materials and methods
2.1. Study area and pollen records
Lake Fúquene (5� 27’ N, 73� 460) is located at 2540 m altitude inthe Eastern Cordillera of Colombia (Fig. 1). Surrounding mountainsreach up to 3700 m altitude and consist of Cretaceous and Tertiaryrock (CAR, 2000; Montenegro-Paredes, 2004; Sarmiento et al.,2008). The surface of the Fúquene Basin covers 1750 km2 andextends between 5�350 N and 5�190 N, and between 73�540 W73�350 W (IGAC, 2003). The main inlet of the lake is the Ubaté Riverand water leaves the lake by the Suárez River (Fig. 1). The currentsurface of the lake is w25 km2 and water depth varies from 2 to6 m. Lacustrine sediments can be found in the basin up to 20 mabove the present-day lake level indicating that during late Pleis-tocene time the lake was not deeper than w25 m for a significantperiod of time. Owing to the flat basin floor, small changes in lakelevel result in large changes of the lake surface.
Due to its almost equatorial position, the precipitation regime atLake Fúquene strongly depends on the annual migration of theIntertropical Convergence Zone (ITCZ). Dry seasons occur fromDecember to January and from July to August, and alternate withtwo rainy seasons from February to June and from September toNovember. A rain shadow effect in the basin causes a variation inmean annual precipitation ranging from 770 mm in the south to1300 mm in the north (Donato-R et al., 1987). Monthly meantemperatures vary from 13 to 14 �C with the coldest monthoccurring during the dry season. In contrast to the small annualtemperature range, the daily temperature range is large and duringthe dry season night frost may occur at the elevation of the lake(IGAC, 2003).
The altitudinal vegetation distribution in the Eastern Cordilleraof Colombia has been studied by a.o. Cuatrecasas (1958), Van derHammen and González (1960), Van der Hammen (1974), Cleefand Hooghiemstra (1984), Van’t Veer and Hooghiemstra (2000),Wille et al. (2001), Hooghiemstra and Van der Hammen (2004)and Van der Hammen (2008). Many taxa share similar altitudinaland ecological ranges. Although pollen records show temporalchanges in abundance of main plant taxa and suggest plantcommunities of Andean forest and páramo vegetation are subject tochange main altitudinally organized vegetation zones can be rec-ognised throughout the records. The present-day UFL is atw3200 m and coincides with a MAT of 9.5 �C. The transition fromcool Andean forest to warmer subandean forest, presently atw2300 m, reflects the lowest occurence of night frost. Today, sub-páramo mostly extends altitudinally over w300 m (fromw3200e3500 m elevation), while the grass páramo extends overw700 m (at present-day from w3500e4200 m). Superpáramoextends from w4200e4800 m up to the glaciers. The altitudinalwidth of the subpáramo and grasspáramo is subject to change, mostpossibly depending on changes in climatic moisture and/or changesin the abundance of dwarf forest around theUFL (Hooghiemstra andVan der Hammen, 2004; Van der Hammen, 2008).
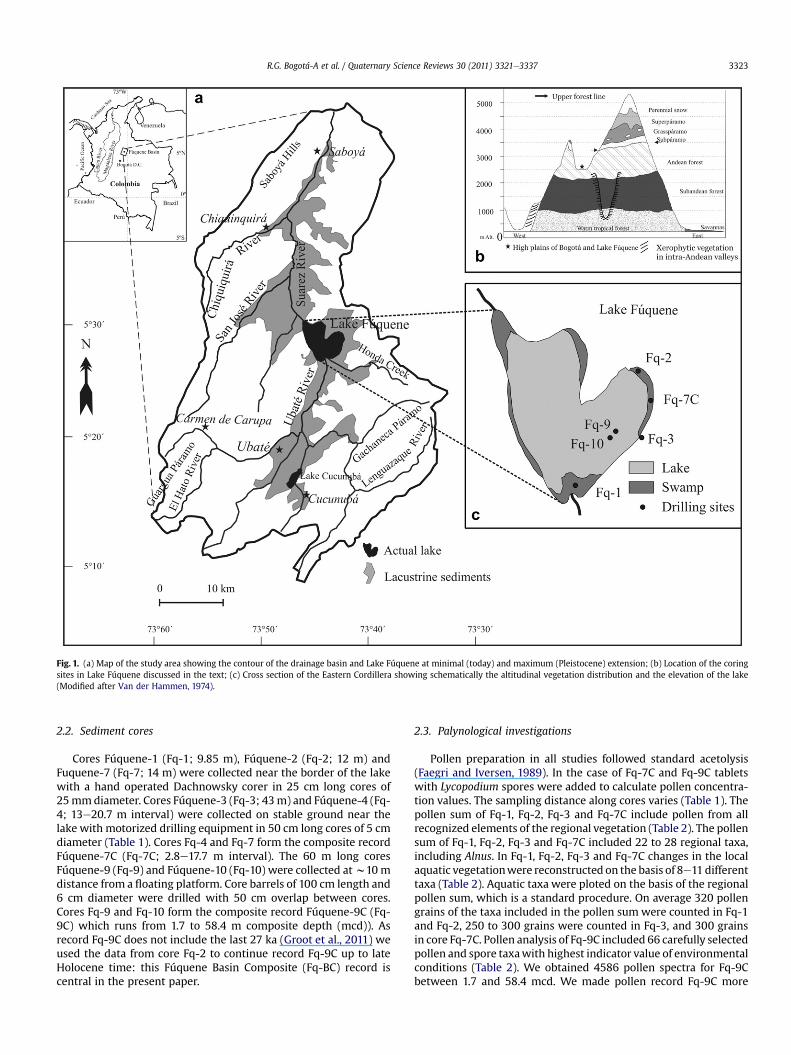
Fig. 1. (a) Map of the study area showing the contour of the drainage basin and Lake Fúquene at minimal (today) and maximum (Pleistocene) extension; (b) Location of the coringsites in Lake Fúquene discussed in the text; (c) Cross section of the Eastern Cordillera showing schematically the altitudinal vegetation distribution and the elevation of the lake(Modified after Van der Hammen, 1974).
R.G. Bogotá-A et al. / Quaternary Science Reviews 30 (2011) 3321e3337 3323
2.2. Sediment cores
Cores Fúquene-1 (Fq-1; 9.85 m), Fúquene-2 (Fq-2; 12 m) andFuquene-7 (Fq-7; 14 m) were collected near the border of the lakewith a hand operated Dachnowsky corer in 25 cm long cores of25mmdiameter. Cores Fúquene-3 (Fq-3; 43m) and Fúquene-4 (Fq-4; 13e20.7 m interval) were collected on stable ground near thelake with motorized drilling equipment in 50 cm long cores of 5 cmdiameter (Table 1). Cores Fq-4 and Fq-7 form the composite recordFúquene-7C (Fq-7C; 2.8e17.7 m interval). The 60 m long coresFúquene-9 (Fq-9) and Fúquene-10 (Fq-10) were collected atw10 mdistance from a floating platform. Core barrels of 100 cm length and6 cm diameter were drilled with 50 cm overlap between cores.Cores Fq-9 and Fq-10 form the composite record Fúquene-9C (Fq-9C) which runs from 1.7 to 58.4 m composite depth (mcd)). Asrecord Fq-9C does not include the last 27 ka (Groot et al., 2011) weused the data from core Fq-2 to continue record Fq-9C up to lateHolocene time: this Fúquene Basin Composite (Fq-BC) record iscentral in the present paper.
2.3. Palynological investigations
Pollen preparation in all studies followed standard acetolysis(Faegri and Iversen, 1989). In the case of Fq-7C and Fq-9C tabletswith Lycopodium spores were added to calculate pollen concentra-tion values. The sampling distance along cores varies (Table 1). Thepollen sum of Fq-1, Fq-2, Fq-3 and Fq-7C include pollen from allrecognized elements of the regional vegetation (Table 2). The pollensum of Fq-1, Fq-2, Fq-3 and Fq-7C included 22 to 28 regional taxa,including Alnus. In Fq-1, Fq-2, Fq-3 and Fq-7C changes in the localaquatic vegetationwere reconstructed on the basis of 8e11differenttaxa (Table 2). Aquatic taxa were ploted on the basis of the regionalpollen sum, which is a standard procedure. On average 320 pollengrains of the taxa included in the pollen sumwere counted in Fq-1and Fq-2, 250 to 300 grains were counted in Fq-3, and 300 grainsin core Fq-7C. Pollen analysis of Fq-9C included 66 carefully selectedpollen and spore taxawith highest indicator value of environmentalconditions (Table 2). We obtained 4586 pollen spectra for Fq-9Cbetween 1.7 and 58.4 mcd. We made pollen record Fq-9C more
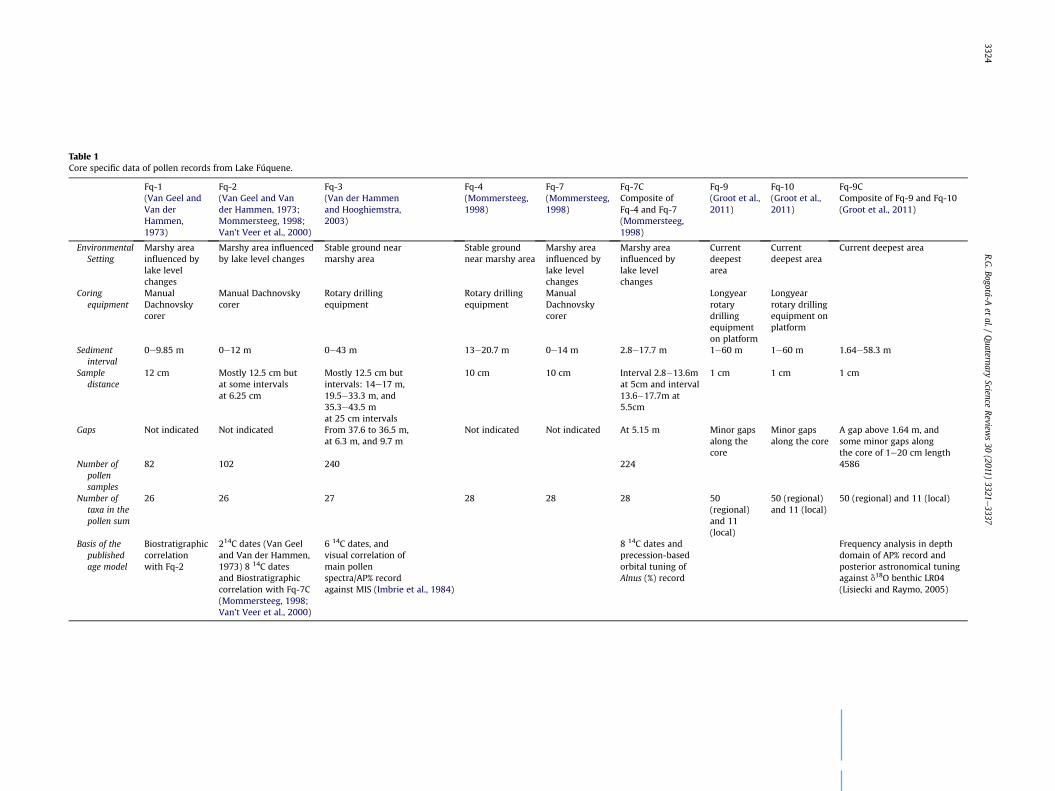
Table 1Core specific data of pollen records from Lake Fúquene.
Fq-1(Van Geel andVan derHammen,1973)
Fq-2(Van Geel and Vander Hammen, 1973;Mommersteeg, 1998;Van’t Veer et al., 2000)
Fq-3(Van der Hammenand Hooghiemstra,2003)
Fq-4(Mommersteeg,1998)
Fq-7(Mommersteeg,1998)
Fq-7CComposite ofFq-4 and Fq-7(Mommersteeg,1998)
Fq-9(Groot et al.,2011)
Fq-10(Groot et al.,2011)
Fq-9CComposite of Fq-9 and Fq-10(Groot et al., 2011)
EnvironmentalSetting
Marshy areainfluenced bylake levelchanges
Marshy area influencedby lake level changes
Stable ground nearmarshy area
Stable groundnear marshy area
Marshy areainfluenced bylake levelchanges
Marshy areainfluenced bylake levelchanges
Currentdeepestarea
Currentdeepest area
Current deepest area
Coringequipment
ManualDachnovskycorer
Manual Dachnovskycorer
Rotary drillingequipment
Rotary drillingequipment
ManualDachnovskycorer
Longyearrotarydrillingequipmenton platform
Longyearrotary drillingequipment onplatform
Sedimentinterval
0e9.85 m 0e12 m 0e43 m 13e20.7 m 0e14 m 2.8e17.7 m 1e60 m 1e60 m 1.64e58.3 m
Sampledistance
12 cm Mostly 12.5 cm butat some intervalsat 6.25 cm
Mostly 12.5 cm butintervals: 14e17 m,19.5e33.3 m, and35.3e43.5 mat 25 cm intervals
10 cm 10 cm Interval 2.8�13.6mat 5cm and interval13.6�17.7m at5.5cm
1 cm 1 cm 1 cm
Gaps Not indicated Not indicated From 37.6 to 36.5 m,at 6.3 m, and 9.7 m
Not indicated Not indicated At 5.15 m Minor gapsalong thecore
Minor gapsalong the core
A gap above 1.64 m, andsome minor gaps alongthe core of 1e20 cm length
Number ofpollensamples
82 102 240 224 4586
Number oftaxa in thepollen sum
26 26 27 28 28 28 50(regional)and 11(local)
50 (regional)and 11 (local)
50 (regional) and 11 (local)
Basis of thepublishedage model
Biostratigraphiccorrelationwith Fq-2
214C dates (Van Geeland Van der Hammen,1973) 8 14C datesand Biostratigraphiccorrelation with Fq-7C(Mommersteeg, 1998;Van’t Veer et al., 2000)
6 14C dates, andvisual correlation ofmain pollenspectra/AP% recordagainst MIS (Imbrie et al., 1984)
8 14C dates andprecession-basedorbital tuning ofAlnus (%) record
Frequency analysis in depthdomain of AP% record andposterior astronomical tuningagainst d18O benthic LR04(Lisiecki and Raymo, 2005)
R.G.Bogotá-A
etal./
Quaternary
ScienceReview
s30
(2011)3321
e3337
3324

Table 2List of taxa included in the pollen sum of records Fq-2, Fq-3, Fq-7C and Fq-9C following the original publications. Taxa indicative of the regional vegetation belts are sorted intofour altitudinal groups; a fifth group includes taxa indicative of dry climatic conditions. Main characteristics of altitudinal groups are indicated. Aquatic taxa are groupedaccording to an idealized hydroseries from wet shore to deep water vegetation.
Fq-9C Fq-2 Fq-3 Fq-7C
Altitudinal vegetation zone Taxa Pollen sum Pollen sum Pollen sum Pollen sum
Regional vegetation Subandean forest 1000e2300 mmean annual temperature 19e23 �C
Andean forest 2300e3200 mmean annual temperature 16-9 �C
Subpáramo 3200e3500 mmean annual temperature 6e9 �C
Grasspáramo 3500e4200 mmean annual temperature 3e6 �C
Dry indicators
Acalypha * * * *
Alchornea * * # *
Cecropia * * *
Urticaceae/Moraceae * * * *
Alnus * * * #Clethra * * * #Croton * # #Daphnopsis * * * *
Drimys * # *
Eugenia * * * *
Gaiadendron * # *
Gunnera * # #Hedyosmum * * * *
Ilex * * * *
Juglans * # * *
Melastomataceae * * * *
Miconia * * * *
Monnina * #Myrica (¼Morella) * * * *
Myrsine (¼Rapanea) * * # *
Myrtaceae * * * #Podocarpus * * * *
Proteaceae * # *
Quercus * * * #Sapium * #Styloceras * * *
Symplocos * # #Thalichtrum * # #Vallea * * *
Weinmannia * * * *
Bocconia * *
Arecaceae *
Relbulnium #Asteraceae Asteroideae * # * *
Asteraceae Lactucoideae * # * *
Ericaceae * * * *
Hypericum * * * *
Polylepis/Acaena * * * *
Aragoa * #Caryophyllaceae * # # #Draba *
Brassicaceae #Gentiana * #Geranium * #Lycopodium (foveolate) * # # #Lysipomia * #Plantago * # # #Poaceae * * * *
Puya * #Valeriana * #Borreria * # #Chenopodiaceae * # # #Cactaceae *
Dodonaea * * * *
Local vegetation Shore vegetation
Swamp vegetationShallow water vegetation
Deep water vegetation
Rumex * # # #Polygonum * # # #Cyperaceae * # # #Ludwigia * # #Apiaceae * # # #Ranunculaceae * # #Myriophyllum * # # #Typha * # #Hydrocotyle * # # #Isoëtes * # #Potamogeton * # # #
* Taxa included in the pollen sum of the original publication.# Taxon registered but not included in the pollen sum of the original publication.
R.G. Bogotá-A et al. / Quaternary Science Reviews 30 (2011) 3321e3337 3325

R.G. Bogotá-A et al. / Quaternary Science Reviews 30 (2011) 3321e33373326
sensitive to climate change compared to previous records bycounting higher pollen sums and avoiding the pollen sum is domi-nated by proliferous taxa such as Alnus. We followed the strategy tocount aminimumnumberof 350pollen grains of the less proliferoustaxa and we added the counted pollen of Alnus to reach the pollensum. Such pollen sum is more variable as traditional but froma statistical and ecological point of view more robust.
We normalised the pollen sum of all records on the basis ofrecord Fq-9C (Bogotá-A et al., 2011). Ecological grouping followsprevious studies in the area but some fine-tuning was applied. Thisincludes that a few regional pollen taxa were now added orexcluded compared to the originally published pollen records(Table 2). For the earlier published records we created a pollen sumbased on the local aquatic vegetation in harmony with core Fq-9C.We decided to reject the data set of core Fq-1 as the original pollencounts were not available, the record has no radiocarbon timecontrol, and visual inspection strongly suggests that this record issimilar to Fq-2.
Alnus occurs as swamp forest around the lake; in this settingAlnus reflects azonal vegetation and should not be included in thepollen sum. In the surrounding slopes Alnus also occurs as galleryforest on wet soils along small rivers. In this setting Alnuscontributes to the zonal forest and should be included in the pollensum of regional vegetation. We present our data on the basis ofAlnus included in the regional pollen sum while pollen and sporesfrom the submerged aquatics and the vegetation on wet shoresform the local pollen sum. Alnus does not occur above the UFL (Vander Hammen and González, 1960; Hooghiemstra, 1984). Alnus isa proliferous pollen producer and pollen grains arewell transportedby wind (Grabandt, 1980). Hooghiemstra (1984) showed thatpercentages up to 20% reflect a general backgrond effect; propor-tions above 20% allow the conclusion that Alnus forest was locallypresent. As a consequence the 20% levels in the record of Alnusshows the events when the UFL is at the level of Lake Fúquene(2540 m). There is a quasi linear relationship between arboreal
Fig. 2. Plot of depth vs. calendar age of pollen records Fq-2, Fq-3, Fq-7C and Fq-9C. The uppecorrelation with benthic d18O LR04 record (Lisiecki and Raymo, 2005); Fq-9C ¼ obtainedbiostratigraphic correlation with pollen record Fq-7C. Accepting continuous cyclostratigraphbased on biostratigraphy (see text for further explanation).
pollen percentages (AP%) and the altitudinal distance of the UFL tothe lake. This relationship was quantified in Groot et al. (2011). AP%at the UFL isw40% while every 100 m of upslope UFL displacementadds w5% to the AP% (Hooghiemstra, 1984; Groot et al., 2011).Variation of AP% is used to reconstruct MAT. For UFL positionsbelow the elevation of the lake the quasi linear relationshipbetween AP% and altitudinal distance to the lake is less robust asthe pollen source areas lie on the outer slopes of the basin.However, uncertainties cannot increase substantially as the eleva-tion of the UFL; primarely indicated by the AP%, is always assessedin combination with judging the taxonomic composition of thedominant plant associations.
We used varying proportions of deep water taxa, shallow watertaxa, swamp taxa, and herb taxa from wet lake shores to recon-strucs lake-level changes. These categories of the hydroseries arebased on Cleef (1981), Donato-R et al. (1987), Rangel (2003) andGuzmán (2007). To produce the pollen record of the local vegeta-tion changes and to interpret the varying categories we followedVan’t Veer and Hooghiemstra (2000).
2.4. Zonation
The zonation of Fq-1, Fq-2, Fq-3, and Fq-7C was based on visualinspection of major changes in the proportions of ecological groupsand changes of individual taxa. In Fq-9C local and regional pollenzones were established on the basis of stratigraphical constrainedcluster analysis using the total sum of squares (CONISS; Grimm,1987; Gill et al., 1993).
3. Revision of age models
Spectral analysis of the Fq-9C AP% record has revealed highlysignificant power at w9.07 and 22.65 m, and peaks with lowersignificance at 12.58, 5.96, 4.19 and 3.65 m (Groot et al., 2011). The22.65 m periodicity coincides with the large-scale variations in the
r panel shows the origin of every tie point: 14C ¼ calibrated age; LR04 ¼ obtained afterafter biostratigraphic correlation with pollen record Fq-9C; Fq-7C ¼ obtained aftery the shadowed interval of Fq-3 has an age of 133e186 ka, but these ages are rejected
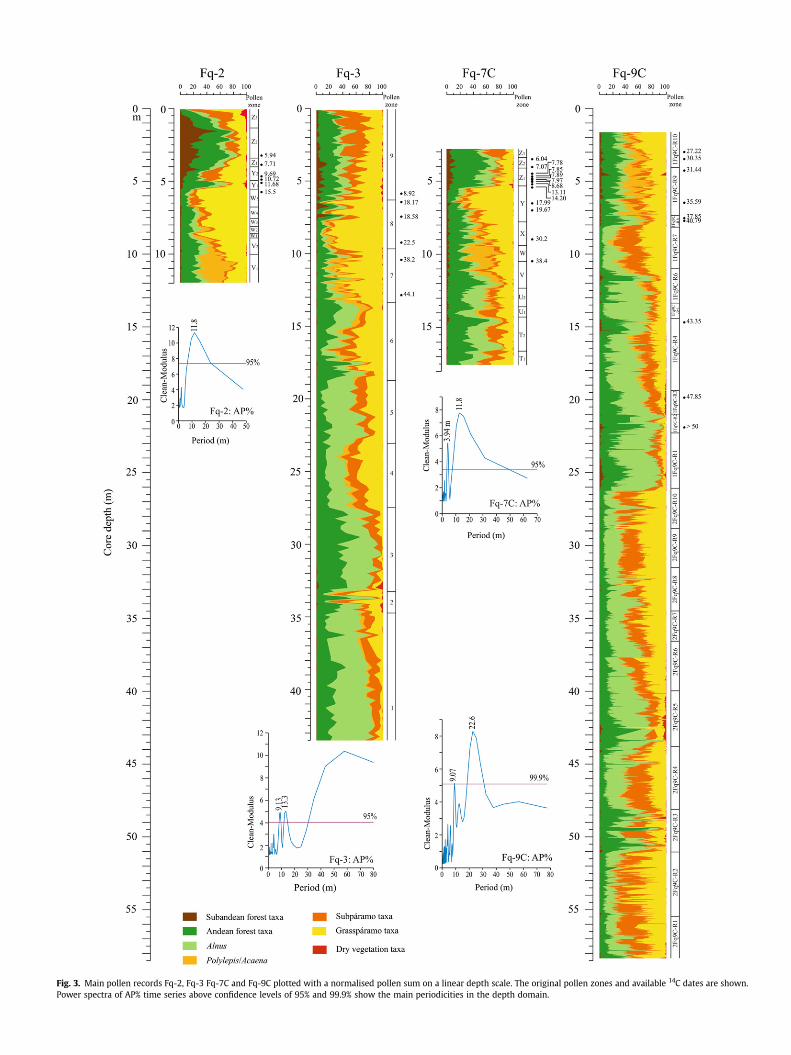
Fig. 3. Main pollen records Fq-2, Fq-3 Fq-7C and Fq-9C plotted with a normalised pollen sum on a linear depth scale. The original pollen zones and available 14C dates are shown.Power spectra of AP% time series above confidence levels of 95% and 99.9% show the main periodicities in the depth domain.
R.G. Bogotá-A et al. / Quaternary Science Reviews 30 (2011) 3321e33373328
AP% record, andwas attributed to the imprint of the late Pleistocenew100 kyr glacial rhythm. This implies that the 9.07 m cycle corre-sponds with a 41 kyr period, indicating a large obliquity control ofthe climate variability in this region, while the less significant peaksat w12.5 m, 5.9 m, 4.19 m, and 3.6 m should coincide respectivelywith 57 kyr, 27 kyr, 19 kyr, and 16.5 kyr periods. Groot et al. (2011)filtered the w9 m period from the AP% record and tuned thiscomponent directly to the 41 kyr obliquity component filtered fromthe global d18O benthic stacked record (LR04; Lisiecki and Raymo,2005). The result is a tuned age model showing the record reflectsthe period from w27 to 284 ka (Groot et al., 2011). Here we shouldstress that our tuned age model differs principally from age modelsbased on subjective curve matching. We have identified the drivingmechanism behind climate change in the study area (Groot et al.,2011) and we tuned the 41 kyr component from the pollenrecords with the 41 kyr component of LR04. While precessionforcing of climate change is dominant in the surrounding lowlandsand related to latitudinal shifts of the ITCZ (Haug et al., 2001)obliquity forcing appears more important at high elevations (Grootet al., 2011).In addition, data from the last 27 kyr of Fq-2, constraintby several recalibrated 14C dates,was implemented on top of the Fq-9C to extend the AP% record up to the latest Holocene. This resultedin a complete and ultra high-resolution AP% record for the past284,000 years, which is used here as the chronological backbone forFq-3 and Fq-7C (Figs. 2 and 3).
We applied the CLEAN algorithm (Roberts et al., 1987; Heslopand Dekkers, 2002) with the same parameters as used for coreFq-9C to identify the main spectral power distribution in the depthdomain of the AP% records of Fq-2, Fq-3 and Fq-7C. The powerspectra of Fq-2 and Fq-7C revealed both a distinct w11.8 m peri-odicity, which given the relatively short length of both cores,reflects the prominent change in AP% from the LGM to the Holo-cene (Fig. 3). Even though a period with a similar length is
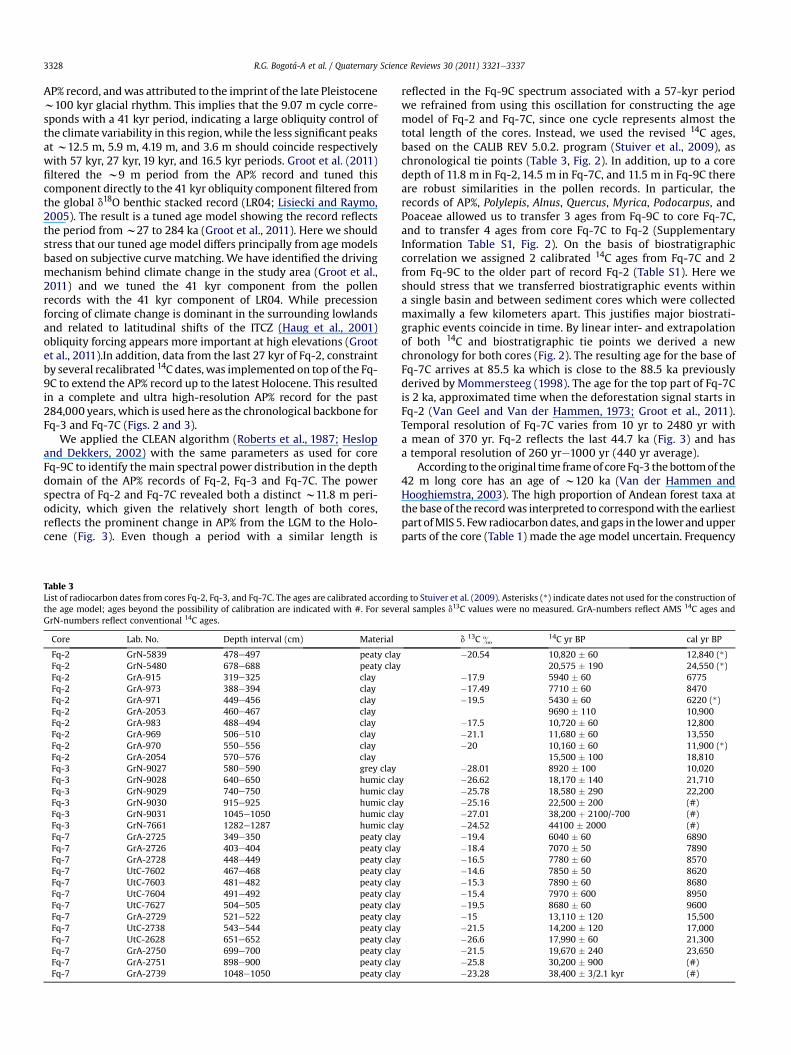
Table 3List of radiocarbon dates from cores Fq-2, Fq-3, and Fq-7C. The ages are calibrated accordithe age model; ages beyond the possibility of calibration are indicated with #. For seveGrN-numbers reflect conventional 14C ages.
Core Lab. No. Depth interval (cm) Material
Fq-2 GrN-5839 478e497 peaty clayFq-2 GrN-5480 678e688 peaty clayFq-2 GrA-915 319e325 clayFq-2 GrA-973 388e394 clayFq-2 GrA-971 449e456 clayFq-2 GrA-2053 460e467 clayFq-2 GrA-983 488e494 clayFq-2 GrA-969 506e510 clayFq-2 GrA-970 550e556 clayFq-2 GrA-2054 570e576 clayFq-3 GrN-9027 580e590 grey clayFq-3 GrN-9028 640e650 humic claFq-3 GrN-9029 740e750 humic claFq-3 GrN-9030 915e925 humic claFq-3 GrN-9031 1045e1050 humic claFq-3 GrN-7661 1282e1287 humic claFq-7 GrA-2725 349e350 peaty clayFq-7 GrA-2726 403e404 peaty clayFq-7 GrA-2728 448e449 peaty clayFq-7 UtC-7602 467e468 peaty clayFq-7 UtC-7603 481e482 peaty clayFq-7 UtC-7604 491e492 peaty clayFq-7 UtC-7627 504e505 peaty clayFq-7 GrA-2729 521e522 peaty clayFq-7 UtC-2738 543e544 peaty clayFq-7 UtC-2628 651e652 peaty clayFq-7 GrA-2750 699e700 peaty clayFq-7 GrA-2751 898e900 peaty clayFq-7 GrA-2739 1048e1050 peaty clay
reflected in the Fq-9C spectrum associated with a 57-kyr periodwe refrained from using this oscillation for constructing the agemodel of Fq-2 and Fq-7C, since one cycle represents almost thetotal length of the cores. Instead, we used the revised 14C ages,based on the CALIB REV 5.0.2. program (Stuiver et al., 2009), aschronological tie points (Table 3, Fig. 2). In addition, up to a coredepth of 11.8 m in Fq-2, 14.5 m in Fq-7C, and 11.5 m in Fq-9C thereare robust similarities in the pollen records. In particular, therecords of AP%, Polylepis, Alnus, Quercus, Myrica, Podocarpus, andPoaceae allowed us to transfer 3 ages from Fq-9C to core Fq-7C,and to transfer 4 ages from core Fq-7C to Fq-2 (SupplementaryInformation Table S1, Fig. 2). On the basis of biostratigraphiccorrelation we assigned 2 calibrated 14C ages from Fq-7C and 2from Fq-9C to the older part of record Fq-2 (Table S1). Here weshould stress that we transferred biostratigraphic events withina single basin and between sediment cores which were collectedmaximally a few kilometers apart. This justifies major biostrati-graphic events coincide in time. By linear inter- and extrapolationof both 14C and biostratigraphic tie points we derived a newchronology for both cores (Fig. 2). The resulting age for the base ofFq-7C arrives at 85.5 ka which is close to the 88.5 ka previouslyderived by Mommersteeg (1998). The age for the top part of Fq-7Cis 2 ka, approximated time when the deforestation signal starts inFq-2 (Van Geel and Van der Hammen, 1973; Groot et al., 2011).Temporal resolution of Fq-7C varies from 10 yr to 2480 yr witha mean of 370 yr. Fq-2 reflects the last 44.7 ka (Fig. 3) and hasa temporal resolution of 260 yre1000 yr (440 yr average).
According to theoriginal time frameof core Fq-3 thebottomof the42 m long core has an age of w120 ka (Van der Hammen andHooghiemstra, 2003). The high proportion of Andean forest taxa atthe base of the recordwas interpreted to correspondwith the earliestpart ofMIS 5. Few radiocarbondates, and gaps in the lower andupperparts of the core (Table 1) made the age model uncertain. Frequency
ng to Stuiver et al. (2009). Asterisks (*) indicate dates not used for the construction ofral samples d13C values were no measured. GrA-numbers reflect AMS 14C ages and
d 13C & 14C yr BP cal yr BP
�20.54 10,820 � 60 12,840 (*)20,575 � 190 24,550 (*)
�17.9 5940 � 60 6775�17.49 7710 � 60 8470�19.5 5430 � 60 6220 (*)
9690 � 110 10,900�17.5 10,720 � 60 12,800�21.1 11,680 � 60 13,550�20 10,160 � 60 11,900 (*)
15,500 � 100 18,810�28.01 8920 � 100 10,020
y �26.62 18,170 � 140 21,710y �25.78 18,580 � 290 22,200y �25.16 22,500 � 200 (#)y �27.01 38,200 þ 2100/-700 (#)y �24.52 44100 � 2000 (#)
�19.4 6040 � 60 6890�18.4 7070 � 50 7890�16.5 7780 � 60 8570�14.6 7850 � 50 8620�15.3 7890 � 60 8680�15.4 7970 � 600 8950�19.5 8680 � 60 9600�15 13,110 � 120 15,500�21.5 14,200 � 120 17,000�26.6 17,990 � 60 21,300�21.5 19,670 � 240 23,650�25.8 30,200 � 900 (#)�23.28 38,400 � 3/2.1 kyr (#)
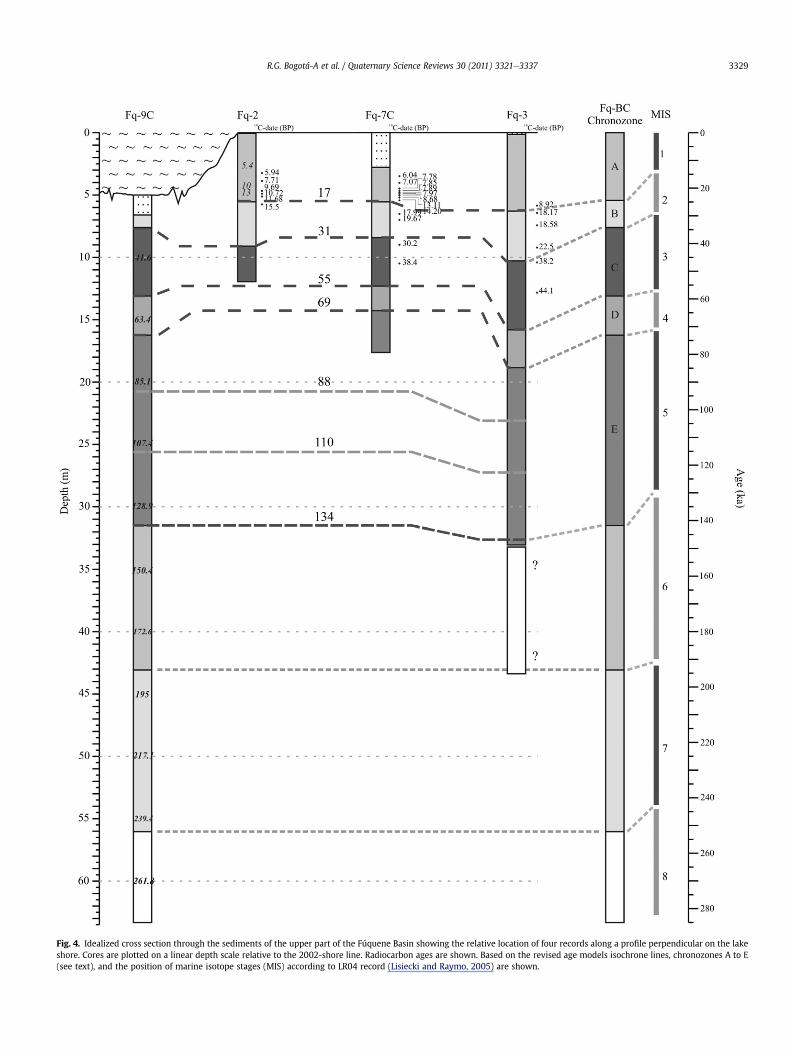
Fig. 4. Idealized cross section through the sediments of the upper part of the Fúquene Basin showing the relative location of four records along a profile perpendicular on the lakeshore. Cores are plotted on a linear depth scale relative to the 2002-shore line. Radiocarbon ages are shown. Based on the revised age models isochrone lines, chronozones A to E(see text), and the position of marine isotope stages (MIS) according to LR04 record (Lisiecki and Raymo, 2005) are shown.
R.G. Bogotá-A et al. / Quaternary Science Reviews 30 (2011) 3321e3337 3329

Fig. 5. Comparison of records of selected pollen taxa from cores Fq-2, Fq-3, Fq-7C and Fq-9C plotted on a linear time scale. Similarity of temporal vegetation change is shown by AP%; the Andean forest taxa Alnus, Quercus, Myrica (recently re-named into Morella), Hedyosmum, and Weinmannia; the subpáramo taxa Asteraceae and Polylepis/Acaena; Poaceaereflecting grasspáramo; and the group of aquatics including Apiaceae, Hydrocotyle, Ludwigia, Myriophyllum, Typha, Ranunculaceae, Isoëtes and Potamogeton.
R.G. Bogotá-A et al. / Quaternary Science Reviews 30 (2011) 3321e3337 3331
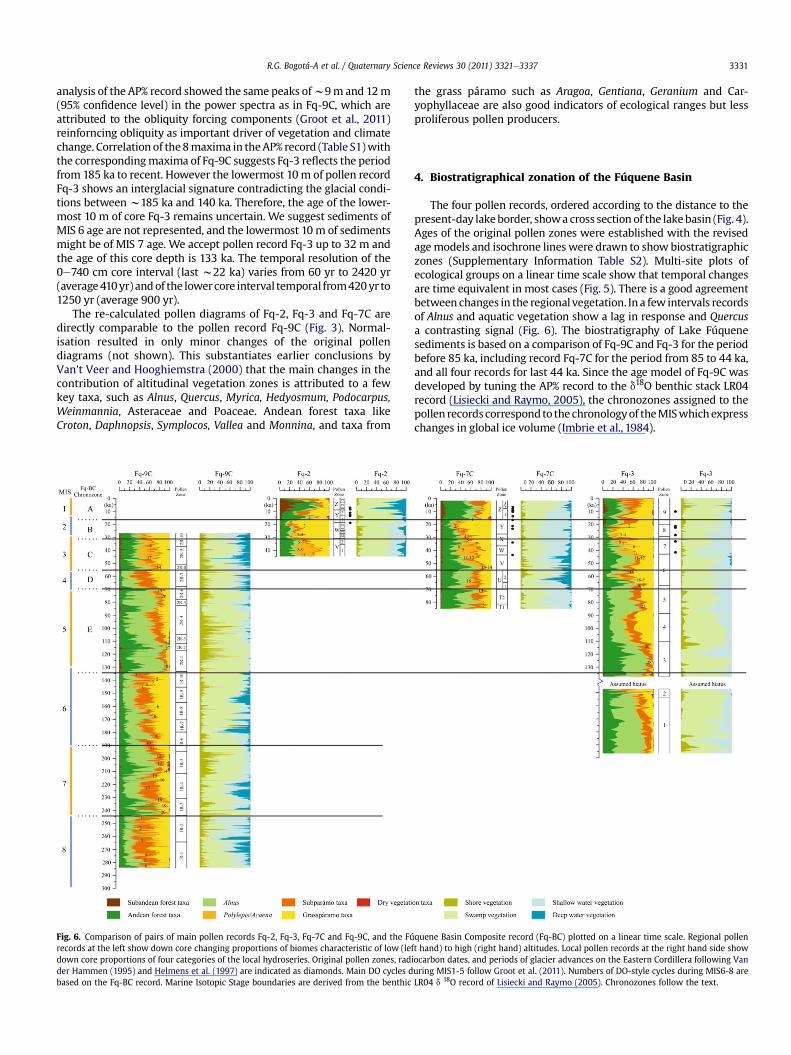
analysis of the AP% record showed the same peaks ofw9m and 12m(95% confidence level) in the power spectra as in Fq-9C, which areattributed to the obliquity forcing components (Groot et al., 2011)reinforncing obliquity as important driver of vegetation and climatechange. Correlation of the8maxima in theAP% record (Table S1)withthe correspondingmaxima of Fq-9C suggests Fq-3 reflects the periodfrom 185 ka to recent. However the lowermost 10m of pollen recordFq-3 shows an interglacial signature contradicting the glacial condi-tions between w185 ka and 140 ka. Therefore, the age of the lower-most 10 m of core Fq-3 remains uncertain. We suggest sediments ofMIS 6 age are not represented, and the lowermost 10m of sedimentsmight be of MIS 7 age. We accept pollen record Fq-3 up to 32 m andthe age of this core depth is 133 ka. The temporal resolution of the0e740 cm core interval (last w22 ka) varies from 60 yr to 2420 yr(average410yr) andof the lowercore interval temporal from420yr to1250 yr (average 900 yr).
The re-calculated pollen diagrams of Fq-2, Fq-3 and Fq-7C aredirectly comparable to the pollen record Fq-9C (Fig. 3). Normal-isation resulted in only minor changes of the original pollendiagrams (not shown). This substantiates earlier conclusions byVan’t Veer and Hooghiemstra (2000) that the main changes in thecontribution of altitudinal vegetation zones is attributed to a fewkey taxa, such as Alnus, Quercus, Myrica, Hedyosmum, Podocarpus,Weinmannia, Asteraceae and Poaceae. Andean forest taxa likeCroton, Daphnopsis, Symplocos, Vallea and Monnina, and taxa from
Fig. 6. Comparison of pairs of main pollen records Fq-2, Fq-3, Fq-7C and Fq-9C, and the Fúrecords at the left show down core changing proportions of biomes characteristic of low (lefdown core proportions of four categories of the local hydroseries. Original pollen zones, radder Hammen (1995) and Helmens et al. (1997) are indicated as diamonds. Main DO cycles dbased on the Fq-BC record. Marine Isotopic Stage boundaries are derived from the benthic
the grass páramo such as Aragoa, Gentiana, Geranium and Car-yophyllaceae are also good indicators of ecological ranges but lessproliferous pollen producers.
4. Biostratigraphical zonation of the Fúquene Basin
The four pollen records, ordered according to the distance to thepresent-day lakeborder, showacross section of the lakebasin (Fig. 4).Ages of the original pollen zones were established with the revisedagemodels and isochrone lines were drawn to show biostratigraphiczones (Supplementary Information Table S2). Multi-site plots ofecological groups on a linear time scale show that temporal changesare time equivalent in most cases (Fig. 5). There is a good agreementbetween changes in the regional vegetation. In a few intervals recordsof Alnus and aquatic vegetation show a lag in response and Quercusa contrasting signal (Fig. 6). The biostratigraphy of Lake Fúquenesediments is based on a comparison of Fq-9C and Fq-3 for the periodbefore 85 ka, including record Fq-7C for the period from 85 to 44 ka,and all four records for last 44 ka. Since the age model of Fq-9C wasdeveloped by tuning the AP% record to the d18O benthic stack LR04record (Lisiecki and Raymo, 2005), the chronozones assigned to thepollen recordscorrespondto the chronologyof theMISwhichexpresschanges in global ice volume (Imbrie et al., 1984).
quene Basin Composite record (Fq-BC) plotted on a linear time scale. Regional pollent hand) to high (right hand) altitudes. Local pollen records at the right hand side showiocarbon dates, and periods of glacier advances on the Eastern Cordillera following Vanuring MIS1-5 follow Groot et al. (2011). Numbers of DO-style cycles during MIS6-8 areLR04 d 18O record of Lisiecki and Raymo (2005). Chronozones follow the text.
R.G. Bogotá-A et al. / Quaternary Science Reviews 30 (2011) 3321e33373332
R.G. Bogotá-A et al. / Quaternary Science Reviews 30 (2011) 3321e3337 3333
The records showing changes in the aquatic vegetation differbetween cores depending on the lake level at the drilling site andsite bound depositional conditions.
4.1. Chronozone E: 134.5 to 69.5 ka (MIS 5)
Atw134.5 ka the vegetation in the Fúquene Basin changed fromsubpáramo and grasspáramo to Andean forest which is associatedto the transition from MIS 6 to MIS 5. We recognised 3 substages.(1) The period from w134.5 to 110 ka shows full interglacialconditions. The UFL was located at w3400 m and the MAT wasaround 14 �C. Some differences in floral composition betweenrecords can be noted. In Fq-3 Weinmannia (insect and wind polli-nated; Moscol-Olivera et al., 2009) and insect pollinated Ilex peakedfrom 124.7 to 111.3 ka while in Fq-9C wind pollinated Quercus andPodocarpuswere abundant. Insect pollinated plants disperse pollenpoorly and representation of insect pollinated taxa may point toa local presence near the coring site. This explanation is supportedby the coring locations: Fq-3 in the border area of the lake and Fq-9C centrally located in open water. Until 123 ka swamp vegetationwas abundant. Between 123 and 115.3 ka abundant shallow watertaxa indicate an increase of the water table in Fq-3. At site Fq-9Cshore vegetation was abundant showing various conditions in thelake coincided and formed a mosaic. (2) The period from w111 to88.5 ka is consistently reflected in Fq-9C and Fq-3. Subpáramo andgrasspáramo vegetation increased on the slopes above the lakeindicating climate became cooler. There is still Andean forestaround the lake a.o. shown by the representation of Alnus >20%.The UFL is around 2550 m and MAT at the level of the lake rangedbetween 9.5 and 10.5 �C (Groot et al., 2011). Up to 95 ka expandingshore vegetation indicates the lake became smaller. Up to 95 ka Fq-9C shows abundant Borreria but Fq-3 does not show evidence ofclimatological dryness. This difference shows that Fq-3 betterregisters local conditions while centrally located Fq-9C showsevidence integrated from a large part of the basin. (3) During theperiod of w88.5 to 69.5 ka all records show permanently high UFLpositions. Fq-9C, Fq-3, and Fq-7C indicate that Andean forest con-sisted mainly of Alnus, Quercus, and Weinmannia. After 78 ka Pol-ylepis became more abundant, first registered in Fq-9C and Fq-7Cand later in Fq-3. This is another evidence that record Fq-3 is leastsensitive to register regional vegetation change. The records ofaquatic vegetation of Fq-9C and Fq-3 show that swamp vegetationexpanded. Peaks in Isoëtes around 83 ka in Fq-7C (at 17.2 m coredepth; Mommersteeg, 1998) and Fq-9C (at 14.5 m core depth)coincides with accumulation of sandy and peaty sediments (Vriendet al., in review). This combination of evidence points to low lakelevel stands, proximal sediment source areas, and Isoëtes vegetationgrowing on sand bars (Torres et al., 2005).
4.2. Chronozone 69.5 to 55.5 ka (MIS 4)
During the period of 69.5 to 55.5 ka the UFL shifted from 3200 tow2200 m, indicative of a MAT lowering from w14 �C to w7.5 �C(Groot et al., 2011). During a short warming around 63.3 ka the UFLmigrated upslope to 2600e3000 m reflecting temperatures up tow10 �C. We noted two main discrepancies between records.
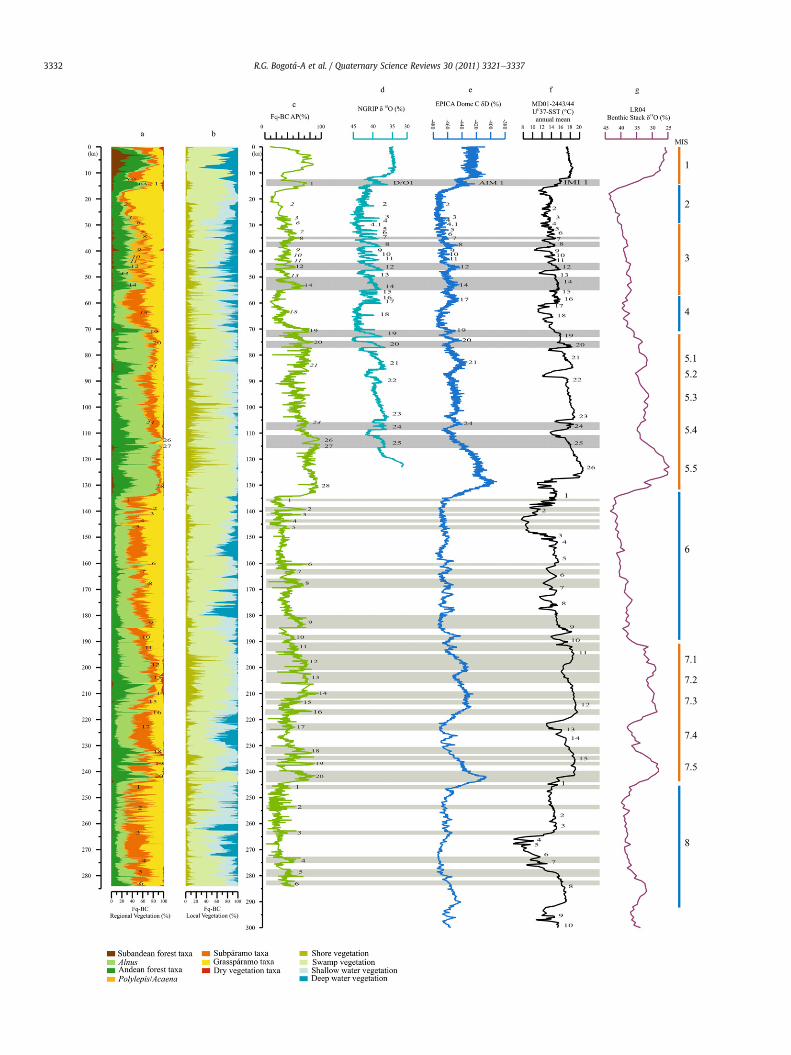
Fig. 7. (a) Climate variability in the northern Andes based on altitudinal vegetation migratioproportions of ecological groups of a hydrological gradient compared with selected recordsreflecting mean annual temperature; (d) ice core NGRIP d18O record indicative of variations iProject Members, 2004); (e) ice core EPICA Dome C dD record (Jouzel et al., 2007) indicativIsotopic Maxima; (f) marine MD01-2443/44 UK’37 alkelone record indicative of sea surfInterstadial (Martrat et al., 2007); (g) d18O benthic stack record LR04 indicative of global ice vcycles during MIS 1-5 follow NGRIP numbering and are shown by gray intervals. Numbers ofintervals.
Around 65.8 ka Fq-9C shows the UFL lowered to � 2200 m, Fq-7Cshows the UFL lowered to w2500 m, and Fq-3 shows an UFL atw3100 m. Fq-3 indicates interglacial conditions that lastedw4.2 kyr longer than the other records do indicate. During thisinterval the forest composition in Fq-3 was dominated by Alnus,Quercus, and Weinmannia and resembles much the forest compo-sition in Fq-9C and Fq-7C during the last part of chronozone E,suggesting a gap in core Fq-3 atw18m (in Figs. 5 and 6 atw 65 ka).A possible gap in core Fq-3 around 66 ka coincides with presence ofcoarse sediment elsewhere: in Fq-7C sandy and organic depositsoccur above 15.2 m (at w69 ka) and in Fq-9C sand and coarse siltappear above 10.5 m (at w66 ka) which makes a plausible totalsetting. The second difference is noted after the short interstadial.Between w60 and 58 ka Fq-9C and Fq-3 show the UFL loweredbelow 2500 m (MAT below 8 �C). During the same period Fq-7Csuggests the UFL varied between 2700 and 3000 m (MATbetween 10 and 12 �C). During the last part of MIS 4 Fq-7C and Fq-3show presence of Andean forest, Alnus in particular, but Fq-9Cshows abundant subpáramo and grasspáramo vegetation. Repre-sentation of Alnus >20% in Fq-7C and Fq-3 points to local presenceof Alnus swamp forest around the lake. We may deal here witha rare setting in which important presence of aquatic asteraceousvegetation (Bidens) and aquatic graminaceous vegetation (e.g. Pol-ypogon) are contributing to the categories of subpáramo andgrasspáramo, respectively (Rangel, 2003; Guzmán, 2007).
4.3. Chronozone C: 55.5 to 31.5 ka (MIS 3)
During MIS 3 the pollen records share two characteristics. (1)after 53.5 ka the UFL rapidly shifted to altitudes above 3000 m andshow a suite of stadial-interstadial oscillations which correlatewithDO cycles (North Greenland Ice Core Project Members, 2004)(Fig. 6). The most robust DO-cycles reflected are 54.6e51.6 ka (DOcycle 14), 46.6e43.7 ka (DO cycle 12), 35.5-32-4 ka (DO cycle 8).Andean forest was mainly composed of Alnus and Quercus togetherwith Myrica and Podocarpus. High proportions of Weinmannia inFq-3 are interpreted as reflecting locally present Weinmanniaforest. During stadial conditions the UFL shifted to elevations belowthe basin and MAT varied between 8� and 9 �C. (2) Polylepis forestinceased in abundance around the UFL and peaked at 53e48.3 ka,47-45 ka, 44.2e41.2 ka, 40.6e37.2 ka and 35.3e34 ka. Glacierexpansions and fluvioglacial deposits pointing to wet climaticconditions occurred at w50 ka, 43e38 ka, and 36e31 ka andglaciers reached as low as w2800 m (Van der Hammen, 1995;Helmens et al., 1997). After retreatment of the glaciers abundantDodonaea may have grown on bare and exposed soils.
4.4. Chronozone B: 31.5 to 17.2 ka (MIS 2)
From 26 ka to 20 ka the UFL reached as low as w2000 m (VanGeel and Van der Hammen, 1973; Van der Hammen andHooghiemstra, 1995). Record Fq-3 shows the lowest position ofthe UFL from 27.2 to 23.4 ka and around 21.7 ka. Between 23.4 kaand 21.8 ka Fq-3 shows a well-dated (2 calibrated 14C ages; Table 3)and sudden upslope migration of the UFL which is not well regis-tered by Fq-2 neither by Fq-7C (Fig. 6). In Fq-2 and Fq-7C the
ns in record Fq-BC and (b) lake level changes in the Fúquene Basin based on changingof global climate change plotted on linear time scale. (c) Fq-BC arboreal pollen recordn atmospheric temperature in Greenland (NGRIP Community North Greenland Ice Coree of variations in atmospheric temperature in Antarctica, AIM corresponds to Antarticace temperature variation in the Mediterranean, IMI corresponds to Iberian Marginolume variation and related Marine Isotope Stages (Lisiecki and Raymo, 2005). Main DODO-style cycles during MIS 6-8 are based on the Fq-BC record and shown in green-gray

R.G. Bogotá-A et al. / Quaternary Science Reviews 30 (2011) 3321e33373334
coldest period is registered from 21 ka to 19.5 ka coinciding withthe LGM. At the elevation of Lake Fúquene lowestMATwere around6.9 �C (Groot et al., 2011). In Fq-2 and Fq-7C the maximal expansionof the swamp vegetation, thus lowest lake level conditions coin-cided with the period of lowest LGM temperatures pointing to verydry climatic conditions. It is plausible that LGM UFL positions andinferred temperatures are flawed by presence of significant aquaticgraminaceous vegetation of Polypogon; more palaeoecologicalevidence from elevations betweenw1900 andw2300 m is neededto precise estimates of LGM temperatute deviations. Fq-3 showsa gap in the sediment record after 21.2 ka (6.3 m core depth)probably due to later erosion (Van der Hammen and Hooghiemstra,2003) preventing further comparison.
4.5. Chronozone A: 17.2 ka to the present (MIS 1)
In Fq-2 andFq-7C the transition fromMIS2 toMIS1 (Termination1) is clearly presented. Fq-2 shows in most detail the Susacá andGuantiva interstadials (equivalent to the Bølling and Allerød inter-stadials) and the El Abra stadial (equivalent to the Younger Dryas(YD); Van Geel and Van der Hammen, 1973; Van der Hammen andHooghiemstra, 1995; Van’t Veer et al., 2000). Termination 1 lastedfromw17ka to 13 ka and theUFL shifted tow3200mreflectingMATof 13 �C. Andean forest was mostly composed of Quercus accompa-nied by Alnus, Myrica, and Podocarpus. Initial relatively wet condi-tions can be inferred from the presence of deep water vegetation.This interpretation is supported by a glacier expansion between 18ka and 15.5 ka and posterior fluvioglacial deposition in the EasternCordillera (Van der Hammen, 1995; Helmens et al., 1997). Repre-sentation of the bare soil pioneer Dodonaea can be explained by theeffect of rapid warming. It caused a high forest turnover leading toabundant presence of exposed soils prone to erosion. Betweenw13 ka and 10 ka Fq-2 shows the El Abra (YD) stadial. High values ofPoaceae and Asteraceae during this period have been interpreted asindicating lower temperatures and lower precipitation (Van’t Veeret al., 2000). Fq-2 shows the UFL shifted after 9.8 ka to present-dayelevations. The UFL shifted to 3400 m and stayed at that elevationbetween 8.3 ka and 3.2 ka; MAT at the lake was between w13 and15 �C. Andean forest was mainly made up of Quercus, Alnus, Mela-stomataceae and Weinmannia. Urticaceae/Moraceae, Acalypha, andAlchornea reached high proportions indicating that uppermostsubandean forest had reached Lake Fúquene closely (Van Geel andVan der Hammen, 1973; Van’t Veer et al., 2000; Van der Hammenand Hooghiemstra, 2003). After 3.2 ka Fq-2 shows significanthuman impact and this last part is not used for biostratigraphic ofclimate reconstructions. Human inpact during this most recentinterval is supported by evidence of pre-hispanic crop cultivation atTocogua site around 2320� 50 14C yr BP (Becerra,1995). In the samearea Gómez et al. (2007) found clearing by fire around 4 ka.
5. Global significance of the Fúquene Basin climate record
We assessed the global relevance of record Fq-BC by comparingclimate variability with selected records from elsewhere (Fig. 7).Correlation between Fq-BC and the d18O benthic LR04 record(Lisiecki and Raymo, 2005) was elaborated to develop the agemodel (Groot et al., 2011). For comparisonwe used Antarctic recordEPICA Dome C (Jouzel et al., 2007) and Greenland record NGRIP(NGRIP Community North Greenland Ice Core Project Members,2004), which reflect variations in atmospheric temperature. Wealso used the Mediterranean records ODP-977A and MD01-2443/44 (Martrat et al., 2004, 2007) which reflect sea surface tempera-tures (SST) to assess climate variability beyond MIS 5. EPICA andMediterranean records support our observation from Fq-BC thatMIS 7.5 temperaures were higher than warmest temperatures
during the Holocene but lower than MIS 5.5 temperatures (Fig. 7).Terminations I, II and III in Fq-BC mimic the pattern observed inLR04 and EPICA. In Fq-BC the Susacá and Gautiva interstadials(indicated in Fig. 7 as BA) and the El Abra stadial (indicated in Fig. 7as YD) of Termination I correspond with the two-step warming inEPICA but also in NGRIP record. The two-step warming is alsoobvious in the Caribbean record ODP 1002 C (Peterson et al., 2000;not shown) and in the Mediterranean SST record (Martrat et al.,2004, 2007). This characteristic climate oscillation is also shownin long European pollen records such as Lake Monticchio (Allenet al., 1999; not shown). A similar two-step warming in Fq-BCduring Termination III was observed in Antarctic temperaturechange (Caillon et al., 2003; Jouzel et al., 2007) and MediterraneanSST (Desprat et al., 2006; Roucoux et al., 2006). Fq-BC also suggestsTermination II shows such characteristic climate oscillation whichis supported by various palaeoceanographic records (Sanchez-Goñiet al., 1999; Gouzy et al., 2004; Cannariato and Kennett, 2005;Risebrobakken et al., 2006; Siddall et al., 2006).
Using a lapse rate of 0.6 �C per 100m, Fq-BC showsMATchangesat Termination I ofw8.5 �C, and Termination II and Termination IIIbup to 10 �C (Groot et al., 2011). During MIS 5-1 in Fq-BC millenniumscale climate variability shows high similarity with the millenniumscale variability in records from Greenland (Dansgaard et al., 1993;NGRIP Community North Greenland Ice Core Project Members,2004), Antarctica (EPICA Community Members, 2006), CariacoBasin (Peterson et al., 2000), Mediterranean Sea (Martrat et al.,2004, 2007) and caves in China (Wang et al., 2001) (Fig. 7).
DansgaardeOeschger (DO) cycles were first described fromGreenland and are characterized by abrupt warming of w7 �Cwithin a few decades followed by gradual cooling over severalhundred of years with a recurrence of 1.5 kyr (Dansgaard et al.,1993). DO cycles are associated with the North Atlantic climaticoscillations (Ganopolski and Rahmstorf, 2001; Lowe, 2001;Clement and Peterson, 2008). Fq-BC shows high climate vari-ability during the last 120 ka; DO cycles 1, 8,12,14,19, 20, 26, 27 and28 are most prominent (Groot et al., 2011). A comparison of Fq-BCwith the NGRIP, EDC and MD01-2443/44 records show that mostDO cycles are reflected with varied robustness in Fq-BC (Fig. 7). Inrecord Fq-2 we recognized during the last 44 ka DO cycles 1, 2, 3-4,5-7, 8-9, and 11) (Fig. 6). The higher temporal resolution in Fq-7Callows to recognise during the last 85 ka DO cycles 1, 2, 3, 4, 5, 7,8, 9, 11-12, 13-14, 18, 19, and 21) (Hessler et al., 2010). In the lowerresolution record Fq-3 we recognized during the last 133 ka DOcycles 2, 3-4, 5, 6, 7, 8, 11-12, 18, 19, 20, 21, 26 and 28).
Heinrich Events (HE) are defined as periodic discharges ofmassive ice rafted debris (IRD) from the Laurentian and Scandina-vian ice sheets into the North Atlantic Ocean together witha southern migration of the Arctic Front during a period ofhundreds to a thousand of years at recurrent intervals of approxi-mately 7e10 kyr (Bond and Lotti, 1995). Pollen records fromlowlands in tropical South America show that HEs mainly affectedthe plant-available moisture. HE periods were particularly dry inthe Cariaco Basin (González et al., 2008) while wetter conditionsprevailed on the northeastern Brazil (Behling et al., 2000:Jennerjahn et al., 2004). Differently, in record Fq-BC HE-1/2 and HE-6, and the massive discharges of IRD during the last part of MIS 6and MIS 8 (McManus et al., 1999) correspond with lowermostpositions of the UFL therefore the lowest MAT (w6.8 �C) in thebasin (Groot et al., 2011).
In Fq-BC millennial-scale climate variation continues into MIS 6,7, and 8. During this period climatic cycles still do not have a stand-ardisednumbering andwe thereforediscussmillennial-scale eventsin Fq-9C as DO-style cycles (Fig. 7). During the period from 243 to134 ka (MIS 7-6) Fq-BC shows 20 DO-style cycles and during theperiod 284-243 ka (MIS 8) 6 DO-style cycles are registered. With
R.G. Bogotá-A et al. / Quaternary Science Reviews 30 (2011) 3321e3337 3335
a recurrenceofw1.5e3kyr theseDO-style cycles resemblemuch theDO cycles of the last 130 ka (Lowe, 2001; Rahmstorf, 2003).Comparisons between records show a different number of DO-stylecycles. The Mediterranean Iberian Margin and Alboran Sea recordsshow between 243 ka and 133 ka 15 DO-style cycles (Martrat et al.,2004, 2007). This number equals the number of most prominentmillennial-scale fluctuations recorded in Antarctica (Jouzel et al.,2007) (Fig. 7). Between 225 and 130 ka 24 summer monsoonevents or Chinese interstadials were identified at middle latitudes(Wang et al., 2008). In North America, the Lake Bear pollen recordshows only 7 DO-style cycles between 195 and 130 ka (Jiménez-Moreno et al., 2007). Difference in the number of cycles may hintto various levels of sensitivity of the monitoring systems.
During MIS 8 Fq-BC shows 6 DO-style cycles while the Mediter-ranean record of Martrat et al. (2007) shows 10 DO-style cycles.Presence of DO cycles at low latitudes during the last 130 ka has beenassociated with synchronic changes in the strength and latitudinalmigrationof the ITCZand themonsoonsystems (Petersonetal., 2000;Wang et al., 2001). Therefore we might expect a similar number ofDO-style cycles in climate records from different latitudes. Insummary theFq-BCrecord showsnearlyallmillenniumscale climaticevents registered before in marine and ice core records evidencingthat the climate record of Lake Fúquene is of global relevance.
6. Conclusions
Long continental records of climate change have few possibili-ties to develop a robust age model for the sediments. Beyond therange of time control by radiocarbon dating, records are oftenvisually compared with a record from elsewhere which is assumedto serve as a standard. However, this procedure of curve matchingdepends on subjective arguments. We used methodology devel-oped in marine micropaleontology which is so far not used indeveloping age models for long terrestrial records. A spectralanalysis in the depth domain of selected taxa with a clear affinity toclimatic parameters shows main frequencies (power spectra) insediment deposition. Results are evaluated and compared withpotentially driving mechanisms. In the case of the pollen recordsfrom Lake Fúquenewe used the AP% recordwhich reflects MAT. Themost dominant peaks in the AP% power spectra show the imprint ofthe w100 kyr eccentricity cycle, and particularly the w41 kyrinfluence of obliquity forcing. Subsequently a direct tuning of thefiltered AP% signal associated to the 41 kyr cycle and the filtered41 kyr cycle from the d18Obenthic stack LR04 record (Lisiecki andRaymo, 2005) allows to establish an independant age model forthe pollen records (Groot et al., 2011). Assumptions are reduced toaccepting a linear sediment accumulation rate between tie points.
In this paper we revisited previously published pollen recordswith age models based on radiocarbon dating and curve matching.We followed the methodology used by Groot et al. (2011) andconcludedmost sediment cores of Lake Fúquene have aw9m cyclein common which reflects the 41 kyr cycle of the obliquity band(Groot et al., 2011). This allowed to develop objective age modelsfor these records. For records which include only one obliquitycycle or less, we used biostratigraphical correlation in addition. Theimproved new age models show the base of record Fq-2 is 44 kaand the base of record Fq-7C is 85.5 ka. We concluded the chro-nology of record Fq-3 had to change significantly. The lowermost10 m of sediments with an interglacial signature are of unknownage and the upper 32 m of sediments reflect the last 133 ka. All fourpollen records from Lake Fúquene have also a w12 m frequency incommon which reflects a w57 kyr cycle possibly associated withthe 54 kyr secondary cycle of the obliquity band (Tuenter et al.,2005). The conclusions from core Fq-9C that climate change inthe high northern Andes is driven by obliquity is in this paper
further supported by other records from this basin. While preces-sion forcing of climate change is dominant in the surroundinglowlands and related to latitudinal shifts of the ITCZ (Haug et al.,2001) obliquity forcing appears more important at high eleva-tions (Groot et al., 2011).
We showed that pollen records from the periphery of the lake,core Fq-3 in particular, differed from the centrally located pollenrecords. Peripheral records show periodic expansion of local Alnusdominated swamp forest andWeinmannia dominated forest on theslopes. The pollen singal of the different vegetation types in theregion are more integrated in the centrally loated record Fq-9C.However all pollen records are in support of a common regionalvegetation development allowing us to conclude that each core isrepresentative of vegetational and climatic change in the studyarea. We found no reason not to rely on a single core from a basin.We neither found arguments not to recore a basin when improvedmethodology can be used. The gap in the sediment record of coreFq-3 which had not been identified in the original paper, caused anerroneous age model for the lower part of the record. This record inpaticular shows the differnce between subjective curve matchingand the objective method used in this paper. We show thatterrestrial sediments are able to provide records of climate changeat centennial time scales over long periods of time challengingcomparisons with highest resolution marine and ice core records ofclimate change. Climate variability at DO-cycle time scales ispresent in all pollen record of Lake Fúquene. Among terrestrialrecord of Pleistocene climate change records Fq-BC undoubtedlyprovides highest resolution over a long period of time (Groot et al.,2011). Several challenging research questions are ahead, such asexploring the nature and rates of change and potential thresholdsin the sensitivity of montane ecosystens to climate perturbations.
Acknowledgements
The Fúquene Project was financially supported by NWO (grantALW 854.00.007), WOTRO (grant WB 84-552), AlBan (grantE04D088907CO), NUFFIC, and the University of Amsterdam. Wethank the CAR in Bogotá (Beatriz Chaparro) for permissions to workin Lake Fúquene, and Tropenbos-Colombia (Carlos Rodriguez) forlogistic support. We thank Orlando Rangel (ICN, UniversidadNacional de Colombia, Bogotá) for making available laboratoryfacilities, and Gustavo Sarmiento and Sergio Gaviria (UniversidadNacional de Colombia, Bogotá) for sharing with us geological andlithological information. We thank Annemarie Philip for preparingthe pollen samples. We thank Yahir Valderrama, Catalina Giraldo,Natalia González, Alejandra Betancour, and Diana Ortega for theircollaboration inpollen analysis.We thank twoananymous reviewersfor their constructive comments on an earlier version of this paper.
Appendix. Supplementary material
Supplementary data associated with this article can be found, inthe online version, at doi:10.1016/j.quascirev.2011.08.003.
References
Allen, J.R.M., Brandt, U., Brauer, A., Hubberten, H.W., Huntley, B., Keller, J., Kraml, M.,Mackensen, A., Mingram, J., Negendank, J.F.W., Nowaczyk, N.R., Oberhänsli, H.,Watts, W.A., Wulf, S., Zolitschka, B., 1999. Rapid environmental changes insouthern Europe during the last glacial period. Nature 400, 740e743.
Becerra, M., 1995. Études morphologiques et traceologiques de mocro pointes dequarz de ‘Duitama-Tocogua’, Haut Plateeau de Boyacá en Colombia. Universitéde Paris-I, Panthéon Sorbonne, Crap, Paris.
Behling, H., Arz, H.W., Pätzold, J., Wefer, G., 2000. Late Quaternary vegetational andclimatic dynamics in northeastern Brazil, inferences from marine core GeoB3104-1. Quaternary Science Reviews 19, 981e994.

R.G. Bogotá-A et al. / Quaternary Science Reviews 30 (2011) 3321e33373336
Bogotá-A., R.G., Hooghiemstra, H., Berrio, J.C., 2011. An ultra-high resolution multi-proxy record from Lake Fuquene (Colombia): orbital to submillennial-scaledynamics of montane vegettion, climate, lake level changes and sedimentaryenvironments. In: Bogotá-A, R.G., Pleistocene centennial-scale vegeteational,environmental, and climatic change in the Colombian Andes. PhD thesisUniversity of Amsterdam, pp. 49e82.
Bond, C.G., Lotti, R., 1995. Iceberg discharges into the North Atlantic on millennialtime scales during the Last Glaciation. Science 267, 1005e1010.
Caillon, N., Severinghaus, J.P., Jouzel, J., Barnola, J.M., Kang, J., Lipenkov, V.Y., 2003.Timing of atmospheric CO2 and Antarctic temperature changes across termi-nation III. Science 299, 1728e1731.
Cannariato,K.G., Kennett, J.P., 2005. Structure of thepenultimate deglaciation along theCalifornia margin and implications for Milankovitch theory. Geology 33,157e160.
CAR, 2000. Fúquene; el lecho de la zorra. Corporación Autónoma Regional deCundinamarca, Bogotá, Colombia, 189 pp.
Chen, Y., 1987. Pollen and sediment distribution in small crater lake in NortheastQueensland, Australia. Pollen et Spores 1, 89e110.
Cleef, A.M., 1981. The vegetation of the páramos of the Colombian CordilleraOriental. Dissertaciones Botanicae 61, 1e321.
Cleef, A.M., Hooghiemstra, H., 1984. Present vegetation of the area of the high plainof Bogotá. In: Hooghiemstra, H. (Ed.), Vegetational and climatic history of thehigh plain of Bogotá, vol. 79. Dissertaciones Botanicae, Colombia, pp. 42e66.
Clement, C.M., Peterson, L.C., 2008. Mechanisms of abrupt climate change of the lastglacial period. Reviews of Geophysics 46, 1e39. doi: 1029/2006RG000204.
Cross, S.L., Baker, P.A., Seltzer, G.O., Fritz, S.C., Dunbar, R.B., 2000. A new estimate ofthe Holocene lowstand level of Lake Titicaca, and implications for tropicalpalaeohydrology. The Holocene 10, 21e32.
Cuatrecasas, J., 1958. Aspectos de la vegetación natural en Colombia. Revista de laAcademia Colombiana de Ciencias Exactas. Físicas Y Naturales 10 (40),221e268.
Dansgaard, W., Johnsen, S.J., Clausen, H.B., Dahl-Jensen, D., Gundenstrup, N.S.,Hammer, C.U., Hvidberg, C.S., Steffensen, J.P., Sveinbjörnsdottir, A.E., Jouzel, J.,Bond, G.C., 1993. Evidence for general instability of past climate from a 250-kyrice-core record. Nature 364, 218e220.
Demske, D., Heumann, G., Granoszewski, W., Nita, M., Mamakowa, K., Tarazov, P.E.,Oberhänsli, H., 2005. Late glacial and Holocene vegetation and regional climatevariability evidenced in high-resolution pollen records from Lake Baikal. Globaland Planetary Change 46, 255e279.
Desprat, S., Sánchez Goñi, M.F., Turon, J.L., Duprat, J., Malaizé, B., Peypouquet, J.P.,2006. Climatic variability of Marine Isotope Stage 7: direct land-sea-ice corre-lation from a multiproxy analysis of a north-western Iberian margin deep-seacore. Quaternary Science Review 25, 1010e1026.
Donato-R., J.C., Duque-E., S.R., Mora-Osejo, L.E., 1987. Estructura y dinamica del fito-plancton de la Laguna de Fúquene (Cundinamarca, Colombia). Revista de laAcademia Colombiana de Ciencias Exactas. Físicas Y Naturales 16 (62), 113e144.
Dumayne-Peaty, L., Barber, K., 1998. Late Holocene vegetational history, humanimpact and pollen representativity variations in northern Cumbria, England.Journal of Quaternary Science 13, 147e164.
EPICA Community Members, 2006. One-to-one coupling of glacial climate vari-ability in Greenland and Antarctica. Nature 444, 195e198.
Faegri, K., Iversen, J., 1989. Textbook of pollen analysis. In: Fægri, K., Kaland, P.E.,Krzywinski, L. (Eds.), fourth ed. Wiley, Chichester, U.K, 328 pp.
Fritz, C.S., Baker, P.A., Tapia, P., Garland, J., 2006. Spatial and temporal variation incores from Lake Titicaca, Bolivia/Peru during the last 13,000 yrs. QuaternaryInternational 158, 23e29.
Ganopolski, A., Rahmstorf, S., 2001. Rapid changes of glacial climate simulated ina couple climate model. Nature 409, 153e158.
Gill, D., Shomrony, A., Fligelman, H., 1993. Numerical zonation of log suites andlogfacies recognition by multivariate clustering. The American Association ofPetroleum Geologist Bulletin 77, 1781e1791.
Gómez, A., Berrio, J.C., Hooghiemstra, H., Becerra, M., Marchant, R., 2007.A Holocene pollen record of vegetation change and human impact from Pan-tano de Vargas, an intra-Andean basin of Duitama, Colombia. Review ofPalaeobotany and Palynology 145, 143e157.
González, C., Dupont, L.M., Behling, H., Wefer, G., 2008. Neotropical vegetationresponse to rapid climate changes during the last glacial period: palynologicalevidence from the Cariaco Basin. Quaternary Research 69, 217e230.
Gouzy, A., Malaizé, B., Pujol, C., Charlier, K., 2004. Climatic "pause" during Termi-nation II identified in shallow and intermediate waters off the Iberian margin.Quaternary Science Reviews 23, 1523e1528.
Grabandt, R.A.J., 1980. Pollen rain in relation to arboreal vegetation in the Colom-bian Cordillera Oriental. Review of Palaeobotany and Palynology 29, 65e147.
Grimm, E.C., 1987. CONISS: a Fortran 77 program for stratigraphycally constrainedcluster analysis by the method of incremental sum of squares. Computers andGeosciences 13, 13e35.
Groot, M.H.M., Bogotá, R.G., Lourens, L.J., Hooghiemstra, H., Vriend, M., Berrio, J.C.,Tuenter, E., Van der Plicht, J., Van Geel, B., Ziegler, M., Weber, S.L., FúqueneProject Members, 2011. Ultra-high resolution pollen record from the northernAndes reveals rapid shifts in montane climates within the last two glacialcycles. Climate of the Past 7, 299e316.
Guzmán, A., 2007. Comunidades vegetales asociadas a juncales en la laguna deFúquene. In: Franco Vidal L, Andrade G (Eds.), Fúquene, Cucunubá y Palacio.Conservación de la biodiversidad y manejo sostenible de un ecosistema lagunarandino. Fundación Humedales e Instituto de Investigación de Recursos Bio-lógicos Alexander von Humboldt, Bogotá D.C. Colombia, p. 364.
Haug, G.H., Haughen, K.A., Sigman, D.M., Peterson, L.C., Roehl, U., 2001. Southwardmigration of the Intertropical Convergence zone through the Holocene. Science293, 1304e1308.
Helmens, K.F., Rutter, N.T., Kuhry, P., 1997. Glacier fluctuations in the Eastern Andesof Colombia (South America) during the last 45,000 radiocarbon years.Quaternary International 38/39, 39e48.
Heslop, D., Dekkers, M.J., 2002. Spectral analysis of unevenly spaced climatic seriesusing CLEAN: signal recovery and derivation of significance levels using a MonteCarlo simulation. Physics of the Earth and Planetary Interiors 130, 103e116.
Hessler, I., Dupont, L., Bonnefille, R., Behling, H., González, C., Helmens, K.F.,Hooghiemstra, H., Lebamba, J., Ledru, M.-P., Lézine, A.-M., Maley, J., Marret, F.,Vincens, A., 2010. Millennial-scale changes in vegetation records from tropicalAfrica and South America during the last glacial. Quaternary Science Reviews 29,2882e2899.
Hooghiemstra, H., 1984. Vegetational and climatic history of the high plain ofBogotá, Colombia. Dissertaciones Botanicae 79, 1e368.
Hooghiemstra, H., Van der Hammen, T., 1993. Late Quaternary vegetation historyand paleoecology of Laguna Pedro Palo (subandean forest belt, EasternCordillera, Colombia). Review of Palaeobotany and Palynology 77, 235e262.
Hooghiemstra, H., Van der Hammen, T., 2004. Quaternary ice-age dynamics in theColombian Andes: developing and understanding of our legacy. PhilosophicalTransaction of the Royal Society B 359, 173e182.
Huntley, B., Watts, W.A., Allen, J.R.M., Zolitschka, B., 1999. Palaeoclimate, chronologyand vegetation history of the Weichselian Lateglacial: comparative analysis ofdata from three cores at Lago Grande di Monticchio, southern Italy. QuaternaryScience Reviews 18, 945e960.
IGAC, 2003. Atlas de Colombia, fifth ed. Instituto Geográfico Agustín Codazzi, BogotáD.E., Colombia.
Imbrie, J., Hays, J.D., Martinson, D.G., McIntyre, A., Mix, A.C., Morley, J.J., Pisias, N.G.,Prell, W.L., Shackleton, N.J., 1984. The orbital theory of Pleistocene climate:support from a revised chronology of the marine dO18 record. In: Berger, A.L.,Imbrie, J., Hays, J., Kukla, G., Saltzman, B. (Eds.), Milankovitch and Climate, vol. 1.Reidel, Dordrecht, pp. 269e306.
Jacobson, G.L., Bradshaw, R.H.W., 1981. The selection of sites for paleoecologicalstudies. Quaternary Research 16, 80e96.
Jennerjahn, T.C., Ittekkot, V., Arz, H.W., Behling, H., Pätzold, J., Wefer, G., 2004.Asynchronous terrestrial and marine signals of climate change during HeinrichEvents. Science 306, 2236e2239.
Jiménez-Moreno, G., Anderson, R.S., Fawcett, P.J., 2007. Orbital- and millennial-scalevegetation and climate changes of the past 225 ka from Bear Lake, Utah-Idaho(USA). Quaternary Science Reviews 26, 1713e1724.
Johnson, T.C., Brown, E.T., McManus, J., Barry, S., Barker, P., Gasse, F., 2002. A high-resolution paleoclimate record spanning the past 25,000 years in Southern EastAfrica. Science 296, 113e116.
Jouzel, J., Masson-Delmotte, V., Cattani, O., Dreyfus, G., Falourd, S., Hoffmann, G.,Minster, B., Nouet, J., Barnola, J.M., Chappellaz, J., Fischer, H., Gallet, J.C.,Johnsen, S., Leuengerger, M., Loulergue, L., Luethi, D., Oerter, H., Parrenin, F.,Raisbeck, G., Raynaud, D., Schilt, A., Schwander, J., Selmo, E., Souchez, R.,Spahni, R., Stauffer, B., Steffensen, J.P., Stenni, B., Stocker, T.F., Tison, J.L.,Werner, M., Wolff, E.W., 2007. Orbital and millennial Antarctic climate vari-ability over the past 800,000 years. Science 317, 793e795.
Kangur, M., 2009. Spatio-temporal distribution of pollen in Lake Väike-Juusa (SouthEstonia) sediments. Review of Palaeobotany and Palynology 153, 354e359.
Lisiecki, L.E., Raymo, M.E., 2005. A Pliocene-Pleistocene stack of 57 globallydistributed benthic d18 O records. Paleoceanography 20 PA1003, doi:10.1029/2004PA001071.
Lowe, J.J., 2001. Climatic oscillations during the last glacial cycle-nature, causes and thecase for synchronous effects. Proceedings of the Royal Irish Academy 101B,19e33.
Marchant, R., Behling, H., Berrio, J.C., Cleef, A., Duivenvoorden, J., Hooghiemstra, H.,Kuhry, P., Melief, B., Van Geel, B., Van der Hammen, T., Van Reenen, G., Wille, M.,2001. Mid-to late Holocene pollen-based biome reconstructions for Colombia.Quaternary Science Reviews 20, 1289e1308.
Martrat, B., Grimalt, J.O., Lopez-Martinez, C., Cacho, I., Sierro, F.J., Flores, J.A.,Zahn, R., Canals, M., Curtis, J.H., Hodell, D.A., 2004. Abrupt temperature changesin Western Mediterranean over the past 250,000 years. Science 306,1762e1765.
Martrat, B., Grimalt, J.O., Shackleton, N.J., de Abreu, L., Hutterli, M.A., Stocker, T.F.,2007. Four climate cycles of recurring deep and surface water destabilizationson the Iberian Margin. Science 317, 502e507.
McManus, J.F., Oppo, D.W., Cullen, J.L., 1999. A 0.5-millon-year record of millennial-scale climate variability in the North Atlantic. Science 283, 971e975.
Mommersteeg, H.J.P.M., 1998. Vegetation and development and cyclic and abruptclimatic change during the Late Quaternary. Palynological evidence from theEastern Cordillera of Colombia. PhD thesis, University of Amsterdam, 191 pp.
Montenegro-Paredes, M.I., 2004. Modeling of wetland habitat availability anddistribution under management alternatives. A case study of the Fúquene lake,Colombia. M.Sc. thesis. International Institute for Geoinformation Science andEarth Observation (ITC). Enschede, The Netherlands, 105 pp.
Moore, P.D., Webb, J.A., 1978. An illustrated guide to pollen analysis. Hodder andStoughton, London.
Moscol-Olivera, M., Duivenvoorden, J.F., Hooghiemstra, H., 2009. Pollen rain andpollen representation across a forest-páramo ecotone in northern Ecuador.Review of Palaeobotany and Palynology 157, 285e300.
North Greenland Ice Core Project Members, 2004. High-resolution record of NorthernHemisphereclimateextending into the last interglacialperiod.Nature431,147e151.

R.G. Bogotá-A et al. / Quaternary Science Reviews 30 (2011) 3321e3337 3337
Peterson, L.C., Haug, G.H., Hughen, K.A., Röhl, U., 2000. Rapid changes in the hydro-logic cycle of the tropical Atlantic during the last glacial. Science 290,1947e1951.
Rahmstorf, S., 2003. Timing of abrupt climate change: a precise clock. GeophysicalResearch Letters 30, 1510. doi: 10.1029/2003GL17115.
Rangel-Ch, O., 2003. El antiguo lago de la Sabana de Bogotá, su vegetación y su floraen el tiempo. In: Bogotá, A.D., C. Conservación Internacional (Eds.), LosHumedales de la Sabana de Bogotá. Zetta Comunicadores. Bogotá, pp. 53e68.
Risebrobakken, B., Balbon, E., Dokken, T., Jansen, E., Kissel, C., Labeyrie, L., Richter, T.,Senneset, L., 2006. The penultimate deglaciation: high-resolution paleoceano-graphic evidence from a north-south transect along the eastern Nordic Seas.Earth and Planetary Science Letters 24, 505e516.
Roberts, D.H., Lehar, J., Dreher, J.W., 1987. Time series analysis with CLEAN. Part I.Derivation of a spectrum. Astronomical Journal 93, 968e989.
Roucoux, K.H., Tzedakis, P.C., de Abreu, L., Shackleton, N.J., 2006. Climate andvegetation changes 180,000 to 345,000 years ago recorded in a deep-sea coreoff Portugal. Earth Planetary Science Letters 249, 307e325.
Sánchez-Goñi, M.F., Eynaud, F., Turon, J.L., Shackleton, N.J., 1999. High resolutionpalynologycal record of Iberian margin: direct land-sea correlation for the LastInterglacial complex. Earth and Planetary Science Letters 171, 123e137.
Sarmiento, G., Gaviria, S., Hooghiemstra, H., Berrio, J.C., Van der Hammen, T., 2008.Landscapeevolutionandoriginof LakeFúquene (Colombia): tectonics, erosionandsedimentation processes during the Pleistocene. Geomorphology 100, 563e575.
Siddall, M., Bard, E., Rohling, E.J., Hemleben, C., 2006. Sea-level reversal duringTermination II. Geology 34, 817e820.
Stuiver, P., Reimer, J., Reimer, R., 2009. CALIB radiocarbon calibration, Executeversion 5.0.2. http://calib.qub.ac.uk/calib/calib.html.
Talbot, M.R., Laerdal, T., 2000. The late Pleistocene-Holocene palaeolimnology ofLake Victoria, East Africa, based upon elemental and isotopic analyses of sedi-mentary organic matter. Journal of Paleolimnology 23, 141e164.
Tapia, P.M., Fritz, S.C., Baker, P.A., Seltzer, G.O., Dunbar, R.B., 2003. A Late Quaternarydiatom record of tropical climatic history from Lake Titicaca (Peru and Bolivia).Palaeogeography Palaeoclimatology Palaeoecology 194, 139e164.
Torres, V., Vanderberghe, J., Hooghiemstra, H., 2005. An environmental recon-struction of the sediment infill of the Bogotá basin (Colombia)during the last 3million years from abiotic and abiotic proxies. Palaeogeography Palae-oclimatology Palaeoecology 226, 127e148.
Tuenter, E., Weber, S.L., Hilgen, F.J., Lourens, L.J., Ganopolski, A., 2005. Simulation ofclimate phase lags in the response to precession and obliquity forcing and therole of vegetation. Climate Dynamics 24, 279e295.
Turner, J., Innes, J.B., Simmons, I.G., 1989. Two pollen diagrams from the same site.New Phytologist 113, 409e416.
Van Geel, B., Van der Hammen, T., 1973. Upper Quaternary vegetational and climaticsequence of the Fúquene area (Eastern Cordillera, Colombia). PalaeogeographyPalaeoclimatology Palaeoecology 14, 9e92.
Van der Hammen, T., 1974. The Pleistocene changes of vegetation and climate intropical South America. Journal of Biogeography 1, 3e26.
Van der Hammen, T., 1995. La última glaciación en Colombia. In: Van derHammen, T. (Ed.), Plioceno y Cuaternario del Altiplano de Bogotá y alrededores,vol. 24. Análisis Geográficos, pp. 70e89.
Van der Hammen, T., 2008. Zonal ecosystems of the western and eastern flanks ofthe Eastern Cordillera of the Colombian Andes (Sumapaz Transect). In: Van derHammen, T. (Ed.), Studies on Tropical Andean Ecosystems, vol. 7. Cramer-Borntraeger, Berlin-Stuttgart, pp. 961e985.
Van der Hammen, T., González, E., 1960. Upper Pleistocene and Holocene climatevegetation of the ‘Sabana de Bogotá’, (Colombia, South America). Leidse Geo-logische Mededelingen 25, 126e315.
Van der Hammen, T., Hooghiemstra, H., 1995. The El Abra stadial, a Younger Dryasequivalent in Colombia. Quaternary Science Reviews 14, 841e851.
Van der Hammen, T., Hooghiemstra, H., 2003. Interglacial-glacial Fúquene-3 pollenrecord from Colombia: an Eemian to Holocene climate record. Global andPlanetary Change 36, 181e199.
Van’t Veer, R., Hooghiemstra, H., 2000. Montane forest evolution during the last650,000 yr in Colombia: a multivariate approach based on pollen record Funza-I. Journal of Quaternary Science 15, 329e346.
Van’t Veer, R., Islebe, G.A., Hooghiemstra, H., 2000. . Climatic change during theYounger Dryas in Colombia chron in northern South America: a test of theevidence. Quaternary Science Reviews 19, 1821e1835.
Vriend, M., Groot, M.H.M., Hooghiemstra, H., Bogotá-A., R.G., Berrio, J.C., in review.Changing depositional environments at submillenial time-scales during 284-27ka from combined unmixed grain-size distributions and aquatic pollen: theColombian Fúquene Basin.
Wang, Y.J., Cheng, H., Edwards, R.L., An, Z.S., Wu, J.Y., Shen, C.C., Dorale, J.A., 2001.A high-resolution absolute dated Late Pleistocene monsoon record from HuluCave, China. Science 294, 2345e2348.
Wang, Y., Cheng, H., Lawrence-E, R., Kong, X., Shao, X., Chen, S., Wu, J., Jiang, X.,Wang, X., An, Z., 2008. Millennial- and orbital-scale changes in the East Asianmonsoon over the past 224,000 years. Nature 451, 1090e1092.
Watts, W.A., Allen, J.R.M., Huntley, B., 2000. Palaeoecology of three interstadialevents during oxygen-isotope Stages 3 and 4: a lacustrine record from LagoGrande di Monticchio southern Italy. Palaeogeography PalaeoclimatologyPalaeoecology 155, 83e93.
Whittington, G., Edwards, K.J., Cundill, P.R., 1991. Late- and post-glacial vegetationchange at Black loch, Fife, eastern Scotland e a multiple core approach. NewPhytologist 118, 147e166.
Wille, M., Hooghiemstra, H., Behling, H., Van der Borg, K., Negret, A.J., 2001.Environmental change in the Colombian subandean forest belt from 8pollen records: the last 50 kyr. Vegetation History and Archaeobotany 10,61e77.