High-resolution magnetostratigraphy and biostratigraphic zonation of the Jurassic/Cretaceous...
16
This article appeared in a journal published by Elsevier. The attached copy is furnished to the author for internal non-commercial research and education use, including for instruction at the authors institution and sharing with colleagues. Other uses, including reproduction and distribution, or selling or licensing copies, or posting to personal, institutional or third party websites are prohibited. In most cases authors are permitted to post their version of the article (e.g. in Word or Tex form) to their personal website or institutional repository. Authors requiring further information regarding Elsevier’s archiving and manuscript policies are encouraged to visit: http://www.elsevier.com/copyright
Transcript of High-resolution magnetostratigraphy and biostratigraphic zonation of the Jurassic/Cretaceous...

This article appeared in a journal published by Elsevier. The attachedcopy is furnished to the author for internal non-commercial researchand education use, including for instruction at the authors institution
and sharing with colleagues.
Other uses, including reproduction and distribution, or selling orlicensing copies, or posting to personal, institutional or third party
websites are prohibited.
In most cases authors are permitted to post their version of thearticle (e.g. in Word or Tex form) to their personal website orinstitutional repository. Authors requiring further information
regarding Elsevier’s archiving and manuscript policies areencouraged to visit:
http://www.elsevier.com/copyright

Author's personal copy
High-resolution magnetostratigraphy and biostratigraphic zonation of theJurassic/Cretaceous boundary strata in the Puerto Escano section (southern Spain)
P. Pruner a, V. Housa a, F. Oloriz b, M. Kostak c,*, M. Krs a, O. Man a, P. Schnabl a, D. Venhodova a,J.M. Tavera b, M. Mazuch c
a Institute of Geology, Academy of Sciences of the Czech Republic, v.v.i., Rozvojova 269, 165 00, Praha 6 – Lysolaje, Czech Republicb Department of Stratigraphy and Paleontology, Faculty of Sciences, University of Granada, Av. Fuentenueva s/n Granada, Spainc Institute of Geology and Palaeontology, Faculty of Science, Charles University in Prague, Albertov 6, Prague 2, Czech Republic
a r t i c l e i n f o
Article history:Received 17 June 2009Accepted in revised form 28 October 2009Available online 10 November 2009
Keywords:AmmonitesMagnetostratigraphyJurassic/Cretaceous boundaryTintinnoidsSouthern SpainSubbetic Zone
a b s t r a c t
This study summarizes the final results of magnetostratigraphic and biostratigraphic investigations ofthe Tithonian/Berriasian (J/K) boundary limestones at the locality of Puerto Escano, Spain. The aim is toprepare the background for correlation of an upper Tithonian and lower Berriasian biostratigraphiczonation with global magnetoevents (manifested in detailed magnetostratigraphic profiles) between theTethyan and the Boreal realms.
Magnetostratigraphic studies were applied to an 8.1-m-thick part of the section embracing upperTithonian and lower Berriasian strata. The average sampling interval was 30 mm. The analysis of the IRMacquisition curves proved the presence of magnetite and hematite, the former mineral being the maincarrier of the remanent magnetization. Progressive thermal demagnetization mostly revealed three NRMcomponents, and magnetostratigraphy was based on the directions of the most stable of them, withunblocking temperature varying mostly from 300 to 540 �C. Due to almost parallel beds, the fold testapplied to this component did not give convincing results. In contrast, the reversal test received the bestclassification ‘A’. The detected polarity zones could has been unequivocally identified against theM-sequence of polarity intervals drawn from the Geomagnetic Polarity Time Scale 2004. This fact,together with the results of the reversal test, confirmed the ChRM to be the primary component. Thesampled part of the section included a part of magnetozone M20r, full magnetozones M20n to M18r anda part of magnetozone M18n. Especially the detection of two reverse respectively by M20n.1r andM19n.1r with thicknesses only 40 and 90 mm, respectively, required much effort when sampling thesection. The calculated sedimentation rate varied from 1 to 5 mm/ky.
The positions of the individual events of tintinnoid biostratigraphy (mainly calpionellids) relative tothe global magnetic polarity timescale are precisely defined. The base of the Calpionella Standard Zone,which is considered to be a potential J/K boundary indicator in ammonite-free sections from the Tethyanrealm, or in sections where calpionellid stratigraphy applies, lies within magnetozone M19n at the levelof 35% of its local thickness. None of the boundaries in the calpionellid zonation coincides precisely withany of those in the palaeomagnetic zonation, but the first appearance datum (FAD) of Calpionellagrandalpina Nagy, indicating the base of the Intermedia Subzone, lies in close proximity to the base ofmagnetozone M19r. The last appearance datum (LAD) for Praetintinnopsella andrusovi Borza in Bed 14Acorresponds approximately to the base of the Kysuca Subzone.
� 2009 Elsevier Ltd. All rights reserved.
1. Introduction
This study is included in a long-term project aiming at thecorrelation of biozones along the Jurassic/Cretaceous (J/K)boundary in the Tethyan and Boreal realms by means of magneticpolarity stratigraphy, which, unlike the biostratigraphic criteria, canbe used for the correlation of chronostratigraphic units amongdiverse faunal realms, since the reversals of the polarity of the maingeomagnetic dipole field are geologically rapid events recorded
* Corresponding author.E-mail addresses: [email protected] (P. Pruner), [email protected] (F. Oloriz),
[email protected], [email protected] (M. Kostak), [email protected] (O. Man),[email protected] (P. Schnabl), [email protected] (D. Venhodova), [email protected] (J.M. Tavera), [email protected] (M. Mazuch).
Contents lists available at ScienceDirect
Cretaceous Research
journal homepage: www.elsevier .com/locate/CretRes
0195-6671/$ – see front matter � 2009 Elsevier Ltd. All rights reserved.doi:10.1016/j.cretres.2009.10.004
Cretaceous Research 31 (2010) 192–206

Author's personal copy
simultaneously in all rocks in the world. Our attention is, therefore,confined to the sections where the geomagnetic polarity horizonscan be precisely detected, allowing testing of the isochroneity ofthe biostratigraphic criteria that are currently in use.
In the last thirty years, magnetostratigraphy has been applied tomany sections embracing the J/K boundary strata in the Tethyan realm(e.g., Ogg and Lowrie, 1986). These studies are, however, typicallyfocussed on the construction of isochronous horizons in a series ofstratigraphic sections rather than on detailed determination ofboundaries in biostratigraphic terms and their correlation withmagnetozones. The J/K boundary has been placed at various levelswithin the range of magnetozones M19 to M17 by different authors.
A synoptic magnetostratigraphic profile for Upper Mesozoicrocks from Tunisia was published by Nairn et al. (1981). Lowrie andChannell (1983) placed the boundary into the lowermost part ofmagnetozone M17 in pelagic limestones of the Maiolica Formationin the Bosso Valley, Italy. Magnetozones detected in this 110-m-thick section were correlated with the M-sequence of marinemagnetic anomalies M19 to M14, or probably M13. The magneto-stratigraphic investigation of the Maiolica and Calcari ad Apticilimestones from the Arcevia, Bosso, Contessa, and Gorgo a Cerbataland sections (Italy) was published by Speranza et al. (2005)including a detailed record of polarity chrons M21 to M14 and M9to M0. Magnetozones M19–M15 were detected in pelagic lime-stones at the localities of Carcabuey and Sierra Gorda in southernSpain by Ogg et al. (1984). A short reverse polarity subzone wasindicated in the normal part of magnetozone M20. MagnetozonesM19–M14 were detected in the Umbrian Maiolica Formation inwhite pelagic limestones at Fonte del Giordano (Cirilli et al., 1984).
After the correlation of magnetostratigraphic data with calpio-nellid zones, Marton (1986) proposed placing the J/K boundaryclose to the base of M17; also Lowrie and Channell (1983), Channelland Grandesso (1987), Channell et al. (1987), and Ogg et al. (1991)contributed to the solution of this problem. Housa et al. (1999)detected magnetozones M20r–M17r in the Brodno section nearZilina and, on the basis of calpionellid zonation, placed the J/Kboundary at approximately the middle of M19n, between M19r andreverse subzone M19n.1r (the Brodno Subzone), a solution whichhas been accepted by Grabowski and Pszczo1kowski (2006), too.The fine structure of polarity zones was completed by the detectionof subzone M20n.1r, too (the Kysuca Subzone). Namely the pres-ence of these subzones makes the pattern of, say, eight polarityzones around the J/K boundary so distinctive that it can be unam-biguously identified against the whole M-sequence of polarityintervals by a mathematical procedure (Man, 2008). To generalizethe obtained results, particularly with respect to equal definition ofcalpionellid zones and their position relative to the detectedmagnetozones, the project was completed by other localities in theTethyan realm, namely: (1) the Bosso Valley, central Italy, Umbria,where the magnetostratigraphy and biostratigraphy were welldocumented (Housa et al., 2004); (2) Rio Argos, Caravaca, Provinceof Murcia, SE Spain (Hoedemaeker et al., 1998) where limestonesthroughout the section were, however, found to be syn-tectonicallyand post-tectonically remagnetized.
This paper presents conclusive results concerning sub-sectionGA-7 located at Puerto Escano, Spain (Fig. 1). This section compliedwith our requirements in three fundamental criteria: (1) litholog-ical succession showing relatively ‘‘continuous’’ sedimentation notinterrupted by marked diastems or hiatuses (i.e., sedimentarydiscontinuities with biostratigraphic relevance); (2) occurrence ofrich fossil assemblages (calpionellids, ammonites) allowinga detailed biostratigraphic division; and (3) rocks evidencingmagnetic properties that are favourable for reliable determinationof palaeomagnetic polarity. The calpionellid assemblages are verywell preserved and highly diversified. The record of their evolution
is practically complete. Boundaries between individual zones andsubzones of calpionellid stratigraphy could, therefore, be veryprecisely determined.
In the Tethyan realm, J/K boundary strata are ususally identified inlimestones lacking ammonites (and other macrofossils) and there-fore interpreted as relatively deep-water deposits. These sections alsoprovide a relatively continuous lithological succession (i.e., hiatusesbeing below biostratigraphic resolution) which is assumed torepresent a sedimentary record with minor incidence of hiatuses,thus, a very suitable condition for obtaining the magnetostratigraphicframework. Stratigraphy of these sections is therefore based onmicrofossils, among which calpionellid assemblages in particularprovide very good possibilities for detailed biostratigraphic subdivi-sion. However, the Puerto Escano sub-section reflects not so deepenvironment with a relatively rich ammonite assemblage, belem-nites, brachiopods, echinoids and less abundant bivalves.
A generally accepted provisional J/K boundary based on cal-pionellids is the base of the Calpionella Standard Zone (Remaneet al., 1986). It was considered to be practically identical to the baseof the ammonite Jacobi Zone. However, the interpretation of the J/Kboundary coinciding with the lower boundary of calpionellid ZoneA and the boundary between the Durangites and Jacobi ammonitezones has been proved wrong in Tethyan areas such as the SubbeticZone and the Majorca Island (Oloriz and Tavera, 1989, 1990; Taveraet al., 1994; Oloriz et al., 1995). In accordance with data given by theauthors mentioned, Tavera et al. (1994) showed that the base ofthe Jacobi Zone at Puerto Escano is somewhat older than the base ofthe Calpionella Zone, which was detected ca. 1 m higher there.Inasmuch ammonites are absent from Brodno and other sites indeeper basinal facies of the Tethys, the J/K boundary in the Tethyanbasinal sediments is defined as the base of the Calpionella StandardZone. The position of this boundary in sections can usually bedetermined precisely (within the range of a few centimetres),mostly lying within a particular bed. In contrast, a precise J/Kboundary determination on the basis of ammonites is possible inmost probably shallower mid-outer shelf and epioceanic deposits(i.e, swells seawards from epicontinental shelves, underlain bycontinental crust) within the Tethyan realm. Ammonite taxastratigraphically significant for the J/K boundary identificationunfortunately occur ‘‘restricted’’ to these settings, whereas calpio-nellid assemblages are widely distributed in mid-outer shelf, epi-oceanic swells and deeper basinal troughs. Thus, looking forenhancig the correlation potential as the most, the provisional J/Kboundary at the base of the Calpionella Standard Zone is favouredas the reference in this research.
2. Geological setting
The upper part of section GA-7, UTM 30SUG449859, investigatedat Puerto Escano, province of Cordoba, approximate coordinates37�27’ N, 4�17’ W, belongs to the External Subbetic, Betic Cordillera,exposed in southeastern Spain (Fig. 1). Palaeogeographically, theExternal Subbetic corresponded to a distal, epioceanic environmentduring the Late Jurassic and the earliest Cretaceous (e.g., Oloriz et al.,2004). The upper Jurassic to lowermost Cretaceous deposits insection GA-7 consist of Ammonitico Rosso and related facies, rangingfrom well-bedded limestones to clayey limestone horizons ofnodular aspect reflecting deposition on distal, epioceanic swell.Although the depositional conditions on raised blocks (swells)commonly resulted in omission/erosion below biostratigraphicresolution (e.g., frequent firmgrounds as identified by Caracuel et al.,2000 in the studied sub-section GA-7), precise biostratigraphy at thebiozone level is available for both ammonites and tintinnoids (Oloriz,1978; Tavera, 1985; Tavera et al., 1994; Caracuel, 1996, Oloriz et al.,2004 and references therein) and, hence, biochronostratigraphic
P. Pruner et al. / Cretaceous Research 31 (2010) 192–206 193

Author's personal copy
correlation with the standard zonation for the Western Tethys (e.g.,Geyssant, 1997).
The studied sub-section is dominated by wackestones showingmicrofacies with variable contents of radiolarians, calcisphaeres,dinoflagellates, planktonic crinoids, unidentifiable foraminifers(planktonic and benthic), organic and hyaline loricated tintinnoids(‘‘chitinoidellids’’ and calpionellids, respectively), ostracodes,cephalopods (ammonitella, and fragments of juvenile and adultammonite shells), and broken molluscs, echinoderms (plates andspines), sponge spicules and pelagic bivalves, among others.Dominant, macroscopic fossil remains are ammonoids, and lessabundant components are belemnites, brachiopods and echinoids.
Burrowing was common and mainly realized through Thalassi-noides- Chondrites- and Planolites-makers (e.g., Caracuel, 1996;Caracuel et al., 2000).
3. Rock magnetism and magnetostratigraphy
Our approach is confronted below with the quality criteriaproposed by Opdyke and Channel (1996). Their list is too long to bereproduced here, but its separate points will be mentioned in thefollowing text. The first of these criteria, requiring the stratigraphicage of the section to be known to the level of the stage, has beensatisfied by the nature of the project. The ninth and the tenth
Fig. 1. A, Geographical location of the area with the studied section (top); inserted map showing the position of section GA-7 at Puerto Escano (geographical coordinates: 37.44�
N;4.28
�W) and roads in the surroundings (bottom): black area for the Betic Cordillera. B, Palaeogeographic sketch for Tithonian - Berriasian as interpreted in Oloriz et al. (2004):
Algarve Shelf [AL-S]; Iberian Shelf-System [IB-SS]; Lusitanian Shelf [Lu-S]; Majorca and related areas [M], except Minorca; Malaguide Complex [Ma]; Nevado-Filabride Complex [Nf];Prebetic Shelf [Pb-S]; Rondaides Complex [Rd]; Subbetic Basin [Sb-B]. Section GA-7 at Puerto Escano [black point]; Epicontiental (AL-S, IB-SS, Lu-S, PB-S) and epioceanic (Sb-B & M)environments [white]; Oceanic environments [shaded].
P. Pruner et al. / Cretaceous Research 31 (2010) 192–206194

Author's personal copy
criteria, however, requiring radiometric dating and multiplesections, respectively, have not been satisfied; radiometric datingcould not be carried out due to the absence of magmatic rocks.
3.1. Sampling
An 8.1-m-thick part of the section embracing upper Tithonianand lower Berriasian sediments was accurately measured andsystematically logged (the second criterion). The beds were labelledwith numbers. Orientated hand samples for magnetic measure-ments were not collected once and for all; instead, we started withrelatively few samples, took the necessary measurements, andconstrained the levels of the expected geomagnetic polarity hori-zons. With the increasing number of samples, these levels and theboundaries between biostratigraphic zones were progressivelydetected with higher precision. The sampling density was,however, limited by the 20 mm size of the cubes used for magneticmeasurements. The above described economic sampling strategyfinally yielded 278 samples. The average sampling interval was30 mm. Taking into account the average deposition rate estimatedin sub-section 3.5, this value corresponds to 8.6 ky in the time scale,classifying our magnetostratigraphic data as high-resolution data.
The uniform bedding-plane orientation of the beds with strikeof 44.1�19.4� and dip angle of 29.2� 6.3� was unfavourable for thesuccessive fold-test applied to the directions of the natural rema-nent magnetization (NRM).
3.2. Laboratory equipment
NRM measurements were carried out using either the spinnermagnetometers JR-5A and JR-6A (AGICO Brno) or Liquid helium-free Superconducting Rock Magnetometer type 755 4 K SRM (2GENTERPRISES). In order to resolve the components of NRM, thelatter equipment used the alternating field demagnetization up to
the peak field of 160 mT, while the former was mostly combinedwith the thermal demagnetization in the field-free space producedby the MAVACS equipment, and seldom with the Mu metal shieldedalternating field demagnetizer LDA-3A (AGICO Brno). The ambientmagnetic field in the cooling chamber of the MAVACS demagne-tizer did not exceed 1 nT owing to a built-in rotating coil magne-tometer controlling the currents in its Helmholtz coil system(Prıhoda et al., 1989). Processing of the output data, including, e.g.,the multicomponent analysis of the demagnetization path, wascarried out by Remasoft 3.0 software (Chadima and Hrouda, 2006).Magnetic susceptibility was measured by the KLY-4 Kappabridge(AGICO Brno) (Jelınek, 1966, 1973).
3.3. Identification of magnetic minerals and significance of the NRMcomponents
According to the sixth criterion of Opdyke and Channel (1996),particular attention should be given to magnetic mineralogy, whichmay constrain the timing of remanence acquisition. The coercivityspectrum of magnetic minerals studied by means of acquisitioncurves of the isothermal remanent magnetization (IRM) providesone possible key to it. Having been obtained for ten pilot samples inmagnetic field progressively increasing up to 2 T, these curvesdemonstrated the presence of magnetite and hematite (seeexamples in Fig. 2). These components, widely differing in theircoercivities, were quantified by the method of Kruiver et al. (2001),which is based on the assumption that the IRM acquisition curve ofa particular mineral can be approximated by a log-normal distri-bution function described by two parameters, of which parameterB1/2 represents the field at which the mineral phase would acquirehalf of its saturation IRM. The application of the Irmunmix V2.2software proved that magnetite, with parameter B1/2 between 8 mTand 12.5 mT, contributed by 70 to 93 % to the bulk IRM curve, whilehematite, with parameter B1/2 between 63 mT and 630 mT,
1 10 100 10000
20
40
60
80
100
IRM
/SIR
M*1
00[%
]
CA21A
1 10 100 1000
Peak field [mT]
0
20
40
60
80
100
CA28B
1 10 100 1000 100000
20
40
60
80
100
C33A2
1 10 100 1000 100000
20
40
60
80
100
C35D2
Peak field [mT]
Peak field [mT] Peak field [mT]
IRM
/SIR
M*1
00[%
]
IRM
/SIR
M*1
00[%
]IR
M/S
IRM
*100
[%]
SIRM=241.7 A/m SIRM=223.2 A/m
SIRM=141.1 A/m SIRM=191.8 A/m
Fig. 2. Examples of IRM acquisition and AF demagnetization curves for limestone samples CA21A (2.14 m), CA28B (4.41 m), C33A2 (5.17 m), CA35D2 (5.55 m).
P. Pruner et al. / Cretaceous Research 31 (2010) 192–206 195

Author's personal copy
contributed by 7 to 30 %. Since the saturation magnetization ofmagnetite is almost thousand times higher than that of hematite, itcan be concluded that, although magnetite is the main NRM carrierin the studied rocks, the rocks contain higher amounts of hematite,likely the authigenic secondary mineral formed during diagenesis.
The third criterion requires complete thermal/AF demagneti-zation of all specimens and analysis of the components of the NRMcarried out using orthogonal projections. An experiment carriedout with several pilot samples proved that the progressive stepwisedemagnetization in 11 or 12 thermal fields gave better results thanthe AF demagnetization (Fig. 3). The former procedure was,
therefore, applied to the majority of samples. Each heating step wasfollowed by the measurements of both the vector of NRM and themagnetic susceptibility. If the symbols Mn and Mt denote the NRMin the natural state and that heated to temperature t and cooled inmagnetic vacuum to the room temperature, respectively, the ratioMt/Mn plotted against temperature t shows the unblockingtemperatures of the NRM carriers. Similarly, the bulk magneticsusceptibility measured after the above heating step plotted againstthe temperature t can detect possible phase changes of mineralsduring the thermal processing. The examples are given in Figs. 4and 5, showing also the demagnetization paths expressed both by
35BCN
E
S
W
N
E
S
W
Up
E
Down
W
Unit = 196 E-6 A/m
0 100 200mT0
0.10.20.30.40.50.60.70.80.9
1
C34H3N
E
S
W
N
E
S
W
Up
E
Down
W
Unit = 778 E-6 A/m
0 10 20 30 40 50 60 70 80 90 100mT
M /Mt n
00.10.20.30.40.50.60.70.80.9
1
a b
M /Mt n
Fig. 3. Results of the progressive AF demagnetization of two limestone samples (a – C34H3 (5.40 m); b – C35BC (7.73 m). The NRM directions are tilt-corrected. Top left,stereographic projection of these directions after each demagnetization step. Solid and open circles represent projections on the lower and upper hemispheres, respectively. Topright, the Zijderveld diagram, showing projections of the demagnetization paths. Projections onto horizontal (XY) and vertical (XZ) planes are marked by solid and open circles,respectively. Bottom left, normalized remanent magnetization depending on the AF intensity.
C34I N
E
S
W
Up
E
Down
W
Unit = 950 E-6 A/m
0 100 200 300 400 500 600°C
M /Mt n
00.10.20.30.40.50.60.70.80.9
1
C33AN
E
S
W
N
E
S
W
Up
E
Down
W
Unit = 724 E-6 A/m
0 100 200 300 400 500 600°C0
0.10.20.30.40.50.60.70.80.9
1
N
E
S
W
a b
0 100 200 300 400 500 600°C
k [E-6 SI]46.4
000 100 200 300 400 500 600°C
k [E-6 SI]21.8
00
M /Mt n
Fig. 4. Results of the progressive thermal demagnetization of two limestone samples (a – C34I (5.42 m); b – C33A (5.17 m) with normal polarity of component C. The NRM directionsare tilt-corrected. Top left, stereographic projections of these directions after each heating step. Top right, the demagnetization path expressed by the Zijderveld diagram. Bottom left,the normalized remanent magnetization Mt=Mn . Bottom right, the bulk magnetic susceptibility depending on the temperature achieved during the previous heating step.
P. Pruner et al. / Cretaceous Research 31 (2010) 192–206196
Author's personal copy
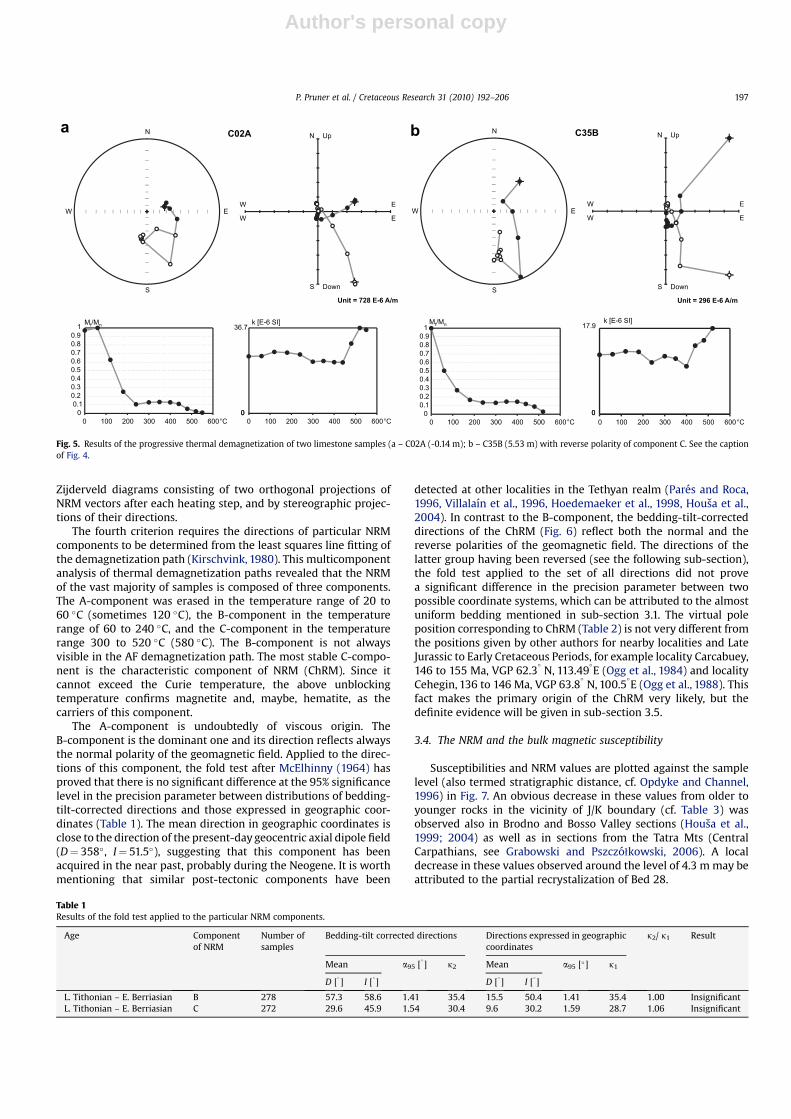
Zijderveld diagrams consisting of two orthogonal projections ofNRM vectors after each heating step, and by stereographic projec-tions of their directions.
The fourth criterion requires the directions of particular NRMcomponents to be determined from the least squares line fitting ofthe demagnetization path (Kirschvink, 1980). This multicomponentanalysis of thermal demagnetization paths revealed that the NRMof the vast majority of samples is composed of three components.The A-component was erased in the temperature range of 20 to60 �C (sometimes 120 �C), the B-component in the temperaturerange of 60 to 240 �C, and the C-component in the temperaturerange 300 to 520 �C (580 �C). The B-component is not alwaysvisible in the AF demagnetization path. The most stable C-compo-nent is the characteristic component of NRM (ChRM). Since itcannot exceed the Curie temperature, the above unblockingtemperature confirms magnetite and, maybe, hematite, as thecarriers of this component.
The A-component is undoubtedly of viscous origin. TheB-component is the dominant one and its direction reflects alwaysthe normal polarity of the geomagnetic field. Applied to the direc-tions of this component, the fold test after McElhinny (1964) hasproved that there is no significant difference at the 95% significancelevel in the precision parameter between distributions of bedding-tilt-corrected directions and those expressed in geographic coor-dinates (Table 1). The mean direction in geographic coordinates isclose to the direction of the present-day geocentric axial dipole field(D¼ 358�, I¼ 51.5�), suggesting that this component has beenacquired in the near past, probably during the Neogene. It is worthmentioning that similar post-tectonic components have been
detected at other localities in the Tethyan realm (Pares and Roca,1996, Villalaın et al., 1996, Hoedemaeker et al., 1998, Housa et al.,2004). In contrast to the B-component, the bedding-tilt-correcteddirections of the ChRM (Fig. 6) reflect both the normal and thereverse polarities of the geomagnetic field. The directions of thelatter group having been reversed (see the following sub-section),the fold test applied to the set of all directions did not provea significant difference in the precision parameter between twopossible coordinate systems, which can be attributed to the almostuniform bedding mentioned in sub-section 3.1. The virtual poleposition corresponding to ChRM (Table 2) is not very different fromthe positions given by other authors for nearby localities and LateJurassic to Early Cretaceous Periods, for example locality Carcabuey,146 to 155 Ma, VGP 62.3
�N, 113.49
�E (Ogg et al., 1984) and locality
Cehegin, 136 to 146 Ma, VGP 63.8�
N, 100.5�E (Ogg et al., 1988). This
fact makes the primary origin of the ChRM very likely, but thedefinite evidence will be given in sub-section 3.5.
3.4. The NRM and the bulk magnetic susceptibility
Susceptibilities and NRM values are plotted against the samplelevel (also termed stratigraphic distance, cf. Opdyke and Channel,1996) in Fig. 7. An obvious decrease in these values from older toyounger rocks in the vicinity of J/K boundary (cf. Table 3) wasobserved also in Brodno and Bosso Valley sections (Housa et al.,1999; 2004) as well as in sections from the Tatra Mts (CentralCarpathians, see Grabowski and Pszczo1kowski, 2006). A localdecrease in these values observed around the level of 4.3 m may beattributed to the partial recrystalization of Bed 28.
C02AN
E
S
W
N
E
S
W
Up
E
Down
W
Unit = 728 E-6 A/m
0 100 200 300 400 500 600°C 0 100 200 300 400 500 600°C
k [E-6 SI]36.7
00
C35BN
E
S
W
N
E
S
W
Up
E
Down
W
Unit = 296 E-6 A/m
0 100 200 300 400 500 600°C0
0.10.20.30.40.50.60.70.80.9
1
a b
0 100 200 300 400 500 600°C
k [E-6 SI]17.9
0000.10.20.30.40.50.60.70.80.9
1M /Mt nM /Mt n
Fig. 5. Results of the progressive thermal demagnetization of two limestone samples (a – C02A (-0.14 m); b – C35B (5.53 m) with reverse polarity of component C. See the captionof Fig. 4.
Table 1Results of the fold test applied to the particular NRM components.
Age Componentof NRM
Number ofsamples
Bedding-tilt corrected directions Directions expressed in geographiccoordinates
k2/ k1 Result
Mean a95 [�] k2 Mean a95 [�] k1
D [�] I [
�] D [
�] I [
�]
L. Tithonian – E. Berriasian B 278 57.3 58.6 1.41 35.4 15.5 50.4 1.41 35.4 1.00 InsignificantL. Tithonian – E. Berriasian C 272 29.6 45.9 1.54 30.4 9.6 30.2 1.59 28.7 1.06 Insignificant
P. Pruner et al. / Cretaceous Research 31 (2010) 192–206 197

Author's personal copy
3.5. Magnetostratigraphy
Magnetostratigraphy is based on the bedding-tilt-correcteddirections of ChRM (herein termed simply ‘directions’, for short),depending on the sample level (Fig. 7). The resolution of geomag-netic polarity zones and their identification against the geomag-netic polarity time scale (GPTS, Gradstein et al., 2004) were carriedout by the MPS program available at http://gli.cas.cz/man (see alsoMan, 2008).
In order to be classified, the directions, regarded as axial vectorsat the beginning, were characterized by a principal axis, i.e., by theeigenvector of the orientation matrix linked with its greatesteigenvalue (cf. Fisher et al., 1987); this approach was recommendedby Opdyke and Channel (1996). The principal axis has, however, twopossible orientations. The orientation D¼ 26�, I¼ 45� has beenregarded as a positive one, since the corresponding VGP (65�N,105�E) was situated on the northern hemisphere, and each directionwas characterized by the cosine of its deflection from the orienta-tion of the principal axis, which is herein termed the discriminantfunction. The set of directions has been partitioned into two basicgroups according to the sign of this function. The hypotheses that inboth groups the mean directions are identical with the respectiveorientations of the principal axis and the deflections from thesemean directions are equally distributed could not be rejected atthe 5% significance level. This result may be taken for the evidencethat the ChRM is really the primary component (the eighth criterion– reversals are antipodal). Moreover the hypothesis that the above
Mean direction
Normal
Reverse
Transient
N
30
60
E
120
150
S
210
240
W
300
033
Fig. 6. Stereographic projections of the bedding-tilt-corrected directions of the ChRM and the classification of these directions. The directions of normal, reverse, and intermediatepolarities are plotted by different symbols.
Table 2VGP position corresponding to ChRM.
Age Location Palaeomagneticpole position
Ovals ofconfidence
Lat. [�] Long. [
�] fp [
�] lp [
�] dm [
�] dp [
�]
L. Tithonian - E. Berriasian 37.45N 4.28W 63.13N 99.26 E 1.3 2.0
P. Pruner et al. / Cretaceous Research 31 (2010) 192–206198

Author's personal copy
Leve
l[m
]
-1 0 1discriminant function
0.0
0.5
1.0
1.5
2.0
2.5
3.0
3.5
4.0
4.5
5.0
5.5
6.0
6.5
7.0
7.5
D [°] I [°]-180 -90 0 90 -90 0 90
0.0
0.5
1.0
1.5
2.0
2.5
3.0
3.5
4.0
4.5
5.0
5.5
6.0
6.5
7.0
7.5
Polarity
144.5
145.0
145.5
146.0
146.5
147.0
GPTS
Age
[Ma]
MM20
n.2n
M20
n.1n
M19
n.2n
M18
rM
18n
M19
rM
20r
0.0
0.5
1.0
1.5
2.0
2.5
3.0
3.5
4.0
4.5
5.0
5.5
6.0
6.5
7.0
7.5
Brod
noKy
suca
-6k [10 SI] M [mA/m]0 20 40 60 80 0 5 10 15
0.0
0.5
1.0
1.5
2.0
2.5
3.0
3.5
4.0
4.5
5.0
5.5
6.0
6.5
7.0
7.5
Fig. 7. Important palaeomagnetic data plotted along the section. From the left: the measured values of both bulk magnetic susceptibility and NRM (denoted by symbols k and M,respectively), the direction of the ChRM, found by the line fitting of the demagnetization path and expressed by declination D and inclination I, and the discriminant function of thisdirection, all plotted against the sample level (or stratigraphic distance). Polarity zones inferred from the discriminant function and expressed by the black (normal) and white(reverse) bar diagram are compared with the corresponding part of the GPTS 2004, against which they have been identified (on the right).
P. Pruner et al. / Cretaceous Research 31 (2010) 192–206 199

Author's personal copy
distribution is Fisherian (Fisher, 1953) with precision parameterk¼ 29 could be rejected. The normal or reverse polarities were,therefore, assigned to the directions within the cones of 95%confidence (whose deflections from the mean direction did notexceed 26.4�), while the directions beyond these limits wereconsidered intermediate (see Fig. 6). This way, 166, 86, and 20directions were classified as normal, reverse, and intermediate,respectively.
In order to enable the conventional classification of our data, thereversal test after McFadden and McElhinny (1990) was applied toboth groups of directions. The results shown in Table 4 are in goodagreement with the previous ones. With gc ¼ 1:9�, the reversaltest must be classified as ‘A’ (as for the definition of angle gc, seeMcFadden and McElhinny, 1990).
The above classification of directions is visible in Fig. 7, too, therange (-1,1) of the discriminant function being partitioned by twovertical lines into three intervals, corresponding (from the left) toreverse, intermediate, and normal polarities, respectively. Havingomitted the intermediate directions, opposite polarities of thesuccessive samples indicated the borders between successivegeomagnetic polarity zones, i.e., the polarity reversal horizons(GPRH). Since we considered the above approach to be superior tothe widely recommended one based on the VGP latitudes, theselatitudes were not included into Fig. 7.
The detected levels of the GPRH are shown in Table 5, asrequired by the fifth criterion of Opdyke and Channel (1996). As thestratigraphic position of the section was inferred from palae-ontology, the detected polarity zones could be easily identifiedagainst the Geomagnetic Polarity Time Scale (GPTS) 2004 redrawnat a proper scale (Fig. 7). This way, GPRH levels were givennumerical ages according to the Geologic Time Scale 2004 (Grad-stein et al., 2004). The striking similarity between the sequence ofpolarity zones and that of polarity intervals leaves no doubts aboutthe completeness of the former sequence and the correctness of theidentification. This similarity, together with the convincing result ofthe reversal test, represents the definite evidence that the charac-teristic component is really the primary one.
In fact, the constraints inferred from palaeontology were notnecessary for the unequivocal identification of polarity zonesagainst the M-sequence of polarity intervals. In order to prove it,a special transform reducing the impact of the variable sedimen-tation rate (Man, 2008, Eq. (1)) was applied to the thicknesses of thepolarity zones. The M-sequence of polarity intervals was trans-formed in a similar way (Man, 2008, Eq. (2)) and the resemblancebetween both sequences shifted relative to each other was assessedby their cross-correlation function. The lag maximizing this func-tion linked the uppermost detected GPRH with the reversal M18r/M18n (Fig. 8). The reliability of this identification was about 99 %
owing to characteristic features of the sequence of the polarityintervals around the J/K boundary, mentioned in Sect. 1, namely tothe existence of short polarity intervals M20n.1r and M19n.1r.
The studied portion of the section included a part of magneto-zone M20r, full magnetozones M20n to M18r and a part of mag-netozone M18n (Fig. 7). A special attention, expressed by samplingdensity, was focused on the detection of two narrow reversesubzones M20n.1r and M19n.1r, named Kysuca Subzone andBrodno Subzone, respectively (Housa et al., 1999). Being situated inthe upper parts of zones M20n and M19n, they are only 40 and90 mm thick, respectively (Figs. 9 and 10). Previously detected inthe Brodno and Bosso Valley sections (Housa et al., 1999; 2004), andin the Tatra Mts. (Grabowski and Pszczo1kowski, 2006), thesesubzones were correlated with the distribution of calpionellid taxa.Like with the Brodno and Bosso Valley sections, the thickness of thedetected polarity zone M20n.1r was much smaller than the thick-ness of 14 cm deduced from the average sedimentation rate and thelength of the polarity interval given by the GPTS 2004. A possibleexplanation is that the latter has been overestimated.
Using a substantial part of Table 5, the time-dependent sectionthickness was expressed by a smoothing spline, whose derivativeshowed the smoothed sedimentation rate ranging from 1 to 5 mm/ky(Fig. 11). Regarding this sedimentation rate as a stationary Gaussianrandom process, its parameters were estimated by the maximumlikelihood method as follows: mean 2.87 mm/ky, standard deviation1.17 mm/ky. These values are in general agreement with thoseexpected for pelagic sediments (cf. Butler, 1991, p. 191). Whencombined with the smoothed sedimentation rate, Table 5 confirmsthat the duration of some polarity reversals does not exceed 3.5 ky.
4. Biostratigraphy
4.1. Biozonation based on tintinnoids
From the basal part of the sub-section (i.e., Beds 5–13, Fig. 12)the registered assemblage of tintinnoids consists of speciesbelonging to the Deflandronellidea family Chitinoidellidae [Long-icollaria dobeni (Borza) (Beds 5–11) and Chitinoidella boneti Doben(Beds 7–13)] and clearly proves the presence of the ChitinoidellaZone, as previously identified in the area as well as in more or lessdistant Tethyan sections (e.g., Oloriz and Tavera, 1981, 1989; Ben-zaggagh and Atrops, 1995; Oloriz et al., 1995; Caracuel 1996;Rehakova 2000a,b; 2002; Zeiss, 2001; Housa et al. 1999, 2004).Longicollaria dobeni has been recorded from the base of the sub-section (from Bed 5): from the topmost part of the M20r and basalpart of the M20n magnetic zones. Tintinnoid diversity is very low inthe interval between Bed 5 and Bed 11, and only Chitinoidellaspecies occur in this part of sub-section. The combined record ofthe single occurrence (LAD) of Borziella slovenica (Borza) in Bed 5and the FAD of Chitinoidella boneti in Bed 7 support the interpre-tation of the Longicollaria dobeni/Chitinoidella boneti Subzonesboundary at the top of Bed 6.
Table 3Natural remanent magnetization and bulk magnetic susceptibility.
Age Numberof samples
NRM [10-6A/m] Bulk magneticsusceptibility [10-6 SI]
Mean value Standarddeviation
Mean value Standarddeviation
Late Tithonian 157 8281 3190 35.3 12.0Early Berriasian 121 3937 1640 22.0 8.0
Table 4The reversal test.
Polarity Number of samples Mean direction k a95 [�]
D [�] I [�]
Normal 166 26.8 44.9 33.8 1.9Reverse 86 205.5 �46.1 35.7 2.5
Table 5The GPRH levels and their identification against the GPTS.
GPRH level [m] Reversal Age in Ma (GPTS 2004)
0.105� 0.015 M20r/ M20n.2 n 147.161.530� 0.005 M20n.2 n/M20n.1r 146.521.570� 0.005 M20n.1r/ M20n.1n 146.472.580� 0.020 M20n.1n/M19r 146.163.180� 0.010 M19r/M19n.2n 145.955.495� 0.015 M19n.2 n/M19n.1r 145.065.585� 0.015 M19n.1r/M19n.1 n 144.995.705� 0.005 M19n.1 n/M18r 144.886.960� 0.010 M18r/M18n 144.57
P. Pruner et al. / Cretaceous Research 31 (2010) 192–206200

Author's personal copy
Middle to upper parts of Bed 11 show a higher diversity of tin-tinnoids, including the FAD of Semichitinoidellidea (Semi-chitinoidellidae). The first appearance datum (FAD) of theSemichitinoidellidae Praetintinnopsella andrusovi Borza in Bed 11defines the base of the Praetintinnopsella Zone, located in themiddle part of the M20n magnetic zone, and the last appearance
(LAD) was recorded just below the reverse Kysuca Subzone(M20n.1r) – i.e., the upper part of Bed 15 at Puerto Escano. The FADof P. andrusovi at Puerto Escano is in accordance with that in theBrodno section in Slovakia (Housa et al., 1999; Rehakova 2000b). Inthe Bosso Valley section in Italy, however, P. andrusovi appears later– in the upper but not the uppermost part of the M20n magnetic
190
200
210
220
230
240
250
260
270
280
290
300
310
320
330
340
350
360
370
380
Rev
ersa
lnum
ber
-5 -4 -3 -2 -1 0 1 2 3 4Transformed polarity intervals
-5 -4 -3 -2 -1 0 1 2 3Transformed polarity zones
-1 0 1Cross-correlation function
M18r/M18n
Fig. 8. Identification of the detected polarity zones against the M-sequence of polarity intervals. The thicknesses of polarity zones were replaced by the differences of theirlogarithms, and the lengths of polarity intervals were transformed in a similar way. The resemblance of these two sequences, having been shifted against each other, is expressed bythe cross-correlation function, whose maximum identifies the former sequence against the latter.
-6k [10 SI] M [mA/m] D [ ]° I [ ]°0 20 40 60 80
1.4
1.5
1.6
1.7
Thic
knes
s[m
]
0 5 10 15 -180 -90 0 90
1.4
1.5
1.6
1.7
-90 0 90 -1 0 1discriminant function
1.4
1.5
1.6
1.7
1.4
1.5
1.6
1.7
Polarity
MM20
n.2n
M20
n.1n
Kysuca
Fig. 9. A part of Fig. 7 that includes the Kysuca Subzone (M20 n.1r) redrawn at a more detailed scale. See the caption of Fig. 7.
P. Pruner et al. / Cretaceous Research 31 (2010) 192–206 201

Author's personal copy
zone (i.e., about 4 m above the Kysuca Subzone M20n.1r, Housaet al., 2004 – see below). In the studied sub-section GA-7, the baseof the Praetintinnopsella Zone coincides with the FAD of Calpio-nellidae – i.e., Calpionella species (Calpionella sp A and B; Housaet al., 2004), which are morphologically closely related to the largeBerriasian form of Calpionella alpina Lorenz. However, their strati-graphic range at Puerto Escano is limited to the interval betweenBeds 11 and 16, and 11 and 20, respectively. In west-Tethyan areas,the FAD of scarce calpionellids together with a variable record ofthe youngest Chitinoidella have been previously interpreted as thelowermost part of the Crassicollaria Zone (e.g., Oloriz et al., 1995),even below the FAD of Tintinnopsella remanei Borza (e.g., Benzag-gagh and Atrops, 1995), and referred to the standard RemaneiSubzone or to a slightly older horizon where the index species isscarce.
The first Tintinnopsella (Tintinnopsella remanei and T. carpathica(Murgeanu et Filipescu)) appears in Bed 14. The Praetintinnopsella/
Crassicollaria zonal boundary is placed at the FAD of T. carpathica(Remane et al., 1986) – i.e. 15 cm below the base of the reverseKysuca Subzone (M20n.1r). This occurrence corresponds to thesituation in the Brodno section (Housa et al., 1999). In the BossoValley, the major part of the M20n including the M20n.1r KysucaSubzone does not contain any relevant calpionellid record (seeHousa et al., 2004, fig. 9) and the stratigraphic position is indicatedby the presence of cysts of calcareous dinoflagellates. The rangezone of Tintinnopsella remanei at Puerto Escano was recorded fromBed 14 (base of the Crassicollaria Zone) to the lower part of the Bed22 (lower part of the Crassicollaria Zone). The base of the RemaneiSubzone was established at the FAD of Tintinnopsella remanei andT. carpathica.
The reported records from the nearby Tethyan areas indicate analternative record of Tintinnopsella remanei below the FAD ofCrassicollaria intermedia (Morocco, Benzaggagh and Atrops, 1995)or their co-occurrence (Majorca Island, Oloriz et al., 1995). It seems
-6k [10 SI] M [mA/m] D [ ]° I [ ]° Polarity0 20 40 60 80 0 5 10 15 -180 -90 0 90 -90 0 90 -1 0 1
discriminant function
5.3
5.4
5.5
5.6
Thic
knes
s[m
]
5.3
5.4
5.5
5.6
5.3
5.4
5.5
5.6
5.3
5.4
5.5
5.6
MM19
n.2n
Brodno
M19
n.1n
Fig. 10. A part of Fig. 7 that includes the Brodno Subzone (M19 n.1r) redrawn at a more detailed scale. See the caption of Fig. 7.
M20r/M20n.2n
M20n.1r/M20n.1n
M20n.1n/M19r
M19r/M19n.2n
M19n.2n/M19n.1rM19n.1n/M18r
M18r/M18n
-147 -146 -145
Age [Ma]
0
1
2
3
4
5
6
Thic
knes
s[m
]
1.0
1.5
2.0
2.5
3.0
3.5
4.0
4.5
Sedi
men
tatio
nra
te[m
m/k
y]
Fig. 11. The thickness of the section plotted against the age according to Table 5 (squares) and interpolated by a smoothing spline (full line). The reversal of M20 n.1r/M20 n.1 n wasomitted because the length of polarity interval M20 n.1r given by the GPTS 2004 was likely overestimated. The derivative of the spline function (dashed line) represents thesmoothed sedimentation rate.
P. Pruner et al. / Cretaceous Research 31 (2010) 192–206202

Author's personal copy
Thick-
ness
[m]
Polarity Tintinnoid distributionAmmonite
zonation
No.
of
Beds
Litology se
no
Z
se
no
zb
uS
iena
mer
allesponnitni
T
aci
htaprac
allesponnitni
T
aide
mretni
airall
ocissarC
ivosurdna
allesponnitnitearP
dille noiplacA B
dillenoiplac
airall
oci
gnoL
inebod
alleizroB
aci
nevols
itenob
alledi
oniti
hC
massutiniana
airall
ocissarC
siverb
aira ll
ocissarC
aluvrap
airall
ocissarC
imol
oc
airall
ocissarC
ani
pla
allenoi
plaC
ani
pladnarg
allenoi
plaC
allenoi
plaC
. pss
ani
platpill
eall
enoi
plaC
simrohpil
od
allesponitni
T
inisaref
allei
na
meR
zb
Si
ne
bo
da
ir
al
lo
ci
gn
oL
zb
Si
te
no
Bz
bS
ie
na
me
R
en
oZ
ib
oc
aJ
en
oZ
se
ti
gn
ar
uD
en
oZ
su
ir
oti
sn
ar
T
en
oZ
se
tc
ni
hp
sil
pm
iS
en
oZ
al
le
no
ip
la
Ce
no
Za
ll
ed
io
ni
ti
hC
al
le
sp
on
ni
tn
it
ea
rP
en
oZ
en
oZ
ai
ra
ll
oc
is
sa
rC
ZA
PC
?Z
AA
C
5
6A
6
7
8
9
10
11
12
13
14-0
14
14A
15
16
17-0
17
1819-0
19
20-0
20
21
22
23-1
23-2
23-3
23-4
23-5
24
25-1
25-2
26-1
26-2
26-3
27
28
29
30
31
32
35
36
37
38
39
40
41
42
33
A
B
C
34
A
B
C
0.0
0.5
1.0
1.5
2.0
2.5
3.0
3.5
4.0
4.5
5.0
5.5
6.0
6.5
7.0
7.5
r8
1M
n8
1M
n9
1M
M19n
r9
1M
n0
2M
n0
2M
r0
2M
M19n1r
on
do
rB
ac
us
yK
zb
Sai
de
mr
et
nI
limestone
altered limestone
marlstone
-i
td
ra
hk
cr
uB
en
oZ
sa
re
c
zb
Ss
im
ro
hp
il
oD
Fig. 12. Lithostratigraphy and biostratigraphy (calpionellid and ammonite data) plotted together with the detected polarity zones. Note: Bed numbers in intervals 5-21 and 30-42are newly re-numbered in more detail. CAAZ - Calpionella alpina ‘‘acme zone’’ (¼epibole), ?CPAZ - Crassicollaria parvula ‘‘acme zone’’ (¼ potential epibole). Black dots – abundantspecimens, null dots – rare occurrences.
P. Pruner et al. / Cretaceous Research 31 (2010) 192–206 203

Author's personal copy
that the range of Tintinnopsella remanei Subzone in the studiedPuerto Escano sub-section reveals an intermediate case, the rele-vance of which will deserve attention in the future.
Crassicollaria intermedia (Durang Delga) first appears in Bed 16(LAD in Bed 26-2) in the middle part of the M20n, about 5 cm abovethe M20n.1r Kysuca Subzone and indicates the base of the Crassi-collaria Zone. Its FAD is therefore identical with that registered atBosso Valley and Brodno (Housa et al. 1999; 2004). The LAD ofCrassicollaria intermedia was registered in Bed 26-2 and, therefore,the identification of the Subzone (Intermedia Subzone) is conclu-sively supported for Puerto Escano as well (see also Oloriz in Taveraet al., 1994, p. 474; Caracuel, 1996). The base of the Crassicollariaintermedia Subzone is defined by the FAD of Calpionella grandalpinain the upper part of Bed 22. The same interpretation was adoptedby Oloriz et al. (1995) using the FAD of medium- to large-sizedC. alpina in the relatively close Majorca Island.
The increase in calpionellid diversity was registered from Bed 22(uppermost part of the M20n), and culminated between Bed 23-5(upper part of the M19r) and the lower part of Bed 26-2. Thisassemblage consists of Crassicollaria, Calpionella and minor Tintin-nopsella (see Fig. 12). A decrease in calpionellid diversity was foundbetween Beds 26-3 and 27 (middle part of the M19 n). Beds 22 to26-3 are characterized by the typical Tithonian Crassicollariaassemblage (e.g., Crassicollaria massutiniana (Colom), C. brevis andC. intermedia), as recognized by Tavera et al., (1994, p. 474; Fig. 2a-b)for the same sub-section GA-7.
The J/K boundary sensu Remane et al. (1986), Oloriz and Tavera(1989, 1990), Oloriz in Tavera et al. (1994), Oloriz et al. (1995) andHousa et al. (1999, 2004) was defined by the mass occurrence ofsmaller globular (spherical) Calpionella alpina. Cecca et al. (1989)used the same C. alpina explosion level as the base of Zone B toidentify the Tithonian/Berriasian boundary, but they proposed itscorrelation with ammonite horizons older than established in theGA-7 sub-section investigated at Puerto Escano (to compare withTavera et al., 1994). In the Puerto Escano sub-section, the base of theCalpionella Zone falls within Bed 28 (the second option for estab-lishing the J/K boundary noted in Tavera et al., 1994, p. 474). Theboundary between the Crassicollaria and Calpionella Zones at PuertoEscano therefore lies inside the Bed 28, approximately in the middleof the M19n magnetic zone. Abundant occurrence of C. alpina(relative frequency of C. alpina reaches more than 80-90%, beingTintinnopsella carpathica and Crassicollaria parvula the remainingrecord of calpionellid) is recorded at the base of the Calpionella zone.On the assumption of its relative isochrony, the mass occurrence ofC. alpina at the base of the Calpionella Zone should be considered asindicating the epibole for this species. It can be correlated with otherTethyan sections: Brodno and Bosso Valley (Housa et al. 1999, 2004)and the relatively close Majorca Island (e.g., Oloriz et al., 1995),although the recorded abundance may vary in the nearby Tethyanareas (Caracuel, 1996). Another important bioevent, the abundantoccurrence of Crassicollaria parvula Remane (above the C. alpinaacme, Bed 31) has been also recorded in the Brodno and Bosso Valleysections. However, in these sections, the C. parvula acme lies insomewhat younger sediments, most probably revealing local acmes(potential), but see Oloriz et al. (1995) for allusion to depositionaldynamics in analogous situations.
Calpionellid taxonomic diversity recorded at the Bed 27 (Fig. 12)decreased rapidly at the base of Bed 28. Through the J/K boundaryinterval, calpionellids show a less diversified and monotonousassemblage of Tintinnopsella carpathica, Crassicollaria parvula andCalpionella alpina. No calpionellid bioevents were observed eitherin the M19n.1r Brodno Subzone or at the boundary of the M19n/M18r zones. Tintinnopsella doliphormis (Colom) was first registeredin the uppermost part of Bed 39 (upper part of the M18r zone). Thisspecies is supposed to be a phyletic ancestor of Remaniella ferasini
(Catalano), which appears in the youngest part of the measuredsub-section – i.e. in Bed 42 (lower part of the M18n). Stratigraphicoccurrences of these species are also in accordance with otherTethyan sections in relatively nearby areas, rather indicating theupper part of the Doliformis interval (e.g., Oloriz et al., 1995) withinthe lower Remaniella Subzone.
4.2. Ammonite zonation
The ammonite assemblages collected from bottom to top in thestudied GA-7 sub-section at Puerto Escano allow to identify thefollowing biozones (Fig. 12). Only ammonites relevant to biostra-tigraphy are cited:
Burckhardticeras Zone (Beds up to 5): Burckhardticeras peroni(Roman), B. sp., Kutekiceras pseudocolubrinus (Kilian), Lemencia sp.cf. pseudociliata Oloriz, L. sp. cf. pergrata (Schneid), L. sp. cf. patula(Schneid), Aulacosphinctes sulcatus Tavera, Simoceras (Simoceras)volanense (Oppel), S. (S.) sp. gr. volanense (Oppel), Cordubicerasmaius Tavera, Haploceras (Hyppolissoceras) sp. cf. rhinotonum(Zittel), H. (H.) sp. cf. cristifer (Zittel).
Simplisphinctes Zone (Beds 6 to 7¼ 20 cm): Oloriziceras magnumTavera, O. salariensis Tavera, O. sp. cf. checai Tavera, Simplisphinctessp. cf. rivasi Tavera, S. sp., Micracanthoceras (Micracanthoceras) sp.gr. radians-flexuosum Tavera, Micracanthoceras (Corongoceras) sp.juv., Cordubiceras sp.
Transitorius Zone (Beds 8 to 21): Paraulacosphinctes transitorius(Oppel), P. senex (Oppel), P. senoides Tavera, P. algariensis Tavera, P.zakharovi Tavera, P. complanatus Tavera, P. sp. cf. exigus Tavera, P. sp.cf. compressus Tavera, P. sp. cf. validus Tavera, P. sp. cf. elegans Tavera,P. sp., Moravisphinctes moravicus (Oppel), M. fischeri (Kilian), M. sp.cf. tenuis Tavera, Andalusphinctes sp. cf. fontannesi Tavera, A. sp.,Aulacosphinctes sulcatus Tavera, A. sp., Tithopeltoceras haranensisOloriz and Tavera, Micracanthoceras (Micracanthoceras) micro-canthum Oppel, M. (M.) sp., ‘‘Corongoceras’’ sp. cf. hexagonus Tavera.
Durangites Zone (Beds 22 to 25-1): Paraulacosphinctes senoidesTavera, P. senex (Oppel), Protacanthodiscus andreaei (Kilian),P. nodosus Tavera, P. heterocosmus (Canavari), P. sp. cf. coronatusTavera, P. darwini Tavera, P. sp. cf. coronatus Tavera, P. sp. 1 gr.andreaei (Kilian in Tavera, 1985), Durangites vulgaris Burckhardt,D. acanthicus (Burckhardt), D. heilprini (Aguilera), D. gigantis Tavera,D. astillerensis Imlay, D. sp. cf. apertus Tavera, D. singularis Tavera,D. sutneroides Tavera, D. sp. cf. heilprini (Aguilera), D. sp. cf. acan-thicus Burckhardt, Neoperisphinctes falloti (Kilian) and N. nexusTavera, Berriasella (Berriasella) tithonica Tavera, Proniceras sp. gr.simile Spath, Aspidoceras sp. gr, taverai Checa.
Jacobi Zone (Beds 25-1 to 42): Protacanthodiscus heterocosmus(Canavari), P. berriasensis (Tavera), Durangites sutneroides Tavera,D. sp. cf. apertus Tavera, ‘‘Corongoceras’’ sp. cf. kollikeri (Oppel),Berriasella (Berriasella) chomeracensis (Toucas), B. (B.) moretiMazenot, B. (B.) sabatasi Le Hegarat, B. (B.) jacobi Mazenot, B. (B.)subcallisto (Toucas), B. (B.) aurousei (Le Hegarat), B. (B.) sp. cf. oxy-costata (Jacob) B. (B.) sp. cf. elmii (Le Hegarat), B. (B.) sp. cf. oppeli(Kilian), B. (B.) sp. cf. mazenoti Breistroffer, B. (B.) sp. cf. berthei(Toucas), Elenaella cularensis (Mazenot), Malbosiceras chaperi (Pic-tet), M. tarini (Kilian), Fauriella floquinensis Le Hegarat, Jabronellacompanyi Tavera, J. subbetica Tavera, Tirnovella sp. cf. allobrogensis(Mazenot), Dalmasiceras sayniforme Tavera, D. subloevis Mazenot, D.progenitor (Oppel), D. sp. cf. praecox (Jacob), D. sp. cf. toucasiMazenot, ‘‘Corongoceras’’ sp. gr. kollikeri (Oppel), Proniceras sp. aff.scorpionum Imlay, Negreliceras sp. cf. negreli (Matheron).
5. Conclusions
Section GA-7, located at Puerto Escano, Spain, is formed bylimestones of epioceanic origin rich in fossils like calpionellids and
P. Pruner et al. / Cretaceous Research 31 (2010) 192–206204

Author's personal copy
ammonites. Magnetostratigraphic studies were applied to an 8.1-m-thick part of the section embracing upper Tithonian and lowerBerriasian strata, the average sampling interval was 30 mm.
The analysis of the IRM acquisition curves proved magnetite tobe the main carrier of the NRM and hematite to be themost abundant magnetic mineral. As a rule, the progressivethermal demagnetization revealed three NRM components.Magnetostratigraphy was based on the directions of the most stablecomponent, whose unblocking temperature varied from 300 to520 �C or, possibly, to 580 �C. Due to only slightly varying strike anddip of the beds, the fold test applied to this component did not giveconvincing results. In contrast, the reversal test received the bestclassification ‘A’.
The detected polarity zones could be unequivocally identifiedagainst the M-sequence of polarity intervals drawn from the GPTS2004. This fact, together with the results of the reversal test,confirmed the ChRM to be the primary component. The sampledpart of the section included a part of magnetozone M20r, fullmagnetozones M20n to M18r and a part of magnetozone M18n(Fig. 7). A special attention was paid to two reverse subzonesM20n.1r and M19n.1r, named Kysuca Subzone and Brodno Subzone,with thicknesses only 40 and 90 mm, respectively. Their presenceenabled easy identification of the detected polarity zones. Thesmoothed sedimentation rate has been deduced to vary from 1 to5 mm/ky.
This study satisfied at least seven of the ten quality criteriaconsidered by Opdyke and Channel (1996); the high density ofsampling of the section and high data quality confirmed by theclassification of the reversal test are its extraordinary features. TheJ/K boundary defined by mass occurrence of Calpionella alpina liesapproximately in the middle part of the M19n magnetozone. Theboundary between Durangites and Jacobi Zones is located below thetop of the Intermedia Subzone, inside the Crassicollaria Zone - i.e.above the base of the M19n.
Acknowledgements
This research honors the memory of Vaclav Housa, anoutstanding Czech geologist and paleontologist and our friend whohad encouraged this collaboration for several years but could finishneither his valuable contribution nor related projects for the nearfuture.
We are grateful to Dr. Jacek Grabowski and Prof. AndrzejPszczo1kowski for their scientific reviews and constructivecomments. We thank Dr. J. Adamovic for his review and improvingour English. We also gratefully acknowledge the Grant Agency ofthe Czech Republic for financial support (Grant No.GACR 205-07-1365), MSM 0021620855 and Research Plan of the IG AS CR No. CEZAV0Z30130516, and facilities from the EMMI Group (RNM-178, J.A.)and Project CGL2005-01316 MICINN, Spain.
References
Benzaggagh, M., Atrops, F., 1995. Les zones a Chitinoidella et a Crassicollaria(Tithonien) dans la partie interne du Prefrif(Maroc). Donnees nouvelles etcorrelation avec les zones d’ammonites. Compte Rendue de l’Academie desSciences Paris 320, Serie Iia, 227–320.
Butler, R.F., 1991. Paleomagnetism: magnetic domains to geologic terranes. BostonBlackwell Scientific Publications, Cambridge, Massachusetts, 319 pp.
Caracuel, J., 1996. Asociaciones de megainvertebrados, Evolucion ecosedimentaria eInterpretaciones ecoestratigraficas en umbrales epioceanicos del Tethys occi-dental (Jurasico superior). PhD Thesis, Universidad de Granada, 475pp.
Caracuel, J., Monaco, P., Oloriz, F., 2000. Taphonomic tools to evaluate sedi-mentation rates and stratigraphic completeness in Rosso Ammonitico Facies(epioceanic Tethyan Jurassic). Rivista Italiana di Paleontologia e Stratigrafia106 (3), 353–368.
Cecca, F., Enay, R., Le Hegarat, G., 1989. L’Ardescien (Tithonique Superieur) de laregion stratotypique: Series de reference et faunes (ammonites, calpionelles) de
la Bordure Ardechoise. Documents des Laboratoires de Geologie Lyon, Sciencesde la Terre. Universite Claude-Bernard, Lyon 1 107. 1–115.
Chadima, M., Hrouda, F., 2006. Remasoft 3.0-A user-friendly paleomagnetic databrowser and analyzer. Travaux Geophysiques XXXVIII, 20–21.
Channell, J.E.T., Bralower, T.J., Grandesso, P., 1987. Biostratigraphic correlation ofMesozoic polarity chrons CM1 to CM23 at Capriolo and Xausa (Southern Alps,Italy). Earth and Planetary Science Letters 85, 203–221.
Channell, J.E.T., Grandesso, P., 1987. A revised correlation of Mesozoic polaritychrons and calpionellid zones. Earth and Planetary Science Letters 85,222–240.
Cirilli, S., Marton, P., Vigli, L., 1984. Implications of a combined biostratigraphic andpalaeomagnetic study of the Umbrian Maiolica Formation. Earth and PlanetaryScience Letters 69, 203–214.
Fisher, R., 1953. Dispersion on a sphere. Proceedings of the Royal Society A 217,295–305.
Fisher, N.I., Lewis, T., Embleton, B.J.J., 1987. Statistical analysis of spherical data.Cambridge University Press, Cambridge, 329 pp.
Geyssant, J., 1997. Tithonien. In: Cariou, E., Hantzpergue, P. (Eds.), Biostratigraphy duJurassique ouest-europeen et mediterraneen: Zonations paralleles et distribu-tion des invertebres et microfossiles. Bulletin Centre Recherches Elf ExplorationProduction, 17. Memoire, pp. 97–102.
Grabowski, J., Pszczo1kowski, A., 2006. Magneto- and biostratigraphy of the Titho-nian-Berriasian pelagic sediments in the Tatra Mountains (central WesternCarpathians, Poland): sedimentary and rock magnetic changes at the Jurassic/Cretaceous boundary. Cretaceouc Research 27, 398–417.
Gradstein, F.M., Ogg, J.G., Smith, A.G. (Eds.), 2004. A gelogic Time Scale 2004.Cambridge University Press, Cambridge, U.K., p. 589.
Hoedemaeker, P.J., Krs, M., Man, O., Pares, J.M., Pruner, P., Venhodova, D., 1998. TheNeogene remagnetization and petromagnetic study of the Early Cretaceouslimestone beds from the Rıo Argos, (Caravaca, Province Murcia, SE Spain).Geologica Carpathica 49, 15–32.
Housa, V., Krs, M., Krsova, M., Man, O., Pruner, P., Venhodova, D., 1999. High-reso-lution magnetostratigraphy and micropaleontology across the J/K boundarystrata at Brodno near Zilina, western Slovakia: summary results. CretaceousResearch 20, 699–717.
Housa, V., Krs, M., Man, O., Pruner, P., Venhodova, D., Cecca, F., Nardi, G.,Piscitello, M., 2004. Combined magnetostratigraphic, paleomagnetic and cal-pionellid investigations across Jurassic/Cretaceous boundary strata in the BossoValley, Umbria, central Italy. Cretaceous Research 25, 771–785.
Jelınek, V., 1966. A high sensitivity spinner magnetometer. Studia Geophysica atGeodaetica 10, 58–78.
Jelınek, V., 1973. Precision A.C. bridge set for measuring magnetic susceptibility andits anisotropy. Studia Geophysica at Geodaetica 17, 36–48.
Kirschvink, J.L., 1980. The least-squares line and plane and the analysis of palae-omagnetic data. Geophysical Journal of the Royal Astronomical Society 62,699–718.
Kruiver, P.P., Dekkers, M.J., Heslop, D., 2001. Quantification of magnetic coercivitycomponents by the analysis of acquisition curves of isothermal remanentmagnetisation. Earth and Planetary Science Letters 189, 269–276.
Lowrie, W., Channell, J.E.T., 1983. Magnetostratigraphy of the Jurassic–Cretaceousboundary in the Maiolica Limestone (Umbria, Italy). Geology 12, 44–47.
Man, O., 2008. On the identification of magnetistratigraphic polarity zones. StudiaGeophysica at Geodaetica 52, 173–186.
Marton, E., 1986. The problems of correlation between magnetozones and calpio-nellid zones in Late Jurassic–Early Cretaceous sections. Acta Geologica Hun-garica 29, 125–131.
McElhinny, M.W., 1964. Statistical significance of the fold test in palaeomagnetism.Geophysical Journal of the Royal Astronomical Society. 8, 338–340.
McFadden, P.L., McElhinny, M.W., 1990. Classification of the reversal test in palae-omagnetism. Geophysical Journal International 103, 725–729.
Nairn, A.E.M., Schmitt, T.J., Smithwick, M.E., 1981. A palaeomagnetic study of theupper Mesozoic succesion in northern Tunisia. Geophysical Journal of the RoyalAstronomical Society 65, 1–18.
Ogg, J.G., Hasenyager, R.W., Wimbledon, W.A., Channell, J.E.T., Bralower, T.J., 1991.Magnetostratigraphy of the Jurassic-Cretaceous boundary interval e Tethyanand English faunal realms. Cretaceous Research 12, 455–482.
Ogg, J.G., Lowrie, W., 1986. Magnetostratigraphy of the Jurassic/ Cretaceousboundary. Geology 14, 547–550.
Ogg, J., Steiner, M.B., Company, M., Tavera, J.M., 1988. Magnetostratigraphyacross the Barriasian-Valanginian stage boundary (Early Cretaceous), atCehegin (Murcia Province, southern Spain). Earth Planet Science Letters 87,204–215.
Ogg, J.G., Steiner, M.B., Oloriz, F., Tavera, J.M., 1984. Jurassic magnetostratigraphy, 1.Kimmeridgian–Tithonian of Sierra Gorda and Carcabuey, southern Spain. EarthPlanet Science Letters 71, 147–162.
Oloriz, F., 1978. Kimmeridgiense-Tithonico inferior en el sector central de lasCordilleras Beticas (Zona Subbetica). Paleontologıa. Bioestratigrafia. Tesis Doc-torales Universidad de Granada no 84, v. I-II: 758 pp.
Oloriz, F., Reolid, M., Rodrıguez-Tovar, F.J., 2004. Microboring and taphonomy inMiddle Oxfordian to lowermost Kimmeridgian (Upper Jurassic) from the PrebeticZone (southern Iberia). Palaeogeography, Palaeoclimatology, Palaeoecology 212,181–197.
Oloriz, F., Tavera, J.M., 1981. El Jurasico superior en el sector central de la ZonaSubbetica. Programa Internacional de Correlacion Geologica. Real Academia deCiencias Fısicas y Naturales, Madrid. 207–239.
P. Pruner et al. / Cretaceous Research 31 (2010) 192–206 205

Author's personal copy
Oloriz, F., Tavera, J.M.,1989. The significance of Mediterranean ammonites with regardto the traditional Jurassic-Cretaceous boundary. Cretaceous Research 10, 221–237.
Oloriz, F., Tavera, J.M., 1990. The Jurassic-Cretaceous boundary in Southern Spain.Some eco-stratigraphical considerations. Transactions Institute of Geology andGeophysics, 699. Siberian Branch of the Academy of Sciences, CCCP (USSR),Hayka (Nauka), Mockba (Moscow). 64–77.
Oloriz, F., Caracuel, J.E., Marques, B., Rodrıguez-Tovar, F.J., 1995. Asociaciones deTintinnoides en facies ammonitico rosso de la Sierra Norte (Mallorca). RevistaEspanola de Paleontologıa, 77–93. No Extra Homenaje al Dr. Guillermo Colom.
Opdyke, N.D., Channel, J.E.T., 1996. Magnetic stratigraphy. Academic Press, NewYork, 346 pp.
Pares, J.M., Roca, E., 1996. The significance of tectonic-related Tertiary remagneti-zation along the margins of the Valencia trough. Journal of Geodynamics 22,207–227.
Prıhoda, K., Krs, M., Pesina, B., Blaha, J., 1989. MAVACS – a new system creatinga nonmagnetic environment for palaeomagnetic studies. In: Banda, E. (Ed.),Paleomagnetismo – palaeomagnetism. CSIC, Madrid, pp. 223–250. 1988–1989,Cuadernos de Geologia Iberica.
Rehakova, D., 2000a. Evolution and distribution of the Late Jurassic and EarlyCretaceous calcareous dinoflagellates recorded in the Western Carpathianpelagic carbonate facies. Mineralia Slovaca 32, 79–88.
Rehakova, D., 2000b. Calcareous dinoflagellate and calpionellid bioevents versussea-level fluctuations recorded in the West Carpathian (Late Jurassic/EarlyCretaceous) pelagic environments. Geologica Carpathica 51, 229–243.
Rehakova, D., 2002. Chitinoidella Trejo, 1975 in Middle Tithonian carbonate pelagicsequences of the West Carpathian Tethyan area. Geoogica Carpathica 53 (6)396–379.
Remane, J., Bakalova-Ivanova, D., Borza, K., Knauer, J., Nagy, I., Pop, G., Tardi-Filacz, E., 1986. Agreement on the subdivision of the standard calpionellid zonesdefined at the IInd Planktonic Conference, Rome 1970. Acta Geologica Hun-garica 29, 5–14.
Speranza, F., Satoli, S., Mattioli, E., Calamita, F., 2005. Magnetic stratigraphy ofKimmeridgian–Aptian sections from Umbria-Marche (Italy): New details on theM polarity sequence. Journal of Geophysical Research 110 (B1209), 1–26.
Tavera, J.M., 1985. Los ammonites del Tithonico superior – Berriasense de la ZonaSubbetica (Cordilleras Beticas). PhD. Thesis, University of Granada, 381pp.
Tavera, J.M., Aguado, R., Company, M., Oloriz, F., 1994. Integrated biostratigraphyof the Durangites and Jacobi Zones (J/K boundary) at the Puerto Escanosection in southern Spain (Province of Cordoba). Geobios, Memoire Specialno 17, 469–476.
Villalaın, J.J., Osete, M.L., Vegas, R., Garcıa-Duenas, V., Heller, F., 1996. The Neogeneremagnetization in the western Betics: a brief comment on the reliability ofpalaeomagnetic directions. In: Morris, A., Tarling, D.H. (Eds.), Palaeomagnetismand Tectonics of the Mediterranean Region, 105. Spec. Publ.. (Geol. Soc. London),pp. 33–41.
Zeiss, A., 2001. Die Ammoniten fauna der Tithonklippen von Ernstbrunn, Nie-derosterreich. Neue Denk-Schriften des Naturhistorischen Museums in Wien6, 8–114.
P. Pruner et al. / Cretaceous Research 31 (2010) 192–206206