Assessing the effect of management zonation on live coral cover using multi-date IKONOS satellite...
16
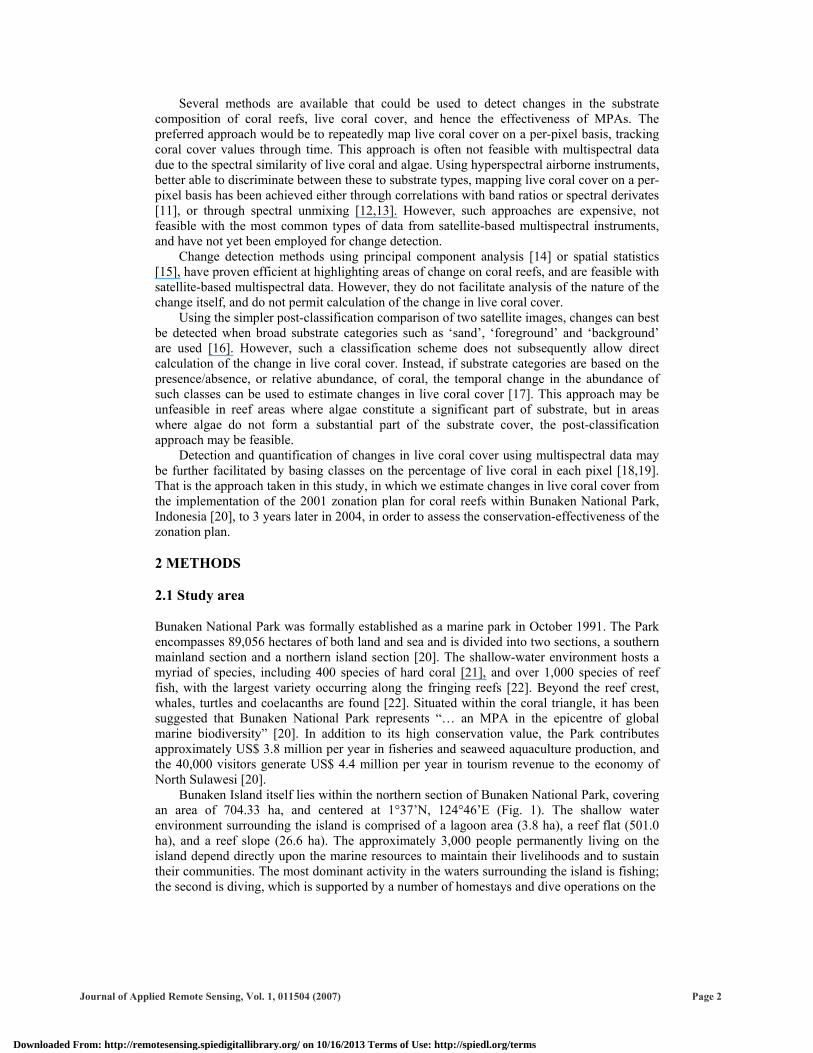
Assessing the effect of management zonation on live coral cover using multi-date IKONOS satellite imagery Candace M. Newman, Anders J. Knudby, Ellsworth F. LeDrew Waterloo Laboratory for Earth Observations, Department of Geography, University of Waterloo, 200 University Avenue West, Waterloo, Ontario N2L 3G1, Canada [email protected] , [email protected] , [email protected] Abstract. Change in live coral cover within the nine different management zones of the Marine Protected Area (MPA) around Bunaken Island, Indonesia, was estimated using IKONOS satellite image data for 2001 and 2004. For both years, field data were used to classify image pixels on a semi-quantitative scale based mainly on coral cover. The resulting substrate maps had overall classification accuracies of 78% and 81%, respectively. Change was estimated for each zone using a post-classification comparison. Results indicated an increase in live coral cover in one zone, a decrease in two other zones, and no change in the remaining six zones. The results show no obvious influence of the MPA’s zonation plan on changes in live coral cover in the three year period investigated, and the study demonstrates the use of remote sensing to determine change in live coral cover, to assess zonation effectiveness, and to guide management efforts. Keywords: management effectiveness, IKONOS, live coral cover, Bunaken Island, zonation system. 1 INTRODUCTION Coral reefs, the biodiversity hotspots of the oceans, are in global decline [1]. The causes of the decline are many and varied, and range from local impacts such as destructive fishing and sedimentation to global pressures such as sea level rise, ocean warming and acidification [2], all resulting in a net decline in the cover of living coral. These threats to coral reefs are only predicted to worsen in the coming century [3-5]. Society’s favoured response to this coral reef crisis is development of Marine Protected Areas (MPAs), in which remnant areas of the world’s healthy coral reefs are delineated and designated for conservation. Well-designed and managed MPAs have proven their ability to conserve live coral by limiting harmful influences, typically by developing a zonation plan that limits local human use in parts of the protected area [6]. MPAs have even been proposed as the main response to the anticipated severe bleaching events of the near future [7]. However, inclusion in an MPA does not guarantee conservation of coral reefs [1]. One measure of success for a coral reef MPA is the effectiveness of the protection offered by it. For MPAs whose goal is conservation of living coral, effectiveness can be assessed by recording temporal changes in live coral cover, also an often-used indicator of coral reef ‘health’. Live coral cover is usually assessed in field surveys using standardized transect techniques [8]. However, repetitive in-situ surveying of coral cover can be impractical, and unfeasible over large areas. Remote sensing has proven its ability to classify large areas of shallow coral reefs into major substrate types such as ‘coral’, ‘algae’, ‘sand’ and ‘seagrass’ [9], and improvements in both the spatial and spectral resolution of the sensors and in the processing of imagery have led to high (>80%) classification accuracies [10]. In-situ data collection is still needed to develop classification algorithms, but the mapping of substrate types over very large areas has become possible. Journal of Applied Remote Sensing, Vol. 1, 011504 (26 December 2007) © 2007 Society of Photo-Optical Instrumentation Engineers [DOI: 10.1117/1.2822612] Received 2 Apr 2007; accepted 17 Oct 2007; published 26 Dec 2007 [CCC: 19313195/2007/$25.00] Journal of Applied Remote Sensing, Vol. 1, 011504 (2007) Page 1 Downloaded From: http://remotesensing.spiedigitallibrary.org/ on 10/16/2013 Terms of Use: http://spiedl.org/terms
Transcript of Assessing the effect of management zonation on live coral cover using multi-date IKONOS satellite...
Assessing the effect of management zonation on live coral cover using multi-date IKONOS satellite imagery
Candace M. Newman, Anders J. Knudby, Ellsworth F. LeDrew Waterloo Laboratory for Earth Observations, Department of Geography, University of
Waterloo, 200 University Avenue West, Waterloo, Ontario N2L 3G1, Canada [email protected], [email protected], [email protected]
Abstract. Change in live coral cover within the nine different management zones of the Marine Protected Area (MPA) around Bunaken Island, Indonesia, was estimated using IKONOS satellite image data for 2001 and 2004. For both years, field data were used to classify image pixels on a semi-quantitative scale based mainly on coral cover. The resulting substrate maps had overall classification accuracies of 78% and 81%, respectively. Change was estimated for each zone using a post-classification comparison. Results indicated an increase in live coral cover in one zone, a decrease in two other zones, and no change in the remaining six zones. The results show no obvious influence of the MPA’s zonation plan on changes in live coral cover in the three year period investigated, and the study demonstrates the use of remote sensing to determine change in live coral cover, to assess zonation effectiveness, and to guide management efforts. Keywords: management effectiveness, IKONOS, live coral cover, Bunaken Island, zonation system. 1 INTRODUCTION Coral reefs, the biodiversity hotspots of the oceans, are in global decline [1]. The causes of the decline are many and varied, and range from local impacts such as destructive fishing and sedimentation to global pressures such as sea level rise, ocean warming and acidification [2], all resulting in a net decline in the cover of living coral. These threats to coral reefs are only predicted to worsen in the coming century [3-5].
Society’s favoured response to this coral reef crisis is development of Marine Protected Areas (MPAs), in which remnant areas of the world’s healthy coral reefs are delineated and designated for conservation. Well-designed and managed MPAs have proven their ability to conserve live coral by limiting harmful influences, typically by developing a zonation plan that limits local human use in parts of the protected area [6]. MPAs have even been proposed as the main response to the anticipated severe bleaching events of the near future [7]. However, inclusion in an MPA does not guarantee conservation of coral reefs [1]. One measure of success for a coral reef MPA is the effectiveness of the protection offered by it. For MPAs whose goal is conservation of living coral, effectiveness can be assessed by recording temporal changes in live coral cover, also an often-used indicator of coral reef ‘health’. Live coral cover is usually assessed in field surveys using standardized transect techniques [8]. However, repetitive in-situ surveying of coral cover can be impractical, and unfeasible over large areas.
Remote sensing has proven its ability to classify large areas of shallow coral reefs into major substrate types such as ‘coral’, ‘algae’, ‘sand’ and ‘seagrass’ [9], and improvements in both the spatial and spectral resolution of the sensors and in the processing of imagery have led to high (>80%) classification accuracies [10]. In-situ data collection is still needed to develop classification algorithms, but the mapping of substrate types over very large areas has become possible.
Journal of Applied Remote Sensing, Vol. 1, 011504 (26 December 2007)
© 2007 Society of Photo-Optical Instrumentation Engineers [DOI: 10.1117/1.2822612]Received 2 Apr 2007; accepted 17 Oct 2007; published 26 Dec 2007 [CCC: 19313195/2007/$25.00]Journal of Applied Remote Sensing, Vol. 1, 011504 (2007) Page 1
Downloaded From: http://remotesensing.spiedigitallibrary.org/ on 10/16/2013 Terms of Use: http://spiedl.org/terms
Journal of Applied Remote Sensing, Vol. 1, 011504 (2007) Page 2
Several methods are available that could be used to detect changes in the substrate composition of coral reefs, live coral cover, and hence the effectiveness of MPAs. The preferred approach would be to repeatedly map live coral cover on a per-pixel basis, tracking coral cover values through time. This approach is often not feasible with multispectral data due to the spectral similarity of live coral and algae. Using hyperspectral airborne instruments, better able to discriminate between these to substrate types, mapping live coral cover on a per-pixel basis has been achieved either through correlations with band ratios or spectral derivates [11], or through spectral unmixing [12,13]. However, such approaches are expensive, not feasible with the most common types of data from satellite-based multispectral instruments, and have not yet been employed for change detection.
Change detection methods using principal component analysis [14] or spatial statistics [15], have proven efficient at highlighting areas of change on coral reefs, and are feasible with satellite-based multispectral data. However, they do not facilitate analysis of the nature of the change itself, and do not permit calculation of the change in live coral cover.
Using the simpler post-classification comparison of two satellite images, changes can best be detected when broad substrate categories such as ‘sand’, ‘foreground’ and ‘background’ are used [16]. However, such a classification scheme does not subsequently allow direct calculation of the change in live coral cover. Instead, if substrate categories are based on the presence/absence, or relative abundance, of coral, the temporal change in the abundance of such classes can be used to estimate changes in live coral cover [17]. This approach may be unfeasible in reef areas where algae constitute a significant part of substrate, but in areas where algae do not form a substantial part of the substrate cover, the post-classification approach may be feasible.
Detection and quantification of changes in live coral cover using multispectral data may be further facilitated by basing classes on the percentage of live coral in each pixel [18,19]. That is the approach taken in this study, in which we estimate changes in live coral cover from the implementation of the 2001 zonation plan for coral reefs within Bunaken National Park, Indonesia [20], to 3 years later in 2004, in order to assess the conservation-effectiveness of the zonation plan. 2 METHODS 2.1 Study area Bunaken National Park was formally established as a marine park in October 1991. The Park encompasses 89,056 hectares of both land and sea and is divided into two sections, a southern mainland section and a northern island section [20]. The shallow-water environment hosts a myriad of species, including 400 species of hard coral [21], and over 1,000 species of reef fish, with the largest variety occurring along the fringing reefs [22]. Beyond the reef crest, whales, turtles and coelacanths are found [22]. Situated within the coral triangle, it has been suggested that Bunaken National Park represents “… an MPA in the epicentre of global marine biodiversity” [20]. In addition to its high conservation value, the Park contributes approximately US$ 3.8 million per year in fisheries and seaweed aquaculture production, and the 40,000 visitors generate US$ 4.4 million per year in tourism revenue to the economy of North Sulawesi [20].
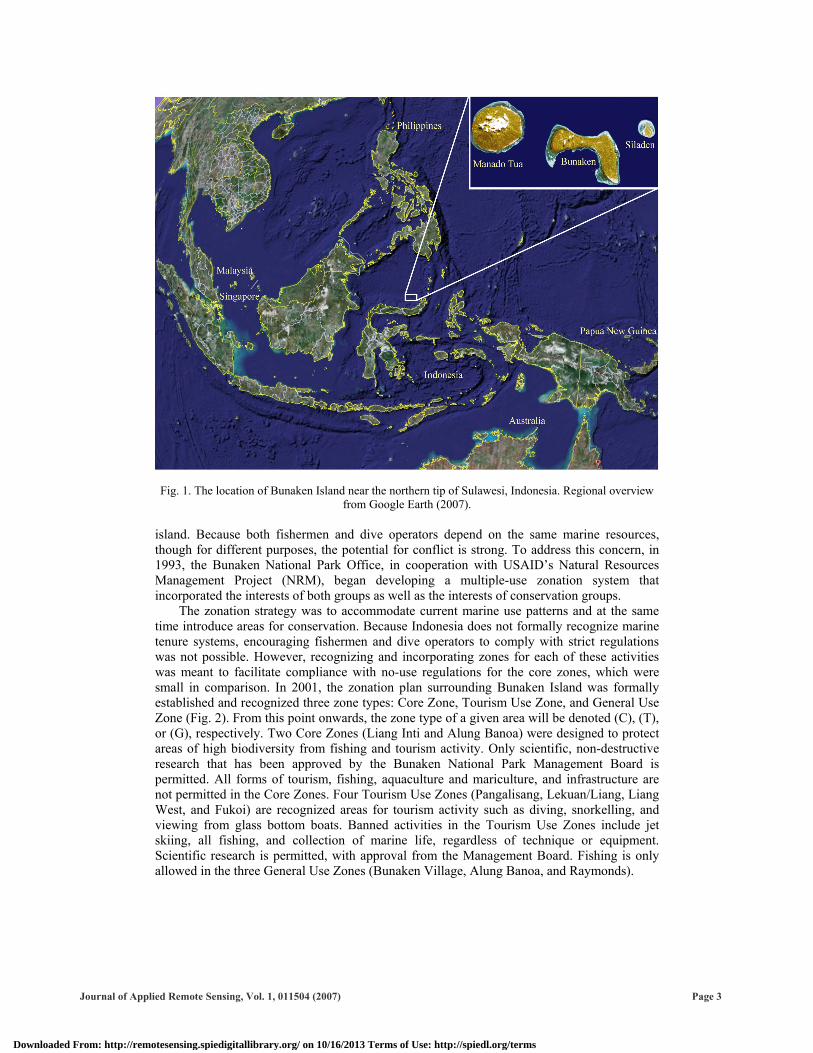
Bunaken Island itself lies within the northern section of Bunaken National Park, covering an area of 704.33 ha, and centered at 1°37’N, 124°46’E (Fig. 1). The shallow water environment surrounding the island is comprised of a lagoon area (3.8 ha), a reef flat (501.0 ha), and a reef slope (26.6 ha). The approximately 3,000 people permanently living on the island depend directly upon the marine resources to maintain their livelihoods and to sustain their communities. The most dominant activity in the waters surrounding the island is fishing; the second is diving, which is supported by a number of homestays and dive operations on the
Downloaded From: http://remotesensing.spiedigitallibrary.org/ on 10/16/2013 Terms of Use: http://spiedl.org/terms
Journal of Applied Remote Sensing, Vol. 1, 011504 (2007) Page 3
Fig. 1. The location of Bunaken Island near the northern tip of Sulawesi, Indonesia. Regional overview from Google Earth (2007).
island. Because both fishermen and dive operators depend on the same marine resources, though for different purposes, the potential for conflict is strong. To address this concern, in 1993, the Bunaken National Park Office, in cooperation with USAID’s Natural Resources Management Project (NRM), began developing a multiple-use zonation system that incorporated the interests of both groups as well as the interests of conservation groups.
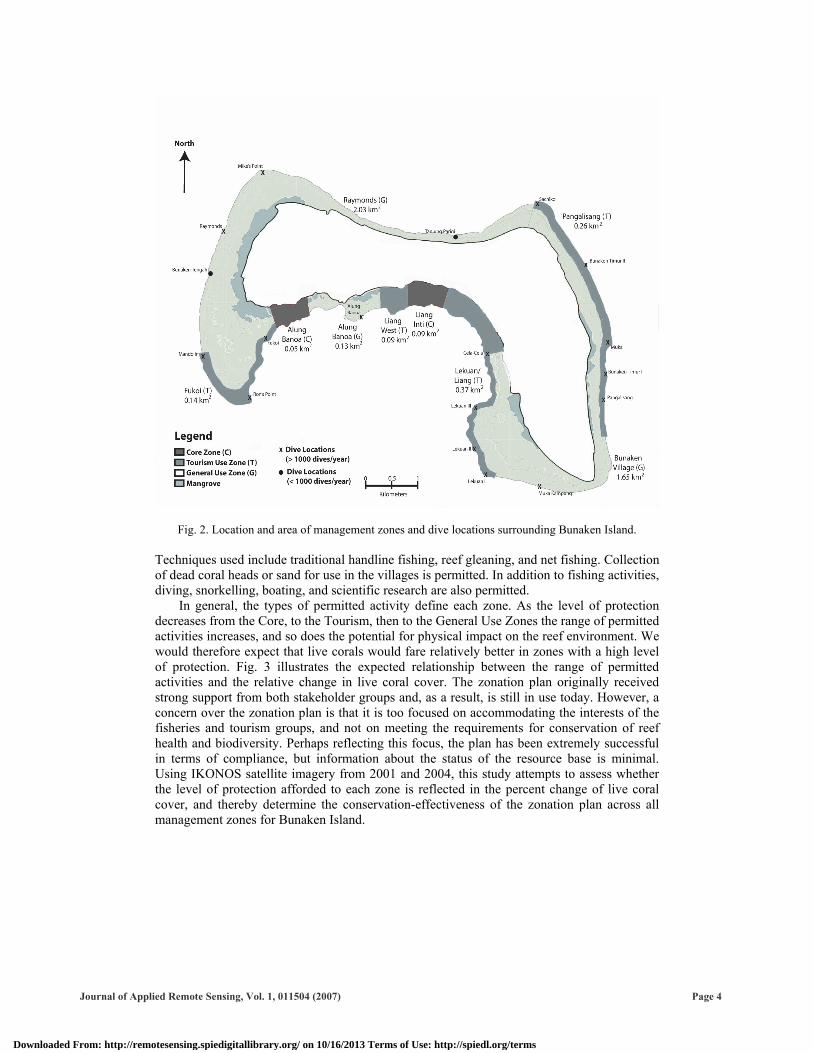
The zonation strategy was to accommodate current marine use patterns and at the same time introduce areas for conservation. Because Indonesia does not formally recognize marine tenure systems, encouraging fishermen and dive operators to comply with strict regulations was not possible. However, recognizing and incorporating zones for each of these activities was meant to facilitate compliance with no-use regulations for the core zones, which were small in comparison. In 2001, the zonation plan surrounding Bunaken Island was formally established and recognized three zone types: Core Zone, Tourism Use Zone, and General Use Zone (Fig. 2). From this point onwards, the zone type of a given area will be denoted (C), (T), or (G), respectively. Two Core Zones (Liang Inti and Alung Banoa) were designed to protect areas of high biodiversity from fishing and tourism activity. Only scientific, non-destructive research that has been approved by the Bunaken National Park Management Board is permitted. All forms of tourism, fishing, aquaculture and mariculture, and infrastructure are not permitted in the Core Zones. Four Tourism Use Zones (Pangalisang, Lekuan/Liang, Liang West, and Fukoi) are recognized areas for tourism activity such as diving, snorkelling, and viewing from glass bottom boats. Banned activities in the Tourism Use Zones include jet skiing, all fishing, and collection of marine life, regardless of technique or equipment. Scientific research is permitted, with approval from the Management Board. Fishing is only allowed in the three General Use Zones (Bunaken Village, Alung Banoa, and Raymonds).
Downloaded From: http://remotesensing.spiedigitallibrary.org/ on 10/16/2013 Terms of Use: http://spiedl.org/terms
Journal of Applied Remote Sensing, Vol. 1, 011504 (2007) Page 4
Fig. 2. Location and area of management zones and dive locations surrounding Bunaken Island.
Techniques used include traditional handline fishing, reef gleaning, and net fishing. Collection of dead coral heads or sand for use in the villages is permitted. In addition to fishing activities, diving, snorkelling, boating, and scientific research are also permitted.
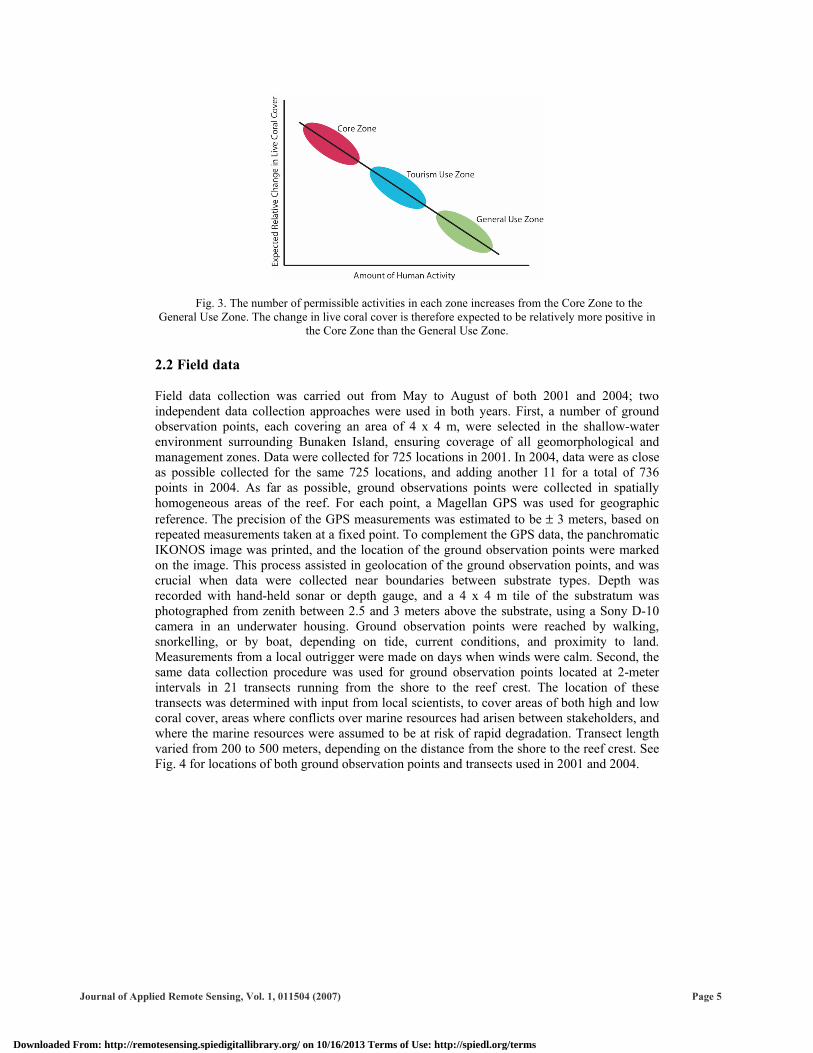
In general, the types of permitted activity define each zone. As the level of protection decreases from the Core, to the Tourism, then to the General Use Zones the range of permitted activities increases, and so does the potential for physical impact on the reef environment. We would therefore expect that live corals would fare relatively better in zones with a high level of protection. Fig. 3 illustrates the expected relationship between the range of permitted activities and the relative change in live coral cover. The zonation plan originally received strong support from both stakeholder groups and, as a result, is still in use today. However, a concern over the zonation plan is that it is too focused on accommodating the interests of the fisheries and tourism groups, and not on meeting the requirements for conservation of reef health and biodiversity. Perhaps reflecting this focus, the plan has been extremely successful in terms of compliance, but information about the status of the resource base is minimal. Using IKONOS satellite imagery from 2001 and 2004, this study attempts to assess whether the level of protection afforded to each zone is reflected in the percent change of live coral cover, and thereby determine the conservation-effectiveness of the zonation plan across all management zones for Bunaken Island.
Downloaded From: http://remotesensing.spiedigitallibrary.org/ on 10/16/2013 Terms of Use: http://spiedl.org/terms
Journal of Applied Remote Sensing, Vol. 1, 011504 (2007) Page 5
Fig. 3. The number of permissible activities in each zone increases from the Core Zone to the General Use Zone. The change in live coral cover is therefore expected to be relatively more positive in
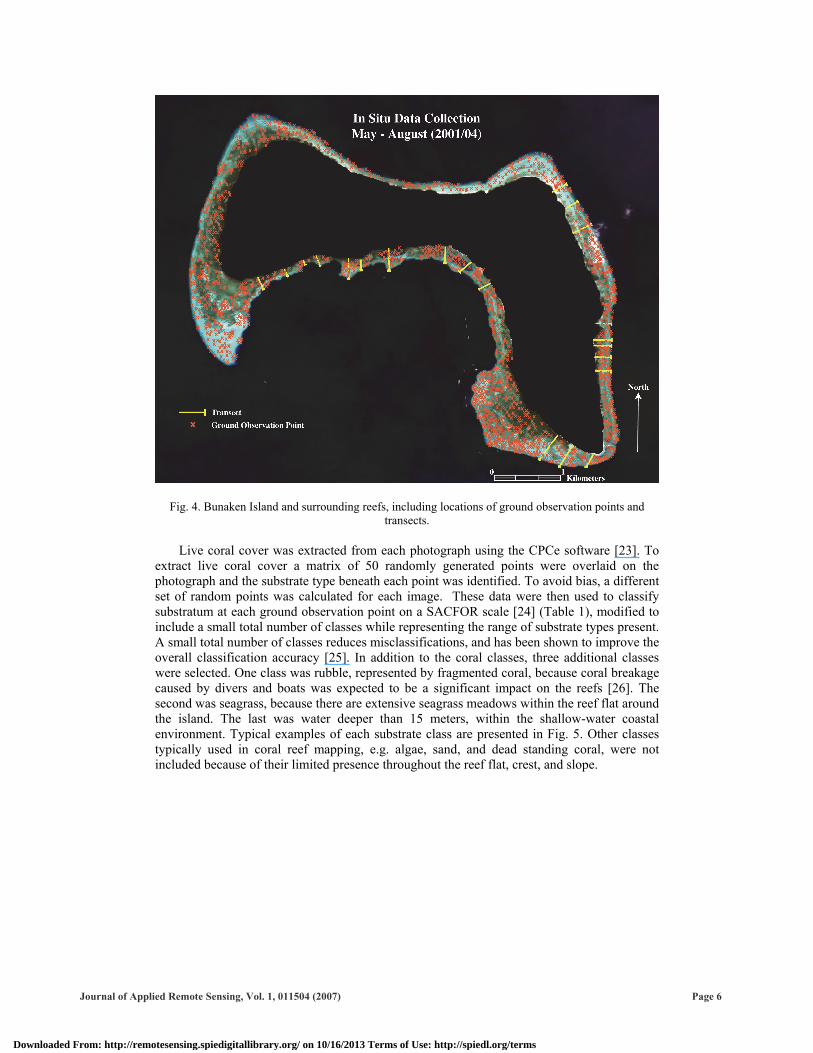
the Core Zone than the General Use Zone. 2.2 Field data Field data collection was carried out from May to August of both 2001 and 2004; two independent data collection approaches were used in both years. First, a number of ground observation points, each covering an area of 4 x 4 m, were selected in the shallow-water environment surrounding Bunaken Island, ensuring coverage of all geomorphological and management zones. Data were collected for 725 locations in 2001. In 2004, data were as close as possible collected for the same 725 locations, and adding another 11 for a total of 736 points in 2004. As far as possible, ground observations points were collected in spatially homogeneous areas of the reef. For each point, a Magellan GPS was used for geographic reference. The precision of the GPS measurements was estimated to be ± 3 meters, based on repeated measurements taken at a fixed point. To complement the GPS data, the panchromatic IKONOS image was printed, and the location of the ground observation points were marked on the image. This process assisted in geolocation of the ground observation points, and was crucial when data were collected near boundaries between substrate types. Depth was recorded with hand-held sonar or depth gauge, and a 4 x 4 m tile of the substratum was photographed from zenith between 2.5 and 3 meters above the substrate, using a Sony D-10 camera in an underwater housing. Ground observation points were reached by walking, snorkelling, or by boat, depending on tide, current conditions, and proximity to land. Measurements from a local outrigger were made on days when winds were calm. Second, the same data collection procedure was used for ground observation points located at 2-meter intervals in 21 transects running from the shore to the reef crest. The location of these transects was determined with input from local scientists, to cover areas of both high and low coral cover, areas where conflicts over marine resources had arisen between stakeholders, and where the marine resources were assumed to be at risk of rapid degradation. Transect length varied from 200 to 500 meters, depending on the distance from the shore to the reef crest. See Fig. 4 for locations of both ground observation points and transects used in 2001 and 2004.
Downloaded From: http://remotesensing.spiedigitallibrary.org/ on 10/16/2013 Terms of Use: http://spiedl.org/terms
Journal of Applied Remote Sensing, Vol. 1, 011504 (2007) Page 6
Fig. 4. Bunaken Island and surrounding reefs, including locations of ground observation points and transects.
Live coral cover was extracted from each photograph using the CPCe software [23]. To
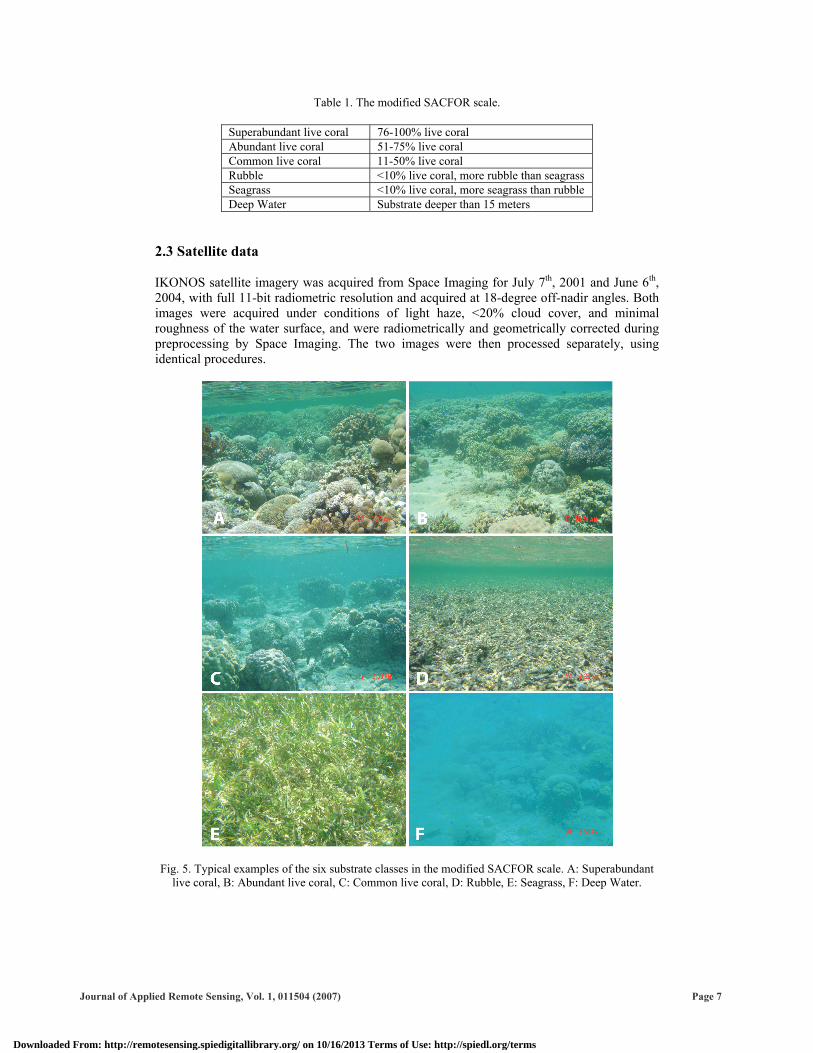
extract live coral cover a matrix of 50 randomly generated points were overlaid on the photograph and the substrate type beneath each point was identified. To avoid bias, a different set of random points was calculated for each image. These data were then used to classify substratum at each ground observation point on a SACFOR scale [24] (Table 1), modified to include a small total number of classes while representing the range of substrate types present. A small total number of classes reduces misclassifications, and has been shown to improve the overall classification accuracy [25]. In addition to the coral classes, three additional classes were selected. One class was rubble, represented by fragmented coral, because coral breakage caused by divers and boats was expected to be a significant impact on the reefs [26]. The second was seagrass, because there are extensive seagrass meadows within the reef flat around the island. The last was water deeper than 15 meters, within the shallow-water coastal environment. Typical examples of each substrate class are presented in Fig. 5. Other classes typically used in coral reef mapping, e.g. algae, sand, and dead standing coral, were not included because of their limited presence throughout the reef flat, crest, and slope.
Downloaded From: http://remotesensing.spiedigitallibrary.org/ on 10/16/2013 Terms of Use: http://spiedl.org/terms
Journal of Applied Remote Sensing, Vol. 1, 011504 (2007) Page 7
Table 1. The modified SACFOR scale.
Superabundant live coral 76-100% live coral Abundant live coral 51-75% live coral Common live coral 11-50% live coral Rubble <10% live coral, more rubble than seagrass Seagrass <10% live coral, more seagrass than rubble Deep Water Substrate deeper than 15 meters
2.3 Satellite data
IKONOS satellite imagery was acquired from Space Imaging for July 7th, 2001 and June 6th, 2004, with full 11-bit radiometric resolution and acquired at 18-degree off-nadir angles. Both images were acquired under conditions of light haze, <20% cloud cover, and minimal roughness of the water surface, and were radiometrically and geometrically corrected during preprocessing by Space Imaging. The two images were then processed separately, using identical procedures.
Fig. 5. Typical examples of the six substrate classes in the modified SACFOR scale. A: Superabundant live coral, B: Abundant live coral, C: Common live coral, D: Rubble, E: Seagrass, F: Deep Water.
Downloaded From: http://remotesensing.spiedigitallibrary.org/ on 10/16/2013 Terms of Use: http://spiedl.org/terms
Journal of Applied Remote Sensing, Vol. 1, 011504 (2007) Page 8
Initially, both images were georeferenced using 57 GPS-measured ground control points: 45 distributed around Bunaken Island and 12 located on docks, buoys, and recognizable boating channels, achieving a registration accuracy of <1 pixel for all points. The two images were then compared to each other, also ensuring a co-registration accuracy of <1 pixel. Areas of land, clouds, boats, and deep water outside the reef crest were then masked out. A basic atmospheric correction was applied to the imagery that involved sampling a large number of pixels from the ‘deep water’ area, the area beyond the reef slope, calculating their average radiance, and then subtracting this value from all other pixels in each band. A depth correction was then carried out using a semi-empirical approach [27] based on Lyzenga’s model [28,29], yielding a depth-independent bottom index. This technique has been successfully applied in other shallow water environments [25] in which depth was similar to that surrounding Bunaken Island.
For each image, 615 ground observation points were then used to develop training areas, encompassing each of the six classes in all geomorphological zones in which they were present. Ground observation points were initially located on the satellite images based on their GPS-based geographic coordinates, then local knowledge of the area was used to ensure their correct placement. The size of each training area varied in size between 4 and 16 pixels based on the homogeneity of the area surrounding the ground observation point. The training areas were input in a supervised maximum likelihood classifier, which was stratified by geomorphologic zone to improve accuracy [27]. A 95% probability threshold was applied; pixels whose likelihood of belonging to any class fell below this threshold were removed. Only the three monochromatic bands, at 4 x 4 m spatial resolution, were used in the classification. Ground observation points not used in the development of training areas (110 from 2001 and 121 from 2004), along with data from the photo transects, were used to assess the accuracy of the classification. A grid overlaid on the image was used to confirm the spatial distribution of the points used for accuracy assessment.
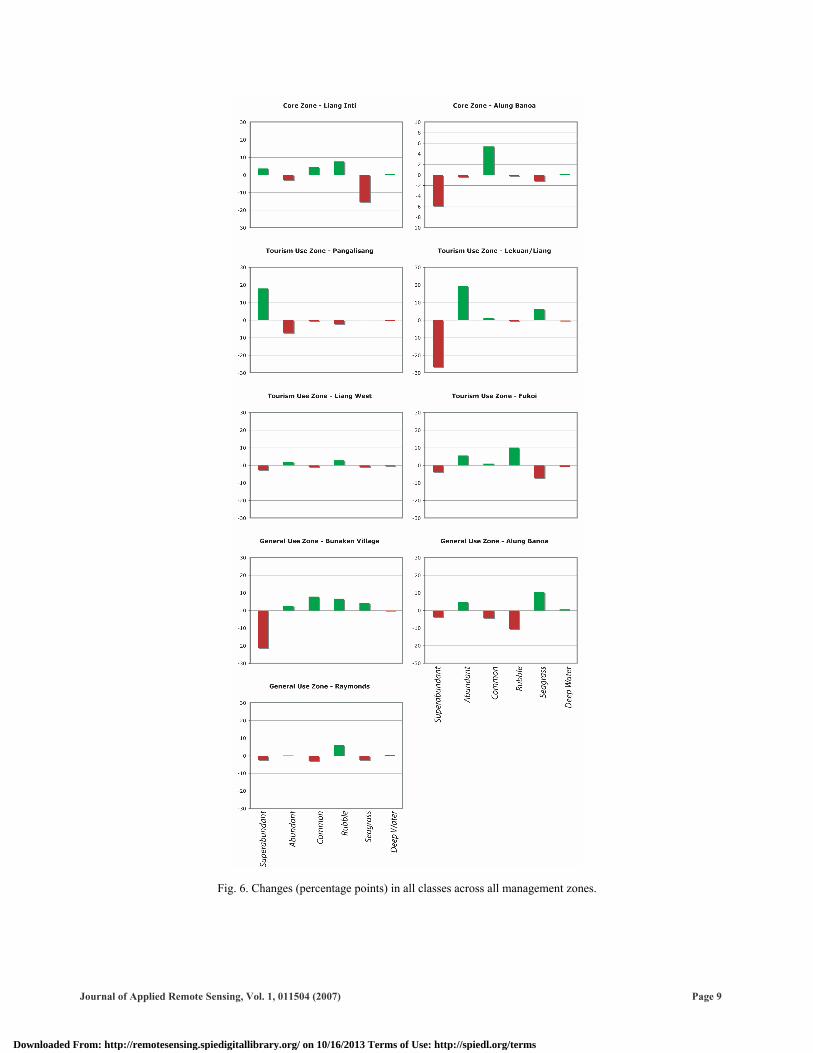
The objective of the classification was to estimate, in both image data sets, the percent live coral cover within each management zone, and to identify changes in these values between the two images. In order to arrive at an estimate of live coral cover for each management zone, the midpoint of the coral cover value for each class was used as an estimate of live coral cover (e.g. pixels classified as ‘abundant live coral’ were assumed to have (75% + 51%) / 2 = 63% live coral cover, on average). Similarly, pixels classified as Rubble or Seagrass were assumed to have 5% live coral, and no live coral was assumed to exist in the Deep Water class. For each management zone, the average live coral cover was then estimated by overlaying the boundaries of the zone on the classified images, and calculating the average live coral cover of all pixels within the zone boundary. Given the width of each class (e.g. 10-50% coral cover), this approach will lead to substantial under- or over-estimation of live coral cover for individual pixels, and should not be employed as such. However, we justify the approach for estimation of averages of live coral cover for the management zones, based on the statistical spread of observed live coral cover values from ground observation points in each class. Finally, comparisons of live coral cover between 2001 and 2004 were made for each zone. 3 RESULTS AND DISCUSSION 3.1 Classification results The classification of the 2001 and 2004 IKONOS satellite imagery resulted in overall accuracies of 78% and 81%, respectively. Producer’s and user’s accuracies for all classes, and both years, ranged from 72.7% to 85.1%. When the changes across all classes for all management zones were calculated the results ranged between -26 and +18 pp (Fig. 6).
Downloaded From: http://remotesensing.spiedigitallibrary.org/ on 10/16/2013 Terms of Use: http://spiedl.org/terms
Journal of Applied Remote Sensing, Vol. 1, 011504 (2007) Page 9
Fig. 6. Changes (percentage points) in all classes across all management zones.
Downloaded From: http://remotesensing.spiedigitallibrary.org/ on 10/16/2013 Terms of Use: http://spiedl.org/terms
Journal of Applied Remote Sensing, Vol. 1, 011504 (2007) Page 10
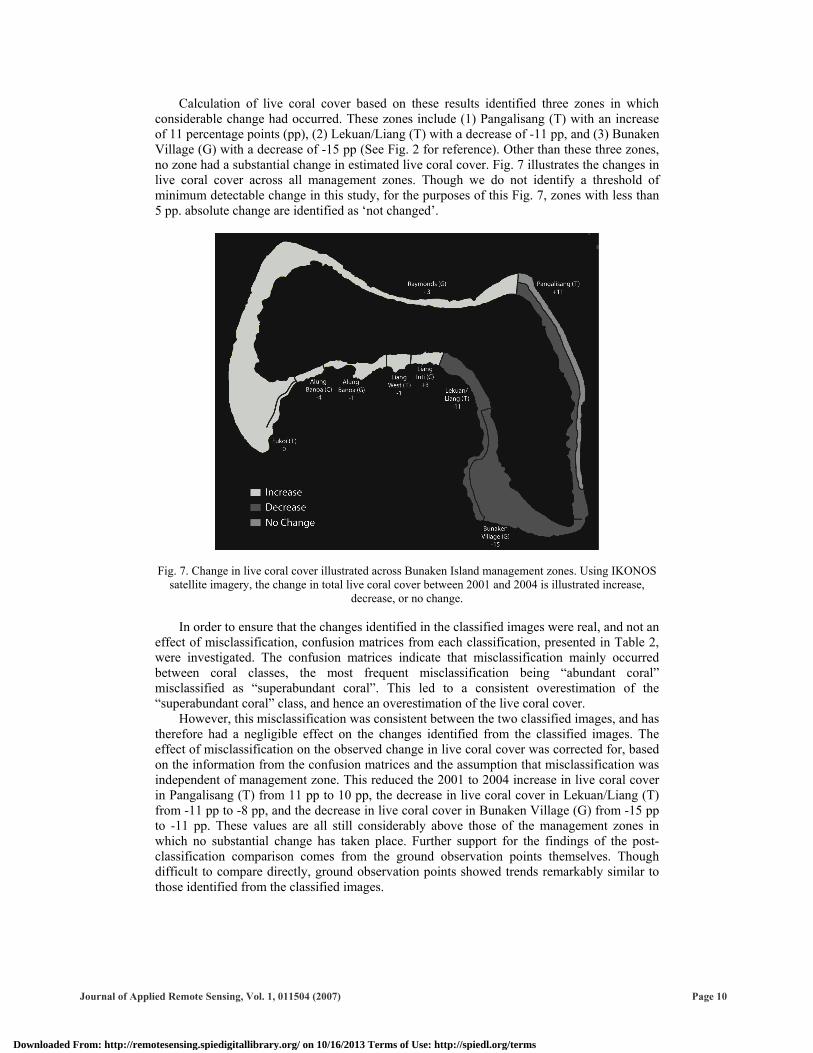
Calculation of live coral cover based on these results identified three zones in which considerable change had occurred. These zones include (1) Pangalisang (T) with an increase of 11 percentage points (pp), (2) Lekuan/Liang (T) with a decrease of -11 pp, and (3) Bunaken Village (G) with a decrease of -15 pp (See Fig. 2 for reference). Other than these three zones, no zone had a substantial change in estimated live coral cover. Fig. 7 illustrates the changes in live coral cover across all management zones. Though we do not identify a threshold of minimum detectable change in this study, for the purposes of this Fig. 7, zones with less than 5 pp. absolute change are identified as ‘not changed’.
Fig. 7. Change in live coral cover illustrated across Bunaken Island management zones. Using IKONOS satellite imagery, the change in total live coral cover between 2001 and 2004 is illustrated increase,
decrease, or no change.
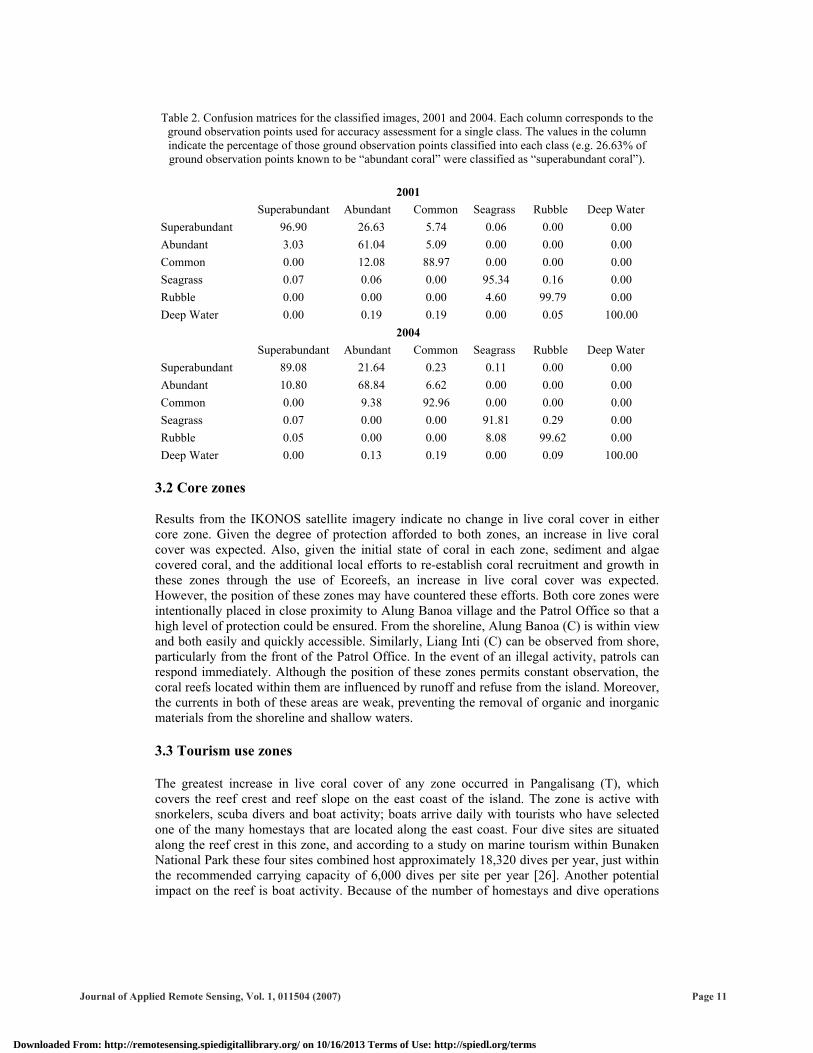
In order to ensure that the changes identified in the classified images were real, and not an effect of misclassification, confusion matrices from each classification, presented in Table 2, were investigated. The confusion matrices indicate that misclassification mainly occurred between coral classes, the most frequent misclassification being “abundant coral” misclassified as “superabundant coral”. This led to a consistent overestimation of the “superabundant coral” class, and hence an overestimation of the live coral cover.
However, this misclassification was consistent between the two classified images, and has therefore had a negligible effect on the changes identified from the classified images. The effect of misclassification on the observed change in live coral cover was corrected for, based on the information from the confusion matrices and the assumption that misclassification was independent of management zone. This reduced the 2001 to 2004 increase in live coral cover in Pangalisang (T) from 11 pp to 10 pp, the decrease in live coral cover in Lekuan/Liang (T) from -11 pp to -8 pp, and the decrease in live coral cover in Bunaken Village (G) from -15 pp to -11 pp. These values are all still considerably above those of the management zones in which no substantial change has taken place. Further support for the findings of the post-classification comparison comes from the ground observation points themselves. Though difficult to compare directly, ground observation points showed trends remarkably similar to those identified from the classified images.
Downloaded From: http://remotesensing.spiedigitallibrary.org/ on 10/16/2013 Terms of Use: http://spiedl.org/terms
Journal of Applied Remote Sensing, Vol. 1, 011504 (2007) Page 11
Table 2. Confusion matrices for the classified images, 2001 and 2004. Each column corresponds to the
ground observation points used for accuracy assessment for a single class. The values in the column indicate the percentage of those ground observation points classified into each class (e.g. 26.63% of ground observation points known to be “abundant coral” were classified as “superabundant coral”).
2001
Superabundant Abundant Common Seagrass Rubble Deep Water Superabundant 96.90 26.63 5.74 0.06 0.00 0.00 Abundant 3.03 61.04 5.09 0.00 0.00 0.00 Common 0.00 12.08 88.97 0.00 0.00 0.00 Seagrass 0.07 0.06 0.00 95.34 0.16 0.00 Rubble 0.00 0.00 0.00 4.60 99.79 0.00 Deep Water 0.00 0.19 0.19 0.00 0.05 100.00
2004 Superabundant Abundant Common Seagrass Rubble Deep Water Superabundant 89.08 21.64 0.23 0.11 0.00 0.00 Abundant 10.80 68.84 6.62 0.00 0.00 0.00 Common 0.00 9.38 92.96 0.00 0.00 0.00 Seagrass 0.07 0.00 0.00 91.81 0.29 0.00 Rubble 0.05 0.00 0.00 8.08 99.62 0.00 Deep Water 0.00 0.13 0.19 0.00 0.09 100.00
3.2 Core zones Results from the IKONOS satellite imagery indicate no change in live coral cover in either core zone. Given the degree of protection afforded to both zones, an increase in live coral cover was expected. Also, given the initial state of coral in each zone, sediment and algae covered coral, and the additional local efforts to re-establish coral recruitment and growth in these zones through the use of Ecoreefs, an increase in live coral cover was expected. However, the position of these zones may have countered these efforts. Both core zones were intentionally placed in close proximity to Alung Banoa village and the Patrol Office so that a high level of protection could be ensured. From the shoreline, Alung Banoa (C) is within view and both easily and quickly accessible. Similarly, Liang Inti (C) can be observed from shore, particularly from the front of the Patrol Office. In the event of an illegal activity, patrols can respond immediately. Although the position of these zones permits constant observation, the coral reefs located within them are influenced by runoff and refuse from the island. Moreover, the currents in both of these areas are weak, preventing the removal of organic and inorganic materials from the shoreline and shallow waters. 3.3 Tourism use zones The greatest increase in live coral cover of any zone occurred in Pangalisang (T), which covers the reef crest and reef slope on the east coast of the island. The zone is active with snorkelers, scuba divers and boat activity; boats arrive daily with tourists who have selected one of the many homestays that are located along the east coast. Four dive sites are situated along the reef crest in this zone, and according to a study on marine tourism within Bunaken National Park these four sites combined host approximately 18,320 dives per year, just within the recommended carrying capacity of 6,000 dives per site per year [26]. Another potential impact on the reef is boat activity. Because of the number of homestays and dive operations
Downloaded From: http://remotesensing.spiedigitallibrary.org/ on 10/16/2013 Terms of Use: http://spiedl.org/terms
Journal of Applied Remote Sensing, Vol. 1, 011504 (2007) Page 12
positioned along the eastern coast, the area receives significant boat traffic. However, boaters from the east coast have collectively agreed to use channels in the reef crest to prevent unnecessary impact on the reef. The authors believe that the no-fishing policy enforced in this zone, as well as the below-carrying-capacity diving activity and attention given to reefs by boaters, have provided the conditions for the observed increase in live coral cover.
Of the remaining three Tourism Use Zones, Liang West (T) and Fukoi (T) experienced no change. Liang West (T) is located west of Liang Inti (C) and has 1 dive site, which hosts approximately 5,000 dives per year [26]. Although it does not experience as many divers as some of the more popular sites, it does have similar environmental conditions as the two core zones. Fukoi (T) is located in the most south-western corner of the island and has 3 dive sites, which together only host approximately 7,000 dives per year [26]. Historically, Fukoi (T) experienced a significant amount of blast fishing leaving some areas covered with coral rubble. Over time, these areas did not recover naturally, so NRMIII (USAID) placed ceramic eco-reefs in groups of 30 on the rubble bottom to encourage coral reef growth.
The remaining Tourism Use zone is Lekuan/Liang (T), which is located at the south-eastern end of Bunaken Island and extends northwest to the main landing dock and visitors center, and experienced declining live coral cover from 2001 to 2004. The zone includes the reef slope, reef crest, and a portion of the reef flat, and the southern end includes three of the four most popular dive sites around Bunaken Island. These three sites, combined with the one other dive site in this zone, experience more than 31,000 dives per year [26]. Most notably, the most popular of the dive sites received more than 10,500 dives per year, which is beyond the recommended carrying capacity. The number of dives at these locations also illustrates the boat traffic in this zone, which includes both dive boats and glass bottom boats common in the area (personal observation). In addition to the impacts caused by numerous divers and boats, an incident occurred along the reef crest in January 2004. At that time, members of a minority group protested the zonation plan by intentionally dragging anchors across the reef crest, causing physical damage. Although the protest only lasted for a few hours, the damage was extensive. Towards the main receiving dock and visitor’s center, boat activity is also high. On weekends, through the months of May and August, the dock can expect to receive up to 50 boats per day carrying passengers from the mainland. These boats must travel through Lekuan/Liang (T) to arrive at the dock, to which channels in the reef crest provide access during low tide. However, at times passengers wish to return to the mainland and not wait for the tide to rise, so boats will pass at low tide and often bump and break coral colonies (personal observation). The continuous overuse and misuse of many areas in this zone may have caused the observed decrease in live coral cover.
3.4 General use zones
Of the three General Use Zones, Alung Banoa (G) and Raymonds (G) experienced no change in live coral cover. Alung Banoa (G) is situated on the southern coast of the island and is positioned between Liang West (T) on the east and Alung Banoa (C) on the west, and Raymonds (G) includes all geomorphologic zones along the west and north coasts (see Fig. 2). These zones also experienced no change. Within Raymonds (G) there are between 3 and 4 dive sites that host over 5,000 dives per year [26]. These dive sites are the least visited because of their position along the west coast of the island in which strong waves and currents are common. The north shore of the island, also part of Raymonds (G), is composed of a narrow reef flat and reef crest, which consists of boulders and overhangs. Diving at these sites is possible though is often avoided by novice divers (personal observation).
The remaining General Use Zone is Bunaken Village (G), which is located south of the village, and includes the reef flat as it runs from the north-eastern end of the island, past the village, and into the central bay. This zone contains a single dive site that is ranked 6th in dive use with approximately 6,500 dives per year [26]. Although dive activity is lower than at other
Downloaded From: http://remotesensing.spiedigitallibrary.org/ on 10/16/2013 Terms of Use: http://spiedl.org/terms
Journal of Applied Remote Sensing, Vol. 1, 011504 (2007) Page 13
sites, Bunaken Village has expanded between 2001 and 2004, and boat activity in this zone is considered the highest around the island. Both outriggers and deep-sea fishing boats are regularly stationed on the reef flat while fishermen gather materials for the day, make repairs, or rest. In both the 2001 and 2004 images, channels in the seagrass are evident, and are the result of boat activity. Channels are also evident in the reef crest, and can be attributed to physical impacts caused by large transportation and deep-sea fishing boats. With continuous use of these channels, physical impacts on corals and smothering of corals is common. 4 CONCLUSION Bunaken National Park was established to conserve the unique biodiversity of the area’s coral reefs, and its conservation-effectiveness can therefore be assessed by monitoring trends in live coral cover, an often-used surrogate for reef health. The number of visitors to Bunaken Island continues to increase, and several homestays and dive operators are accommodating increased tourism through expansion of existing buildings and boat activity, mainly along the east coast. As a result, particularly Pangalisang (T) may be at risk of increased impacts, but other zones also experience increasing use. A noticeable result of increased human activity between 2001 and 2004 is the increase in densely concentrated seagrass patches in front of popular homestays. This pattern may be caused by the release of nutrients into the water; with tourist numbers expected to increase, this and similar effects may add to the physical damage caused by also increasing diving and boating activity. There is a critical need to understand how the reefs around Bunaken Island will respond to these and other human impacts, coupled with potential natural disturbances, and how the managers of Bunaken National Park can respond.
Despite the known difficulties involved in remotely detecting small changes in live coral cover, we have shown that the changes experienced by three of the management zones around Bunaken Island could be identified with a post-classification comparison, using two multispectral IKONOS images and a classification scheme based largely on variations in coral cover. The results question the conservation-effectiveness of the MPA, because coral cover is decreasing in two of the managed zones, and because the one zone that experienced increasing coral cover in the three years after the implementation of the zonation plan was a Tourism Use Zone, and not one of the Core Zones intended solely for coral conservation. The two Core Zones experienced little change in coral cover. Given the contexts of the different zones, described above, no clear relationship could be identified between the status of a given area in the zonation plan, and the trajectory of its coral cover in the three years following implementation. This is a sobering but important indication for the management board, and perhaps for other MPA managers faced with managing small MPAs embedded within a regional context over which they have no control.
As Bunaken Island and Bunaken National Park become fully integrated in a national MPA network over the next several years, it will be important to assess live coral cover changes of reefs in a larger area, and to communicate this information to managers faced with balancing marine resource use and marine resource conservation. This study demonstrates that IKONOS satellite imagery can be used to identify and map such changes over periods of only three years. The increased availability of data from spaceborne hyperspectral instruments such as HYPERION, despite their reduced spatial resolution, is likely to improve the accuracy of remote detection of changes in live coral cover, even in areas where, unlike Bunaken Island, algae spectrally similar to live coral continue to pose a problem for classification accuracy. We believe that our post-classification comparison approach can be further improved by using airborne or satellite hyperspectral data, and may prove useful for MPA managers who wish to rapidly assess changes in coral cover over large areas, and use the resulting maps to assess the conservation-effectiveness of their MPAs.
Downloaded From: http://remotesensing.spiedigitallibrary.org/ on 10/16/2013 Terms of Use: http://spiedl.org/terms
Journal of Applied Remote Sensing, Vol. 1, 011504 (2007) Page 14
Acknowledgments The authors would like to thank the following individuals for providing field assistance, B. Newman, M. Erdmann, J. Rotinsulu, and D. Caroles. Many thanks to S. Wanget and J. Rotinsulu for administration assistance. This study was funded by (1) a University Consortium on the Environment (Canadian International Development Agency-CIDA) Graduate Student Scholarship and (2) an International Development Research Centre Doctoral (IDRC) Scholarship to Candace Newman. Ellsworth LeDrew was funded by a Natural Sciences and Engineering Research Council of Canada (NSERC) Operating Grant. References [1] C. Wilkinson, Status of Coral Reefs of the World, Australian Institute of Marine
Science, Townsville (2004). [2] J. M. Pandolfi, R. H. Bradbury, E. Sala, T. P. Hughes, K. A. Bjorndal, R. G. Cooke,
D. McArdle, L. McClenachan, M. J. H. Newman, G. Paredes, R. R. Warner and J. B. C. Jackson, "Global trajectories of the long-term decline of coral reef ecosystems," Science 301 955-958 (2003) [doi:10.1126/science.1085706].
[3] O. Hoegh-Guldberg, "Climate change, coral bleaching and the future of the world's coral reefs," Mar. Freshwat. Res. 50 839-866 (1999) [doi:10.1071/MF99078].
[4] J. A. Kleypas, R. W. Buddemeier, D. Archer, J. P. Gattuso, C. Langdon, and B. N. Opdyke, "Geochemical consequences of increased atmospheric carbon dioxide on coral reefs," Science 284 118-120 (1999) [doi:10.1126/science.284.5411.118].
[5] A. B. Pittock, "Coral reefs and environmental change: Adaptation to what?," Am. Zool. 39 10-29 (1999)
[6] R. V. Salm and J. R. Clark, Marine and Coastal Protected Areas, IUCN, Cambridge (2000).
[7] P. Marshall and H. Schuttenberg, A Reef Manager's Guide to Coral Bleaching, Great Barrier Reef Marine Park Authority, Townsville (2006).
[8] S. English, C. Wilkinson, and V. Baker, Survey Manual for Tropical Marine Resources, Australian Institute of Marine Science, Townsville (1997).
[9] P. J. Mumby, E. P. Green, A. J. Edwards and C. D. Clark, "Coral reef habitat-mapping: how much detail can remote sensing provide?," Mar. Biol. 130 193-202 (1997) [doi:10.1007/s002270050238].
[10] P. J. Mumby, W. Skirving, A. E. Strong, J. T. Hardy, E. F. LeDrew, E. J. Hochberg, R. P. Stumpf, and L. T. David, "Remote sensing of coral reefs and their physical environment," Mar. Pollut. Bull. 48 219-228 (2004) [doi:10.1016/j.marpolbul.2003.10.031].
[11] K. Joyce, A method for mapping live coral cover using remote sensing, University of Queensland, Brisbane, Australia (2004).
[12] J. D. Hedley and P. J. Mumby, "A remote sensing method for resolving depth and subpixel composition of aquatic benthos," Limnol. Oceanogr. 48 480-488 (2003).
[13] P. J. Mumby, J. D. Hedley, J. R. M. Chisholm, C. D. Clark, H. Ripley and J. Jaubert, "The cover of living and dead corals from airborne remote sensing," Coral Reef. 23 171-183 (2004) [doi:10.1007/s00338-004-0382-1].
[14] A. C. Shapiro and S. O. Rohmann, "Summit-to-sea mapping and change detection using satellite imagery: tools for conservation and management of coral reefs," Rev. Biol. Trop. 53 185-193 (2005).
[15] E. F. LeDrew, H. Holden, M. A. Wulder, C. Derksen and C. Newman, "A spatial statistical operator applied to multidate satellite imagery for identification of coral reef stress," Rem. Sens. Environ. 91 271-279 (2004) [doi:10.1016/j.rse.2003.10.007].
Downloaded From: http://remotesensing.spiedigitallibrary.org/ on 10/16/2013 Terms of Use: http://spiedl.org/terms
Journal of Applied Remote Sensing, Vol. 1, 011504 (2007) Page 15
[16] S. Andrefouet, F. E. Muller-Karger, E. J. Hochberg, C. M. Hu, and K. L. Carder, "Change detection in shallow coral reef environments using Landsat 7 ETM+ data," Rem. Sens. Environ. 78 150-162 (2001) [doi:10.1016/S0034-4257(01)00256-5].
[17] D. Palandro, S. Andrefouet, P. Dustan, and F. E. Muller-Karger, "Change detection in coral reef communities using Ikonos satellite sensor imagery and historic aerial photographs," Int. J. Rem Sens. 24 873-878 (2003) [doi:10.1080/0143116021000009895].
[18] E. Isoun, C. Fletcher, N. Frazer, and J. Gradie, "Multi-spectral mapping of reef bathymetry and coral cover; Kailua Bay, Hawaii," Coral Reef .22 68-82 (2003).
[19] J. Turner and R. Klaus, "Coral reefs of the Mascarenes, Western Indian Ocean," Phil. Trans. Roy. Soc. Lond. 363 229-250 (2005).
[20] M. V. Erdmann, P. R. Merrill, M. Mongdong, I. Arsyad, Z. Harahap, R. Pangalila, R. Elverawati, and P. Baworo, Building effective co-management systems for decentralized protected areas management in Indonesia: Bunaken National Park Case Study, Natural Resources Management (NRM), Jakarta (2004).
[21] E. Turak and L. M. DeVantier, Reef -building corals of Bunaken National Park, North Sulawesi, Indonesia: Rapid ecological assessment of biodiversity and status, Natural Resources Management (NRM), Jakarta (2003).
[22] A. Mehta, Bunaken National Park Natural History Guide, NRM/EPIQ, Jakarta (2000).
[23] K. E. Kohler and S. M. Gill, "Coral point count with Excel extensions (CPCe): A visual basic program for the determination of coral and substrate coverage using random point count methodology," Comput. Geosci. 32 1259-1269 (2006) [doi:10.1016/j.cageo.2005.11.009].
[24] K. Hiscock (ed.), Marine Nature Conservation Review: rational and methods, Joint Nature Conservation Committee, Peterborough, UK (1996).
[25] S. Andrefouet, P. Kramer, D. Torres-Pulliza, K. E. Joyce, E. J. Hochberg, R. Garza-Perez, P. J. Mumby, B. Riegl, H. Yamano, W. H. White, M. Zubia, J. C. Brock, S. R. Phinn, A. Naseer, B. G. Hatcher and F. E. Muller-Karger, "Multi-site evaluation of IKONOS data for classification of tropical coral reef environments," Rem. Sens. Environ. 88 128-143 (2003) [doi:10.1016/j.rse.2003.04.005].
[26] L. DeVantier and E. Turak, Managing marine tourism in Bunaken National Park and adjacent waters, North Sulawesi, Indonesia, Natural Resources Management (NRM), Jakarta (2004).
[27] E. P. Green, P. J. Mumby, A. J. Edwards, and C. D. Clark, Remote Sensing Handbook for Tropical Coastal Management, UNESCO, Paris (2000).
[28] D. R. Lyzenga, "Passive remote-sensing techniques for mapping water depth and bottom features," Appl. Optic. 17 379-383 (1978)
[29] D. R. Lyzenga, "Remote sensing of bottom reflectance and water attenuation parameters in shallow water using aircraft and Landsat data," Int. J. Rem. Sens. 2 71-82 (1981). [doi.org/10.1080/01431168108948342].
Downloaded From: http://remotesensing.spiedigitallibrary.org/ on 10/16/2013 Terms of Use: http://spiedl.org/terms
Journal of Applied Remote Sensing, Vol. 1, 011504 (2007) Page 16
Candace M. Newman is a PhD student at the University of Waterloo. She received her BA at the University of Windsor in 1998 and MES in Geography at the University of Waterloo in 2001. Her PhD research examines the use of remotely-sensed biophysical marine information for marine management, and techniques to effectively communicate this information to coastal managers in developing countries. She has contributed two chapters on remote sensing and Marine Protected Area management. Anders J. Knudby is a PhD student at the University of Waterloo. He received his BSc in Geomatics in 1998, and his MSc in Geography in 2001, both at the University of Copenhagen. His PhD research focuses on using remote sensing to map local variations in habitat properties that affect the spatial distribution of reef fishes, and creating biodiversity maps for use in biodiversity research and management. Ellsworth F. LeDrew is Professor and University Research Chair at the University of Waterloo. He received a BA at the University of Toronto in 1972, MA at the University of Colorado in 1974 and PhD at the University of Colorado in 1976. He is the author of 83 refereed papers, 8 refereed chapters in books and has co-edited 8 books or monographs. His research is on remote sensing of environmental change in coral reefs and coastal systems, and change of climate and sea ice in the Arctic.
Downloaded From: http://remotesensing.spiedigitallibrary.org/ on 10/16/2013 Terms of Use: http://spiedl.org/terms