
Cometary science. On the nucleus structure and activity of comet 67P/Churyumov-Gerasimenko
Upload
independentCategory
view
4download
0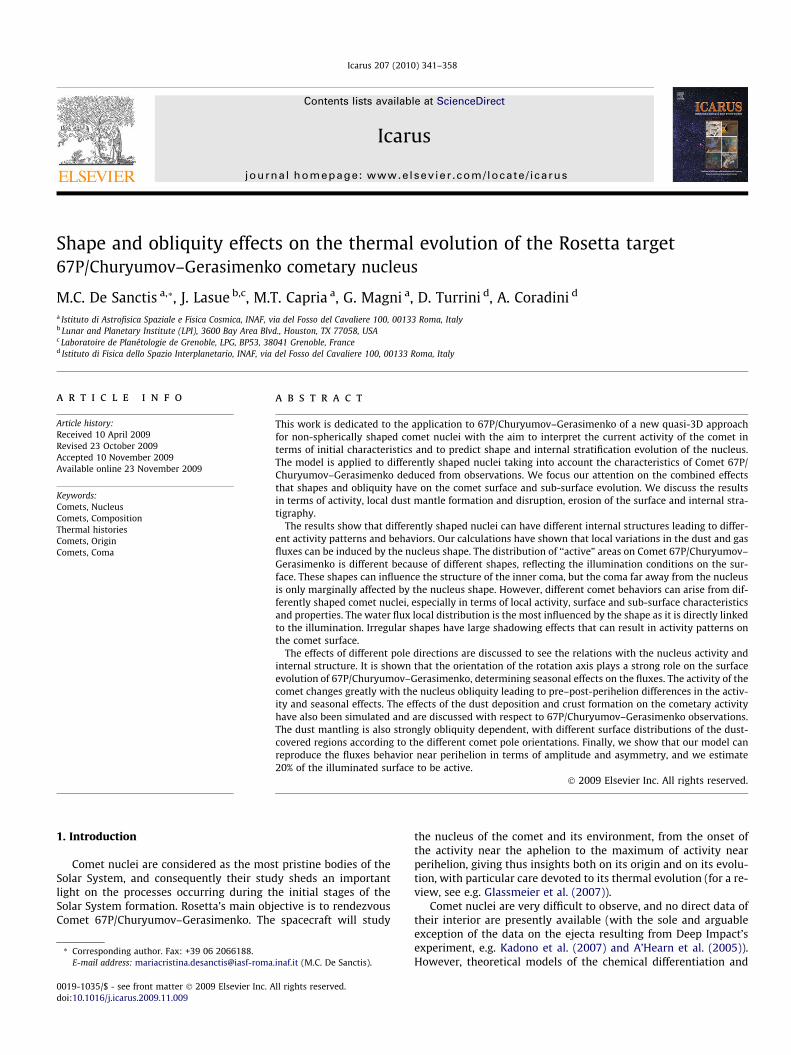
Icarus 207 (2010) 341–358
Contents lists available at ScienceDirect
Icarus
journal homepage: www.elsevier .com/locate / icarus
Shape and obliquity effects on the thermal evolution of the Rosetta target67P/Churyumov–Gerasimenko cometary nucleus
M.C. De Sanctis a,*, J. Lasue b,c, M.T. Capria a, G. Magni a, D. Turrini d, A. Coradini d
a Istituto di Astrofisica Spaziale e Fisica Cosmica, INAF, via del Fosso del Cavaliere 100, 00133 Roma, Italyb Lunar and Planetary Institute (LPI), 3600 Bay Area Blvd., Houston, TX 77058, USAc Laboratoire de Planétologie de Grenoble, LPG, BP53, 38041 Grenoble, Franced Istituto di Fisica dello Spazio Interplanetario, INAF, via del Fosso del Cavaliere 100, 00133 Roma, Italy
a r t i c l e i n f o
Article history:Received 10 April 2009Revised 23 October 2009Accepted 10 November 2009Available online 23 November 2009
Keywords:Comets, NucleusComets, CompositionThermal historiesComets, OriginComets, Coma
0019-1035/$ - see front matter � 2009 Elsevier Inc. Adoi:10.1016/j.icarus.2009.11.009
* Corresponding author. Fax: +39 06 2066188.E-mail address: mariacristina.desanctis@iasf-roma
a b s t r a c t
This work is dedicated to the application to 67P/Churyumov–Gerasimenko of a new quasi-3D approachfor non-spherically shaped comet nuclei with the aim to interpret the current activity of the comet interms of initial characteristics and to predict shape and internal stratification evolution of the nucleus.The model is applied to differently shaped nuclei taking into account the characteristics of Comet 67P/Churyumov–Gerasimenko deduced from observations. We focus our attention on the combined effectsthat shapes and obliquity have on the comet surface and sub-surface evolution. We discuss the resultsin terms of activity, local dust mantle formation and disruption, erosion of the surface and internal stra-tigraphy.
The results show that differently shaped nuclei can have different internal structures leading to differ-ent activity patterns and behaviors. Our calculations have shown that local variations in the dust and gasfluxes can be induced by the nucleus shape. The distribution of ‘‘active” areas on Comet 67P/Churyumov–Gerasimenko is different because of different shapes, reflecting the illumination conditions on the sur-face. These shapes can influence the structure of the inner coma, but the coma far away from the nucleusis only marginally affected by the nucleus shape. However, different comet behaviors can arise from dif-ferently shaped comet nuclei, especially in terms of local activity, surface and sub-surface characteristicsand properties. The water flux local distribution is the most influenced by the shape as it is directly linkedto the illumination. Irregular shapes have large shadowing effects that can result in activity patterns onthe comet surface.
The effects of different pole directions are discussed to see the relations with the nucleus activity andinternal structure. It is shown that the orientation of the rotation axis plays a strong role on the surfaceevolution of 67P/Churyumov–Gerasimenko, determining seasonal effects on the fluxes. The activity of thecomet changes greatly with the nucleus obliquity leading to pre–post-perihelion differences in the activ-ity and seasonal effects. The effects of the dust deposition and crust formation on the cometary activityhave also been simulated and are discussed with respect to 67P/Churyumov–Gerasimenko observations.The dust mantling is also strongly obliquity dependent, with different surface distributions of the dust-covered regions according to the different comet pole orientations. Finally, we show that our model canreproduce the fluxes behavior near perihelion in terms of amplitude and asymmetry, and we estimate20% of the illuminated surface to be active.
� 2009 Elsevier Inc. All rights reserved.
1. Introduction
Comet nuclei are considered as the most pristine bodies of theSolar System, and consequently their study sheds an importantlight on the processes occurring during the initial stages of theSolar System formation. Rosetta’s main objective is to rendezvousComet 67P/Churyumov–Gerasimenko. The spacecraft will study
ll rights reserved.
.inaf.it (M.C. De Sanctis).
the nucleus of the comet and its environment, from the onset ofthe activity near the aphelion to the maximum of activity nearperihelion, giving thus insights both on its origin and on its evolu-tion, with particular care devoted to its thermal evolution (for a re-view, see e.g. Glassmeier et al. (2007)).
Comet nuclei are very difficult to observe, and no direct data oftheir interior are presently available (with the sole and arguableexception of the data on the ejecta resulting from Deep Impact’sexperiment, e.g. Kadono et al. (2007) and A’Hearn et al. (2005)).However, theoretical models of the chemical differentiation and

342 M.C. De Sanctis et al. / Icarus 207 (2010) 341–358
thermal evolution of a nucleus can be used to link coma observa-tions with the characteristics and properties of real nuclei.
In order to prepare adequately the arrival and the landing of theRosetta mission, both long distance observations and numericalmodels of the nucleus and its activity are required. Predictive mod-els of the thermal evolution and differentiation of a cometary nu-cleus are needed to understand the nature of the comet nuclei interms of composition, structure and physical properties, to under-stand the physical phenomena that can occur in comet nuclei andforesee cometary activity.
Numerical models of comet evolution have been developed dur-ing the last two decades, starting from relatively simple one-dimensional representation of an ideal spherical nucleus (Fanaleand Salvail, 1984; Herman and Podolak, 1985; Espinasse et al.,1991; De Sanctis et al., 1999, 2001) to the more complex modelspresently available, which take into account both the latitudinaland the longitudinal variations of illumination (Capria et al.,2001; Cohen et al., 2003; De Sanctis et al., 2005, 2007; Sarid etal., 2005; Rosenberg and Prialnik, 2007). Most of these models dealwith spherical nuclei, but the recent in situ measurements of co-met nuclei have shown typical non-spherical shapes and particulartopography including large depressions and mountain-like fea-tures. The images of the nuclei of Comet 1P/Halley from Giotto(see e.g. Keller et al., 1986), Comet 19P/Borrelly observed by DeepSpace 1 (Oberst et al., 2004), Comet 81P/Wild 2 and 9P/Tempel,from Stardust and Deep Impact, have confirmed these views.
Studies of the thermal and chemical evolution of cometary nu-clei have shown the importance of topography (Colwell, 1997;Gutiérrez et al., 2000, 2001; Lasue et al., 2008). Gutiérrez et al.(2000, 2001) have shown that topographic features of comet nu-clei increase the global water production along the orbit. Theycan also be at the origin of jet-like structures (see e.g. Crifo andRodionov, 1997) as well as the main contributor to the oscilla-tions of the comet’s light-curve. Since the shape of the comet nu-cleus affects its thermal evolution and vice versa (Cohen et al.,2003), it is mandatory to develop a model that takes into accountthe non-spherical shape of the observed comets and their evolu-tion with time.
We applied the model described in Lasue et al. (2008) to thecase of Comet 67P/Churyumov–Gerasimenko. This new approachis suitable to describe non-spherically shaped comet nuclei withthe aim to interpret the current activity of comets in terms of ini-tial characteristics, and to predict the shape and internal stratifica-tion evolution of the nucleus.
2. Comet 67P/Churyumov–Gerasimenko
Comet 67P/Churyumov–Gerasimenko was discovered in 1969,and it belongs to the Jupiter family. Its dynamical history has beenstudied by Beliaev et al. (1986) and Carusi et al. (1985). They foundthat the comet had close encounters with Jupiter in 1840 and 1959that changed the perihelion distance significantly. From 1600 to1959, both the perihelion and aphelion distances of the comet(respectively, q and Q) increased, while its inclination i continuedto decrease slightly. Then, a significant reduction in both q (from2.7 to 1.3 AU) and i (from 28� to 7�) occurred, followed by a com-plete reorientation of the nodal line. These events probably trig-gered an extra activity of the comet, leading to its discovery in1969. The present orbit is characterized by a period of 6.57 years,q = 1.292 AU, e = 0.632 and i = 7.12�. The comet has now completedonly 7 perihelion passages on its new orbit.
67P/Churyumov–Gerasimenko has been poorly observed beforeit was designed as the target of the Rosetta mission in 2004. In thelast few years, the comet was the subject of many observations
and theoretical work, which improved our knowledge of itscharacteristics.
The comet radius has been estimated with different techniques.From HST observations, it seems to be about 2 km, in agreementwith the radius estimated by ground-based observations (Mueller,1992; Kamoun et al., 1998; Tancredi et al., 2000). Radar observa-tions (Kamoun et al., 1998) give an upper limit of 3.7 km for thenucleus radius.
Using Spitzer Space Telescope, Lamy et al. (2008) derived anellipsoid with the principal axes of 4.40–5.20 km, 4.16–4.30 kmand 3.40–3.50 km, corresponding to an effective spherical radiusin the 1.93–2.03 km range and an albedo in the 0.039–0.043range.
From the HST observations of the comet light-curve, it is pos-sible to invert a shape model of the comet by making theassumption of a surface albedo equal to 0.04 and constrainingthe principal axis of the inertia tensor (Lamy et al., 2007). Theseshape models present relatively large variations of the shape ofthe comet and are characterized by the presence of ‘mountains’the size of half the radius of the equivalent ellipsoid discussedearlier. Such irregularities have not yet been seen in cometary nu-clei but could in principle exist due to the small self-gravity ofthese objects.
The rotation axis of 67P/Churyumov–Gerasimenko has beenestimated in different ways. Chesley (2004) estimated that the spinaxis is about (I, U) = (43�, 236�) (where the obliquity I is the anglebetween the orbital and equatorial planes of the comet, and U ismeasured from the vernal equinox of the comet, counter-clock-wise). Schleicher (2006) studied the coma morphology on imagestaken in early 1996 and concluded that the geometry of the fea-tures could be explained if (I, U) = (46�, 262�), or if the rotation isretrograde (I, U) = (134�, 82�). This solution is similar to that ofChesley (2004). Davidson and Gutierrez (2005) using non-gravita-tional forces modeling found a solution where U is 60� ± 15� or240� ± 15�, and I is between 100� and 140� for U � 60�, or in therange 40–80�, if U � 240�. According to Lamy et al. (2007), therotation axis is located at RA = 220� ± 50� and Dec = �70� ± 10�(retrograde rotation). However, there is still very large uncertaintyon the pole direction of this comet.
A dust trail was detected in the Spitzer/MIPS images when thecomet was at 4.5 AU post-perihelion (Agarwal et al., 2007; Kelleyet al., 2009). Because of its dust trail, 67P/Churyumov–Gera-simenko is known as a comet that emits large dust particles (Agar-wal et al., 2007). The dust grains greater than 1 mm are notsensitive to solar radiation pressure and may remain in the vicinityof the nucleus. In 2003, 67P/Churyumov–Gerasimenko’s appear-ance was quite intriguing. The comet exhibited a thin, bright dustcloud, which has been the subject of some controversial interpre-tations. Some observers inferred that the thin dust cloud couldbe composed of dust released around the previous perihelion pas-sage on January 1996. Fulle et al. (2004) concluded that the thinbright cloud was composed of the dust particles ejected more re-cently, in the period approximately 150 days before and after theperihelion. Moreno et al. (2004) used the same approach and ar-gued that the thin cloud is not a dust trail. Therefore, it is likely thatthe thin bright cloud observed in early 2003 is the necklinestructure. According to the recent work by Ishiguro (2008), thedust trail is composed by particles quite large (up to 5 mm inradius) released during the 2002/2003 apparition. Production ratemeasurements of five species are available for 67P/Churyumov–Gerasimenko: OH, CN, C2, C3 and NH. All these species weredetected during both the 1982 and 1996 apparitions. The data onthe water production rate, spanning a large range of heliocentricdistances, reveal a pre–post-perihelion asymmetry, with peak pro-ductivity occurring 1 month after perihelion passage (Agarwalet al., 2007; Lamy et al., 2007).

M.C. De Sanctis et al. / Icarus 207 (2010) 341–358 343
3. Quasi-3D model principle
3.1. General model description
The thermal evolution model takes an approach in which diur-nal and latitudinal temperature variations are calculated by the so-lar insolation onto a rotating 3D cometary-shaped nucleus and forwhich the heat is supposed to flow perpendicularly to the surface.This method is justified by the low-thermal conductivity of come-tary porous material. The model is fully described in Lasue et al.(2008). Here, we will recall only the main assumptions andequations.
We assume a porous, initially homogeneous nucleus composedof amorphous water ice, dust and other volatile species in specifiedproportions (CO, CO2). The dust component is included as dust par-ticles embedded in an icy matrix. The dust size grains are distrib-uted in different size classes and can have different physical andthermal characteristics. At the start of the evolution, the waterice is assumed to consist entirely of its amorphous phase and themodel uses the thermal properties of amorphous ices. The numer-ical code computes the heat diffusion in the porous cometarymaterial, leading to the water ice phase transition and the sublima-tion of the volatile ices. The initially homogeneous nucleus differ-entiates, exhibiting a layered structure, in which the boundarybetween different layers is a sublimation front. The amorphous–crystalline water ice transition is taken into account with the re-lease of gases trapped in the amorphous ice, if any, and the changesin the thermal characteristics (Schmitt et al., 1989). The gases dif-fuse inside the pore system, either re-condensing in the colder lay-ers or else escaping into space. The gas flux and the gas diffusioncoefficients are computed according to the kinetic theory. Themodel foresees different regimes: Knudsen, viscous and an inter-mediate one.
When the ices begin to sublimate, refractory particles are liber-ated, due to the drag exerted by the escaping gas, so that they areeither blown off or accumulate on the surface to form a crust. Thecode computes the ‘‘critical radius”, representing the largest parti-cles that are likely to leave the comet, and compares it to the dustparticles characteristics (radius and mass) of each distribution. Thegrains with radii and masses smaller than the critical values areejected giving, consequently, the number of dust particles thatleave the comet or that reside on the surface. It must be pointedout that the dust size distribution observed in the coma of cometsmay be different from the dust size distribution within the nucleus.The existence in the model of different dust grain size classes al-lows for differential deposition and differential dust emission. Sur-face erosion due to ice sublimation, particles ejection, crustformation and compaction is computed at each step. For furtherdetails, we refer the reader to our previous articles (Coradiniet al., 1997a,b; Capria et al., 1996, 2001; De Sanctis et al., 1999,2003, 2005).
The shape of the comet can be described in our model through athree-dimensional discreet grid defined with the angles h, u and zcorresponding to the colatitudes, longitude and distance from thecenter of the nucleus of each point considered (Lasue et al.,2008). The colatitude is defined equal to zero at the north poleand increases up to 180� at the south pole of the comet; the longi-tude is given between 0� and 360�, in a body fixed coordinate sys-tem, and 0� is the subsolar meridian at perihelion.
The 360� of the longitude length is divided by the number ofsteps in u, n/, and the 180� in latitude is divided by the numberof steps in h, nh. For each point of the grid, the distance z fromthe center of the nucleus, defined by its global shape, is also deter-mined. The illumination at one point of the grid is calculated as theillumination over the surface circumscribed by the four faces of the
quadrilateral defined by the four points of the grid. The local illu-mination is calculated by taking the cosine of the angle betweenthe local normal to the surface and the direction to the Sun, whichhas been determined previously by taking into account the motionof the center of the nucleus along its orbit and the rotation of thecomet (for details, see Lasue et al. (2008)).
The code is thus able to calculate the thermal evolution of com-etary nuclei with non-spherical shapes. The rotation axis is givenvia its celestial angles. Spheroid shapes are defined by their threeprincipal axes. More irregular shapes, like the ones obtained fromthe inversion of the light-curve of 67P/Churyumov–Gerasimenko,are simulated using spherical harmonics functions calculated overthe surface of the comet. For each shape or altered shape, the sha-dow of each point on the surface of the nucleus is calculated bydetermining whether the direction to the Sun from the point con-sidered crosses another part of the nucleus or not. The surface ofthe nucleus can be altered with time by the ejection of cometarymaterial. This erosion can be quantified by the difference betweenthe initial local radius of the point considered on the comet’s sur-face and its value as a function of time. The layering of the sub-sur-face can also be represented as a distance from the current surfaceof the comet. Such a procedure will give us insights on the changeof the surface structure of the cometary nucleus due to its thermalevolution.
3.2. Main equations
Here, we recall only the main equations of the model (for de-tails, see De Sanctis et al. (2005)). The heat diffusion through theporous cometary material is described by the following equation,expressing the conservation of energy:
qc@T@t¼ r½K � rT� þ
X
x
Qx þ Q tr ð1Þ
where T is the temperature, t the time, K the heat conduction coef-ficient, q the density, and c is the specific heat of the cometarymaterial, Qx (for H2O, CO and CO2) is the specific energies gainedor lost by the solid matrix due to sublimation and recondensationof the different ices.
The term Qtr accounts for the energy released during the phasetransition from amorphous to crystalline ice (Ghormley, 1968)according to the activation law experimentally found by Schmittet al. (1989).
The gas flow through the pore system is described by the massconservations equation:
@q@t¼ �rUþ Q � ð2Þ
where q is the gas density, U is the flux, and Q* is the gas sourceterm due to sublimation and recondensation processes.
We assume that the gas density can be related to its pressurethrough the ideal gas law and that the flows of different gases donot influence each other: Eq. (2) can be solved separately for eachgas. In a quasi-stationary regime, Ux can be written as
Ux ¼ �GxrPx ½mol m�2 s�1� ð3Þ
where Px is the partial pressure of gas x, and Gx is its gas diffusioncoefficient. The gas coefficients are computed according to the ki-netic theory of gas. We assume that the gas temperature is alwaysthe same as the matrix through which the gas is moving (the heatcapacity of a gas is usually much less than that of a solid). In sucha situation, the gas pressure variations do not affect its temperature,and we finally obtain:

Table 2Dynamical orbital parameters for a cometary nucleus, with semi-major axis, a,eccentricity, e, and closest distance to the Sun, q. The multistage orbits correspond toa progressive evolution from the Kuiper Belt to the inner Solar System. The threeinjection orbits are the inner Solar System orbits of 67P/Churyumov–Gersimenkoreconstructed by Carusi et al. (1985).
Orbit a (AU) e q (AU)
Multistage 1 50 0.5 25Multistage 2 25 0.4 15Multistage 3 8 0.5 4Injection orbit a 3.84 0.43 2.19Injection orbit b 4.3 0.36 2.75Injection orbit c 3.51 0.63 1.3
344 M.C. De Sanctis et al. / Icarus 207 (2010) 341–358
1RT
@Px
@t¼ r½Gx � rPx� þ Q �x ð4Þ
where R is the gas constant.For each point, the surface boundary condition is the following
(a balance between the solar input and the energy re-emitted inthe infrared, conducted in the interior and used to sublimate sur-face ices):
Sð1� AsÞj cosðZÞjR2
h
¼ erT4s þ KðTsÞ
dTdz
����z¼Rn
þX
f sx � HðTsÞx � _eðTsÞx
ð5Þ
where S is the solar constant, Rh the heliocentric distance of the co-met, As the Bond bolometric albedo of the surface, e is the infraredemissivity of the surface, and r is the Stefan–Boltzmann constant.The term Z represents the local zenith angle. The term |cos(Z)| isthe insolation term that takes into account the spin axis obliquity,the rotation angle and the latitude on the comet’s surface (Sekanina,1979). In the last term of the right hand side, f s
x represents the sur-face fraction covered by different ices, H is the latent heat of subli-mation, and _e is the sublimation rate.
The temperature boundary condition, at the center of the co-met, is
@T@z¼ 0 ð6Þ
The center boundary condition for the diffusion equation isobtained by assuming that the ice is in equilibrium with its va-por, and the partial pressures are equal to the saturation pres-sures at the temperature of the solid matrix. The surfaceboundary condition used to solve the diffusion equation is ob-tained assuming free sublimation of ice at comet nucleus sur-face, when a crust is present, or saturation pressure when theice is present.
The dust flux is determined using the concept of critical radiusas described in our previous articles (De Sanctis et al., 1999, 2005,2007). The ejection of dust grains is localized, in that the code doesnot consider a redeposition of the dust on remote parts of the nu-cleus. This assumption has already been used in previous models(Fanale and Salvail, 1984) and favors the creation of a dust mantlein specific locations of the nucleus.
3.3. Physical parameters used for the calculations
Compositions and internal structure of comet nuclei are poorlyknown and cannot be easily determined from ground observations.Parameters used in these simulations are derived from the obser-vations of 67P/Churyumov–Gerasimenko when available, or other-wise chosen among those that are considered typical for comets(Huebner et al., 2006).
Table 1Initial commons physical parameters for the various cometary nuclei.
Albedo 0.04Dust/ice ratio 1CO2/H2O 0.01CO/H2O 0.01Porosity 0.6Mean pore radius 1.10�4 mInitial temperature 30 KDust grain thermal conductivity 3 W K�1 m�1
Dust grain density 1000 kg m�3
Hertz factor 0.05Comet nucleus radius 2000 mRotation period 12.55 hNumber of initial cells 300
The parameters used are detailed in Table 1. For the purpose ofour work towards comparing the different evolution of differentshapes of comet nuclei, only one set of internal parameters hasbeen used.
The calculations have been made for the full orbital history of acomet like 67P/Churyumov–Gerasimenko. We start our simula-tions from the Kuiper Belt and calculated the early multistageinjection of the comet from the Kuiper Belt to the internal SolarSystem as described by the semi-major axis and eccentricity ofthe orbit in Table 2. After that, we used the dynamical evolutioncalculated by Carusi et al. (1985) as input.
The orbits in the inner Solar System have been divided into28,000 steps of maximum 2 h each, giving thus a good average ofthe illumination on the comet nucleus.
The size distribution of the grains corresponds to five classes ofsizes ranging from 1 lm to 1 cm with a Gaussian size distributionthat has been already used to model comets (see e.g. De Sanctis etal., 2005). The intrinsic thermal conductivity of the ice matrix issmaller than that of compact water ice, because of the reducedcontact area between particles. The reduction is usually describedby the Hertz factor.
Different shapes have been simulated to understand how thetopography and the illuminations conditions influence the evolu-tion and behavior of the models.
For the purpose of our work towards comparing the differentevolution of different shapes and obliquity of comet nuclei, onlyone set of internal parameters has been used. In Table 3, the maincharacteristics of the models are reported. The shapes of the mod-els are depicted in Fig. 1.
Different pole directions have been simulated to understandhow the illumination conditions influence the model evolutionsand behaviors. The pole orientations of model H3 is derived fromthe observations (Lamy et al., 2007).
In our previous article, Lasue et al. (2008), we discussed theresults obtained for different cometary shapes, moving on ficti-tious orbits, instead of the ones here simulated. Moreover, in La-sue et al. (2008), we limited the discussion on the water fluxdistribution and surface behavior, while here we want to discussalso the minor species distribution and internal cometstratigraphy.
Table 3Main characteristics of the shapes used to model Comet 67P/Churyumov–Gerasimenko.
Models Pole (k, b) Dimensions (km) Shape (a/c, b/c)
S0 0�, 0� 2 1, 1E0 0�, 0� 2.686 � 2.125 � 1.7035 1.26, 1.6 (Lamy et al., 2007)H0 0�, 0� 2 (mean radius) 1, 1.1H3 �45�, 7� 2 (mean radius) 1, 1.1D3 �45�, 7� 2 (mean radius) 1, 1.1ED 0�, 0� 2.686 � 2.125 � 1.7035 1.26, 1.6 (Lamy et al., 2007)

Spherical shape, model S0
(a)
Ellipsoidal shape, model E0
(b)
Spherical Harmonic Shape, model H0
(c)
Fig. 1. Comet nucleus shape for the various models: (a) Spherical shape, (b)ellipsoidal shape and (c) spherical harmonic shape.
M.C. De Sanctis et al. / Icarus 207 (2010) 341–358 345
4. Results for differently shaped nuclei
4.1. Model S0 – spherical shape
Spherical nuclei have been used thoroughly by a number ofauthors to describe the thermal evolution of cometary nuclei. Itis thus of interest to compute the evolution of a spherical shapednucleus to compare our results with those available in the litera-ture. The calculations are made through the multistage injectionorbits and three orbits close to the Sun with the previously definedparameters (Table 1). The obliquity is set equal to 0�.
Fig. 2 presents the bi-dimensional Mercator projection on thesurface of the comet of the stratification (difference between thecurrent local radius and the initial local radius) of the comet nu-cleus for the H2O, CO, CO2 and amorphous ice layers at the endof the multistage injection orbits.
This figure represents the condition of the comet when it en-ters into the inner Solar System. The subsequent evolution willgreatly change the comet from the situation depicted in Fig. 2,where the volatile ices are the most evolved and distributed indifferent ways in the comet interior. The less altered regionsare the polar ones where the illumination is less efficient. Theequatorial region, which is the most illuminated part of the nu-cleus, has been the most eroded part of the comet. In that re-gion, the most volatile ice, like CO, are found several tens ofmeters below the surface, while the CO2 ice, being less volatileis found only few meters below the surface. The transitions of
amorphous–crystalline ice are located at depths between theCO and CO2 ice levels.
When the comet is injected in the inner Solar System (Table 2,orbits a–c), we see an increase in the overall activity. The differentorbits are characterized by different levels of gas and dust activitylinked to the different heliocentric distances and to the stratigra-phy of the cometary nucleus.
Orbit b is characterized by a larger heliocentric distance, and thewater flux is almost one order of magnitude lower than that in or-bit c. Moreover, the CO and CO2 fluxes show very small variabilityalong the orbits and are not peaked at the perihelion. The flux ofthe minor species comes from sub-surface layers located at differ-ent depths inside the nucleus. The depth at which the ice is locatedinfluences the flux dependence on the heliocentric distance. Fig. 3presents the Mercator projections of the illumination, fluxes ofwater, fluxes and stratification for the CO2 and CO at the perihelionof the present inner Solar System orbit (orbit c).
Most of the flux comes from the equatorial regions, where theillumination is at its maximum. Consequently, equatorial regionsare the most eroded. The results show that, with respect to the ini-tial conditions, the depths at which we find the sublimation frontsfor the volatile ices are differently distributed. This is due to thefact that the erosion of the surface is faster than the sublimationof the sub-surface ices. The volatile ices are closer to the surfacewhere the surface ablation is faster, i.e. where the dust and waterfluxes are higher.
The depth of the CO, amorphous water ice and CO2 is decreasingwith time, especially in the equatorial regions, where volatile icescan be very close to the surface. We can easily see that the waterflux shows a diurnal dependence on the illumination while theother species do not.
Fig. 4 presents the gas and dust total fluxes as a function of theheliocentric distance for orbit c. The CO and CO2 production ratesare quite constant over the whole orbit, while the H2O and dustfluxes are very dependent on the distance to the Sun. The asymme-try in the gas emission rates between pre- and post-perihelion isclearly visible particularly in the case of the flux of the minor spe-cies in Fig. 4a. There is no variation of the production rate with therotation of the nucleus due to its spherical shape. The asymmetry,with small enhancements in the post-perihelion phase, is due tothe fact that a time lag of the thermal wave exists. In fact, the ther-mal wave needs time to penetrate and to reach the ice inside thecomet nucleus. When the heat reaches the ices, it induces the icesublimation and produces an enhancement of the flux.
4.2. Model E0 – ellipsoidal shape
We considered a model of 67P/Churyumov-Gerasimenkoshaped as an ellipsoid with semi-major axes a, b, c equal to2.686 km, 2.125 km and 1.7035 km, respectively, with aspect ratiosa/b = 1.26 and a/c = 1.57 (coherent with aspect ratio described inLamy et al. (2007)) and an obliquity of 0�. We modeled the cometnucleus in the Kuiper Belt and through its dynamical path from theKuiper Belt to the inner Solar System (Table 2). After the injectionin the inner Solar System, we followed the comet nucleus on theevolutionary dynamical path of 67P/Churyumov-Gerasimenko (Ta-ble 2, orbits a–c).
During its evolution in the outer Solar System, the surface of thecometary nucleus does not change significantly, while the sub-sur-face layers are strongly affected by this long phase: the CO2 ice le-vel is a few meters below the surface, and the CO ice is locatedseveral tens of meters below the surface, as occurred in the previ-ous models (Fig. 5).
When the comet is injected in the inner Solar System, the waterice on the surface starts to sublimate, leading to the ablation of theexternal surface and the formation of dust residuals covering the

Fig. 3. Model S0: bi-dimensional Mercator projections of the illumination, fluxes of H2O, fluxes and stratification for the CO2 and CO at the perihelion of the present innerSolar System orbit (orbit c, Table 2). The erosion plots show the difference in meters between the current local sublimation fronts and the local radius.
Fig. 2. Model S0: bi-dimensional Mercator projection on the surface of the comet of the stratification (difference between the current local radius and the initial local radius)of the comet nucleus for the H2O, CO, CO2 and amorphous ice layers at the end of the multistage injection orbits.
346 M.C. De Sanctis et al. / Icarus 207 (2010) 341–358

Fig. 4. Model S0: (a) evolution of the global gas fluxes versus heliocentric distancein the inner Solar System orbit (orbit c, Table 2) and (b) evolution of the global dustfluxes versus heliocentric distance in the inner Solar System orbit (orbit c, Table 2).
Fig. 5. Model E0: bi-dimensional Mercator projection on the surface of the comet ofthe stratification (difference between the current local radius and the initial localradius) of the comet nucleus for the H2O, CO, CO2 ice layers at the end of themultistage injection orbits.
Fig. 6. Model E0: Mercator projection on the surface of the comet of the dust-covered regions (several spots appear in different locations of the comet surface) atthe end of the evolutions on orbit b.
M.C. De Sanctis et al. / Icarus 207 (2010) 341–358 347
surface. In particular, during orbit b (due to its large heliocentricdistance), the comet develops a dust crust (Fig. 6) in differentlocations of the comet surface. The geometrical pattern of the dustcrust is related to the combination of the different illuminationconditions and to the forces that drag the dust particles from thesurface.
During orbit b, the water flux comes prevalently from the zonesilluminated that are not covered by dust.
After the injection in orbit c, the dust crust is removed, and thewater ice is exposed on the entire cometary surface. Orbit c is char-acterized by a smaller heliocentric distance that enhances theoverall cometary activity, causing the removal of the dust fromthe surface. For this reason, the water flux follows the diurnal var-iation in illumination while the minor species, coming from sub-surface layers, have a different distribution (Fig. 7). These fluxesare the result of a combination of illumination conditions andinternal distribution of the different ices. The CO and CO2 sourcesare more diffused on the comet and the fluxes come also fromthe dark side of the nucleus.
The distribution of the volatile gases is related to the temperatureof the comet interior and to the depth at which the ices are located.The evolution of internal distribution of these species changes dur-ing the comet lifetime, CO2 and CO depths change in respect to thesurface according to the local thermo-physical conditions. On thelast orbit, due to the large activity and the consequently large and ra-pid surface ablation, the CO2 level is getting closer to the surface.
Also, the CO depth is reduced progressively at each orbit due tothe ablation of the external layers. The distribution of the CO sub-limation front changes during the evolution of the comet: when
the nucleus is injected from the Kuiper Belt to the first orbit inthe inner Solar System (orbit a), the maximum depth of the COfront is in the equatorial area, while at the end of the evolution (or-bit c), the minimum depth is at the equator.
It is interesting to note the different distributions of the ices inthe interiors of the comets: the shape influences their distributionsand results in different internal patterns.
The overall CO and CO2 production rates are quite constant overthe whole orbit, while the H2O and dust fluxes are very dependent
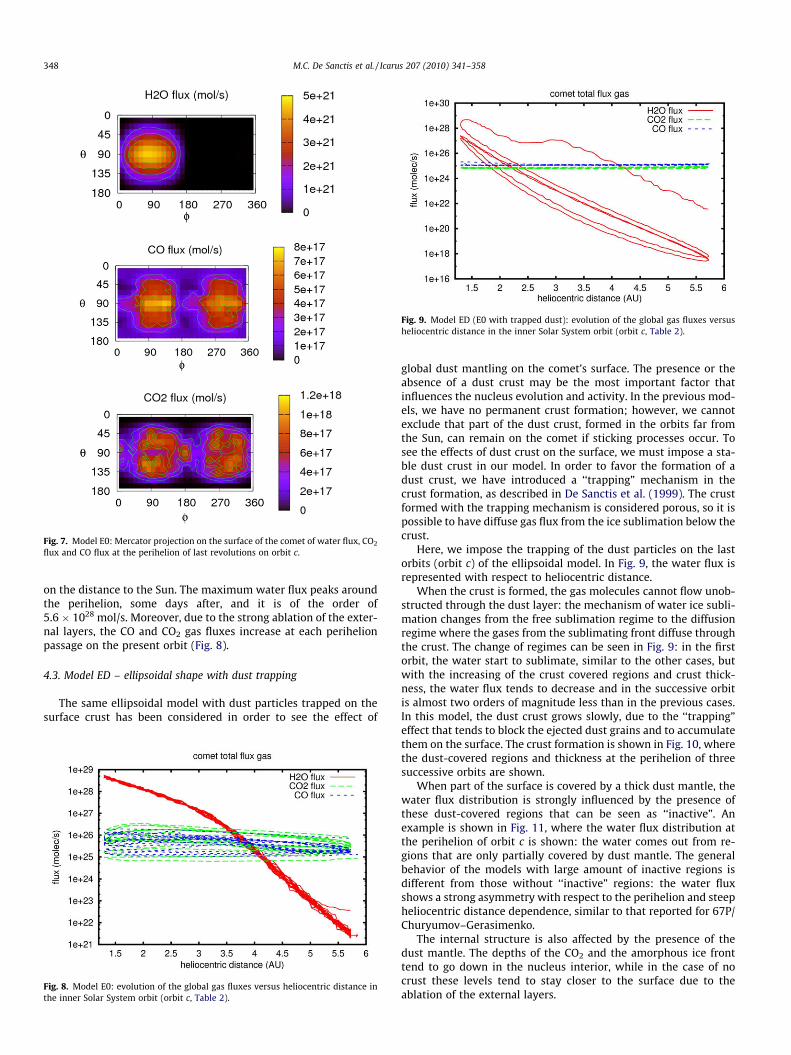
Fig. 7. Model E0: Mercator projection on the surface of the comet of water flux, CO2
flux and CO flux at the perihelion of last revolutions on orbit c.
Fig. 9. Model ED (E0 with trapped dust): evolution of the global gas fluxes versusheliocentric distance in the inner Solar System orbit (orbit c, Table 2).
348 M.C. De Sanctis et al. / Icarus 207 (2010) 341–358
on the distance to the Sun. The maximum water flux peaks aroundthe perihelion, some days after, and it is of the order of5.6 � 1028 mol/s. Moreover, due to the strong ablation of the exter-nal layers, the CO and CO2 gas fluxes increase at each perihelionpassage on the present orbit (Fig. 8).
4.3. Model ED – ellipsoidal shape with dust trapping
The same ellipsoidal model with dust particles trapped on thesurface crust has been considered in order to see the effect of
Fig. 8. Model E0: evolution of the global gas fluxes versus heliocentric distance inthe inner Solar System orbit (orbit c, Table 2).
global dust mantling on the comet’s surface. The presence or theabsence of a dust crust may be the most important factor thatinfluences the nucleus evolution and activity. In the previous mod-els, we have no permanent crust formation; however, we cannotexclude that part of the dust crust, formed in the orbits far fromthe Sun, can remain on the comet if sticking processes occur. Tosee the effects of dust crust on the surface, we must impose a sta-ble dust crust in our model. In order to favor the formation of adust crust, we have introduced a ‘‘trapping” mechanism in thecrust formation, as described in De Sanctis et al. (1999). The crustformed with the trapping mechanism is considered porous, so it ispossible to have diffuse gas flux from the ice sublimation below thecrust.
Here, we impose the trapping of the dust particles on the lastorbits (orbit c) of the ellipsoidal model. In Fig. 9, the water flux isrepresented with respect to heliocentric distance.
When the crust is formed, the gas molecules cannot flow unob-structed through the dust layer: the mechanism of water ice subli-mation changes from the free sublimation regime to the diffusionregime where the gases from the sublimating front diffuse throughthe crust. The change of regimes can be seen in Fig. 9: in the firstorbit, the water start to sublimate, similar to the other cases, butwith the increasing of the crust covered regions and crust thick-ness, the water flux tends to decrease and in the successive orbitis almost two orders of magnitude less than in the previous cases.In this model, the dust crust grows slowly, due to the ‘‘trapping”effect that tends to block the ejected dust grains and to accumulatethem on the surface. The crust formation is shown in Fig. 10, wherethe dust-covered regions and thickness at the perihelion of threesuccessive orbits are shown.
When part of the surface is covered by a thick dust mantle, thewater flux distribution is strongly influenced by the presence ofthese dust-covered regions that can be seen as ‘‘inactive”. Anexample is shown in Fig. 11, where the water flux distribution atthe perihelion of orbit c is shown: the water comes out from re-gions that are only partially covered by dust mantle. The generalbehavior of the models with large amount of inactive regions isdifferent from those without ‘‘inactive” regions: the water fluxshows a strong asymmetry with respect to the perihelion and steepheliocentric distance dependence, similar to that reported for 67P/Churyumov–Gerasimenko.
The internal structure is also affected by the presence of thedust mantle. The depths of the CO2 and the amorphous ice fronttend to go down in the nucleus interior, while in the case of nocrust these levels tend to stay closer to the surface due to theablation of the external layers.

Fig. 10. Model ED (E0 with trapped dust): Mercator projection on the surface of thecomet of evolution of the dust-covered regions (several spots appear in differentlocations of the comet surface) during the first orbit c. (a) Condition at start of theorbit, similar to the one presented in Fig. 7; (b) condition after one quarter of theorbit at about 3 AU from the Sun and (c) condition after the perihelion passage,afterwards no significant variation of the dust coverage is obtained.
M.C. De Sanctis et al. / Icarus 207 (2010) 341–358 349
4.4. Model H0 – spherical harmonics shape
A simulation of Comet 67P/Churyumov–Gerasimenko has beendone using a spherical harmonics shape similar to the one deduced
Fig. 11. Model ED (E0 with trapped dust): Mercator projection on the surface of the come
from 67P/Churyumov–Gerasimenko observations (see Fig. 3 andLamy et al., 2007). The nucleus has an obliquity of 0�.
During its aging in the Kuiper Belt and the transfer orbits, thecomet evolves and loses most of its volatile ices from the interior.When the comet arrives in the inner Solar System, the CO ice levelis located several meters below the surface, the CO2 is near the sur-face, and the erosion of the surface is small. No dust crust is presenton the surface. This evolution is similar to the ones previously pre-sented. Even if the shape is significantly different from those pre-viously explored, the resulting internal stratigraphy due to theevolution in the Kuiper Belt is similar.
After the injection in the inner Solar System, the comet starts todifferentiate, losing water, dust and volatile gases. During orbit b,the comet develops a dust crust on its surface. In Fig. 12, the evo-lution of the dust mantle is reported.
Also in this case, the more exposed parts of the surface of thecomet, after the loss of the water, remain covered by the dust.The mid-latitudes of the flattest part of the comet are those thatmore easily become covered by the dust mantle.
The reason why this happens is related to the combined ac-tions of gas drag and centrifugal forces versus comet gravity:the dust settles where the flux is enough to blow off the smallergrains, leaving the larger particles on the surface. Where the fluxis large, as in the equatorial regions, particles of all sizes areblown off, and the comet surface is always a mixture of icesand dust. On this orbit, the water flux comes from those illumi-nated part of the comet that are not completely covered by thedust mantle.
When the comet moves in the inner orbit c, the larger solar illu-mination is such that the water flux increases so that all the dustgrains are blown off from the surface. The crust that was presentis completely removed after the first passage in the inner Solar Sys-tem orbit.
The water flux follows the illumination conditions, as can beseen in Fig. 13, while the other species, coming from the sub-sur-face, are less dependent from the illumination conditions. While,as usual, the water flux comes prevalently form the day side, theCO and CO2 fluxes are present also during the night. In Fig. 13e,shadowing effects of the shape can be observed.
The distribution of the fluxes of the minor species is linked alsoto their stratification inside the comet. For this particular shape,the CO and CO2 ices are closer to the surface in the equatorial re-gions. The continuous ablation of the surface layers is such thatthe ices that were confined well below the surface tend to belocated not far from the surface, especially the CO2. The CO is at
t of the illumination, water flux and dust crust at the perihelion of the second orbit c.

Fig. 12. Model H0: Mercator projection on the surface of the comet of evolution ofthe dust-covered regions (several spots appears in different locations of the cometsurface) during orbit b. (a) Condition at start of the fifth revolution on orbit b; (b)condition at sixth revolution on orbit b; (c) condition at start of the seventhrevolution on orbit b and (d) condition at the tenth and last revolution on orbit b.
350 M.C. De Sanctis et al. / Icarus 207 (2010) 341–358
larger depth, but this depth will decrease at each orbit. We can ex-pect volatile ices to be located not far from the surface.
The flux distribution of the minor species is a strong indicationof the depth at which those ices are. The more the distribution fol-lows the illumination condition, the more the ice is located nearthe surface. This is clear if we compare the water flux with theCO2 flux.
The internal stratigraphy resulting from this model is linked notonly to the shape, but also to the obliquity of the comet. The equa-torial regions are those that present the stronger ablation sincethey are more illuminated.
The overall water gas flux is of the order of 5.7 � 1028 mol/s atthe perihelion of orbit c and less than 1022 mol/s at the aphelion
(Fig. 14). The CO and CO2 production rates are more constant overthe whole orbit, being in the range 1025–1026 mol/s. These fluxesare compatible with the upper limit on the CO production rate of<9.2 � 1026 mol/s obtained at 3 AU (Bockelee-Morvan et al., 2004).
We can see that, due to the fast erosion of the external layerscontaining only dust and water, the CO and CO2 ice levels comenear the comet surface and the corresponding fluxes increase aftereach orbit. The water shows small asymmetry in its flux betweenthe pre- and post-perihelion activity, while the minor species showa clear enhancements in the post-perihelion phase. This is consis-tent with the observations of 67P/Churyumov–Gerasimenko(Schleicher, 2006) that reported a continued increase in gas anddust production to a peak about a month following perihelion,and a large pre–post-perihelion asymmetry. This behavior can bedue to the thermal lag of the first layers.
4.5. Model H3 – spherical harmonics shape with pole coordinates atk = �45�, b = 7�
In this case, calculations have been performed using a pole po-sition that correspond to the orientation of the polar axis deducedfrom the observations and expressed in the cometary referenceframe (Lamy et al., 2007) (see Table 3) and a spherical harmonicsshape (similar to Lamy et al. (2007)).
During the aging in the Kuiper Belt and the multistage capturemechanism, the comet nucleus evolves from a homogeneous mate-rial to a layered structure where the volatile ices are the mosteroded and distributed in different ways in the comet interior.The surface is a mixture of dust and water ice, the CO2 sublimationfront and the crystallization front are few meters below the sur-face, while due to the high volatility of CO, the sublimation frontof this ice is several meters below the surface. We can recognizea slight asymmetry in the ices distributions being the northern partless altered. The CO ice distribution is mainly due to the past evo-lution in the multistage capture processes from the Kuiper Belt tothe inner Solar System.
We can see that the obliquity effects are negligible when the co-met is very far from the Sun. This evolution is similar to the previ-ous seen for differently shaped nuclei with 0� of obliquity. No dustmantle is present on the surface of this model.
In the first two orbits in the Solar System (Table 2, orbits a andb), we see the formation of the dust mantle (Fig. 15). The character-istics of these two orbits are such that the comet is at quite largeheliocentric distance, implying that only the smaller grains areblown off from the comet surface, while the larger ones remainon the comet, forming the crust. In particular, orbit b has a verylarge perihelion distance: during this dynamical phase, all the sub-limation phenomena are reduced and the gas and dust activity ispartially quenched. In our approach, the dust mantle is formedby dust particles that are no more embedded in the icy matrix sothey are free to move off from the nucleus. The dust starts to accu-mulate in equatorial regions. However, this crust is not stablewhen the comet moves on orbits closer to the Sun (orbit c, Table2), and the gas flux is strong enough to remove dust layers.
On the present orbit, the water flux comes directly from the sur-face of the comet and produces different spots of activity that fol-low the day/night variation and the shadows caused by the cometshape. In Fig. 16, the water flux is shown in relation with the illu-mination of the surface during a comet rotation at the perihelionand aphelion of orbit c. The water gas activity is directly dependenton the solar illumination. The gas activity main modulation is dueto the seasonal effects: the maximum of the activity is in the south-ern hemisphere at perihelion and in the northern hemisphere atthe aphelion.
With this rotation axis orientation, the northern regions arecompletely in the shadow at perihelion and do not contribute

Fig. 13. Model H0: Mercator projection on the surface of the comet of the illumination, water, CO and CO2 fluxes at the perihelion of last revolutions on orbit c.
Fig. 14. Model H0: evolution of the global gas fluxes versus heliocentric distance inthe inner Solar System orbit (orbit c, Table 2).
M.C. De Sanctis et al. / Icarus 207 (2010) 341–358 351
significantly to the gas activity at perihelion, which is drivenmainly by the southern circumpolar areas. The gas and dust activ-ity at the perihelion is concentrated in the southern regions thatare subjected to a strong ablation, while the northern hemisphereremains ‘‘untouched” by this activity.
The nucleus that results from this odd activity, concentrated inthe south polar regions, has a peculiar internal structure, with old,devolatilized terrains in the northern hemisphere and fresh, less al-tered terrains in the southern areas. The inclination of the spin axisis very important for the internal layered structure of the cometnucleus: in the southern hemisphere the ices are close to the sur-
face, while the northern hemisphere shows a larger differentiation,with the ices sublimation fronts located very far from the surface(Fig. 17).
This internal structure is reflected in the global gas activity ofthe comet. The total gas production rate versus the heliocentricdistance is shown in Fig. 18.
It is interesting to notice that there is a strong asymmetry nearaphelion in this case, with a flux that is one order of magnitude lar-ger than in the previous cases. This is due to the fact that, with thisgeometry, the north pole is oriented towards the Sun at aphelionand was practically not illuminated during the perihelion passage,which leads to a higher activity at large distances from the Sun. Thewater curve is different from the previous models, even if the peakof the flux is more or less the same. The differences in water activ-ity are more evident at large distances from the Sun. Also, the min-or species show different trends, with large asymmetry pre–post-perihelion and a strong dependence from the heliocentric distance.The CO and CO2 fluxes are peaked after perihelion, showing asym-metric curves with respect to the perihelion. The activity peaks aredue to the fact that the sublimation fronts are closer to the surfaceat perihelion.
4.6. Model D3 – spherical harmonics shape with pole coordinates atk = �45�, b = 7� and dust trapping
In this case, we simulated a model with the same characteris-tics as model H3, but with a dust mantle imposed on the surfaceusing the same ‘‘dust-trapping mechanism’’ adopted for model ED(De Sanctis et al., 1999). In model D3, a stable crust forms on thecomet surface with a strong effect on the comet activity. When athick crust is formed, the gas molecules cannot flow unobstructed

Fig. 15. Model H3: Mercator projection on the surface of the comet of evolution ofthe dust covered during orbit b. (a) Condition at start of second revolution on orbitb; (b) condition after three revolutions on orbit b and (c) condition at the end oforbit b.
352 M.C. De Sanctis et al. / Icarus 207 (2010) 341–358
through the dust layer and the gas flux quenches. The crust growsslowly, due to the quenching of activity and the consequent smallnumber of free particles, and tends to reduce the water flux. Inthose regions covered by the dust, the water flux is stronglyquenched and these dust-covered regions can be seen as ‘‘inac-tive” (Fig. 19a). In this model, after few orbits, the dust mantleis very thick and the comet is mostly inactive (Fig. 19b): onlyone single spot of activity is seen on the comet surface. The gen-eral behavior of the models with large amount of inactive regionsis different from those without ‘‘inactive” regions: the water fluxshows a larger asymmetry with respect to the perihelion andsteep heliocentric distance dependence, especially for the minorspecies.
5. Discussion
The model presented here is able to simulate fully irregularcometary nuclei for any combination of orbit and rotation param-eters. This code can work with realistic cometary shapes and canbe seen as a tool able not only to predict comet thermal evolu-tion, but also to help in the analysis of the data obtained by fu-ture cometary missions, such as Rosetta. The model has beenapplied to several simulated cometary nuclei with different poledirections.
5.1. Results of the models in terms of activity
Our calculations have shown that local variations in the dustand gas fluxes can be induced by the nucleus shape and obliquity,even if the total gas fluxes are similar for different shaped nuclei.
From the results here shown, we can say that the activity pat-tern of Comet 67P/Churyumov–Gerasimenko is strongly influencedby the pole direction. We see different comet behaviors for thesame shape by using different inclination of the spin axis. Thewater flux comes directly from the surface of the comet and pro-duces different spots of activity that follow the day/night variation:a clear dependence of the gas activity on the illumination can beseen. Also, the release of the other minor species depends on theillumination conditions but is less sensitive to the diurnal varia-tions of illumination over the surface. This is due to the fact thatthe sublimation fronts of these ices are located below the surface,in the comet interior. The distribution of these volatile gas fluxesare linked to the depth at which these ices are inside the comet.
The relative importance of sublimation, radiation and conduc-tion depends on the surface inclination with respect to the Sunin a non-linear manner. The results obtained show that there aretwo modulations to the water activity: a ‘‘short term” due to thediurnal variation and a ‘‘long term” due to pole direction. This‘‘long-term” modulation is a seasonal effect: the maximum of theactivity is concentrated in the hemisphere that is prevalently illu-minated. The ‘‘active” hemisphere changes during the cometmovement on its orbit, according to the pole direction. In the ex-treme case of spin axis precession, the comet activity may changegreatly during the orbit.
In case of inclined spin axis, a strong seasonal effect can be seenin the gas and dust flux local distribution, while in case of poledirection perpendicular to the orbital plane, no seasonal effectsare visible and the equatorial regions are the ‘‘active” regions alongthe orbit.
The only data for which the distribution of the inner coma hasbeen studied in detail at subkilometer scales are those of Comet9P/Tempel 1, obtained with the Deep Impact Mission. The map ofTempel 1 water emission shows a near-nucleus enhancement inthe sunward direction (Feaga et al., 2007). In regions far from thenucleus and in the anti-sunward direction, the H2O distributionis much more uniform. The Deep-Impact data confirm our generalresults on the link between the Sun illumination and the water fluxdistribution in the inner coma.
From our models, we have seen that irregular shapes can havelarge shadowing effects resulting in very diverse activity patternson the comet surface (models H0 and H3). The distribution of‘‘active” areas varies with the shape and obliquity, reflecting theillumination conditions on the surface. These shadowing effectsare clearly seen in the water flux maps of the spherical harmonicshaped nucleus.
When the ice is at the comet surface, the water flux comes prev-alently from the comet dayside, and it is concentrated where theillumination is maximum, in the sunward direction.
If Comet 67P/Churyumov–Gerasimenko has an irregular shape,as suggested by some inversion technique (Lamy et al., 2007), withlarge areas in shadows, we can expect an irregular distribution inthe emission of water from the surface. The near-nucleus watercoma can be strongly affected by the comet shape, with enhance-ments and decreases as indicated by the results shown in thisarticle.
In model H3, we have simulated a comet nucleus as the one de-rived from the observations of 67P/Churyumov–Gerasimenko(Lamy et al., 2007): irregular spherical harmonic shapes and obliq-uity about �45�. The simulations give us a scenario with an irreg-ular distribution of water from the surface, coming mainly fromthe illuminated south sub-polar regions at the perihelion. Also,

Fig. 16. Model H3: Mercator projection of the illumination (a) and fluxes of water (b), CO2 (c) and CO (d) at the perihelion of the present inner Solar System orbit andMercator projection of the illumination (e) and fluxes of water (f), CO2 (g) and CO (h) at the aphelion of the present inner Solar System orbit.
M.C. De Sanctis et al. / Icarus 207 (2010) 341–358 353
the minor species show strong enhancements in southern hemi-sphere at perihelion. The modeled cases can give insights on whatwe can expect in the near-nucleus coma of Comet 67P/Churyu-mov–Gerasimenko with enhancements and decreases. Moreover,we have seen that, when the dust mantle is present, the water fluxcomes prevalently from those regions not covered by dust that canbe defined as ‘‘active regions”.
The flux distributions of the minor species are less influenced bythe illumination condition on the surface, but they depend on thelocation of the sublimation fronts inside the cometary nucleus. Ingeneral, CO and CO2 fluxes are present also during the night, andtheir distribution is linked also to their stratification inside the co-met. The sub-surface distribution of volatile ices influences theactivity of these species. We see a modulation due to a seasonal ef-fect in case of inclined spin axis: the activity is concentrated in theregion that is prevalently illuminated. This region can change goingfrom the aphelion to the perihelion, according to the comet spinaxis. In the regions where the sublimation fronts are located nearthe surface, the sublimating layers are easily maintained at thesublimation temperature of the volatile ices. In those areas, wesee a continuous gas flux during the comet rotation.
Also in this case, the only data of CO2 distribution in the nearcoma are those of Comet 9P/Tempel 1, the distribution of the
CO2 gas in the inner coma was mapped and an asymmetry wasfound, which was interpreted as the indication of chemical heter-ogeneities, thermal-lag and sub-surface gradient of CO2 with re-spect to H2O (Feaga et al., 2007). 9P/Tempel 1 asymmetry in CO2
emission can be compared with the results that we found for themodels presented here. In our models, the CO2 flux enhancementscorrespond to regions where the CO2 ice level is near the surface,implying different sub-surface gradients of CO2/H2O in differentcomet areas. We see sub-surface chemical heterogeneities in thenucleus related to the comet shapes and obliquity.
From these models, we have seen that the combinations of dif-ferent cometary shapes and obliquities develop different internalstratigraphies: it is likely that the distribution of gases in thenear-nucleus coma can give hints on the internal comet properties.
The modeled cases can give insights on what we can expect inthe near-nucleus coma of Comet 67P/Churyumov–Gerasimenko.The coma far from the nucleus will be more uniform, being thecumulative result of several emission cycles. The fluxes that wesee from ground-based telescopes are the integration of the earlierdiscussed fluxes and are much less dependent on the comet shapethan the fluxes in the near-nucleus coma.
The rotationally averaged gas production rate of an irregularbody can be different from that of a sphere due to shadowing

Fig. 18. Model H3: evolution of the global gas fluxes versus heliocentric distance inthe inner Solar System orbit (orbit c, Table 2).
Fig. 19. Model D3: Mercator projection on the surface of the comet dust-coveredregions (a) and the water flux (b).Fig. 17. Model H3: Mercator projection of the internal stratigraphy of CO and CO2
ices on the present orbit. The figure shows the difference between the current localsublimation fronts and the local radius.
354 M.C. De Sanctis et al. / Icarus 207 (2010) 341–358
effects (Gutiérrez et al., 2000; Lasue et al., 2008). Here, comparingthe results obtained for different spin axis orientations, we see thatthe averaged gas production rates of the minor species versusheliocentric distance are different when diverse orientations ofthe spin axis are considered (Fig. 20b and c).
The global activities of the minor species show large variety oftrends with large asymmetries between pre- and post-perihelionflux. This indicates that the obliquity effects are important on theglobal flux of the comet, also for the activity at large heliocentricdistance.
It is difficult to compare the models results with the 67P/Chu-ryumov–Gerasimenko observations, due to the small amount ofdata available. The ground-based data of Comet 67P/Churyumov–Gerasimenko are relative to the production rate of five species:OH (used for calculating the production rate of H2O), CN, C2, C3and NH (Schleicher, 2006; Lamy et al., 2007). Many observers re-ported that both the Afq and the H2O production rates reach their
maxima around 30 days after perihelion (Schleicher, 2006; Agar-wal et al., 2007). According to Weiler et al. (2004), this cometshows a strong perihelion asymmetry: the enhanced activitypost-perihelion can be seen in the CN production rates and Afqvalues.
In Fig. 20, we reported the OH production rates observations andthe total fluxes resulting from the models. If we look at the water fluxemission around perihelion, we note that an asymmetry in the waterproduction rate is foreseen by our models to some extent. The sim-ulated water flux peak occurs few days after perihelion. These re-sults are in agreement with the observations. Schleicher (2006)reports that gas and dust production peaks approximately 1 monthfollowing perihelion, after a near-continuous steep rise in produc-tion for several months. Following this peak, production rates dropat a slower but still steep rate. The model H3, with the obliquity de-rived from the observation, shows large asymmetries in the CO andCO2 fluxes that are peaked about 30 days after the perihelion andshow strong heliocentric dependence in their fluxes, similar to thetrend reported for other minor species in Comet 67P/Churyumov–Gerasimenko (Schleicher, 2006). The models with 0� obliquity showdifferent CO and CO2 curves: they are smoother, with smallerenhancements after perihelion, and the peak of the activity delayedwith respect to the case with 45� obliquity.
The behavior showed by model H3 is due to the fact that the COand CO2 sublimation fronts are very close to the surface in the sub-polar regions, and these regions are illuminated at the perihelion,while they are completely in shadows at the aphelion. The southregions can be considered as active areas for the sublimation ofminor species. The pre–post asymmetry in their curves dependson how the Sun illuminates the nucleus. When the Sun starts toilluminate the regions where these ices are close to the surface,they start to sublimate in a vigorous way. The consequent ablationof the external layers at the perihelion helps in the upliftment ofthe sublimation fronts that become reachable by the heat waveincreasing the gas sublimation. After the perihelion, the heatingof the nucleus decreases and, moreover, the Sun starts to illumi-nate regions less rich in volatile gas, resulting in the decrease inthe gas flux.

Fig. 20. Evolution of the global gas fluxes of the different models in days fromperihelion in the inner Solar System orbit (orbit c, Table 2) compared with waterflux observation (from Lamy et al. (2007)). The bold curves represent the simulatedfluxes, the thin curves the simulated fluxes with a reduction factor of 20%.
M.C. De Sanctis et al. / Icarus 207 (2010) 341–358 355
We obtain a water flux that is a factor 2–5 larger than the ob-served one. The high values of total fluxes obtained from thesemodels with respect to the observations, can indicate a smaller nu-cleus or that part of the nucleus is not contributing to the observedactivity.
Normally, the observers use the term ‘‘active fraction”, which isthe fraction of surface needed to have the observed water flux, gi-ven the comet radius. For 67P/Churyumov–Gerasimenko, Lamyet al. (2007) estimated an active fraction of 7%, implying that most
of the surface of 67P/Churyumov–Gerasimenko is inactive. How-ever, this is a very simple way to describe the comet activity, whichassumes that every area of the surface of the comet has the samesublimation rate. We have seen that the comet water flux variesover the comet surface in relation with the shape and illumination,so it is not reasonable to assume a constant sublimation rate toevaluate the fraction of active surface as this will underestimatethe fraction of active area. In our models, the maximum of the totalwater activity is about 5 � 1028 mol/s. This is larger than the ob-served water production rate (1–2 � 1028 mol/s). To obtain resultscomparable to the observed rates, we can assume a smaller nu-cleus or limit the ‘‘active surface” to about 20–40% of the total areaof the comet. Assuming that only 20% of the surface is active, weobtain a water flux compatible with the observations (Fig. 20a, thincurves) and approximately compatible with the 7% of active sur-face previously determined, as usually about a quarter of the sur-face sublimates water in our model (see e.g. Fig. 4). However,even if in this way the peak of the water activity is compatible withthe observed one, the water flux curves (flux versus heliocentricdistance) are different.
The shape of the water emission curve from most of our modelsis not exactly the same as the observed one, the simulated curvebeing less steep. The fact that the 67P/Churyumov–Gerasimenkoobservations show an asymmetry in the activity is partiallyexplained by our models, but it should be related also to other fac-tors, including the possibility of sub-surface sublimation of water,as in model ED or D3. We have seen that many models predict theformation of a dust crust on orbit b. The formation of the dust crustwhen the nucleus is far from the Sun has been obtained also forone-dimensional models of 67P/Churyumov–Gerasimenko (DeSanctis et al., 2005). These models present the advantage to supplya three-dimensional determination of the location of the crust andits local effect on the cometary nucleus, e.g. the increase in surfacetemperature at those locations, the quenching of H2O and dustejection, and the change in the local stratigraphy of sub-surfacelayers.
We can note that the crust forms naturally where the gas flux isintense enough to lift off only the smaller dust grains, leaving thelarger ones on the comet surface. In both models, the areas coveredby the dust are located at mid-latitudes, on the flattest parts of thenucleus. In those regions, the combination of molecular flux, grav-ity and centrifugal forces act on the stability of the dust on the co-met surface. However, in our model, the dust mantle can beremoved if the gas flux is high enough, i.e. when the comet moveson the present orbit (orbit c), with the reduction in the heliocentricdistance and the increase in the overall activity. No sticking pro-cess is normally taken into account in these models after the dustcrust formation: the dust crust formation and disruption are trea-ted as reversible processes. If we introduce a sticking mechanismto maintain the dust mantle on the comet (dust-trapping mecha-nism and cohesive forces have been suggested to justify the pres-ence of stable dust crusts on the surface of comets), we easilyobtain the areas of the surface covered by dust also on the presentorbit of 67P/Churyumov–Gerasimenko, as in the case of models EDand D3. We have applied the dust-trapping mechanism to modelsED and D3: a stable crust forms on the comet surface with a strongeffect on the comet activity that can be seen in Fig. 20a. Previous1D simulations (De Sanctis et al., 2005) have shown that such abehavior could be obtained if a smaller fraction of the nucleus isactive due to the presence of a dust crust. In case of dust trappingwith consequent formation of crust, the water can sublimate notonly from the surface but also from layers under the dust, andthere is a time delay in the activity proportional to the depth ofthe water sublimation front, leading to an emission asymmetry.
In models ED and D3, the water sublimates from the sub-sur-face under the dust-covered regions: the water comes out mainly

356 M.C. De Sanctis et al. / Icarus 207 (2010) 341–358
from those regions where the dust thickness is less, and, conse-quently, the sublimation is not completely quenched. The valuesof water flux obtained from models ED and D3 on the last orbitsare much less than the observed ones, while the water flux onthe first orbit is more similar to the observed one. The higher fluxduring the crust forming is due to the fact that, during this orbit,there are some regions where the dust thickness is still small,and the sublimation happens mainly from such regions: the gasdiffuses inside the porous dust mantle according to the kinetic the-ory. With the increase in the dust thickness, the gas is partiallyquenched to the level that we found in the last orbits. The strongquenching effects of the dust mantle have been recognized in otherpapers (Rosenberg and Prialnik, 2009; De Sanctis et al., 1999,2005). To fit the water flux observations, we can think that a smal-ler area is covered by the thick dust mantle or that a thin dust man-tle is covering the comet surface. In fact, if we consider a thinnerlayer of dust, as during the crust formation period, the gas flux isless quenched flowing through the layer, and it is possible to havethe observed values of the flux. Moreover, if the spin axis is in-clined as in model H3 and the water sublimates from a layer belowa thin dust mantle, we can expect a steep rise of the activity beforethe perihelion, followed by a smoother activity curves after theperihelion, similar to the behavior showed by the minor speciesin model H3.
According to our findings and comparing with the observations,67P/Churyumov–Gerasimenko could have water gas coming outfrom sub-surface sources, located in the southern hemisphere.
5.2. Discussion of the results of the models in terms of surface ablationand internal nucleus properties
The modeled fluxes lead to the erosion of the comet nucleus andthus modify the characteristics of the nucleus. The differential ero-sion of the comet nucleus can lead to shapes that differ from theoriginal ones. Such shape variations will have not only an impor-tant effect on the illumination and the fluxes of the comet, but theycan also alter the dynamics of the comet nucleus (rotation axis,period, etc.).
Moreover, our calculations showed that, on secular timescales,very important morphological features can be erased or changedby the different fluxes of gas and dust occurring at different loca-tions on the nucleus. Models with different shapes and obliquitieshave different stratigraphies, resulting in different spatial distribu-tions of the volatile gases. It is interesting to see how the ices aredistributed in the comet interiors: the shape and the axis inclina-tion influence their distributions resulting in different patterns inthe comet interior. In case of inclined spin axis, we see the asym-metric erosion of the surface. The water and dust fluxes come prev-alently from the regions illuminated. Due to the comet obliquity,activity shows not only a large variation during the orbit, but alsothe location of this activity changes during the comet orbit. Theerosion of the comet surface is linked with the flux of water anddust, and the resulting asymmetry is due to the larger flux in thecomet areas exposed to the Sun at perihelion.
Depending on the orientation of the pole, the regions orientedtowards the Sun at perihelion are the most eroded. During its life,the comet changes its original shape resulting in uneven morphol-ogies. The most altered of the calculated cases is H3, due to the factthat the south pole is exposed to the Sun at the perihelion. Theasymmetric erosion, determining changes in the symmetry of theshape, can have effects on the orientation of the spin axis. Changesof the principal symmetry axis can result in wobbling of the comet.
The distribution of the ices inside the comet is determined bythe comet evolution. The results show that volatile ices are distrib-uted at different depths inside the comet, being more or less closeto surface. The water ice mixed with the dust is on the comets sur-
face except for those areas covered only by dust. In those regions,the water ice is just below the dust mantle. Volatile ices are locatednear the surface only in the most eroded part of the comet; other-wise, ices as CO and CO2 are located far from the surface. Theeroded regions can be seen as ‘‘young and fresh” terrains, becausethey have the largest activity that removes altered materials. Be-neath those regions, the interior close to the surface is the ‘‘mostpristine”. In those regions, the composition near the surface is sim-ilar to the original one. On the contrary, the less ablated regions, insome sense those most ‘‘old and altered”, are those behind whichthe most differentiated material can be found. Under those areas,different ice species are stratified according to their sublimationtemperature, with the most volatile ones hidden deep inside thecomet.
5.3. Dust mantling
In all the cases investigated, dust mantles are formed during theinner Solar System orbits at large heliocentric distance. The regionscovered by the dust are different and depend on the comet obliq-uity. The comet axis inclination is the key parameter in the dustmantling: comparing the results obtained for models with thesame shape and different obliquities, H0 and H3, we recognize thatthe crust forms in different locations. The role of the obliquity isclear in the formation of dust-covered regions: we see that differ-ent regions of the comet are covered by dust depending on theobliquities of the models. In all the models with 0�, the mantles oc-cur at about the same latitudes, with small deviations dependingon the shapes. In model H3, with a large obliquity, the mantle oc-curs at equatorial region, differently in respect to the other models.So, the position of the spin axis influences the distribution in lati-tude of the dust mantle.
The role of the spin axis inclination on the dust mantle forma-tion has been investigated by Rickman et al. (1990) using a moresimple and one-dimensional cometary model. They found that sta-ble mantle can be found quite frequently when the rotation axis isnear the orbital plane and the perihelion distances are >2 AU. Inour models, we see that the dust mantle is generally present whenthe comet orbit has perihelion >2 AU (Table 2, orbit b), and it is re-moved when the comet moves on a orbit with lower periheliondistance (Table 2, orbit c). No sticking or trapping of the dust par-ticles is normally considered in models presented, and the dustcrust can be easily removed with increasing gas flux. We see dustmantles localized where the activity of the comet is not too strong.
One of the effects of dust mantle is the quenching of the come-tary activity: the water is not more on the comet surface, but itsublimates from beneath the surface diffusing through the crust.The gas diffusion through the dust mantle gives lower fluxes fromthe dust-covered regions.
This implies that, when the dust mantle is present on someareas of the comet surface, the water flux comes prevalently fromthose regions not covered by dust where the ice is exposed on thesurface. These areas can be defined as ‘‘active regions” and duringthe nucleus rotation, several spots or areas can be activated whenilluminated. However, the dust mantle formed on orbit at largeheliocentric distance is not easily retained on the current orbit of67P/Churyumov–Gerasimenko, if we do not consider a trappingmechanism or more massive grains. The cases with dust mantleimposed (D3 and ED) the water sublimates from the sub-surfaceunder the dust-covered regions: most of water sublimates and dif-fuses under those regions where the dust thickness is less. The dustmantle thickness increases orbit after orbit, and the water flux ob-tained from these models on the last orbits is much less than theobserved ones. However, the gradient of water activity with timeobtained in these cases better reproduces the values observed forthe comet.

M.C. De Sanctis et al. / Icarus 207 (2010) 341–358 357
5.4. Discussion of the results in terms of Rosetta forthcomingmeasurements
Rosetta will study the activity of the comet from the onset tothe perihelion. The delivery of the Rosetta Lander to the surfaceof the comet is foreseen at a distance of about 3 AU to the Sun. Thiswill take place after a phase of close investigation of 67P/Churyu-mov–Gerasimenko by the Rosetta Orbiter instruments. The RosettaOrbiter measurements with the comet model results will help toevaluate the landing site of the Rosetta Lander. Our models foreseethat different places of the comet nucleus can have different inter-nal properties, being more or less rich in volatile ices beneath thesurface.
According to our results, if Rosetta Lander PHILAE wants tocharacterize the most pristine materials on the comet, the landingsite should be chosen among the ‘‘young and fresh” areas, becausebeneath those regions the less altered material can be found. If theshape and the inclination is that of H3 model, these regions are lo-cated in the southern hemisphere, where the Sun shines at theperihelion. Landing in the southern regions can give insight aboutthe primordial material.
From our results, the comet water activity is strongly localizedand linked with the illumination condition. The Rosetta missionobservation plan must take into account that the near coma dis-tribution of different gases could be very different from what it isobserved from ground, where only the far coma can be moni-tored. We foresee a large difference between night and day waterfluxes and a strong dependence of water emission on the illumi-nation, and, consequently, on spin axis inclinations. The water lo-cal activity is enhanced in the sunward direction rotationalphase. Water activity shows not only diurnal variations but alsochanges of intensity linked to the shadows on the comet. If thepole orientation of 67P/Churyumov–Gerasimenko is as we havesimulated in H3 model and the comet is not covered by thickdust crust, the water gas distribution at perihelion is localizedin the southern hemisphere and concentrated around the southpolar regions, showing not only diurnal variations but alsochanges of intensity linked to the irregularity and shadows onthe comet.
Rosetta mission will observe the comet at different heliocentricdistance: in the simulated case with significant obliquity of therotation axis the active regions at the perihelion are the south polarregions.
The model characteristic implies a seasonal effect caused by ac-tive regions that rapidly come into illumination as the comet ap-proaches the Sun, changing from winter to spring to summer. InH3 model, at the perihelion large part of the surface is relatively in-ert (see Fig. 16) releasing gas at a much lower rate than the south-ern regions, but the active regions changes during the comet orbits.Rosetta mission must take into account the possibility to have dif-ferent sources that are activated during the comet approach to theSun. When Rosetta will observe the comet at about 3 AU, the mostilluminated regions, and consequently the most active will be theequatorial ones, but these regions will change in southern regions,approaching the perihelion.
The observed rapid rise in brightness (Schleicher, 2006) throughperihelion has been interpreted to be caused by the continuedchange in available illumination for one or more source regionscoming out of winter, while the large short-term variability is verylikely due to diurnal effects. This interpretation is in agreementwith our simulations. In fact, the trends of the minor species inmodel H3 show a rapid rise before the perihelion with a peak about30 days after the perihelion, followed by a less steep productionrate, similar to trends observed for the comet.
The dust emission has a similar behavior: the dust particles arelifted off by gas drag and are strictly correlated with gas emission.
Understanding the comet’s gas and dust development and behav-ior along the comet orbit is important for the planning of Rosetta.
The dust emission from Comet 67P has been observed by sev-eral authors, who determined its Afq values. These values havebeen measured during three perihelion passages: 1982/1983,1996/1997 and 2002/2003 (Osip et al., 1992; A’Hearn et al.,1995; Kidger, 2003; Weiler et al., 2004; Schulz et al., 2004; Feld-man et al., 2004; Schleicher, 2006). The dust flux estimated by dif-ferent authors varies, depending on the model adopted.
The total dust flux computed by our models is of the order of103 kg/s at the comet perihelion, and it is directly linked to thegas fluxes. The dust production rate is in agreement with the esti-mation by Weiler et al. (2004), who determined a peak of dust of2000 kg/s in 1982 at 1.36 AU. According to Kelley et al. (2009), vig-orous coma activity did not occur before rh = 4.3 AU in 2007. Fromour models, we can see that 67P/Churyumov–Gerasimenko’s activ-ity is very low at that heliocentric distance, confirming the obser-vations. As the Rosetta spacecraft approaches the comet during thesame in-bound path in 2014, we may expect to see images of aweakly active nucleus.
6. Conclusion
We have presented the results obtained with a thermal evolu-tion code developed for the calculations of spherical and non-spherical nuclei such as spherical harmonics generated shapes.Calculations have been presented for spherical nuclei, spheroid-shaped and spherical, harmonics-shaped nuclei with differentinclinations of the spin axis, with the aim to simulate the effectson different shapes of long thermal history, helping in understand-ing the characteristics and nature of Comet 67P/Churyumov–Gerasimenko.
We have seen that these shapes influence the structure of theinner coma, but the coma far away from the nucleus is only mar-ginally affected by the nucleus shape. We have seen that theinclination of the spin axis has strong influence on the local activ-ity, surface and sub-surface characteristics and properties. In gen-eral, the models with inclined spin axis show strong asymmetricerosion with respect to those not inclined. The shape influence isvisible, but the main effects are due to the obliquity of the spinaxis. Also, the internal stratigraphy is mainly influenced by theobliquity of the comet: different comet behaviors can arise fromdifferently shaped and inclined comet nuclei, especially in termsof local activity, surface and sub-surface characteristics andproperties.
Acknowledgments
The authors would like to thank two anonymous referees fortheir helpful comments and remarks that helped improve the pa-per substantially. This work was partly financed by the CNES andEuroplanet Personnel Exchange Program Number 5. This is LPIContribution Number 1522.
References
Agarwal, J., Müller, M., Grün, E., 2007. Dust environment modelling of Comet 67P/Churyumov-Gerasimenko. Space Sci. Rev. 128 (1–4), 79–131.
A’Hearn, M.F., Millis, R.L., Schleicher, D.G., Osip, D.J., Birch, P.V., 1995. The ensembleproperties of comets: Results from narrowband photometry of 85 comets,1976–1992. Icarus 118, 223–270.
A’Hearn, M.F., and 32 colleagues, 2005. Deep impact: Excavating Comet Tempel 1.Science 310, 258–264.
Beliaev, N.A., Kresak, L., Pittich, E.M., 1986. Catalogue of Short-Period Comets.Slovak Academy of Sciences, Astronomical Institute, Bratislava.
Bockelee-Morvan, D., Moreno, R., Biver, N., Crovisier, J., Crifo, J.F., Fulle, M., Grewing,M., 2004. CO and dust productions in 67P/Churyumov-Gerasimenko at 3 AUpost-perihelion. AASL 311, 25–36.

358 M.C. De Sanctis et al. / Icarus 207 (2010) 341–358
Capria, M.T., Capaccioni, F., Coradini, A., De Sanctis, M.C., Espinasse, S., Federico, C.,Orosei, R., Salomone, M., 1996. AP/Wirtanen evolution model. Planet. Space Sci.44, 987–1000.
Capria, M.T., Coradini, A., De Sanctis, M.C., Blecka, M.I., 2001. P/Wirtanen thermalevolution: Effects due to the presence of an organic component in the refractorymaterial. Planet. Space Sci. 49, 907–918.
Carusi, A., Kresak, L., Perozzi, E., Valsecchi, G.B., 1985. Long-term Evolution of Short-Period Comets. Bristol. Adam Hilger, Ltd., England and Accord, MA.
Chesley, S.R., 2004. An estimate of the spin axis of Comet 67P/Churyumov-Gerasimenko. Bull. Am. Astron. Soc. 36, 1118.
Cohen, M., Prialnik, D., Podolak, M., 2003. A quasi-3D model for the evolution ofshape and temperature distribution of comet nuclei – Application to Comet46P/Wirtanen. New Astron. 8, 179–189.
Colwell, J.E., 1997. Comet lightcurves: Effects of active regions and topography.Icarus 125, 406–415.
Coradini, A., Capaccioni, F., Capria, M.T., De Sanctis, M.C., Espinasse, S., Orosei, R.,Salomone, M., Federico, C., 1997a. Transition elements between comets andasteroids. I. Thermal evolution models. Icarus 129, 317–336.
Coradini, A., Capaccioni, F., Capria, M.T., De Sanctis, M.C., Espinasse, S., Orosei, R.,Salomone, M., Federico, C., 1997b. Transition elements between comets andasteroids. II. From the Kuiper Belt to NEO orbits. Icarus 129, 337–347.
Crifo, J.F., Rodionov, A.V., 1997. The dependence of the circumnuclear comastructure on the properties of the nucleus: II. First investigation of the comasurrounding a homogeneous, aspherical nucleus. Icarus 129, 72–93.
Davidson, B.J., Gutierrez, P.J., 2005. Nucleus properties of Comet 67P/Churyumov-Gerasimenko estimated from non-gravitational force modeling. Icarus 176 (2),453–477.
De Sanctis, M.C., Capaccioni, F., Capria, M.T., Coradini, A., Federico, C., Orosei, R.,Salomone, M., 1999. Models of P/Wirtanen nucleus: Active regions versus non-active regions. Planet. Space Sci. 47, 855–872.
De Sanctis, M.C., Capria, M.T., Coradini, A., 2001. Thermal evolution anddifferentiation of Edgeworth–Kuiper Belt objects. Astron. J. 121, 2792–2799.
De Sanctis, M.C., Capria, M.T., Coradini, A., 2003. Models of P/Borrelly: Activity anddust mantle formation. Adv. Space Res. 31, 2519–2525.
De Sanctis, M.C., Capria, M.T., Coradini, A., 2005. Thermal evolution model of 67P/Churyumov-Gerasimenko, the new Rosetta target. Astron. Astrophys. 444, 605–614.
De Sanctis, M.C., Capria, M.T., Coradini, A., Ammannito, E., 2007. Thermal evolutionmodels of 9P/Tempel 1 comet nucleus to interpret the deep impact results.Astron. J. 133, 1836–1846.
Espinasse, S., Klinger, J., Ritz, C., Schmitt, B., 1991. Modeling of the thermal behaviorand of the chemical differentiation of cometary nuclei. Icarus 92, 350–365.
Fanale, F.P., Salvail, J.R., 1984. An idealized short-period comet model: Surfaceinsolation, H2O flux, dust flux, and mantle evolution. Icarus 60, 476–511.
Feaga, L.M., A’Hearn, M.F., Sunshine, J.M., Groussin, O., Farnham, T.L., 2007.Asymmetries in the distribution of H2O and CO2 in the inner coma of Comet9P/Tempel 1 as observed by deep impact. Icarus 190, 345–356.
Feldman, P., A’Hearn, M., Festou, M., 2004. Observations of Comet 67P/Churyumov-Gerasimenko with the International Ultraviolet Explorer at Perihelion in 1982.ASSL 311, 47–52.
Fulle, M., Barbieri, C., Cremonese, G., Rauer, H., Weiler, M., Milani, G., Ligustri, R.,2004. The dust environment of Comet 67P/Churyumov-Gerasimenko. Astron.Astrophys. 422, 357–368.
Ghormley, J.A., 1968. Enthalpy changes and heat-capacity changes in thetransformations from high-surface-area amorphous ice to stable hexagonalice. J. Chem. Phys. 48, 503–508.
Glassmeier, K.-H., Boehnhardt, H., Koschny, D., Kührt, E., Richter, I., 2007. TheRosetta mission: Flying towards the origin of the Solar System. Space Sci. Rev.128, 1–21.
Gutiérrez, P.J., Ortiz, J.L., Rodrigo, R., López-Moreno, J.J., 2000. A study of waterproduction and temperatures of rotating irregularly shaped cometary nuclei.Astron. Astrophys. 355, 809–817.
Gutiérrez, P.J., Ortiz, J.L., Rodrigo, R., López-Moreno, J.J., 2001. Effects of irregularshape and topography in thermophysical models of heterogeneous cometarynuclei. Astron. Astrophys. 374, 326–336.
Herman, G., Podolak, M., 1985. Numerical simulations of comet nuclei: I. Water icecomets. Icarus 61, 252–266.
Huebner, W.F., Benkhoff, J., Capria, M.T., Coradini, A., De Sanctis, C., Orosei, R.,Prialnik, D., 2006. Heat and gas diffusion in comet nuclei. ISSI Scientific Report,ESA Publications Division, Noordwijk.
Ishiguro, M., 2008. Cometary dust trail associated with Rosetta mission target: 67P/Churyumov-Gerasimenko. Icarus 193 (1), 96–104.
Kadono, T., Sugita, S., Sako, S., Ootsubo, T., Honda, M., Kawakita, H., Miyata, T.,Furusho, R., Watanabe, J., 2007. The thickness and formation age of the surfacelayer on Comet 9P/Tempel 1. Astrophys. J. 661, L89–L92.
Kamoun, P., Campbell, D., Pettengill, G., Shapiro, I., 1998. Radar observations ofthree comets and detection of echoes from one: P/Grigg–Skjellerup. Planet.Space Sci. 47 (1–2), 23–28.
Keller, H.U., and 17 colleagues, 1986. First Halley multicolour camera imagingresults from Giotto. Nature 321, 320–326.
Kelley, M.S., Wooden, D.H., Tubiana, C., Boehnhardt, H., Woodward, C.E., Harker, D.,2009. Spitzer observations of Comet 67P/Churyumov-Gerasimenko at 5.5–4.3 AU from the Sun. Astron. J. 137, 4633–4642.
Kidger, M.R., 2003. Dust production and coma morphology of 67P/Churyumov-Gerasimenko during the 2002–2003 apparition. Astron. Astrophys. 408, 767–774.
Lamy, P.L., Toth, I., Davidsson, B.J.R., Groussin, O., Gutiérrez, P., Jorda, L., Kaasalainen,M., Lowry, S.C., 2007. A portrait of the nucleus of Comet 67P/Churyumov-Gerasimenko. Space Sci. Rev. 128, 23–66.
Lamy, P.L., Toth, I., Groussin, O., Jorda, L., Kelley, M.S., Stansberry, J.A., 2008. SpitzerSpace Telescope observations of the nucleus of Comet 67P/Churyumov-Gerasimenko. Astron. Astrophys. 489, 777–785.
Lasue, J., DeSanctis, M.C., Coradini, A., Magni, G., Capria, M.T., Turrini, D., Levasseur-Regourd, A.C., 2008. Quasi-3D model to describe topographic effects on non-spherical comet nucleus evolution. Planet. Space Sci. 56, 1977–1991.
Moreno, F., Lara, L.M., Muñoz, O., López-Moreno, J.J., Molina, A., 2004. Dust in Comet67P/Churyumov-Gerasimenko. Astrophys. J. 613 (2), 1263–1269.
Mueller, B.E.A., 1992. CCD-photometry of comets at large heliocentric distances. In:Asteroids, Comets, Meteors, pp. 425–428.
Oberst, J., Giese, B., Howington-Kraus, E., Kirk, R., Soderblom, L., Buratti, B., Hicks, M.,Nelson, R., Britt, D., 2004. The nucleus of comet Borrelly: A study of morphologyand surface brightness. Icarus 167, 70–79.
Osip, D.J., Schleicher, D.G., Millis, R.L., 1992. Comets – Groundbased observations ofspacecraft mission candidates. Icarus 98, 115–124.
Rickman, H., Fernandez, J.A., Gustafson, B.A.S., 1990. Formation of stable dustmantles on short-period comet nuclei. Astron. Astrophys. 237, 524–535.
Rosenberg, E.D., Prialnik, D., 2007. A fully 3-dimensional thermal model of a cometnucleus. New Astron. 12, 523–532.
Rosenberg, E.D., Prialnik, D., 2009. Fully 3-dimensional calculations of dust mantleformation for a model of Comet 67P/Churyumov-Gerasimenko. Icarus 201, 740–749.
Sarid, G., Prialnik, D., Meech, K.J., Pittichova, J., Farnham, T.L., 2005. Thermalevolution and activity of Comet 9P/Tempel 1 and simulation of a deep impact.Publ. Astron. Soc. Pacific 117, 796–809.
Schleicher, D.G., 2006. Compositional and physical results for Rosetta’s new targetComet 67P/Churyumov-Gerasimenko from narrowband photometry andimaging. Icarus 181, 442–457.
Schmitt, B., Espinasse, S., Grim, R.J.A., Greenberg, J.M., Klinger, J., 1989. Laboratorystudies of cometary ice analogues. ESA-SP 302, pp. 65–69.
Schulz, R., Stuwe, J.A., Boehnhardt, H., 2004. Monitoring Comet 67P/Churyumov-Gerasimenko from ESO in 2003. Astron. Astrophys. 422, L19–L21.
Sekanina, Z., 1979. Fan-shaped coma, orientation of rotation axis, and surfacestructure of a cometary nucleus: I. Test of a model on four comets. Icarus 37,420–442.
Tancredi, G., Fernandez, J.A., Rickman, H., Licandro, J., 2000. A catalog of observednuclear magnitudes of Jupiter family comets. Astron. Astrophys. 146, 73–90.
Weiler, M., Rauer, H., Helbert, J., 2004. Optical observations of Comet 67P/Churyumov-Gerasimenko. Astron. Astrophys. 414, 749–755.
Copyright © 2022 FDOKUMEN