Radiative evolution of polyploid races of the Iberian carnation Dianthus broteri (Caryophyllaceae
10
Radiative evolution of polyploid races of the Iberian carnation Dianthus broteri (Caryophyllaceae) Francisco Balao 1 *, Luis M. Valente 2 *, Pablo Vargas 2 , Javier Herrera 1 and Salvador Talavera 1 1 Departamento de Biologı ´a Vegetal y Ecologı ´a, Universidad de Sevilla, Apdo. 1095, E-41080 Sevilla, Spain; 2 Real Jardı ´n Bota ´nico de Madrid, CSIC, Plaza de Murillo 2, 28014 Madrid, Spain Author for correspondence: Francisco Balao Tel: +34954559887 Email: [email protected] Received: 18 February 2010 Accepted: 24 March 2010 New Phytologist (2010) 187: 542–551 doi: 10.1111/j.1469-8137.2010.03280.x Key words: amplified fragment length polymorphism (AFLP), cpDNA, Dianthus broteri, internal transcribed spacer (ITS), Mediterranean, polyploidy, radiation, speciation. Summary • The micro-evolutionary mechanisms that drive large-scale radiations are not completely understood, partly because of a shortage of population-level studies aimed at identifying putative causes of rapid evolutionary change. The Dianthus broteri complex, representing the largest polyploid series known to date for any species in the genus (2·,4·,6· and 12· cytotypes), belongs to a lineage that was recently found to have diversified at unusually rapid rates. • We used a combination of genome sequencing (internal transcribed spacer (ITS), plus chloroplast DNA (cpDNA) regions trnH-psbA, psbA-trnK and trnK- matK) and amplified fragment length polymorphism (AFLP) fingerprinting in 25 populations to infer the evolutionary history of extant polyploid races. • The haplotype, ribotype and AFLP reconstructions showed a star-shaped arrange- ment suggesting a pattern of radiative evolution. The major, widespread haplotype occurred at all ploidy levels, whereas 20 minor haplotypes were restricted to single populations and cytotypes. In addition, AFLP analyses retrieved well-supported cytogeographic groups: six clades were clearly differentiated in terms of ploidy level and geography. Molecular data indicate that gene flow among different cyto- types is rare or nonexistent. • Our study supports a scenario of rapid diversification in carnations in which autopolyploidy and allopolyploidy, in interaction with geography and ⁄ or isolation, have played prominent roles. Introduction During the past decade, several rapid radiations of plant lin- eages have been documented (Linder, 2008), revealing that the processes leading to extant plant diversity may be remarkably dynamic. Despite an abundance of studies, the causes of ‘explosive’ diversification still remain obscure (Coyne & Orr, 2004). In particular, the micro-evolutionary mechanisms that drive large-scale radiations are incom- pletely understood, partly because of a shortage of popula- tion-level studies with the explicit aim of identifying putative causes of rapid evolutionary change in species from young hyperdiverse lineages. Polyploidy, a major evolutionary force in plants (Ramsey & Schemske, 1998; Otto, 2007; Leitch & Leitch, 2008; Paun et al., 2009; Soltis & Soltis, 2009), is often invoked as a potential driver of angiosperm radiations. Genome dupli- cation events are thought to have played an important role in generating plant diversity both directly – speciation events are often associated with polyploidization (Wood et al., 2009) – and indirectly – polyploid lineages often dis- play above-average rates of diversification (Soltis & Soltis, 2009; Soltis et al., 2009). Indeed, the radiation of several species-rich lineages of plants has been partially attributed to polyploidization (e.g. Barrier et al., 1999; Guo et al., 2005; Jordon-Thaden & Koch, 2008; Blo ¨ch et al., 2009). However, the role of polyploidy in shaping population structuring in such lineages has rarely been addressed. Dianthus L. (Caryophyllaceae), a genus of > 300 species centred in the Mediterranean Basin, is a good system in which to study the role of polyploidy in evolutionary radia- tion. Polyploidization seems to occur readily in Dianthus, and speciation often takes place through hybridization and genome duplication (Carolin, 1957; Weiss et al., 2002). *These authors contributed equally. New Phytologist Research 542 New Phytologist (2010) 187: 542–551 www.newphytologist.com Ó The Authors (2010) Journal compilation Ó New Phytologist Trust (2010)
-
Upload
independent -
Category
Documents
-
view
0 -
download
0
Transcript of Radiative evolution of polyploid races of the Iberian carnation Dianthus broteri (Caryophyllaceae
Radiative evolution of polyploid races of the Iberiancarnation Dianthus broteri (Caryophyllaceae)
Francisco Balao1*, Luis M. Valente2*, Pablo Vargas2, Javier Herrera1 and Salvador Talavera1
1Departamento de Biologıa Vegetal y Ecologıa, Universidad de Sevilla, Apdo. 1095, E-41080 Sevilla, Spain; 2Real Jardın Botanico de Madrid, CSIC, Plaza
de Murillo 2, 28014 Madrid, Spain
Author for correspondence:Francisco Balao
Tel: +34954559887
Email: [email protected]
Received: 18 February 2010
Accepted: 24 March 2010
New Phytologist (2010) 187: 542–551doi: 10.1111/j.1469-8137.2010.03280.x
Key words: amplified fragment lengthpolymorphism (AFLP), cpDNA, Dianthus
broteri, internal transcribed spacer (ITS),Mediterranean, polyploidy, radiation,speciation.
Summary
• The micro-evolutionary mechanisms that drive large-scale radiations are not
completely understood, partly because of a shortage of population-level studies
aimed at identifying putative causes of rapid evolutionary change. The Dianthus
broteri complex, representing the largest polyploid series known to date for any
species in the genus (2·, 4·, 6· and 12· cytotypes), belongs to a lineage that was
recently found to have diversified at unusually rapid rates.
• We used a combination of genome sequencing (internal transcribed spacer
(ITS), plus chloroplast DNA (cpDNA) regions trnH-psbA, psbA-trnK and trnK-
matK) and amplified fragment length polymorphism (AFLP) fingerprinting in 25
populations to infer the evolutionary history of extant polyploid races.
• The haplotype, ribotype and AFLP reconstructions showed a star-shaped arrange-
ment suggesting a pattern of radiative evolution. The major, widespread haplotype
occurred at all ploidy levels, whereas 20 minor haplotypes were restricted to single
populations and cytotypes. In addition, AFLP analyses retrieved well-supported
cytogeographic groups: six clades were clearly differentiated in terms of ploidy
level and geography. Molecular data indicate that gene flow among different cyto-
types is rare or nonexistent.
• Our study supports a scenario of rapid diversification in carnations in which
autopolyploidy and allopolyploidy, in interaction with geography and ⁄ or isolation,
have played prominent roles.
Introduction
During the past decade, several rapid radiations of plant lin-eages have been documented (Linder, 2008), revealing thatthe processes leading to extant plant diversity may beremarkably dynamic. Despite an abundance of studies, thecauses of ‘explosive’ diversification still remain obscure(Coyne & Orr, 2004). In particular, the micro-evolutionarymechanisms that drive large-scale radiations are incom-pletely understood, partly because of a shortage of popula-tion-level studies with the explicit aim of identifyingputative causes of rapid evolutionary change in species fromyoung hyperdiverse lineages.
Polyploidy, a major evolutionary force in plants (Ramsey& Schemske, 1998; Otto, 2007; Leitch & Leitch, 2008;Paun et al., 2009; Soltis & Soltis, 2009), is often invoked as
a potential driver of angiosperm radiations. Genome dupli-cation events are thought to have played an important rolein generating plant diversity both directly – speciationevents are often associated with polyploidization (Woodet al., 2009) – and indirectly – polyploid lineages often dis-play above-average rates of diversification (Soltis & Soltis,2009; Soltis et al., 2009). Indeed, the radiation of severalspecies-rich lineages of plants has been partially attributedto polyploidization (e.g. Barrier et al., 1999; Guo et al.,2005; Jordon-Thaden & Koch, 2008; Bloch et al., 2009).However, the role of polyploidy in shaping populationstructuring in such lineages has rarely been addressed.
Dianthus L. (Caryophyllaceae), a genus of > 300 speciescentred in the Mediterranean Basin, is a good system inwhich to study the role of polyploidy in evolutionary radia-tion. Polyploidization seems to occur readily in Dianthus,and speciation often takes place through hybridization andgenome duplication (Carolin, 1957; Weiss et al., 2002).*These authors contributed equally.
NewPhytologistResearch
542 New Phytologist (2010) 187: 542–551
www.newphytologist.com� The Authors (2010)
Journal compilation � New Phytologist Trust (2010)
A recent phylogenetic study of the genus revealed that ratesof diversification in Mediterranean Dianthus have beenexceptionally high (Valente et al., 2010), and raised thequestion of whether a combination of polyploidy and geo-graphical speciation may have driven cladogenesis in thegroup. In this context, a ‘zoom in’ approach, in which thegenetics of a particular group of Dianthus is studied indetail, could provide valuable insights into the causes oflarge-scale radiations.
Here, we focus on Dianthus broteri s.l. as a model systemin which to study the evolutionary radiation in polyploid an-giosperms. Dianthus broteri is a well-defined Mediterraneanpolyploid group of perennial, xenogamous (but self-compatible) herbs pollinated by hawkmoths (F. Balao,unpublished data). This complex is endemic to the IberianPeninsula, where it occurs mainly on calcareous soils but canalso inhabit dolomitic and siliceous areas in the south andeast of the Peninsula, from altitudes of 1800 m to coastalsand palaeodunes. According to a recent study of chromo-some numbers and genome size (Balao et al., 2009),D. broteri represents the most extensive polyploid seriesknown to date for the genus. Diploids, triploids, tetraploids,hexaploids and dodecaploids occur, but cytotypes rarely ifever coexist in the same population, and have distinct geo-graphical distributions: dodecaploids occur only in certainareas of the lower Guadalquivir River valley; hexaploids arerestricted to arid localities in south-eastern Spain; tetraploidsare distributed from Portugal to north-eastern Spain; dip-loids are scattered in two disjunct areas in mountain rangesof Portugal and Spain. An autopolyploid origin has beensuggested for most of these cytological races (Balao et al.,
2009), but precise genetic data are required for a deeperunderstanding of their evolutionary history.
In the present study, we adopted a combined molecular-marker approach to investigate the origins of the D. brotericomplex using data from the nuclear ribosomal internaltranscribed spacer (ITS) region, chloroplast DNA (cpDNA)and amplified fragment length polymorphism (AFLP).Our specific goals were to gain insights into the micro-evolutionary processes that drive plant species radiations; toinvestigate the origin of the different cytotypes; and to iden-tify the role of polyploidy in the evolution of this taxon.
Materials and Methods
Sampling
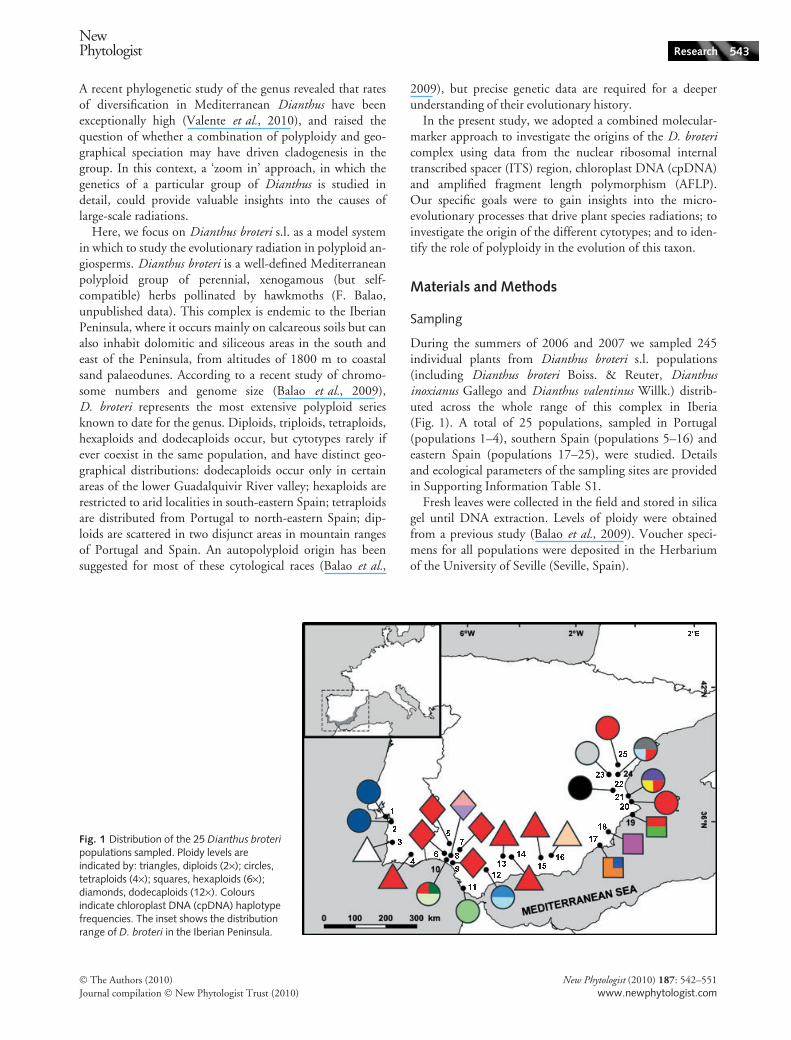
During the summers of 2006 and 2007 we sampled 245individual plants from Dianthus broteri s.l. populations(including Dianthus broteri Boiss. & Reuter, Dianthusinoxianus Gallego and Dianthus valentinus Willk.) distrib-uted across the whole range of this complex in Iberia(Fig. 1). A total of 25 populations, sampled in Portugal(populations 1–4), southern Spain (populations 5–16) andeastern Spain (populations 17–25), were studied. Detailsand ecological parameters of the sampling sites are providedin Supporting Information Table S1.
Fresh leaves were collected in the field and stored in silicagel until DNA extraction. Levels of ploidy were obtainedfrom a previous study (Balao et al., 2009). Voucher speci-mens for all populations were deposited in the Herbariumof the University of Seville (Seville, Spain).
Fig. 1 Distribution of the 25 Dianthus broteri
populations sampled. Ploidy levels areindicated by: triangles, diploids (2·); circles,tetraploids (4·); squares, hexaploids (6·);diamonds, dodecaploids (12·). Coloursindicate chloroplast DNA (cpDNA) haplotypefrequencies. The inset shows the distributionrange of D. broteri in the Iberian Peninsula.
NewPhytologist Research 543
� The Authors (2010)
Journal compilation � New Phytologist Trust (2010)
New Phytologist (2010) 187: 542–551
www.newphytologist.com
DNA extraction and sequencing
Total genomic DNA was extracted using the cetyl trimethylammonium bromide (CTAB) method (Doyle & Doyle,1987; with modifications following Ortiz et al., 2007) atfacilities of the Biology Research Services (CITIUS) of theUniversity of Seville. A pilot study was performed to findthe most variable DNA sequences among 12 differentmolecular markers, and the nuclear ribosomal internal tran-scribed spacer (ITS1-5.8S-ITS2) and three chloroplastregions (trn (tRNA)H-psbA, psb (photosystem II)A-trnK andtrnK-matK (maturase)) were identified as the most suitablemarkers. These regions were sequenced for a representativesubset of 100 plants (four individuals per population).Primer sequences for polymerase chain reaction (PCR)amplification were obtained from White et al. (1990),Johnson & Soltis (1994), Demesure et al. (1995) and Listonet al. (1996). Sequencing was conducted on an AppliedBiosystems Prism Model 3700 DNA analyser (AppliedBiosystems, Foster City, CA, USA).
Sequences were proofread, assembled into contigs andtrimmed of ambiguous ends in Geneious Pro 4.7.6(Drummond et al., 2009). Ambiguous nucleotides wererepresented by IUPAC symbols. Alignment was performedmanually. The three chloroplast matrices were concatenatedand a parsimony network was constructed using TCS ver-sion 1.21 (Clement et al., 2000), with gaps treated as miss-ing data and a 95% connection limit. A second parsimonynetwork based on the ITS sequences was built with thesame settings.
In order to investigate whether there was significantgenetic structuring within the Iberian Peninsula (morespecifically, southern vs eastern populations), we estimatedthe nearest-neighbour statistic (Snn; Hudson, 2000) which isappropriate for diverse haplotype data sets with small samplesizes. Permutation tests with 1000 replicates were performedin DnaSP v5 (Librado & Rozas, 2009). The distribution ofamong-haplotype pairwise differences (i.e. the ‘mismatchdistribution’ of Rogers & Harpending, 1992) was examinedfor evidence of past spatial and demographic expansions.This was done by comparing the observed distribution ofmismatches with distributions obtained using models ofeither sudden demographic expansion or sudden spatialexpansion (Ray et al., 2003; Excoffier, 2004).
AFLP fingerprinting
We analysed 245 individuals from 25 populations. TheAFLP procedure followed the protocol established byGaudeul et al. (2000), with modifications (Escudero et al.,2008). An initial screening of selective primers wasperformed on six individuals from five populations (oneindividual was replicated), using 33 primer combinationswith three selective nucleotides. In order to choose the most
replicable combinations, a second screening was then run oneight individuals from four randomly chosen populations(one individual replicated per population) employing the 25best primer combinations. The four primer combinationsselected for the selective PCR were: EcoRI-ACC (FAM) ⁄MseI-CAA; EcoRI-AAC (VIC) ⁄ MseI-CGA; EcoRI-ACT(FAM) ⁄ MseI-CAT; and EcoRI-AAC (VIC) ⁄ MseI-CCT.
For each individual, 0.5 ll of 6-FAM-labelled and 0.5 llof VIC-labelled selective PCR products were combined with0.5 ll of GeneScan 500 LIZ (Applied Biosystems) and13.5 ll of formamide. The mix was run on a capillarysequencer (ABI 3730; Applied Biosystems), and theGeneMapper� software application (version 3.4; AppliedBiosystems) was used to score amplified fragments 100–500 bp in length. An automated allele binning protocol andposterior manual review were performed. To calculate theerror rate of the method, replicates of the AFLP proto-col were conducted on 13 individual plants (5.3% of thetotal).
AFLP scores were treated as a binary (presence ⁄ absence)variable, incorporated into a data matrix, and imported intor software (R Development Core Team, 2008). To assessthe genetic diversity in each population, the total number offragments scored (Fragtot), the number of private fragments(Fragpriv) and the percentage of polymorphic fragments(%pol) were determined. Additionally, the Rarity 1 Index(equivalent to the frequency of down-weighted markervalues; i.e. DW sensu Schonswetter & Tribsch, 2005) wascalculated using AFLPdat (Ehrich, 2006). Nei’s gene diver-sity (Hj) was measured in aflp-surv version 1.0 (Vekemanset al., 2002), and genetic diversity within plant groupswas estimated from band richness by the rarefactionmethod (Kalinowski, 2004) using HP-Rare version 1.0(Kalinowski, 2005). Our estimates are based on two(randomly chosen) populations within each group, andeight individuals per population. Group-based DW esti-mates were obtained by nonparametric bootstrapping ofplant individual values (not population averages) for eachgroup. The average and confidence interval (bias-correctedand accelerated (BCa); Efron & Tibshirani, 1986) werecalculated from 1000 repetitions.
AFLP-based population and individual relatedness
Groups of genetically similar individuals were identifiedgraphically with a principal coordinate analysis (PCoA) oftheir genetic distances (1 – Jaccard similarity). Subsequently,a second PCoA was performed using the chord distancematrix (single-locus chord distance; Cavalli-Sforza &Edwards, 1967) among populations based on allelefrequency data (adegenet and vegan packages in r softwareversion 2.8.0; Jombart, 2008; Oksanen et al., 2010).
Among-population fixation indices (FST) were computedusing aflp-surv version 1.0 (Vekemans et al., 2002) and
544 Research
NewPhytologist
� The Authors (2010)
Journal compilation � New Phytologist Trust (2010)
New Phytologist (2010) 187: 542–551
www.newphytologist.com
10 000 matrices obtained by bootstrapping. These werethen used to build a neighbour-joining tree (with phylip
software; Felsenstein, 2005). The hidden genetic structureof populations was studied by Bayesian analysis of plantsclustering into genetically divergent groups using baps ver-sion 5.1 (Corander & Marttinen, 2006). The program wasrun with the maximal number of groups (K) set to 1–25(i.e. the number of populations), and each run was repli-cated five times. The partition with the highest log-marginallikelihood was plotted onto the neighbour-joining tree.
AFLP molecular variance analysis
The partitioning of variance among PCoA plant groups wasstudied with molecular variance analysis (AMOVA) asimplemented in Arlequin 3.11 (Excoffier et al., 2005).Variance partitioning was also investigated in the groupsretrieved in the neighbour-joining analysis. To find thebest-fit model, and to compare models with different num-bers of parameters, we used the corrected Akaike informa-tion criterion (AICc) (Halverson et al., 2008). Variancecomponents were tested for significance using an exact non-parametric test with 10 000 permutations.
As a cautionary remark, all our analyses based on allelicfrequencies explicitly assume Hardy–Weinberg equilibriumand polysomic inheritance. Unfortunately, the effect ofploidy level on AFLP allelic frequencies is unknown, and atheoretical basis and practical methodology for dealing withthis problem are not yet available (unlike, for instance, inmicrosatellite or isoenzyme studies; e.g. Bruvo et al., 2004;De Silva et al., 2005; Obbard et al., 2006).
Results
cpDNA and ITS sequences
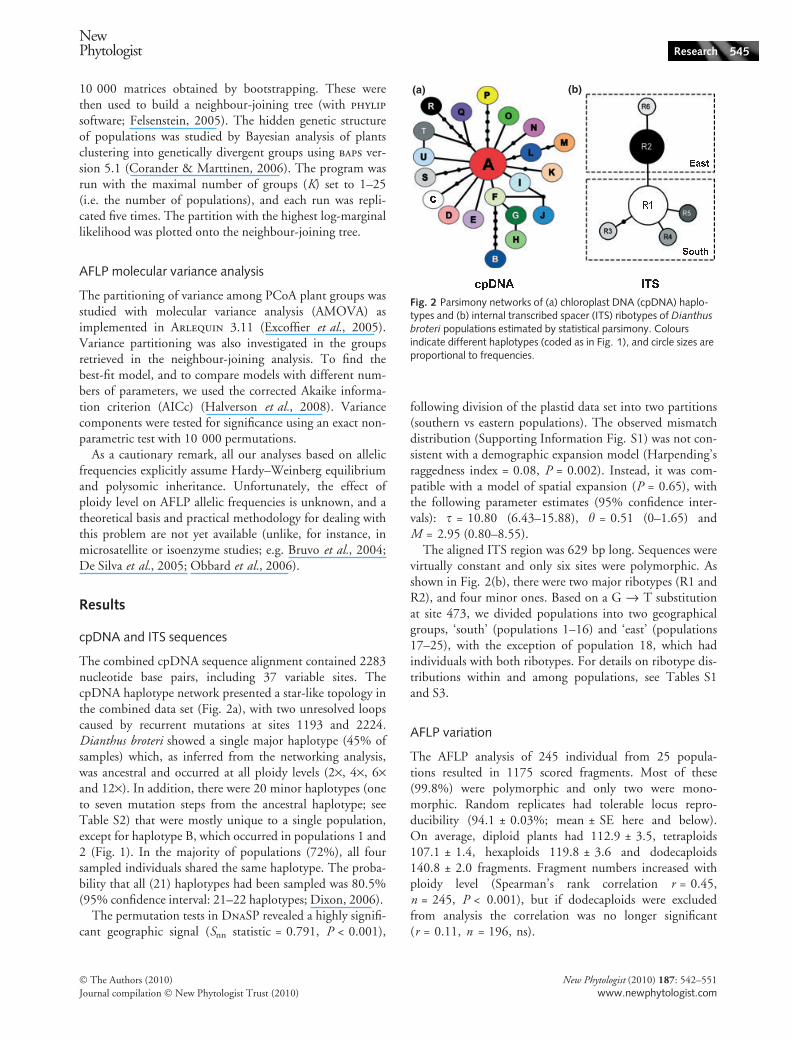
The combined cpDNA sequence alignment contained 2283nucleotide base pairs, including 37 variable sites. ThecpDNA haplotype network presented a star-like topology inthe combined data set (Fig. 2a), with two unresolved loopscaused by recurrent mutations at sites 1193 and 2224.Dianthus broteri showed a single major haplotype (45% ofsamples) which, as inferred from the networking analysis,was ancestral and occurred at all ploidy levels (2·, 4·, 6·and 12·). In addition, there were 20 minor haplotypes (oneto seven mutation steps from the ancestral haplotype; seeTable S2) that were mostly unique to a single population,except for haplotype B, which occurred in populations 1 and2 (Fig. 1). In the majority of populations (72%), all foursampled individuals shared the same haplotype. The proba-bility that all (21) haplotypes had been sampled was 80.5%(95% confidence interval: 21–22 haplotypes; Dixon, 2006).
The permutation tests in DnaSP revealed a highly signifi-cant geographic signal (Snn statistic = 0.791, P < 0.001),
following division of the plastid data set into two partitions(southern vs eastern populations). The observed mismatchdistribution (Supporting Information Fig. S1) was not con-sistent with a demographic expansion model (Harpending’sraggedness index = 0.08, P = 0.002). Instead, it was com-patible with a model of spatial expansion (P = 0.65), withthe following parameter estimates (95% confidence inter-vals): s = 10.80 (6.43–15.88), h = 0.51 (0–1.65) andM = 2.95 (0.80–8.55).
The aligned ITS region was 629 bp long. Sequences werevirtually constant and only six sites were polymorphic. Asshown in Fig. 2(b), there were two major ribotypes (R1 andR2), and four minor ones. Based on a G fi T substitutionat site 473, we divided populations into two geographicalgroups, ‘south’ (populations 1–16) and ‘east’ (populations17–25), with the exception of population 18, which hadindividuals with both ribotypes. For details on ribotype dis-tributions within and among populations, see Tables S1and S3.
AFLP variation
The AFLP analysis of 245 individual from 25 popula-tions resulted in 1175 scored fragments. Most of these(99.8%) were polymorphic and only two were mono-morphic. Random replicates had tolerable locus repro-ducibility (94.1 ± 0.03%; mean ± SE here and below).On average, diploid plants had 112.9 ± 3.5, tetraploids107.1 ± 1.4, hexaploids 119.8 ± 3.6 and dodecaploids140.8 ± 2.0 fragments. Fragment numbers increased withploidy level (Spearman’s rank correlation r = 0.45,n = 245, P < 0.001), but if dodecaploids were excludedfrom analysis the correlation was no longer significant(r = 0.11, n = 196, ns).
(a) (b)
Fig. 2 Parsimony networks of (a) chloroplast DNA (cpDNA) haplo-types and (b) internal transcribed spacer (ITS) ribotypes of Dianthus
broteri populations estimated by statistical parsimony. Coloursindicate different haplotypes (coded as in Fig. 1), and circle sizes areproportional to frequencies.
NewPhytologist Research 545
� The Authors (2010)
Journal compilation � New Phytologist Trust (2010)
New Phytologist (2010) 187: 542–551
www.newphytologist.com
AFLP individual and population relatedness
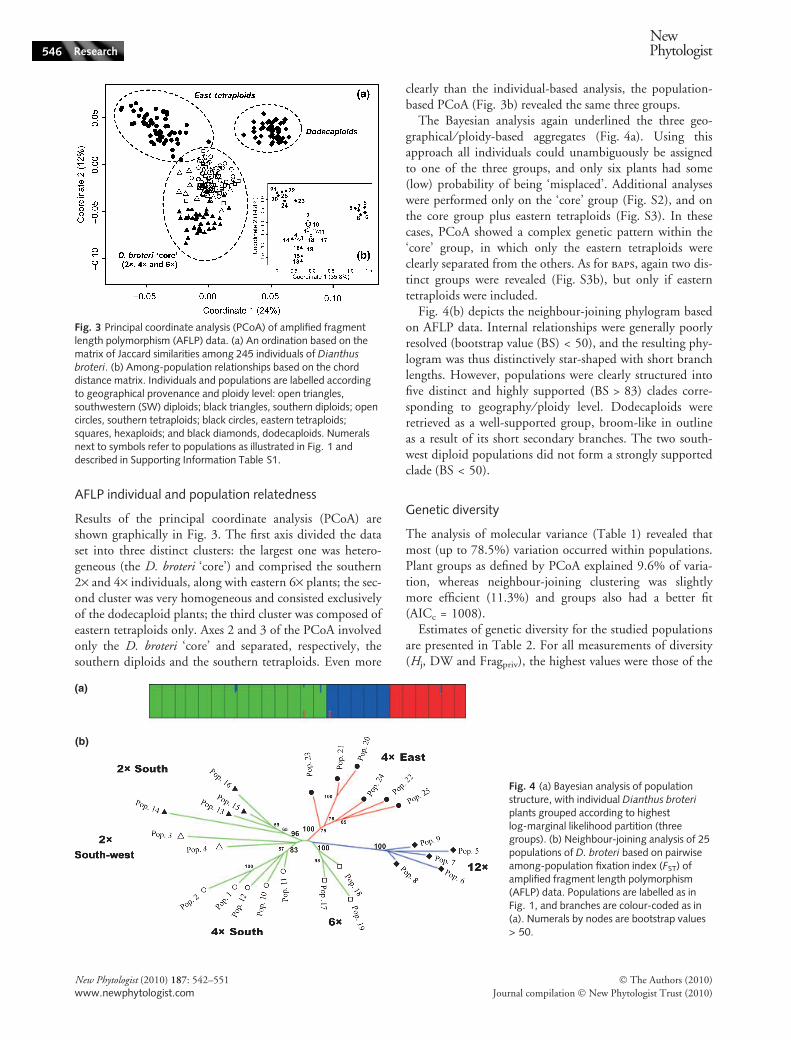
Results of the principal coordinate analysis (PCoA) areshown graphically in Fig. 3. The first axis divided the dataset into three distinct clusters: the largest one was hetero-geneous (the D. broteri ‘core’) and comprised the southern2· and 4· individuals, along with eastern 6· plants; the sec-ond cluster was very homogeneous and consisted exclusivelyof the dodecaploid plants; the third cluster was composed ofeastern tetraploids only. Axes 2 and 3 of the PCoA involvedonly the D. broteri ‘core’ and separated, respectively, thesouthern diploids and the southern tetraploids. Even more
clearly than the individual-based analysis, the population-based PCoA (Fig. 3b) revealed the same three groups.
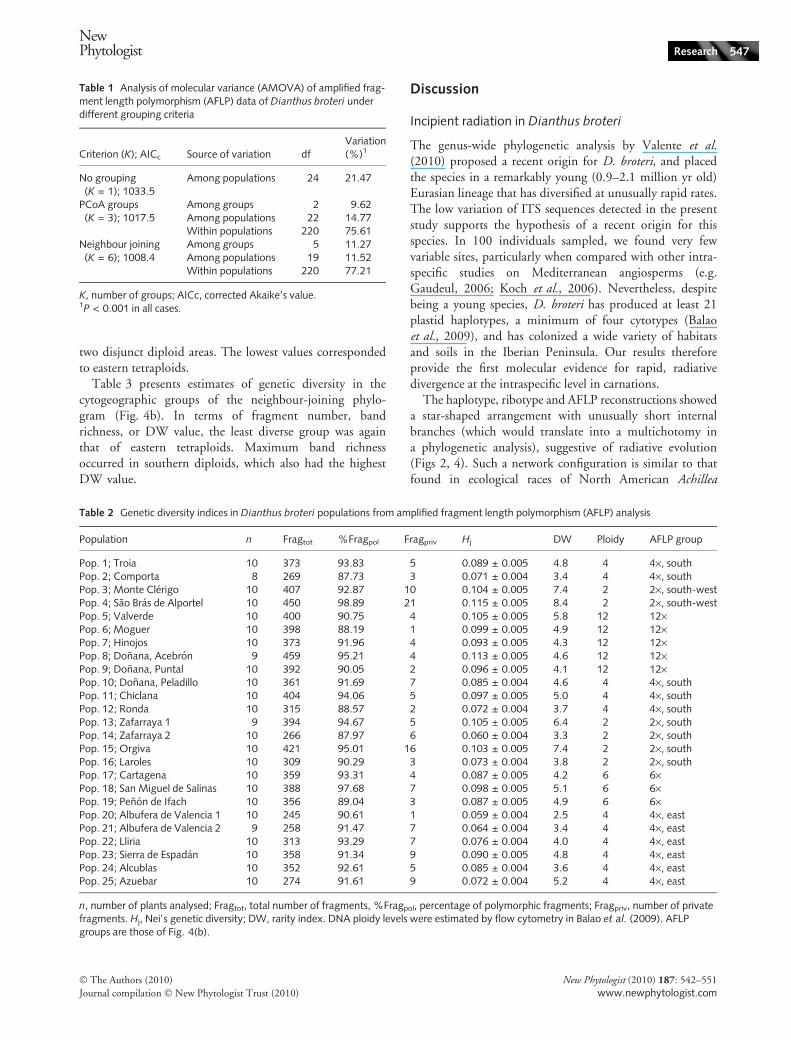
The Bayesian analysis again underlined the three geo-graphical ⁄ ploidy-based aggregates (Fig. 4a). Using thisapproach all individuals could unambiguously be assignedto one of the three groups, and only six plants had some(low) probability of being ‘misplaced’. Additional analyseswere performed only on the ‘core’ group (Fig. S2), and onthe core group plus eastern tetraploids (Fig. S3). In thesecases, PCoA showed a complex genetic pattern within the‘core’ group, in which only the eastern tetraploids wereclearly separated from the others. As for baps, again two dis-tinct groups were revealed (Fig. S3b), but only if easterntetraploids were included.
Fig. 4(b) depicts the neighbour-joining phylogram basedon AFLP data. Internal relationships were generally poorlyresolved (bootstrap value (BS) < 50), and the resulting phy-logram was thus distinctively star-shaped with short branchlengths. However, populations were clearly structured intofive distinct and highly supported (BS > 83) clades corre-sponding to geography ⁄ ploidy level. Dodecaploids wereretrieved as a well-supported group, broom-like in outlineas a result of its short secondary branches. The two south-west diploid populations did not form a strongly supportedclade (BS < 50).
Genetic diversity
The analysis of molecular variance (Table 1) revealed thatmost (up to 78.5%) variation occurred within populations.Plant groups as defined by PCoA explained 9.6% of varia-tion, whereas neighbour-joining clustering was slightlymore efficient (11.3%) and groups also had a better fit(AICc = 1008).
Estimates of genetic diversity for the studied populationsare presented in Table 2. For all measurements of diversity(Hj, DW and Fragpriv), the highest values were those of the
Fig. 3 Principal coordinate analysis (PCoA) of amplified fragmentlength polymorphism (AFLP) data. (a) An ordination based on thematrix of Jaccard similarities among 245 individuals of Dianthus
broteri. (b) Among-population relationships based on the chorddistance matrix. Individuals and populations are labelled accordingto geographical provenance and ploidy level: open triangles,southwestern (SW) diploids; black triangles, southern diploids; opencircles, southern tetraploids; black circles, eastern tetraploids;squares, hexaploids; and black diamonds, dodecaploids. Numeralsnext to symbols refer to populations as illustrated in Fig. 1 anddescribed in Supporting Information Table S1.
(a)
(b)
Fig. 4 (a) Bayesian analysis of populationstructure, with individual Dianthus broteri
plants grouped according to highestlog-marginal likelihood partition (threegroups). (b) Neighbour-joining analysis of 25populations of D. broteri based on pairwiseamong-population fixation index (FST) ofamplified fragment length polymorphism(AFLP) data. Populations are labelled as inFig. 1, and branches are colour-coded as in(a). Numerals by nodes are bootstrap values> 50.
546 Research
NewPhytologist
� The Authors (2010)
Journal compilation � New Phytologist Trust (2010)
New Phytologist (2010) 187: 542–551
www.newphytologist.com
two disjunct diploid areas. The lowest values correspondedto eastern tetraploids.
Table 3 presents estimates of genetic diversity in thecytogeographic groups of the neighbour-joining phylo-gram (Fig. 4b). In terms of fragment number, bandrichness, or DW value, the least diverse group was againthat of eastern tetraploids. Maximum band richnessoccurred in southern diploids, which also had the highestDW value.
Discussion
Incipient radiation in Dianthus broteri
The genus-wide phylogenetic analysis by Valente et al.(2010) proposed a recent origin for D. broteri, and placedthe species in a remarkably young (0.9–2.1 million yr old)Eurasian lineage that has diversified at unusually rapid rates.The low variation of ITS sequences detected in the presentstudy supports the hypothesis of a recent origin for thisspecies. In 100 individuals sampled, we found very fewvariable sites, particularly when compared with other intra-specific studies on Mediterranean angiosperms (e.g.Gaudeul, 2006; Koch et al., 2006). Nevertheless, despitebeing a young species, D. broteri has produced at least 21plastid haplotypes, a minimum of four cytotypes (Balaoet al., 2009), and has colonized a wide variety of habitatsand soils in the Iberian Peninsula. Our results thereforeprovide the first molecular evidence for rapid, radiativedivergence at the intraspecific level in carnations.
The haplotype, ribotype and AFLP reconstructions showeda star-shaped arrangement with unusually short internalbranches (which would translate into a multichotomy ina phylogenetic analysis), suggestive of radiative evolution(Figs 2, 4). Such a network configuration is similar to thatfound in ecological races of North American Achillea
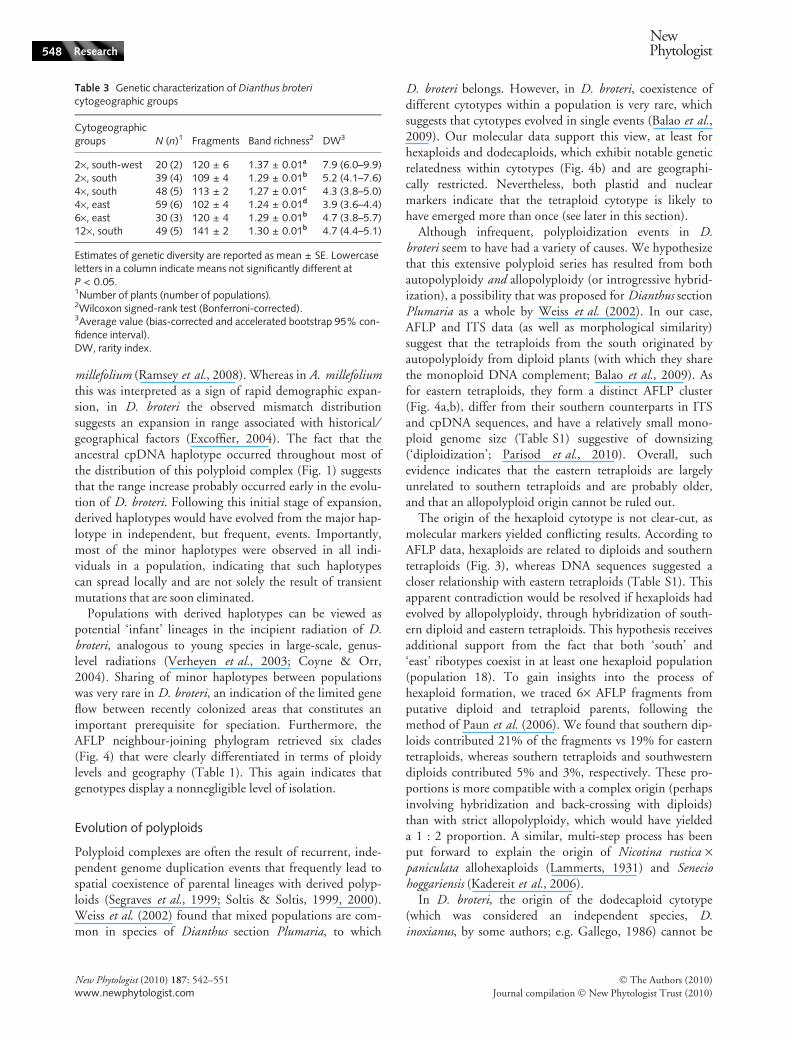
Table 1 Analysis of molecular variance (AMOVA) of amplified frag-ment length polymorphism (AFLP) data of Dianthus broteri underdifferent grouping criteria
Criterion (K); AICc Source of variation dfVariation(%)1
No grouping(K = 1); 1033.5
Among populations 24 21.47
PCoA groups(K = 3); 1017.5
Among groups 2 9.62Among populations 22 14.77Within populations 220 75.61
Neighbour joining(K = 6); 1008.4
Among groups 5 11.27Among populations 19 11.52Within populations 220 77.21
K, number of groups; AICc, corrected Akaike’s value.1P < 0.001 in all cases.
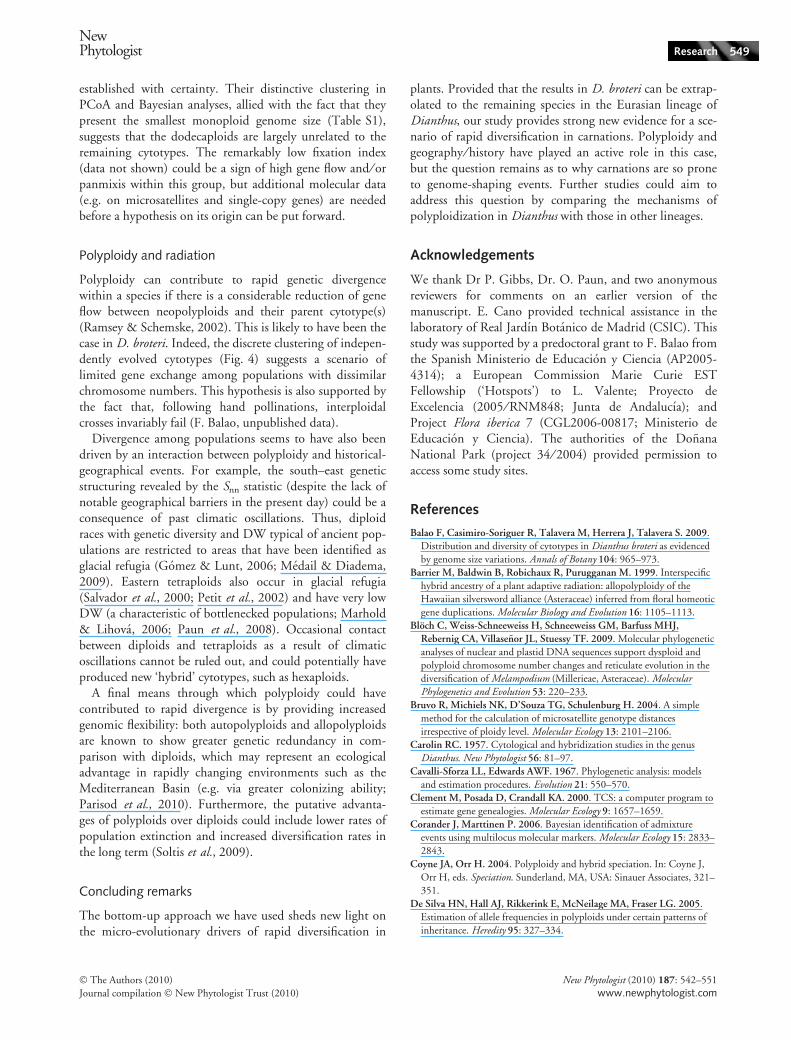
Table 2 Genetic diversity indices in Dianthus broteri populations from amplified fragment length polymorphism (AFLP) analysis
Population n Fragtot %Fragpol Fragpriv Hj DW Ploidy AFLP group
Pop. 1; Troia 10 373 93.83 5 0.089 ± 0.005 4.8 4 4·, southPop. 2; Comporta 8 269 87.73 3 0.071 ± 0.004 3.4 4 4·, southPop. 3; Monte Clerigo 10 407 92.87 10 0.104 ± 0.005 7.4 2 2·, south-westPop. 4; Sao Bras de Alportel 10 450 98.89 21 0.115 ± 0.005 8.4 2 2·, south-westPop. 5; Valverde 10 400 90.75 4 0.105 ± 0.005 5.8 12 12·Pop. 6; Moguer 10 398 88.19 1 0.099 ± 0.005 4.9 12 12·Pop. 7; Hinojos 10 373 91.96 4 0.093 ± 0.005 4.3 12 12·Pop. 8; Donana, Acebron 9 459 95.21 4 0.113 ± 0.005 4.6 12 12·Pop. 9; Donana, Puntal 10 392 90.05 2 0.096 ± 0.005 4.1 12 12·Pop. 10; Donana, Peladillo 10 361 91.69 7 0.085 ± 0.004 4.6 4 4·, southPop. 11; Chiclana 10 404 94.06 5 0.097 ± 0.005 5.0 4 4·, southPop. 12; Ronda 10 315 88.57 2 0.072 ± 0.004 3.7 4 4·, southPop. 13; Zafarraya 1 9 394 94.67 5 0.105 ± 0.005 6.4 2 2·, southPop. 14; Zafarraya 2 10 266 87.97 6 0.060 ± 0.004 3.3 2 2·, southPop. 15; Orgiva 10 421 95.01 16 0.103 ± 0.005 7.4 2 2·, southPop. 16; Laroles 10 309 90.29 3 0.073 ± 0.004 3.8 2 2·, southPop. 17; Cartagena 10 359 93.31 4 0.087 ± 0.005 4.2 6 6·Pop. 18; San Miguel de Salinas 10 388 97.68 7 0.098 ± 0.005 5.1 6 6·Pop. 19; Penon de Ifach 10 356 89.04 3 0.087 ± 0.005 4.9 6 6·Pop. 20; Albufera de Valencia 1 10 245 90.61 1 0.059 ± 0.004 2.5 4 4·, eastPop. 21; Albufera de Valencia 2 9 258 91.47 7 0.064 ± 0.004 3.4 4 4·, eastPop. 22; Lliria 10 313 93.29 7 0.076 ± 0.004 4.0 4 4·, eastPop. 23; Sierra de Espadan 10 358 91.34 9 0.090 ± 0.005 4.8 4 4·, eastPop. 24; Alcublas 10 352 92.61 5 0.085 ± 0.004 3.6 4 4·, eastPop. 25; Azuebar 10 274 91.61 9 0.072 ± 0.004 5.2 4 4·, east
n, number of plants analysed; Fragtot, total number of fragments, %Fragpol, percentage of polymorphic fragments; Fragpriv, number of privatefragments. Hj, Nei’s genetic diversity; DW, rarity index. DNA ploidy levels were estimated by flow cytometry in Balao et al. (2009). AFLPgroups are those of Fig. 4(b).
NewPhytologist Research 547
� The Authors (2010)
Journal compilation � New Phytologist Trust (2010)
New Phytologist (2010) 187: 542–551
www.newphytologist.com
millefolium (Ramsey et al., 2008). Whereas in A. millefoliumthis was interpreted as a sign of rapid demographic expan-sion, in D. broteri the observed mismatch distributionsuggests an expansion in range associated with historical ⁄geographical factors (Excoffier, 2004). The fact that theancestral cpDNA haplotype occurred throughout most ofthe distribution of this polyploid complex (Fig. 1) suggeststhat the range increase probably occurred early in the evolu-tion of D. broteri. Following this initial stage of expansion,derived haplotypes would have evolved from the major hap-lotype in independent, but frequent, events. Importantly,most of the minor haplotypes were observed in all indi-viduals in a population, indicating that such haplotypescan spread locally and are not solely the result of transientmutations that are soon eliminated.
Populations with derived haplotypes can be viewed aspotential ‘infant’ lineages in the incipient radiation of D.broteri, analogous to young species in large-scale, genus-level radiations (Verheyen et al., 2003; Coyne & Orr,2004). Sharing of minor haplotypes between populationswas very rare in D. broteri, an indication of the limited geneflow between recently colonized areas that constitutes animportant prerequisite for speciation. Furthermore, theAFLP neighbour-joining phylogram retrieved six clades(Fig. 4) that were clearly differentiated in terms of ploidylevels and geography (Table 1). This again indicates thatgenotypes display a nonnegligible level of isolation.
Evolution of polyploids
Polyploid complexes are often the result of recurrent, inde-pendent genome duplication events that frequently lead tospatial coexistence of parental lineages with derived polyp-loids (Segraves et al., 1999; Soltis & Soltis, 1999, 2000).Weiss et al. (2002) found that mixed populations are com-mon in species of Dianthus section Plumaria, to which
D. broteri belongs. However, in D. broteri, coexistence ofdifferent cytotypes within a population is very rare, whichsuggests that cytotypes evolved in single events (Balao et al.,2009). Our molecular data support this view, at least forhexaploids and dodecaploids, which exhibit notable geneticrelatedness within cytotypes (Fig. 4b) and are geographi-cally restricted. Nevertheless, both plastid and nuclearmarkers indicate that the tetraploid cytotype is likely tohave emerged more than once (see later in this section).
Although infrequent, polyploidization events in D.broteri seem to have had a variety of causes. We hypothesizethat this extensive polyploid series has resulted from bothautopolyploidy and allopolyploidy (or introgressive hybrid-ization), a possibility that was proposed for Dianthus sectionPlumaria as a whole by Weiss et al. (2002). In our case,AFLP and ITS data (as well as morphological similarity)suggest that the tetraploids from the south originated byautopolyploidy from diploid plants (with which they sharethe monoploid DNA complement; Balao et al., 2009). Asfor eastern tetraploids, they form a distinct AFLP cluster(Fig. 4a,b), differ from their southern counterparts in ITSand cpDNA sequences, and have a relatively small mono-ploid genome size (Table S1) suggestive of downsizing(‘diploidization’; Parisod et al., 2010). Overall, suchevidence indicates that the eastern tetraploids are largelyunrelated to southern tetraploids and are probably older,and that an allopolyploid origin cannot be ruled out.
The origin of the hexaploid cytotype is not clear-cut, asmolecular markers yielded conflicting results. According toAFLP data, hexaploids are related to diploids and southerntetraploids (Fig. 3), whereas DNA sequences suggested acloser relationship with eastern tetraploids (Table S1). Thisapparent contradiction would be resolved if hexaploids hadevolved by allopolyploidy, through hybridization of south-ern diploid and eastern tetraploids. This hypothesis receivesadditional support from the fact that both ‘south’ and‘east’ ribotypes coexist in at least one hexaploid population(population 18). To gain insights into the process ofhexaploid formation, we traced 6· AFLP fragments fromputative diploid and tetraploid parents, following themethod of Paun et al. (2006). We found that southern dip-loids contributed 21% of the fragments vs 19% for easterntetraploids, whereas southern tetraploids and southwesterndiploids contributed 5% and 3%, respectively. These pro-portions is more compatible with a complex origin (perhapsinvolving hybridization and back-crossing with diploids)than with strict allopolyploidy, which would have yieldeda 1 : 2 proportion. A similar, multi-step process has beenput forward to explain the origin of Nicotina rustica ·paniculata allohexaploids (Lammerts, 1931) and Seneciohoggariensis (Kadereit et al., 2006).
In D. broteri, the origin of the dodecaploid cytotype(which was considered an independent species, D.inoxianus, by some authors; e.g. Gallego, 1986) cannot be
Table 3 Genetic characterization of Dianthus broteri
cytogeographic groups
Cytogeographicgroups N (n)1 Fragments Band richness2 DW3
2·, south-west 20 (2) 120 ± 6 1.37 ± 0.01a 7.9 (6.0–9.9)2·, south 39 (4) 109 ± 4 1.29 ± 0.01b 5.2 (4.1–7.6)4·, south 48 (5) 113 ± 2 1.27 ± 0.01c 4.3 (3.8–5.0)4·, east 59 (6) 102 ± 4 1.24 ± 0.01d 3.9 (3.6–4.4)6·, east 30 (3) 120 ± 4 1.29 ± 0.01b 4.7 (3.8–5.7)12·, south 49 (5) 141 ± 2 1.30 ± 0.01b 4.7 (4.4–5.1)
Estimates of genetic diversity are reported as mean ± SE. Lowercaseletters in a column indicate means not significantly different atP < 0.05.1Number of plants (number of populations).2Wilcoxon signed-rank test (Bonferroni-corrected).3Average value (bias-corrected and accelerated bootstrap 95% con-fidence interval).DW, rarity index.
548 Research
NewPhytologist
� The Authors (2010)
Journal compilation � New Phytologist Trust (2010)
New Phytologist (2010) 187: 542–551
www.newphytologist.com
established with certainty. Their distinctive clustering inPCoA and Bayesian analyses, allied with the fact that theypresent the smallest monoploid genome size (Table S1),suggests that the dodecaploids are largely unrelated to theremaining cytotypes. The remarkably low fixation index(data not shown) could be a sign of high gene flow and ⁄ orpanmixis within this group, but additional molecular data(e.g. on microsatellites and single-copy genes) are neededbefore a hypothesis on its origin can be put forward.
Polyploidy and radiation
Polyploidy can contribute to rapid genetic divergencewithin a species if there is a considerable reduction of geneflow between neopolyploids and their parent cytotype(s)(Ramsey & Schemske, 2002). This is likely to have been thecase in D. broteri. Indeed, the discrete clustering of indepen-dently evolved cytotypes (Fig. 4) suggests a scenario oflimited gene exchange among populations with dissimilarchromosome numbers. This hypothesis is also supported bythe fact that, following hand pollinations, interploidalcrosses invariably fail (F. Balao, unpublished data).
Divergence among populations seems to have also beendriven by an interaction between polyploidy and historical-geographical events. For example, the south–east geneticstructuring revealed by the Snn statistic (despite the lack ofnotable geographical barriers in the present day) could be aconsequence of past climatic oscillations. Thus, diploidraces with genetic diversity and DW typical of ancient pop-ulations are restricted to areas that have been identified asglacial refugia (Gomez & Lunt, 2006; Medail & Diadema,2009). Eastern tetraploids also occur in glacial refugia(Salvador et al., 2000; Petit et al., 2002) and have very lowDW (a characteristic of bottlenecked populations; Marhold& Lihova, 2006; Paun et al., 2008). Occasional contactbetween diploids and tetraploids as a result of climaticoscillations cannot be ruled out, and could potentially haveproduced new ‘hybrid’ cytotypes, such as hexaploids.
A final means through which polyploidy could havecontributed to rapid divergence is by providing increasedgenomic flexibility: both autopolyploids and allopolyploidsare known to show greater genetic redundancy in com-parison with diploids, which may represent an ecologicaladvantage in rapidly changing environments such as theMediterranean Basin (e.g. via greater colonizing ability;Parisod et al., 2010). Furthermore, the putative advanta-ges of polyploids over diploids could include lower rates ofpopulation extinction and increased diversification rates inthe long term (Soltis et al., 2009).
Concluding remarks
The bottom-up approach we have used sheds new light onthe micro-evolutionary drivers of rapid diversification in
plants. Provided that the results in D. broteri can be extrap-olated to the remaining species in the Eurasian lineage ofDianthus, our study provides strong new evidence for a sce-nario of rapid diversification in carnations. Polyploidy andgeography ⁄ history have played an active role in this case,but the question remains as to why carnations are so proneto genome-shaping events. Further studies could aim toaddress this question by comparing the mechanisms ofpolyploidization in Dianthus with those in other lineages.
Acknowledgements
We thank Dr P. Gibbs, Dr. O. Paun, and two anonymousreviewers for comments on an earlier version of themanuscript. E. Cano provided technical assistance in thelaboratory of Real Jardın Botanico de Madrid (CSIC). Thisstudy was supported by a predoctoral grant to F. Balao fromthe Spanish Ministerio de Educacion y Ciencia (AP2005-4314); a European Commission Marie Curie ESTFellowship (‘Hotspots’) to L. Valente; Proyecto deExcelencia (2005 ⁄ RNM848; Junta de Andalucıa); andProject Flora iberica 7 (CGL2006-00817; Ministerio deEducacion y Ciencia). The authorities of the DonanaNational Park (project 34 ⁄ 2004) provided permission toaccess some study sites.
References
Balao F, Casimiro-Soriguer R, Talavera M, Herrera J, Talavera S. 2009.
Distribution and diversity of cytotypes in Dianthus broteri as evidenced
by genome size variations. Annals of Botany 104: 965–973.
Barrier M, Baldwin B, Robichaux R, Purugganan M. 1999. Interspecific
hybrid ancestry of a plant adaptive radiation: allopolyploidy of the
Hawaiian silversword alliance (Asteraceae) inferred from floral homeotic
gene duplications. Molecular Biology and Evolution 16: 1105–1113.
Bloch C, Weiss-Schneeweiss H, Schneeweiss GM, Barfuss MHJ,
Rebernig CA, Villasenor JL, Stuessy TF. 2009. Molecular phylogenetic
analyses of nuclear and plastid DNA sequences support dysploid and
polyploid chromosome number changes and reticulate evolution in the
diversification of Melampodium (Millerieae, Asteraceae). MolecularPhylogenetics and Evolution 53: 220–233.
Bruvo R, Michiels NK, D’Souza TG, Schulenburg H. 2004. A simple
method for the calculation of microsatellite genotype distances
irrespective of ploidy level. Molecular Ecology 13: 2101–2106.
Carolin RC. 1957. Cytological and hybridization studies in the genus
Dianthus. New Phytologist 56: 81–97.
Cavalli-Sforza LL, Edwards AWF. 1967. Phylogenetic analysis: models
and estimation procedures. Evolution 21: 550–570.
Clement M, Posada D, Crandall KA. 2000. TCS: a computer program to
estimate gene genealogies. Molecular Ecology 9: 1657–1659.
Corander J, Marttinen P. 2006. Bayesian identification of admixture
events using multilocus molecular markers. Molecular Ecology 15: 2833–
2843.
Coyne JA, Orr H. 2004. Polyploidy and hybrid speciation. In: Coyne J,
Orr H, eds. Speciation. Sunderland, MA, USA: Sinauer Associates, 321–
351.
De Silva HN, Hall AJ, Rikkerink E, McNeilage MA, Fraser LG. 2005.
Estimation of allele frequencies in polyploids under certain patterns of
inheritance. Heredity 95: 327–334.
NewPhytologist Research 549
� The Authors (2010)
Journal compilation � New Phytologist Trust (2010)
New Phytologist (2010) 187: 542–551
www.newphytologist.com
Demesure B, Sodzi N, Petit R. 1995. A set of universal primers for
amplification of polymorphic non-coding regions of mitochondrial and
chloroplast DNA in plants. Molecular Ecology 4: 129–131.
Dixon CJ. 2006. A means of estimating the completeness of haplotype
sampling using the Stirling probability distribution. Molecular EcologyNotes 6: 650–652.
Doyle JJ, Doyle JL. 1987. A rapid DNA isolation procedure for small
quantities of fresh leaf tissue. Phytochemistry Bulletin 19: 11–15.
Drummond A, Ashton B, Cheung M, Heled J, Kearse M, Moir R,
Stones-Havas S, Thierer T, Wilson A. 2009. Geneious v4.7. Available
from http://www.geneious.com/.
Efron B, Tibshirani R. 1986. Bootstrap methods for standard errors,
confidence intervals, and other measures of statistical accuracy. StatisticalScience 1: 54–75.
Ehrich D. 2006. AFLPDAT: a collection of R functions for convenient
handling of AFLP data. Molecular Ecology Notes 6: 603–604.
Escudero M, Vargas P, Valcarcel V, Luceno M. 2008. Strait of Gibraltar:
an effective gene-flow barrier for wind-pollinated Carex helodes(Cyperaceae) as revealed by DNA sequences, AFLP, and cytogenetic
variation. American Journal of Botany 95: 745–755.
Excoffier L. 2004. Patterns of DNA sequence diversity and genetic
structure after a range expansion: lessons from the infinite-island model.
Molecular Ecology 13: 853–864.
Excoffier L, Laval G, Schneider S. 2005. Arlequin ver. 3.0: an integrated
software package for population genetics data analysis. EvolutionaryBioinformatics Online 1: 47–50.
Felsenstein J. 2005. PHYLIP (Phylogeny Inference Package) version 3.6.
Seattle, WA, USA: Department of Genome Sciences, University of
Washington.
Gallego MJ. 1986. Una nueva especie de Dianthus del litoral del SW de
Espana. Lagascalia 14: 71–72.
Gaudeul M. 2006. Disjunct distribution of Hypericumn nummularium L.
(Hypericaceae): molecular data suggest bidirectional colonization from a
single refugium rather than survival in distinct refugia. Biological Journalof the Linnean Society 87: 437–447.
Gaudeul M, Taberlet P, Till-Bottraud I. 2000. Genetic diversity in an
endangered alpine plant, Eryngium alpinum L. (Apiaceae), inferred from
amplified fragment length polymorphism markers. Molecular Ecology 9:
1625–1637.
Gomez A, Lunt D. 2006. Refugia within refugia: patterns of
phylogeographic concordance in the Iberian Peninsula. In: Weiss S,
Ferrand N, eds. Phylogeography in southern European refugia: evolutionaryperspectives on the origins and conservation of European biodiversity.Dordrecht, the Netherlands: Springer, 155–182.
Guo Y-P, Saukel J, Mittermayr R, Ehrendorfer F. 2005. AFLP analyses
demonstrate genetic divergence, hybridization, and multiple
polyploidization in the evolution of Achillea (Asteraceae-Anthemideae).
New Phytologist 166: 273–290.
Halverson K, Heard SB, Nason JD, Stireman JO. 2008. Origins,
distribution, and local co-occurrence of polyploid cytotypes in Solidagoaltissima (Asteraceae). American Journal of Botany 95: 50–58.
Hudson RR. 2000. A new statistic for detecting genetic differentiation.
Genetics 155: 2011–2014.
Johnson L, Soltis D. 1994. matK DNA sequences and phylogenetic
reconstruction in Saxifragaceae s. str. Systematic Botany 19: 143–156.
Jombart T. 2008. adegenet: a R package for the multivariate analysis of
genetic markers. Bioinformatics 24: 1403–1405.
Jordon-Thaden I, Koch M. 2008. Species richness and polyploid patterns
in the genus Draba (Brassicaceae): a first global perspective. PlantEcology & Diversity 1: 255–263.
Kadereit JW, Uribe-Convers S, Westberg E, Comes HP. 2006.
Reciprocal hybridization at different times between Senecio flavus and
Senecio glaucus gave rise to two polyploid species in north Africa and
south-west Asia. New Phytologist 169: 431–441.
Kalinowski ST. 2004. Counting alleles with rarefaction: private alleles and
hierarchical sampling designs. Conservation Genetics 5: 539–543.
Kalinowski ST. 2005. HP-RARE 1.0: a computer program for performing
rarefaction on measures of allelic richness. Molecular Ecology Notes 5:
187–189.
Koch MA, Kiefer C, Ehrich D, Vogel J, Brochmann C, Mummenhoff K.
2006. Three times out of Asia Minor: the phylogeography of Arabisalpina L. (Brassicaceae). Molecular Ecology 15: 825–839.
Lammerts W. 1931. Interspecific hybridization in Nicotiana. XII. The
amphidiploid rustica-paniculata hybrid; its origin and cytogenetic
behavior. Genetics 16: 191.
Leitch AR, Leitch IJ. 2008. Genomic plasticity and the diversity of
polyploid plants. Science 320: 481–483.
Librado P, Rozas J. 2009. DnaSP v5: a software for comprehensive
analysis of DNA polymorphism data. Bioinformatics 25: 1451–
1452.
Linder HP. 2008. Plant species radiations: where, when, why?
Philosophical Transactions of the Royal Society B: Biological Sciences 363:
3097–3105.
Liston A, Robinson W, Oliphant J, Alvarez-Buylla E. 1996. Length
variation in the nuclear ribosomal DNA internal transcribed spacer
region of non-flowering seed plants. Systematic Botany 21: 109–120.
Marhold K, Lihova J. 2006. Polyploidy, hybridization and reticulate
evolution: lessons from the Brassicaceae. Plant Systematics and Evolution259: 143–174.
Medail F, Diadema K. 2009. Glacial refugia influence plant diversity
patterns in the Mediterranean Basin. Journal of Biogeography 36: 1333–
1345.
Obbard DJ, Harris SA, Pannell JR. 2006. Simple allelic-phenotype
diversity and differentiation statistics for allopolyploids. Heredity 97:
296–303.
Oksanen J, Blanchet FG, Kindt R, Legendre P, O’Hara RG, Simpson
GL, Solymos P, Henry M, Stevens H, Wagner H. 2010. vegan:
community ecology package. R package version 1.17-2. Available from
http://CRAN.R-project.org/package=vegan/.
Ortiz MA, Tremetsberger K, Talavera S, Stuessy T, Garcia-Castano JL.
2007. Population structure of Hypochaeris salzmanniana DC.
(Asteraceae), an endemic species to the Atlantic coast on both sides of
the Strait of Gibraltar, in relation to Quaternary sea level changes.
Molecular Ecology 16: 541–552.
Otto SP. 2007. The evolutionary consequences of polyploidy. Cell 131:
452–462.
Parisod C, Holderegger R, Brochmann C. 2010. Evolutionary
consequences of autopolyploidy. New Phytologist 186: 5–17.
Paun O, Forest F, Fay MF, Chase MW. 2009. Hybrid speciation in
angiosperms: parental divergence drives ploidy. New Phytologist 182:
507–518.
Paun O, Schonswetter P, Winkler M, Tribsch A, Intrabiodiv
Consortium. 2008. Historical divergence vs. contemporary gene flow:
evolutionary history of the calcicole Ranunculus alpestris group
(Ranunculaceae) in the European Alps and the Carpathians. MolecularEcology 17: 4263–4275.
Paun O, Stuessy TF, Horandl E. 2006. The role of hybridization,
polyploidization and glaciation in the origin and evolution of the
apomictic Ranunculus cassubicus complex. New Phytologist 171: 223–
236.
Petit RJ, Brewer S, Bordacs S, Burg K, Cheddadi R, Coart E, Cottrell J,
Csaikl UM, van DamB, Deans JD et al. 2002. Identification of refugia
and post-glacial colonisation routes of European white oaks based on
chloroplast DNA and fossil pollen evidence. Forest Ecology andManagement 156: 49–74.
R Development Core Team. 2008. R: a language and environment forstatistical computing. Vienna, Austria: R Foundation for Statistical
Computing.
550 Research
NewPhytologist
� The Authors (2010)
Journal compilation � New Phytologist Trust (2010)
New Phytologist (2010) 187: 542–551
www.newphytologist.com
Ramsey J, Robertson A, Husband B. 2008. Rapid adaptive divergence in
new world Achillea, an autopolyploid complex of ecological races.
Evolution 62: 639–653.
Ramsey J, Schemske DW. 1998. Pathways, mechanisms, and rates of
polyploid formation in flowering plants. Annual Reviews in Ecology andSystematics 29: 467–501.
Ramsey J, Schemske DW. 2002. Neopolyploidy in flowering plants.
Annual Review of Ecology and Systematics 33: 589–639.
Ray N, Currat M, Excoffier L. 2003. Intra-deme molecular diversity in
spatially expanding populations. Molecular Biology and Evolution 20:
76–86.
Rogers A, Harpending H. 1992. Population growth makes waves in the
distribution of pairwise genetic differences. Molecular Biology andEvolution 9: 552–569.
Salvador L, Alıa R, Agundez D, Gil L. 2000. Genetic variation and
migration pathways of maritime pine (Pinus pinaster Ait) in the Iberian
Peninsula. Theoretical and Applied Genetics 100: 89–95.
Schonswetter P, Tribsch A. 2005. Vicariance and dispersal in the alpine
perennial Bupleurum stellatum L. (Apiaceae). Taxon 54: 725–732.
Segraves KA, Thompson JN, Soltis PS, Soltis DE. 1999. Multiple origins
of polyploidy and the geographic structure of Heuchera grossulariifolia.
Molecular Ecology 8: 253–262.
Soltis DE, Albert VA, Leebens-Mack J, Bell CD, Paterson AH, Zheng C,
Sankoff D, dePamphilis CW, Wall PK, Soltis PS. 2009. Polyploidy
and angiosperm diversification. American Journal of Botany 96: 336–
348.
Soltis DE, Soltis PS. 1999. Polyploidy: recurrent formation and genome
evolution. Trends in Ecology & Evolution 14: 348–352.
Soltis PS, Soltis DE. 2000. The role of genetic and genomic attributes in
the success of polyploids. Proceedings of the National Academy of Sciences,USA 97: 7051–7057.
Soltis PS, Soltis DE. 2009. The role of hybridization in plant speciation.
Annual Review of Plant Biology 60: 561–588.
Valente LM, Savolainen V, Vargas P. 2010. Unparalleled rates of species
diversification in Europe. Proceedings of the Royal Society B: BiologicalSciences 277: 1489–1497.
Vekemans X, Beauwens T, Lemaire M, Roldan-Ruiz I. 2002. Data from
amplified fragment length polymorphism (AFLP) markers show
indication of size homoplasy and of a relationship between degree of
homoplasy and fragment size. Molecular Ecology 11: 139–151.
Verheyen E, Salzburger W, Snoeks J, Meyer A. 2003. Origin of the
superflock of cichlid fishes from Lake Victoria, East Africa. Science 300:
325–329.
Weiss H, Dobes C, Schneeweiss GM, Greimler J. 2002. Occurrence of
tetraploid and hexaploid cytotypes between and within populations in
Dianthus sect. Plumaria (Caryophyllaceae). New Phytologist 156: 85–94.
White T, Bruns T, Lee S, Taylor J. 1990. Amplification and direct
sequencing of fungal ribosomal RNA genes for phylogenetics. In: Innis
M, Gelfand D, Sninsky J, White T, eds. PCR protocols: a guide to
methods and applications. San Diego, CA, USA: Academic Press, 315–
322.
Wood TE, Takebayashi N, Barker MS, Mayrose I, Greenspoon PB,
Rieseberg LH. 2009. The frequency of polyploid speciation in vascular
plants. Proceedings of the National Academy of Sciences, USA 106: 13875–
13879.
Supporting Information
Additional supporting information may be found in theonline version of this article.
Fig. S1 Observed and expected mismatch distributions ofDianthus broteri haplotypes under (a) demographic expan-sion and (b) spatial expansion models.
Fig. S2 Principal coordinate analysis (PCoA) (a) andBayesian analysis (b) of Dianthus broteri amplified fragmentlength polymorphism (AFLP) data in the ‘core’ group.
Fig. S3 Principal coordinate analysis (PCoA) (a) andBayesian analysis (b) of Dianthus broteri amplified fragmentlength polymorphism (AFLP) data in the ‘core’ group pluseastern tetraploids.
Table S1 Details of the Dianthus broteri populations stud-ied.
Table S2 Polymorphic sites for chloroplast DNA (cpDNA)regions (trnK-matK, trnH-psbA and psbA-trnK) of Dianthusbroteri haplotypes, and GenBank accession numbers foreach haplotype sequence.
Table S3 Polymorphic sites for the internal transcribedspacer (ITS) region in Dianthus broteri ribotypes, andGenBank accession numbers for each ribotype sequence.
Please note: Wiley-Blackwell are not responsible for thecontent or functionality of any supporting information sup-plied by the authors. Any queries (other than about missingmaterial) should be directed to the New Phytologist CentralOffice.
NewPhytologist Research 551
� The Authors (2010)
Journal compilation � New Phytologist Trust (2010)
New Phytologist (2010) 187: 542–551
www.newphytologist.com