Estimating the species tree for Hawaiian Schiedea (Caryophyllaceae) from multiple loci in the...
20
Estimating the species tree for Hawaiian Schiedea (Caryophyllaceae) from multiple loci in the presence of reticulate evolution Ann Willyard a,⇑,1 , Lisa E. Wallace b,1 , Warren L. Wagner c , Stephen G. Weller d , Ann K. Sakai d , Molly Nepokroeff a a University of South Dakota, Department of Biology, 414 E. Clark St., Vermillion, SD 57069, USA b Mississippi State University, Department of Biological Sciences, P.O. Box GY, Mississippi State, MS 39762, USA c National Museum of Natural History, Smithsonian Institution, Botany, P.O. Box 37012, MRC 166, Washington, DC 20013, USA d University of California Irvine, Department of Ecology & Evolutionary Biology, 321 Steinhaus Hall, Irvine, CA 92697, USA article info Article history: Received 1 August 2010 Revised 4 April 2011 Accepted 5 April 2011 Available online 12 April 2011 Keywords: Hawai‘i Species trees Reticulate evolution Schiedea Caryophyllaceae Low-copy nuclear loci abstract Schiedea (Caryophyllaceae) is a monophyletic genus of 34 species, all endemic to the Hawaiian Islands, that arose from a single colonization, providing one of the best examples of adaptive radiation in Hawai‘i. Species utilize a range of habitats and exhibit a variety of growth forms and transitions in breeding sys- tems from hermaphroditism toward dimorphism or autogamy. Our study included the most thorough sampling to date: 2–5 individuals per species and 4 independent genetic partitions: eight plastid and three low-copy nuclear loci (9217 bps), allowing a three-locus BEST species tree. Despite incomplete res- olution at the tips, our results support monophyly for each extant species. Gene trees revealed several clear cases of cytonuclear incongruence, likely created by interspecific introgression. Conflict occurs at the divergence of section Alphaschiedea as well as at the tips. Ages inferred from a BEAST analysis allow an original colonization onto either Nihoa or Kauaì and inform some aspects of inter-island migrations. We suggest that several hard polytomies on the species tree are biologically realistic, signifying either nearly simultaneous speciation or historical introgressive hybridization. Based on inferred node ages that exceed expected coalescent times, we propose that undetected nuclear introgression may play a larger role than incomplete lineage sorting in sections Schiedea and Mononeura. Ó 2011 Elsevier Inc. All rights reserved. 1. Introduction 1.1. Species tree construction Adaptive radiations are a major challenge to molecular system- atics because individual gene lineages may be so recent that they fail to coalesce before the time of species divergence (Edwards et al., 2007). Among recently diverged species, genealogies inferred from independent regions of the genome are likely to disagree due to the differential sorting of ancestral polymorphism into daughter lineages such that each gene tree may differ from the species tree (Degnan and Rosenberg, 2006; Funk and Omland, 2003; Goodman et al., 1979; Maddison, 1997). To construct a species tree where coalescence cannot safely be assumed, multiple independent loci are vital to overcome the stochastic nature of lineage sorting (Edwards et al., 2007; Kubatko and Degnan, 2007; Maddison and Knowles, 2006; Rokas et al., 2003). Multiple accessions per species may also strengthen inferences if young species groups still share polyphyletic alleles (Edwards and Beerli, 2000; Maddison and Knowles, 2006). Although incomplete lineage sorting is a well- recognized feature of species-level phylogenies, methods to infer species trees from disparate gene trees are in their infancy (e.g. Carstens and Knowles, 2007; Edwards, 2009; Huang and Knowles, 2009; Liu et al., 2008; Maddison, 1997). Despite simulations that describe inconsistent results from concatenated data in groups with rapid and/or recent radiations (Kubatko and Degnan, 2007; Liu and Edwards, 2009), ‘single-tree’ techniques are still widely used. Species tree approaches that simultaneously consider each gene tree have the potential to provide a useful integration of population genetics and phylogenetics, particularly where 1055-7903/$ - see front matter Ó 2011 Elsevier Inc. All rights reserved. doi:10.1016/j.ympev.2011.04.001 Abbreviations: p, nucleotide diversity; AIC, Akaike information criterion; BS, bootstrap; BEAST, Bayesian evolutionary analysis by sampling trees; BEST, Bayesian estimation of species trees; CI, consistency index; GSI, genealogical sorting index; Ma, million years ago; MCMC, Markov chain Monte Carlo simulations; PI, parsimony-informative; PP, posterior probability; RI, retention index; TL, tree length; TMRCA, time to most recent common ancestor. ⇑ Corresponding author. Address: Hendrix College, Biology Department, 1600 Washington Ave., Conway, AR 72032, USA. Fax: +1 501 450 4547. E-mail addresses: [email protected] (A. Willyard), lisawallace@biology. msstate.edu (L.E. Wallace), [email protected] (W.L. Wagner), [email protected] (S.G. Weller), [email protected] (A.K. Sakai), [email protected] (M. Nepokroeff). 1 These authors contributed equally to this work. Molecular Phylogenetics and Evolution 60 (2011) 29–48 Contents lists available at ScienceDirect Molecular Phylogenetics and Evolution journal homepage: www.elsevier.com/locate/ympev
Transcript of Estimating the species tree for Hawaiian Schiedea (Caryophyllaceae) from multiple loci in the...
Molecular Phylogenetics and Evolution 60 (2011) 29–48
Contents lists available at ScienceDirect
Molecular Phylogenetics and Evolution
journal homepage: www.elsevier .com/ locate /ympev
Estimating the species tree for Hawaiian Schiedea (Caryophyllaceae)from multiple loci in the presence of reticulate evolution
Ann Willyard a,⇑,1, Lisa E. Wallace b,1, Warren L. Wagner c, Stephen G. Weller d,Ann K. Sakai d, Molly Nepokroeff a
a University of South Dakota, Department of Biology, 414 E. Clark St., Vermillion, SD 57069, USAb Mississippi State University, Department of Biological Sciences, P.O. Box GY, Mississippi State, MS 39762, USAc National Museum of Natural History, Smithsonian Institution, Botany, P.O. Box 37012, MRC 166, Washington, DC 20013, USAd University of California Irvine, Department of Ecology & Evolutionary Biology, 321 Steinhaus Hall, Irvine, CA 92697, USA
a r t i c l e i n f o a b s t r a c t
Article history:Received 1 August 2010Revised 4 April 2011Accepted 5 April 2011Available online 12 April 2011
Keywords:Hawai‘iSpecies treesReticulate evolutionSchiedeaCaryophyllaceaeLow-copy nuclear loci
1055-7903/$ - see front matter � 2011 Elsevier Inc. Adoi:10.1016/j.ympev.2011.04.001
Abbreviations: p, nucleotide diversity; AIC, Akaikbootstrap; BEAST, Bayesian evolutionary analysis by saestimation of species trees; CI, consistency index; GSMa, million years ago; MCMC, Markov chain Mparsimony-informative; PP, posterior probability; Rlength; TMRCA, time to most recent common ancesto⇑ Corresponding author. Address: Hendrix College
Washington Ave., Conway, AR 72032, USA. Fax: +1 50E-mail addresses: [email protected] (A. W
msstate.edu (L.E. Wallace), [email protected] (W.L. WaWeller), [email protected] (A.K. Sakai), Molly.Nepokroef
1 These authors contributed equally to this work.
Schiedea (Caryophyllaceae) is a monophyletic genus of 34 species, all endemic to the Hawaiian Islands,that arose from a single colonization, providing one of the best examples of adaptive radiation in Hawai‘i.Species utilize a range of habitats and exhibit a variety of growth forms and transitions in breeding sys-tems from hermaphroditism toward dimorphism or autogamy. Our study included the most thoroughsampling to date: 2–5 individuals per species and 4 independent genetic partitions: eight plastid andthree low-copy nuclear loci (9217 bps), allowing a three-locus BEST species tree. Despite incomplete res-olution at the tips, our results support monophyly for each extant species. Gene trees revealed severalclear cases of cytonuclear incongruence, likely created by interspecific introgression. Conflict occurs atthe divergence of section Alphaschiedea as well as at the tips. Ages inferred from a BEAST analysis allowan original colonization onto either Nihoa or Kauaì and inform some aspects of inter-island migrations.We suggest that several hard polytomies on the species tree are biologically realistic, signifying eithernearly simultaneous speciation or historical introgressive hybridization. Based on inferred node ages thatexceed expected coalescent times, we propose that undetected nuclear introgression may play a largerrole than incomplete lineage sorting in sections Schiedea and Mononeura.
� 2011 Elsevier Inc. All rights reserved.
1. Introduction
1.1. Species tree construction
Adaptive radiations are a major challenge to molecular system-atics because individual gene lineages may be so recent that theyfail to coalesce before the time of species divergence (Edwardset al., 2007). Among recently diverged species, genealogies inferredfrom independent regions of the genome are likely to disagree due
ll rights reserved.
e information criterion; BS,mpling trees; BEST, Bayesian
I, genealogical sorting index;onte Carlo simulations; PI,I, retention index; TL, treer., Biology Department, 16001 450 4547.
illyard), [email protected]), [email protected] ([email protected] (M. Nepokroeff).
to the differential sorting of ancestral polymorphism into daughterlineages such that each gene tree may differ from the species tree(Degnan and Rosenberg, 2006; Funk and Omland, 2003; Goodmanet al., 1979; Maddison, 1997). To construct a species tree wherecoalescence cannot safely be assumed, multiple independent lociare vital to overcome the stochastic nature of lineage sorting(Edwards et al., 2007; Kubatko and Degnan, 2007; Maddison andKnowles, 2006; Rokas et al., 2003). Multiple accessions per speciesmay also strengthen inferences if young species groups still sharepolyphyletic alleles (Edwards and Beerli, 2000; Maddison andKnowles, 2006). Although incomplete lineage sorting is a well-recognized feature of species-level phylogenies, methods to inferspecies trees from disparate gene trees are in their infancy (e.g.Carstens and Knowles, 2007; Edwards, 2009; Huang and Knowles,2009; Liu et al., 2008; Maddison, 1997). Despite simulations thatdescribe inconsistent results from concatenated data in groupswith rapid and/or recent radiations (Kubatko and Degnan, 2007;Liu and Edwards, 2009), ‘single-tree’ techniques are still widelyused. Species tree approaches that simultaneously consider eachgene tree have the potential to provide a useful integrationof population genetics and phylogenetics, particularly where
30 A. Willyard et al. / Molecular Phylogenetics and Evolution 60 (2011) 29–48
conditions of high gene tree discordance due to incomplete lineagesorting are to be expected, such as those encountered in recent, ra-pid radiations (Edwards et al., 2007). However, their implementa-tion can be challenging, and few empirical studies have usedspecies-tree methods for large numbers of samples (Linnen andFarrell, 2008).
1.2. Reticulate evolution
Reticulate evolution arises if genetic information is acquiredfrom a divergent taxon and a remnant of the ‘foreign’ genome per-sists in a lineage. Several mechanisms for such gene transfers areknown from eukaryotes (Doolittle and Bapteste, 2007), and inter-specific hybridization that leads to the persistence of introgressedgenomic regions (introgression) appears to be a common phenom-enon in the divergence of plant species (Grant, 1981; Seehausen,2004; Stebbins, 1950). Species barriers are particularly porousto the introgression of maternally inherited organelle genes(Chan and Levin, 2005). Reports of introgressed mitochondrialgenes are frequent (Chan and Levin, 2005; Shaw, 2002), and intro-gressed plastid genes appear to be nearly ubiquitous across theplant kingdom (Rieseberg and Soltis, 1991). Factors that makeorganellar introgression much more likely than nuclear includematernal inheritance (Chan and Levin, 2005; Rieseberg et al.,1996), lack of linkage to nuclear genes under selection (Funk andOmland, 2003) and smaller effective population size due to clonalinheritance (Petit et al., 1993). Despite a recognition that reticulateevolution appears to be a common phenomenon (especially, butnot exclusively, in plant species), the complexity of the problemhas so far prevented chloroplast capture from being included inmodels used for phylogenetic algorithms that infer species trees(Edwards et al., 2007). While the exclusive use of organellar genesto construct species trees is misleading in the case of chloroplastcapture, their uniparental inheritance can be helpful in conjunctionwith nuclear genes to infer the direction, as well as the relativetiming, of introgression, (e.g. Bossu and Near, 2009; Dunbar-Coet al., 2008; Howarth and Baum, 2005; Lindqvist et al., 2003;Willyard et al., 2009).
1.3. Schiedea overview
Monophyly in Schiedea (Caryophyllaceae), a genus of herbs,vines, and small shrubs endemic to the Hawaiian Islands, suggeststhat all 34 known species (32 of them extant) arose in situ follow-ing a single colonization of the island chain (Wagner et al., 2005).Schiedea’s closest sister genera (Honckenya and Wilhelmsia) are cir-cumboreal (Wagner et al., 2005) with the nearest populationsgrowing some 4000 km from the Hawaiian archipelago. Speciesof Schiedea are unique among the Caryophyllaceae in possessingdistinctive floral nectaries. Developmental studies have shown thatthese nectaries, which may have co-evolved with honeycreeperand/or honeyeater bird pollinators in sections Nothoschiedea andAlsinidendron (Weller et al., 1998), and reduced structures inwind-pollinated Schiedea, represent homologous organs acrossthe genus (Wagner et al., 2005). The presence of a woody habitin some species also delineates Schiedea from other members ofthe subfamily Alsinoideae (Wagner et al., 1999), and is one thenumerous examples of woodiness arising in island flora from her-baceous progenitors (Carlquist, 1974). Schiedea represents thefourth most species-rich radiation of plants in the Hawai‘ianIslands, and the third from a single colonization of these islands(Wagner et al., 1999). Fifteen of the 32 extant species are endan-gered, giving Schiedea the undesirable distinction of having the‘‘highest proportion of endangered taxa for any species-rich line-age in the Hawaiian Islands’’ (Wagner et al., 2005). Most Schiedeaspecies are single-island endemics. When Lana‘i, Moloka‘i, and
Maui are considered as a single land mass (Maui Nui) due to geo-logically recent and prolonged above-water connections (Wagneret al., 1999), only four Schiedea species have populations that occu-py multiple islands. This high level of single-island endemism in aspecies-rich genus provides the opportunity to compare reproduc-tive isolation achieved via inter-island migrations with allopatricspeciation created by habitat shifts within an island, an objectivepossible only with a resolved phylogeny for the lineage (Sakaiet al., 2006; Weller and Sakai, 1999). A resolved phylogeny wouldalso be useful for understanding the number of breeding systemstransitions that have occurred in this lineage, and possibly the eco-logical factors that have driven these changes.
1.4. Timing of Schiedea colonization and radiation
The age of all Schiedea species may be constrained by the age ofthe current high Hawai‘ian Islands, i.e., within the last 5–7 millionyears (Ma; Clague, 1996). The recent nature of the Schiedea radia-tion is supported by low interspecific nucleotide sequence diver-gence in nuclear ribosomal (nrDNA) internal and externaltranscribed spacers (ITS and ETS; Wagner et al., 2005). However,intraspecific variation has not been tested across the genus, as pre-vious genus-wide molecular systematic studies have used single-exemplar sampling. Based on the geographic distribution of mostapparently early-branching Schiedea lineages (Wagner et al.,2005), the original immigration may have been onto the oldestcurrent high island in the chain (Kauaì; ca. 4.7 Ma; Clague, 1996),placing a lower boundary for the origin of Schiedea within that timeframe. Alternatively, the presence of a single Schiedea species(S. verticillata) on the eroded island of Nihoa could represent thepersistence of the lineage from one of the older, leeward, islandswhile it was higher. The timing and spacing of volcanic islandformation in this chain may have provided continuous habitat aslong ago as 30 or 23 Ma, dating to times when the atolls of Kure orLisianski, respectively, were high islands (Clague, 1996). ‘Island-hopping’ to a new island before all of the suitable habitat on olderislands was degraded has been proposed for lineages of someorganisms on the Hawaiian archipelago (Givnish et al., 2009,1995; Jordan et al., 2003; Russo et al., 1995; Schneider et al.,2005), while other colonizations have been described as being morerecent and thus their radiations more rapid (Fleischer et al., 1998;Havran et al., 2009; Price and Clague, 2002). A resolved Schiedeaspecies tree would help calibrate the age of the genus and thusimprove estimations for the rate of speciation in the lineage.
1.5. Evolution of breeding systems
The genus Schiedea is of additional interest as an outstandingsystem in which to study diversification of sexual dimorphismin plants. Dioecy arose within the genus (Wagner et al., 2005),and a wide range of breeding systems are currently represented:14 species are moderately to highly outcrossing hermaphrodites,eight are facultatively autogamous or cleistogamous, and 10 aredimorphic: gynodioecious, subdioecious or dioecious (Wagneret al., 2005; Weller et al., 1998). Schiedea has been used to testsome of the factors that promote dioecy, e.g. inbreeding depres-sion (Sakai et al., 1989, 1997), sex allocation (Sakai et al., 2008;Weller and Sakai, 2005), wind pollination (Golonka et al., 2005;Weller et al., 1998, 2006, 2007), and environmental conditions(Culley et al., 2006; Sakai and Weller, 1991). However, the num-ber of shifts to dimorphic breeding systems within Schiedea isunknown, as it depends on phylogenetic resolution among the12 very closely related species in section Schiedea. Up to sixindependent transitions to dioecy have been suggested withinthis section (Norman et al., 1997; Weller et al., 1990, 1995),and previous phylogenies have not provided any evidence that
A. Willyard et al. / Molecular Phylogenetics and Evolution 60 (2011) 29–48 31
the three hermaphroditic species in section Schiedea retain thatfeature as the plesiomorphic state. At least one reversal towardhermaphroditism may have occurred: from gynodioecy to her-maphroditism in S. lydgatei (Soltis et al., 1996). In Schiedea, malesterility (a critical component of dioecy) is under the control of asingle, recessive nuclear gene (Weller and Sakai, 1991). This sug-gests that the allele conferring male sterility might be passedamong species if interspecific hybridization leads to the intro-gression of some nuclear genes between different species. Abetter understanding of the phylogeny within section Schiedeawill allow an investigation of whether male sterility arose as asingle transition followed by retention of the allele in the lineagewith dimorphic species, an evolutionary scenario suggested byapparent identity of the male sterility gene across species(Weller et al., 2001). Alternatively, the male sterility allele mayhave been transferred across species boundaries by hybridiza-tion. A resolved phylogeny would also help determine if anylineages within section Schiedea truly represent reversals towardhermaphroditism.
1.6. Introgression among Schiedea
The role of interspecific gene flow in the diversification of plantand animal adaptive radiations, (reviewed by Seehausen (2004))has been recently explored in a number of plant and animal groups(e.g. (Caraway et al., 2001; Frajman et al., 2009; Howarth andBaum, 2005; Leache, 2009; Pirie et al., 2009; Taylor and McPhail,2008)). We suspected that introgression might have occurred with-in Schiedea. Based on morphological intermediates, natural hybrid-ization has been reported for five pairs of Schiedea species:extensive numbers of hybrid plants for S. ligustrina � S. mannii,S. lydgatei � S. sarmentosa, and S. menziesii � S. salicaria; minimalnumbers for S. hookeri � S. mannii and S. hookeri � S. pentandra(Wagner et al., 2005; Weller et al., 2001). Introgression of plastidgenes was inferred from molecular evidence between S. kealiae �S. ligustrina (Soltis et al., 1996). In contrast to the apparently min-imal occurrence of natural hybridization, vigorous F1 progeny withfertile pollen can be created from artificial crosses between manySchiedea species (Weller et al., 2001). This suggests that allopatryprovides reproductive isolation in Schiedea, as most species arecurrently limited to specialized habitat within a fairly small rangethat rarely coincides with the range and/or the habitat of conge-neric species (Weller et al., 2001). Opportunities for sympatric ornearly sympatric pairs of Schiedea to hybridize are further reducedby the tendency toward autogamy in eight species. For example,no morphological intermediates have been detected betweenS. nuttallii and the sympatric but facultatively autogamousS. obovata, between S. pentandra and the sympatric but cleistoga-mous S. trinervis, or between S. stellarioides and the sympatric butfacultatively autogamous S. viscosa. The extent of hybridizationbetween other sympatric pairs (e.g. S. kauaiensis � S. membranacea,S. spergulina � S. stellarioides) is an open question, as no morpho-logical intermediates have been reported.
1.7. Experiment overview
Species-tree methods are computationally difficult with a largenumber of samples. Our data set consisted of 91 accessions (yield-ing 182 nuclear alleles) to adequately sample all 32 extant speciesof Schiedea across their geographic ranges, and to address morpho-logical variation. For 91 tips, the number of possible tree rearrange-ments approaches 3 � 10195 (Felsenstein, 2004), a vast number forany phylogenetic method, let alone one that takes individual genetree topologies into account. In this paper, we use our multi-locusdata set that represents both plastid and nuclear genomes to com-pare inferences between a species tree approach and a traditional
concatenation method. We also use a ‘total-evidence’ analysis thatconcatenates nuclear, plastid, and morphological data. In overview,our process was to: (1) create four independent gene trees – onefor plastid loci and one for each of three independent nuclear loci;(2) create a ‘Bayesian Estimation of Species Trees’ (BEST; Liu, 2008)using three nuclear loci; (3) concatenate three nuclear loci and cre-ate a nuclear single-tree species estimate; (4) evaluate speciesmonophyly and identify accessions with conflicting placement onplastid and nuclear gene trees; (5) exclude the plastid informationfor species with cytonuclear conflict to create a ‘compromise’ dataset; (6) create a second BEST species tree that combines nuclearand plastid data using this compromise data set; (7) test the to-tal-evidence approach by analyzing a 32-allele data set (applyingthe same compromise for cytonuclear conflict) that collapses themulti-accession data set to one record per species and incorporatespreviously published nrDNA sequences and morphology. The total-evidence process retains much of the valuable data from plastidloci and incorporates additional information for each species, whileattempting to avoid major violations of the assumption of hierar-chical evolution. We compare species tree results from these verydifferent approaches to test the utility of species-tree vs. concate-nated methods and the reliability of identifying and suppressingcytonuclear conflict in this species-rich young lineage.
We address six main questions: (1) Are named taxonomic spe-cies of Schiedea monophyletic? (2) How do traditional sectionalrelationships compare to relationships resolved on our speciestrees? (3) Given multiple loci and the apparently rapid and recentnature of the Schiedea lineage, what is the relative performance ofthe species-tree vs. the concatenated method for inferring speciesrelationships in Schiedea? (4) At what evolutionary depth andtimeframe do incomplete lineage sorting and introgression resultin statistically inconsistent species trees within the Schiedea line-age? (5) Can we improve species tree inference by identifyingand excluding introgressed alleles and by incorporating additionaldata for each species? (6) What is the age of the genus and of themost recent crown radiation?
2. Materials and methods
2.1. Plant materials
Ninety-one individuals were sampled from 51 populations,representing all 32 extant Schiedea species with two or threeaccessions per species except that five accessions were includedfor S. globosa in order to sample populations from the islands ofHawai‘i, Maui, and Oàhu (Table 1). Herbarium abbreviationsfollow the online database Index Herbariorum (Thiers, 2010).Nucleotide sequences for S. globosa, S. haleakalensis, S. hookeri,and S. mannii were included from a previous study: GenBankaccessions FJ496359, FJ496372, FJ496374, FJ496387, FJ496413,FJ496416- FJ496425, FJ496430, FJ496455, FJ496458, FJ496459,FJ496481, FJ496526, FJ496527, FJ496531- FJ496541, FJ496545,FJ496546, FJ496562, FJ496563, FJ496566, FJ496567, FJ496587,FJ496588, FJ496632, FJ496633, and FJ496638- FJ496647 (Wallaceet al., 2009). Plants were grown in the UC-Irvine greenhouses fromwild-collected cuttings or seed. Harvested leaves were stored insilica or frozen until being processed. Five outgroups were selectedfrom subfamily Alsinoideae (Caryophyllaceae; Table 1).
2.2. DNA isolation, amplification, and sequencing
DNA was isolated with the DNeasy Plant Mini Kit (Qiagen,Valencia, CA, USA). Eleven loci were PCR-amplified and sequenced.These included portions of three low-copy nuclear genes: chloro-plast-expressed glutamine synthetase (ncpGS), nitrate reductase
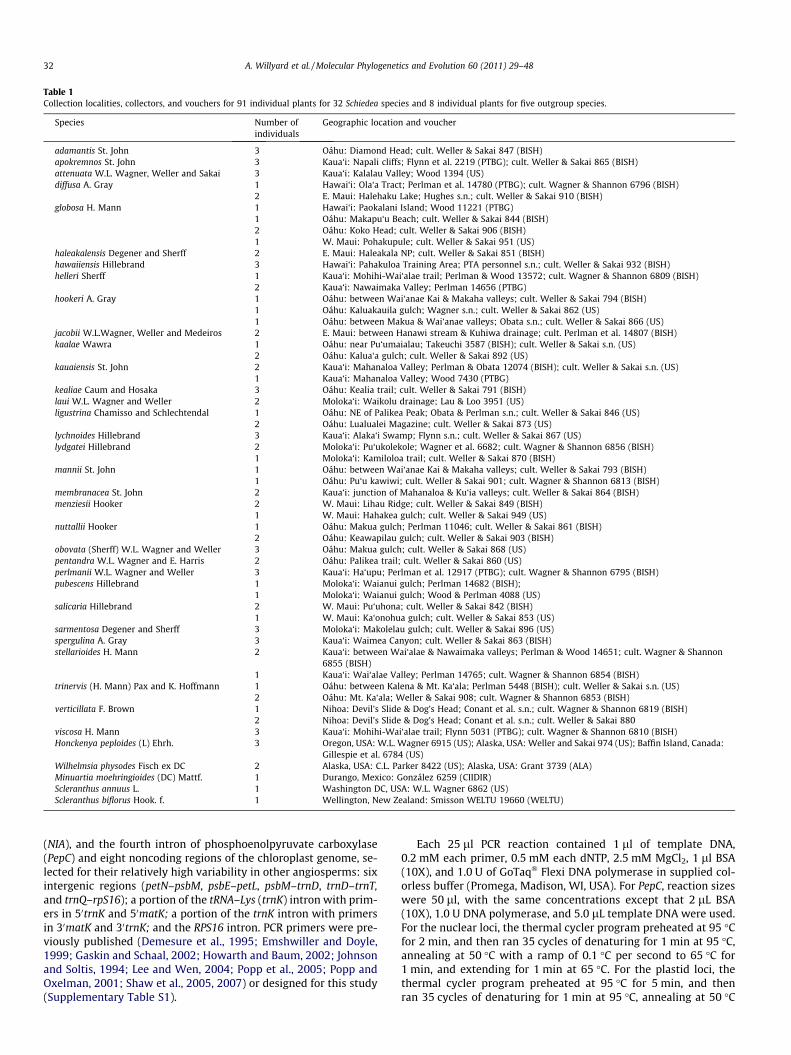
Table 1Collection localities, collectors, and vouchers for 91 individual plants for 32 Schiedea species and 8 individual plants for five outgroup species.
Species Number ofindividuals
Geographic location and voucher
adamantis St. John 3 Oáhu: Diamond Head; cult. Weller & Sakai 847 (BISH)apokremnos St. John 3 Kaua‘i: Napali cliffs; Flynn et al. 2219 (PTBG); cult. Weller & Sakai 865 (BISH)attenuata W.L. Wagner, Weller and Sakai 3 Kaua‘i: Kalalau Valley; Wood 1394 (US)diffusa A. Gray 1 Hawai‘i: Ola‘a Tract; Perlman et al. 14780 (PTBG); cult. Wagner & Shannon 6796 (BISH)
2 E. Maui: Halehaku Lake; Hughes s.n.; cult. Weller & Sakai 910 (BISH)globosa H. Mann 1 Hawai‘i: Paokalani Island; Wood 11221 (PTBG)
1 Oáhu: Makapu‘u Beach; cult. Weller & Sakai 844 (BISH)2 Oáhu: Koko Head; cult. Weller & Sakai 906 (BISH)1 W. Maui: Pohakupule; cult. Weller & Sakai 951 (US)
haleakalensis Degener and Sherff 2 E. Maui: Haleakala NP; cult. Weller & Sakai 851 (BISH)hawaiiensis Hillebrand 3 Hawai‘i: Pahakuloa Training Area; PTA personnel s.n.; cult. Weller & Sakai 932 (BISH)helleri Sherff 1 Kaua‘i: Mohihi-Wai‘alae trail; Perlman & Wood 13572; cult. Wagner & Shannon 6809 (BISH)
2 Kaua‘i: Nawaimaka Valley; Perlman 14656 (PTBG)hookeri A. Gray 1 Oáhu: between Wai‘anae Kai & Makaha valleys; cult. Weller & Sakai 794 (BISH)
1 Oáhu: Kaluakauila gulch; Wagner s.n.; cult. Weller & Sakai 862 (US)1 Oáhu: between Makua & Wai‘anae valleys; Obata s.n.; cult. Weller & Sakai 866 (US)
jacobii W.L.Wagner, Weller and Medeiros 2 E. Maui: between Hanawi stream & Kuhiwa drainage; cult. Perlman et al. 14807 (BISH)kaalae Wawra 1 Oáhu: near Pu‘umaialau; Takeuchi 3587 (BISH); cult. Weller & Sakai s.n. (US)
2 Oáhu: Kalua‘a gulch; cult. Weller & Sakai 892 (US)kauaiensis St. John 2 Kaua‘i: Mahanaloa Valley; Perlman & Obata 12074 (BISH); cult. Weller & Sakai s.n. (US)
1 Kaua‘i: Mahanaloa Valley; Wood 7430 (PTBG)kealiae Caum and Hosaka 3 Oáhu: Kealia trail; cult. Weller & Sakai 791 (BISH)laui W.L. Wagner and Weller 2 Moloka‘i: Waikolu drainage; Lau & Loo 3951 (US)ligustrina Chamisso and Schlechtendal 1 Oáhu: NE of Palikea Peak; Obata & Perlman s.n.; cult. Weller & Sakai 846 (US)
2 Oáhu: Lualualei Magazine; cult. Weller & Sakai 873 (US)lychnoides Hillebrand 3 Kaua‘i: Alaka‘i Swamp; Flynn s.n.; cult. Weller & Sakai 867 (US)lydgatei Hillebrand 2 Moloka‘i: Pu‘ukolekole; Wagner et al. 6682; cult. Wagner & Shannon 6856 (BISH)
1 Moloka‘i: Kamiloloa trail; cult. Weller & Sakai 870 (BISH)mannii St. John 1 Oáhu: between Wai‘anae Kai & Makaha valleys; cult. Weller & Sakai 793 (BISH)
1 Oáhu: Pu‘u kawiwi; cult. Weller & Sakai 901; cult. Wagner & Shannon 6813 (BISH)membranacea St. John 2 Kaua‘i: junction of Mahanaloa & Ku‘ia valleys; cult. Weller & Sakai 864 (BISH)menziesii Hooker 2 W. Maui: Lihau Ridge; cult. Weller & Sakai 849 (BISH)
1 W. Maui: Hahakea gulch; cult. Weller & Sakai 949 (US)nuttallii Hooker 1 Oáhu: Makua gulch; Perlman 11046; cult. Weller & Sakai 861 (BISH)
2 Oáhu: Keawapilau gulch; cult. Weller & Sakai 903 (BISH)obovata (Sherff) W.L. Wagner and Weller 3 Oáhu: Makua gulch; cult. Weller & Sakai 868 (US)pentandra W.L. Wagner and E. Harris 2 Oáhu: Palikea trail; cult. Weller & Sakai 860 (US)perlmanii W.L. Wagner and Weller 3 Kaua‘i: Ha‘upu; Perlman et al. 12917 (PTBG); cult. Wagner & Shannon 6795 (BISH)pubescens Hillebrand 1 Moloka‘i: Waianui gulch; Perlman 14682 (BISH);
1 Moloka‘i: Waianui gulch; Wood & Perlman 4088 (US)salicaria Hillebrand 2 W. Maui: Pu‘uhona; cult. Weller & Sakai 842 (BISH)
1 W. Maui: Ka‘onohua gulch; cult. Weller & Sakai 853 (US)sarmentosa Degener and Sherff 3 Moloka‘i: Makolelau gulch; cult. Weller & Sakai 896 (US)spergulina A. Gray 3 Kaua‘i: Waimea Canyon; cult. Weller & Sakai 863 (BISH)stellarioides H. Mann 2 Kaua‘i: between Wai‘alae & Nawaimaka valleys; Perlman & Wood 14651; cult. Wagner & Shannon
6855 (BISH)1 Kaua‘i: Wai‘alae Valley; Perlman 14765; cult. Wagner & Shannon 6854 (BISH)
trinervis (H. Mann) Pax and K. Hoffmann 1 Oáhu: between Kalena & Mt. Ka‘ala; Perlman 5448 (BISH); cult. Weller & Sakai s.n. (US)2 Oáhu: Mt. Ka‘ala; Weller & Sakai 908; cult. Wagner & Shannon 6853 (BISH)
verticillata F. Brown 1 Nihoa: Devil’s Slide & Dog’s Head; Conant et al. s.n.; cult. Wagner & Shannon 6819 (BISH)2 Nihoa: Devil’s Slide & Dog’s Head; Conant et al. s.n.; cult. Weller & Sakai 880
viscosa H. Mann 3 Kaua‘i: Mohihi-Wai‘alae trail; Flynn 5031 (PTBG); cult. Wagner & Shannon 6810 (BISH)Honckenya peploides (L) Ehrh. 3 Oregon, USA: W.L. Wagner 6915 (US); Alaska, USA: Weller and Sakai 974 (US); Baffin Island, Canada:
Gillespie et al. 6784 (US)Wilhelmsia physodes Fisch ex DC 2 Alaska, USA: C.L. Parker 8422 (US); Alaska, USA: Grant 3739 (ALA)Minuartia moehringioides (DC) Mattf. 1 Durango, Mexico: González 6259 (CIIDIR)Scleranthus annuus L. 1 Washington DC, USA: W.L. Wagner 6862 (US)Scleranthus biflorus Hook. f. 1 Wellington, New Zealand: Smisson WELTU 19660 (WELTU)
32 A. Willyard et al. / Molecular Phylogenetics and Evolution 60 (2011) 29–48
(NIA), and the fourth intron of phosphoenolpyruvate carboxylase(PepC) and eight noncoding regions of the chloroplast genome, se-lected for their relatively high variability in other angiosperms: sixintergenic regions (petN–psbM, psbE–petL, psbM–trnD, trnD–trnT,and trnQ–rpS16); a portion of the tRNA–Lys (trnK) intron with prim-ers in 50trnK and 50matK; a portion of the trnK intron with primersin 30matK and 30trnK; and the RPS16 intron. PCR primers were pre-viously published (Demesure et al., 1995; Emshwiller and Doyle,1999; Gaskin and Schaal, 2002; Howarth and Baum, 2002; Johnsonand Soltis, 1994; Lee and Wen, 2004; Popp et al., 2005; Popp andOxelman, 2001; Shaw et al., 2005, 2007) or designed for this study(Supplementary Table S1).
Each 25 ll PCR reaction contained 1 ll of template DNA,0.2 mM each primer, 0.5 mM each dNTP, 2.5 mM MgCl2, 1 ll BSA(10X), and 1.0 U of GoTaq� Flexi DNA polymerase in supplied col-orless buffer (Promega, Madison, WI, USA). For PepC, reaction sizeswere 50 ll, with the same concentrations except that 2 lL BSA(10X), 1.0 U DNA polymerase, and 5.0 lL template DNA were used.For the nuclear loci, the thermal cycler program preheated at 95 �Cfor 2 min, and then ran 35 cycles of denaturing for 1 min at 95 �C,annealing at 50 �C with a ramp of 0.1 �C per second to 65 �C for1 min, and extending for 1 min at 65 �C. For the plastid loci, thethermal cycler program preheated at 95 �C for 5 min, and thenran 35 cycles of denaturing for 1 min at 95 �C, annealing at 50 �C
A. Willyard et al. / Molecular Phylogenetics and Evolution 60 (2011) 29–48 33
for 1 min, extending for 2 min at 72 �C, and a final extension for7 min at 72 �C.
A sample of each PCR product and the negative controls wereelectrophoresed in TBE agarose gels to check for amplification ofa band of the expected size and for the absence of contamination.Plastid PCR products were cleaned with the QIAquick PCR Purifica-tion Kit (Qiagen, Valencia, CA, USA). For nuclear loci, bands cutfrom gels were purified with the QIAquick Gel Extraction Kit(Qiagen, Valencia, CA, USA). Cleaned DNA was sequenced fromthe forward and reverse primers with the dideoxy chain termina-tion method using Big Dye Terminator v3.1 Cycle Sequencing Kit(Applied Biosystems, Foster City, CA, USA) and Better Buffer (TheGel Company, San Francisco, CA, USA). For two longer amplicons(psbE–petL and trnD–trnT), additional sequencing was performedfrom internal primers (Supplementary Table S1). Reactions werecleaned with an ethanol/sodium acetate precipitation, and sampleswere capillary electrophoresed in an Avant-3100 Genetic Analyzerfollowing manufacturer’s protocols (Applied Biosystems, FosterCity, CA, USA).
2.3. Data preparation
Raw sequences were manually edited and a contig of each allelewas created in Sequencher vers. 4.1 (Gene Codes, Ann Arbor, MI,USA). For individuals heterozygous for ncpGS, NIA, or PepC, we in-ferred the identities of the two alleles using haplotype subtraction(Clark, 1990). For those individuals whose allelic identities couldnot be determined by this method, we cloned that locus with thepGEM-T Easy Vector System II (Promega Madison, WI, USA) and se-quenced individual clones as described. The two-allele data set in-cluded all 182 sequences, even if identical. The same arbitraryselection of one allele per accession (91 samples) was used for allone-allele analyses. Sequences were manually aligned using Se–Al vers. 2.0 (Rambaut, 2010b) to minimize the number of inferredindels. Nucleotide diversity (p; Nei, 1987) was calculated acrossthe one-allele data set as the average number of nucleotide differ-ences per site between two sequences, excluding sites with miss-ing data, using the software DnaSP vers. 4.5.0 (Rozas et al., 2003).For NIA, we excluded one missing allele from S. apokremnos beforecalculating p.
Recombinant sequences can distort phylogenetic inferences.We tested for evidence of recombination in the ncpGS, NIA, andPepC nuclear alignments by applying two statistical tests, theRDP method (Martin and Rybicki, 2000) and the MaxChi methodimplemented in the software RDP vers. 2.0 (Martin et al., 2005).For the RDP test, we analyzed the sequences at window sizes of5, 10, 50, and 100, using internal references. The MaxChi test wasrun by considering triplets of sequences and all sequences simulta-neously with gaps removed and a variable window size of 0.013.The significance of v2 peaks was tested using a permutation testof 1000 iterations.
Because we have a data set with multiple accessions per spe-cies, we are able to examine the monophyly of each namedtaxonomic species. The genealogical sorting index (gsi) is a stan-dardized measure of exclusive ancestry based on a tree topology.The index accounts for polytomies that do not conflict with sharedancestry and is normalized to account for differences in samplesize among clades (Cummings et al., 2008). Index values rangebetween gsi = 1 (complete monophyly) and gsi = 0 (no sharedancestry). We calculated the gsi for each species for each of ourfour Bayesian majority-rule gene trees (plastid, ncpGS, NIA, andPepC), selecting the one-allele gene tree for nuclear loci, using aweb-based application (Cummings et al., 2010). For each statistic,1000 permutations were used to assess significance at theP = 0.05 level. An ensemble gsi statistic was calculated using allfour of our gene trees to provide an overall estimate of each
species’ monophyly. This single statistic accounts for the uncer-tainty on one or more trees by weighting the gsi value from eachtree with its probability. We considered the gsi statistic whendeciding which species had paraphyletic, and therefore potentiallyintrogressed, plastid genes that should be excluded in the compro-mise species tree.
After preliminary investigations, we selected a single accession,Honckenya peploides (W.L. Wagner 6915), as the outgroup for allanalyses, because the current facility in BEST only allows for a sin-gle outgroup. For all phylogenetic analyses, alignment gaps weretreated as missing data. We used SeqState vers. 1.4 (Müller,2005) to recode gaps between ingroup alleles in our alignmentsas presence/absence characters using the simple indel-codingmethod (Simmons and Ochoterena, 2000). Indel-coding characterswere added to the matrices used for parsimony and Bayesian anal-yses, with these characters coded as missing data for the outgroupin order to minimize homoplasy.
2.4. Phylogenetic analyses
Model parameters are summarized in Table 2. We used similarmethods to infer individual gene trees and for concatenated spe-cies trees. Parsimony searches were conducted in PAUP� vers.4.0b10 (Swofford, 2002) using a heuristic search with 10 indepen-dent repetitions of random sequence addition and the tree bisec-tion reconnection method of branch swapping. For some analyses(Table 2), the maximum number of trees held was limited to100,000 in order to reduce computation time. Nodal support wasestimated using 1000 bootstrap pseudoreplicates. Based on thefindings of DeBry and Olmstead (2000), one tree was held duringbootstrapping for some analyses (Table 2).
A nucleotide substitution model was selected with the Akaikeinformation criterion (AIC; Akaike, 1974) from among 88 possiblemodels using jModeltest vers. 2.0 (Posada, 2008). The best-fit mod-el for the concatenated eight-locus plastid alignment and for ITS/ETS is GTR + G. Using the two-allele data set, the best-fit model isGTR + G for PepC, TMP3uf + G for ncpGS, and GTR + I + G for NIA.Thus, our nucleotide partitions in Bayesian analyses allowed sixsubstitution types for every partition. Among-site variation wasmodeled with a gamma distribution for plastid, ITS/ETS, PepC, andncpGS partitions, while the NIA partition allowed a proportion ofsites to be invariable with the remainder gamma-distributed.
Bayesian analyses to infer gene trees and concatenated speciestrees were performed by allowing rates to vary by partition. Fordata included in a particular analysis (Table 2), we defined up toseven partitions: (1) the eight plastid loci as a single partition;(2–4) a partition for each low-copy nuclear locus individually;(5) a partition for all indel-coding characters; (6) a single partitionfor nrDNA ITS and ETS sequences; and (7) a partition for morpho-logical characters. Bayesian searches applied the optimum substi-tution model to each nucleotide partition and an equal-ratebinary model to partitions for morphological and indel characters.For indel characters, the coding parameter was set to indicate thatonly variable characters had the possibility of being sampled. Foreach analysis, we performed two simultaneous runs using a mul-ti-processor compilation of MrBayes vers. 3.1.2 (Ronquist andHuelsenbeck, 2003). The number of chains of Markov chain MonteCarlo simulations (MCMC), number of generations, and tempera-ture parameters for chain swapping are given in Table 2. All runswere sampled at the frequency needed to save 20,000 trees perrun. We evaluated convergence and chose the number of samplesto discard as burn-in based on stationarity of a plot of the genera-tion versus log-likelihood for each run. We also compared plots oftree distances and split frequencies between two runs using the‘Comparetree’ function in MrBayes. One majority-rule consensustree was built for each data set by combining trees generated by
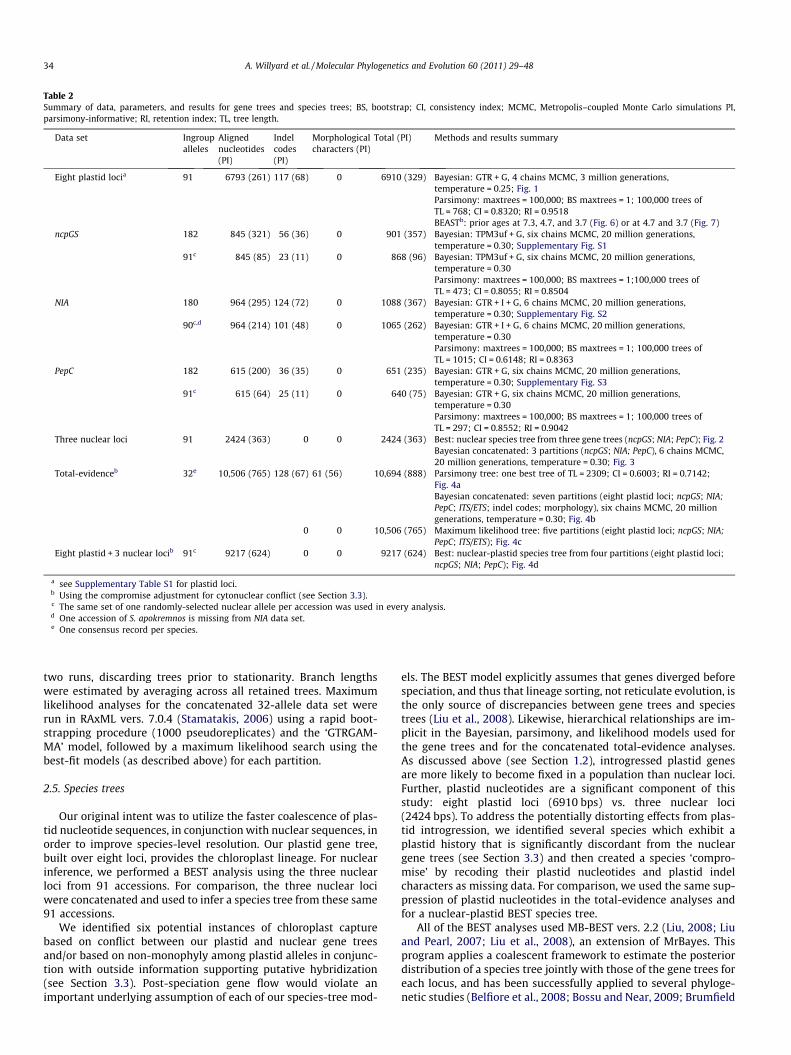
Table 2Summary of data, parameters, and results for gene trees and species trees; BS, bootstrap; CI, consistency index; MCMC, Metropolis–coupled Monte Carlo simulations PI,parsimony-informative; RI, retention index; TL, tree length.
Data set Ingroupalleles
Alignednucleotides(PI)
Indelcodes(PI)
Morphologicalcharacters (PI)
Total (PI) Methods and results summary
Eight plastid locia 91 6793 (261) 117 (68) 0 6910 (329) Bayesian: GTR + G, 4 chains MCMC, 3 million generations,temperature = 0.25; Fig. 1Parsimony: maxtrees = 100,000; BS maxtrees = 1; 100,000 trees ofTL = 768; CI = 0.8320; RI = 0.9518BEASTb: prior ages at 7.3, 4.7, and 3.7 (Fig. 6) or at 4.7 and 3.7 (Fig. 7)
ncpGS 182 845 (321) 56 (36) 0 901 (357) Bayesian: TPM3uf + G, six chains MCMC, 20 million generations,temperature = 0.30; Supplementary Fig. S1
91c 845 (85) 23 (11) 0 868 (96) Bayesian: TPM3uf + G, six chains MCMC, 20 million generations,temperature = 0.30Parsimony: maxtrees = 100,000; BS maxtrees = 1;100,000 trees ofTL = 473; CI = 0.8055; RI = 0.8504
NIA 180 964 (295) 124 (72) 0 1088 (367) Bayesian: GTR + I + G, 6 chains MCMC, 20 million generations,temperature = 0.30; Supplementary Fig. S2
90c,d 964 (214) 101 (48) 0 1065 (262) Bayesian: GTR + I + G, 6 chains MCMC, 20 million generations,temperature = 0.30Parsimony: maxtrees = 100,000; BS maxtrees = 1; 100,000 trees ofTL = 1015; CI = 0.6148; RI = 0.8363
PepC 182 615 (200) 36 (35) 0 651 (235) Bayesian: GTR + G, six chains MCMC, 20 million generations,temperature = 0.30; Supplementary Fig. S3
91c 615 (64) 25 (11) 0 640 (75) Bayesian: GTR + G, six chains MCMC, 20 million generations,temperature = 0.30Parsimony: maxtrees = 100,000; BS maxtrees = 1; 100,000 trees ofTL = 297; CI = 0.8552; RI = 0.9042
Three nuclear loci 91 2424 (363) 0 0 2424 (363) Best: nuclear species tree from three gene trees (ncpGS; NIA; PepC); Fig. 2Bayesian concatenated: 3 partitions (ncpGS; NIA; PepC), 6 chains MCMC,20 million generations, temperature = 0.30; Fig. 3
Total-evidenceb 32e 10,506 (765) 128 (67) 61 (56) 10,694 (888) Parsimony tree: one best tree of TL = 2309; CI = 0.6003; RI = 0.7142;Fig. 4aBayesian concatenated: seven partitions (eight plastid loci; ncpGS; NIA;PepC; ITS/ETS; indel codes; morphology), six chains MCMC, 20 milliongenerations, temperature = 0.30; Fig. 4b
0 0 10,506 (765) Maximum likelihood tree: five partitions (eight plastid loci; ncpGS; NIA;PepC; ITS/ETS); Fig. 4c
Eight plastid + 3 nuclear locib 91c 9217 (624) 0 0 9217 (624) Best: nuclear-plastid species tree from four partitions (eight plastid loci;ncpGS; NIA; PepC); Fig. 4d
a see Supplementary Table S1 for plastid loci.b Using the compromise adjustment for cytonuclear conflict (see Section 3.3).c The same set of one randomly-selected nuclear allele per accession was used in every analysis.d One accession of S. apokremnos is missing from NIA data set.e One consensus record per species.
34 A. Willyard et al. / Molecular Phylogenetics and Evolution 60 (2011) 29–48
two runs, discarding trees prior to stationarity. Branch lengthswere estimated by averaging across all retained trees. Maximumlikelihood analyses for the concatenated 32-allele data set wererun in RAxML vers. 7.0.4 (Stamatakis, 2006) using a rapid boot-strapping procedure (1000 pseudoreplicates) and the ‘GTRGAM-MA’ model, followed by a maximum likelihood search using thebest-fit models (as described above) for each partition.
2.5. Species trees
Our original intent was to utilize the faster coalescence of plas-tid nucleotide sequences, in conjunction with nuclear sequences, inorder to improve species-level resolution. Our plastid gene tree,built over eight loci, provides the chloroplast lineage. For nuclearinference, we performed a BEST analysis using the three nuclearloci from 91 accessions. For comparison, the three nuclear lociwere concatenated and used to infer a species tree from these same91 accessions.
We identified six potential instances of chloroplast capturebased on conflict between our plastid and nuclear gene treesand/or based on non-monophyly among plastid alleles in conjunc-tion with outside information supporting putative hybridization(see Section 3.3). Post-speciation gene flow would violate animportant underlying assumption of each of our species-tree mod-
els. The BEST model explicitly assumes that genes diverged beforespeciation, and thus that lineage sorting, not reticulate evolution, isthe only source of discrepancies between gene trees and speciestrees (Liu et al., 2008). Likewise, hierarchical relationships are im-plicit in the Bayesian, parsimony, and likelihood models used forthe gene trees and for the concatenated total-evidence analyses.As discussed above (see Section 1.2), introgressed plastid genesare more likely to become fixed in a population than nuclear loci.Further, plastid nucleotides are a significant component of thisstudy: eight plastid loci (6910 bps) vs. three nuclear loci(2424 bps). To address the potentially distorting effects from plas-tid introgression, we identified several species which exhibit aplastid history that is significantly discordant from the nucleargene trees (see Section 3.3) and then created a species ‘compro-mise’ by recoding their plastid nucleotides and plastid indelcharacters as missing data. For comparison, we used the same sup-pression of plastid nucleotides in the total-evidence analyses andfor a nuclear-plastid BEST species tree.
All of the BEST analyses used MB-BEST vers. 2.2 (Liu, 2008; Liuand Pearl, 2007; Liu et al., 2008), an extension of MrBayes. Thisprogram applies a coalescent framework to estimate the posteriordistribution of a species tree jointly with those of the gene trees foreach locus, and has been successfully applied to several phyloge-netic studies (Belfiore et al., 2008; Bossu and Near, 2009; Brumfield
A. Willyard et al. / Molecular Phylogenetics and Evolution 60 (2011) 29–48 35
et al., 2008; Linnen and Farrell, 2008; Spinks and Shaffer, 2009),although lack of convergence has been reported (Wares et al.,2009). This version of MB-BEST uses a uniform prior for the speciestree and accounts for multiple accessions per species. Three parti-tions (and hence, three gene trees) were defined: (ncpGS; NIA;PepC). For the nuclear-plastid BEST, a fourth partition was definedfor all non-suppressed plastid data. For each BEST data set, we usedtwo simultaneous runs with 16 chains of MCMC for 20 million gen-erations with a temperature parameter for chain mixing of 0.35.Based on the ratios of p between our loci (see Section 3.1), weelected to retain the default theta and gene mutation rate priors:thetapr = invgamma (3 and 0.003); genemupr = uniform (0.5 and1.5). The optimum nucleotide substitution model was adoptedfor each locus, and the plastid partition was further defined as hap-loid. Numerous attempts failed to converge despite running up to50 million generations (not shown). We were only able to achieveconvergence toward a single optimum tree in either nuclear or nu-clear-plastid data sets by setting a uniform prior for branch lengths(prset brlenspr = clock:uniform). Convergence was confirmed by atleast two independent analyses. Each gene tree partition was eval-uated as described above for Bayesian gene trees. Species clado-grams were created by using a dummy matrix of the samelength as the original data set, with one sequence per species, tosummarize the species tree files created by BEST.
To test a total-evidence approach, we created a concatenatedmatrix with one record per species (32 ingroup tips) that combinednucleotide sequences for nrDNA (see below), and morphologicalcharacters (see below) with the nucleotide sequences and indel-coding characters for our eight plastid and three nuclear loci, yield-ing 10,694 total characters (Table 2). Our multiple-accession dataset was collapsed by creating one consensus sequence for each spe-cies with variable nucleotide positions re-coded using IUPAC ambi-guity codes. Thus, these species consensus records condensed theheterozygosity observed in low-copy nuclear loci as well as thevariation observed across multiple individuals within each species.Variable indel coding positions were scored as missing data. Then,plastid data for the six species we identified with cytonuclear con-flict (see Section 3.3) was re-coded as missing data as a compro-mise. For parsimony analyses, ambiguity coding was set tovariable (i.e. pset mstaxa = polymorphic in PAUP�). For Bayesiananalyses where a model to account for ambiguity coding is notavailable, we converted variable nucleotide positions to missingdata. We concatenated one nrDNA sequence per species from aprevious published study (Wagner et al., 2005): nucleotide se-quences for ITS (GenBank accessions AY517655–AY517686) andETS (GenBank accessions AY517688–AY517717). The ETS regionfor S. laui was sequenced for this study (GenBank accessionGQ279733), but is missing for S. nuttallii. Outgroup sequences wereavailable for H. peploides (ITS: AY517653 and AY517654; ETS:AY517687), Minuartia spp. (ITS: AY517679 and AY517650), andWilhelmsia physodes (ITS: AY517652). Due to ambiguous align-ment, we followed the submitting authors in excluding ITS posi-tions 1–74 and 356–517 and ETS positions 1–25. We used 61morphological characters described in Appendix 3 of the mono-graph (Wagner et al., 2005). Seven partitions were defined forthe 32-allele matrix as described above for Bayesian analyses(Table 2). We used FigTree vers. 1.2.3 (Rambaut, 2010a) to modifyall of our tree figures. Trees were outgroup rooted and the ‘cartoon’option was used to collapse conspecific alleles. Each graphic filewas exported from FigTree as a Windows Enhanced Metafile.Annotations and branch support graphics were added manually.
2.6. Dating
The plastid (rather than the nuclear) partition was selected toestimate divergence dates for several reasons. First, our plastid tree
provides more resolved nodes than our nuclear gene trees (see Sec-tion 3.2). Second, modeling is simpler with a single partition thatsupports a single topology. Third, longer sequence lengths are animportant factor in estimating ages (Brown and Yang, 2010) andour plastid data set contained many more nucleotides than our nu-clear partition (6793 for eight plastid loci cf. 2424 for three nuclearloci; Table 2). Because reticulate evolution has affected Schiedea,this molecular clock represents how plastid lineages, not necessar-ily species, have diverged over time. Nonetheless, this is a usefulexercise for Schiedea as the plastid lineages can be used to inferthe age of the original colonization and, perhaps, the age of thecrown radiation. As described above, individuals with putativelyintrogressed plastid genomes were excluded, but S. spergulinawas retained in order to estimate the timing of plastid transfer.Ages were estimated using ‘Bayesian evolutionary analysis by sam-pling trees’ (BEAST) vers. 1.5.4 (Drummond and Rambaut, 2007;Heled and Drummond, 2009) with a simple HKY nucleotide substi-tution model, a UPGMA starting tree, a Yule tree prior (assumingconstant speciation rate per lineage), 30 million generations, sav-ing one tree every 1000 generations. Bayes factor comparisons inpreliminary runs supported our selection of the uncorrelated re-laxed lognormal rather than a strict clock model for this data set.Priors for the time to most recent common ancestor (TMRCA) wereprovided for two nodes to represent ages of the islands of Kauaì(4.7 Ma) and Oáhu (3.7 Ma; Clague, 1996). We tested three datesfor the age prior on the root node. First, we set the root at 23 Mato test the possibility that species could have island-hopped tonewly formed islands dating back to the creation of Lisianski(Clague, 1996). We abandoned this calibration (and did notattempt the even older possibility of 30 Ma for the age of Kure)because we could not obtain resolved estimates for substitutionrates among branches. Second, we assigned a prior for the root at7.3 Ma to represent the age of Nihoa (Clague, 1996). This island,while old and eroded, currently supports one Schiedea species(S. verticillata). Third, we set a prior for the root at 4.7 Ma, theage of Kauaì. Runs were repeated with increasing numbers ofgenerations and with parameter adjustments (e.g. window size)suggested by BEAST until the ‘effective sample size’ statistic wasgreater than 200 for each parameter. We used Tracer vers. 1.5(distributed with the BEAST package) to summarize BEAST output,discarding 3 million generations as burn-in. One maximum cladecredibility tree was created for each calibration scenario usingTreeAnnotator vers. 1.5.2 (distributed with the BEAST package)with a 0.5 posterior probability limit, discarding 3000 trees asburn-in.
3. Results
3.1. Data matrices
The eight plastid loci had an aligned length of 6793 nucleotidesand 117 indel codes for a total of 6910 characters, 329 of which areparsimony-informative (PI); the one-allele matrix for ncpGS had845 nucleotides and 23 indel codes for a total of 868 characters(96 PI); NIA had 964 nucleotides and 101 indel codes for a totalof 1065 characters (262 PI); and PepC had 615 nucleotides and25 indel codes for a total of 640 characters (75 PI; Table 2). Thetwo-allele data sets that were used to construct gene trees for nu-clear loci yielded more PI characters than the one-allele matrices(Table 2). We did not detect genetic recombination in any of thetests for the three nuclear loci. We deposited 1284 new sequencesin GenBank as accession numbers GQ223800–GQ225083. The nu-clear BEST data set had 2424 nucleotides (363 PI) for 91-alleles,the total-evidence data set had 10,506 nucleotides, 128 indel-cod-ing characters, and 61 morphological characters for a total of
36 A. Willyard et al. / Molecular Phylogenetics and Evolution 60 (2011) 29–48
10,695 characters (888 PI), while the nuclear-plastid BEST data sethad 9217 nucleotides (624 PI) for 91 accessions (Table 2).
Nucleotide diversity for individual loci ranged from p = 0.00425(SD = 0.00052) in rpS16 to p = 0.03278 (SD = 0.00217) in NIA (Sup-plementary Table S2). The total nucleotide diversity across theeight plastid loci that we combined for a plastid gene tree wasp = 0.00640 (SD = 0.00038). Based on the absence (or at least ex-treme rarity) of genetic recombination in circular plastid genomes,the lack of dramatic rate variation among our eight loci (Supple-mentary Table S2), the limited phylogenetic information in eachplastid locus for these closely related species, and poor resolutionin preliminary comparisons of phylogenies between individualplastid loci (data not shown), we chose to present analyses withthese eight plastid loci concatenated as a single partition.
3.2. Gene trees
Parsimony searches for each of the four individual gene trees hitthe maximum tree limit, returning 100,000 equally parsimonioustrees. For Bayesian analyses, stationarity was generally reachedearly, and we discarded 2000 of 20,000 trees from each run as‘burn-in’ except for the PepC gene tree, where we discarded 4000trees.
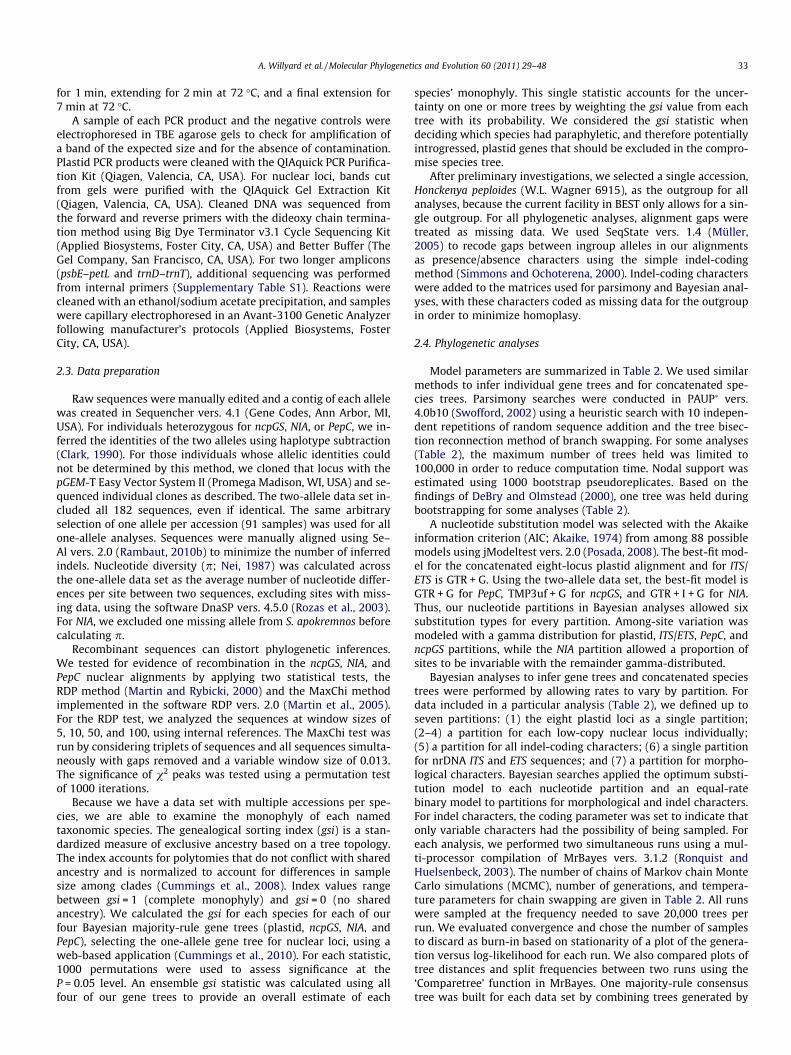
For the plastid lineage, Bayesian and parsimony methods re-solve essentially identical topologies (Fig. 1). Except for S. globosaand S. kauaiensis (see Section 3.3), the 91 accessions sampled inthis study are largely (but not exclusively) resolved on the plastidgene tree into 32 clades that are consistent with species that havebeen recognized using a combination of morphological and nuclearcharacters (Wagner et al., 2005). In contrast, some of the slightlydeeper nodes are poorly resolved on the plastid gene tree. Six ofeight previously described taxonomic groups (see Plate 2 inWagner et al., 2005) are recovered in the plastid gene tree: sectionsAlphaschiedea, Alsinidendron, and Nothoschiedea (Alp, Als, N; Fig. 1)as well as three monotypic sections: Leucocalyx (S. attenuata),Polyneura (S. verticillata) and Anestioschiedea (S. apokremnos).Sections Schiedea and Mononeura, which comprise the bulk of thespecies in the radiation, are polyphyletic on the plastid gene tree(S, MI, MII; Fig. 1).
For each nuclear gene tree, the topology of the parsimony strictconsensus was similar to Bayesian estimates from the same dataset (not shown). We chose to present the two-allele results fromBayesian analyses in order to show the full range of intraspecificvariability (Supplementary Figs. S1–S3). Unlike the plastid genetree, most species do not achieve complete monophyly on thesetrees. Paraphyly is particularly evident on the tips of the shallowestbranches. However, the pattern on the nuclear gene trees,particularly within species assigned to sections Schiedea andMononeura, is largely one of allele sharing among close relatives.Sections Alphaschiedea, Alsinidendron, and Nothoschiedea (andmonotypic sections Polyneura (S. verticillata), and Anestioschiedea(S. apokremnos)) are resolved on each nuclear gene tree; monotypicsection Leucocalyx (S. attenuata) is resolved on NIA and PepC, butnot ncpGS trees. Section Schiedea is recovered on the ncpGS andPepC trees but is paraphyletic on the NIA gene tree. Conversely,section Mononeura is monophyletic in the NIA gene tree, but ispolyphyletic on the other two gene trees. An early-branching clade,consisting of sections Alsinidendron and Nothoschiedea, S. attenuata,and S. verticillata, was recovered on the plastid, ncpGS, and NIAgene trees (‘B’ in Fig. 1, Supplementary Figs. S1 and S2). On thePepC gene tree (Supplementary Fig. S3), the B clade only differsin the placement of S. verticillata as a sister to S. apokremnos andin the placement of these species as sister to section Schiedearather than an early-branching lineage. Previous evidence fromnrDNA and morphology recovered a similar B clade, except for a
reversed branching order between S. attenuata and S. verticillata(Wagner et al., 2005).
3.3. Cytonuclear discordance and identification of introgression events
There are four major conflicts between the plastid (Fig. 1) andnuclear gene trees (Supplementary Figs. S1–S3), plus two potentialconflicts with weak or equivocal support. The first strongly sup-ported case for chloroplast capture is the unequivocal placementon the plastid tree of three S. spergulina accessions (sectionSchiedea) within a clade of Kauaìan endemics belonging to sectionMononeura (MII, Fig. 1). There is strong support for a sister relation-ship between S. spergulina and S. stellarioides plastid lineages. Thisrelationship is dramatically different than the placement ofS. spergulina within section Schiedea based on nuclear gene trees(Supplementary Figs. S1–S3) and in a previous phylogeny (Wagneret al., 2005). Based on the monophyly of S. spergulina on the plastidgene tree, supported by a moderate branch length, we canconclude that historical, rather than recent, introgression is highlylikely (Sang and Zhong, 2000). However, the direction of thetransfer (i.e. from section Schiedea to section Mononeura or viceversa) is equivocal.
The second example of strongly supported introgression isfound in the S. globosa populations on Oáhu. Schiedea globosahas extant populations on Oáhu, Maui, Moloka‘i, and Hawai‘i,was formerly distributed on Lana‘i, and has the widest distribu-tion of any species in the lineage (Wagner et al., 2005). On ourplastid gene tree, three S. globosa individuals from Oáhu resolvestrongly supported as sister to a rare Oáhu endemic, S. adaman-tis, while the other two accessions are strongly supported as clo-ser to all other members of section Schiedea (Fig. 1). On thencpGS gene tree (Supplementary Fig. S1), one of the S. globosaOáhu) accessions is sister to one of the S. adamantis accessions,although without branch support. In the other nuclear gene trees(Supplementary Figs. S2 and S3), all five S. globosa accessions aremonophyletic, and are not part of the clade containingS. adamantis. Based on the topology of the plastid gene tree(Fig. 1), the plastid lineage found in S. globosa accessions fromOáhu appears to be derived from S. adamantis.
The third strongly supported case of plastid introgression in-volves two closely related but morphologically distinct membersof section Schiedea: S. lydgatei and S. sarmentosa. Our plastid genetree resolves a clade containing all six accessions of both species(Fig. 1). One S. sarmentosa allele joins S. lydgatei on the ncpGS genetree, but not on the NIA or PepC gene trees (SupplementaryFigs. S1–S3). With the evidence at hand, the introgression of nucle-ar genes and the direction of the transfer remain ambiguous. Wearbitrarily selected S. lydgatei to suppress plastid information inthe compromise data set.
The fourth strongly supported case of plastid introgression isthe monophyletic lineage shared by all five of our S. hookeri andS. mannii accessions (Fig. 1). Nuclear alleles from these same acces-sions do not cluster (Supplementary Figs. S1–S3), congruent withfindings from a previous phylogeny (Wagner et al., 2005). Thesource populations for two of our S. hookeri collections are sympat-ric with S. mannii (between Wai‘anae and Makaha valleys onOáhu), although the third S. hookeri collection (Kaluakauila gulch)is ca. 2 km from the nearest documented S. mannii populationson ‘Ohikilolo Ridge (Wagner et al., 1995). Our results suggest oneor more historic hybridization events that lead to a single plastidlineage persisting in both species. The lack of resolution on theplastid gene tree does not clarify which parental chloroplastpersisted, so our decision to suppress the plastid sequences for S.mannii was arbitrary.
More obscure evidence for chloroplast introgression was ob-served for S. kauaiensis (section Mononeura), which is paraphyletic
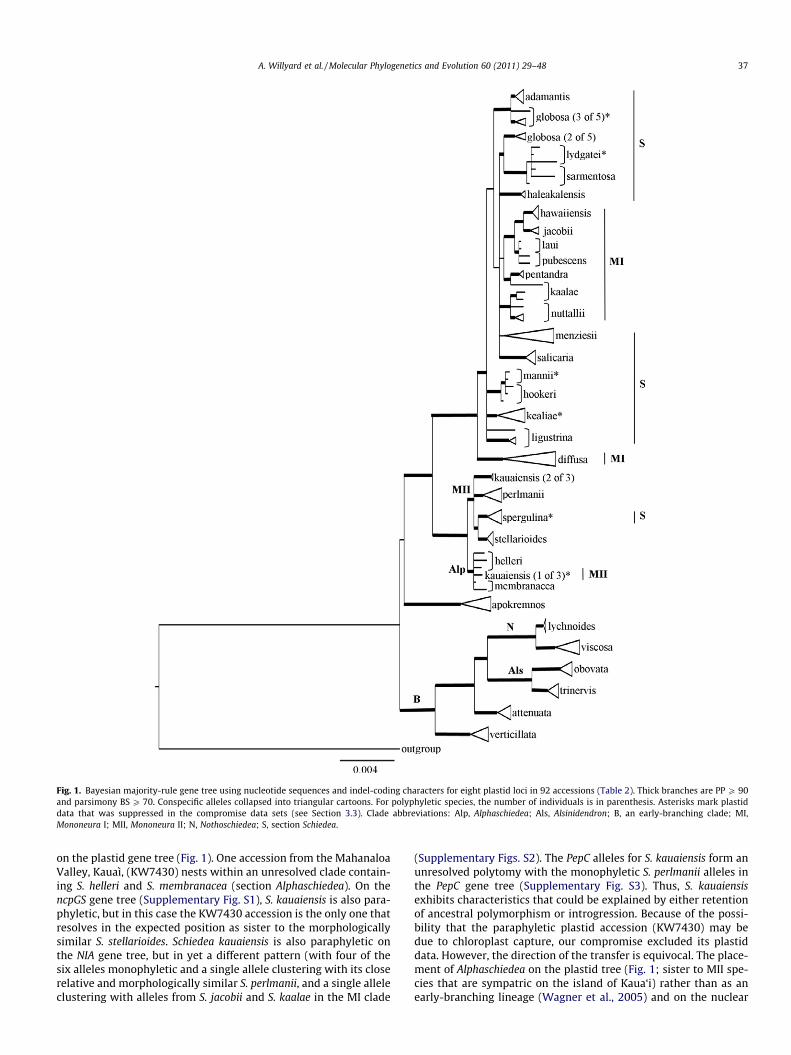
Fig. 1. Bayesian majority-rule gene tree using nucleotide sequences and indel-coding characters for eight plastid loci in 92 accessions (Table 2). Thick branches are PP P 90and parsimony BS P 70. Conspecific alleles collapsed into triangular cartoons. For polyphyletic species, the number of individuals is in parenthesis. Asterisks mark plastiddata that was suppressed in the compromise data sets (see Section 3.3). Clade abbreviations: Alp, Alphaschiedea; Als, Alsinidendron; B, an early-branching clade; MI,Mononeura I; MII, Mononeura II; N, Nothoschiedea; S, section Schiedea.
A. Willyard et al. / Molecular Phylogenetics and Evolution 60 (2011) 29–48 37
on the plastid gene tree (Fig. 1). One accession from the MahanaloaValley, Kauaì, (KW7430) nests within an unresolved clade contain-ing S. helleri and S. membranacea (section Alphaschiedea). On thencpGS gene tree (Supplementary Fig. S1), S. kauaiensis is also para-phyletic, but in this case the KW7430 accession is the only one thatresolves in the expected position as sister to the morphologicallysimilar S. stellarioides. Schiedea kauaiensis is also paraphyletic onthe NIA gene tree, but in yet a different pattern (with four of thesix alleles monophyletic and a single allele clustering with its closerelative and morphologically similar S. perlmanii, and a single alleleclustering with alleles from S. jacobii and S. kaalae in the MI clade
(Supplementary Figs. S2). The PepC alleles for S. kauaiensis form anunresolved polytomy with the monophyletic S. perlmanii alleles inthe PepC gene tree (Supplementary Fig. S3). Thus, S. kauaiensisexhibits characteristics that could be explained by either retentionof ancestral polymorphism or introgression. Because of the possi-bility that the paraphyletic plastid accession (KW7430) may bedue to chloroplast capture, our compromise excluded its plastiddata. However, the direction of the transfer is equivocal. The place-ment of Alphaschiedea on the plastid tree (Fig. 1; sister to MII spe-cies that are sympatric on the island of Kaua‘i) rather than as anearly-branching lineage (Wagner et al., 2005) and on the nuclear
38 A. Willyard et al. / Molecular Phylogenetics and Evolution 60 (2011) 29–48
BEST tree (see Section 3.4) suggests that S. helleri and S. membran-acea, the only two extant species of Alphaschiedea, may have ac-quired a chloroplast lineage from the younger Mononeura group.
Although a previous study (Soltis et al., 1996) reported poten-tial chloroplast transfer between S. ligustrina and S. kealiae, weobserved only weak evidence for introgression. On our plastidgene tree, (Fig. 1), there is very weak support for their siblingstatus (BS < 50; PP = 55; depicted as unresolved in Fig. 1). Thethree accessions of S. kealiae are not polyphyletic on the PepCgene tree (Supplementary Fig. S3), but no sister relationship withS. ligustrina is supported. Schiedea kealiae alleles are unresolvedon the ncpGS and NIA gene trees (Supplementary Figs. S1 andS2). Because our results are not inconsistent with evidence forplastid introgression (Soltis et al., 1996), we chose to excludethe plastid information for S. kealiae in our compromise data set.
Based on these cytonuclear conflicts, we re-coded the plastidpartition as missing data in the compromise data set for the follow-ing accessions: (i) all accessions of S. spergulina; (ii) all accessionsof S. mannii; (iii) all accessions of S. lydgatei; (iv) three S. globosa
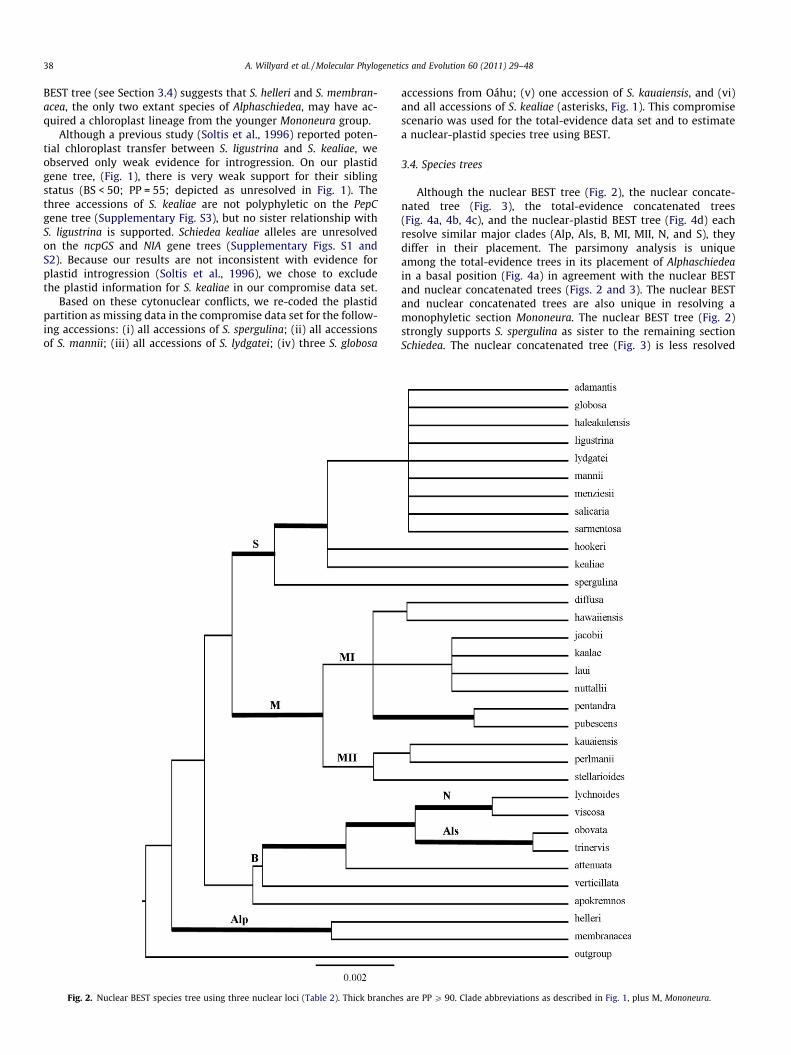
Fig. 2. Nuclear BEST species tree using three nuclear loci (Table 2). Thick branche
accessions from Oáhu; (v) one accession of S. kauaiensis, and (vi)and all accessions of S. kealiae (asterisks, Fig. 1). This compromisescenario was used for the total-evidence data set and to estimatea nuclear-plastid species tree using BEST.
3.4. Species trees
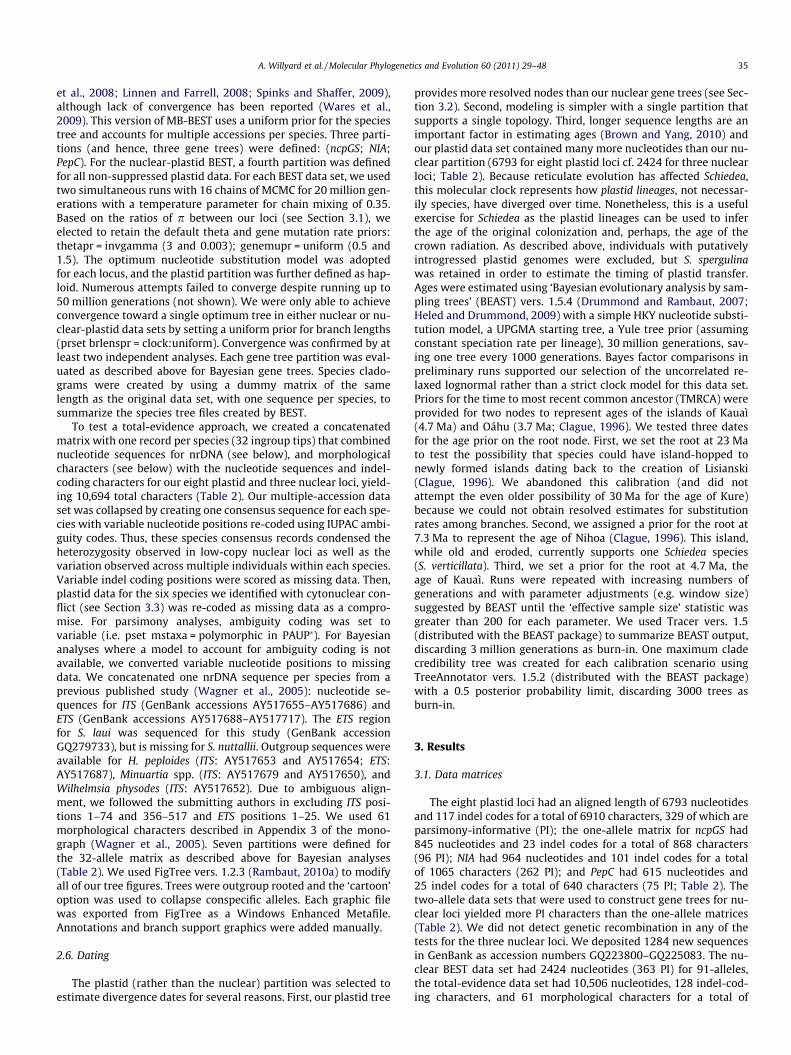
Although the nuclear BEST tree (Fig. 2), the nuclear concate-nated tree (Fig. 3), the total-evidence concatenated trees(Fig. 4a, 4b, 4c), and the nuclear-plastid BEST tree (Fig. 4d) eachresolve similar major clades (Alp, Als, B, MI, MII, N, and S), theydiffer in their placement. The parsimony analysis is uniqueamong the total-evidence trees in its placement of Alphaschiedeain a basal position (Fig. 4a) in agreement with the nuclear BESTand nuclear concatenated trees (Figs. 2 and 3). The nuclear BESTand nuclear concatenated trees are also unique in resolving amonophyletic section Mononeura. The nuclear BEST tree (Fig. 2)strongly supports S. spergulina as sister to the remaining sectionSchiedea. The nuclear concatenated tree (Fig. 3) is less resolved
s are PP P 90. Clade abbreviations as described in Fig. 1, plus M, Mononeura.
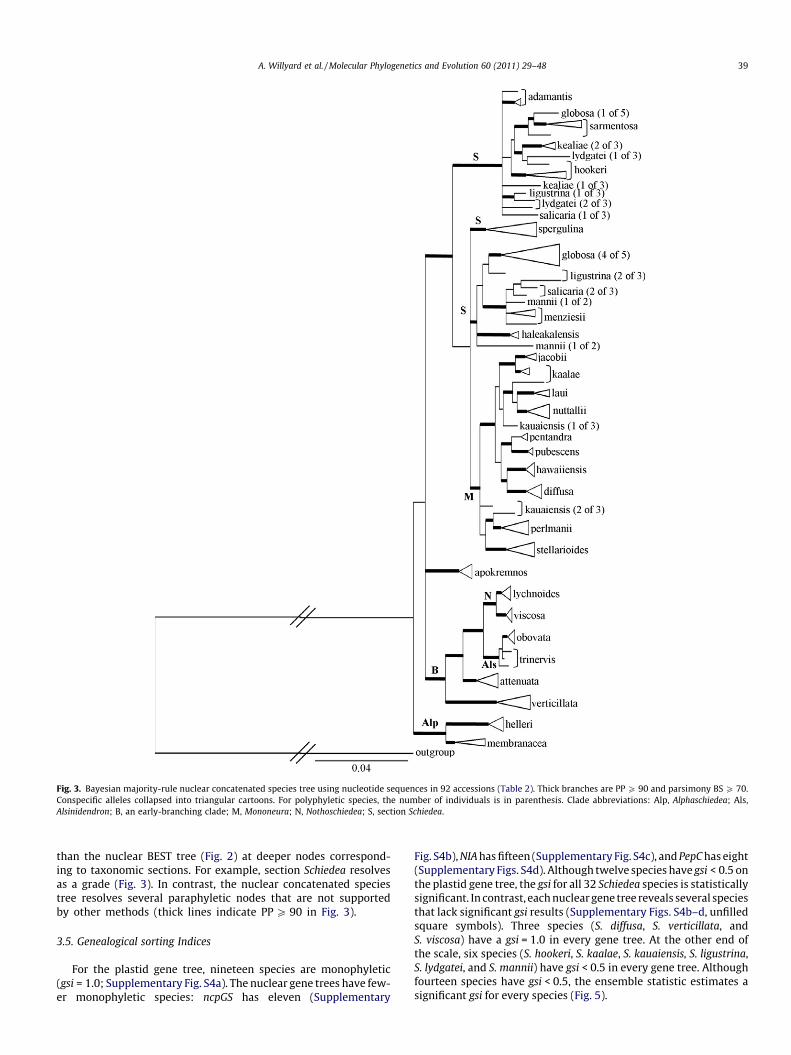
Fig. 3. Bayesian majority-rule nuclear concatenated species tree using nucleotide sequences in 92 accessions (Table 2). Thick branches are PP P 90 and parsimony BS P 70.Conspecific alleles collapsed into triangular cartoons. For polyphyletic species, the number of individuals is in parenthesis. Clade abbreviations: Alp, Alphaschiedea; Als,Alsinidendron; B, an early-branching clade; M, Mononeura; N, Nothoschiedea; S, section Schiedea.
A. Willyard et al. / Molecular Phylogenetics and Evolution 60 (2011) 29–48 39
than the nuclear BEST tree (Fig. 2) at deeper nodes correspond-ing to taxonomic sections. For example, section Schiedea resolvesas a grade (Fig. 3). In contrast, the nuclear concatenated speciestree resolves several paraphyletic nodes that are not supportedby other methods (thick lines indicate PP P 90 in Fig. 3).
3.5. Genealogical sorting Indices
For the plastid gene tree, nineteen species are monophyletic(gsi = 1.0; Supplementary Fig. S4a). The nuclear gene trees have few-er monophyletic species: ncpGS has eleven (Supplementary
Fig. S4b), NIA has fifteen (Supplementary Fig. S4c), and PepC has eight(Supplementary Figs. S4d). Although twelve species have gsi < 0.5 onthe plastid gene tree, the gsi for all 32 Schiedea species is statisticallysignificant. In contrast, each nuclear gene tree reveals several speciesthat lack significant gsi results (Supplementary Figs. S4b–d, unfilledsquare symbols). Three species (S. diffusa, S. verticillata, andS. viscosa) have a gsi = 1.0 in every gene tree. At the other end ofthe scale, six species (S. hookeri, S. kaalae, S. kauaiensis, S. ligustrina,S. lydgatei, and S. mannii) have gsi < 0.5 in every gene tree. Althoughfourteen species have gsi < 0.5, the ensemble statistic estimates asignificant gsi for every species (Fig. 5).
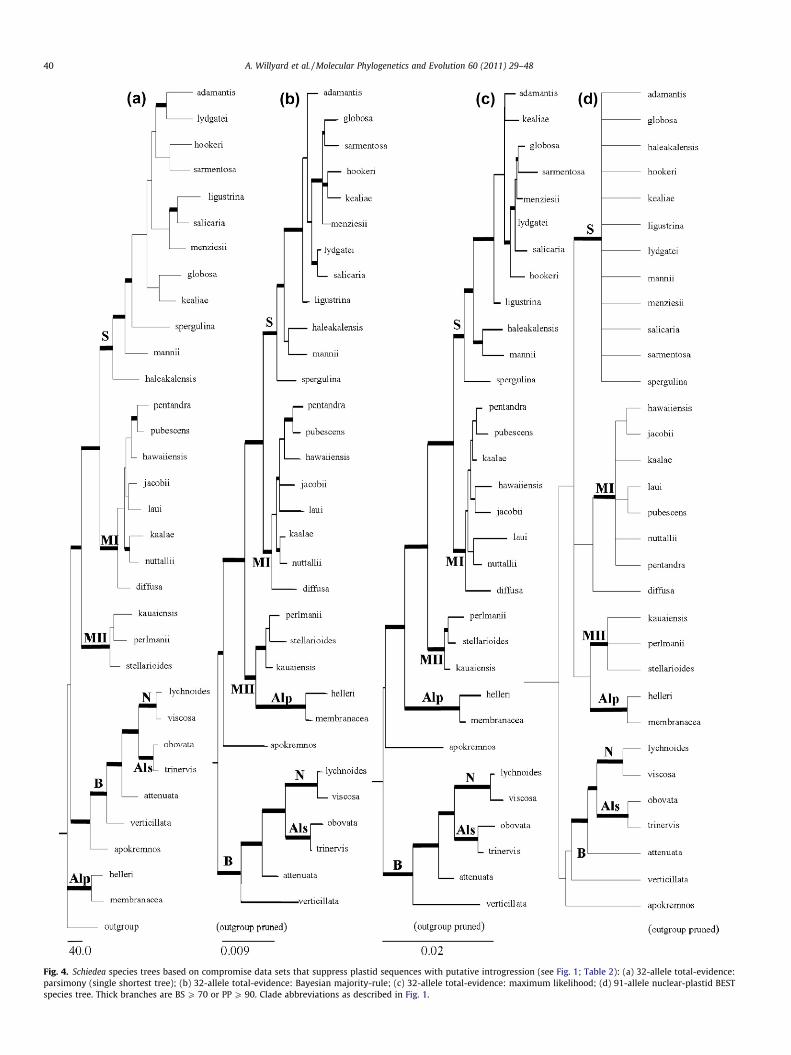
Fig. 4. Schiedea species trees based on compromise data sets that suppress plastid sequences with putative introgression (see Fig. 1; Table 2): (a) 32-allele total-evidence:parsimony (single shortest tree); (b) 32-allele total-evidence: Bayesian majority-rule; (c) 32-allele total-evidence: maximum likelihood; (d) 91-allele nuclear-plastid BESTspecies tree. Thick branches are BS P 70 or PP P 90. Clade abbreviations as described in Fig. 1.
40 A. Willyard et al. / Molecular Phylogenetics and Evolution 60 (2011) 29–48
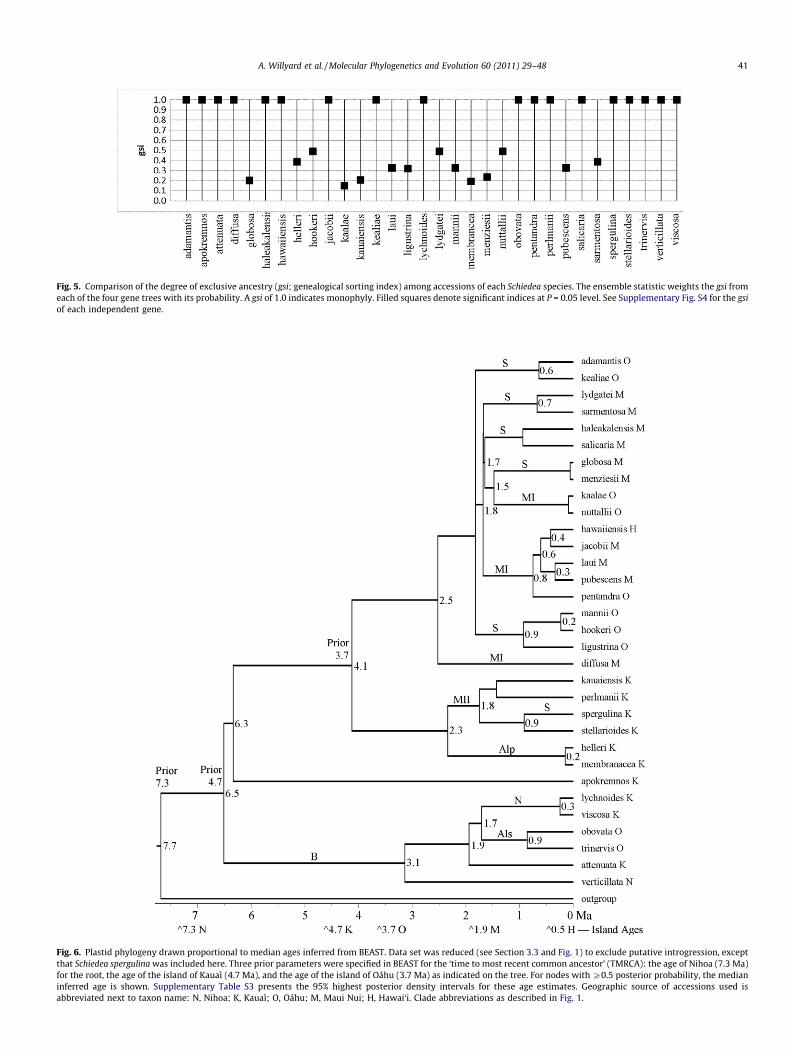
Fig. 5. Comparison of the degree of exclusive ancestry (gsi; genealogical sorting index) among accessions of each Schiedea species. The ensemble statistic weights the gsi fromeach of the four gene trees with its probability. A gsi of 1.0 indicates monophyly. Filled squares denote significant indices at P = 0.05 level. See Supplementary Fig. S4 for the gsiof each independent gene.
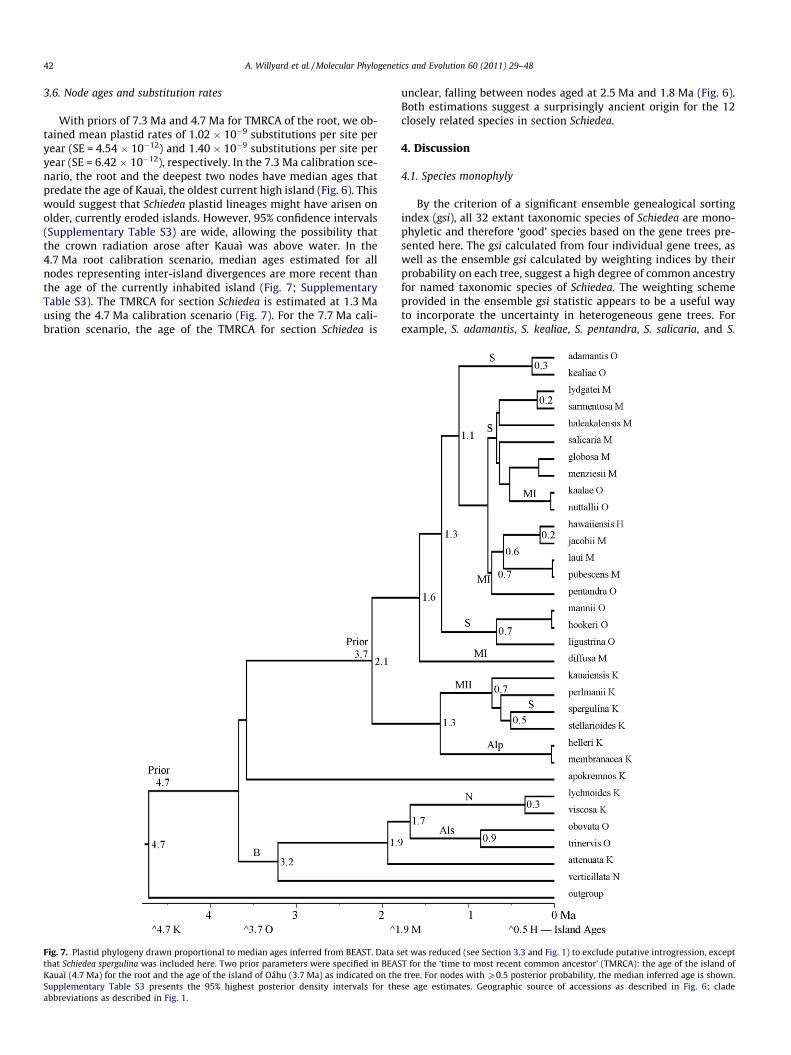
Fig. 6. Plastid phylogeny drawn proportional to median ages inferred from BEAST. Data set was reduced (see Section 3.3 and Fig. 1) to exclude putative introgression, exceptthat Schiedea spergulina was included here. Three prior parameters were specified in BEAST for the ‘time to most recent common ancestor’ (TMRCA): the age of Nihoa (7.3 Ma)for the root, the age of the island of Kauaì (4.7 Ma), and the age of the island of Oáhu (3.7 Ma) as indicated on the tree. For nodes with P0.5 posterior probability, the medianinferred age is shown. Supplementary Table S3 presents the 95% highest posterior density intervals for these age estimates. Geographic source of accessions used isabbreviated next to taxon name: N, Nihoa; K, Kauaì; O, Oáhu; M, Maui Nui; H, Hawai‘i. Clade abbreviations as described in Fig. 1.
A. Willyard et al. / Molecular Phylogenetics and Evolution 60 (2011) 29–48 41
42 A. Willyard et al. / Molecular Phylogenetics and Evolution 60 (2011) 29–48
3.6. Node ages and substitution rates
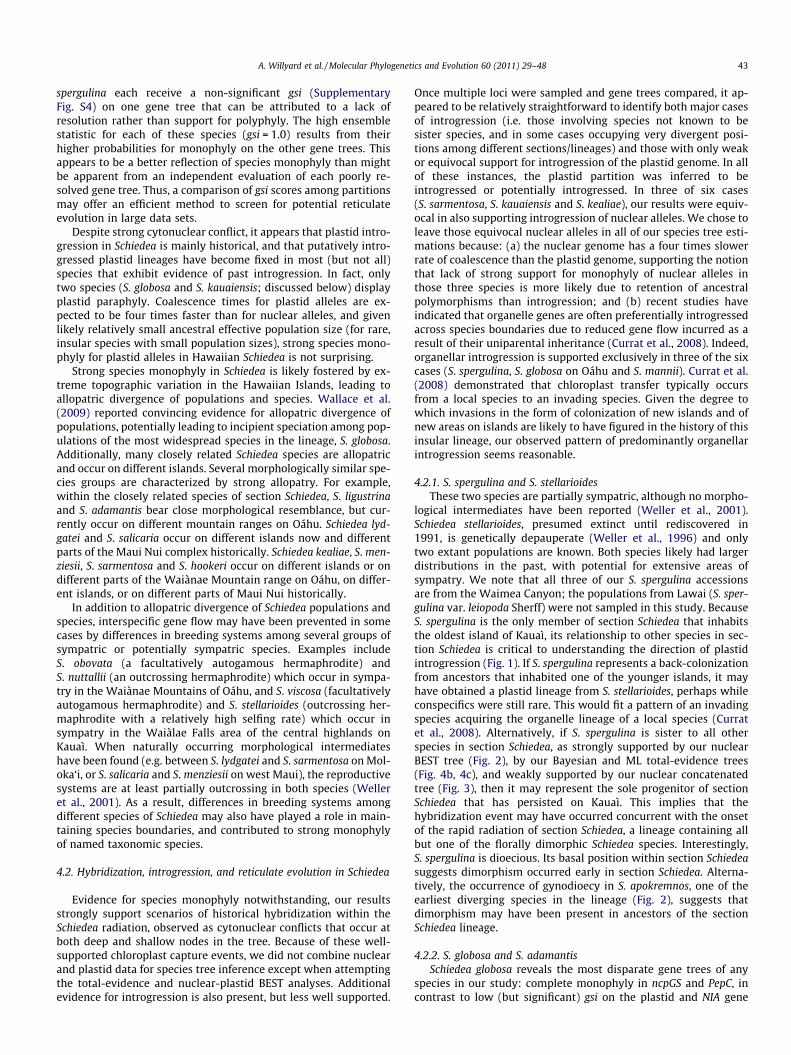
With priors of 7.3 Ma and 4.7 Ma for TMRCA of the root, we ob-tained mean plastid rates of 1.02 � 10�9 substitutions per site peryear (SE = 4.54 � 10�12) and 1.40 � 10�9 substitutions per site peryear (SE = 6.42 � 10�12), respectively. In the 7.3 Ma calibration sce-nario, the root and the deepest two nodes have median ages thatpredate the age of Kauaì, the oldest current high island (Fig. 6). Thiswould suggest that Schiedea plastid lineages might have arisen onolder, currently eroded islands. However, 95% confidence intervals(Supplementary Table S3) are wide, allowing the possibility thatthe crown radiation arose after Kauaì was above water. In the4.7 Ma root calibration scenario, median ages estimated for allnodes representing inter-island divergences are more recent thanthe age of the currently inhabited island (Fig. 7; SupplementaryTable S3). The TMRCA for section Schiedea is estimated at 1.3 Mausing the 4.7 Ma calibration scenario (Fig. 7). For the 7.7 Ma cali-bration scenario, the age of the TMRCA for section Schiedea is
Fig. 7. Plastid phylogeny drawn proportional to median ages inferred from BEAST. Data sthat Schiedea spergulina was included here. Two prior parameters were specified in BEASKauaì (4.7 Ma) for the root and the age of the island of Oáhu (3.7 Ma) as indicated on theSupplementary Table S3 presents the 95% highest posterior density intervals for theabbreviations as described in Fig. 1.
unclear, falling between nodes aged at 2.5 Ma and 1.8 Ma (Fig. 6).Both estimations suggest a surprisingly ancient origin for the 12closely related species in section Schiedea.
4. Discussion
4.1. Species monophyly
By the criterion of a significant ensemble genealogical sortingindex (gsi), all 32 extant taxonomic species of Schiedea are mono-phyletic and therefore ‘good’ species based on the gene trees pre-sented here. The gsi calculated from four individual gene trees, aswell as the ensemble gsi calculated by weighting indices by theirprobability on each tree, suggest a high degree of common ancestryfor named taxonomic species of Schiedea. The weighting schemeprovided in the ensemble gsi statistic appears to be a useful wayto incorporate the uncertainty in heterogeneous gene trees. Forexample, S. adamantis, S. kealiae, S. pentandra, S. salicaria, and S.
et was reduced (see Section 3.3 and Fig. 1) to exclude putative introgression, exceptT for the ‘time to most recent common ancestor’ (TMRCA): the age of the island oftree. For nodes with P0.5 posterior probability, the median inferred age is shown.
se age estimates. Geographic source of accessions as described in Fig. 6; clade
A. Willyard et al. / Molecular Phylogenetics and Evolution 60 (2011) 29–48 43
spergulina each receive a non-significant gsi (SupplementaryFig. S4) on one gene tree that can be attributed to a lack ofresolution rather than support for polyphyly. The high ensemblestatistic for each of these species (gsi = 1.0) results from theirhigher probabilities for monophyly on the other gene trees. Thisappears to be a better reflection of species monophyly than mightbe apparent from an independent evaluation of each poorly re-solved gene tree. Thus, a comparison of gsi scores among partitionsmay offer an efficient method to screen for potential reticulateevolution in large data sets.
Despite strong cytonuclear conflict, it appears that plastid intro-gression in Schiedea is mainly historical, and that putatively intro-gressed plastid lineages have become fixed in most (but not all)species that exhibit evidence of past introgression. In fact, onlytwo species (S. globosa and S. kauaiensis; discussed below) displayplastid paraphyly. Coalescence times for plastid alleles are ex-pected to be four times faster than for nuclear alleles, and givenlikely relatively small ancestral effective population size (for rare,insular species with small population sizes), strong species mono-phyly for plastid alleles in Hawaiian Schiedea is not surprising.
Strong species monophyly in Schiedea is likely fostered by ex-treme topographic variation in the Hawaiian Islands, leading toallopatric divergence of populations and species. Wallace et al.(2009) reported convincing evidence for allopatric divergence ofpopulations, potentially leading to incipient speciation among pop-ulations of the most widespread species in the lineage, S. globosa.Additionally, many closely related Schiedea species are allopatricand occur on different islands. Several morphologically similar spe-cies groups are characterized by strong allopatry. For example,within the closely related species of section Schiedea, S. ligustrinaand S. adamantis bear close morphological resemblance, but cur-rently occur on different mountain ranges on Oáhu. Schiedea lyd-gatei and S. salicaria occur on different islands now and differentparts of the Maui Nui complex historically. Schiedea kealiae, S. men-ziesii, S. sarmentosa and S. hookeri occur on different islands or ondifferent parts of the Waiànae Mountain range on Oáhu, on differ-ent islands, or on different parts of Maui Nui historically.
In addition to allopatric divergence of Schiedea populations andspecies, interspecific gene flow may have been prevented in somecases by differences in breeding systems among several groups ofsympatric or potentially sympatric species. Examples includeS. obovata (a facultatively autogamous hermaphrodite) andS. nuttallii (an outcrossing hermaphrodite) which occur in sympa-try in the Waiànae Mountains of Oáhu, and S. viscosa (facultativelyautogamous hermaphrodite) and S. stellarioides (outcrossing her-maphrodite with a relatively high selfing rate) which occur insympatry in the Waiàlae Falls area of the central highlands onKauaì. When naturally occurring morphological intermediateshave been found (e.g. between S. lydgatei and S. sarmentosa on Mol-oka‘i, or S. salicaria and S. menziesii on west Maui), the reproductivesystems are at least partially outcrossing in both species (Welleret al., 2001). As a result, differences in breeding systems amongdifferent species of Schiedea may also have played a role in main-taining species boundaries, and contributed to strong monophylyof named taxonomic species.
4.2. Hybridization, introgression, and reticulate evolution in Schiedea
Evidence for species monophyly notwithstanding, our resultsstrongly support scenarios of historical hybridization within theSchiedea radiation, observed as cytonuclear conflicts that occur atboth deep and shallow nodes in the tree. Because of these well-supported chloroplast capture events, we did not combine nuclearand plastid data for species tree inference except when attemptingthe total-evidence and nuclear-plastid BEST analyses. Additionalevidence for introgression is also present, but less well supported.
Once multiple loci were sampled and gene trees compared, it ap-peared to be relatively straightforward to identify both major casesof introgression (i.e. those involving species not known to besister species, and in some cases occupying very divergent posi-tions among different sections/lineages) and those with only weakor equivocal support for introgression of the plastid genome. In allof these instances, the plastid partition was inferred to beintrogressed or potentially introgressed. In three of six cases(S. sarmentosa, S. kauaiensis and S. kealiae), our results were equiv-ocal in also supporting introgression of nuclear alleles. We chose toleave those equivocal nuclear alleles in all of our species tree esti-mations because: (a) the nuclear genome has a four times slowerrate of coalescence than the plastid genome, supporting the notionthat lack of strong support for monophyly of nuclear alleles inthose three species is more likely due to retention of ancestralpolymorphisms than introgression; and (b) recent studies haveindicated that organelle genes are often preferentially introgressedacross species boundaries due to reduced gene flow incurred as aresult of their uniparental inheritance (Currat et al., 2008). Indeed,organellar introgression is supported exclusively in three of the sixcases (S. spergulina, S. globosa on Oáhu and S. mannii). Currat et al.(2008) demonstrated that chloroplast transfer typically occursfrom a local species to an invading species. Given the degree towhich invasions in the form of colonization of new islands and ofnew areas on islands are likely to have figured in the history of thisinsular lineage, our observed pattern of predominantly organellarintrogression seems reasonable.
4.2.1. S. spergulina and S. stellarioidesThese two species are partially sympatric, although no morpho-
logical intermediates have been reported (Weller et al., 2001).Schiedea stellarioides, presumed extinct until rediscovered in1991, is genetically depauperate (Weller et al., 1996) and onlytwo extant populations are known. Both species likely had largerdistributions in the past, with potential for extensive areas ofsympatry. We note that all three of our S. spergulina accessionsare from the Waimea Canyon; the populations from Lawai (S. sper-gulina var. leiopoda Sherff) were not sampled in this study. BecauseS. spergulina is the only member of section Schiedea that inhabitsthe oldest island of Kauaì, its relationship to other species in sec-tion Schiedea is critical to understanding the direction of plastidintrogression (Fig. 1). If S. spergulina represents a back-colonizationfrom ancestors that inhabited one of the younger islands, it mayhave obtained a plastid lineage from S. stellarioides, perhaps whileconspecifics were still rare. This would fit a pattern of an invadingspecies acquiring the organelle lineage of a local species (Curratet al., 2008). Alternatively, if S. spergulina is sister to all otherspecies in section Schiedea, as strongly supported by our nuclearBEST tree (Fig. 2), by our Bayesian and ML total-evidence trees(Fig. 4b, 4c), and weakly supported by our nuclear concatenatedtree (Fig. 3), then it may represent the sole progenitor of sectionSchiedea that has persisted on Kauaì. This implies that thehybridization event may have occurred concurrent with the onsetof the rapid radiation of section Schiedea, a lineage containing allbut one of the florally dimorphic Schiedea species. Interestingly,S. spergulina is dioecious. Its basal position within section Schiedeasuggests dimorphism occurred early in section Schiedea. Alterna-tively, the occurrence of gynodioecy in S. apokremnos, one of theearliest diverging species in the lineage (Fig. 2), suggests thatdimorphism may have been present in ancestors of the sectionSchiedea lineage.
4.2.2. S. globosa and S. adamantisSchiedea globosa reveals the most disparate gene trees of any
species in our study: complete monophyly in ncpGS and PepC, incontrast to low (but significant) gsi on the plastid and NIA gene
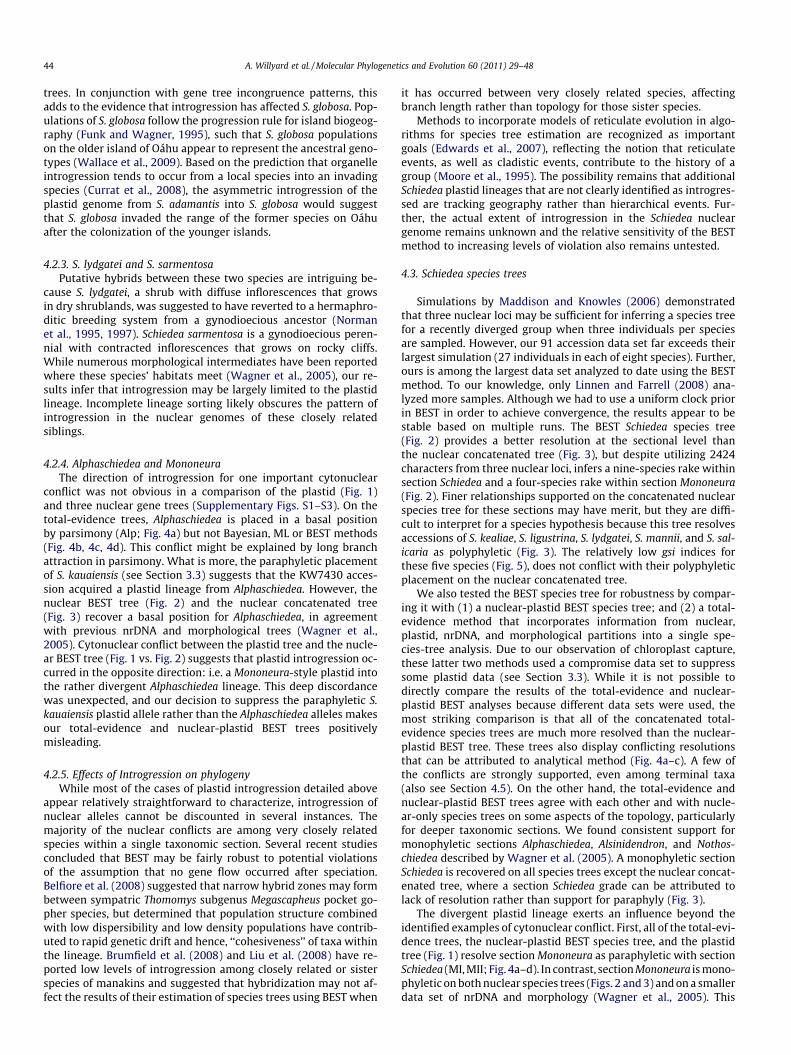
44 A. Willyard et al. / Molecular Phylogenetics and Evolution 60 (2011) 29–48
trees. In conjunction with gene tree incongruence patterns, thisadds to the evidence that introgression has affected S. globosa. Pop-ulations of S. globosa follow the progression rule for island biogeog-raphy (Funk and Wagner, 1995), such that S. globosa populationson the older island of Oáhu appear to represent the ancestral geno-types (Wallace et al., 2009). Based on the prediction that organelleintrogression tends to occur from a local species into an invadingspecies (Currat et al., 2008), the asymmetric introgression of theplastid genome from S. adamantis into S. globosa would suggestthat S. globosa invaded the range of the former species on Oáhuafter the colonization of the younger islands.
4.2.3. S. lydgatei and S. sarmentosaPutative hybrids between these two species are intriguing be-
cause S. lydgatei, a shrub with diffuse inflorescences that growsin dry shrublands, was suggested to have reverted to a hermaphro-ditic breeding system from a gynodioecious ancestor (Normanet al., 1995, 1997). Schiedea sarmentosa is a gynodioecious peren-nial with contracted inflorescences that grows on rocky cliffs.While numerous morphological intermediates have been reportedwhere these species’ habitats meet (Wagner et al., 2005), our re-sults infer that introgression may be largely limited to the plastidlineage. Incomplete lineage sorting likely obscures the pattern ofintrogression in the nuclear genomes of these closely relatedsiblings.
4.2.4. Alphaschiedea and MononeuraThe direction of introgression for one important cytonuclear
conflict was not obvious in a comparison of the plastid (Fig. 1)and three nuclear gene trees (Supplementary Figs. S1–S3). On thetotal-evidence trees, Alphaschiedea is placed in a basal positionby parsimony (Alp; Fig. 4a) but not Bayesian, ML or BEST methods(Fig. 4b, 4c, 4d). This conflict might be explained by long branchattraction in parsimony. What is more, the paraphyletic placementof S. kauaiensis (see Section 3.3) suggests that the KW7430 acces-sion acquired a plastid lineage from Alphaschiedea. However, thenuclear BEST tree (Fig. 2) and the nuclear concatenated tree(Fig. 3) recover a basal position for Alphaschiedea, in agreementwith previous nrDNA and morphological trees (Wagner et al.,2005). Cytonuclear conflict between the plastid tree and the nucle-ar BEST tree (Fig. 1 vs. Fig. 2) suggests that plastid introgression oc-curred in the opposite direction: i.e. a Mononeura-style plastid intothe rather divergent Alphaschiedea lineage. This deep discordancewas unexpected, and our decision to suppress the paraphyletic S.kauaiensis plastid allele rather than the Alphaschiedea alleles makesour total-evidence and nuclear-plastid BEST trees positivelymisleading.
4.2.5. Effects of Introgression on phylogenyWhile most of the cases of plastid introgression detailed above
appear relatively straightforward to characterize, introgression ofnuclear alleles cannot be discounted in several instances. Themajority of the nuclear conflicts are among very closely relatedspecies within a single taxonomic section. Several recent studiesconcluded that BEST may be fairly robust to potential violationsof the assumption that no gene flow occurred after speciation.Belfiore et al. (2008) suggested that narrow hybrid zones may formbetween sympatric Thomomys subgenus Megascapheus pocket go-pher species, but determined that population structure combinedwith low dispersibility and low density populations have contrib-uted to rapid genetic drift and hence, ‘‘cohesiveness’’ of taxa withinthe lineage. Brumfield et al. (2008) and Liu et al. (2008) have re-ported low levels of introgression among closely related or sisterspecies of manakins and suggested that hybridization may not af-fect the results of their estimation of species trees using BEST when
it has occurred between very closely related species, affectingbranch length rather than topology for those sister species.
Methods to incorporate models of reticulate evolution in algo-rithms for species tree estimation are recognized as importantgoals (Edwards et al., 2007), reflecting the notion that reticulateevents, as well as cladistic events, contribute to the history of agroup (Moore et al., 1995). The possibility remains that additionalSchiedea plastid lineages that are not clearly identified as introgres-sed are tracking geography rather than hierarchical events. Fur-ther, the actual extent of introgression in the Schiedea nucleargenome remains unknown and the relative sensitivity of the BESTmethod to increasing levels of violation also remains untested.
4.3. Schiedea species trees
Simulations by Maddison and Knowles (2006) demonstratedthat three nuclear loci may be sufficient for inferring a species treefor a recently diverged group when three individuals per speciesare sampled. However, our 91 accession data set far exceeds theirlargest simulation (27 individuals in each of eight species). Further,ours is among the largest data set analyzed to date using the BESTmethod. To our knowledge, only Linnen and Farrell (2008) ana-lyzed more samples. Although we had to use a uniform clock priorin BEST in order to achieve convergence, the results appear to bestable based on multiple runs. The BEST Schiedea species tree(Fig. 2) provides a better resolution at the sectional level thanthe nuclear concatenated tree (Fig. 3), but despite utilizing 2424characters from three nuclear loci, infers a nine-species rake withinsection Schiedea and a four-species rake within section Mononeura(Fig. 2). Finer relationships supported on the concatenated nuclearspecies tree for these sections may have merit, but they are diffi-cult to interpret for a species hypothesis because this tree resolvesaccessions of S. kealiae, S. ligustrina, S. lydgatei, S. mannii, and S. sal-icaria as polyphyletic (Fig. 3). The relatively low gsi indices forthese five species (Fig. 5), does not conflict with their polyphyleticplacement on the nuclear concatenated tree.
We also tested the BEST species tree for robustness by compar-ing it with (1) a nuclear-plastid BEST species tree; and (2) a total-evidence method that incorporates information from nuclear,plastid, nrDNA, and morphological partitions into a single spe-cies-tree analysis. Due to our observation of chloroplast capture,these latter two methods used a compromise data set to suppresssome plastid data (see Section 3.3). While it is not possible todirectly compare the results of the total-evidence and nuclear-plastid BEST analyses because different data sets were used, themost striking comparison is that all of the concatenated total-evidence species trees are much more resolved than the nuclear-plastid BEST tree. These trees also display conflicting resolutionsthat can be attributed to analytical method (Fig. 4a–c). A few ofthe conflicts are strongly supported, even among terminal taxa(also see Section 4.5). On the other hand, the total-evidence andnuclear-plastid BEST trees agree with each other and with nucle-ar-only species trees on some aspects of the topology, particularlyfor deeper taxonomic sections. We found consistent support formonophyletic sections Alphaschiedea, Alsinidendron, and Nothos-chiedea described by Wagner et al. (2005). A monophyletic sectionSchiedea is recovered on all species trees except the nuclear concat-enated tree, where a section Schiedea grade can be attributed tolack of resolution rather than support for paraphyly (Fig. 3).
The divergent plastid lineage exerts an influence beyond theidentified examples of cytonuclear conflict. First, all of the total-evi-dence trees, the nuclear-plastid BEST species tree, and the plastidtree (Fig. 1) resolve section Mononeura as paraphyletic with sectionSchiedea (MI, MII; Fig. 4a–d). In contrast, section Mononeura is mono-phyletic on both nuclear species trees (Figs. 2 and 3) and on a smallerdata set of nrDNA and morphology (Wagner et al., 2005). This
A. Willyard et al. / Molecular Phylogenetics and Evolution 60 (2011) 29–48 45
suggests a historical chloroplast transfer of the plastid lineages be-tween sections Schiedea and Mononeura that is creating this para-phyletic resolution in every data set where plastid nucleotides arepresent. Similarly, both nuclear species trees reveal a basal resolu-tion of Alphaschiedea (Figs. 2 and 3), even though NIA (Supplemen-tary Fig. S2) is the only gene tree with this topology. Thisplacement for Alphaschiedea agrees with previous reports (Wagneret al., 2005). For the total-evidence species trees, only parsimony(Fig. 4a) recovers this placement. Notably, our plastid tree resolvesAlphaschiedea sister to the MII clade (Fig. 1). The simplest explana-tion for these results is that one of our compromise assumptions(that the plastid lineage from Alphaschiedea had been transferredto S. kauaiensis) is incorrect. Despite ambiguous placement ofAlphaschiedea on individual nuclear gene trees (SupplementaryFigs. S1–S3), the nuclear species trees (Figs. 2 and 3) clearly resolvethe lineage as expected from nrDNA and morphology. Therefore, theplacement of Alphaschiedea in our compromise scenarios appears tobe driven by its plastid lineage. Further, both nuclear species trees(Figs. 2 and 3) resolve S. diffusa and S. hawaiiensis as sister taxa.The resolution of S. diffusa as sister to remaining Mononeura on thetotal-evidence and nuclear-plastid BEST trees (Figs. 4a–d) alsoappears to be driven by the topology of the plastid lineage (Fig. 1).
Schiedea apokremnos (monotypic section Anestioschiedea) is re-solved as sister to the B clade in the nuclear BEST, total-evidenceparsimony, and nuclear-plastid BEST species trees (Figs. 2 and 4aand d). The plastid tree (Fig. 1) places S. apokremnos sister to mem-bers of sections Schiedea and Mononeura, resembling a previousnrDNA and morphology tree (Wagner et al., 2005). Schiedeaapokremnos is known only from valleys and ridges of the NapaliCoast on northwestern Kauaì, the oldest part of the oldest currenthigh island in the chain. In this case, our improved nuclear data setclearly places this species among the basal lineages of the radia-tion, consistent with its geographical location.
Within section Schiedea, the nuclear BEST tree (Fig. 2) supportsS. spergulina, then S. hookeri and S. kealiae, as sister to the remain-ing members of the section. This is not in conflict with the poorerresolution for this node on the concatenated nuclear species tree(Fig. 3). This position clarifies the direction of introgression thatwe can infer from cytonuclear conflict. The basal position of S. sper-gulina within section Schiedea suggests that it represents the solesurviving species on the older island of Kauaì, with the remainderof the radiation occurring as part of a migration onto the youngerislands of Oáhu and Maui Nui.
Hard polytomies for remaining species in section Schiedea onboth the nuclear BEST (Fig. 2) and the nuclear-plastid BEST(Fig. 4d) species trees, several paraphyletic species on the concat-enated nuclear species tree (Fig. 3), conflicting resolution for thesespecies based on methodology for the total-evidence species trees(Fig. 4a vs. Fig. 4b vs. Fig. 4c), taken together with weak resolutionbased on nrDNA and morphology (Wagner et al., 2005), suggeststhat their biologically realistic topology is very close to a hard poly-tomy. While the plastid lineage is more clearly resolved, it appearsto be partly tracking geography rather than species lineages(Fig. 6). We emphasize that plastid conflict is located deep in thetree (Alphaschiedea), at the tips (e.g. S. globosa on Oáhu), and inintermediate positions (e.g. S. diffusa), requiring great caution inthe interpretation of the chloroplast lineage. This finding is of greatimportance, as whole-plastome sequencing techniques currentlybeing applied to other species, e.g. (Parks et al., 2009), will be allur-ing for their potential to resolve polytomies in groups such asSchiedea.
4.4. Original colonization and inter-island migrations
A molecular clock can be used to infer the age of a taxonomicgroup; reviewed by Sanderson et al. (2004). For Hawaiian archipel-
ago radiations, an inference of the age of the root allows a ball-parkestimate of how long ago the original colonization took place(Fleischer et al., 1998; Givnish et al., 2009; Jordan et al., 2003;Russo et al., 1995). The substantial divergence of the Schiedeachloroplast lineage from the species lineage (see Sections 3.3 and4.3) needs to be considered in the interpretation of inferred nodeages. Although there is clearly a geographic pattern, the Schiedeaplastid lineage does not appear to be mainly tracking geographyrather than species (Petit et al., 1993). Based on presumed mater-nal inheritance, chloroplasts are unlikely to accomplish inter-island migrations except within a species. Thus, their lineage canbe used in Schiedea for a rough estimate of island progression.
Despite being rather well resolved at deeper nodes, our plastidphylogeny exhibits considerable rate heterogeneity amongbranches (see Section 2.6). This required the use of a relaxed log-normal clock that yields wider confidence intervals than expectedfrom a clock-like tree (Supplementary Table S3). Although we wereable to exclude root ages of 23 Ma and earlier based on a severedistortion of rates (see Section 2.6), root calibrations at 7.3 Maand 4.7 Ma infer mean substitution rates (1.02 and 1.40 � 10�9
substitutions per site per year, respectively) that are near the rangeof 1.1–1.6 � 10�9 reported for plastid loci across plants (Wolfeet al., 1987). Thus, we cannot use the criterion of unreasonablerates to exclude an original colonization of the Schiedea progenitoronto either Nihoa or Kauaì. Nonetheless, our BEAST results clarifyseveral inter-island migration patterns.
All of our species trees (Figs. 2 and 4a–d) and the plastid tree(Fig. 1) place S. verticillata, a distinctive endemic from the leewardisland of Nihoa, within the B clade. This topology is similar to a pre-vious nrDNA and morphology tree (Wagner et al., 2005), exceptthat our data infers that S. verticillata, rather than S. attenuata, issister to remaining members of the B clade. Because we have con-firmed the earlier branching of Alphaschiedea, S. verticillata isnested within the tree rather than representing the basal positionthat would be expected of a progenitor. We estimate the diver-gence of S. verticillata from the other members of the B clade atca. 3 Ma (Figs. 6 and 7). This is more recent than the age of Kauaìand more recent than some other plastid lineages currently distrib-uted on Kauaì. This suggests that S. verticillata represents a back-colonization from Kauaì to Nihoa rather than the maintenance ofan ancestral lineage from the older islands.
Each of our analyses infers a migration of the ancestors of sec-tion Alsinidendron (S. obovata and S. trinervis) from Kauaì to Oáhu.Regardless of calibration scenario, Alsinidendron is inferred to havediverged from Nothoschiedea 1.7 Ma (Figs. 6 and 7). The plastidlineage shared by S. spergulina and S. stellarioides split ca. 0.5–0.9 Ma (Figs. 6 and 7). There is also a general consensus that theprogenitor of the lineage leading to sections Schiedea and Monone-ura migrated from Kauaì to Oáhu or from Kauaì to the islands of theMaui Nui complex ca. 2.5–2.1 Ma (Figs. 6 and 7). However, the pat-tern of inter-island dispersals within sections Schiedea andMononeura to Oáhu and to the younger islands of Maui Nui is lar-gely obscured by short branches and poorly resolved nodes thatappear to be biologically realistic.
4.5. How old are the conflicting nodes?
Our BEAST results suggest that the TMRCA for the plastid line-age leading to the 19 species in section Schiedea and the MI clade(excepting S. diffusa) is at least 1.3 Ma (Fig. 7). We used this in-ferred age to judge whether these species would be expected todemonstrate incomplete lineage sorting for nuclear genes undera coalescent model. A coalescent time for 95% of loci to reach reci-procal monophyly can be estimated using a large population size(N = 10,000) and a reasonable generation time for Schiedea (g = 5;Wallace et al., 2009) to yield a conservative estimate (Maddison
46 A. Willyard et al. / Molecular Phylogenetics and Evolution 60 (2011) 29–48
and Knowles, 2006). Applying formulas of ‘9Ng’ and ‘12Ng’(Hudson and Coyne, 2002), we calculate a span of 450,000–600,000 years until reciprocal monophyly is expected. Only a fewSchiedea species pairs are inferred to have diverged within thistimeframe (Fig. 7). It is also likely that Schiedea ancestral effectivepopulation sizes (for rare, insular species) were relatively smalland we know that the typical census size for extant Schiedea spe-cies is much smaller than 10,000 (Wagner et al., 2005). Thus, theexpected coalescent time may be considerably less than450,000 years for Schiedea. Unless the original colonization wasmuch more recent than our inference (Figs. 6 and 7) or Schiedeaspecies lineages diverged much more recently than their plastidlineages, then our lack of reciprocal monophyly in nuclear genetrees within section Schiedea (Supplementary Figs. S1–S3) is unli-kely to be due to incomplete lineage sorting alone. One explanationfor this phenomenon is that reticulate evolution has played a majorrole in the radiation of section Schiedea. Additional, undetected,nuclear introgression may be masquerading as incomplete lineagesorting in this group.
We also considered whether the conflicting support inferred byparsimony and ML for different pairs of taxa in the total-evidencetrees (Figs. 4a and b) is likely to be due to an anomaly zone createdby short internal branches. Our conservatively calibrated plastidclock (Fig. 7) infers a TMRCA for these taxa pairs of 1.3 Ma(S. salicaria, S. ligustrina); 1.1 Ma (S. adamantis, S. lydgatei andS. kealiae, S. ligustrina); and ca. 0.65 Ma (S. lydgatei, S. salicaria).Using a population size of N = 10,000 and a generation time ofg = 5, the total branch lengths in coalescent units (t/2N) can beroughly estimated at 6.5, 11, and 13, respectively. These branchlengths are much longer than ones expected to form an ‘anomalyzone’ (Kubatko and Degnan, 2007; their Fig. S1). Thus, anomaloustrees that are distorted by short internal branches are unlikely tofully account for the conflict we observe in concatenated methods.Again, undetected introgression could offer an alternative explana-tion. Obviously, this coarse estimate ignores many complexities,including extinctions and short branches nested within the clade.We propose that these exercises are helpful by connectingempirical results with simulations in order to improve ourunderstanding of real-world problems.
4.6. Evolution of breeding systems
An interest in reconstructing the pattern of breeding systemshifts remains an important goal of a resolved phylogeny ofSchiedea. Our placement of S. apokremnos sister to clade B (Fig. 2)differs from previous results (Wagner et al., 2005; Weller et al.,1998) and confirms that gynodioecy arose independently in thisspecies. At minimum, one additional shift to dimorphic breedingsystems occurred in section Schiedea. Unfortunately, the lack ofresolution within this clade does not support a formal reconstruc-tion of breeding system character states. In fact, incongruenceamong our four independent genetic partitions should suggestcaution in using a single genetic partition to infer character statesin section Schiedea. We cannot reject either possibility: (i)hermaphroditism as the plesiomorphic state for the section andan unknown number of shifts to dimorphy; or (ii) dimorphy asthe plesiomorphic state for the section and up to three reversalsto hermaphroditism (S. lydgatei, S. menziesii, and S. hookeri). Thenuclear BEST tree (Fig. 2) places the hermaphroditic S. hookeri out-side the rake, but this is not supported by our nuclear concatenatedtree (Fig. 3). None of our species trees places either of the other twohermaphroditic species (S. lydgatei and S. menziesii) on an earlybranch within the section. In fact, the dioecious S. spergulina isbasal in the nuclear BEST tree (Fig. 2). A likelihood ratio test con-straining the three hermaphroditic species to monophyly (andhence representing one reversal) is not statistically different than
an unconstrained tree (data not shown) suggesting that such a sce-nario is not unwarranted. Although the pattern of interspecificbreeding system shifts in section Schiedea remains complex, intra-specific studies of gynodioecious Schiedea species are a useful sys-tem in which to study the transition from hermaphroditismtoward dioecy (Campbell et al., 2010; Rankin et al., 2002).
5. Conclusions
Although all 32 extant Schiedea species are monophyletic, ourtrees reveal patterns of introgression suggesting that interspecifichybridization has exerted a strong influence, despite being appar-ently infrequent. An example of reticulate evolution occurs deep inthe lineage of this genus, and there are several more examples to-ward the tips. The use of cytonuclear conflict among individualgene trees was not reliable for identifying divergent plastid lin-eages to remove from this data set. In particular, the paraphyleticnature of S. kauaiensis was a misleading clue. A comparison ofthe plastid tree with better-resolved nuclear species trees indicatesthat the lateral transfer of a plastid lineage likely occurred in theopposite direction, i.e. that the basally-branching section Alphas-chiedea acquired a chloroplast lineage from the more recent sectionMononeura. Our results are equivocal for nuclear introgression.Molecular clock calibrations suggest an unexpectedly ancient age(ca. 2–2.5 Ma) for the chloroplast lineage of the crown radiationof sections Mononeura and Schiedea. Because this timeframe ex-ceeds the expected coalescence time for species with small effec-tive population sizes, the lack of resolution among sectionSchiedea species has likely been driven, at least partially, by addi-tional chloroplast transfers.
In the presence of this level of reticulate evolution, the plastidlineage, our nuclear-plastid BEST tree, and our total-evidence ap-proach are positively misleading in their inferred species trees, de-spite our use of a ‘compromise’ data set. Further, we obtainedstronger sectional resolution with a nuclear BEST tree comparedwith a concatenated species tree method. Whether other nodeson the nuclear concatenated tree that lack support on the nuclearBEST tree will withstand remains to be seen. In any case, it appearsthat additional nuclear evidence, and perhaps the application ofpopulation-structure models, will be needed to tease apart the pat-tern of breeding system evolution within section Schiedea.
Acknowledgments
This research was supported by a Grant from the NationalScience Foundation (DEB-0445410). The authors thank theNational Tropical Botanical Gardens McBryde Senior Research pro-gram for support to MN; Douglas Jennewein and Joe Reynoldsonfor computing support; Tim Flynn, Joel Lau, John Obata, StevePerlman, Wayne Takeuchi, and Ken Wood for field collections; TinaClausen, Jeff Engeman, Bridget Jacobs, Calvin Krogman, and RobynnShannon for laboratory and herbarium work; L. Lacey Knowles,Laura Kubatko and the participants in the Estimating Species Treesworkshop for inspiration; Adam Bazinet and Liang Liu for helpfulsuggestions on software implementation.
Appendix A. Supplementary material
Supplementary data associated with this article can be found, inthe online version, at doi:10.1016/j.ympev.2011.04.001.
References
Akaike, H., 1974. A new look at the statistical model identification. IEEE Trans.Automat. Control 19, 716–723.
A. Willyard et al. / Molecular Phylogenetics and Evolution 60 (2011) 29–48 47
Belfiore, N.M., Liu, L., Moritz, C., 2008. Multilocus phylogenetics of a rapid radiationin the genus Thomomys (Rodentia: Geomyidae). Syst. Biol. 57, 294–310.
Bossu, C.M., Near, T.J., 2009. Gene trees reveal repeated instances of mitochondrialDNA introgression in orangethroat darters (Percidae: Etheostoma). Syst. Biol. 58,114–129.
Brown, R.P., Yang, Z., 2010. Bayesian dating of shallow phylogenies with a relaxedclock. Syst. Biol. 59, 119–131.
Brumfield, R.T., Liu, L., Lum, D.E., Edwards, S.V., 2008. Comparison of species treemethods for reconstructing the phylogeny of bearded Manakins (Aves: Pipridae,Manacus) from multilocus sequence data. Syst. Biol. 57, 719–731.
Campbell, D.R., Weller, S.G., Sakai, A.K., Culley, T.M., Dang, P.N., Dunbar-Wallis, A.K.,2010. Genetic variation and covariation in floral allocation of two species ofSchiedea with contrasting levels of sexual dimorphism. Evolution 65, 757–770.
Caraway, V., Carr, G.D., Morden, C., 2001. Assessment of hybridization andintrogression in lava-colonizing Hawaiian Dubautia (Asteraceae: Madiinae)using RAPD markers. Am. J. Bot. 88, 1688–1694.
Carlquist, S., 1974. Island Biology. Columbia University Press, New York, NY, USA.Carstens, B.C., Knowles, L., 2007. Estimating species phylogeny from gene-tree
probabilities despite incomplete lineage sorting: an example from Melanoplusgrasshoppers. Syst. Biol. 56, 400–411.
Chan, K.M., Levin, S.A., 2005. Leaky prezygotic isolation and porous genomes: rapidintrogression of maternally inherited DNA. Evolution 59, 720–729.
Clague, D.A., 1996. The growth and subsidence of the Hawaiian-Emperor volcanicchain. In: Keast, A., Miller, S.E. (Eds.), The Origin and Evolution of Pacific IslandBiotas, New Guinea to Eastern Polynesia: Patterns and Processes. SPB AcademicPublishing, Amsterdam, Netherlands, pp. 35–50.
Clark, A., 1990. Inference of haplotypes from PCR-amplified samples of diploidpopulations. Mol. Biol. Evol. 7, 111–122.
Culley, T.M., Dunbar-Wallis, A.K., Sakai, A.K., Weller, S.G., Mishio, M., Campbell, D.R.,Herzenach, M., 2006. Genetic variation of ecophysiological traits in twogynodioecious species of Schiedea (Caryophyllaceae). New Phytol. 169, 589–601.
Cummings, M., Neel, M., Shaw, K., Bazinet, A., 2010. Genealogical Sorting Index(Web-based Software Program). <http://gsi.umiacs.umd.edu/> (accessed11.06.10).
Cummings, M.P., Neel, M.C., Shaw, K.L., 2008. A genealogical approach toquantifying lineage divergence. Evolution 62, 2411–2422.
Currat, M., Ruedi, M., Petit, R.J., Excoffier, L., 2008. The hidden side of invasions:massive introgression by local genes. Evolution 62, 1908–1920.
DeBry, R.W., Olmstead, R.G., 2000. A simulation study of reduced tree-search effortin bootstrap resampling analysis. Syst. Biol. 49, 171–179.
Degnan, J.H., Rosenberg, N.A., 2006. Discordance of species trees with their mostlikely gene trees. PLoS Genetics 2, 762–768.
Demesure, B., Sodzi, N., Petit, R.J., 1995. A set of universal primers for amplificationof polymorphic non-coding regions of mitochondrial and chloroplast DNA inplants. Mol. Ecol. 4, 129–131.
Doolittle, W.F., Bapteste, E., 2007. Pattern pluralism and the Tree of Life hypothesis.Proc. Natl. Acad. Sci. USA 104, 2043–2049.
Drummond, A.J., Rambaut, A., 2007. BEAST: Bayesian evolutionary analysis bysampling trees. BMC Evol. Biol. 7, 214–221.
Dunbar-Co, S., Wieczorek, A.M., Morden, C.W., 2008. Molecular phylogeny andadaptive radiation of the endemic Hawaiian Plantago species (Plantaginaceae).Am. J. Bot. 95, 1177–1188.
Edwards, S.V., 2009. Is a new and general theory of molecular systematicsemerging? Evolution 63, 1–19.
Edwards, S.V., Beerli, P., 2000. Perspective: gene divergence, population divergence,and the variance in coalescence time in phylogeographic studies. Evolution 54,1839–1854.
Edwards, S.V., Liu, L., Pearl, D.K., 2007. High-resolution species trees withoutconcatenation. Proc. Natl. Acad. Sci. USA 104, 5936–5941.
Emshwiller, E., Doyle, J.J., 1999. Chloroplast-expressed glutamine synthetase(ncpGS): potential utility for phylogenetic studies with an example fromOxalis (Oxalidaceae). Mol. Phylogen. Evol. 12, 310–319.
Felsenstein, J., 2004. Inferring Phylogenies. Sinauer Assoc., Inc., Sunderland, MA,USA.
Fleischer, R.C., McIntosh, C.E., Tarr, C.L., 1998. Evolution on a volcanic conveyor belt:using phylogeographic reconstructions and K–Ar-based ages of the HawaiianIslands to estimate molecular evolutionary rates. Mol. Ecol. 7, 533–545.
Frajman, B., Eggens, F., Oxelman, B., 2009. Hybrid origins and homoploid reticulateevolution within Heliosperma (Sileneae, Caryophyllaceae) – a multigenephylogenetic approach with relative dating. Syst. Biol. 58, 328–345.
Funk, D.J., Omland, K.E., 2003. Species-level paraphyly and polyphyly: frequency,causes, and consequences, with insights from animal mitochondrial DNA. Ann.Rev. Ecol. Evol. Syst. 34, 397–423.
Funk, V.A., Wagner, W.L., 1995. Biogeographic patterns in the Hawaiian Islands In:Wagner, W.L., Funk, V.A. (Eds.), Hawaiian Biogeography: Evolution on A HotSpot Archipelago. Smithsonian Institution Press, Washington, DC, USA.
Gaskin, J.F., Schaal, B.A., 2002. Hybrid Tamarix widespread in US invasion andundetected in native Asian range. Proc. Natl. Acad. Sci. USA 99, 11256–11259.
Givnish, T.J., Sytsma, K.J., Smith, J.F., Hahn, W.J., 1995. Molecular evolution, adaptiveradiation and geographic speciation in Cyanea (Campanulaceae, Lobelioideae).In: Wagner, W.L., Funk, V.A. (Eds.), Hawaiian Biogeography: Evolution in aHotspot Archipelago. Smithsonian Institution Press, Washington, DC, USA, pp.288–336.
Givnish, T.J., Millam, K.C., Mast, A.R., Paterson, T.B., Theim, T.J., Hipp, A.L., Henss,J.M., Smith, J.F., Wood, K.R., Sytsma, K.J., 2009. Origin, adaptive radiation, anddiversification of the Hawaiian lobeliads (Asterales: Campanulaceae). Proc. R.Soc. Lond. B 276, 407–416.
Golonka, A.M., Sakai, A.K., Weller, S.G., 2005. Wind pollination, sexual dimorphism,and changes in floral traits of Schiedea (Caryophyllaceae). Am. J. Bot. 92, 1492–1502.
Goodman, M., Czelusniak, J., Moore, G.W., Romero-Herrera, A.E., Matsuda, G., 1979.Fitting the gene lineage into its species lineage, a parsimony strategy illustratedby cladograms constructed from Globin sequences. Syst. Zool. 28, 132–163.
Grant, V., 1981. Plant Speciation. Columbia Univ. Press, New York, NY, USA.Havran, J.C., Sytsma, K.J., Ballard Jr., H.E., 2009. Evolutionary relationships,
interisland biogeography, and molecular evolution in the Hawaiian violets(Viola: Violaceae). Am. J. Bot. 96, 2087–2099.
Heled, J., Drummond, A.J., 2009. Bayesian inference of species trees from multilocusdata. Mol. Biol. Evol. 27, 570–580.
Howarth, D.G., Baum, D.A., 2002. Phylogenetic utility of a nuclear intron fromnitrate reductase for the study of closely related plant species. Mol. Phylogen.Evol. 23, 525–528.
Howarth, D.G., Baum, D.A., 2005. Genealogical evidence of homoploid hybridspeciation in an adaptive radiation of Scaveola (Goodeniaceae) in the HawaiianIslands. Evolution 59, 948–961.
Huang, H.T., Knowles, L.L., 2009. What is the danger of the anomaly zone forempirical phylogenetics? Syst. Biol. 58, 527–536.
Hudson, R.R., Coyne, J.A., 2002. Mathematical consequences of the genealogicalspecies concept. Evolution 56, 1557–1565.
Johnson, L.A., Soltis, D.E., 1994. matK DNA sequences and phylogeneticreconstruction in Saxifragaceae s. str. Syst. Bot. 19, 143–156.
Jordan, S., Simon, C., Polhemus, D., 2003. Molecular systematics and adaptiveradiation of Hawaii’s endemic Damselfly genus Megalagrion (Odonata:Coenagrionidae). Syst. Biol. 52, 89–109.
Kubatko, L.S., Degnan, J.H., 2007. Inconsistency of phylogenetic estimates fromconcatenated data under coalescence. Syst. Biol. 56, 17–24.
Leache, A.D., 2009. Species tree discordance traces to phylogeographic cladeboundaries in North American Fence Lizards (Sceloporus). Syst. Biol. 58, 547–559.
Lee, C., Wen, J., 2004. Phylogeny of Panax using chloroplast trnC-trnD intergenicregion and the utility of trnC-trnD in interspecific studies of plants. Mol.Phylogen. Evol. 31, 894–903.
Lindqvist, C., Motley, T.J., Jeffrey, J.J., Albert, V.A., 2003. Cladogenesis and reticulationin the Hawaiian endemic mints (Lamiaceae). Cladistics 19, 480–495.
Linnen, C.R., Farrell, B.D., 2008. Comparison of methods for species-tree inference inthe sawfly genus Neodiprion (Hymenoptera: Diprionidae). Syst. Biol. 57, 876–890.
Liu, L., 2008. BEST: Bayesian estimation of species under the coalescent model.Bioinformatics 24, 2542–2543.
Liu, L., Edwards, S.V., 2009. Phylogenetic analysis in the anomaly zone. Syst. Biol. 58,452–460.
Liu, L., Pearl, D.K., 2007. Species trees from gene trees: reconstructing Bayesianposterior distributions of a species phylogeny using estimated gene treedistributions. Syst. Biol. 56, 504–514.
Liu, L., Pearl, D.K., Brumfield, R.T., Edwards, S.V., 2008. Estimating species trees usingmultiple-allele DNA sequence data. Evolution 62, 2080–2091.
Maddison, W.P., 1997. Gene trees in species trees. Syst. Biol. 46, 523–536.Maddison, W.P., Knowles, L.L., 2006. Inferring phylogeny despite incomplete lineage
sorting. Syst. Biol. 55, 21–30.Martin, D., Rybicki, E., 2000. RDP: detection of recombination amongst aligned
sequences. Bioinformatics 16, 562–563.Martin, D.P., Williamson, C., Posada, D., 2005. RDP2: recombination detection and
analysis from sequence alignments. Bioinformatics 21, 260–262.Moore, G., Devos, K., Wang, Z., Gale, M., 1995. Grasses, line up and form a circle.
Curr. Biol. 5, 737.Müller, K., 2005. SeqState – primer design and sequence statistics for phylogenetic
DNA data sets. Appl. Bioinf. 4, 65–69.Nei, M., 1987. Molecular Evolutionary Genetics. Columbia University Press, New
York, NY, USA.Norman, J.K., Sakai, A.K., Weller, S.G., Dawson, T.E., 1995. Inbreeding depression in
morphological and physiological traits of Schiedea lydgatei (Caryophyllaceae) intwo environments. Evolution 49, 297–306.
Norman, J.K., Weller, S.G., Sakai, A.K., 1997. Pollination biology and outcrossingrates in hermaphroditic Schiedea lydgatei (Caryophyllaceae). Am. J. Bot. 84, 641–648.
Parks, M., Cronn, R., Liston, A., 2009. Increasing phylogenetic resolution at lowtaxonomic levels using massively parallel sequencing of chloroplast genomes.BMC Biol. 7, 84–100.
Petit, R.J., Kremer, A., Wagner, D.B., 1993. Geographic structure of chloroplast DNApolymorphisms in European oaks. Theor. Appl. Gen. 87, 122–128.
Pirie, M.D., Humphreys, A.M., Barker, N.P., Linder, H.P., 2009. Reticulation, datacombination, and inferring evolutionary history: an example fromDanthonioideae (Poaceae). Syst. Biol. 58, 612–628.
Popp, M., Oxelman, B., 2001. Inferring the history of the polyploid Silene aegaea(Caryophyllaceae) using plastid and homoeologous nuclear DNA sequences.Mol. Phylogen. Evol. 20, 474–481.
Popp, M., Erixon, P., Eggens, F., Oxelman, B., 2005. Origin and evolution of acircumpolar polyploid species complex in Silene (Caryophyllaceae) inferred
48 A. Willyard et al. / Molecular Phylogenetics and Evolution 60 (2011) 29–48
from low copy nuclear RNA polymerase introns, rDNA, and chloroplast DNA.Syst. Bot. 30, 302–313.
Posada, D., 2008. JModelTest: phylogenetic model averaging. Mol. Biol. Evol. 25,1253–1256.
Price, J.P., Clague, D.A., 2002. How old is the Hawaiian biota? Geology andphylogeny suggest recent divergence. Proc. R. Soc. Lond. B 269, 2429–2435.
Rambaut, A., 2010a. FigTree (Software Program). <http://tree.bio.ed.ac.uk/software/> (accessed 11.06.10).
Rambaut, A., 2010b. Se–Al, Sequence Alignment Editor (Software Program). <http://iubio.bio.indiana.edu/soft/iubionew/molbio/dna/analysis/Pist/main.html/>(accessed 11.06.10).
Rankin, A.E., Weller, S.G., Sakai, A.K., 2002. Mating system instability in Schiedeamenziesii (Caryophyllaceae). Evolution 56, 1574–1585.
Rieseberg, L.H., Soltis, D.E., 1991. Phylogenetic consequences of cytoplasmic geneflow in plants. Evol. Trends Plants 5, 65–84.
Rieseberg, L.H., Whitton, J., Linder, C.R., 1996. Molecular marker incongruence inplant hybrid zones and phylogenetic trees. Acta Bot. Neerl. 45, 243–262.
Rokas, A., Williams, B.L., King, N., Carroll, S.B., 2003. Genome-scale approaches toresolving incongruence in molecular phylogenies. Nature 425, 798–804.
Ronquist, F., Huelsenbeck, J.P., 2003. MrBayes 3: Bayesian phylogenetic inferenceunder mixed models. Bioinformatics 19, 1572–1574.
Rozas, J., Sánchez-DelBarrio, J.C., Messeguer, X., Rozas, R., 2003. DnaSP, DNApolymorphism analyses by the coalescent and other methods. Bioinformatics19, 2496–2497.
Russo, C.A.M., Takezaki, N., Nei, M., 1995. Molecular phylogeny and divergencetimes of Drosophilid species. Mol. Biol. Evol. 12, 391–404.
Sakai, A.K., Weller, S.G., 1991. Ecological aspects of sex expression in subdioeciousSchiedea globosa (Caryophyllaceae). Am. J. Bot. 78, 1280–1288.
Sakai, A.K., Karoly, K., Weller, S.G., 1989. Inbreeding depression in Schiedea globosaand S. salicaria (Caryophyllaceae), subdioecious and gynodioecious Hawaiianspecies. Am. J. Bot. 76, 437–444.
Sakai, A.K., Weller, S.G., Chen, M.-L., Chou, S.-Y., Tasanont, C., 1997. Evolution ofgynodioecy and maintenance of females: the role of inbreeding depression,outcrossing rates, and resource allocation in Schiedea adamantis(Caryophyllaceae). Evolution 51, 724–736.
Sakai, A.K., Weller, S.G., Wagner, W.L., Nepokroeff, M., Culley, T.M., 2006. Adaptiveradiation and evolution of breeding systems in Schiedea (Caryophyllaceae), anendemic Hawaiian genus. Ann. Missouri Bot. Gard. 93, 49–63.
Sakai, A.K., Weller, S.G., Culley, T.M., Campbell, D.R., Dunbar-Wallis, A.K., Andres, A.,2008. Sexual dimorphism and the genetic potential for evolution of sexallocation in the gynodioecious plant, Schiedea salicaria. J. Evol. Biol. 21, 18–29.
Sanderson, M., Thorne, J., Wikstrom, N., Bremer, K., 2004. Molecular evidence onplant divergence times. Am. J. Bot. 91, 1656–1665.
Sang, T., Zhong, Y., 2000. Testing hybridization hypotheses based on incongruentgene trees. Syst. Biol. 49, 422–434.
Schneider, H., Ranker, T.A., Russell, S.J., Cranfill, R., Geiger, J.M.O., Aguraiuja, R.,Wood, K.R., Grundmann, M., Kloberdanz, K., Vogel, J.C., 2005. Origin of theendemic fern genus Diellia coincides with the renewal of Hawaiian terrestriallife in the Miocene. Proc. R. Soc. Lond. B 272, 455–460.
Seehausen, O., 2004. Hybridization and adaptive radiation. Trends Ecol. Evol. 19,198–207.
Shaw, K.L., 2002. Conflict between nuclear and mitochondrial DNA phylogenies of arecent species radiation: what mtDNA reveals and conceals about modes ofspeciation in Hawaiian crickets. Proc. Natl. Acad. Sci. USA 99, 16122–16127.
Shaw, J., Lickey, E.B., Beck, J.T., Farmer, S.B., Liu, W., Miller, J., Siripun, K.C., Winder,C.T., Schilling, E.E., Small, R.L., 2005. The tortoise and the hare II: relative utilityof 21 noncoding chloroplast DNA sequences for phylogenetic analysis. Am. J.Bot. 92, 142–166.
Shaw, J., Lickey, E.B., Schilling, E.E., Small, R.L., 2007. Comparison of wholechloroplast genome sequences to choose noncoding regions for phylogeneticstudies in angiosperms: the tortoise and the hare III. Am. J. Bot. 94, 275–288.
Simmons, M.P., Ochoterena, H., 2000. Gaps as characters in sequence-basedphylogenetic analyses. Syst. Biol. 49, 369–381.
Soltis, P.S., Soltis, D.E., Weller, S.G., Sakai, A.K., Wagner, W.L., 1996. Molecularphylogenetic analysis of the Hawaiian endemics Schiedea and Alsinidendron(Caryophyllaceae). Syst. Bot. 21, 365–379.
Spinks, P.Q., Shaffer, H.B., 2009. Conflicting mitochondrial and nuclear phylogeniesfor the widely disjunct Emys (Testudines: Emydidae) species complex, and whatthey tell us about biogeography and hybridization. Syst. Biol. 58, 1–20.
Stamatakis, A., 2006. RAxML-V1-HPC: maximum likelihood-based phylogeneticanalyses with thousands of taxa and mixed models. Bioinformatics 22, 2688–2690.
Stebbins, G.L., 1950. Variation and Evolution in Plants. Columbia Univ. Press, NewYork, NY.
Swofford, D., 2002. PAUP�: Phylogenetic Analysis Using Parsimony (� and OtherMethods), Version 4.0 b10. Sinauer Assoc., Inc., Sunderland, MA, USA.
Taylor, E.B., McPhail, J.D., 2008. Evolutionary history of an adaptive radiation inspecies pairs of threespine sticklebacks (Gasterosteus): insights frommitochondrial DNA. Biol. J. Linn. Soc. 66, 271–291.
Thiers, B., 2010. Index Herbariorum (Online Database). <http://sweetgum.nybg.org/ih/> (accessed 11.06.10).
Wagner, W.L., Weller, S.G., Sakai, A.K., 1995. Phylogeny and biogeography inSchiedea and Alsinidendron (Caryophyllaceae). In: Wagner, W.L., Funk, V.A.(Eds.), Hawaiian Biogeography. Smithsonian Institution Press, Washington, DC,pp. 221–258.
Wagner, W.L., Herbst, D.R., Sohmer, S., 1999. Manual of the Flowering Plants ofHawai‘i. Bishop Museum Press, Honolulu, HI, USA.
Wagner, W.L., Weller, S.G., Sakai, A.K., 2005. Monograph of Schiedea(Caryophyllaceae–Alsinoideae). Syst. Bot. Monographs 72, 169.
Wallace, L.E., Weller, S.G., Wagner, W.L., Sakai, A.K., Nepokroeff, M., 2009.Phylogeographic patterns and demographic history of Schiedea globosa(Caryophyllaceae) on the Hawaiian Islands. Am. J. Bot. 96, 958–967.
Wares, J.P., Pankey, M.S., Pitombo, F., Gómez Daglio, L., Achituv, Y., 2009. A ‘‘shallowphylogeny’’ of shallow barnacles (Chthamalus). PLoS One 4, 1–10.
Weller, S.G., Sakai, A.K., 1991. The genetic basis of male sterility in Schiedea(Caryophyllaceae), an endemic Hawaiian genus. Heredity 67, 265–273.
Weller, S.G., Sakai, A.K., 1999. Using phylogenetic approaches for the analysis ofplant breeding system evolution. Ann. Rev. Ecol. Syst. 30, 167–199.
Weller, S.G., Sakai, A.K., 2005. Selfing and resource allocation in Schiedea salicaria(Caryophyllaceae), a gynodioecious species. J. Evol. Biol. 18, 301–308.
Weller, S.G., Sakai, A.K., Wagner, W.L., Herbst, D.R., 1990. Evolution of dioecy inSchiedea (Caryophyllaceae: Alsinoideae) in the Hawaiian Islands:biogeographical and ecological factors. Syst. Bot. 15, 266–276.
Weller, S.G., Wagner, W.L., Sakai, A.K., 1995. A phylogenetic analysis of Schiedea andAlsinidendron (Caryophyllaceae: Alsinoideae): implications for the evolution ofbreeding systems. Syst. Bot. 20, 315–337.
Weller, S.G., Sakai, A.K., Straub, C., 1996. Allozyme diversity and genetic identity inSchiedea and Alsinidendron (Caryophyllaceae: Alsinoideae) in the HawaiianIslands. Evolution 50, 23–34.
Weller, S.G., Sakai, A.K., Rankin, A.E., Golonka, A.M., Kutcher, B., Ashby, K.E., 1998.Dioecy and the evolution of pollination systems in Schiedea and Alsinidendron(Caryophyllaceae: Alsinoideae) in the Hawaiian Islands. Am. J. Bot. 85, 1377–1388.
Weller, S.G., Sakai, A.K., Wagner, W.L., 2001. Artificial and natural hybridization inSchiedea and Alsinidendron (Caryophyllaceae: Alsinoideae): the importance ofphylogeny, genetic divergence, breeding system, and population size. Syst. Bot.26, 571–584.
Weller, S.G., Sakai, A.K., Culley, T.M., Campbell, D.R., Dunbar-Wallis, A.K., 2006.Predicting the pathway to wind pollination: heritabilities and geneticcorrelations of inflorescence traits associated with wind pollination inSchiedea salicaria (Caryophyllaceae). J. Evol. Biol. 19, 331–342.
Weller, S.G., Sakai, A.K., Culley, T.M., Campbell, D.R., Ngo, P., Dunbar-Wallis, A.K.,2007. Sexually dimorphic inflorescence traits in a wind-pollinated species:heritabilities and genetic correlations in Schiedea adamantis (Caryophyllaceae).Am. J. Bot. 94, 1716–1725.
Willyard, A., Cronn, R., Liston, A., 2009. Reticulate evolution among the ponderosapines. Mol. Phylogen. Evol. 52, 498–511.
Wolfe, K., Li, W.-H., Sharp, P., 1987. Rates of nucleotide substitution vary greatlyamong plant mitochondrial, chloroplast, and nuclear DNAs. Proc. Natl. Acad. Sci.USA 84, 9054–9058.