Haplotype threading: accurate polyploid ... - Genome Biology
Upload
independentCategory
view
1download
0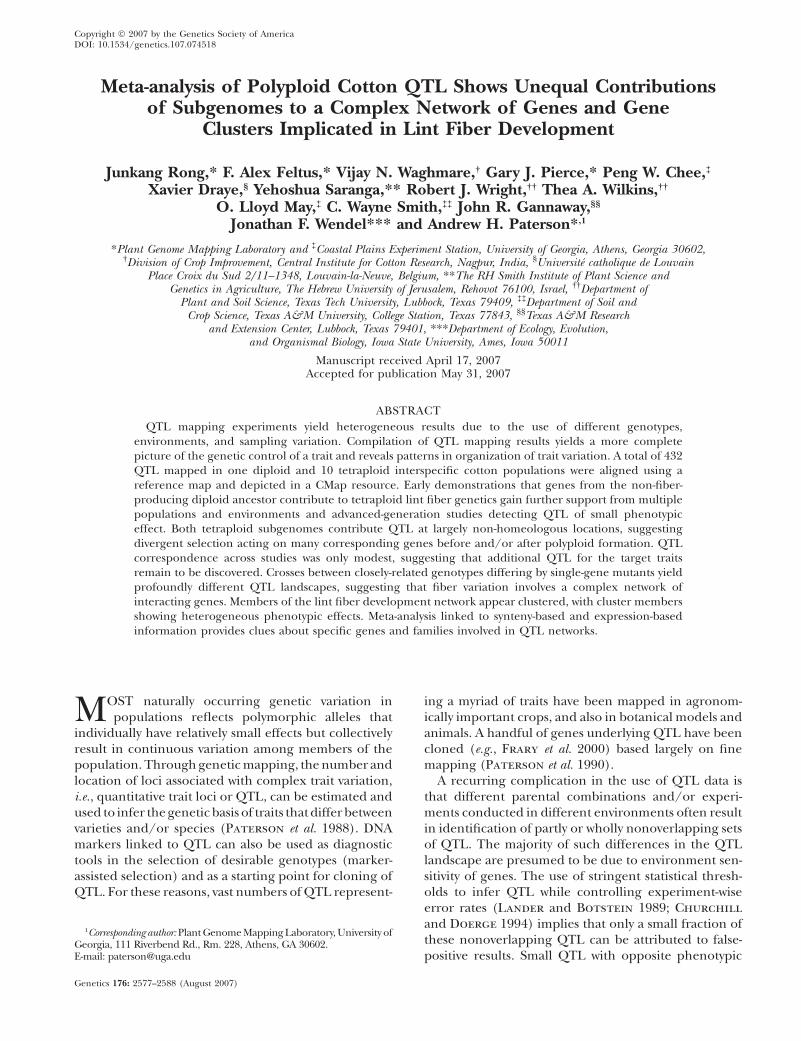
Copyright � 2007 by the Genetics Society of AmericaDOI: 10.1534/genetics.107.074518
Meta-analysis of Polyploid Cotton QTL Shows Unequal Contributionsof Subgenomes to a Complex Network of Genes and Gene
Clusters Implicated in Lint Fiber Development
Junkang Rong,* F. Alex Feltus,* Vijay N. Waghmare,† Gary J. Pierce,* Peng W. Chee,‡
Xavier Draye,§ Yehoshua Saranga,** Robert J. Wright,†† Thea A. Wilkins,††
O. Lloyd May,‡ C. Wayne Smith,‡‡ John R. Gannaway,§§
Jonathan F. Wendel*** and Andrew H. Paterson*,1
*Plant Genome Mapping Laboratory and ‡Coastal Plains Experiment Station, University of Georgia, Athens, Georgia 30602,†Division of Crop Improvement, Central Institute for Cotton Research, Nagpur, India, §Universite catholique de Louvain
Place Croix du Sud 2/11–1348, Louvain-la-Neuve, Belgium, **The RH Smith Institute of Plant Science andGenetics in Agriculture, The Hebrew University of Jerusalem, Rehovot 76100, Israel, ††Department of
Plant and Soil Science, Texas Tech University, Lubbock, Texas 79409, ‡‡Department of Soil andCrop Science, Texas A&M University, College Station, Texas 77843, §§Texas A&M Research
and Extension Center, Lubbock, Texas 79401, ***Department of Ecology, Evolution,and Organismal Biology, Iowa State University, Ames, Iowa 50011
Manuscript received April 17, 2007Accepted for publication May 31, 2007
ABSTRACT
QTL mapping experiments yield heterogeneous results due to the use of different genotypes,environments, and sampling variation. Compilation of QTL mapping results yields a more completepicture of the genetic control of a trait and reveals patterns in organization of trait variation. A total of 432QTL mapped in one diploid and 10 tetraploid interspecific cotton populations were aligned using areference map and depicted in a CMap resource. Early demonstrations that genes from the non-fiber-producing diploid ancestor contribute to tetraploid lint fiber genetics gain further support from multiplepopulations and environments and advanced-generation studies detecting QTL of small phenotypiceffect. Both tetraploid subgenomes contribute QTL at largely non-homeologous locations, suggestingdivergent selection acting on many corresponding genes before and/or after polyploid formation. QTLcorrespondence across studies was only modest, suggesting that additional QTL for the target traitsremain to be discovered. Crosses between closely-related genotypes differing by single-gene mutants yieldprofoundly different QTL landscapes, suggesting that fiber variation involves a complex network ofinteracting genes. Members of the lint fiber development network appear clustered, with cluster membersshowing heterogeneous phenotypic effects. Meta-analysis linked to synteny-based and expression-basedinformation provides clues about specific genes and families involved in QTL networks.
MOST naturally occurring genetic variation inpopulations reflects polymorphic alleles that
individually have relatively small effects but collectivelyresult in continuous variation among members of thepopulation. Through genetic mapping, the number andlocation of loci associated with complex trait variation,i.e., quantitative trait loci or QTL, can be estimated andused to infer the genetic basis of traits that differ betweenvarieties and/or species (Paterson et al. 1988). DNAmarkers linked to QTL can also be used as diagnostictools in the selection of desirable genotypes (marker-assisted selection) and as a starting point for cloning ofQTL. For these reasons, vast numbers of QTL represent-
ing a myriad of traits have been mapped in agronom-ically important crops, and also in botanical models andanimals. A handful of genes underlying QTL have beencloned (e.g., Frary et al. 2000) based largely on finemapping (Paterson et al. 1990).
A recurring complication in the use of QTL data isthat different parental combinations and/or experi-ments conducted in different environments often resultin identification of partly or wholly nonoverlapping setsof QTL. The majority of such differences in the QTLlandscape are presumed to be due to environment sen-sitivity of genes. The use of stringent statistical thresh-olds to infer QTL while controlling experiment-wiseerror rates (Lander and Botstein 1989; Churchill
and Doerge 1994) implies that only a small fraction ofthese nonoverlapping QTL can be attributed to false-positive results. Small QTL with opposite phenotypic
1Corresponding author: Plant Genome Mapping Laboratory, University ofGeorgia, 111 Riverbend Rd., Rm. 228, Athens, GA 30602.E-mail: [email protected]
Genetics 176: 2577–2588 (August 2007)
effects might occasionally be closely linked in couplingin early-generation populations, and separated onlyin advanced-generation populations after additionalrecombination.
Comparison of multiple QTL mapping experimentsby alignment to a common reference map offers a morecomplete picture of the genetic control of a trait thancan be obtained in any one study. One such trait, thegenetic control of variation in growth and developmentof seed-borne epidermal ‘‘lint’’ fibers, is a natural pri-ority in cotton genome analysis. All 50 Gossypium spe-cies have seed-borne epidermal trichomes, often referredto as ‘‘fuzz’’ fibers. ‘‘A’’ genome diploid cottons are dis-tinct from their sister ‘‘F’’ and ‘‘B’’ genomes in that bothwild and cultivated forms have longer lint fibers withsecondary thickening, which are spinnable; this featurecan thus be inferred to have evolved after the divergenceof the A, B, and F genomes from a common ancestor�5–7 MYA (Wendel 1989). Some view lint as distinctfrom fuzz fibers based on the secondary thickening,while others view the two as extremes in a continuum.However, all agree that economically important lint fi-bers are much longer, reaching lengths of �20 mm incultivated A-genome diploids Gossypium herbaceum andG. arboreum. Wild tetraploid cottons have fibers resem-bling those of wild diploids; however, domestication andscientific improvement of AD tetraploids G. hirsutumand G. barbadense (from different tetraploid clades) haveincreased fiber length to as much as�mm or more, andalso improved other aspects of fiber quality (strength,fineness, and elongation) as well as higher yield, even inenvironments to which both have been adapted byscientific plant breeding ( Jiang et al. 1998).
Accurate measurement of cotton fiber quality re-quires complex instrumentation and therefore has beena high-priority trait for which to establish diagnosticDNA markers, in view of the fact that cotton provides�45% of the raw material for the �$500 billion/yearworldwide textile industry. Cotton fiber quality is acomplex characteristic with many components affectingboth the efficacy of processing by textile spinningmachinery and the comfort attributes associated withcotton fabrics. To date, .200 QTL related to variousaspects of fiber quality have been mapped using differ-ent kinds of populations including F2 ( Jiang et al. 1998;Paterson et al. 2003; Mei et al. 2004; Lin et al. 2005; Shen
et al. 2005; Udall et al. 2006), advanced backcross (Chee
et al. 2005a,b; Draye et al. 2005; Lacape et al. 2005), andcytogenetic stocks (Saha et al. 2004).
Meta-analysis of cotton fiber QTL promises to con-tribute to our understanding of fundamental questionsand to expedite crop improvement. Gossypium is anespecially good model in which to advance understand-ing of the consequences of polyploidy in that bothderived tetraploids and their ancestral diploids (or atleast very close relatives) are known and remain extant,yet the polyploidization event is sufficiently old ½�1–2
million years (Senchina et al. 2003)� for adaptiveevolution to have occurred. One particularly excitingopportunity is to shed light on why tetraploid cottonsconsistently have higher yield and quality than themodern descendants of their diploid progenitors, evenin environments to which both have been adapted byscientific plant breeding ( Jiang et al. 1998).
Research into the genetic control of cotton fiberdevelopment may also benefit from progress in under-standing the growth and development of hair-bearingepidermal cells (trichomes) in Arabidopsis. Indeed,Gossypium and Arabidopsis are thought to have sharedcommon ancestry �83–86 MYA (Benton 1993), andcotton may be the best crop outside of the Brassicalesin which to employ translational genomics fromArabidopsis.
Using a high-density reference genetic map whichconsists of 3475 loci in total, herein we report thealignment of 432 QTL involving cotton fiber quality( Jiang et al. 1998; Paterson et al. 2003; Chee et al.2005a,b; Draye et al. 2005), yield ( Jiang et al. 1998;Saranga et al. 2001, 2004; Rong et al. 2005b), leafmorphology ( Jiang et al. 2000; Waghmare et al. 2005),flower morphology, resistance to bacteria (Wright et al.1998), trichome distribution and density (Wright et al.1999), and other traits that were mapped in 11 pop-ulations. All QTL were also projected onto a consensusmap, which was inferred to resemble the DNA markerarrangement of the hypothetical ancestor of the twosubgenomes of tetraploid cotton (Rong et al. 2005a).The consensus map has improved our ability to deducecotton-Arabidopsis synteny relationships and thus fos-ters study of correspondence between the cotton QTLand fiber or trichome-related Arabidopsis genes. Toencourage further utilization and on-line communityaccess to these data, a CMap resource was developedand can be accessed at our website.
MATERIALS AND METHODS
Populations: QTL and mutant data used in this study werepublished previously except for those from populationssegregating for n2 and im mutants (see below), as describedin Table 1.
QTL mapping of n2 and im populations: Two new F2
populations derived from crosses between G. barbadense var.Pima S-7 and G. hirsutum cv. Texas Marker-1 (TM-1) isogeniclines with n2 and im mutants, respectively, were mapped.
A total of 124 F2 plants from each of n2 and im crosses weregrown in a field at the Coastal Plain Experiment Station,Tifton, GA during the 2002 season. Five traits reflecting fiberquality parameters were determined by the Cotton Incorpo-rated Textile Services Laboratory (Cotton Incorporated, Cary,NC) using the High-Volume Precision Instrument (HVI),including upper-half mean length (HVuhm), percentageshort fiber by weight (HVsfc), uniformity index (HVui), fiberstrength (FS), fiber elongation (ELO), and micronaire (Mic).In addition, two fiber yield components, lint percentage andlint index, were measured as reported (Rong et al. 2005b).
2578 J. Rong et al.
DNA markers were selected from a high-density referencemap (Rong et al. 2004). Procedures for linkage analysis werereported previously (Rong et al. 2004). Composite intervalmapping (Zeng 1994) was performed using Windows QTLCartographer (Wang et al. 2005) (http://statgen.ncsu.edu/qtlcart/WQTLCart.htm). A stringent LR threshold of 13.8(equivalent to LOD score 3.0) was used to declare significantQTL to keep the experiment-wise likelihood of even one falsepositive below 5% in the large genome of cotton ( Jiang et al.1998). Effects and percent of phenotypic variance (PV)explained by single QTL (R 2) were estimated with WindowsQTL Cartographer 2.0 at likelihood peaks.
Integration of QTL from different populations: Forconvenience of description, three names were used for dif-ferent types of genetic maps: individual map, reference map(Rong et al. 2004), and consensus map (Rong et al. 2005a).Individual maps were the original QTL maps summarized inTable 1. To align QTL from different individual maps, thereference map was used, from which subsets of informativemarkers were drawn to make the individual maps. Finally,some analyses also used a ‘‘consensus map’’ that depicts themarker arrangement along the genome of a hypotheticalcommon ancestor that gave rise to the diploid progenitors ofpolyploid cotton, inferred as described elsewhere (Rong et al.2005a). Most of the QTL locations in reference and consensusmaps were determined by BioMERCARTOR (Version 2)(Arcade et al. 2004). QTL in regions where the marker orderwas different between the individual map and reference mapwere plotted based on the location of the marker nearest to thelikelihood peak on the reference map. The individual mapswere made over several years, during which changes in thereference map occurred; marker and chromosome nomen-clature was all synchronized with that of the current referencemap (Rong et al. 2004). Redundant probes, identified as de-tailed elsewhere (Rong et al. 2005a), were removed. Nomen-clature of QTL in the reference map was standardized to thesystem reported (Chee et al. 2005a,b; Draye et al. 2005), that is,trait name first, then the name of the chromosome on whichthe QTL was located, followed by a number indicating the locion this chromosome. If two QTL were reported by Chee et al.(2005a,b) and Draye et al. (2005) on a chromosome, addi-tional QTL for the same trait mapped in the same chromo-some of other individual maps will be given a number with twodigits to represent their relative locations. For example,because two QTL for fiber length were mapped on linkagegroup D08 by Chee et al. (2005b) and named FLD08.1 andFLD08.2 respectively, another QTL mapped on the samechromosome was named FLD08.15 representing the relativelocation of its likelihood peak between FLD08.1 and FLD08.2.The original name for each QTL used in each map, and thename in CMap of each trait as well as their category andsource were summarized in supplemental Table 9 (http://www.genetics.org/supplemental/).
CMap display of genetic maps: CMap v0.16 was down-loaded from the Generic Components for Model OrganismDatabase project (GMOD; http://www.gmod.org). Geneticmapping data were prepared in spreadsheets and importedinto CMap.
RESULTS
A CMap visualization tool for meta-analysis: Tostreamline comparisons of QTL and other genomicdata among chromosomes, subgenomes, populations,and syntenic locations in Arabidopsis, we developed acotton CMap resource (publicly available at http://www.
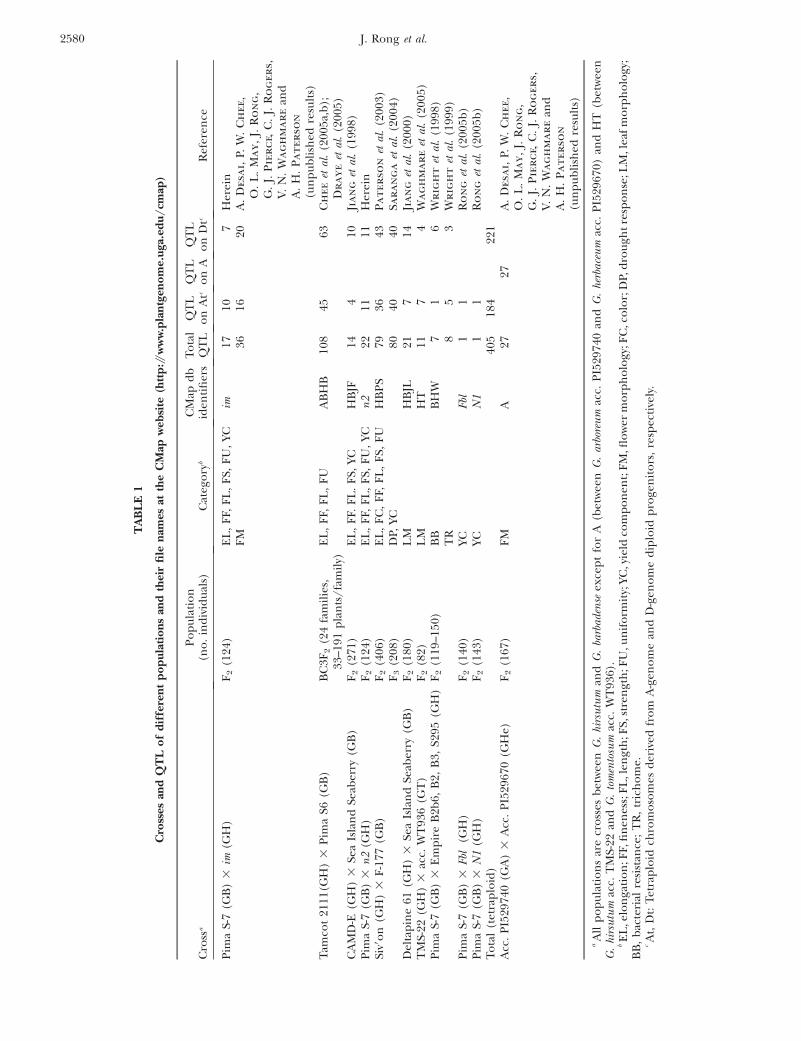
plantgenome.uga.edu/cmap). Using BioMERCARTOR(Arcade et al. 2004), a total of 432 QTL from 11 indi-vidual maps (Table 1) were aligned to the reference map(Rong et al. 2004) and to the consensus map represent-ing inferred gene (marker) arrangements along thechromosomes of a common ancestor of the A and Dgenomes (Rong et al. 2005a). Among them, 224 QTLfrom five populations were related to fiber quality, 64from four populations were related to yield compo-nents, 63 from two populations (one tetraploid and onediploid A genome) were related to flower morphology,33 from one population were related to drought re-sponse, 32 from two populations were related to leafmorphology, 8 from four populations were related totrichome density, 7 from four populations were relatedto bacterial blight resistance, and 1 from one populationwas related to earliness. Available from the CMap re-source are individual QTL maps, the reference map,and the consensus map, plus relationships of cottonchromosomes to inferred gene orders for a hypotheticalcommon ancestor of cotton and Arabidopsis (Rong
et al. 2005a) based on correspondence inferred usingCSII (Levine 2002) and FISH (Calabrese et al. 2003).
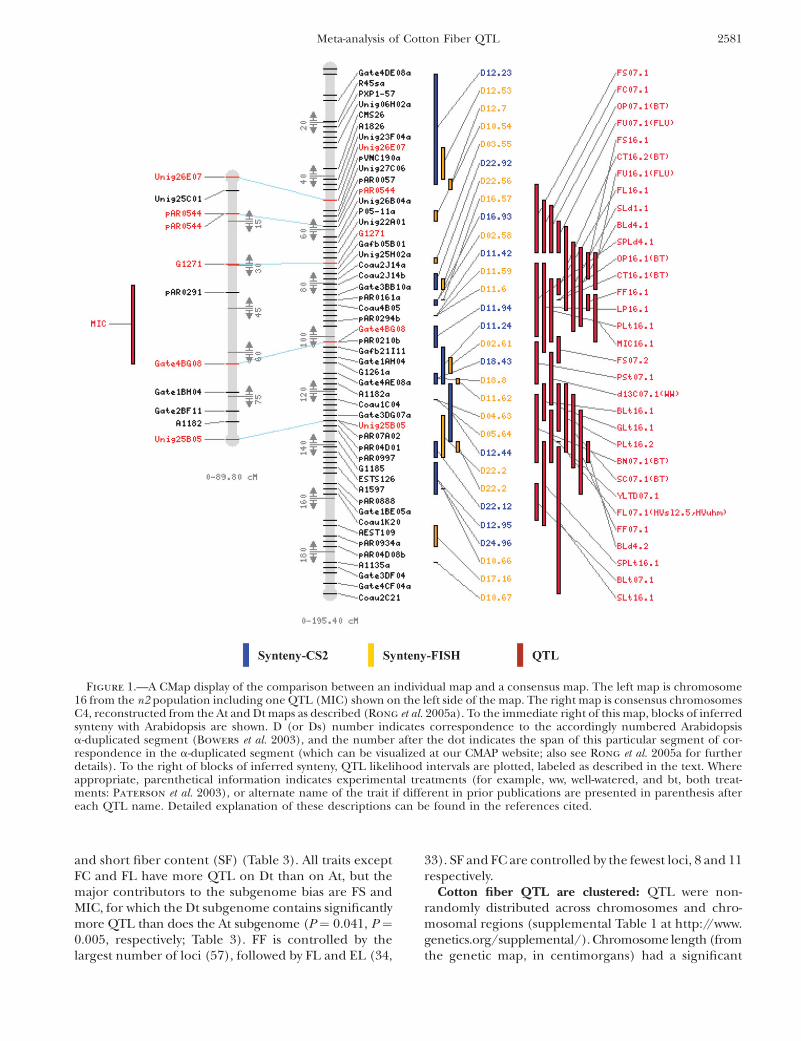
In an example of the visualizations possible with thisresource (Figure 1), a QTL on one chromosome (Chr.16) of an individual population (n2) is aligned to thecorresponding ‘‘chromosome’’ of the consensus map,also indicating corresponding regions of Arabidopsisand showing all QTL known from all populations for theregion shown. Thus, the CMap resource expedites thecomparison of QTL between different homeologouschromosomes as well as between cotton QTL andArabidopsis orthologs in the syntenic regions.
Cotton fiber QTL are enriched in the D subgenome:More QTL were detected in the tetraploid D (hereafterDt) than in the tetraploid A (hereafter At) subgenome,specifically 221 vs. 184 (Table 1). Of special interest wereQTL related to lint fiber quality characteristics, in thatthe At progenitor produces spinnable fiber but the Dtprogenitor does not. We focused this analysis on fiberquality characteristics because of their relatively highheritability (May and Wofford 2000) and economicimportance. QTL for fiber yield components from asmall number of studies are also in the CMap database,but in view of the complexity and low heritability of thistrait we considered that more extensive testing would beneeded before a meaningful meta-analysis could beperformed on these.
Based on three well-studied crosses for which bothparents are elite cultivars or breeding lines (Table 2), theDt subgenome contained 112 lint fiber-related QTLvs. 84 in the At (Tables 2 and 3), a marginally signifi-cant difference (P ¼ 0.0455). The 196 genes and QTLmapped in these elite crosses were further classified intothe following trait categories: elongation (EL), fibercolor (FC), fiber fineness (FF), fiber length (FL), fiberstrength (FS), fiber uniformity (FU), micronaire (MIC),
Meta-analysis of Cotton Fiber QTL 2579
TA
BL
E1
Cro
sses
and
QT
Lo
fd
iffe
ren
tp
op
ula
tio
ns
and
thei
rfi
len
ames
atth
eC
Map
web
site
(htt
p://
ww
w.p
lan
tgen
om
e.u
ga.e
du
/cm
ap)
Cro
ssa
Po
pu
lati
on
(no
.in
div
idu
als)
Cat
ego
ryb
CM
apd
bid
enti
fier
sT
ota
lQ
TL
QT
Lo
nA
tc
QT
Lo
nA
QT
Lo
nD
tcR
efer
ence
Pim
aS-
7(G
B)
3im
(GH
)F
2(1
24)
EL
,F
F,F
L,
FS,
FU
,YC
im17
107
Her
ein
FM
3616
20A
.D
esa
i,
P.W
.C
hee,
O.
L.
Ma
y,
J.R
on
g,
G.
J.P
ier
ce,
C.
J.R
og
er
s,
V.
N.
Wa
gh
ma
re
and
A.
H.
Pa
ter
so
n
(un
pu
bli
shed
resu
lts)
Tam
cot
2111
(GH
)3
Pim
aS6
(GB
)B
C3F
2(2
4fa
mil
ies,
33–1
91p
lan
ts/
fam
ily)
EL
,F
F,F
L,
FU
AB
HB
108
4563
Ch
ee
etal
.(2
005a
,b);
Dr
ay
eet
al.
(200
5)C
AM
D-E
(GH
)3
Sea
Isla
nd
Seab
erry
(GB
)F
2(2
71)
EL
,F
F.F
L.
FS,
YCH
BJF
144
10Ji
an
get
al.
(199
8)P
ima
S-7
(GB
)3
n2
(GH
)F
2(1
24)
EL
,F
F,F
L,
FS,
FU
,YC
n2
2211
11H
erei
nSi
v9o
n(G
H)
3F
-177
(GB
)F
2(4
06)
EL
,F
C,
FF,
FL
,F
S,F
UH
BP
S79
3643
Pa
ter
so
net
al.
(200
3)F
3(2
08)
DP,
YC80
4040
Sar
an
ga
etal
.(2
004)
Del
tap
ine
61(G
H)
3Se
aIs
lan
dSe
aber
ry(G
B)
F2
(180
)L
MH
BJL
217
14Ji
an
get
al.
(200
0)T
MS-
22(G
H)
3ac
c.W
T93
6(G
T)
F2
(82)
LM
HT
117
4W
ag
hm
ar
eet
al.
(200
5)P
ima
S-7
(GB
)3
Em
pir
eB
2b6,
B2,
B3,
S295
(GH
)F
2(1
19–1
50)
BB
BH
W7
16
Wr
ig
ht
etal
.(1
998)
TR
85
3W
rig
ht
etal
.(1
999)
Pim
aS-
7(G
B)
3Fb
l(G
H)
F2
(140
)YC
Fbl
11
Ro
ng
etal
.(2
005b
)P
ima
S-7
(GB
)3
N1
(GH
)F
2(1
43)
YCN
11
1R
on
get
al.
(200
5b)
To
tal
(tet
rap
loid
)40
518
422
1A
cc.
PI5
2974
0(G
A)
3A
cc.
PI5
2967
0(G
He)
F2
(167
)F
MA
2727
A.
Desa
i,
P.W
.C
hee,
O.
L.
Ma
y,
J.R
on
g,
G.
J.P
ier
ce,
C.
J.R
og
er
s,
V.
N.
Wa
gh
ma
re
and
A.
H.
Pa
ter
so
n
(un
pu
bli
shed
resu
lts)
aA
llp
op
ula
tio
ns
are
cro
sses
bet
wee
nG
.hi
rsu
tum
and
G.
barb
aden
seex
cep
tfo
rA
(bet
wee
nG
.ar
bore
um
acc.
PI5
2974
0an
dG
.he
rbac
eum
acc.
PI5
2967
0)an
dH
T(b
etw
een
G.
hirs
utu
mac
c.T
MS-
22an
dG
.to
men
tosu
mac
c.W
T93
6).
bE
L,e
lon
gati
on
;FF,
fin
enes
s;F
L,l
engt
h;F
S,st
ren
gth
;FU
,un
ifo
rmit
y;YC
,yie
ldco
mp
on
ent;
FM
,flo
wer
mo
rph
olo
gy;F
C,c
olo
r;D
P,d
rou
ght
resp
on
se;L
M,l
eaf
mo
rph
olo
gy;
BB
,b
acte
rial
resi
stan
ce;
TR
,tr
ich
om
e.cA
t,D
t:T
etra
plo
idch
rom
oso
mes
der
ived
fro
mA
-gen
om
ean
dD
-gen
om
ed
iplo
idp
roge
nit
ors
,re
spec
tive
ly.
2580 J. Rong et al.
and short fiber content (SF) (Table 3). All traits exceptFC and FL have more QTL on Dt than on At, but themajor contributors to the subgenome bias are FS andMIC, for which the Dt subgenome contains significantlymore QTL than does the At subgenome (P ¼ 0.041, P ¼0.005, respectively; Table 3). FF is controlled by thelargest number of loci (57), followed by FL and EL (34,
33). SF and FC are controlled by the fewest loci, 8 and 11respectively.
Cotton fiber QTL are clustered: QTL were non-randomly distributed across chromosomes and chro-mosomal regions (supplemental Table 1 at http://www.genetics.org/supplemental/). Chromosome length (fromthe genetic map, in centimorgans) had a significant
Figure 1.—A CMap display of the comparison between an individual map and a consensus map. The left map is chromosome16 from the n2 population including one QTL (MIC) shown on the left side of the map. The right map is consensus chromosomesC4, reconstructed from the At and Dt maps as described (Rong et al. 2005a). To the immediate right of this map, blocks of inferredsynteny with Arabidopsis are shown. D (or Ds) number indicates correspondence to the accordingly numbered Arabidopsisa-duplicated segment (Bowers et al. 2003), and the number after the dot indicates the span of this particular segment of cor-respondence in the a-duplicated segment (which can be visualized at our CMAP website; also see Rong et al. 2005a for furtherdetails). To the right of blocks of inferred synteny, QTL likelihood intervals are plotted, labeled as described in the text. Whereappropriate, parenthetical information indicates experimental treatments (for example, ww, well-watered, and bt, both treat-ments: Paterson et al. 2003), or alternate name of the trait if different in prior publications are presented in parenthesis aftereach QTL name. Detailed explanation of these descriptions can be found in the references cited.
Meta-analysis of Cotton Fiber QTL 2581
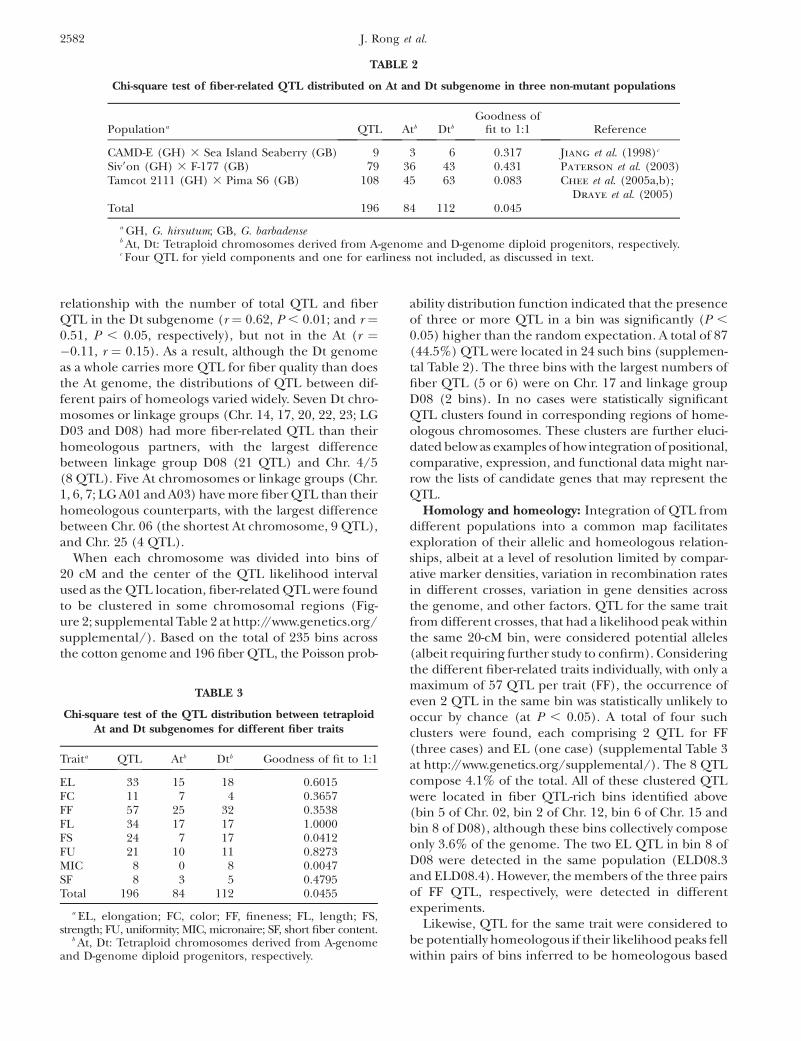
relationship with the number of total QTL and fiberQTL in the Dt subgenome (r ¼ 0.62, P , 0.01; and r ¼0.51, P , 0.05, respectively), but not in the At (r ¼�0.11, r ¼ 0.15). As a result, although the Dt genomeas a whole carries more QTL for fiber quality than doesthe At genome, the distributions of QTL between dif-ferent pairs of homeologs varied widely. Seven Dt chro-mosomes or linkage groups (Chr. 14, 17, 20, 22, 23; LGD03 and D08) had more fiber-related QTL than theirhomeologous partners, with the largest differencebetween linkage group D08 (21 QTL) and Chr. 4/5(8 QTL). Five At chromosomes or linkage groups (Chr.1, 6, 7; LG A01 and A03) have more fiber QTL than theirhomeologous counterparts, with the largest differencebetween Chr. 06 (the shortest At chromosome, 9 QTL),and Chr. 25 (4 QTL).
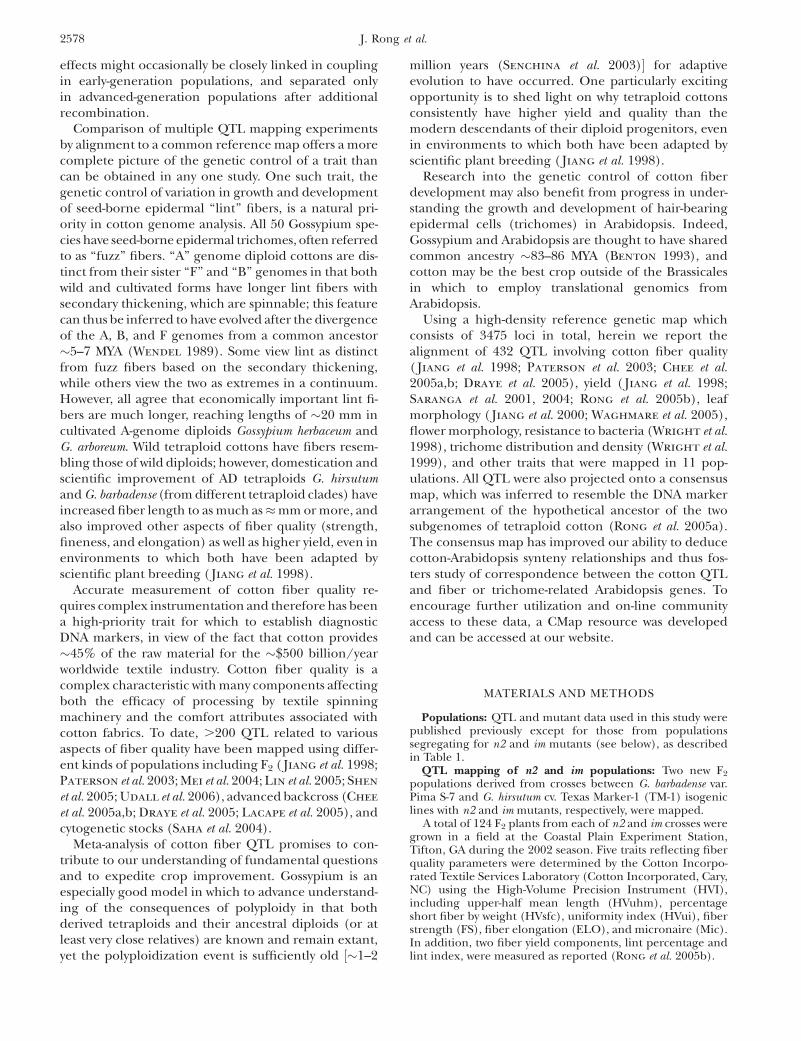
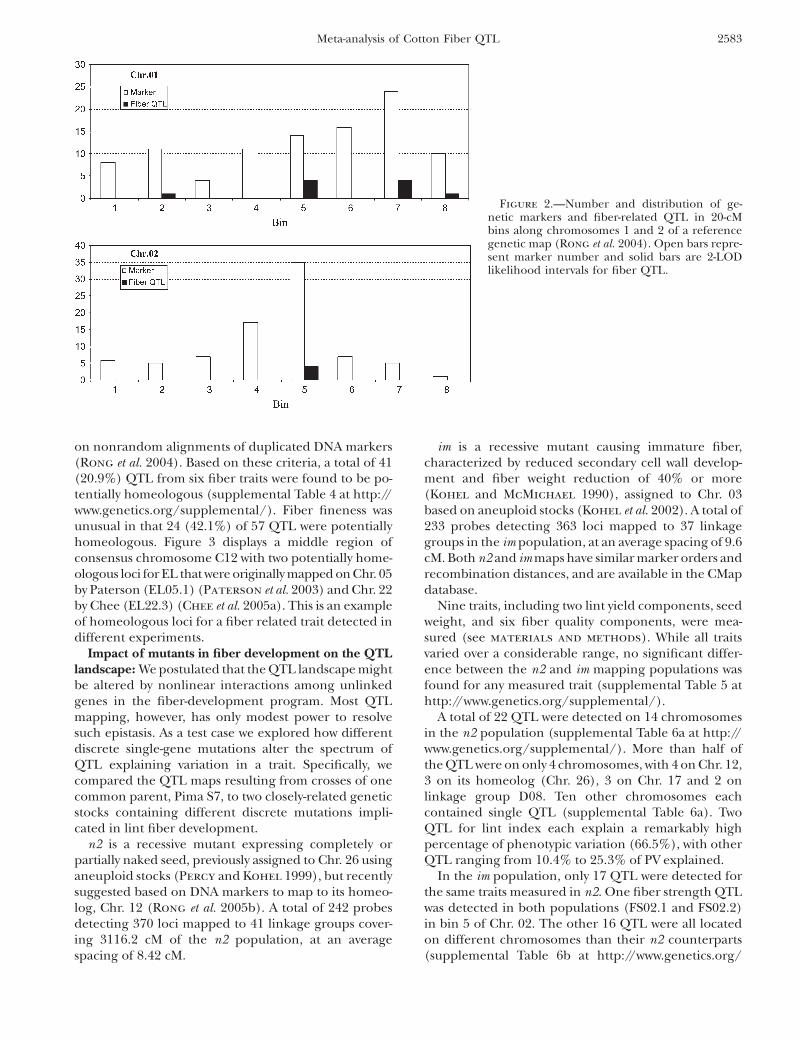
When each chromosome was divided into bins of20 cM and the center of the QTL likelihood intervalused as the QTL location, fiber-related QTL were foundto be clustered in some chromosomal regions (Fig-ure 2; supplemental Table 2 at http://www.genetics.org/supplemental/). Based on the total of 235 bins acrossthe cotton genome and 196 fiber QTL, the Poisson prob-
ability distribution function indicated that the presenceof three or more QTL in a bin was significantly (P ,
0.05) higher than the random expectation. A total of 87(44.5%) QTL were located in 24 such bins (supplemen-tal Table 2). The three bins with the largest numbers offiber QTL (5 or 6) were on Chr. 17 and linkage groupD08 (2 bins). In no cases were statistically significantQTL clusters found in corresponding regions of home-ologous chromosomes. These clusters are further eluci-dated below as examples of how integration of positional,comparative, expression, and functional data might nar-row the lists of candidate genes that may represent theQTL.
Homology and homeology: Integration of QTL fromdifferent populations into a common map facilitatesexploration of their allelic and homeologous relation-ships, albeit at a level of resolution limited by compar-ative marker densities, variation in recombination ratesin different crosses, variation in gene densities acrossthe genome, and other factors. QTL for the same traitfrom different crosses, that had a likelihood peak withinthe same 20-cM bin, were considered potential alleles(albeit requiring further study to confirm). Consideringthe different fiber-related traits individually, with only amaximum of 57 QTL per trait (FF), the occurrence ofeven 2 QTL in the same bin was statistically unlikely tooccur by chance (at P , 0.05). A total of four suchclusters were found, each comprising 2 QTL for FF(three cases) and EL (one case) (supplemental Table 3at http://www.genetics.org/supplemental/). The 8 QTLcompose 4.1% of the total. All of these clustered QTLwere located in fiber QTL-rich bins identified above(bin 5 of Chr. 02, bin 2 of Chr. 12, bin 6 of Chr. 15 andbin 8 of D08), although these bins collectively composeonly 3.6% of the genome. The two EL QTL in bin 8 ofD08 were detected in the same population (ELD08.3and ELD08.4). However, the members of the three pairsof FF QTL, respectively, were detected in differentexperiments.
Likewise, QTL for the same trait were considered tobe potentially homeologous if their likelihood peaks fellwithin pairs of bins inferred to be homeologous based
TABLE 2
Chi-square test of fiber-related QTL distributed on At and Dt subgenome in three non-mutant populations
Populationa QTL Atb Dtb
Goodness offit to 1:1 Reference
CAMD-E (GH) 3 Sea Island Seaberry (GB) 9 3 6 0.317 Jiang et al. (1998)c
Siv9on (GH) 3 F-177 (GB) 79 36 43 0.431 Paterson et al. (2003)Tamcot 2111 (GH) 3 Pima S6 (GB) 108 45 63 0.083 Chee et al. (2005a,b);
Draye et al. (2005)Total 196 84 112 0.045
a GH, G. hirsutum; GB, G. barbadenseb At, Dt: Tetraploid chromosomes derived from A-genome and D-genome diploid progenitors, respectively.c Four QTL for yield components and one for earliness not included, as discussed in text.
TABLE 3
Chi-square test of the QTL distribution between tetraploidAt and Dt subgenomes for different fiber traits
Traita QTL Atb Dtb Goodness of fit to 1:1
EL 33 15 18 0.6015FC 11 7 4 0.3657FF 57 25 32 0.3538FL 34 17 17 1.0000FS 24 7 17 0.0412FU 21 10 11 0.8273MIC 8 0 8 0.0047SF 8 3 5 0.4795Total 196 84 112 0.0455
a EL, elongation; FC, color; FF, fineness; FL, length; FS,strength; FU, uniformity; MIC, micronaire; SF, short fiber content.
b At, Dt: Tetraploid chromosomes derived from A-genomeand D-genome diploid progenitors, respectively.
2582 J. Rong et al.
on nonrandom alignments of duplicated DNA markers(Rong et al. 2004). Based on these criteria, a total of 41(20.9%) QTL from six fiber traits were found to be po-tentially homeologous (supplemental Table 4 at http://www.genetics.org/supplemental/). Fiber fineness wasunusual in that 24 (42.1%) of 57 QTL were potentiallyhomeologous. Figure 3 displays a middle region ofconsensus chromosome C12 with two potentially home-ologous loci for EL that were originally mapped on Chr. 05by Paterson (EL05.1) (Paterson et al. 2003) and Chr. 22by Chee (EL22.3) (Chee et al. 2005a). This is an exampleof homeologous loci for a fiber related trait detected indifferent experiments.
Impact of mutants in fiber development on the QTLlandscape: We postulated that the QTL landscape mightbe altered by nonlinear interactions among unlinkedgenes in the fiber-development program. Most QTLmapping, however, has only modest power to resolvesuch epistasis. As a test case we explored how differentdiscrete single-gene mutations alter the spectrum ofQTL explaining variation in a trait. Specifically, wecompared the QTL maps resulting from crosses of onecommon parent, Pima S7, to two closely-related geneticstocks containing different discrete mutations impli-cated in lint fiber development.
n2 is a recessive mutant expressing completely orpartially naked seed, previously assigned to Chr. 26 usinganeuploid stocks (Percy and Kohel 1999), but recentlysuggested based on DNA markers to map to its homeo-log, Chr. 12 (Rong et al. 2005b). A total of 242 probesdetecting 370 loci mapped to 41 linkage groups cover-ing 3116.2 cM of the n2 population, at an averagespacing of 8.42 cM.
im is a recessive mutant causing immature fiber,characterized by reduced secondary cell wall develop-ment and fiber weight reduction of 40% or more(Kohel and McMichael 1990), assigned to Chr. 03based on aneuploid stocks (Kohel et al. 2002). A total of233 probes detecting 363 loci mapped to 37 linkagegroups in the im population, at an average spacing of 9.6cM. Both n2 and im maps have similar marker orders andrecombination distances, and are available in the CMapdatabase.
Nine traits, including two lint yield components, seedweight, and six fiber quality components, were mea-sured (see materials and methods). While all traitsvaried over a considerable range, no significant differ-ence between the n2 and im mapping populations wasfound for any measured trait (supplemental Table 5 athttp://www.genetics.org/supplemental/).
A total of 22 QTL were detected on 14 chromosomesin the n2 population (supplemental Table 6a at http://www.genetics.org/supplemental/). More than half ofthe QTL were on only 4 chromosomes, with 4 on Chr. 12,3 on its homeolog (Chr. 26), 3 on Chr. 17 and 2 onlinkage group D08. Ten other chromosomes eachcontained single QTL (supplemental Table 6a). TwoQTL for lint index each explain a remarkably highpercentage of phenotypic variation (66.5%), with otherQTL ranging from 10.4% to 25.3% of PV explained.
In the im population, only 17 QTL were detected forthe same traits measured in n2. One fiber strength QTLwas detected in both populations (FS02.1 and FS02.2)in bin 5 of Chr. 02. The other 16 QTL were all locatedon different chromosomes than their n2 counterparts(supplemental Table 6b at http://www.genetics.org/
Figure 2.—Number and distribution of ge-netic markers and fiber-related QTL in 20-cMbins along chromosomes 1 and 2 of a referencegenetic map (Rong et al. 2004). Open bars repre-sent marker number and solid bars are 2-LODlikelihood intervals for fiber QTL.
Meta-analysis of Cotton Fiber QTL 2583
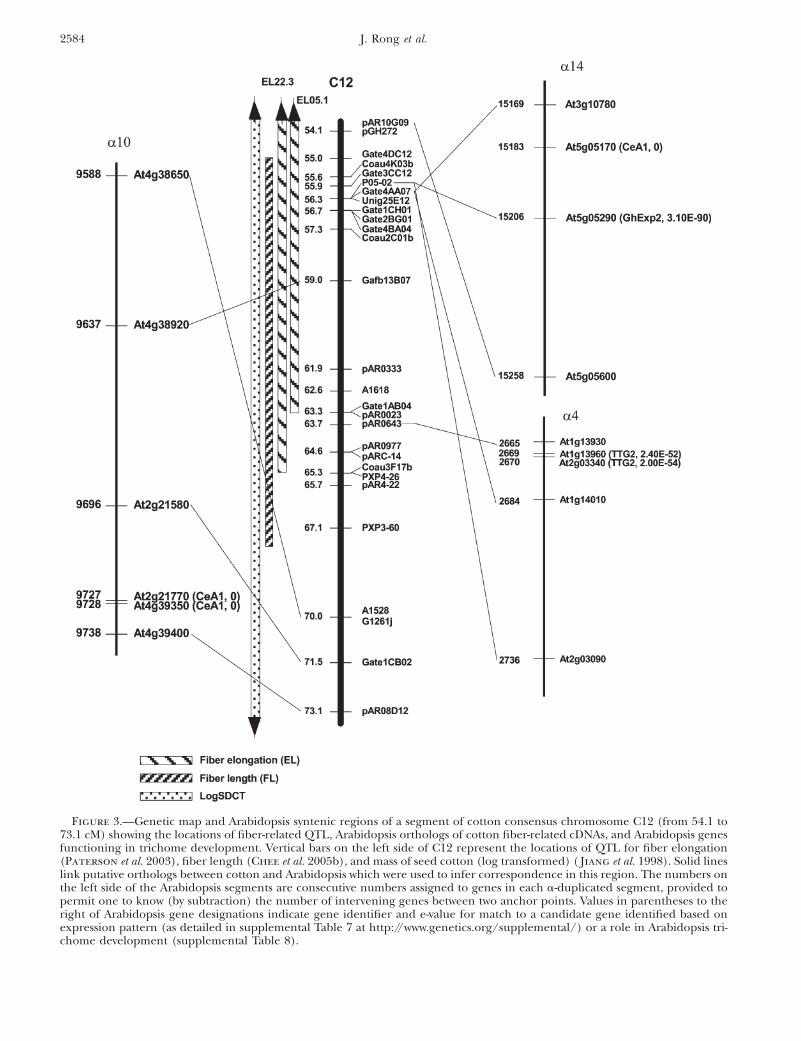
Figure 3.—Genetic map and Arabidopsis syntenic regions of a segment of cotton consensus chromosome C12 (from 54.1 to73.1 cM) showing the locations of fiber-related QTL, Arabidopsis orthologs of cotton fiber-related cDNAs, and Arabidopsis genesfunctioning in trichome development. Vertical bars on the left side of C12 represent the locations of QTL for fiber elongation(Paterson et al. 2003), fiber length (Chee et al. 2005b), and mass of seed cotton (log transformed) ( Jiang et al. 1998). Solid lineslink putative orthologs between cotton and Arabidopsis which were used to infer correspondence in this region. The numbers onthe left side of the Arabidopsis segments are consecutive numbers assigned to genes in each a-duplicated segment, provided topermit one to know (by subtraction) the number of intervening genes between two anchor points. Values in parentheses to theright of Arabidopsis gene designations indicate gene identifier and e-value for match to a candidate gene identified based onexpression pattern (as detailed in supplemental Table 7 at http://www.genetics.org/supplemental/) or a role in Arabidopsis tri-chome development (supplemental Table 8).
2584 J. Rong et al.
supplemental/). For example, no QTL were detected inthe im population on Chr. 12, 17, and 26, which eachhad 3–4 QTL in n2. Chr. 02 and A02, which show 1 or 0QTL in the n2 population, had 4 and 3 QTL in the impopulation, respectively. One large-effect QTL (explain-ing 46.7% of phenotypic variation) was detected onlinkage group D02 for FUD02.1(HVui) in the impopulation, but no corresponding QTL was found inn2. Likewise, the strong QTL for lint index in the n2population showed no corresponding effects in the impopulation, although a relatively weak QTL was de-tected for this trait on Chr. 14 of im. While the two studypopulations were only of sufficient size to detect thelargest-effect segregating QTL, the use of stringent sig-nificance thresholds supports the validity of the QTLthat were claimed, and even these relatively large-effectQTL did not correspond in the two populations. Sincethese two populations involved very similar geneticbackgrounds tested in the same environment, the non-overlapping QTL detected suggest that the differingqualitative mutations cause different pathways and/ornetworks to be limiting factors of fiber quality.
Although only one correspondence (FS02.1 andFS02.2) was found in fiber QTL between the n2 and impopulations, considerable correspondence was foundbetween the n2 or im fiber QTL and those detected inthe three non-mutant populations introduced above.Seven QTL found in the mutant populations map tobins containing QTL for the same fiber traits from otherpopulations, increasing the number of nonrandomQTL clusters from 4 (based only on the three non-mutant populations) to 12 (including the QTL from themutant populations) (supplemental Table 3 at http://www.genetics.org/supplemental/). Clusters had 2 QTLeach, for EL (three clusters), FF (three), FL (two), FS(three), and SF (one) and composed 10.9% (24 of 224)of all fiber QTL. This correspondence to QTL fromother larger populations provides further support forthe validity of at least a subset of the inferred QTL.
The QTL for different fiber characters located on thesame chromosome were generally clustered both in n2and im. For example, 3 QTL on Chr. 26 of n2 were all inbin 5. Four QTL on Chr. 02 of im were centered in bins 4and 5 and 2 more in bin 2 of A02. Many of the QTL,scattered on different bins of Chr. 12 in n2, or differentchromosomes, were clustered with QTL detected in theelite populations. In total, inclusion of mutant popula-tion data increased QTL clusters to 27 bins of 105 QTLvs. 24 bins of 87 QTL based on the elite populationsalone, with 6 bins containing 5–7 fiber QTL on Chr. 1, 2,16, 17, and D08 (2 bins). As found in the three non-mutant populations, no statistically significant QTLclusters occurred in corresponding regions of thehomeologous chromosomes.
Relationships between QTL and fiber-relatedcDNAs/genes: A consensus map that depicts the in-ferred marker arrangement along the genome of the
common ancestor that gave rise to the diploid progen-itors of tetraploid cotton (Rong et al. 2005a) sets thestage for exploring relationships between cotton QTLand genes from taxa such as Arabidopsis that divergedfrom cotton prior to polyploid formation. All QTL fromthe reference map were plotted to corresponding loca-tions on the consensus map. In parallel, we determinedthe locations in the Arabidopsis genome of a total of203 candidate genes representing up to the four bestmatches (at E , 10�10) for each of 78 cDNAs/genesknown from prior published work to be preferentiallyexpressed during cotton lint fiber growth and develop-ment (supplemental Table 7 at http://www.genetics.org/supplemental/, which includes their protein family af-filiation, GenBank accession number, expression pat-tern if known, and citations of published descriptions)and 28 Arabidopsis genes known to be critical for tri-chome and/or fiber development (supplemental Table8). The Arabidopsis orthologs were plotted to their lo-cations in an inferred ancestral gene order that miti-gates the effects of a whole-genome duplication inArabidopsis since its divergence from cotton (i.e., a-duplicated segments). Established syntenic relationshipsbetween cotton and Arabidopsis (Rong et al. 2005a) wereused to determine correspondence between the QTLand candidate genes. QTL locations were plotted basedon the midpoint of the QTL likelihood interval.
We found evidence of a general association betweenconcentrations of candidate genes and cotton fiber-related QTL. Based on synteny inferred using CrimeStatII (Rong et al. 2005a), a significant correlation (r ¼0.260, N ¼ 167, P ¼ 0.0003) was found between QTLnumber in cotton and candidate gene number in Arabi-dopsis. When we considered only the smaller number(largely a subset) of regions of synteny inferred usingFISH (Rong et al. 2005a), the correlation was weaker(r ¼ 0.072, N ¼ 189) and fell short of significance (P ¼0.164). In both CSII and FISH-based models, the cor-relations between numbers of fiber QTL and all (notjust candidate) Arabidopsis genes in the syntenic re-gions detected by CrimestatII or FISH were not signif-icant, suggesting that the relationship is specific to thepopulation of candidate genes. Figure 3 presents anexample in which four fiber-related QTL on a region ofconsensus chromosome C12 ranging from 54.1 to 73.1cM showed synteny with Arabidopsis a 4, 10, and 14duplicated segments. At least six Arabidopsis sequencesin this region matched two fiber-related cDNAs (CesA1and GhExp1) and one Arabidopsis trichome gene (TTG2).Numbers and names of all Arabidopsis orthologs in thesyntenic regions can be found in CMap.
DISCUSSION
The subgenome from the non-fiber-producing an-cestor plays a large role in the genetic control of fiber
Meta-analysis of Cotton Fiber QTL 2585
growth and development in polyploid cotton: Tetra-ploid cottons have higher lint fiber yield and qualitythan the modern descendants of their diploid progen-itors, even in environments to which both have beenadapted by plant breeding ( Jiang et al. 1998). While thegenetic potential for lint fiber development appears tohave been transmitted to tetraploid cottons by theirA genome progenitor, early demonstrations that Dt-subgenome loci have been recruited to contribute fur-ther to lint fiber genetics in tetraploids ( Jiang et al. 1998)gain further support from the more extensive data nowavailable from larger numbers of QTL in additionalindependent populations that include a higher degree ofreplication across environments (Paterson et al. 2003),and advanced-generation studies able to detect QTL ofsmaller phenotypic effect (Chee et al. 2005a,b; Draye
et al. 2005; Lacape et al. 2005). This finding implicates theDt-genome (from the non-fiber-producing ancestor) inevolution of the transgressive fiber quality and yield ofpolyploid cottons relative to their diploid progenitors.
A wealth of research has revealed that gene copiesfrom genome duplications (polyploidizations) experi-ence different fates during their evolution includinggene loss, subfunctionalization, and neofunctionaliza-tion (Lynch and Force 2000; Rastogi and Liberles
2005). This raises the possibility that differential evolu-tion of homeologous fiber-related genes duplicated bypolyploid formation (Cronn et al. 1999) is partly re-sponsible for modern cotton fiber quality. Randomlychosen genes show similar evolutionary rates in the twogenomes before and after polyploid formation. How-ever, lack of knowledge of the gene network involved inlint fiber morphogenesis has precluded study of its spe-cific constituents; perhaps the Dt alleles of key lint fiber-related genes have evolved more quickly. In otherwords, selection may have played a different role ingenetic changes of homeologous genes in At and Dtgenomes, respectively, after reunion of these two ge-nomes �1–2 MYA.
Meta-analysis reveals a complex QTL landscape:Although the sets of QTL found for the same fiber-related trait in different experiments showed nonran-dom correspondence, we were surprised that corre-spondence was only observed for�10% of the total QTLset. Comparison in the same environment of two newmapping populations which shared one identical par-ent, Pima S-7, and had closely related alternative parentsthat differed in carrying specific fiber mutants (n2 andim, respectively) showed virtually no common QTL.However, the validity of many QTL in each of thesepopulations is supported by their correspondence toQTL found in other populations. This suggests that lintfiber development may involve a complex gene networkin which perturbations at one point have widespreadconsequences. The discrete mutants studied may im-pose particularly large perturbations; if small differ-ences in QTL alleles among populations also cause the
same phenomenon, then the generally low level ofcorrespondence among QTL found in different pop-ulations might be explained.
These findings have several implications. In terms ofbasic genetics, the heterogeneity in QTL revealed by thedifferent experiments reiterates the need for study of abroad sampling of germplasm, in a wide range of envi-ronments, to gain a representative picture of the truegenetic complexity of a trait in a particular taxon. Froman applied standpoint, the data highlight the need tovalidate QTL specifically in each genetic background inwhich they are to be deployed (for example, in main-stream breeding).
Members of the lint fiber development networkappear clustered, but cluster members show heteroge-neous phenotypic effects: Several lines of evidence sug-gest nonrandom distribution of genes implicated in lintfiber development. First, 105 (46.9%) lint fiber-relatedQTL were concentrated in 27 bins composing 12.1% ofthe genome. Further, the corresponding regions of theArabidopsis genome also contain nonrandom concen-trations of genes that are implicated in fiber/trichomedevelopment based on either expression patterns orfunctional information.
Most of these clusters show heterogeneous pheno-typic consequences. In only a small subset of cases (12)did more than one QTL affect the same phenotype.Moreover, in many cases the genes were detected indifferent experimental populations, precluding pleiot-ropy as a general explanation (although it may contrib-ute in some cases).
A tantalizing hypothesis is that concentrations of cot-ton lint fiber QTL may represent groups of coordinatelyregulated genes and/or groups of small gene familiesthat have undergone proximal duplication followed bysub- or neofunctionalization. Progress in physical map-ping of several members of the Gossypium genus maypermit this hypothesis to be tested in the near future.
Meta-analysis linked to synteny-based and expression-based information provides clues about specific genesand families involved in QTL networks: Integration ofQTL from individual maps using a common referencemap will be helpful to infer possible positional relation-ships to QTL locations on other maps that share someDNA markers with our reference map (Lacape et al.2003, 2005; Shen et al. 2005; Han et al. 2006). For exam-ple, a QTL governing fiber elongation (ELO) (Lacape
et al. 2005) near marker G1058 in Chr. 22 correspondsclosely to a QTL for the same trait (EL22.1) on thereference map, suggesting that these two QTL may bethe same. Similarly, if new QTL were plotted in mapsthat share common markers with this high-density map,it can quickly be determined if they might correspond topreviously identified QTL.
The integration of QTL, discrete mutants, and re-gions syntenic with Arabidopsis in a common map canfacilitate the exploitation of Arabidopsis sequence
2586 J. Rong et al.
information in further study and cloning of fiber genes.Burgeoning information about differential expressionpatterns of cotton genes, together with extensive knowl-edge of the molecular control of epidermal trichomedevelopment in Arabidopsis, provide valuable cluesabout possible cotton genes in the fiber developmentnetwork. The locations of cotton fiber QTL, and in-formation about synteny between cotton and Arabidop-sis, make it possible to begin to search for intersectionsamong these various data types that point to specificgenes as candidates worthy of further functional testingto determine if they are directly responsible for geneticvariation in cotton fiber development.
For example, the collective data in clusters of QTLsuggest numerous candidate genes and possible ap-proaches for advancing progress toward identificationof the causal gene(s), as follows:
The cluster with five fiber QTL in Chr. 17 was ina region ranging from 2.4 to 11.4 cM on bin 1. TheseQTL each are based on different measurements of fiberquality, and reported in two different studies ½FS17.1and FC17.1 (Paterson et al. 2003) and FL17.1, FU17.1,and MIC17.1 (Chee et al. 2005a,b; Draye et al. 2005)�.The region harboring these QTL showed synteny(identified by both CrimestatII and FISH) with Arabi-dopsis duplications a03 and a21. Gene At4g18780 ina21 is CelA1 (E ¼ 0) and two Arabidopsis genes(At1g12560 and At1g62980) in a03 are members ofthe expansin gene family (best matching AtEXP7, E ,
1E-154 and AtEXP18, E , 6E-156) involved in Arabi-dopsis trichome development.
In linkage group D08, 11 of 22 fiber QTL wereclustered in bins 3 and 8. QTL in bin 3 are ELD08.2,FLD08.1(HVsl2.5,HVuhm,Lw), FUD08.1(HVui), SFD08.1(HVsfc, SFCn), FSD08.2(STR), and FFD08.2, and dis-tributed from 40.3 to 53.1 cM, a marker-sparse segment.Except for FSD08.2 (STR) reported by ( Jiang et al.1998), all others were detected in advanced backcrosspopulations (Chee et al. 2005a,b; Draye et al. 2005). NoQTL were found in the homeologous region on Chr. 05.These QTL were located in a region (D05.153) showingsynteny with a segment of Arabidopsis duplication a5where four candidate genes were found including pa-ralogs (At1g80350 and At1g80360, E¼ 8E-118 and 1.4E-56, respectively) of fra2, and homologs (At1g15690 andAt1g79840, E ¼ 4.8E-97 and 0) of proton-translocatingpyrophosphatase (Ppase) and a homeobox protein(GhHox1). Another 5 fiber-related QTL on D08 werelocated in a region of bin 8 from 140.3 to 157.4 cM. Allfive QTL were found in advanced backcross populations(Chee et al. 2005a,b; Draye et al. 2005), including threefiber length loci, FLD08.2 (HVsl2.5, HVuhm, Lw),FUD08.2 (HVui), and SFD08.2 (HVsfc), and two fiberelongation loci, ELD08.3 and ELD08.4. The regionshowed synteny with part of a07 (D07.160) and one ofthe Arabidopsis genes, At4g09820, is the paralog ofEGL3 (E , 1.5E-38).
We thank numerous colleagues for valuable assistance and sugges-tions, and the United States–Israel Binational Agricultural Researchand Development Fund (US-2506-94R to A.H.P. and Y.S.), theBOYSCAST program of the Department of Science and Technology,India (to V.N.W.), United States Department of Agriculture NationalResearch Initiative (02-01412 to A.H.P.), the National Science Foun-dation Plant Genome Research Program (DBI-9872630, DBI-0211700to A.H.P. and J.F.W.), the Fonds National belge pour la RechercheScientifique (research associate grant to X.D.), the Texas and GeorgiaAgricultural Experiment Stations, Texas Higher Education Coordi-nating Board, Cotton Incorporated, and United States Department ofAgriculture–Initiative for Future Agriculture and Food Systems (00-52100-9685 to A.H.P., P.W.C., J.R.G., O.L.M., C.W.S.) for financialsupport.
LITERATURE CITED
Arcade, A., A. Labourdette, M. Falque, B. Mangin, F. Chardon
et al., 2004 BioMercator: integrating genetic maps and QTL to-wards discovery of candidate genes. Bioinformatics 20: 2324–2326.
Benton, M. J., 1993 The Fossil Record, Ed. 2. Chapman & Hall,New York.
Bowers, J. E., B. A. Chapman, J. Rong and A. H. Paterson,2003 Unravelling angiosperm genome evolution by phyloge-netic analysis of chromosomal duplication events. Nature 422:433–438.
Calabrese, P. P., S. Chakravarty and T. J. Vision, 2003 Fast iden-tification and statistical evaluation of segmental homologies incomparative maps. Bioinformatics 19(Suppl. 1): i74–i80.
Chee, P., X. Draye, C. Jiang, L. Decanini, T. Delmonte et al.,2005a Molecular dissection of interspecific variation between Gos-sypium hirsutum and G. barbadense (cotton) by a backcross-self ap-proach: I. Fiber elongation. Theor. Appl. Genet. 111: 757–763.
Chee, P., X. Draye, C.-X. Jiang, L. Decanini, T. Delmonte et al.,2005b Molecular dissection of phenotypic variation betweenGossypium hirsutum and Gossypium barbadense (cotton) by abackcross-self approach: III. Fiber length. Theor. Appl. Genet.111: 772–781.
Churchill, G. A., and R. W. Doerge, 1994 Empirical threshold val-ues for quantitative triat mapping. Genetics 138: 963–971.
Cronn, R. C., R. L. Small and J. F. Wendel, 1999 Duplicated genesevolve independently after polyploid formation in cotton. Proc.Natl. Acad. Sci. USA 96: 14406–14411.
Draye, X., P. Chee, C. Jiang, L. Decanini, T. Delmonte et al.,2005 Molecular dissection of interspecific variation betweenGossypium hirsutum and G. barbadense (cotton) by a backcross-selfapproach: II. Fiber fineness. Theor. Appl. Genet. 111: 764–771.
Frary, A., T. C. Nesbitt, A. Frary, S. Grandillo, E. v. d. Knaap et al.,2000 fw2.2: A quantitative trait locus key to the evolution of to-mato fruit size. Science 289: 85–88.
Han, Z., C. Wang, X. Song, W. Guo, J. Gou et al., 2006 Char-acteristics, development and mapping of Gossypium hirsutum de-rived EST-SSRs in allotetraploid cotton. Theor. Appl. Genet. 112:430–439.
Jiang, C., R. J. Wright, S. S. Woo, T. A. DelMonte and A. H.Paterson, 2000 QTL analysis of leaf morphology in tetraploidGossypium (cotton). Theor. Appl. Genet. 100: 409–418.
Jiang, C. X., R. J. Wright, K. El-Zik and A. H. Paterson, 1998 Poly-ploid formation created unique avenues for response to selectionin Gossypium (cotton). Proc. Natl. Acad. Sci. USA 95: 4419–4424.
Kohel, R. J., and S. C. McMichael, 1990 Immature fiber mutant ofupland cotton. Crop Sci. 30: 419–421.
Kohel, R. J., D. M. Stelly and J. Yu, 2002 Tests of six cotton (Gos-sypium hirsutum L.) mutants for association with aneuploids. J.Hered. 93: 130–132.
Lacape, J.-M., T. B. Nguyen, S. Thibivilliers, B. Bojinov, B.Courtois et al., 2003 A combined RFLP-SSR-AFLP map of tet-raploid cotton based on a Gossypium hirsutum 3 Gossypium barba-dense backcross population. Genome 46: 612–626.
Lacape, J.-M., T.-B. Nguyen, B. Courtois, J.-L. Belot, M. Giband
et al., 2005 QTL analysis of cotton fiber quality using multiple
Meta-analysis of Cotton Fiber QTL 2587
Gossypium hirsutum x Gossypium barbadense backcross generations.Crop Sci. 45: 123–140.
Lander, E. S., and D. Botstein, 1989 Mapping mendelian factorsunderlying quantitative traits using RFLP linkage maps. Genetics121: 185–199.
Levine, N., 2002 CrimeStat: A spatial statistics program for the anal-ysis of crime incident locations (v 2.0). Ned Levine & Associates,Houston, TX, and the National Institute of Justice, Washington,DC.
Lin, Z., D. He, X. Zhang, Y. Nie, X. Guo et al., 2005 Linkage mapconstruction and mapping QTL for cotton fibre quality usingSRAP, SSR and RAPD. Plant Breed. 124: 180–187.
Lynch, M., and A. Force, 2000 The probability of duplicate genepreservation by subfunctionalization. Genetics 154: 459–473.
May, O. L., and T. J. Wofford, 2000 Breeding transformed cottonexpressing enhanced fiber strength. J. New Seeds 2: 1–13.
Mei, M., N. H. Syed, W. Gao, P. M. Thaxton, C. W. Smith et al.,2004 Genetic mapping and QTL analysis of fiber-related traitsin cotton (Gossypium). Theor. Appl. Genet. 108: 280–291.
Paterson, A. H., E. S. Lander, J. D. Hewitt, S. Peterson, S. E.Lincoln et al., 1988 Resolution of quantitative traits into Men-delian factors by using a complete linkage map of restriction frag-ment length polymorphisms. Nature 335: 721–726.
Paterson, A. H., J. W. DeVerna, B. Lanini and S. D. Tanksley,1990 Fine mapping of quantitative trait loci using selected over-lapping recombinant chromosomes, in an interspecies cross oftomato. Genetics 124: 735–742.
Paterson, A. H., Y. Saranga, M. Menz, C. X. Jiang and R. J. Wright,2003 QTL analysis of genotype x environment interactions af-fecting cotton fiber quality. Theor. Appl. Genet. 106: 384–396.
Percy, R. G., and R. J. Kohel, 1999 Qualitative Genetics, pp. 319–360 in Cotton: Origin, History, Technology, and Production, edited byC. W. Smith and J. T. Cothren. John Wiley & Sons, Hoboken, NJ.
Rastogi, S., and D. Liberles, 2005 Subfunctionalization of dupli-cated genes as a transition state to neofunctionalization. BMCEvol. Bio. 5: 28.
Rong, J., C. Abbey, J. E. Bowers, C. L. Brubaker, C. Chang et al.,2004 A 3347-locus genetic recombination map of sequence-tagged sites reveals features of genome organization, transmis-sion and evolution of cotton (Gossypium). Genetics 166: 389–417.
Rong, J., J. E. Bowers, S. R. Schulze, V. N. Waghmare, C. J. Rogers
et al., 2005a Comparative genomics of Gossypium and Arabidop-sis: Unraveling the consequences of both ancient and recentpolyploidy. Genome Res. 15: 1198–1210.
Rong, J., G. Pierce, V. Waghmare, C. Rogers, A. Desai et al.,2005b Genetic mapping and comparative analysis of seven mu-tants related to seed fiber development in cotton. Theor. Appl.Genet. 111: 1137–1146.
Saha, S., J. Wu, J. N. Jenkins, J. J. C. McCarty, O. A. Gutierrez et al.,2004 Effect of chromosome substitutions from Gossypium barba-dense L. 3–79 into G. hirsutum L. TM-1 on agronomic and fibertraits. J. Cotton Sci. 8: 162–169.
Saranga, Y., M. Menz, C. X. Jiang, R. J. Wright, D. Yakir et al.,2001 Genomic dissection of genotype x environment interac-tions conferring adaptation of cotton to arid conditions. Ge-nome Res. 11: 1988–1995.
Saranga, Y., M. Menz, C. Jiang, R. Wright, D. Yakir et al.,2004 Genetic and physiological dissection of adaptations asso-ciated with cotton productivity under arid conditions. Plant, Celland Environ. 27: 263–277.
Senchina, D. S., I. Alvarez, R. C. Cronn, B. Liu, J. Rong et al.,2003 Rate variation among nuclear genes and the age of poly-ploidy in Gossypium. Mol. Biol. Evol. 20: 633–643.
Shen, X., W. Guo, X. Zhu, Y. Yuan, J. Z. Yu et al., 2005 Molecularmapping of QTLs for fiber qualities in three diverse lines in up-land cotton using SSR markers. Mol. Breed. 15: 169–181.
Udall, J. A., J. M. Swanson, K. Haller, R. A. Rapp, M. E. Sparks
et al., 2006 A global assembly of cotton ESTs. Genome Res.16: 441–450.
Waghmare, V. N., J. Rong, C. J. Rogers, G. J. Pierce, J. F. Wendel
et al., 2005 Genetic mapping of a cross between Gossypium hir-sutum (cotton) and the Hawaiian endemic, Gossypium tomentosum.Theor. Appl. Genet. 111: 665–676.
Wang, S., C. J. Basten and Z. B. Zeng, 2005 Windows QTL Cartog-rapher 2.5. Department of Statistics, North Carolina State Univer-sity, Raleigh, NC.
Wendel, J. F., 1989 New world tetraploid cottons contain old-worldcytoplasm. Proc. Natl. Acad. Sci. USA 86: 4132–4136.
Wright, R., P. Thaxton, K. El-Zik and A. H. Paterson, 1998 D-sub-genome bias of Xcm resistance genes in tetraploid Gossypium(Cotton) suggests that polyploid formation has created novel ave-nues for evolution. Genetics 149: 1987–1996.
Wright, R., P. Thaxton, A. H. Paterson and K. El-Zik, 1999 Mo-lecular mapping of genes affecting pubescence of cotton.J. Heredity 90: 215–219.
Zeng, Z. B., 1994 Precision mapping of quantitative trait loci. Genet-ics 136: 1457–1468.
Communicating editor: J. A. Birchler
2588 J. Rong et al.
Copyright © 2022 FDOKUMEN