Application of a Multipurpose Unequal Probability Stream Survey in the Mid-Atlantic Coastal Plain
13
ABSTRACT: A stratified, spatially balanced sample with unequal probability selection was used to design a multipurpose survey of headwater streams in the Mid-Atlantic Coastal Plain. Objectives for the survey include unbiased estimates of regional stream condi- tions, and adequate coverage of unusual but significant environ- mental settings to support empirical modeling of the factors affecting those conditions. The design and field application of the survey are discussed in light of these multiple objectives. A proba- bility (random) sample of 175 first-order nontidal streams was selected for synoptic sampling of water chemistry and benthic and riparian ecology during late winter and spring 2000. Twenty-five streams were selected within each of seven hydrogeologic subre- gions (strata) that were delineated on the basis of physiography and surficial geology. In each subregion, unequal inclusion proba- bilities were used to provide an approximately even distribution of streams along a gradient of forested to developed (agricultural or urban) land in the contributing watershed. Alternate streams were also selected. Alternates were included in groups of five in each subregion when field reconnaissance demonstrated that primary streams were inaccessible or otherwise unusable. Despite the rejec- tion and replacement of a considerable number of primary streams during reconnaissance (up to 40 percent in one subregion), the desired land use distribution was maintained within each hydroge- ologic subregion without sacrificing the probabilistic design. (KEY TERMS: statistical analysis; stream survey design; sampling design; site replacement; land use; water quality; aquatic ecosys- tems; Atlantic Coastal Plain.) Ator, Scott W., Anthony R. Olsen, Ann M. Pitchford, and Judith M. Denver, 2003. Application of a Multipurpose Unequal Probability Stream Survey in the Mid-Atlantic Coastal Plain. J. of the American Water Resources Association (JAWRA) 39(4):872-885. INTRODUCTION Surveys designed for environmental sampling must often balance competing objectives. Data collected at randomly selected sites (a probability sample) support assessments of regional conditions (population esti- mates) along with accompanying estimates of uncer- tainty. Given the geographic distribution and relative scarcity of some important environmental phenome- na, however, surveys designed using simple random sampling seldom provide data that can support a thorough analysis of the natural or anthropogenic causes of the observed conditions. Such analyses typi- cally require a careful allocation of data-collection sites across the range of environmental settings that are known or suspected to affect measured conditions. Although randomly selected sites may be supplement- ed with targeted (nonrandomly selected) sites to pro- vide additional data for modeling or other purposes, adding large numbers of sites in this manner is inher- ently inefficient. Considering the cost of collecting environmental data, surveys in which the most possi- ble sites can be used for population estimates and sta- tistical models of environmental conditions can be extremely useful for research as well as monitoring. Random site selection (probability sampling) is fun- damental to developing population estimates of regional environmental status; such estimates drawn from nonrandomly selected sites may substantially misrepresent true environmental conditions (Paulsen et al., 1998). The State of Oregon recently (1990) 1 Paper No. 02134 of the Journal of the American Water Resources Association. Discussions are open until February 1, 2004. 2 Respectively, Hydrologist, U.S. Geological Survey, 8987 Yellow Brick Road, Baltimore, Maryland 21237; Environmental Statistician, U.S. Environmental Protection Agency, 200 S.W. 35th Street, Corvallis, Oregon 97333; Environmental Scientist, U.S. Environmental Protection Agency, 944 East Harmon Avenue, Las Vegas, Nevada 89119; and Hydrologist, U.S. Geological Survey, 1289 McD Drive, Dover, Delaware 19901 (E-Mail/Ator: [email protected]). JOURNAL OF THE AMERICAN WATER RESOURCES ASSOCIATION 873 JAWRA JOURNAL OF THE AMERICAN WATER RESOURCES ASSOCIATION AUGUST AMERICAN WATER RESOURCES ASSOCIATION 2003 APPLICATION OF A MULTIPURPOSE UNEQUAL PROBABILITY STREAM SURVEY IN THE MID-ATLANTIC COASTAL PLAIN 1 Scott W. Ator, Anthony R. Olsen, Ann M. Pitchford, and Judith M. Denver 2
Transcript of Application of a Multipurpose Unequal Probability Stream Survey in the Mid-Atlantic Coastal Plain
ABSTRACT: A stratified, spatially balanced sample with unequalprobability selection was used to design a multipurpose survey ofheadwater streams in the Mid-Atlantic Coastal Plain. Objectivesfor the survey include unbiased estimates of regional stream condi-tions, and adequate coverage of unusual but significant environ-mental settings to support empirical modeling of the factorsaffecting those conditions. The design and field application of thesurvey are discussed in light of these multiple objectives. A proba-bility (random) sample of 175 first-order nontidal streams wasselected for synoptic sampling of water chemistry and benthic andriparian ecology during late winter and spring 2000. Twenty-fivestreams were selected within each of seven hydrogeologic subre-gions (strata) that were delineated on the basis of physiographyand surficial geology. In each subregion, unequal inclusion proba-bilities were used to provide an approximately even distribution ofstreams along a gradient of forested to developed (agricultural orurban) land in the contributing watershed. Alternate streams werealso selected. Alternates were included in groups of five in eachsubregion when field reconnaissance demonstrated that primarystreams were inaccessible or otherwise unusable. Despite the rejec-tion and replacement of a considerable number of primary streamsduring reconnaissance (up to 40 percent in one subregion), thedesired land use distribution was maintained within each hydroge-ologic subregion without sacrificing the probabilistic design.(KEY TERMS: statistical analysis; stream survey design; samplingdesign; site replacement; land use; water quality; aquatic ecosys-tems; Atlantic Coastal Plain.)
Ator, Scott W., Anthony R. Olsen, Ann M. Pitchford, and Judith M. Denver,2003. Application of a Multipurpose Unequal Probability Stream Survey in theMid-Atlantic Coastal Plain. J. of the American Water Resources Association(JAWRA) 39(4):872-885.
INTRODUCTION
Surveys designed for environmental sampling mustoften balance competing objectives. Data collected atrandomly selected sites (a probability sample) supportassessments of regional conditions (population esti-mates) along with accompanying estimates of uncer-tainty. Given the geographic distribution and relativescarcity of some important environmental phenome-na, however, surveys designed using simple randomsampling seldom provide data that can support athorough analysis of the natural or anthropogeniccauses of the observed conditions. Such analyses typi-cally require a careful allocation of data-collectionsites across the range of environmental settings thatare known or suspected to affect measured conditions.Although randomly selected sites may be supplement-ed with targeted (nonrandomly selected) sites to pro-vide additional data for modeling or other purposes,adding large numbers of sites in this manner is inher-ently inefficient. Considering the cost of collectingenvironmental data, surveys in which the most possi-ble sites can be used for population estimates and sta-tistical models of environmental conditions can beextremely useful for research as well as monitoring.
Random site selection (probability sampling) is fun-damental to developing population estimates ofregional environmental status; such estimates drawnfrom nonrandomly selected sites may substantiallymisrepresent true environmental conditions (Paulsenet al., 1998). The State of Oregon recently (1990)
1Paper No. 02134 of the Journal of the American Water Resources Association. Discussions are open until February 1, 2004.2Respectively, Hydrologist, U.S. Geological Survey, 8987 Yellow Brick Road, Baltimore, Maryland 21237; Environmental Statistician, U.S.
Environmental Protection Agency, 200 S.W. 35th Street, Corvallis, Oregon 97333; Environmental Scientist, U.S. Environmental ProtectionAgency, 944 East Harmon Avenue, Las Vegas, Nevada 89119; and Hydrologist, U.S. Geological Survey, 1289 McD Drive, Dover, Delaware19901 (E-Mail/Ator: [email protected]).
JOURNAL OF THE AMERICAN WATER RESOURCES ASSOCIATION 873 JAWRA
JOURNAL OF THE AMERICAN WATER RESOURCES ASSOCIATIONAUGUST AMERICAN WATER RESOURCES ASSOCIATION 2003
APPLICATION OF A MULTIPURPOSE UNEQUAL PROBABILITYSTREAM SURVEY IN THE MID-ATLANTIC COASTAL PLAIN1
Scott W. Ator, Anthony R. Olsen, Ann M. Pitchford, and Judith M. Denver2
Used Mac Distiller 5.0.x Job Options
This report was created automatically with help of the Adobe Acrobat Distiller addition "Distiller Secrets v1.0.5" from IMPRESSED GmbH. You can download this startup file for Distiller versions 4.0.5 and 5.0.x for free from http://www.impressed.de. GENERAL ---------------------------------------- File Options: Compatibility: PDF 1.2 Optimize For Fast Web View: Yes Embed Thumbnails: No Auto-Rotate Pages: No Distill From Page: 1 Distill To Page: All Pages Binding: Left Resolution: [ 600 600 ] dpi Paper Size: [ 612 792 ] Point COMPRESSION ---------------------------------------- Color Images: Downsampling: Yes Downsample Type: Average Downsampling Downsample Resolution: 151 dpi Downsampling For Images Above: 227 dpi Compression: Yes Automatic Selection of Compression Type: Yes JPEG Quality: Medium Bits Per Pixel: As Original Bit Grayscale Images: Downsampling: Yes Downsample Type: Average Downsampling Downsample Resolution: 151 dpi Downsampling For Images Above: 227 dpi Compression: Yes Automatic Selection of Compression Type: Yes JPEG Quality: Medium Bits Per Pixel: As Original Bit Monochrome Images: Downsampling: Yes Downsample Type: Average Downsampling Downsample Resolution: 600 dpi Downsampling For Images Above: 900 dpi Compression: Yes Compression Type: CCITT CCITT Group: 4 Anti-Alias To Gray: No Compress Text and Line Art: Yes FONTS ---------------------------------------- Embed All Fonts: Yes Subset Embedded Fonts: Yes Subset When Percent Of Characters Used is Less: 100 % When Embedding Fails: Cancel Job Embedding: Always Embed: [ ] Never Embed: [ ] COLOR ---------------------------------------- Color Management Policies: Color Conversion Strategy: Leave Color Unchanged Intent: Default Device-Dependent Data: Preserve Overprint Settings: No Preserve Under Color Removal and Black Generation: No Transfer Functions: Preserve Preserve Halftone Information: No ADVANCED ---------------------------------------- Options: Use Prologue.ps and Epilogue.ps: No Allow PostScript File To Override Job Options: Yes Preserve Level 2 copypage Semantics: No Save Portable Job Ticket Inside PDF File: No Illustrator Overprint Mode: No Convert Gradients To Smooth Shades: Yes ASCII Format: No Document Structuring Conventions (DSC): Process DSC Comments: No OTHERS ---------------------------------------- Distiller Core Version: 5000 Use ZIP Compression: Yes Deactivate Optimization: No Image Memory: 524288 Byte Anti-Alias Color Images: No Anti-Alias Grayscale Images: No Convert Images (< 257 Colors) To Indexed Color Space: Yes sRGB ICC Profile: sRGB IEC61966-2.1 END OF REPORT ---------------------------------------- IMPRESSED GmbH Bahrenfelder Chaussee 49 22761 Hamburg, Germany Tel. +49 40 897189-0 Fax +49 40 897189-71 Email: [email protected] Web: www.impressed.de
Adobe Acrobat Distiller 5.0.x Job Option File
<< /ColorSettingsFile () /LockDistillerParams false /DetectBlends true /DoThumbnails false /AntiAliasMonoImages false /MonoImageDownsampleType /Average /GrayImageDownsampleType /Average /MaxSubsetPct 100 /MonoImageFilter /CCITTFaxEncode /ColorImageDownsampleThreshold 1.5 /GrayImageFilter /DCTEncode /ColorConversionStrategy /LeaveColorUnchanged /CalGrayProfile (Gray Gamma 2.2) /ColorImageResolution 151 /UsePrologue false /MonoImageResolution 600 /ColorImageDepth -1 /sRGBProfile (sRGB IEC61966-2.1) /PreserveOverprintSettings false /CompatibilityLevel 1.2 /UCRandBGInfo /Remove /EmitDSCWarnings false /CreateJobTicket false /DownsampleMonoImages true /DownsampleColorImages true /MonoImageDict << /K -1 >> /ColorImageDownsampleType /Average /GrayImageDict << /HSamples [ 2 1 1 2 ] /VSamples [ 2 1 1 2 ] /Blend 1 /QFactor 0.9 >> /CalCMYKProfile (U.S. Web Coated (SWOP) v2) /ParseDSCComments false /PreserveEPSInfo false /MonoImageDepth -1 /AutoFilterGrayImages true /SubsetFonts true /GrayACSImageDict << /VSamples [ 2 1 1 2 ] /HSamples [ 2 1 1 2 ] /Blend 1 /QFactor 0.76 /ColorTransform 1 >> /ColorImageFilter /DCTEncode /AutoRotatePages /None /PreserveCopyPage false /EncodeMonoImages true /ASCII85EncodePages false /PreserveOPIComments false /NeverEmbed [ ] /ColorImageDict << /HSamples [ 2 1 1 2 ] /VSamples [ 2 1 1 2 ] /Blend 1 /QFactor 0.9 >> /AntiAliasGrayImages false /GrayImageDepth -1 /CannotEmbedFontPolicy /Error /EndPage -1 /TransferFunctionInfo /Preserve /CalRGBProfile (Adobe RGB (1998)) /EncodeColorImages true /EncodeGrayImages true /ColorACSImageDict << /VSamples [ 2 1 1 2 ] /HSamples [ 2 1 1 2 ] /Blend 1 /QFactor 0.76 /ColorTransform 1 >> /Optimize true /ParseDSCCommentsForDocInfo true /GrayImageDownsampleThreshold 1.5 /MonoImageDownsampleThreshold 1.5 /AutoPositionEPSFiles false /GrayImageResolution 151 /AutoFilterColorImages true /AlwaysEmbed [ ] /ImageMemory 524288 /OPM 0 /DefaultRenderingIntent /Default /EmbedAllFonts true /StartPage 1 /DownsampleGrayImages true /AntiAliasColorImages false /ConvertImagesToIndexed true /PreserveHalftoneInfo false /CompressPages true /Binding /Left >> setdistillerparams << /PageSize [ 576.0 792.0 ] /HWResolution [ 600 600 ] >> setpagedevice
began using a probability survey to estimate spawn-ing habitat for coho salmon (Jacobs and Cooney, 1995;Paulsen et al., 1998). The survey revealed that fishcounts at nonrandomly selected sites since 1950 hadbeen overestimating the naturally spawning coho pop-ulation by a factor of three to five. The nonrandomlyselected sites had been assumed to represent allspawning habitat, but actually represented only thebest 20 to 30 percent. Coastal sport and commercialcoho fisheries were closed after these results becameavailable, and the State began investing in salmonrestoration (Jacobs and Cooney, 1995; Paulsen et al.,1998).
Although individual random samples may containbias, random sampling provides some assurance thatselected sites represent the intended conditions byminimizing this bias in the survey design. In a ran-dom sampling approach, each potential sampling loca-tion within the population of interest has a known,nonzero probability of being selected for the survey. Insimple random selection, these probabilities are equalfor all potential sites (Cochran, 1977). Because of thepractical problems inherent in defining all potentialsampling sites within a continuous resource, sites forenvironmental sampling are often selected from arandomly located uniform grid over the study area(Messer et al., 1988; Scott, 1990; Stevens, 1997; Olsenet al., 1998). For environmental assessments, much ofthe expected variability in the observed conditionsmay often be attributable to one or more geographicvariables, such as land use, geology, or soil conditions(Hem, 1985; Krebs, 1994; Drever, 1997). In suchcases, stratified random sampling (Cochran, 1977)may be used, in which such variables are used tostratify the population of interest and simple randomsampling is performed within each stratum. Stratifiedrandom sampling was used for ground water qualityassessments in the Potomac River Basin (Gilliom etal., 1995; Gerhart and Brakebill, 1996). A stream sur-vey in the Southern Blue Ridge Mountains wasdesigned by selecting streams in watersheds inter-sected by a randomly located systematic grid of points(Messer et al., 1988). A similar approach was used todesign a stream survey in the Mid-Atlantic andSoutheastern United States (Kaufmann et al., 1991).
Population estimates can be extrapolated directlyfrom observations at randomly selected sites. Theseestimates are computed using weights that are theinverse of the inclusion probabilities, and are equiva-lent to the number of sites in the target populationthat are represented by each site in the sample (Kauf-mann et al., 1991). For example, the number of popu-lation sites with some attribute (such as a streamconcentration above or below some level) can be esti-mated as the sum of the weights of the sampled sites
with that attribute (Kaufmann et al., 1991). If s1, s2, ..., sn is a stream sample selected according to adesign with inclusion probabilities π(s) and jointinclusion probabilities π(s, t), an unbiased estimatorof the population mean is given by
where z(si) is data value for stream si, and the pair-wise inclusion probability is π(s, t) = (n - 1) π(s)π(t)/n(D. L. Stevens, personal communication). The vari-ance estimator for ZT is then
where VSRS(z/π) is the usual estimator of the popula-tion variance for a simple random sample (SRS)design applied to z(si)/π(si) (D. L. Stevens, personalcommunication). Further details on the estimation ofweighted population statistics are available in Kauf-mann et al. (1991) and Diaz-Ramos et al. (1996). Inthe special case of simple random selection, weightsare equal for all sampled sites.
Although probability sampling is important for theassessment of regional conditions, the application ofsurveys designed using simple random sampling isoften limited for evaluating and fully analyzing thenatural or human processes affecting the observedconditions. Simple random sampling may yield fewsamples from environmental settings that are associ-ated with important observed conditions but are oflimited spatial extent. For example, in a hypotheticalstudy area that is 6 percent urban, a simple randomsample of 100 sites will contain (on average) only sixsites in urban areas. This sample will be useful forcharacterizing conditions over the entire study area,but estimates of conditions in urban areas will havelarge associated uncertainties. Stratification mayimprove these estimates, although simple randomsampling within strata will not ensure that samplesare evenly distributed geographically (spatially bal-anced). On average, simple random samples will bedistributed spatially according to the distribution ofthe population (although any specific sample may dif-fer substantially from this distribution). Generalizedrandom tessellation stratified (GRTS) sampling is oneapproach that may be used to substantially improve
JAWRA 874 JOURNAL OF THE AMERICAN WATER RESOURCES ASSOCIATION
ATOR, OLSEN, PITCHFORD, AND DENVER
ˆ ( )( )
zz s
sTi
ii
n=
=∑ π1
ˆ ˆ ( )( )
( )( )
( )
( )
( )( )
( / )
V Zz s
s nz s
s
z s
s
nn
z ss
znV z
IRS Ti
ii
i
ij
j
j
i
iiSRS
( ) =
−
−
=−
−
=
∑ ∑
∑
≠π π π
π ππ
2
1
2
11
1
(1)
(2)
spatial balance among random samples (Stevens,1997; Stevens and Olsen, 1999). This technique pro-vides the added advantage of improved precision esti-mates for variables with a spatial pattern. Randomselection within grid cells (Scott, 1990) may also beused to improve spatial balance.
Targeted site selection on the basis of scientificjudgment is often used for investigating the naturalor anthropogenic causes of environmental conditions.In such observational studies, sites are selected non-randomly to ensure they include certain unique set-tings or conditions of interest or are distributed acrossthe entire range of environmental conditions underinvestigation. Although sampling only targeted set-tings can be efficient, detailed prior knowledge of theentire range of environmental conditions in the popu-lation of interest is required (Buck et al., 2000). Anonrandom selection of stream sites across a gradientof watershed development was used to assess theeffects of urban development on stream ecology in theBoston area, Massachusetts (Robinson et al., 2000).Liu et al. (2000) used nonrandom selection of data col-lection sites across a wide range of land use and geo-logic settings to maximize their ability to detect andquantify the effects of these variables on streamchemistry in the Chesapeake Bay watershed.
Unequal probability sampling was developed tocombine the benefits of randomized and targeted sam-pling designs. In this approach, survey sites areselected randomly to allow for probabilistic regionalassessments (with known certainties), however, theinclusion probabilities for each potential site in thepopulation are adjusted to ensure that sites in theresulting survey meet some desired distribution.Unequal inclusion probabilities provide for an appro-priate allocation of samples and ensure that they canbe used to estimate regional conditions (Stevens andOlsen, 1999). If the environmental gradient or vari-able used to define the unequal probabilities is relat-ed to the measured response, these populationestimates will be more precise than those based onsimple random sampling. Otherwise, the populationestimates will be less precise (D. L. Stevens, personalcommunication). Larsen et al. (1994) used unequalprobability sampling in a survey of northeasternlakes in which one objective was to ensure that lakesof all area classes would be included. Olsen et al.(1998) used an unequal probability approach to ran-domly select approximately equal numbers of lakesfor sediment sampling in Vermont (274 potentialsites) and New Hampshire (516 potential sites). Herli-hy et al. (2000) used a similar approach to design asurface water network in the Mid-Atlantic UnitedStates in which sites were evenly distributed amongfirst-, second-, and third-order streams.
This paper describes the design and field applica-tion of a stratified GRTS survey with unequal proba-bility selection (within strata) of first-order streams inthe Mid-Atlantic Coastal Plain (Figure 1). The ratio-nale and approach for the survey design are dis-cussed, along with the results of field reconnaissanceand the replacement of streams not suitable for sam-pling. The resulting survey is evaluated in light of themultiple objectives for data collected from surveystreams. The distribution of land uses and other geo-graphic variables is graphically compared amongwatersheds of sampled streams, selected streams, andthe entire population of first-order Coastal Plainstreams to evaluate the effectiveness of the survey atproviding estimates of regional stream ecology andwater quality. The distribution of survey streams isalso evaluated to ensure adequate coverage of a rangeof environmental settings to support empirical model-ing of factors affecting those regional conditions. Thispaper is intended for environmental scientists andmanagers tasked with conducting similar multipur-pose surveys while balancing financial and/or site-access limitations.
BACKGROUND
The Mid-Atlantic Coastal Plain stream survey wasdeveloped for two purposes (Pitchford et al., 2000): (1)to support the development of landscape indicatormodels for benthic ecological conditions and for con-centrations of pesticides and nutrients in groundwater discharging to small streams, and (2) to esti-mate the ecological and water quality conditions of allfirst-order streams in the Mid-Atlantic Coastal Plain.Landscape indicator models are based on analyses ofrelations among geographic variables (such as landuse, geology, and soils), aquatic ecology, and base flowwater quality. These empirical models summarizeimportant biophysical and geographic variables in agiven area to provide an initial estimate of environ-mental conditions (Kepner et al., 1995; Jones et al.,2001). Landscape indicator model developmentrequires the collection of data across the entire rangeof intensity of the various geographic variables to beincluded in the models. Benthic ecology and base flowwater quality sampling to support these objectiveswas conducted on survey streams during late winterand spring 2000.
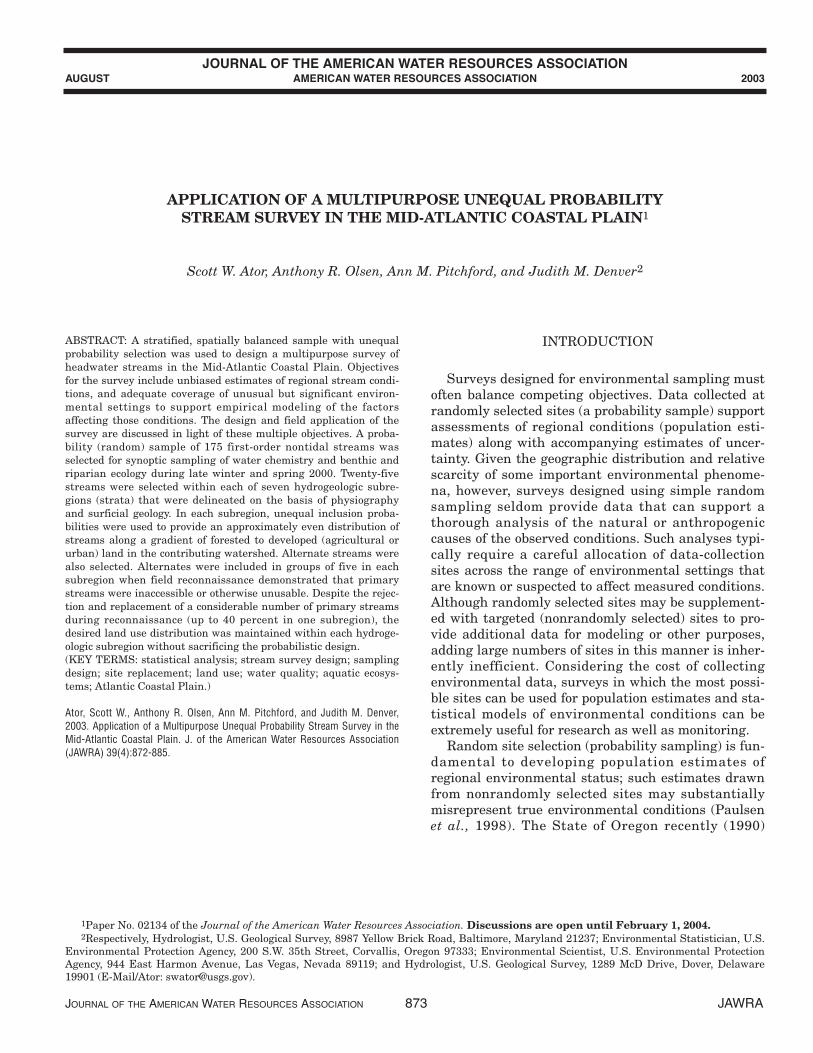
The Mid-Atlantic Coastal Plain (Figure 1) includesparts of the Coastal Plain Physiographic Province(Fenneman and Johnson, 1946) in the eastern UnitedStates, including parts of Delaware, Maryland, NewJersey, North Carolina, Pennsylvania, Virginia, andthe District of Columbia. The 114,000-km2 (square
JOURNAL OF THE AMERICAN WATER RESOURCES ASSOCIATION 875 JAWRA
APPLICATION OF A MULTIPURPOSE UNEQUAL PROBABILITY STREAM SURVEY IN THE MID-ATLANTIC COASTAL PLAIN
kilometer) area has a humid, temperate climate andis mostly flat and low lying, particularly along themargins of the Atlantic Ocean and inland estuarieslike Chesapeake Bay and Pamlico Sound (Verdin,1997). Some areas of the Coastal Plain have consider-able relief, particularly along the western margin atthe Fall Line (Figure 1). The Coastal Plain is under-lain primarily by unconsolidated siliciclastic sedi-ments that vary texturally both laterally andvertically, and form an alternating series of aquifersand leaky confining units (Trapp, 1992). Land cover inthe Coastal Plain is primarily forested (40 percent),agricultural (29 percent), or wetlands (20 percent).Only 6 percent of the study area is urban, mainlyalong the Fall Line (Vogelmann et al., 1998).
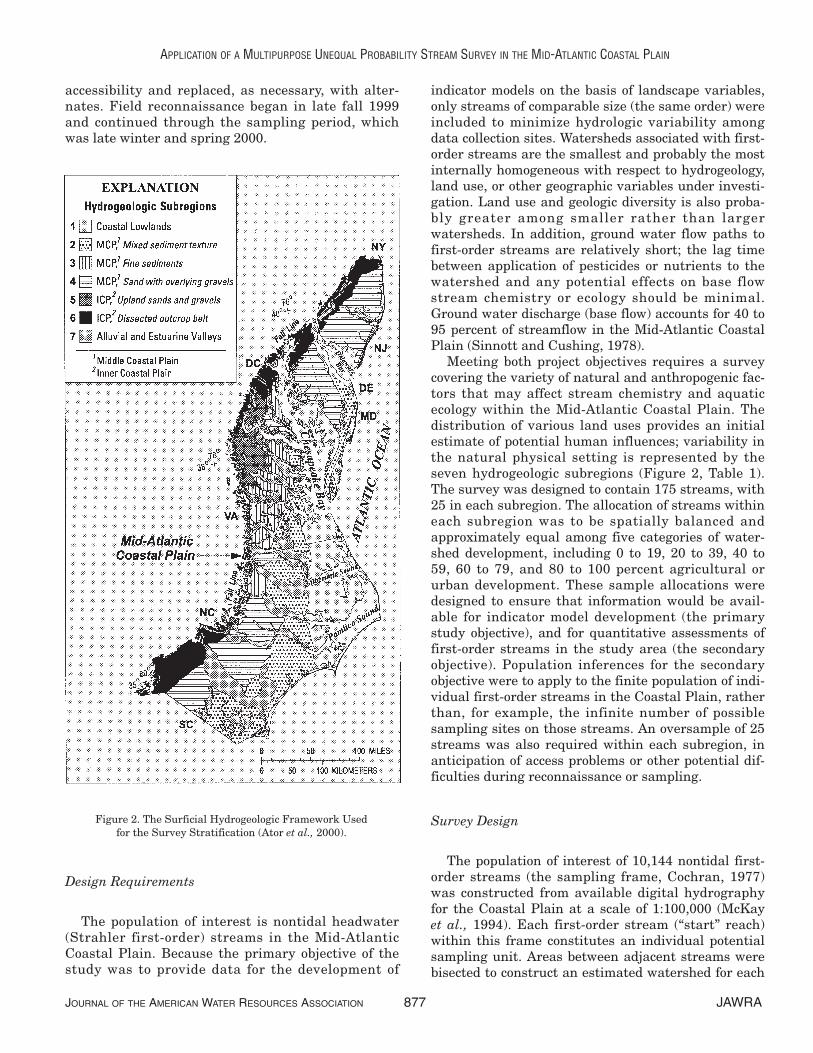
The development of stream networks and shallowground water resources in the Mid-Atlantic CoastalPlain is controlled primarily by the variable topogra-phy and texture of surficial and near surface sedi-ments. A surficial hydrogeologic framework wasdeveloped for the Coastal Plain to represent this vari-ability on a regional scale (Ator et al., 2000). Sevendistinct subregions (Figure 2, Table 1) were delineat-ed, within which the natural physical features con-trolling the movement of chemicals into shallowground water and small streams are relatively homo-geneous or, in some cases, consistently heterogeneous.The subregions represent areas of similar geology(primarily unconsolidated siliciclastic sediments)along a continuum of sediment textures and physiog-raphy (Ator et al., 2000). A review of previously col-lected data in the study area suggested that shallowground water quality is significantly different amongthe more distinct and homogeneous subregions, butparticularly variable among subregions with mixedhydrogeologic settings (Ator et al., 2000).
METHODS
Streams were selected for the survey from amongthe more than 10,000 first-order streams in the Mid-Atlantic Coastal Plain using a probability samplingapproach. Survey design requirements were deter-mined on the basis of the objectives, constraints, andcontext of the survey. The primary objective of land-scape indicator development required a uniform dis-tribution of sampled streams along a gradient ofwatershed land use within each of the seven hydroge-ologic subregions. This was achieved with an unequal-probability survey by watershed land use, andresulted in unequal weights for use in statistical pop-ulation estimates (the secondary objective). Primarystreams were evaluated in the field for suitability and
JAWRA 876 JOURNAL OF THE AMERICAN WATER RESOURCES ASSOCIATION
ATOR, OLSEN, PITCHFORD, AND DENVER
Figure 1. The Mid-Atlantic Coastal Plain.
accessibility and replaced, as necessary, with alter-nates. Field reconnaissance began in late fall 1999and continued through the sampling period, whichwas late winter and spring 2000.
Design Requirements
The population of interest is nontidal headwater(Strahler first-order) streams in the Mid-AtlanticCoastal Plain. Because the primary objective of thestudy was to provide data for the development of
indicator models on the basis of landscape variables,only streams of comparable size (the same order) wereincluded to minimize hydrologic variability amongdata collection sites. Watersheds associated with first-order streams are the smallest and probably the mostinternally homogeneous with respect to hydrogeology,land use, or other geographic variables under investi-gation. Land use and geologic diversity is also proba-bly greater among smaller rather than largerwatersheds. In addition, ground water flow paths tofirst-order streams are relatively short; the lag timebetween application of pesticides or nutrients to thewatershed and any potential effects on base flowstream chemistry or ecology should be minimal.Ground water discharge (base flow) accounts for 40 to95 percent of streamflow in the Mid-Atlantic CoastalPlain (Sinnott and Cushing, 1978).
Meeting both project objectives requires a surveycovering the variety of natural and anthropogenic fac-tors that may affect stream chemistry and aquaticecology within the Mid-Atlantic Coastal Plain. Thedistribution of various land uses provides an initialestimate of potential human influences; variability inthe natural physical setting is represented by theseven hydrogeologic subregions (Figure 2, Table 1).The survey was designed to contain 175 streams, with25 in each subregion. The allocation of streams withineach subregion was to be spatially balanced andapproximately equal among five categories of water-shed development, including 0 to 19, 20 to 39, 40 to59, 60 to 79, and 80 to 100 percent agricultural orurban development. These sample allocations weredesigned to ensure that information would be avail-able for indicator model development (the primarystudy objective), and for quantitative assessments offirst-order streams in the study area (the secondaryobjective). Population inferences for the secondaryobjective were to apply to the finite population of indi-vidual first-order streams in the Coastal Plain, ratherthan, for example, the infinite number of possiblesampling sites on those streams. An oversample of 25streams was also required within each subregion, inanticipation of access problems or other potential dif-ficulties during reconnaissance or sampling.
Survey Design
The population of interest of 10,144 nontidal first-order streams (the sampling frame, Cochran, 1977)was constructed from available digital hydrographyfor the Coastal Plain at a scale of 1:100,000 (McKayet al., 1994). Each first-order stream (“start” reach)within this frame constitutes an individual potentialsampling unit. Areas between adjacent streams werebisected to construct an estimated watershed for each
JOURNAL OF THE AMERICAN WATER RESOURCES ASSOCIATION 877 JAWRA
APPLICATION OF A MULTIPURPOSE UNEQUAL PROBABILITY STREAM SURVEY IN THE MID-ATLANTIC COASTAL PLAIN
Figure 2. The Surficial Hydrogeologic Framework Usedfor the Survey Stratification (Ator et al., 2000).
stream, and land cover data from the early 1990s [res-olution, 30 m (meters)] (Vogelmann et al., 1998) wereused to infer the distribution of various land useswithin each watershed. Streams draining watershedssmaller than 1.3 km2 were omitted to minimize theeffects of any inaccuracies in the watershed estima-tion or the original digital hydrography. Streamsdraining watersheds within which at least 20 percentof the area is below 2 m in altitude (Verdin, 1997)were omitted to avoid tidal influence. Watersheds ofthe remaining 10,144 streams in the sampling framerarely exceed 10 km2 in area (median, 3.0 km2; inter-quartile range, 2.3 km2). Watersheds for streamseventually included in the survey were hand delineat-ed on the basis of topography and compared to esti-mated watersheds to evaluate the sensitivity of theoverall survey design to the procedure used for water-shed estimation. The percentage of agricultural orurban development within hand delineated water-sheds is strongly correlated with that of estimatedwatersheds (Spearman’s rho = 0.95, p < 0.0001).
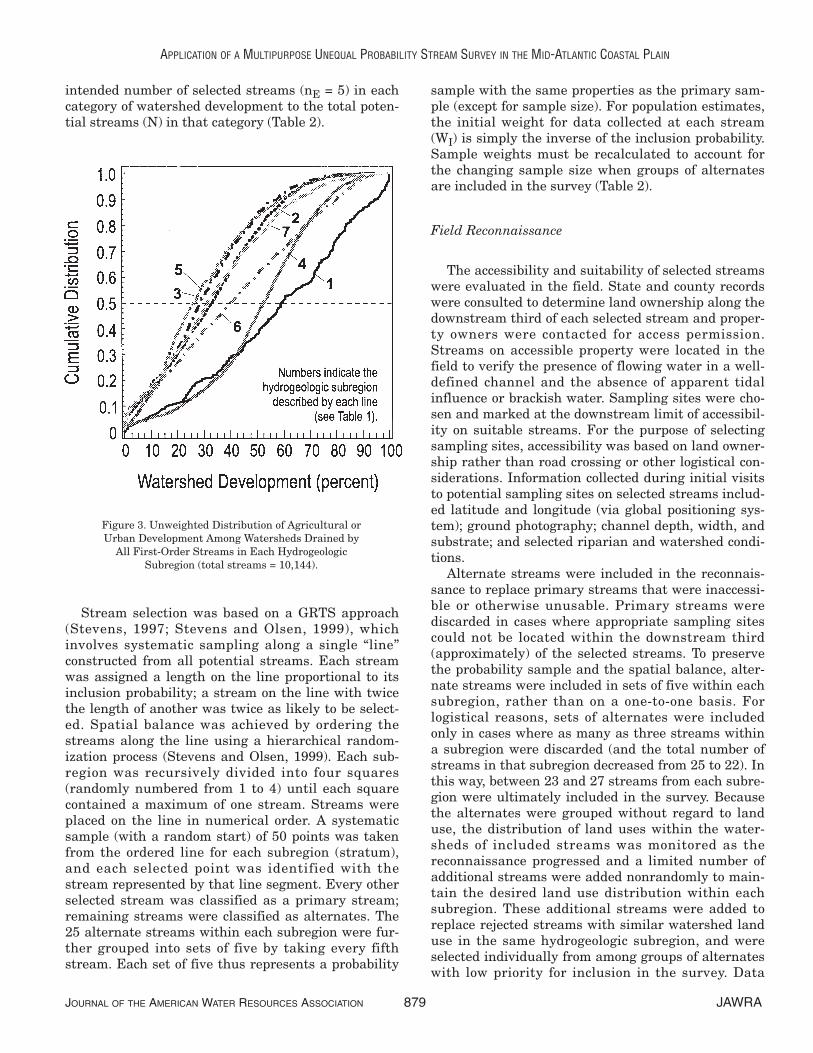
The population of 10,144 first-order streams wasstratified by hydrogeologic subregions that weredefined for the entire Mid-Atlantic Coastal Plain (Fig-ure 2, Table 1). Each stream was assigned to one ofthe seven hydrogeologic subregions; streams in water-sheds covering multiple subregions were assigned tothe subregion covering the largest part. The intensityof urban and agricultural development varies amongsubregions (Table 1). For streams in the population ofinterest, median watershed development (includingurban and agricultural areas), for example, variesfrom about 25 percent in Subregion 5 to about 60 per-cent in Subregion 1 (Figure 3).
A stratified, spatially balanced sample withunequal probability of selection (within each stratum)was used to satisfy the design requirements. Unequalselection probabilities were chosen to result in fivestreams within each of the five categories of water-shed development in each of the seven hydrogeologicsubregions (strata). Within each subregion, the inclu-sion probability for each stream is the ratio of the
JAWRA 878 JOURNAL OF THE AMERICAN WATER RESOURCES ASSOCIATION
ATOR, OLSEN, PITCHFORD, AND DENVER
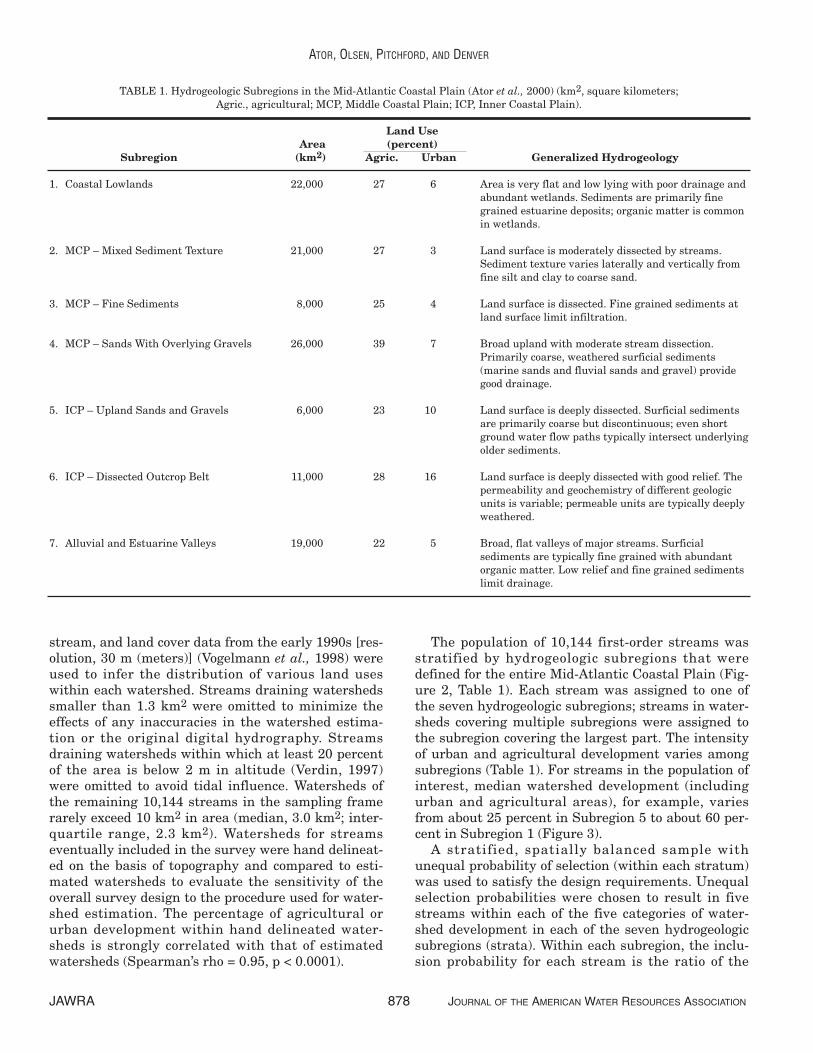
TABLE 1. Hydrogeologic Subregions in the Mid-Atlantic Coastal Plain (Ator et al., 2000) (km2, square kilometers;Agric., agricultural; MCP, Middle Coastal Plain; ICP, Inner Coastal Plain).
Land UseArea (percent)
Subregion (km2) Agric. Urban Generalized Hydrogeology
1. Coastal Lowlands 22,000 27 6 Area is very flat and low lying with poor drainage andabundant wetlands. Sediments are primarily finegrained estuarine deposits; organic matter is commonin wetlands.
2. MCP – Mixed Sediment Texture 21,000 27 3 Land surface is moderately dissected by streams.Sediment texture varies laterally and vertically fromfine silt and clay to coarse sand.
3. MCP – Fine Sediments 8,000 25 4 Land surface is dissected. Fine grained sediments atland surface limit infiltration.
4. MCP – Sands With Overlying Gravels 26,000 39 7 Broad upland with moderate stream dissection.Primarily coarse, weathered surficial sediments (marine sands and fluvial sands and gravel) provide good drainage.
5. ICP – Upland Sands and Gravels 6,000 23 10 Land surface is deeply dissected. Surficial sediments are primarily coarse but discontinuous; even short ground water flow paths typically intersect underlying older sediments.
6. ICP – Dissected Outcrop Belt 11,000 28 16 Land surface is deeply dissected with good relief. The permeability and geochemistry of different geologic units is variable; permeable units are typically deeply weathered.
7. Alluvial and Estuarine Valleys 19,000 22 5 Broad, flat valleys of major streams. Surficial sediments are typically fine grained with abundant organic matter. Low relief and fine grained sediments limit drainage.
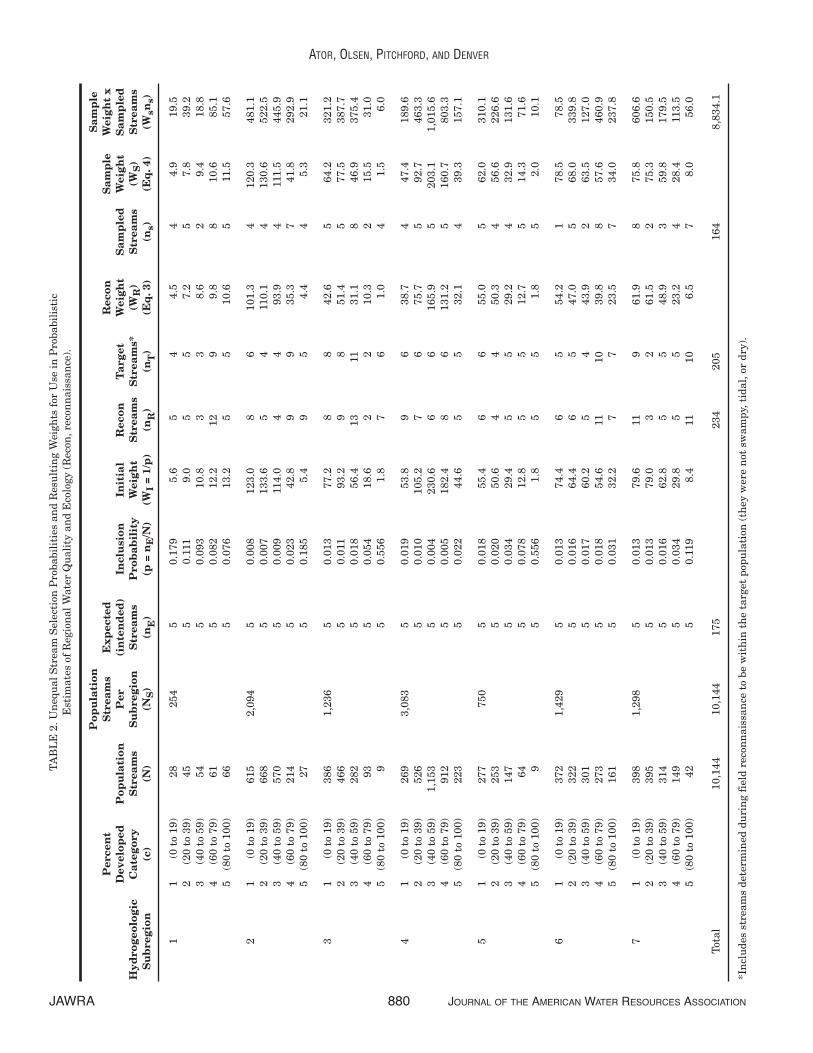
intended number of selected streams (nE = 5) in eachcategory of watershed development to the total poten-tial streams (N) in that category (Table 2).
Stream selection was based on a GRTS approach(Stevens, 1997; Stevens and Olsen, 1999), whichinvolves systematic sampling along a single “line”constructed from all potential streams. Each streamwas assigned a length on the line proportional to itsinclusion probability; a stream on the line with twicethe length of another was twice as likely to be select-ed. Spatial balance was achieved by ordering thestreams along the line using a hierarchical random-ization process (Stevens and Olsen, 1999). Each sub-region was recursively divided into four squares(randomly numbered from 1 to 4) until each squarecontained a maximum of one stream. Streams wereplaced on the line in numerical order. A systematicsample (with a random start) of 50 points was takenfrom the ordered line for each subregion (stratum),and each selected point was identified with thestream represented by that line segment. Every otherselected stream was classified as a primary stream;remaining streams were classified as alternates. The25 alternate streams within each subregion were fur-ther grouped into sets of five by taking every fifthstream. Each set of five thus represents a probability
sample with the same properties as the primary sam-ple (except for sample size). For population estimates,the initial weight for data collected at each stream(WI) is simply the inverse of the inclusion probability.Sample weights must be recalculated to account forthe changing sample size when groups of alternatesare included in the survey (Table 2).
Field Reconnaissance
The accessibility and suitability of selected streamswere evaluated in the field. State and county recordswere consulted to determine land ownership along thedownstream third of each selected stream and proper-ty owners were contacted for access permission.Streams on accessible property were located in thefield to verify the presence of flowing water in a well-defined channel and the absence of apparent tidalinfluence or brackish water. Sampling sites were cho-sen and marked at the downstream limit of accessibil-ity on suitable streams. For the purpose of selectingsampling sites, accessibility was based on land owner-ship rather than road crossing or other logistical con-siderations. Information collected during initial visitsto potential sampling sites on selected streams includ-ed latitude and longitude (via global positioning sys-tem); ground photography; channel depth, width, andsubstrate; and selected riparian and watershed condi-tions.
Alternate streams were included in the reconnais-sance to replace primary streams that were inaccessi-ble or otherwise unusable. Primary streams werediscarded in cases where appropriate sampling sitescould not be located within the downstream third(approximately) of the selected streams. To preservethe probability sample and the spatial balance, alter-nate streams were included in sets of five within eachsubregion, rather than on a one-to-one basis. Forlogistical reasons, sets of alternates were includedonly in cases where as many as three streams withina subregion were discarded (and the total number ofstreams in that subregion decreased from 25 to 22). Inthis way, between 23 and 27 streams from each subre-gion were ultimately included in the survey. Becausethe alternates were grouped without regard to landuse, the distribution of land uses within the water-sheds of included streams was monitored as thereconnaissance progressed and a limited number ofadditional streams were added nonrandomly to main-tain the desired land use distribution within eachsubregion. These additional streams were added toreplace rejected streams with similar watershed landuse in the same hydrogeologic subregion, and wereselected individually from among groups of alternateswith low priority for inclusion in the survey. Data
JOURNAL OF THE AMERICAN WATER RESOURCES ASSOCIATION 879 JAWRA
APPLICATION OF A MULTIPURPOSE UNEQUAL PROBABILITY STREAM SURVEY IN THE MID-ATLANTIC COASTAL PLAIN
Figure 3. Unweighted Distribution of Agricultural orUrban Development Among Watersheds Drained by
All First-Order Streams in Each HydrogeologicSubregion (total streams = 10,144).
JAWRA 880 JOURNAL OF THE AMERICAN WATER RESOURCES ASSOCIATION
ATOR, OLSEN, PITCHFORD, AND DENVERT
AB
LE
2. U
neq
ual
Str
eam
Sel
ecti
on P
roba
bili
ties
an
d R
esu
ltin
g W
eigh
ts f
or U
se in
Pro
babi
list
icE
stim
ates
of
Reg
ion
al W
ater
Qu
alit
y an
d E
colo
gy (
Rec
on, r
econ
nai
ssan
ce).
Pop
ula
tion
Sam
ple
Per
cen
tS
trea
ms
Exp
ecte
dR
econ
Sam
ple
Wei
ght
xD
evel
oped
Pop
ula
tion
Per
(in
ten
ded
)In
clu
sion
Init
ial
Rec
onT
arge
tW
eigh
tS
amp
led
Wei
ght
Sam
ple
dH
ydro
geol
ogic
Cat
egor
yS
trea
ms
Su
bre
gion
Str
eam
sP
rob
abil
ity
Wei
ght
Str
eam
sS
trea
ms*
(WR
)S
trea
ms
(WS
)S
trea
ms
Su
bre
gion
(c)
(N)
(NS
)(n
E)
(p =
nE
/N)
(WI
= 1/
p)
(nR
)(n
T)
(Eq
. 3)
(ns)
(Eq
. 4)
(Wsn
s)
11
(0 t
o 19
)28
254
50.
179
5.6
54
4.5
44.
919
.52
(20
to 3
9)45
50.
111
9.0
55
7.2
57.
839
.23
(40
to 5
9)54
50.
093
10.8
33
8.6
29.
418
.84
(60
to 7
9)61
50.
082
12.2
129
9.8
810
.685
.15
(80
to 1
00)
665
0.07
613
.25
510
.65
11.5
57.6
21
(0 t
o 19
)61
52,
094
50.
008
123.
08
610
1.3
412
0.3
481.
12
(20
to 3
9)66
85
0.00
713
3.6
54
110.
14
130.
652
2.5
3(4
0 to
59)
570
50.
009
114.
04
493
.94
111.
544
5.9
4(6
0 to
79)
214
50.
023
42.8
99
35.3
741
.829
2.9
5(8
0 to
100
)27
50.
185
5.4
95
4.4
45.
321
.1
31
(0 t
o 19
)38
61,
236
50.
013
77.2
88
42.6
564
.232
1.2
2(2
0 to
39)
466
50.
011
93.2
98
51.4
577
.538
7.7
3(4
0 to
59)
282
50.
018
56.4
1311
31.1
846
.937
5.4
4(6
0 to
79)
935
0.05
418
.62
210
.32
15.5
31.0
5(8
0 to
100
)9
50.
556
1.8
76
1.0
41.
56.
0
41
(0 t
o 19
)26
93,
083
50.
019
53.8
96
38.7
447
.418
9.6
2(2
0 to
39)
526
50.
010
105.
27
675
.75
92.7
463.
33
(40
to 5
9)1,
153
50.
004
230.
66
616
5.9
520
3.1
1,01
5.6
4(6
0 to
79)
912
50.
005
182.
48
613
1.2
516
0.7
803.
35
(80
to 1
00)
223
50.
022
44.6
55
32.1
439
.315
7.1
51
(0 t
o 19
)27
775
05
0.01
855
.46
655
.05
62.0
310.
12
(20
to 3
9)25
35
0.02
050
.64
450
.34
56.6
226.
63
(40
to 5
9)14
75
0.03
429
.45
529
.24
32.9
131.
64
(60
to 7
9)64
50.
078
12.8
55
12.7
514
.371
.65
(80
to 1
00)
95
0.55
61.
85
51.
85
2.0
10.1
61
(0 t
o 19
)37
21,
429
50.
013
74.4
65
54.2
178
.578
.52
(20
to 3
9)32
25
0.01
664
.46
547
.05
68.0
339.
83
(40
to 5
9)30
15
0.01
760
.25
443
.92
63.5
127.
04
(60
to 7
9)27
35
0.01
854
.611
1039
.88
57.6
460.
95
(80
to 1
00)
161
50.
031
32.2
77
23.5
734
.023
7.8
71
(0 t
o 19
)39
81,
298
50.
013
79.6
119
61.9
875
.860
6.6
2(2
0 to
39)
395
50.
013
79.0
32
61.5
275
.315
0.5
3(4
0 to
59)
314
50.
016
62.8
55
48.9
359
.817
9.5
4(6
0 to
79)
149
50.
034
29.8
55
23.2
428
.411
3.5
5(8
0 to
100
)42
50.
119
8.4
1110
6.5
78.
056
.0
Tota
l10
,144
10,1
4417
523
420
516
48,
834.
1
*In
clu
des
stre
ams
dete
rmin
ed d
uri
ng
fiel
d re
con
nai
ssan
ce t
o be
wit
hin
th
e ta
rget
pop
ula
tion
(th
ey w
ere
not
sw
ampy
, tid
al, o
r dr
y).
from these additional streams will be useful only forthe planned statistical models relating stream ecologyand water quality to land use and other geographicvariables; they will be assigned a weight of zero forprobabilistic assessments of conditions in the studyarea.
RESULTS AND DISCUSSION
Although a considerable number of randomlyselected streams were rejected during field reconnais-sance, the unequal probability approach to primaryand alternate selection and replacement was effectiveat designing a stream survey useful for meeting bothproject objectives. Maps of rejected streams werereviewed to identify any obvious geographical biasesin the stream replacement during the reconnaissance.The distribution of land uses among watersheds of all
sampled streams was examined to ensure data wouldbe collected across the range of environmental set-tings that occur within the study area, and therebysupport the development of meaningful landscapeindicators. Weights were adjusted due to the rejectionand replacement of primary streams; the weighteddistribution of land uses and other watershed vari-ables was also compared to their distribution in theentire population of 10,144 first-order streams toidentify any biases that may affect the usefulness ofdata from the survey for assessing regional condi-tions.
Of the 175 primary streams selected for the survey,48 (27 percent) were rejected during the field recon-naissance (Table 3). Fifty-nine alternate streams weresubsequently included as replacements, but 22 ofthese were also rejected. More than a third (39 per-cent) of rejected streams were inaccessible, typicallybecause access permission was denied (Table 4). A fewstreams were inaccessible because of safety concerns
JOURNAL OF THE AMERICAN WATER RESOURCES ASSOCIATION 881 JAWRA
APPLICATION OF A MULTIPURPOSE UNEQUAL PROBABILITY STREAM SURVEY IN THE MID-ATLANTIC COASTAL PLAIN
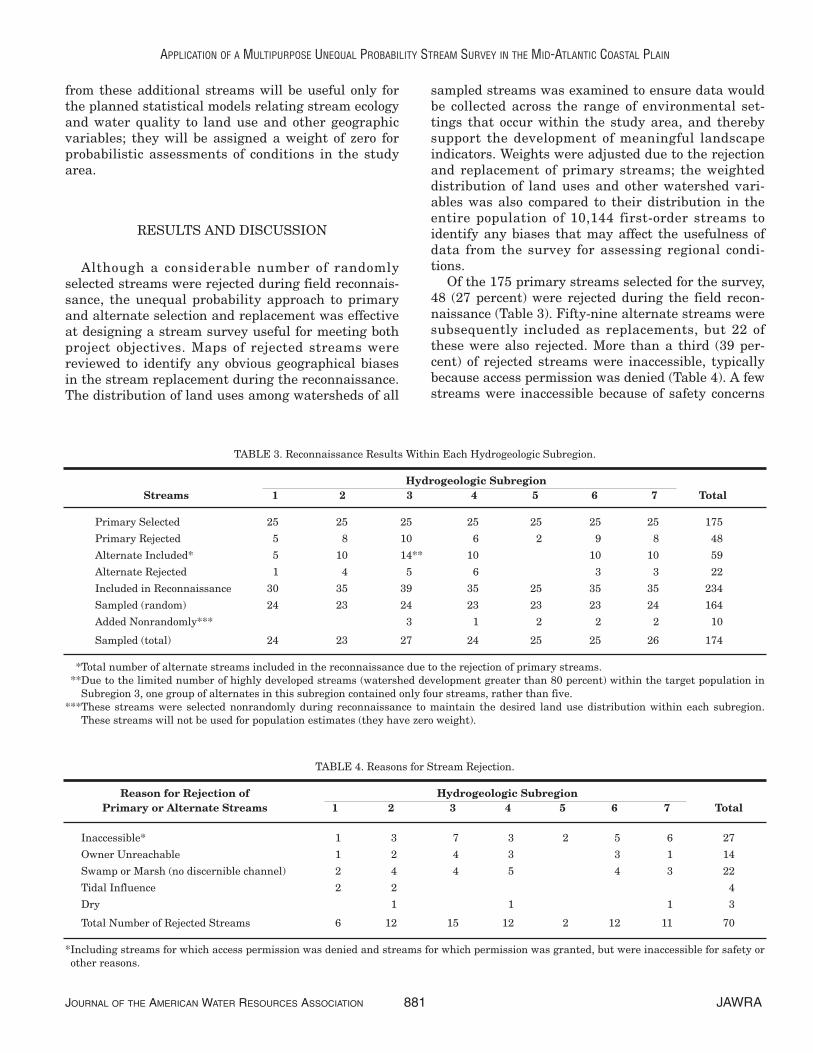
TABLE 3. Reconnaissance Results Within Each Hydrogeologic Subregion.
Hydrogeologic SubregionStreams 1 2 3 4 5 6 7 Total
Primary Selected 25 25 25 25 25 25 25 175
Primary Rejected 5 8 10 6 2 9 8 48
Alternate Included* 5 10 14** 10 10 10 59
Alternate Rejected 1 4 05 6 3 3 22
Included in Reconnaissance 30 35 39 35 25 35 35 234
Sampled (random) 24 23 24 23 23 23 24 164
Added Nonrandomly*** 03 1 2 2 2 10
Sampled (total) 24 23 27 24 25 25 26 174
***Total number of alternate streams included in the reconnaissance due to the rejection of primary streams.***Due to the limited number of highly developed streams (watershed development greater than 80 percent) within the target population in ***Subregion 3, one group of alternates in this subregion contained only four streams, rather than five.***These streams were selected nonrandomly during reconnaissance to maintain the desired land use distribution within each subregion. ***These streams will not be used for population estimates (they have zero weight).
TABLE 4. Reasons for Stream Rejection.
Reason for Rejection of Hydrogeologic SubregionPrimary or Alternate Streams 1 2 3 4 5 6 7 Total
Inaccessible* 01 03 07 03 02 05 06 27
Owner Unreachable 01 02 04 03 03 01 14
Swamp or Marsh (no discernible channel) 02 04 04 05 04 03 22
Tidal Influence 02 02 04
Dry 01 01 01 03
Total Number of Rejected Streams 06 12 15 12 02 12 11 70
*Including streams for which access permission was denied and streams for which permission was granted, but were inaccessible for safety or *other reasons.
or other reasons – one stream was selected in an areaof active timber harvesting and another two wereselected within the high security area of a stateprison. Fourteen streams were rejected because prop-erty owners could not be contacted for access permis-sion or land ownership was unclear. No geographictrend is apparent among streams rejected due to inac-cessibility or difficulty contacting property owners.
More than 40 percent of unusable streams (29 of70) were rejected because field reconnaissance orother investigations showed that they were tidallyinfluenced, dry, or swampy, with no discernible chan-nel (Table 4). Tidal influence was encountered only inthe most low-lying subregions (Subregions 1 and 2), incoastal areas of Delaware and North Carolina.Swampy conditions affected streams in most subre-gions, reflecting the fact that poor drainage occurslocally throughout the Coastal Plain, regardless of theregional hydrogeology. Some of these streams mighthave been suitable for inclusion in the survey if sam-pling had been planned for a drier season, such aslate summer. Dry streams were rare, as might beexpected considering the scale of the data from whichthe sampling frame was constructed (1:100,000) andthe seasons during which the reconnaissance was con-ducted (winter and spring). One stream was appar-ently dry because of recently installed artificialdrainage.
Alternate streams were required to replace rejectedstreams in most hydrogeologic subregions, but thesuccess of the field reconnaissance was somewhatvariable among subregions (Table 3). In most subre-gions (Subregions 2, 4, 6, and 7), 35 streams (25 pri-mary and 10 alternate) were ultimately included inthe reconnaissance and 11 or 12 of these were reject-ed. Ten of the 25 primary streams in Subregion 3were rejected, typically because of access problems ordifficulty contacting property owners (Table 4). Five ofthe 14 alternates included to replace streams in Sub-region 3 were also rejected. Only one group of fivealternate streams was needed in Subregion 1; noalternates were necessary in Subregion 5. In spite ofthe considerable number of rejected primary streams,only 10 nonrandomly selected streams were added tomaintain the desired land-use distribution within thefinal survey.
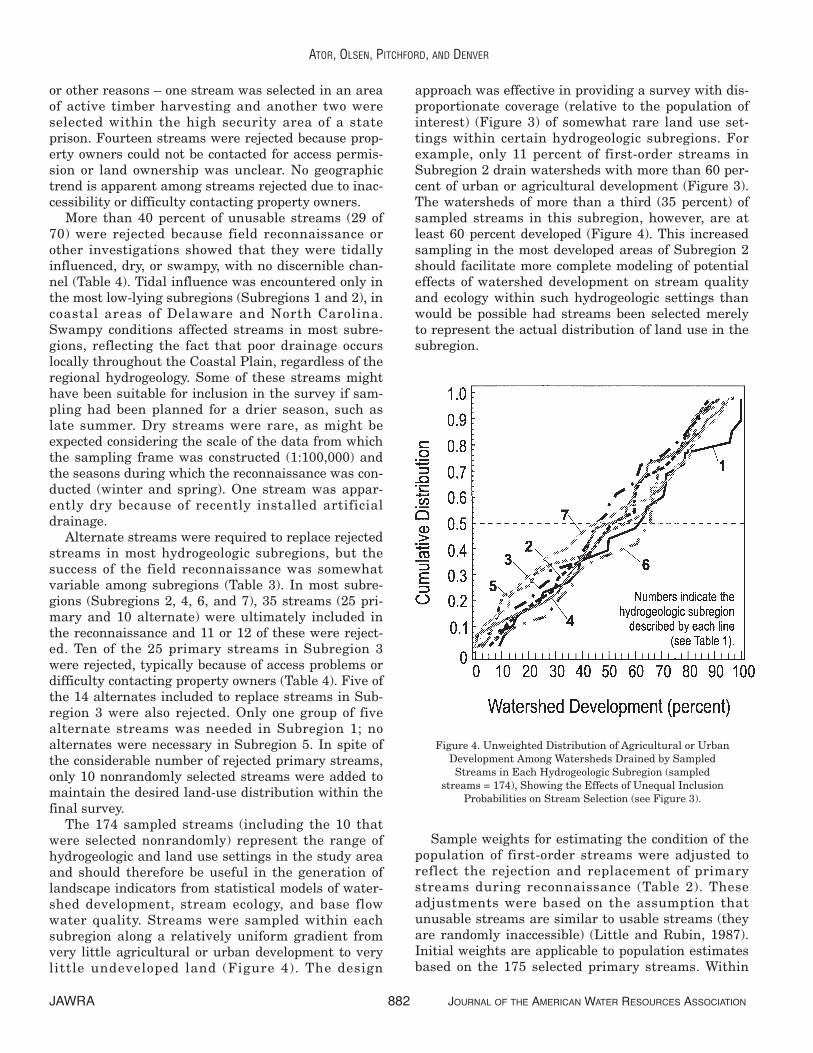
The 174 sampled streams (including the 10 thatwere selected nonrandomly) represent the range ofhydrogeologic and land use settings in the study areaand should therefore be useful in the generation oflandscape indicators from statistical models of water-shed development, stream ecology, and base flowwater quality. Streams were sampled within eachsubregion along a relatively uniform gradient fromvery little agricultural or urban development to verylittle undeveloped land (Figure 4). The design
approach was effective in providing a survey with dis-proportionate coverage (relative to the population ofinterest) (Figure 3) of somewhat rare land use set-tings within certain hydrogeologic subregions. Forexample, only 11 percent of first-order streams inSubregion 2 drain watersheds with more than 60 per-cent of urban or agricultural development (Figure 3).The watersheds of more than a third (35 percent) ofsampled streams in this subregion, however, are atleast 60 percent developed (Figure 4). This increasedsampling in the most developed areas of Subregion 2should facilitate more complete modeling of potentialeffects of watershed development on stream qualityand ecology within such hydrogeologic settings thanwould be possible had streams been selected merelyto represent the actual distribution of land use in thesubregion.
Sample weights for estimating the condition of thepopulation of first-order streams were adjusted toreflect the rejection and replacement of primarystreams during reconnaissance (Table 2). Theseadjustments were based on the assumption thatunusable streams are similar to usable streams (theyare randomly inaccessible) (Little and Rubin, 1987).Initial weights are applicable to population estimatesbased on the 175 selected primary streams. Within
JAWRA 882 JOURNAL OF THE AMERICAN WATER RESOURCES ASSOCIATION
ATOR, OLSEN, PITCHFORD, AND DENVER
Figure 4. Unweighted Distribution of Agricultural or UrbanDevelopment Among Watersheds Drained by SampledStreams in Each Hydrogeologic Subregion (sampled
streams = 174), Showing the Effects of Unequal InclusionProbabilities on Stream Selection (see Figure 3).
each subregion, these initial weights (WI) wereadjusted on the basis of the number of streams even-tually included in the reconnaissance (nR), as well asthe population streams per subregion (NS) (Table 2)
The adjusted “reconnaissance” weights (WR) can beused to estimate the number of streams in the popula-tion that are inaccessible and the number that aresuitable for sampling. A final adjustment was com-pleted for use in estimating watershed characteristicson the basis of data collected at sampled streams. The“sample” weight (WS) is computed within each subre-gion from the reconnaissance weight (WR), the num-ber of sampled streams (nS), and the number of targetstreams (nT) (Table 2)
Target streams include those that were verified dur-ing field reconnaissance as part of the intended targetpopulation (they were not swampy, tidal, or dry). Theproduct of sampled streams (nS) and weights (WS)provides an estimate of the number of target streamswithin each hydrogeologic subregion and land use cat-egory. The sum of these products indicates thatapproximately 8,834 (87 percent) of the 10,144streams included in the sampling frame are withinthe intended population of nontidal, flowing streamsin a well defined channel (Table 2).
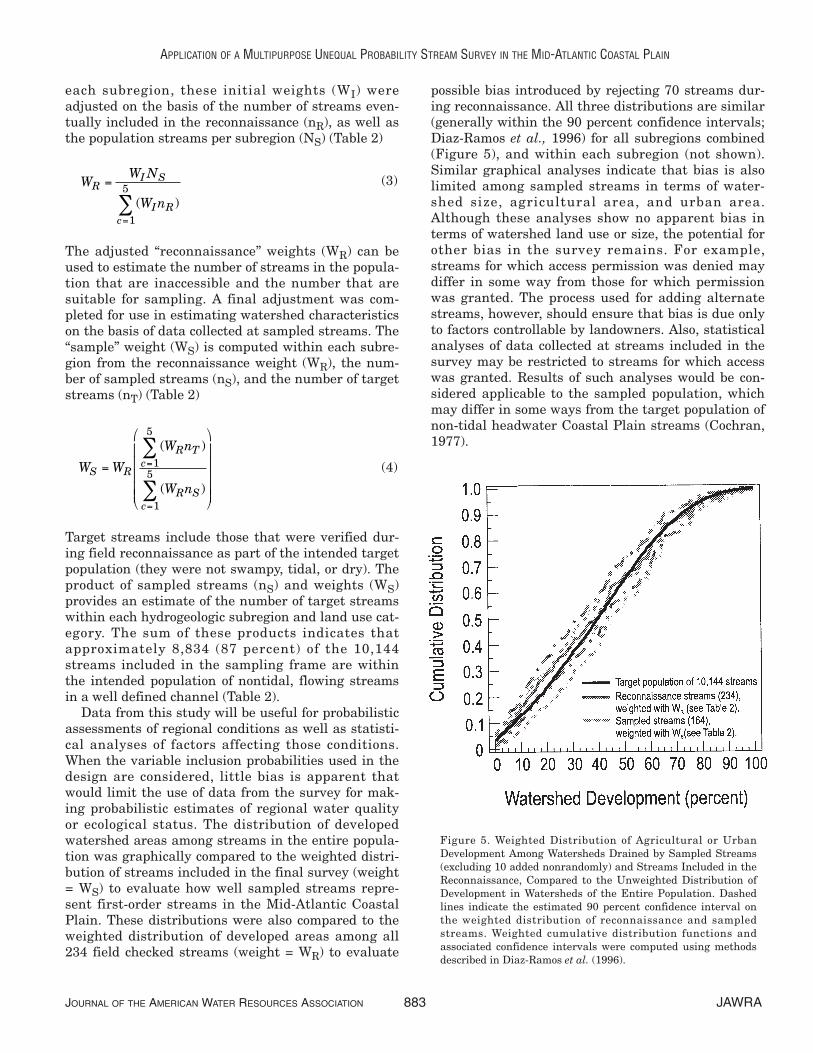
Data from this study will be useful for probabilisticassessments of regional conditions as well as statisti-cal analyses of factors affecting those conditions.When the variable inclusion probabilities used in thedesign are considered, little bias is apparent thatwould limit the use of data from the survey for mak-ing probabilistic estimates of regional water qualityor ecological status. The distribution of developedwatershed areas among streams in the entire popula-tion was graphically compared to the weighted distri-bution of streams included in the final survey (weight= WS) to evaluate how well sampled streams repre-sent first-order streams in the Mid-Atlantic CoastalPlain. These distributions were also compared to theweighted distribution of developed areas among all234 field checked streams (weight = WR) to evaluate
possible bias introduced by rejecting 70 streams dur-ing reconnaissance. All three distributions are similar(generally within the 90 percent confidence intervals;Diaz-Ramos et al., 1996) for all subregions combined(Figure 5), and within each subregion (not shown).Similar graphical analyses indicate that bias is alsolimited among sampled streams in terms of water-shed size, agricultural area, and urban area.Although these analyses show no apparent bias interms of watershed land use or size, the potential forother bias in the survey remains. For example,streams for which access permission was denied maydiffer in some way from those for which permissionwas granted. The process used for adding alternatestreams, however, should ensure that bias is due onlyto factors controllable by landowners. Also, statisticalanalyses of data collected at streams included in thesurvey may be restricted to streams for which accesswas granted. Results of such analyses would be con-sidered applicable to the sampled population, whichmay differ in some ways from the target population ofnon-tidal headwater Coastal Plain streams (Cochran,1977).
JOURNAL OF THE AMERICAN WATER RESOURCES ASSOCIATION 883 JAWRA
APPLICATION OF A MULTIPURPOSE UNEQUAL PROBABILITY STREAM SURVEY IN THE MID-ATLANTIC COASTAL PLAIN
WW N
W nR
I S
I Rc
=
=∑ ( )
1
5
W W
W n
W nS R
R Tc
R Sc
=
=
=
∑
∑
( )
( )
1
5
1
5 (4)
(3)
Figure 5. Weighted Distribution of Agricultural or UrbanDevelopment Among Watersheds Drained by Sampled Streams(excluding 10 added nonrandomly) and Streams Included in theReconnaissance, Compared to the Unweighted Distribution ofDevelopment in Watersheds of the Entire Population. Dashedlines indicate the estimated 90 percent confidence interval onthe weighted distribution of reconnaissance and sampledstreams. Weighted cumulative distribution functions and associated confidence intervals were computed using methodsdescribed in Diaz-Ramos et al. (1996).
SUMMARY AND IMPLICATIONS
An unequal probability survey of 175 first-orderstreams was designed in the Mid-Atlantic CoastalPlain to provide data for multiple objectives. Designrequirements for the survey included spatial balanceand uniform distribution along a gradient of water-shed land use within each of seven hydrogeologic sub-regions. Primary survey streams were evaluated inthe field and replaced, as necessary, with alternates.Weights computed for each stream reflect the unequalselection probabilities required for the design as wellas the rejection and replacement of primary streams.The flexible unequal probability design was effectiveat providing a survey suitable for multiple projectobjectives in spite of the rejection and replacement ofa considerable number of primary streams duringfield reconnaissance. Data collected at survey streamswill be useful for probabilistic assessments of regionalconditions with known certainty. At the same time,the survey provides adequate coverage of unusual butpotentially important settings to support empiricalmodeling of factors affecting those measured condi-tions.
Scientists and managers need not always choosebetween competing objectives when designing net-works for environmental sampling. Sample surveyswith unequal inclusion probabilities can be very effec-tive for designing multipurpose surveys for environ-mental sampling, even in cases where one mightexpect some randomly selected sites to be unusable orinaccessible. Despite the rejection and replacement ofa considerable number of primary streams, thedesired land use distribution was maintained in theMid-Atlantic Coastal Plain survey without sacrificingthe probabilistic design. Although randomized sur-veys may always be supplemented with nonrandomlyselected sites to provide additional data for statisticalmodeling or other purposes, adding large numbers ofnonrandomly selected sites is inherently inefficientand may become prohibitively expensive. To maximizethe return on available research or monitoringresources, data from all sampled sites should be use-ful for as many project objectives as possible. Only 10nonrandomly selected streams were necessary to sup-plement the Mid-Atlantic Coastal Plain stream sur-vey; more than two were added in only one subregion.
As with most surveys, the inclusion of accurate andcomplete geographic data in the design of unequal-probability surveys would minimize the need foralternate sites and greatly simplify reconnaissanceand data analysis. Accessibility is a common problemwith randomly selected sites; even if property owner-ship is not an issue, some sites may be unusable forsafety or logistical reasons. The time and expense
devoted to selecting alternates and visiting unusablesites can be minimized, however, by using high quali-ty geographic data in defining the sampling frame.Nearly half of the rejected streams in the Mid-Atlantic Coastal Plain survey were tidally influenced,dry, or too swampy. Site rejections during field recon-naissance may be less problematic in study areas forwhich more accurate, regionally consistent data areavailable for defining the sample frame.
The unequal probability approach is not universal-ly applicable for those tasked with balancing multipleobjectives in designing sampling surveys for environ-mental studies. A major concern arises if the inclu-sion probabilities become exceedingly unequal. Insuch cases, population estimates based on the weight-ed distribution will be dominated by the relatively fewsamples with unusually large weights; variance esti-mates increase as the sample size is effectivelyreduced. Fortunately, this potential problem can beidentified during the design process (rather than afterthe data are collected) and possibly mitigated throughstratification or another design approach. Alterna-tively, a probability survey may be used to addresssome of the project objectives, and supplemented withadditional sites to address remaining objectives.Because these additional sites have no effect on theprobability survey (they have a weight of zero for pop-ulation estimates), they may be added, with consider-ation only of the remaining objectives and availableproject resources. Sites selected for the probabilitysurvey may also prove useful for remaining objectives,thereby limiting the number of required additionalsites.
ACKNOWLEDGMENTS
This work was conducted as part of collaborative researchbetween the U.S. Environmental Protection Agency (USEPA) andthe U.S. Geological Survey (USGS). Joel Blomquist and MarkNardi of the USGS were instrumental in designing the Mid-Atlantic Coastal Plain stream survey, and Rick Ahlin, Joe Beman,Mike Gearheart, Tracy Hancock, Mark Nardi, and other USGS per-sonnel provided significant assistance during reconnaissance.Barbara Rosenbaum of INDUS Corporation and David Cassell ofComputer Science Corporation provided valuable computer sup-port. The authors also wish to thank Phillip Larsen, Maliha Nash,and John Paul of USEPA and three anonymous reviewers for tech-nical comments on this manuscript. Valerie Gaine and Tim Auer ofUSGS provided editorial assistance and help with illustrations(respectively).
The U.S. Environmental Protection Agency, through its Office ofResearch and Development, partially funded and collaborated inthe research described here under Interagency Agreement numberDW 14938535 with the U.S. Geological Survey. It has been subjectto review and approved for publication by USEPA and USGS. Men-tion of trade names or commercial products does not constituteendorsement or recommendation for use.
JAWRA 884 JOURNAL OF THE AMERICAN WATER RESOURCES ASSOCIATION
ATOR, OLSEN, PITCHFORD, AND DENVER
LITERATURE CITED
Ator, S. W., J. M Denver, and T. C. Hancock, 2000. Relating ShallowGround-Water Quality to Surficial Hydrogeology in the Mid-Atlantic Coastal Plain. Proceedings of the National Water-Qual-ity Monitoring Conference. Austin, Texas, pp. 409-423.
Buck, S., W. Dodds, J. Fisher, D. Hart, A. Parker, J. Stevenson, V. Watson, and E. Welch, 2000. Nutrient Criteria TechnicalGuidance Manual – Rivers and Streams. U.S. EnvironmentalProtection Agency EPA/822/B-00/002, 240 pp.
Cochran, W. G., 1977. Sampling Techniques (Third Edition). JohnWiley and Sons, New York, New York, 428 pp.
Diaz-Ramos, S., D. L. Stevens, and A. R. Olsen, 1996. EMAP Statis-tical Methods Manual. U.S. Environmental Protection AgencyEPA/620/R-96/002, 167 pp.
Drever, J. I., 1997. The Geochemistry of Natural Waters (Third Edi-tion). Simon and Shuster, Upper Saddle River, New Jersey, 436pp.
Fenneman, N. M. and D. W. Johnson, 1946. Physical Divisions ofthe United States. U.S. Geological Survey Map, scale1:7,000,000.
Gerhart, J. M. and J. W. Brakebill, 1996. Design of a SamplingStrategy for a Water-Quality Assessment of the Potomac RiverBasin. U.S. Geological Survey Water-Resources InvestigationsReport 96-4034, 31 pp.
Gilliom, R. J., W. M. Alley, and M. E. Gurtz, 1995. Design of theNational Water-Quality Assessment Program – Occurrence andDistribution of Water-Quality Conditions. U.S. Geological Sur-vey Circular 1112, 33 pp.
Hem, J. D., 1985. Study and Interpretation of the Chemical Char-acteristics of Natural Water (Third Edition). U.S. GeologicalSurvey Water-Supply Paper 2254, 263 pp.
Herlihy, A. T., D. P. Larsen, S. G. Paulsen, N. S. Urquhart, and B. J.Rosenbaum, 2000. Designing a Spatially Balanced RandomizedSite Selection Process for Regional Stream Surveys – The EMAPMid-Atlantic Pilot Study. Environmental Monitoring andAssessment 63:95-113.
Jacobs, S. E. and C. X. Cooney, 1995. Improvements of MethodsUsed to Estimate the Spawning Escapement of Oregon CoastalNatural Coho Salmon. Oregon Department of Fish and Wildlife,Portland, Oregon. Discussed in S. G. Paulsen, R. M. Hughes,and D. P. Larsen, 1998. Critical Elements in Describing andUnderstanding Our Nation’s Aquatic Resources. Journal of theAmerican Water Resources Association 34:995-1005.
Jones, K. B., A. C. Neale, M. S. Nash, R. D. Van Remortel, J. D.Wickham, K. H. Riitters, and R. V. O’Neill, 2001. PredictingNutrient and Sediment Loadings to Streams From LandscapeMetrics – A Multiple Watershed Study From the United StatesMid-Atlantic Region. Landscape Ecology 16:301-312.
Kaufmann, P. R., A. T. Herlihy, M. E. Mitch, J. J. Messer, and W. S.Overton, 1991. Stream Chemistry in the Eastern United States:1. Synoptic Survey Design, Acid-Base Status, and Regional Pat-terns. Water Resources Research 27:611-627.
Kepner, W. G., K. B. Jones, D. J. Chaloud, J. D. Wickham, K. H.Riitters, and R. V. O’Neill, 1995. Mid-Atlantic Landscape Indica-tors Project Plan – Environmental Monitoring and AssessmentProgram. U.S. Environmental Protection Agency EPA/620/R-95/003, 37 pp.
Krebs, C. J., 1994. Ecology – The Experimental Analysis of Distri-bution and Abundance (Fourth Edition). Harper Collins, NewYork, New York, 802 pp.
Larsen, D. P., K. W. Thornton, N. S. Uquhart, and S. G. Paulsen,1994. The Role of Sample Surveys for Monitoring the Conditionof the Nation’s Lakes. Environmental Monitoring and Assess-ment 32:101-134.
Little, R. J. and D. B. Rubin, 1987. Statistical Inference With Miss-ing Data. John Wiley and Sons, New York, New York, 278 pp.
Liu, Z.-J., D. E. Weller, D. L. Correll, and T. E. Jordan, 2000.Effects of Land Cover and Geology on Stream Chemistry inWatersheds of Chesapeake Bay. Journal of the American WaterResources Association 36:1349-1365.
McKay, L., S. Hanson, R. Horn, R. Dulaney, A. Cahoon, M. Olsen,and T. Dewald, 1994. The USEPA Reach File Version 3.0 AlphaRelease – Technical Reference. U.S. Environmental ProtectionAgency, Washington, D.C.
Messer, J. J., C. W. Ariss, J. R. Baker, S. V. Drouse, K. N. Eschle-man, A. J. Kinney, W. S. Overton, M. J. Sale, and R. D. Schon-brod, 1988. Stream Chemistry in the Southern Blue Ridge:Feasibility of a Regional Synoptic Sampling Approach. WaterResources Bulletin 24:821-829.
Olsen, A. R., D. L. Stevens, and D. White, 1998. Application ofGlobal Grids to Environmental Sampling. Computing Scienceand Statistics 30:279-284.
Paulsen, S. G., R. M. Hughes, and D. P. Larsen, 1998. Critical Ele-ments in Describing and Understanding Our Nation’s AquaticResources. Journal of the American Water Resources Associa-tion 34:995-1005.
Pitchford, A. M., J. M. Denver, A. R. Olsen, S. W. Ator, S. Cormier,M. S. Nash, and M. H. Mehaffey, 2000. Testing Landscape Indi-cators for Stream Condition Related to Pesticides and Nutrients– Landscape Indicators for Pesticides Study for Mid-AtlanticCoastal Streams. U.S. Environmental Protection AgencyEPA/600/R-00/087, 84 pp.
Robinson, K. W., A. T. Chalmers, J. F. Coles, T. F. Cuffney, G. McMahon, D. B. Smith, and M. J. Zimmerman, 2000. AnIntegrated Approach for Monitoring the Effects of Urbanizationon Stream Quality in New England. [abs.] in Conference Agen-da, Abstracts, and List of Attendees – National Water-QualityMonitoring Conference, Austin, Texas, p. 67.
Scott, J. C., 1990. Computerized Stratified Random Site-SelectionApproaches for Design of a Ground-Water Quality SamplingNetwork. U.S. Geological Survey Water-Resources Investiga-tions Report 90-4101,109 pp.
Sinnott, A. and E.M. Cushing, 1978. Summary Appraisals of theNation’s Ground-Water Resources – Mid-Atlantic Region. U.S.Geological Survey Professional Paper 813-I, 32 pp.
Stevens, D.L., Jr., 1997. Variable Density Grid-Based SamplingDesigns for Continuous Spatial Populations. Envirometrics8:167-195.
Stevens, D. L., Jr. and A. R. Olsen, 1999. Spatially Restricted Sur-veys Over Time for Aquatic Resources. Journal of Agricultural,Biological, and Environmental Statistics 4:415-428.
Trapp, H., Jr., 1992. Hydrogeologic Framework of the NorthernAtlantic Coastal Plain in Parts of North Carolina, Virginia,Maryland, Delaware, New Jersey, and New York. U.S. Geologi-cal Survey Professional Paper 1404-G, 59 pp.
Verdin, K. L., 1997. HYDRO 1K Elevation Derivatives Database:U.S. Geological Survey. Available at http://edcwww.cr.usgs.gov/landdaac/gtopo30/hydro/namerica.thml. Accessed on January 12,1998.
Vogelmann, J. E., T. L. Sohl, P. V. Campbell, and D. M. Shaw. 1998,Regional Land-Cover Characterization Using Landsat andAncillary Sources. Environmental Monitoring and Assessment51:415-428.
JOURNAL OF THE AMERICAN WATER RESOURCES ASSOCIATION 885 JAWRA
APPLICATION OF A MULTIPURPOSE UNEQUAL PROBABILITY STREAM SURVEY IN THE MID-ATLANTIC COASTAL PLAIN