Acoustic Control in A Multipurpose Hall - EMU I-Rep
160
Acoustic Control in A Multipurpose Hall: The Case Study of LaLa Mustafa Pasa Sports Complex, Eastern Mediterranean University, Gazimağusa- North Cyprus Timothy Onosahwo Iyendo Submitted to the Institute of Graduate Studies and Research in partial fulfillment of the requirements for the Degree of Master of Science in Architecture Eastern Mediterranean University September, 2011 Gazimağusa, North Cyprus
-
Upload
khangminh22 -
Category
Documents
-
view
0 -
download
0
Transcript of Acoustic Control in A Multipurpose Hall - EMU I-Rep
Acoustic Control in A Multipurpose Hall: The Case
Study of LaLa Mustafa Pasa Sports Complex,
Eastern Mediterranean University, Gazimağusa-
North Cyprus
Timothy Onosahwo Iyendo
Submitted to the
Institute of Graduate Studies and Research
in partial fulfillment of the requirements for the Degree of
Master of Science
in
Architecture
Eastern Mediterranean University
September, 2011
Gazimağusa, North Cyprus
ii
Approval of the Institute of Graduate Studies and Research
Prof. Dr. Elvan Yılmaz
Director
I certify that this thesis satisfies the requirements of thesis for the degree of Master
of Science in Architecture.
Assoc. Prof. Dr. Özgür Dinçyürek
Chair, Department of Architecture
We certify that we have read this thesis and that in our opinion it is fully adequate in
scope and quality as a thesis for the degree of Master of Science in Architecture.
Prof. Dr. Mesut B. Özdeniz
Supervisor
Examining Committee
1. Prof. Dr. Mesut B. Özdeniz
2. Asst. Prof. Dr. Halil Zafer Alibaba
3. Asst. Prof. Dr. Polat Hançer
iii
ABSTRACT
In recent years, due to tight budgets, a large number of multipurpose halls have been
constructed applying relatively inexpensive materials without regard to planning for
noise control to mitigate loud, unpleasant, unanticipated, or undesired sound.
Consequently, after construction is completed, noise issues are often proven within
the spaces and render the initial purposes of the structure unattainable. In this study
both qualitative and quantitative research methods are used to identify the acoustics
problems, its sources, effects, and control. The research revealed that the Rapid
Speech Transmission Index [RASTI] and Reverberation Time [RT] of the Hall was
0.34 and around 4.5 seconds respectively, which indicated that EMU, LaLa Mustafa
Pasa Hall in North Cyprus is having speech intelligibility and echo problems. The
study would not only edify potentials and professionals on the importance of
acoustics as a major factor in building design, but also address the common solutions
to resolve noise in multipurpose spaces. This multipurpose hall is expected to be used
for various activities such as music functions, sports and speeches. Against this
background the study highlights the fundamentals of sound and room acoustics
including noise from interior and exterior sources as well as looking into the possible
economic solutions that can be taken within the building to attenuate noise.
Suggestions and recommendations to this effect are given at the end of this research
to guide any institution or company and all those who may wish to build a proficient
and acceptable multipurpose hall in the future.
Keywords: Acoustic Control, Room Acoustics, Multipurpose Halls, Reverberation
Time, Echo, Speech Intelligibility.
iv
ÖZ
Son yıllarda düşük bütçeler nedeniyle, birçok çok amaçlı salon, ucuz malzemeler
kullanılarak ve ses kontrolu yapılmadan inşa edilmektrdic. Bunun sonucu olarak,
yapılar inşa edildikten sonra birçok akustik sorunlarla karşılaşmakta ve amacına
hizmet edememektedir. Bu çalışmada niteliksel ve niceliksel araştırma yöntemleri
kullanılarak, akustik sorunları tanımlamak, bunların kaynaklarını, etkilerini ve çözüm
yollarını bulmak amaçlanmıştır. Araştırma göstermiştir ki hızlı konuşma iletim
endeksi [RASTI] ve Çınlama Süresi [RT] sıasıyla 0.34 ve 4.5 saniye dolayındadır.
Bu da Doğu Akdeniz Üniversitesi DAU LaLa Mustafa Pasa Salonunda, konuşma
analaşılabilirliğinin çok düşük olduğunu ve istenmeyen yankıların bulunduğunu
göstermektedir. Çalışma yalnız profesyonelleri yapı tasarımında akustiğin önemi
konusunda yalniz profesyonelleri değil, çok amaçlı salonlarda bu sorunların nasil
basit olarak çözülebileceği konusunda gili herkesi aydınlatmayı amaçlamaktadır. Bu
çok amaçlı salon sporun yanısıra, muzik, konuşma ve gösteri amaçlarına da hizmet
etmektedir. Bu nedenle çalışma sesin temelini, iç ve dış gürültü sorununu, oda
akustiğini, muhtemel ekonomik çözümleri ele almaktadır. Tezin sonunda verilen
tavsiler ve öneriler, gelecekte çok amaçlı salon tasarlayıcılarına yol gösterecektir.
Anahtar Kelimeler: Akustik kontrol, Oda Akustiği, Çok Amaçlı Salonlar, Çınlama
Süresi, Yankı, Konuşma Anlaşılabilirliği

v
To my family and the Almighty Jehovah God who kept me alive to this very moment
and who has been a source of strength and zeal, enabling me to successfully cope
with the challenges of both this programme and my life itself.
vi
ACKNOWLEDGMENTS
I would like to express my appreciation and thanks to my indefatigable supervisor
Prof. Dr. Mesut B. Özdeniz for his keen interest despite his tight academic schedule
and personal commitments to go through this script and continuous guidance
received from him throughout the period of this thesis. I am very grateful to Prof. Dr.
Olu Ola Ogunsote of the Federal University of Technology Akure-Nigeria for his
kind assistance to the completion of this research work.
Also worthy of acknowledgement are all members of staff of the department of
Architecture, who directly or one way or other contributed to the success of this
research work; Assoc. Prof. Dr. Özgür Dinçyürek (chair, department of
Architecture), Prof. Dr. Şebnem Önal Hoşkara, Assoc. Prof. Dr. Yonca Hürol, Assoc.
Pro. Dr. Hıfsiye Pulhan, Assoc. Prof. Dr. Türkan Uraz, Asst. Prof. Dr. Guita
Farivarsadri, Asst. Prof. Dr. Halil Zafer Alibaba, and Asst. Prof. Dr. Resmiye Alpar
Atun. I equally wish to acknowledge my friends, Shairmila De Soyza, Yusuf Tijjani,
Alexander Philip, Chelsea-Olivia Obi, Ahmed Hamidu and Abimbola Aeshinliye for
their supports at the time of undertaking this research study.
My utmost gratitude goes to my parents Mr. and Mrs. J. Iyendo whose moral and
financial support afforded me the opportunity for undertaking and completing this
programme sucessfully. I am also entirely indebted to my brothers and sisters; whose
care and love have been a compelling force that enabled me to aspire once more to
excellence.

vii
I finally give all glory to the Almighty God Jehovah, the sustenan of my life and
giver of knowledge in Jesus name…………..Amen.
viii
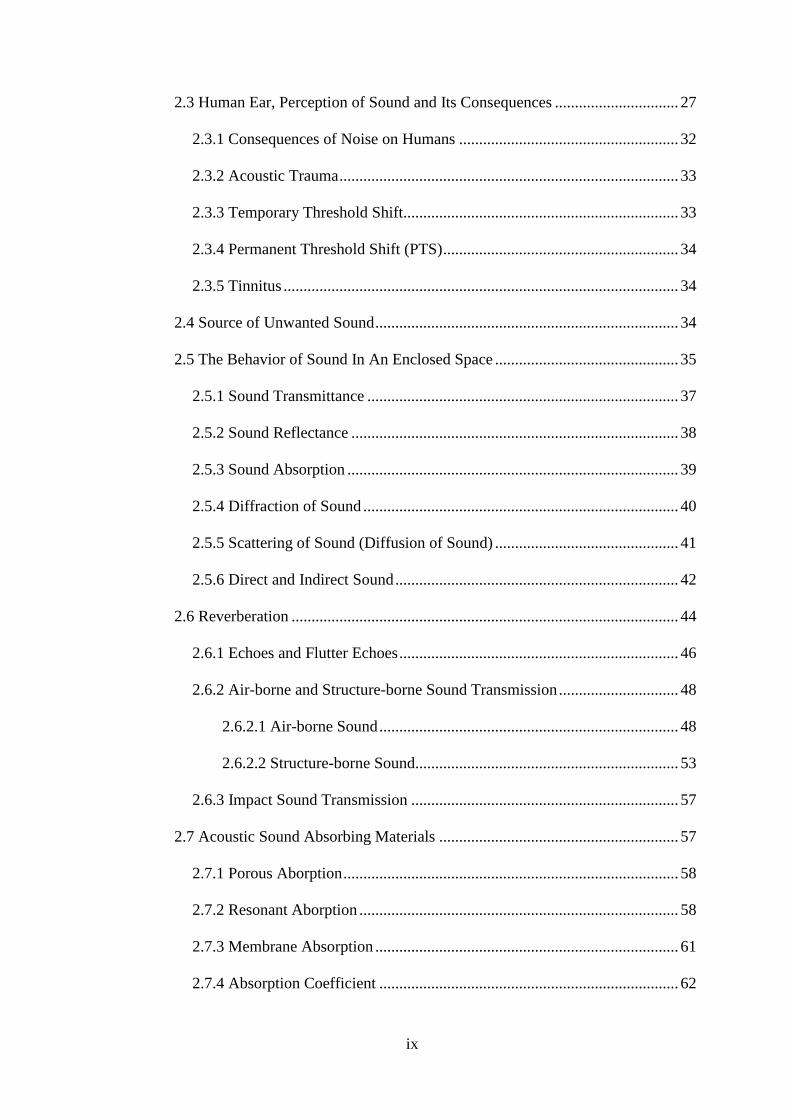
TABLE OF CONTENTS
ABSTRACT ................................................................................................................ iii
ÖZ................................................................................................................................ iv
DEDICATION ............................................................................................................. v
ACKNOWLEDGMENTS ........................................................................................... vi
LIST OF TABLES .................................................................................................... xiii
LIST OF FIGURES ................................................................................................... xv
LIST OF PLATES ................................................................................................... xviii
LIST OF SYMBOLS AND ABBREVIATIONS ..................................................... xix
1 INTRODUCTION ……………………………………...…………………………..1
1.1 Background of The Study…………………………………………………… ..1
1.2 Statement of The Problem . ……………………………………………………6
1.3 Research Aim and Objectives ............................................................................ 6
1.4 Research Questions ............................................................................................ 7
1.5 Scope of the study .............................................................................................. 7
1.6 Limitation of the study ....................................................................................... 7
1.7 Significance of the study ................................................................................... 7
1.8 Definition of Commonly Used Technical Terms in Noise Control ................... 8
2 LITERATURE REVIEW .......................................................................................... 9
2.1 Introduction ...................................................................................................... 9
2.2 The Physical Characteristics of Sound ........................................................... 18
2.2.1 Sound Pressure and The Decibel ............................................................ 22
2.2.2 Intensity of A Sound ............................................................................... 25
2.2.3 Threshold of Hearing and Threshold of Pain ......................................... 26
ix
2.3 Human Ear, Perception of Sound and Its Consequences ............................... 27
2.3.1 Consequences of Noise on Humans ....................................................... 32
2.3.2 Acoustic Trauma ..................................................................................... 33
2.3.3 Temporary Threshold Shift ..................................................................... 33
2.3.4 Permanent Threshold Shift (PTS) ........................................................... 34
2.3.5 Tinnitus ................................................................................................... 34
2.4 Source of Unwanted Sound ............................................................................ 34
2.5 The Behavior of Sound In An Enclosed Space .............................................. 35
2.5.1 Sound Transmittance .............................................................................. 37
2.5.2 Sound Reflectance .................................................................................. 38
2.5.3 Sound Absorption ................................................................................... 39
2.5.4 Diffraction of Sound ............................................................................... 40
2.5.5 Scattering of Sound (Diffusion of Sound) .............................................. 41
2.5.6 Direct and Indirect Sound ....................................................................... 42
2.6 Reverberation ................................................................................................. 44
2.6.1 Echoes and Flutter Echoes ...................................................................... 46
2.6.2 Air-borne and Structure-borne Sound Transmission .............................. 48
2.6.2.1 Air-borne Sound ........................................................................... 48
2.6.2.2 Structure-borne Sound.................................................................. 53
2.6.3 Impact Sound Transmission ................................................................... 57
2.7 Acoustic Sound Absorbing Materials ............................................................ 57
2.7.1 Porous Aborption .................................................................................... 58
2.7.2 Resonant Aborption ................................................................................ 58
2.7.3 Membrane Absorption ............................................................................ 61
2.7.4 Absorption Coefficient ........................................................................... 62
x
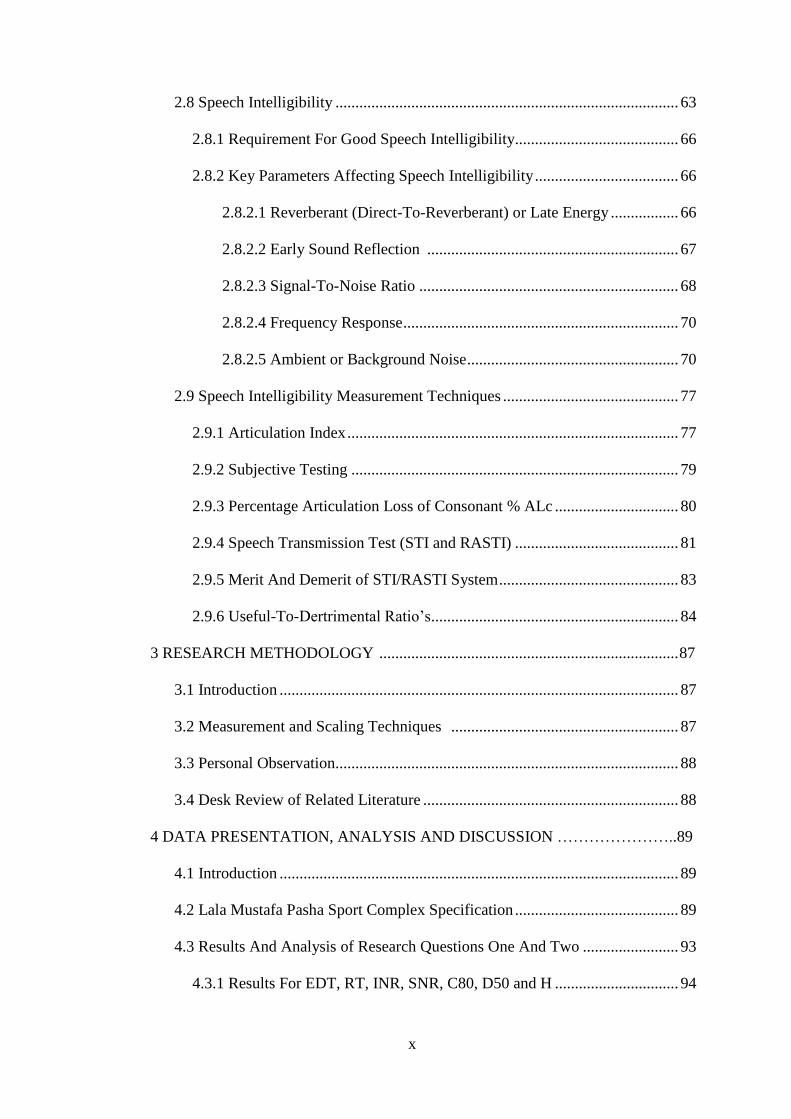
2.8 Speech Intelligibility ...................................................................................... 63
2.8.1 Requirement For Good Speech Intelligibility......................................... 66
2.8.2 Key Parameters Affecting Speech Intelligibility .................................... 66
2.8.2.1 Reverberant (Direct-To-Reverberant) or Late Energy ................. 66
2.8.2.2 Early Sound Reflection ............................................................... 67
2.8.2.3 Signal-To-Noise Ratio ................................................................. 68
2.8.2.4 Frequency Response ..................................................................... 70
2.8.2.5 Ambient or Background Noise ..................................................... 70
2.9 Speech Intelligibility Measurement Techniques ............................................ 77
2.9.1 Articulation Index ................................................................................... 77
2.9.2 Subjective Testing .................................................................................. 79
2.9.3 Percentage Articulation Loss of Consonant % ALc ............................... 80
2.9.4 Speech Transmission Test (STI and RASTI) ......................................... 81
2.9.5 Merit And Demerit of STI/RASTI System ............................................. 83
2.9.6 Useful-To-Dertrimental Ratio’s .............................................................. 84
3 RESEARCH METHODOLOGY ........................................................................... 87
3.1 Introduction .................................................................................................... 87
3.2 Measurement and Scaling Techniques ......................................................... 87
3.3 Personal Observation...................................................................................... 88
3.4 Desk Review of Related Literature ................................................................ 88
4 DATA PRESENTATION, ANALYSIS AND DISCUSSION …………………..89
4.1 Introduction .................................................................................................... 89
4.2 Lala Mustafa Pasha Sport Complex Specification ......................................... 89
4.3 Results And Analysis of Research Questions One And Two ........................ 93
4.3.1 Results For EDT, RT, INR, SNR, C80, D50 and H ............................... 94
xi
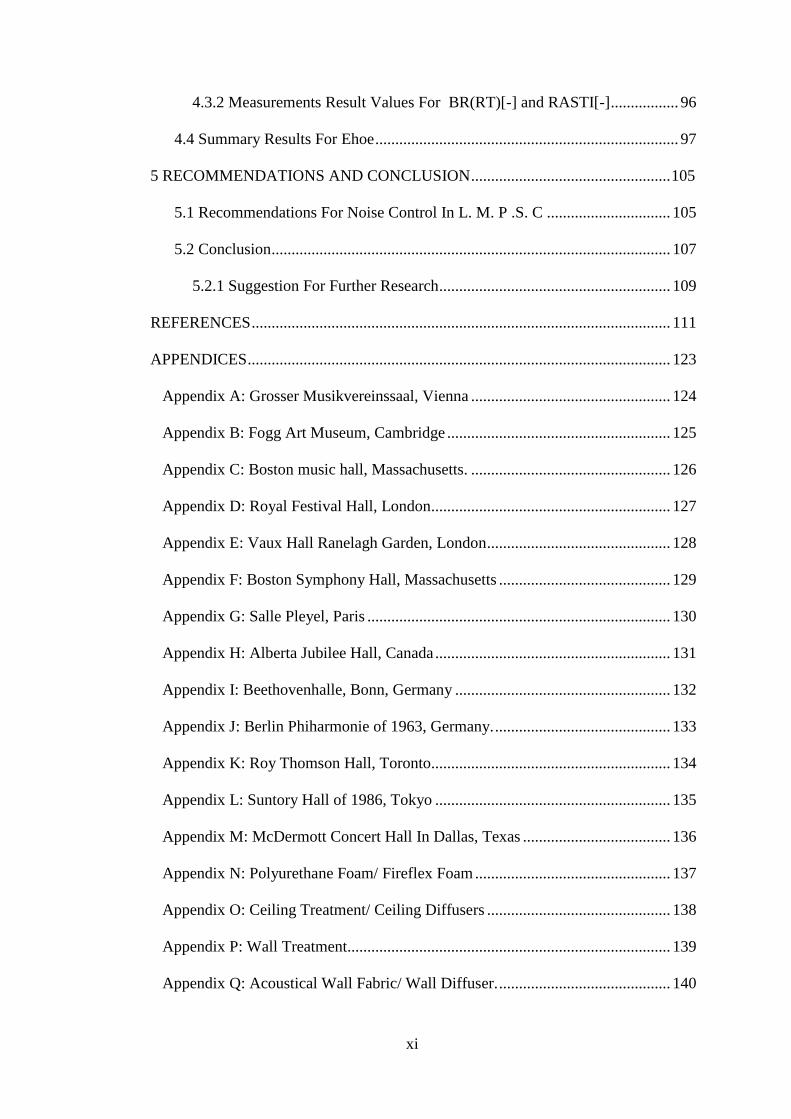
4.3.2 Measurements Result Values For BR(RT)[-] and RASTI[-] ................. 96
4.4 Summary Results For Ehoe ............................................................................ 97
5 RECOMMENDATIONS AND CONCLUSION .................................................. 105
5.1 Recommendations For Noise Control In L. M. P .S. C ............................... 105
5.2 Conclusion .................................................................................................... 107
5.2.1 Suggestion For Further Research .......................................................... 109
REFERENCES ......................................................................................................... 111
APPENDICES .......................................................................................................... 123
Appendix A: Grosser Musikvereinssaal, Vienna .................................................. 124
Appendix B: Fogg Art Museum, Cambridge ........................................................ 125
Appendix C: Boston music hall, Massachusetts. .................................................. 126
Appendix D: Royal Festival Hall, London............................................................ 127
Appendix E: Vaux Hall Ranelagh Garden, London .............................................. 128
Appendix F: Boston Symphony Hall, Massachusetts ........................................... 129
Appendix G: Salle Pleyel, Paris ............................................................................ 130
Appendix H: Alberta Jubilee Hall, Canada ........................................................... 131
Appendix I: Beethovenhalle, Bonn, Germany ...................................................... 132
Appendix J: Berlin Phiharmonie of 1963, Germany. ............................................ 133
Appendix K: Roy Thomson Hall, Toronto............................................................ 134
Appendix L: Suntory Hall of 1986, Tokyo ........................................................... 135
Appendix M: McDermott Concert Hall In Dallas, Texas ..................................... 136
Appendix N: Polyurethane Foam/ Fireflex Foam ................................................. 137
Appendix O: Ceiling Treatment/ Ceiling Diffusers .............................................. 138
Appendix P: Wall Treatment................................................................................. 139
Appendix Q: Acoustical Wall Fabric/ Wall Diffuser. ........................................... 140
xii
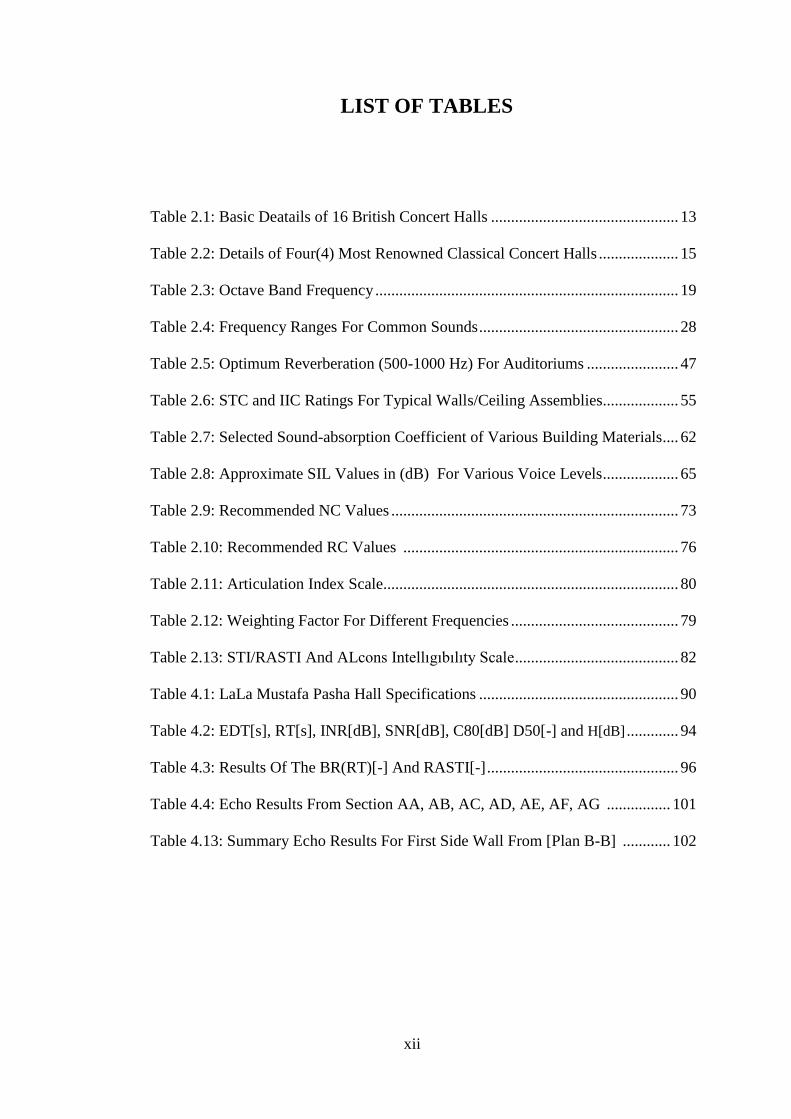
LIST OF TABLES
Table 2.1: Basic Deatails of 16 British Concert Halls ............................................... 13
Table 2.2: Details of Four(4) Most Renowned Classical Concert Halls .................... 15
Table 2.3: Octave Band Frequency ............................................................................ 19
Table 2.4: Frequency Ranges For Common Sounds .................................................. 28
Table 2.5: Optimum Reverberation (500-1000 Hz) For Auditoriums ....................... 47
Table 2.6: STC and IIC Ratings For Typical Walls/Ceiling Assemblies................... 55
Table 2.7: Selected Sound-absorption Coefficient of Various Building Materials.... 62
Table 2.8: Approximate SIL Values in (dB) For Various Voice Levels................... 65
Table 2.9: Recommended NC Values ........................................................................ 73
Table 2.10: Recommended RC Values ..................................................................... 76
Table 2.11: Articulation Index Scale.......................................................................... 80
Table 2.12: Weighting Factor For Different Frequencies .......................................... 79
Table 2.13: STI/RASTI And ALcons Intellıgıbılıty Scale ......................................... 82
Table 4.1: LaLa Mustafa Pasha Hall Specifications .................................................. 90
Table 4.2: EDT[s], RT[s], INR[dB], SNR[dB], C80[dB] D50[-] and H[dB] ............. 94
Table 4.3: Results Of The BR(RT)[-] And RASTI[-] ................................................ 96
Table 4.4: Echo Results From Section AA, AB, AC, AD, AE, AF, AG ................ 101
Table 4.13: Summary Echo Results For First Side Wall From [Plan B-B] ............ 102
xiii
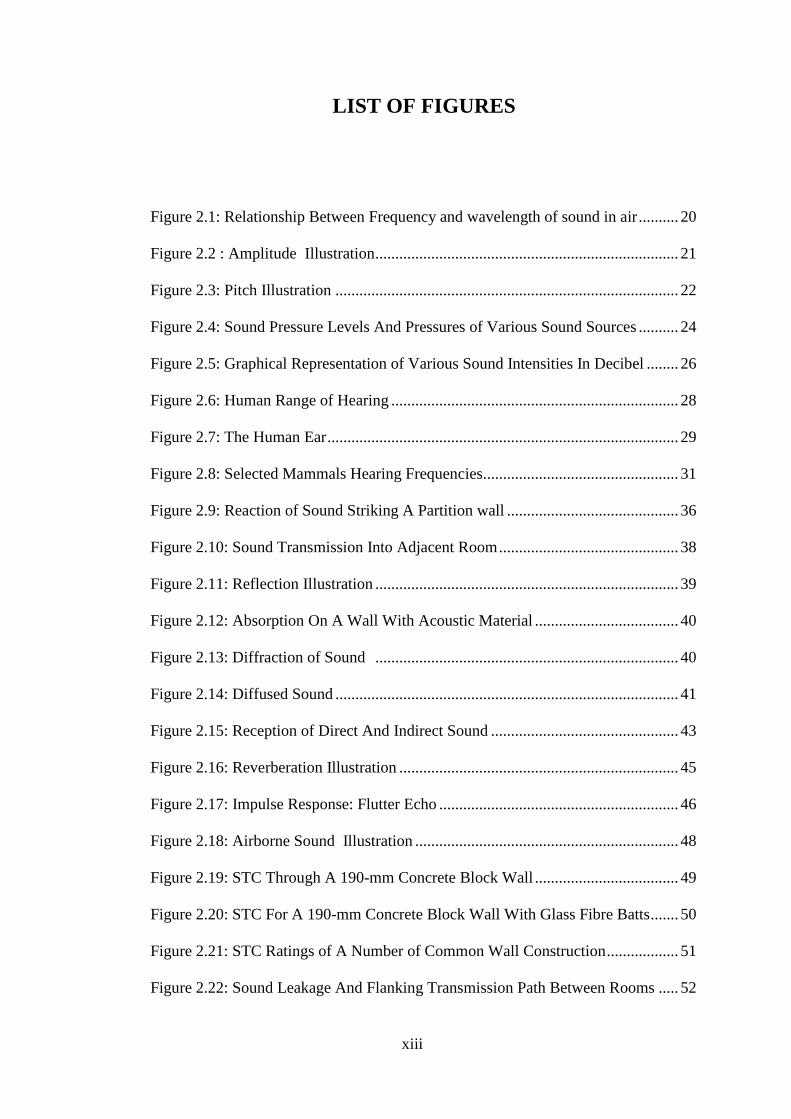
LIST OF FIGURES
Figure 2.1: Relationship Between Frequency and wavelength of sound in air .......... 20
Figure 2.2 : Amplitude Illustration ............................................................................ 21
Figure 2.3: Pitch Illustration ...................................................................................... 22
Figure 2.4: Sound Pressure Levels And Pressures of Various Sound Sources .......... 24
Figure 2.5: Graphical Representation of Various Sound Intensities In Decibel ........ 26
Figure 2.6: Human Range of Hearing ........................................................................ 28
Figure 2.7: The Human Ear ........................................................................................ 29
Figure 2.8: Selected Mammals Hearing Frequencies................................................. 31
Figure 2.9: Reaction of Sound Striking A Partition wall ........................................... 36
Figure 2.10: Sound Transmission Into Adjacent Room ............................................. 38
Figure 2.11: Reflection Illustration ............................................................................ 39
Figure 2.12: Absorption On A Wall With Acoustic Material .................................... 40
Figure 2.13: Diffraction of Sound ............................................................................ 40
Figure 2.14: Diffused Sound ...................................................................................... 41
Figure 2.15: Reception of Direct And Indirect Sound ............................................... 43
Figure 2.16: Reverberation Illustration ...................................................................... 45
Figure 2.17: Impulse Response: Flutter Echo ............................................................ 46
Figure 2.18: Airborne Sound Illustration .................................................................. 48
Figure 2.19: STC Through A 190-mm Concrete Block Wall .................................... 49
Figure 2.20: STC For A 190-mm Concrete Block Wall With Glass Fibre Batts ....... 50
Figure 2.21: STC Ratings of A Number of Common Wall Construction .................. 51
Figure 2.22: Sound Leakage And Flanking Transmission Path Between Rooms ..... 52
xiv
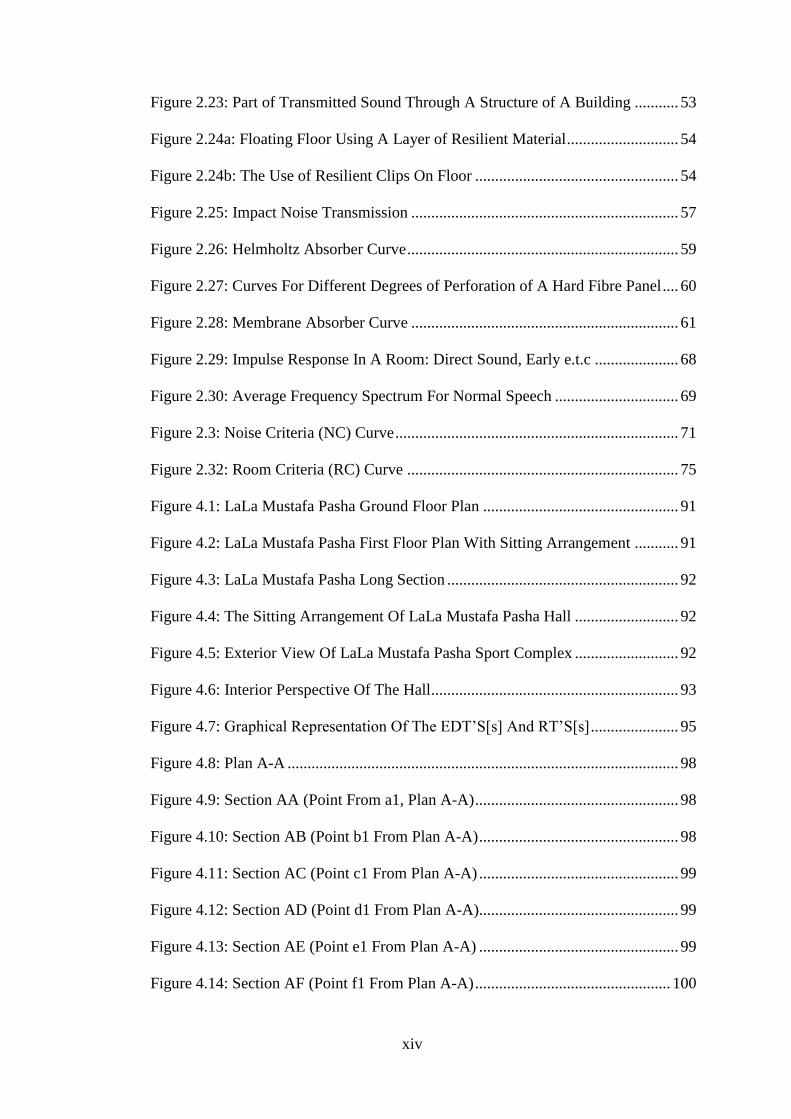
Figure 2.23: Part of Transmitted Sound Through A Structure of A Building ........... 53
Figure 2.24a: Floating Floor Using A Layer of Resilient Material ............................ 54
Figure 2.24b: The Use of Resilient Clips On Floor ................................................... 54
Figure 2.25: Impact Noise Transmission ................................................................... 57
Figure 2.26: Helmholtz Absorber Curve .................................................................... 59
Figure 2.27: Curves For Different Degrees of Perforation of A Hard Fibre Panel .... 60
Figure 2.28: Membrane Absorber Curve ................................................................... 61
Figure 2.29: Impulse Response In A Room: Direct Sound, Early e.t.c ..................... 68
Figure 2.30: Average Frequency Spectrum For Normal Speech ............................... 69
Figure 2.3: Noise Criteria (NC) Curve ....................................................................... 71
Figure 2.32: Room Criteria (RC) Curve .................................................................... 75
Figure 4.1: LaLa Mustafa Pasha Ground Floor Plan ................................................. 91
Figure 4.2: LaLa Mustafa Pasha First Floor Plan With Sitting Arrangement ........... 91
Figure 4.3: LaLa Mustafa Pasha Long Section .......................................................... 92
Figure 4.4: The Sitting Arrangement Of LaLa Mustafa Pasha Hall .......................... 92
Figure 4.5: Exterior View Of LaLa Mustafa Pasha Sport Complex .......................... 92
Figure 4.6: Interior Perspective Of The Hall.............................................................. 93
Figure 4.7: Graphical Representation Of The EDT’S[s] And RT’S[s] ...................... 95
Figure 4.8: Plan A-A .................................................................................................. 98
Figure 4.9: Section AA (Point From a1, Plan A-A) ................................................... 98
Figure 4.10: Section AB (Point b1 From Plan A-A) .................................................. 98
Figure 4.11: Section AC (Point c1 From Plan A-A) .................................................. 99
Figure 4.12: Section AD (Point d1 From Plan A-A).................................................. 99
Figure 4.13: Section AE (Point e1 From Plan A-A) .................................................. 99
Figure 4.14: Section AF (Point f1 From Plan A-A) ................................................. 100

xv
Figure 4.15: Section AG (Point g1 From Plan A-A)................................................ 100
Figure 4.15: Plan B-B............................................................................................... 102
xvi
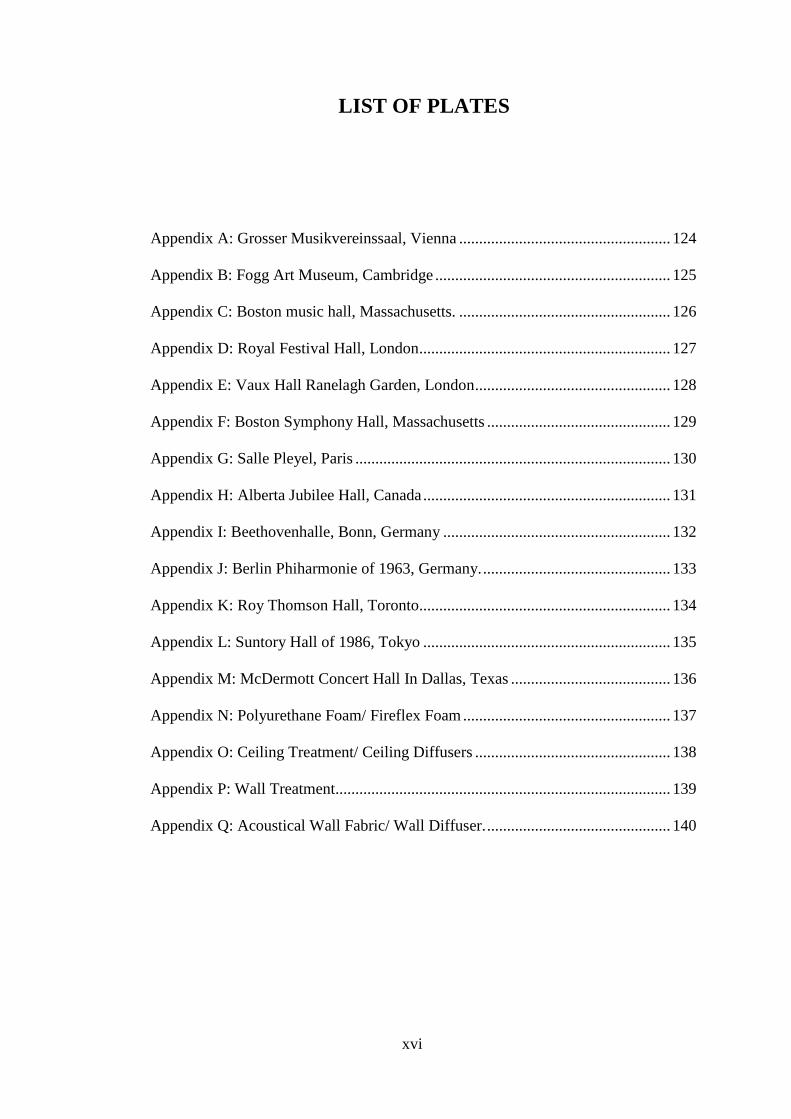
LIST OF PLATES
Appendix A: Grosser Musikvereinssaal, Vienna ..................................................... 124
Appendix B: Fogg Art Museum, Cambridge ........................................................... 125
Appendix C: Boston music hall, Massachusetts. ..................................................... 126
Appendix D: Royal Festival Hall, London............................................................... 127
Appendix E: Vaux Hall Ranelagh Garden, London ................................................. 128
Appendix F: Boston Symphony Hall, Massachusetts .............................................. 129
Appendix G: Salle Pleyel, Paris ............................................................................... 130
Appendix H: Alberta Jubilee Hall, Canada .............................................................. 131
Appendix I: Beethovenhalle, Bonn, Germany ......................................................... 132
Appendix J: Berlin Phiharmonie of 1963, Germany. ............................................... 133
Appendix K: Roy Thomson Hall, Toronto............................................................... 134
Appendix L: Suntory Hall of 1986, Tokyo .............................................................. 135
Appendix M: McDermott Concert Hall In Dallas, Texas ........................................ 136
Appendix N: Polyurethane Foam/ Fireflex Foam .................................................... 137
Appendix O: Ceiling Treatment/ Ceiling Diffusers ................................................. 138
Appendix P: Wall Treatment.................................................................................... 139
Appendix Q: Acoustical Wall Fabric/ Wall Diffuser. .............................................. 140

xvii
LIST OF SYMBOLS AND ABBREVIATIONS
%ALc Percentage Loss of Consonants
f0 Frequency Resonance
Linear Early-To-Late Ratio
EBL Background Energy
ESL Speech Energy
Ee Relative Energy
E1 Late Energy
Ute Useful-To-Detrimental Ratio
g Lambda
m’(F) Modulatıon Index
te Early Time Limit
Absorption Coefficient/Fraction Of Energy
Approximately
µbar Microbar
µPa Micropascal
µW Microwatt
AC Arcticulation Class
AI Articulation Index
ANSI American National Standards Institude
ASHA American Speech-Language-Hearing Association
ASHRAE American Society Of Heating, Refrigerating And Air-
Conditioning Engineer
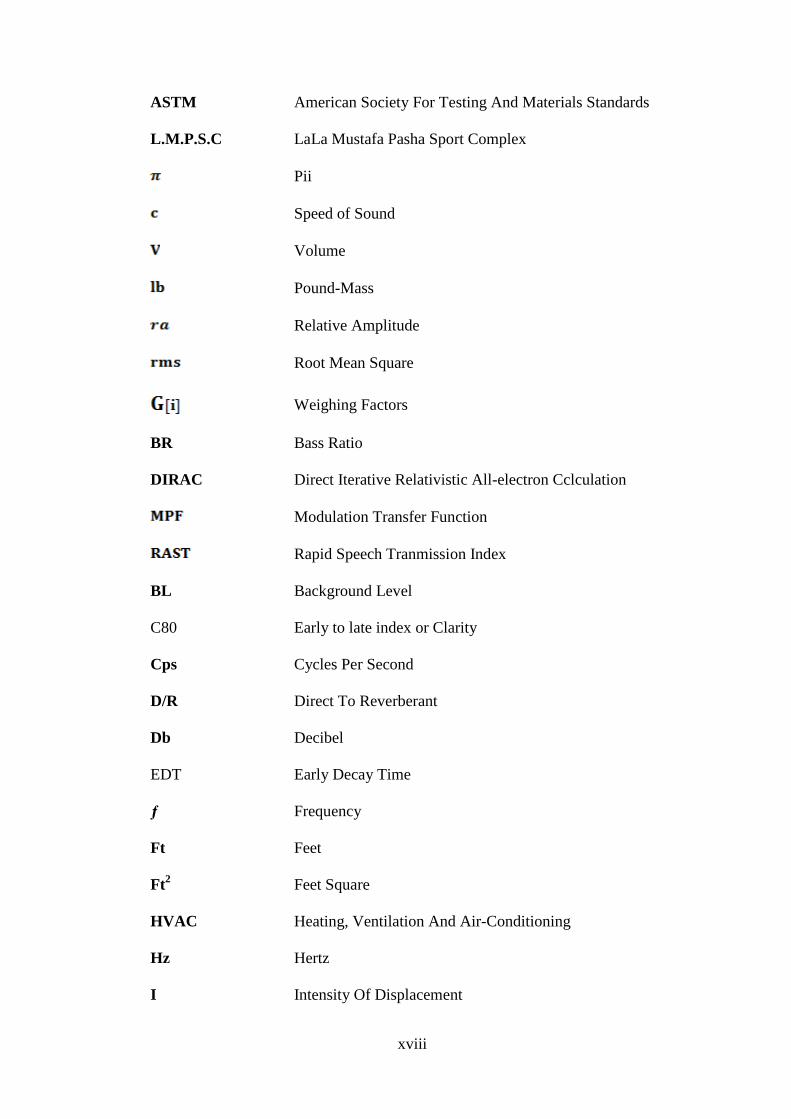
xviii
ASTM American Society For Testing And Materials Standards
L.M.P.S.C LaLa Mustafa Pasha Sport Complex
Pii
Speed of Sound
Volume
Pound-Mass
Relative Amplitude
Root Mean Square
Weighing Factors
BR Bass Ratio
DIRAC Direct Iterative Relativistic All-electron Cclculation
Modulation Transfer Function
Rapid Speech Tranmission Index
BL Background Level
C80 Early to late index or Clarity
Cps Cycles Per Second
D/R Direct To Reverberant
Db Decibel
EDT Early Decay Time
ƒ Frequency
Ft Feet
Ft2
Feet Square
HVAC Heating, Ventilation And Air-Conditioning
Hz Hertz
I Intensity Of Displacement
xix
IIC Impact İnsulation Class
INR Impulse Response To Noise Ration
In Inch
Kg Kilogram
L Length
LNA A- Weighted Long-Term Average Level Background Noise
LSA A- Weighted Long-Term Average Level
M Metre
m2 Metre Square
m3
Metre Cube
Max. Maximun
mm Milimetres
msec MiliSecond
mW Miliwatt
N Newton
NC Noise Criterial
P0 Threshold of Human Hearing
Pa Pascal
PA Public Address
PNC Prefered Noise Criterion
Pt Point
PTS Permanent Threshold Shift
r2 Redius Square
Rc Room Criterial
RT Reverberation Time
xx
Rw Weighted Sound Reduction Index
s Seconds
S Emitted Sond Power
SI Speech Index
SIL Speech Interference Level
SL Speech Level
SNR (S/N) Sıgnal-To-Noıse Ratıo
SPL Sound Pressure Level
Sq Square
STC Sound Transmission Clss
STL Sound Transmission Loss
t Time
TL Transmission Loss
TTS Temporary Threshold Shift
v Speed Or Velocity of Sound
1
Chapter 1
INTRODUCTION
1.1 Background of the study
According to science and engineering encyclopedia of 2001, “acoustics (Greek word
derived from “akouein” to hear), is a general term used for the scientific discipline
of sound”. Harris (1975), simply defined acoustics “as the science of sound,
including its production, transmission, reception, and effects”. On the other side,
Merriam Webster online dictionary defined “acoustics as the science that deals with
the production, transmission, reception, effects and control of sound”
(www.physic.byu.edu). In other words, “acoustics can be defined as the branch of
science that deals with room acoustic and noise control” (Harris, 1994).
Means (2009), states that “architectural acoustics deals with the construction of
enclosed or within a single area (i.e. reflection, reverberation, absorption,
transmission etc.), so as to enhance the hearing of speech or music”. Funk and
Wagnalls (1994), state that “building acoustics was unexploited aspect of the study of
sound until relatively recent times”. “Marcus Pollio, a Roman architect who lived
during the 1st century B.C, made some pertinent observations on the subject
(acoustics) and came out with some astute guesses concerning reverberation and
interference” (Barron, 2003).
2
The scientific aspects of this subject, however, was comprehensively first treated by
an American physicist Joseph Henry in 1856 and was ameliorated in full by Wallace
Sabine an American physicist in 1900 (Funk and Wagnalls, 1994).
Reports gathered over the years; show that we are living in a noisy environment.
Noise can scotch or thwart speech communication, and can also be a physical health
peril as well. Rogers (1982), confirms that the brain pressure is often increased as
much as 400 percent by sudden loud noise, which may cause loss of temper,
incitement, and permanent hearing loss. Humans are usually annoyed by noise and
react to it. Due to this cause, the need to achieve noiseless conditions in offices,
factories and multipurpose dwelling housing is considered to provide greater comfort
for the occupants of these buildings (Harris, 1994).
Acoustic consideration is essential to the functionality of almost every type of
buildings, from residential buildings, open offices, worship centers and multipurpose
halls. Thus, the concept of habitability within the framework of architectural
practices for a functional room space means more than just normal conventional
design consideration (i.e. Lighting, ventilation etc.). However, the functionality of a
multipurpose space will not be complete, without due consideration of the sound
production (acoustics) of the space. The effect of both indoor and outdoor generated
sound must be considered to enhance an acoustic ideal environment for its users.
Thus, shelter can only fulfill its requirement as a functional space, if noise reduction
is taken as one of the design consideration for a habitable space, especially with
regards to multipurpose spaces since attaining noiseless conditions in such spaces are
almost impossible.
3
The consideration of acoustic in building design is a major factor often undermined
and this relatively reduces the functionality of buildings as noise has quite a number
of adverse effects on humans, such as discomfort and health related problems which
reduces the overall productivity of humans. Therefore, accounting for acoustic
conditions can greatly increase the overall comfort quality of a space, whereas poor
acoustics upshot in an unhealthy and dangerous environment.
In multipurpose spaces, acoustic consideration is a factor to ameliorate on good
listening condition as background noise, reverberation (echo), air born sounds,
structure-born sound and speech intelligibility are some of the acoustic problems of
most auditoria, halls or multipurpose spaces which reduces the acoustic stability of
the entire building.
Hunt (1978), avers that acoustics is associated with music, and it has been a field of
concern for many centuries. Rayleigh (1945), also averred that Pythagoras was the
first Greek philosopher credited to carry out studies on the physical origin of musical
sounds around 550BC. In Pythagoras‟s experiment, he ascertained that “when two
strings on a musical instrument are struck, the shorter one will emit a higher pitched
sound than the longer one”. Approximately in 240 BC, Crysippus a Greek
philosopher postulated that “sound was generated by vibration of parts of the musical
instrument” (the strings, for example), he also stated that “ sound was transmitted by
means of vibration of the air or other fluid, and that this motion caused the
sensation of hearing when the waves strike a person‟s ear ” (Rayleigh, 1945).
Many other scientists made further assertions and contributed to the issue of
acoustics being associated with music sound. Galileo Galilei an Italian physicist,
4
famously known as the father of modern science also contributed to study of music
sound, which led to his published discussion in 1638, on the vibration of strings in
which he developed quantitative relationships between the frequency of
vibration of the string, the length , its tension, and density of the string
(Finocchiaro, 1989).
Another school of thought came from Otto Von Guericke, who affirms that he
“doubted sound was transmitted by the vibratory motion of air, because sound was
transmitted better when the air was still than when there was a breeze”. Guericke
concluded that air was not necessary for the transmission of sound (Raichel, 2006).
Further research was conducted by Sir Isaac Newton in 1687; he compared the
transmission of sound and motion of waves on water surface. As well, he developed
an expression for the speed of sound based on the premise that the sound wave was
transmitted isothermally, whereas sound is emitted adiabatically for small amplitude
sound waves, by analogy with the vibration of a pendulum. Various contemporary
researchers came out with various results although with little similarity in their
research. This was still on when Rayleigh published a two-volume work in 1877,
“The theory of sound”, which placed the discipline acoustics on a solid scientific
foundation (Barron, 2003). Within the interval of 1898 and 1900, Sabine wrote and
produced series of written document on reflection of sound in rooms where he
introduced the cornerstone of architectural acoustics (Sabine, 1922).
In 1827, a British physicist Sir Charles Wheatstone, invented the famous Wheatstone
bridge, he produced an instrument similar to the stethoscope, which he called a
„„microphone ‟‟. Subsequently the invention of the triode vacuum tube in 1907 and
5
the initial advancement of radio broadcasting in the 1920s, electric microphones and
loudspeakers were manufactured. Research was also carried out on the concepts
pertaining to loudness and the reaction of the human ear to sound in the 1920s
(Barron, 2003).
Between 1930 and 1940, mark the beginning of noise control principles application
to buildings, automobiles, aircraft and ships, and from their researchers began to
investigate the physical processes involved in sound absorption by porous
acoustic materials. “With the advent of World War II, improvement on the ways in
which speech communication problems could be solved in noisy surroundings, such
as in tanks and aircraft were made”. “Subsequently, after World War II more
pragmatic and rigorous research in noise control and acoustics was undertaken in
several scientific institutes and universities, which gave rise to addressing noise
problems in both architecture and industry properly in post war time period”
(Beranek, 1962).
Afterwards, research was also conducted to solve noise problems in residential
buildings, workplace and transportation. “The adjustment of the (Walsh–Healy Act)
in 1969 contributed greatly to the control of noise activity in the industry and the law
demanded that the noise exposure of workers in the industrial environment be
reduced to a specific value (90 dBA for an 8- hour period)”. “The law also avers that,
workers should be provided and trained on how to use personal hearing protection
devices, if noise exposure exceeds prevented level” (Barron, 2003).
6
1.2 Statement of the problem
The consideration of acoustic in building design is a major factor that is often
undermined and this relatively reduces the functionality of the building and the
overall productivity of the users as well.
Thus, accounting for acoustic situations can greatly increase the overall comfort level
of the entire space, whereas poor acoustics can result in unsafe and insalubrious
environment. Against this background, acoustic consideration is a major factor to be
considered in LaLa Mustafa Pasa multipurpose hall to enhance good listening
condition since reverberation (echo), background noise and speech intelligibility are
the major acoustic defects of the space and which reduces the acoustical suitability of
the building as a whole.
1.3 Research aim and objectives
(a) Aim
The aim of this research study is to investigate the acoustic (noise) problems in LaLa
Mustafa Pasa multipurpose sports complex, Eastern Mediterranean University North
Cyprus.
(b) Research Objectives
This research survey is geared towards examining the noise issues in LaLa Mustafa
Pasa Multipurpose hall, Eastern Mediterranean University with the view:
1. To identify the possible existing acoustic problems.
2. To analyze the existing problems identified.
3. To determine the most economic solutions to the problems that can be taken
within the sport complex to enhance a comfortable good listening environment
for its users.
7
1.4 Research questions
In order to critically examine the impact of noise in LaLa Mustafa Pasa Multipurpose
Sports Complex (Eastern Mediterranean University), this research study provides
answers to the following three (3) objectives of the research work.
1. What are the ways to identify the possible existing acoustic problems?
2. What appropriate method is to be used to analyze the problems identified?
3. What parameter that could be used to determine the most economic solutions to
the problems that can be taken within the sport complex to enhance a comfortable
good listening environment for its users?
1.5 Scope of the study
This study based its scope on the noise (acoustic) problems and control of LaLa
Mustafa Pasa Multipurpose Sport Complex (Eastern Mediterranean University-
Gazimağusa, North Cyprus).
1.6 Limitation of the study
The issue of insufficient equipments, time constraint, insufficient income, and the
unavailability of multipurpose spaces in Gazimagusa, Northern-Cyprus pose a major
limitation on this research.
1.7 Significance of the study
This study is expected to contribute to the body of knowledge by acquitting both
practicing and potential designers and architects with appropriate modern design
strategies and the relevant options needed to effectively control and manage the
behaviour of sound within multipurpose spaces.
The research will be appealing to students of Architecture, urban planning, civil
engineering and also serve as a reference document to those who may carry out
8
similar study on the topic or related topic. Other beneficiaries will be any
government ministries and research institutions/organizations who may find it helpful
for the furtherance of planning and development of auditorium/Hall or multipurpose
spaces.
1.8 Definitions of commonly used technical terms in noise control
Acoustic environment: This is the overall environment, including the exterior to
interior that affects the acoustic conditions of the space or structure under
consideration.
Amplification: the increase in intensity level of an audible signal produced by means
of a loudspeaker and is associated with electric amplification apparatus.
Attenuation: The decrease in level of sound, usually from absorption, divergence,
scattering, or the cancellation of the sound waves.
Audible sound: Acoustic oscillations of such a character as to be capable of giving
rise to the sensation of hearing.
Distortion: This is known as any change in the transmitted sound signal such that the
received is not a faithful replica of the original source sound.
Flanking path: A path along which sound is communicated that leads to flanking
sound transmission.
Frequency analyzer: This is an instrument used for measuring the acoustic energy
present in various frequency subdivision, for instance (one, one-third, one-tenth-
octave bands etc.) of a complex sound.
Velocity of sound: This known as the rate at which a sound wave travels from a
source through a medium to the listener or receiver and the SI unit is in m/s.
9
Chapter 2
LITERATURE REVIEW
2.1 Introduction
“The problem of achieving good hall acoustics has induced much valuable research
since 1950” (Barron, 2009). Ryan, (1998) avers that is easier to achieve good
acoustics in smaller halls than in larger ones. Many of these old halls suffer from
deficiencies at certain location, particularly from poor sightlines in the side balconies,
for example the Grosser Musikvereinssaal, Vienna (Bradley, 1991), as shown in
appendix A: plate 1. Designing auditoria is a complex, elaborate but highly
constrained exercise. All auditoria rely on both visual and acoustic stimulation
(Brewer, 1854: Barron, 2009). The discussion of auditorium design and development
on the basis of precedent were well established in Brewer‟s day, even if not on a
particular scientific base. Vitruvius, (1960) based his geometric prescriptions for
designing Greek and Roman theatres on an understanding of acoustics. Over the
years, the fan shaped plan and arena form became highly developed and remain a
constant point of reference for present design at that time. The developments of these
dominant auditorium plans through the centuries were really fascinating (Barron,
1992). The first of the fan shape design was the Dumon’t Parrallele De Plans des
Plus Belles Salles De Spectacles of 1774. Dumont proposed his own designs with
vast concave domed ceilings, which would not give any acoustician nightmares
(Barron, 1993).
10
In the late 19th
century, European theatres and opera houses experienced a building
rapid growth. By 1896 Sachs could fill his monumental three-volume modern opera
houses and theatres with extensive details about more than 50 theatres completed
since Contant‟s earlier survey (Barron, 2009). Beranek (1962), pioneered analysis of
auditorium acoustics on the basis of several independent subjective qualities, such as
„intimacy‟, „liveness‟ and „warmth‟. He was the first person to give a serious attempt
on the complete explanation of auditorium acoustics and to answer many
misconceptions on acoustics as a subject. Patte (1782), was another fellow who first
made attempts pertaining to auditorium form and acoustics behaviour by proposing
elliptical plans. Attempts were also made by Saunders (1790), by proposing circular
auditorium, although such forms can be dangerous due to focusing by concave
surfaces. Dr Reid in 1835, also made some progress in understanding the acoustics of
rooms in the nineteenth centuries by postulating that “any difficulty in the
communication of sound in large rooms arises generally from the interruption of
sound produced by a prolonged reverberation” (Barron, 1993). Dr Rein also
successfully gave advice on the acoustic treatment of the Westminster contemporary
House of Commons (Bagenal and Wood, 1931).
Around 1900, it was discovered that many large playhouse (theatre) were built at that
time and are still in use, which still function and have good acoustics. On the other
hand, Roger Smith summarizes the state of art in 1861 but fail to reconcile the
conflicting evidence from the men of science (Smith, 1861). Lord Rayleigh (1878),
also postulated on room acoustics in his book “theory of sound”, and which is still
widely used today by scholars and researchers.
11
Sabine (1922), discovered a solution to the acoustics of the newly Fogg Art museum
lecture room, as shown in appendix B: plate 2. In his research, he realized that there
was too much reverberation in the lecture room; he measured the unoccupied
reverberation as 5.5 seconds and later developed a technique for measuring the decay
time of residual sound after an organ pipe was switched off. He achieved that by ear
observation and stop watch. Modification was made to ameliorate the acoustics of the
lecture room in 1898 and was finally demolished in 1973 (Cavanaugh and Wilkes,
1999).
In appendix C: plate 3, is another outstanding hall, the Boston music Hall of 1863,
which was completed in the fall of 1898, and Sabine was ask to evaluate the acoustic
issues of the hall (Beranek, 1979). “Sabine later discovered that the reverberation
time was proportional to the reciprocal of the amount of absorption, which is now
called the Boston symphony hall, a concert hall that has gained a reputation for
having one of the best acoustics worldwide” (Sabine, 1922). In his paper of 1898,
Sabine summarized the requirements for room acoustics as:
“In order that hearing may be good in any auditorium, it is necessary that the
sound should be sufficiently loud; that the simultaneous components of a complex
sound should maintain their proper relative intensities; and that the successive
sounds in rapidly moving articulation, either of speech or music, should be clear
and distinct, free from each other and from extraneous noises. These three are
necessary, as they are the entirely sufficient, conditions for good hearing”
(Sabine, 1922: Barron, 2009).
12
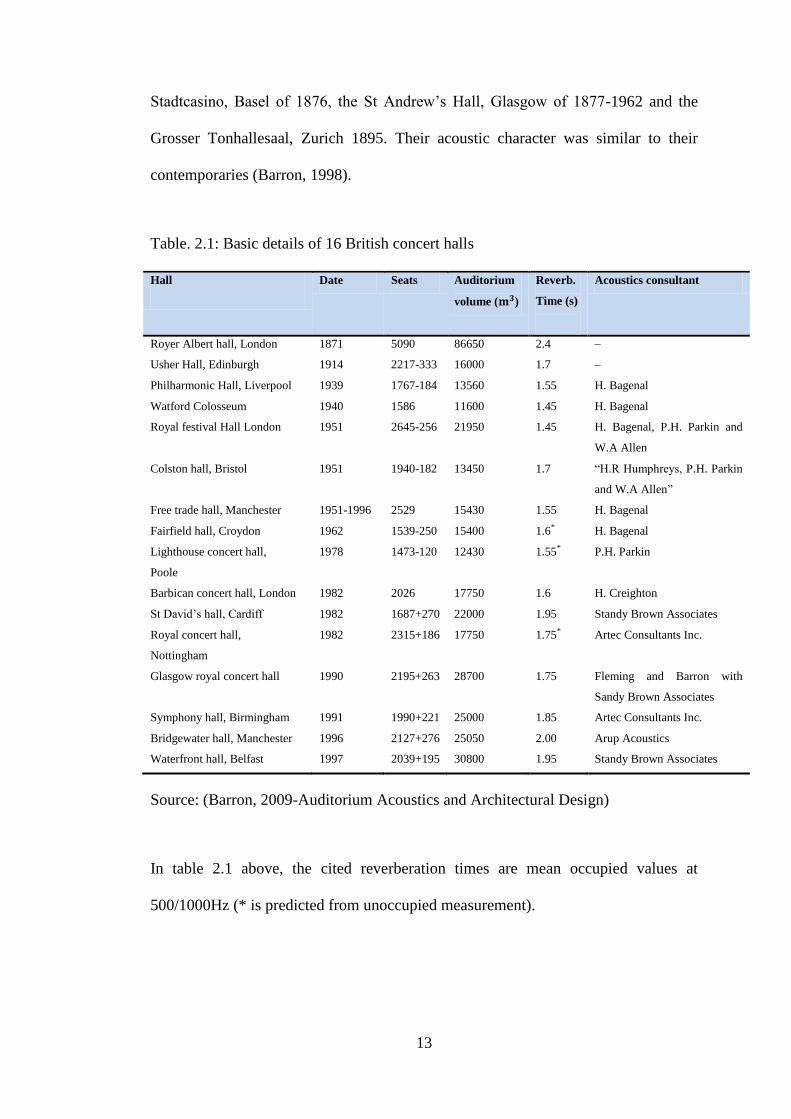
Barron (2009), in his book auditorium acoustics and architectural design, he stated
that the Royal Festival Hall, London, of 1951 was a typical of several subsequent
dashing hopes due to the lack of proper acoustic consideration, see appendix D: plate
4. Table 2.1, shows a brief and comprehensive overview of some British hall
chronologically. Cremer and Muller (1982), made progress in terms of measurable
quantities, which are now widely used for music listening. Meyer (2009), recently,
takes it as the basis characteristics of musical instruments (spectral, directional etc)
and how this is significant for performance.
Arthur (2002), made some study on British auditoria between 1982 and 1983, which
led to measurement of acoustics in over 40 auditoria in which subjective test were
conducted with listeners completing questionnaire at public performances. Also, five
British auditoria which were completed since 1990 were tested and reported as well.
The new scientific basis for auditorium acoustics has made acoustics design more
confident exercise over the years, in spaces for both music and speech (Talaske et al.,
1982).
According to Barron (1998) in his research on Royal Festival Hall acoustic of 1951,
he stated that “to design a concert hall is to go down into the arena and risk death
from violence of your contending passions”. The London examples at Vaux Hall and
Ranelagh Gardens were copied in several other European cities, but none of these
old London concert venues survived the test of time, though they are well
documented (Forsyth, 1985), as shown in appendix E: plate 5. A technical analysis of
the three of these halls that survived has been made by (Bradley, 1991). While the
years progress, many other rectangular halls were also built which gained good
standing, among them are the Liverpool Philharmonic Hall of 1849-1933, the
13
Stadtcasino, Basel of 1876, the St Andrew‟s Hall, Glasgow of 1877-1962 and the
Grosser Tonhallesaal, Zurich 1895. Their acoustic character was similar to their
contemporaries (Barron, 1998).
Table. 2.1: Basic details of 16 British concert halls
Hall Date Seats Auditorium
volume ( )
Reverb.
Time (s)
Acoustics consultant
Royer Albert hall, London 1871 5090 86650 2.4 –
Usher Hall, Edinburgh 1914 2217-333 16000 1.7 –
Philharmonic Hall, Liverpool 1939 1767-184 13560 1.55 H. Bagenal
Watford Colosseum 1940 1586 11600 1.45 H. Bagenal
Royal festival Hall London 1951 2645-256 21950 1.45 H. Bagenal, P.H. Parkin and
W.A Allen
Colston hall, Bristol 1951 1940-182 13450 1.7 “H.R Humphreys, P.H. Parkin
and W.A Allen”
Free trade hall, Manchester 1951-1996 2529 15430 1.55 H. Bagenal
Fairfield hall, Croydon 1962 1539-250 15400 1.6* H. Bagenal
Lighthouse concert hall,
Poole
1978 1473-120 12430 1.55* P.H. Parkin
Barbican concert hall, London 1982 2026 17750 1.6 H. Creighton
St David‟s hall, Cardiff 1982 1687+270 22000 1.95 Standy Brown Associates
Royal concert hall,
Nottingham
1982 2315+186 17750 1.75* Artec Consultants Inc.
Glasgow royal concert hall 1990 2195+263 28700 1.75 Fleming and Barron with
Sandy Brown Associates
Symphony hall, Birmingham 1991 1990+221 25000 1.85 Artec Consultants Inc.
Bridgewater hall, Manchester 1996 2127+276 25050 2.00 Arup Acoustics
Waterfront hall, Belfast 1997 2039+195 30800 1.95 Standy Brown Associates
Source: (Barron, 2009-Auditorium Acoustics and Architectural Design)
In table 2.1 above, the cited reverberation times are mean occupied values at
500/1000Hz (* is predicted from unoccupied measurement).
14
In 1870, the Gesellschaft der Musikfreunde opened a new building adjacent to the
Ringstrasse, which comprises a Grosser and Kleiner Musikvereinssaal and was
designed by architects Theophil Ritter Von Hansen (Barron, 2009). The hall was
renamed at a later date and was called the Brahmssaal, while the former has
established the esteem as having one of the best acoustics in the world. The hall
differs in several respects from the original design and was renovated as a result of
fire safety in 1911. Although clement still records some lapses on acoustics issues in
the Grosser Musikvereinssaal Hall. See appendix A: plate 1. He discovered that
lateral reflections were the major problems of the hall (Clements, 1999). Table 2.2
shows details of some renowned classical concert halls.
Appendix F: plate 6 shows the Boston symphony Hall, Massachusetts, was rated as
one of the best in the 18th
century. Beranek who was conversant with the hall,
delineated the sound in the hall as clear, live, brilliant and loud (Beranek, 2004).
Muller (1992) verified that the certainty of the hall is not based on single feature to
have a satisfactory acoustics in the hall. The reverberation and envelopment
produced by the sound were confirmed to be very good. Bradley (1991) discovered
that there are a few audible differences between the halls, some of which can be
connected or linked to measurements.
Modern movement in architecture after First World War marked the end of
decorative mouldings‟, the statues in niches and coffered ceilings of the classical
halls. After this era, architects Auburtin, Granet and Mathon, designed Salle Pleyel of
1927, Paris (Barron, 2009). See appendix G: plate 7. Andrade (1932), in his research
on this particular hall recorded that he experienced a clear hearing throughout the
lecture hall, including the back gallery which is more than 45 metres away from the
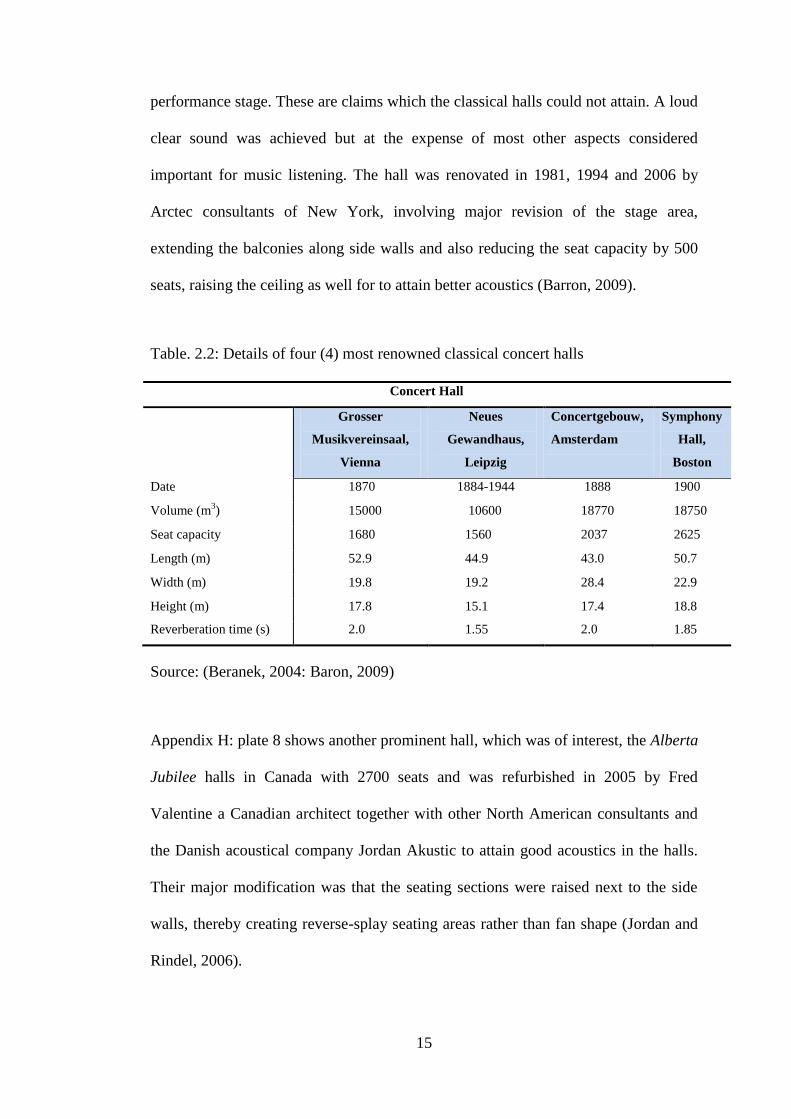
15
performance stage. These are claims which the classical halls could not attain. A loud
clear sound was achieved but at the expense of most other aspects considered
important for music listening. The hall was renovated in 1981, 1994 and 2006 by
Arctec consultants of New York, involving major revision of the stage area,
extending the balconies along side walls and also reducing the seat capacity by 500
seats, raising the ceiling as well for to attain better acoustics (Barron, 2009).
Table. 2.2: Details of four (4) most renowned classical concert halls
Concert Hall
Grosser
Musikvereinsaal,
Vienna
Neues
Gewandhaus,
Leipzig
Concertgebouw,
Amsterdam
Symphony
Hall,
Boston
Date 1870 1884-1944 1888 1900
Volume (m3) 15000 10600 18770 18750
Seat capacity 1680 1560 2037 2625
Length (m) 52.9 44.9 43.0 50.7
Width (m) 19.8 19.2 28.4 22.9
Height (m) 17.8 15.1 17.4 18.8
Reverberation time (s) 2.0 1.55 2.0 1.85
Source: (Beranek, 2004: Baron, 2009)
Appendix H: plate 8 shows another prominent hall, which was of interest, the Alberta
Jubilee halls in Canada with 2700 seats and was refurbished in 2005 by Fred
Valentine a Canadian architect together with other North American consultants and
the Danish acoustical company Jordan Akustic to attain good acoustics in the halls.
Their major modification was that the seating sections were raised next to the side
walls, thereby creating reverse-splay seating areas rather than fan shape (Jordan and
Rindel, 2006).
16
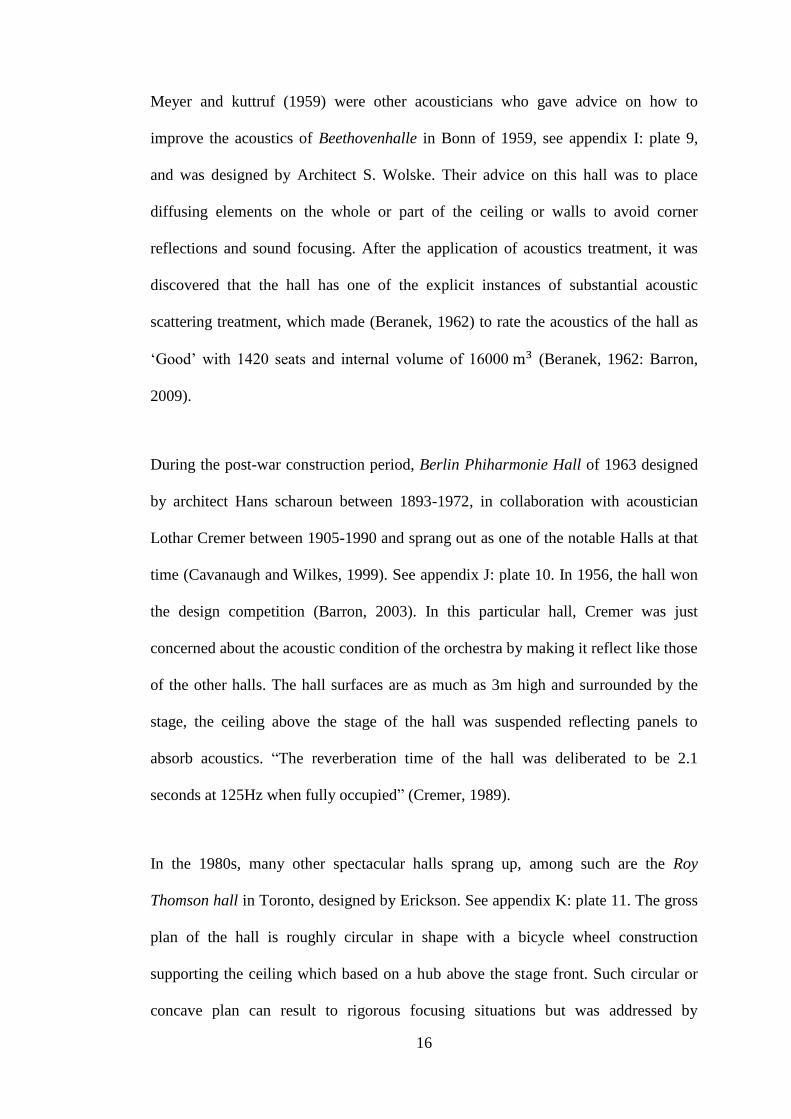
Meyer and kuttruf (1959) were other acousticians who gave advice on how to
improve the acoustics of Beethovenhalle in Bonn of 1959, see appendix I: plate 9,
and was designed by Architect S. Wolske. Their advice on this hall was to place
diffusing elements on the whole or part of the ceiling or walls to avoid corner
reflections and sound focusing. After the application of acoustics treatment, it was
discovered that the hall has one of the explicit instances of substantial acoustic
scattering treatment, which made (Beranek, 1962) to rate the acoustics of the hall as
„Good‟ with 1420 seats and internal volume of 16000 (Beranek, 1962: Barron,
2009).
During the post-war construction period, Berlin Phiharmonie Hall of 1963 designed
by architect Hans scharoun between 1893-1972, in collaboration with acoustician
Lothar Cremer between 1905-1990 and sprang out as one of the notable Halls at that
time (Cavanaugh and Wilkes, 1999). See appendix J: plate 10. In 1956, the hall won
the design competition (Barron, 2003). In this particular hall, Cremer was just
concerned about the acoustic condition of the orchestra by making it reflect like those
of the other halls. The hall surfaces are as much as 3m high and surrounded by the
stage, the ceiling above the stage of the hall was suspended reflecting panels to
absorb acoustics. “The reverberation time of the hall was deliberated to be 2.1
seconds at 125Hz when fully occupied” (Cremer, 1989).
In the 1980s, many other spectacular halls sprang up, among such are the Roy
Thomson hall in Toronto, designed by Erickson. See appendix K: plate 11. The gross
plan of the hall is roughly circular in shape with a bicycle wheel construction
supporting the ceiling which based on a hub above the stage front. Such circular or
concave plan can result to rigorous focusing situations but was addressed by
17
substantial segmentation of the walls. In 1978, tilted reflectors were introduced
around the side walls to ameliorate the early lateral reflections. The overstage panels
were originally 2.1m diameter convex circular „saucers‟ made of clear acrylic plastic,
covering 40 percent of the stage area. These reflecting panels were orientate to serve
the stage, main floor and the first balcony and the reverberation time in fully
occupied situation was about 1.8 seconds which can be reduced to 1.4 seconds
(Barron, 2009). “The hall was renovated in 2002 due to criticisms of the acoustics by
architect Alison Rose in collaboration with Thomas Payne of Kuwabara, Payne
McKenna Blumberg (KPMB) Architects and Russell Johnson of Artec Consultants
Inc” (Alison, 2009).
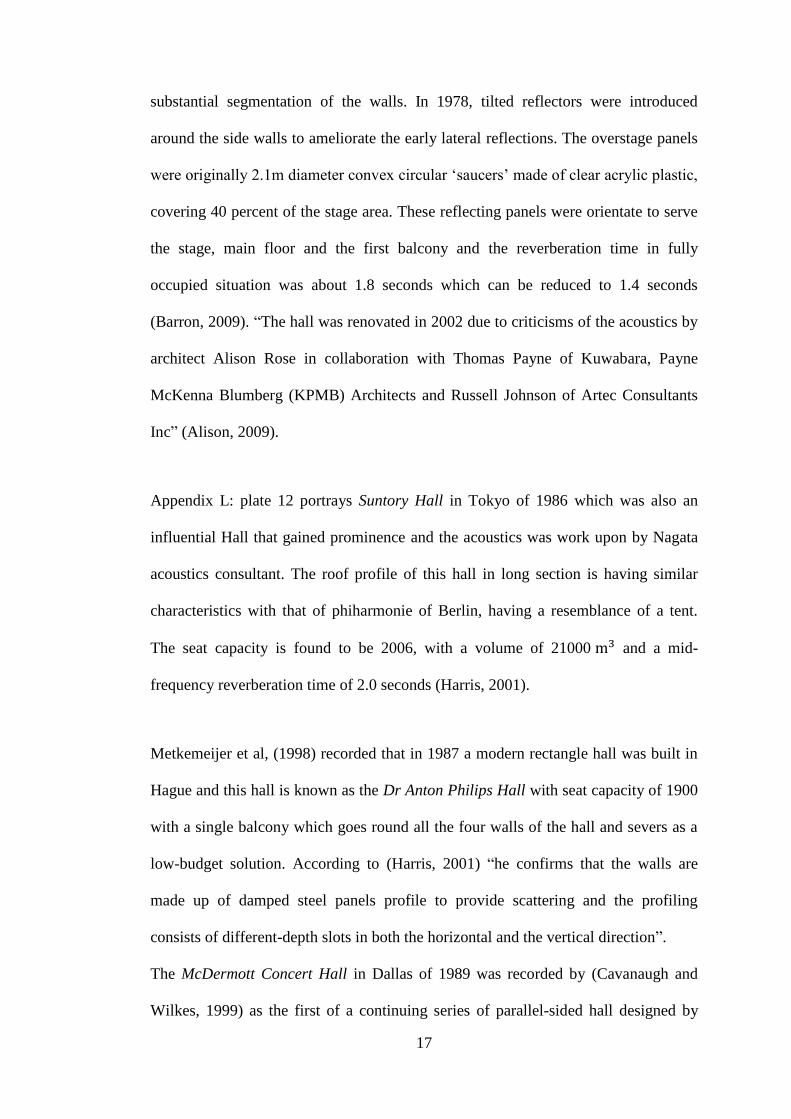
Appendix L: plate 12 portrays Suntory Hall in Tokyo of 1986 which was also an
influential Hall that gained prominence and the acoustics was work upon by Nagata
acoustics consultant. The roof profile of this hall in long section is having similar
characteristics with that of phiharmonie of Berlin, having a resemblance of a tent.
The seat capacity is found to be 2006, with a volume of 21000 and a mid-
frequency reverberation time of 2.0 seconds (Harris, 2001).
Metkemeijer et al, (1998) recorded that in 1987 a modern rectangle hall was built in
Hague and this hall is known as the Dr Anton Philips Hall with seat capacity of 1900
with a single balcony which goes round all the four walls of the hall and severs as a
low-budget solution. According to (Harris, 2001) “he confirms that the walls are
made up of damped steel panels profile to provide scattering and the profiling
consists of different-depth slots in both the horizontal and the vertical direction”.
The McDermott Concert Hall in Dallas of 1989 was recorded by (Cavanaugh and
Wilkes, 1999) as the first of a continuing series of parallel-sided hall designed by

18
Artec. The hall consists of about 2065 seats with a chamber volume of 7200 m3, 30
percent of the auditorium. See appendix M: plate 13. An example of a hall with
terrace is the Kitara Concert Hall of 1997 in Sapporo, Japan with Nagata acoustics as
the acoustics consultant. In this hall, the introduction of large convex surface
common to ameliorate sound and the hall was flexible as well (Beranek, 2004).
From the selected Halls studied in the literature review of both early and recent Halls,
in this thesis shows that reverberation time has always been a major problem in halls
either large or small.
2.2 The physical characteristics of sound
The attribute or features of sound that can be detected by the human ear comprises
the followings:
1. Frequency: “The frequency of a sound wave is simply the number of complete
vibrations occurring per unit of time and it is measured in decibels (dB)”
(Cavanaugh and Wilkes, 1999). “The decibel scale is a logarithmic scale based
on the logarithm of the ratio of a sound pressure to a reference sound pressure
(the threshold of audibility), while the frequency of sound waves is measured in
Hertz (HZ, also known as cycles per second) and grouped into octaves (an octave
band is labeled by its geometric center frequency). Human hearing is most acute
in the 1000 to 4000 HZ octave bands” (Binggeli and Greichen, 2011). Table 2.3
shows the recommended centre frequencies and the band limits of eight octave
band in common use.
19
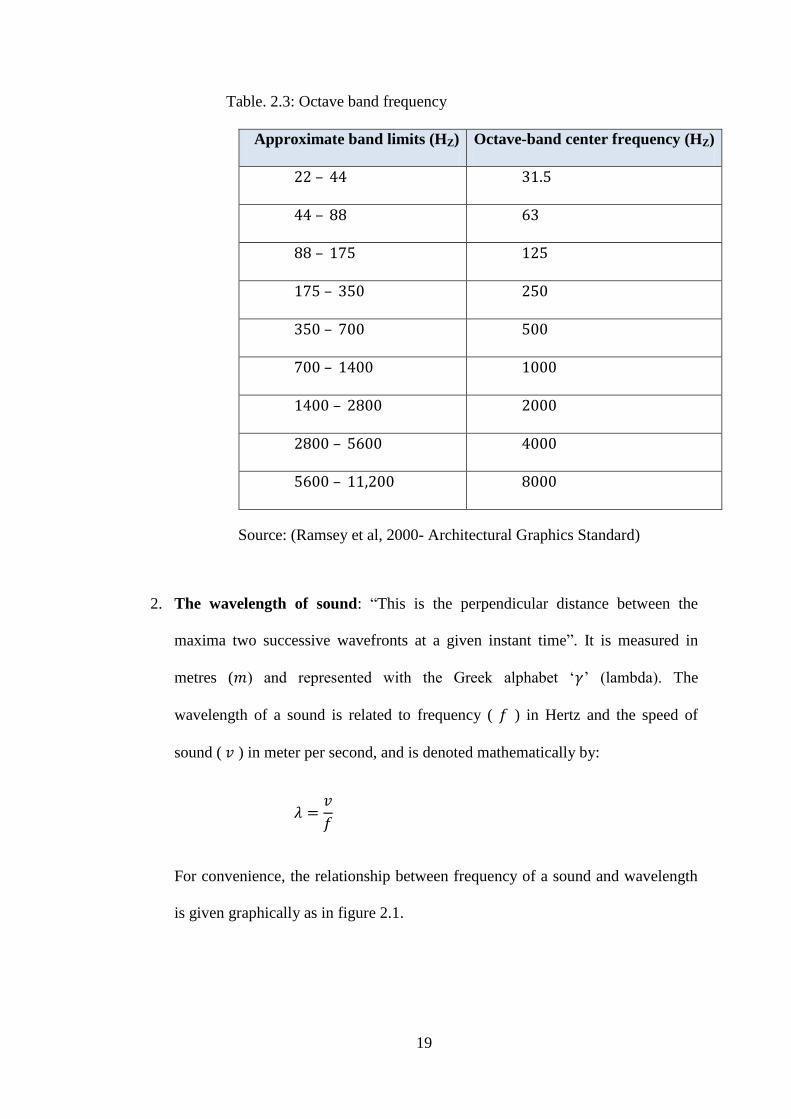
Table. 2.3: Octave band frequency
Approximate band limits (HZ) Octave-band center frequency (HZ)
Source: (Ramsey et al, 2000- Architectural Graphics Standard)
2. The wavelength of sound: “This is the perpendicular distance between the
maxima two successive wavefronts at a given instant time”. It is measured in
metres ( ) and represented with the Greek alphabet „ ‟ (lambda). The
wavelength of a sound is related to frequency ( ) in Hertz and the speed of
sound ( ) in meter per second, and is denoted mathematically by:
For convenience, the relationship between frequency of a sound and wavelength
is given graphically as in figure 2.1.

20
Fig. 2.1: Relationship between frequency f and wavelength of sound in air
(Source: Harris, 1994)
3. Period: This simply means the time taken for one complete cycle or oscillation,
denoted by capital letter „ ‟ and measured in seconds ( ).
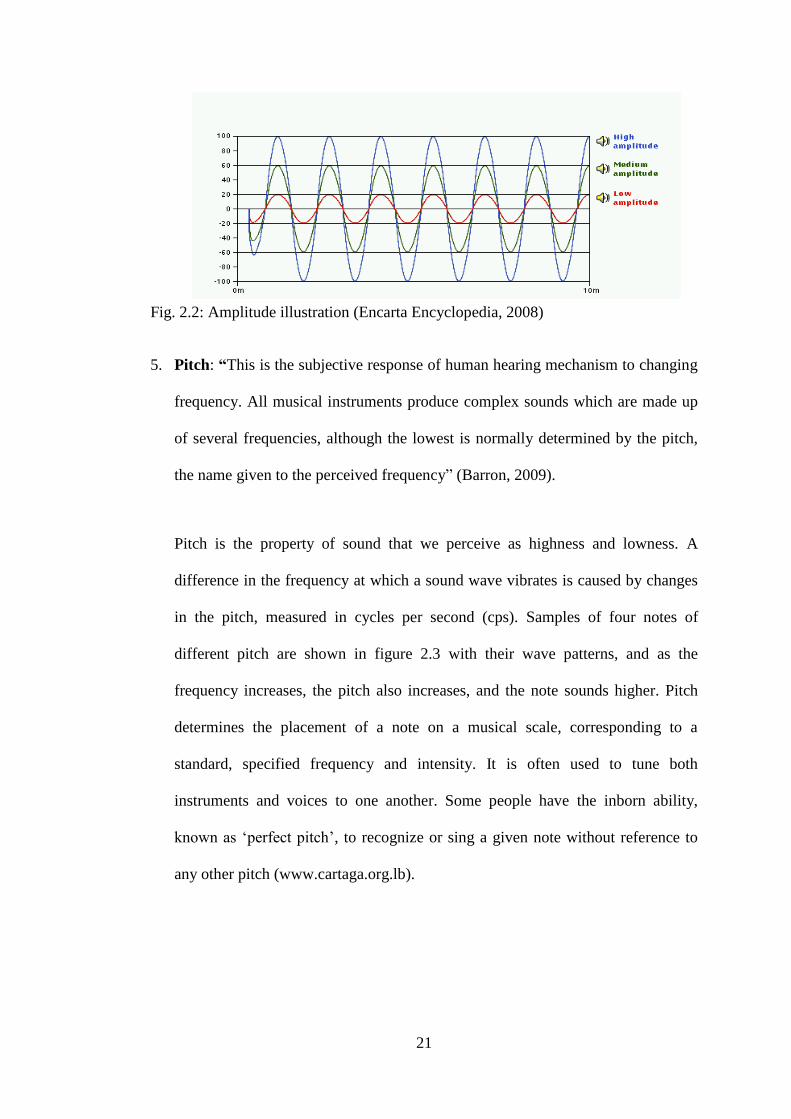
4. Amplitude: We perceive amplitude as volume and this is known as the
maximum displacement a wave travels from the normal or zero position, as
shown in figure 2.2. This distance corresponds to the level of motion in the air
molecules of a wave. “As the level of motion in the molecules increases, its strike
the ear drums with greater force progressively and as a result causes the ear to
react to a louder sound”. “The amplitude of a sound wave is ascertained by the
magnitude of the pressure fluctuation” (Barron, 1995). “Therefore, the greater the
amplitude of the wave, the harder the molecules strikes the eardrum and the
louder the sound that is perceived. However, the range of pressure to which our
ears can react exceeds a ratio of one to million and response is not linear”
(Blauert, 1983).
21
Fig. 2.2: Amplitude illustration (Encarta Encyclopedia, 2008)
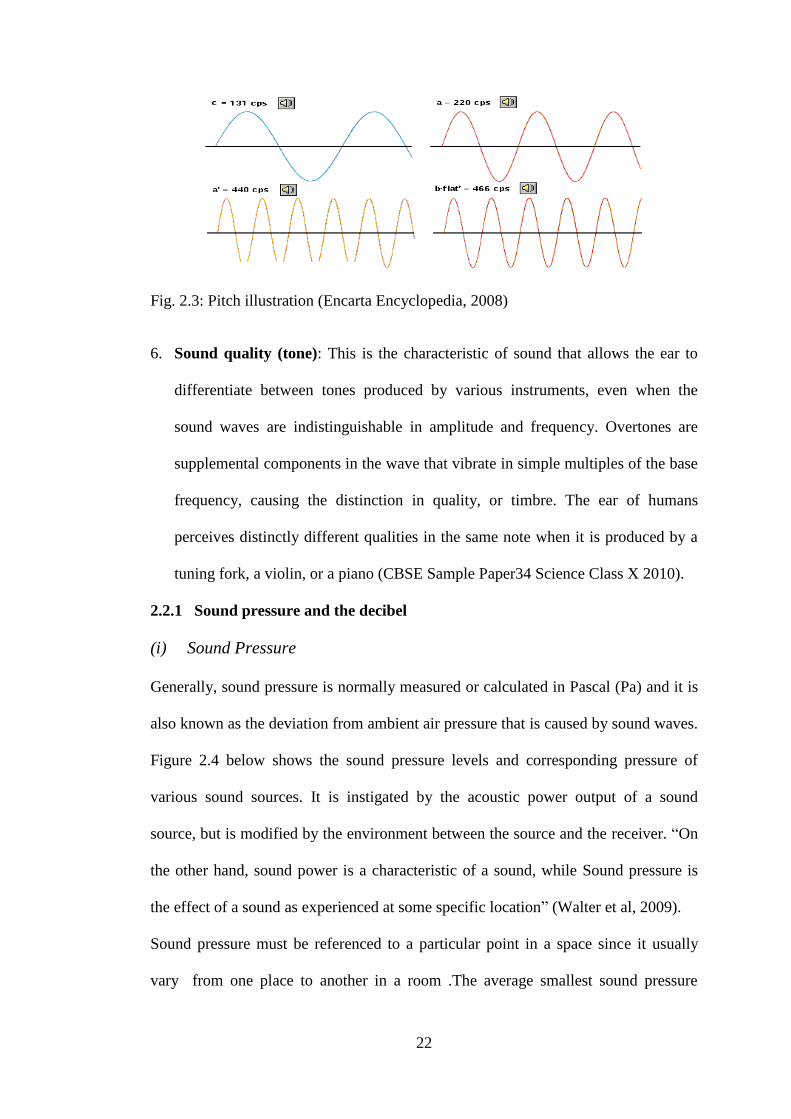
5. Pitch: “This is the subjective response of human hearing mechanism to changing
frequency. All musical instruments produce complex sounds which are made up
of several frequencies, although the lowest is normally determined by the pitch,
the name given to the perceived frequency” (Barron, 2009).
Pitch is the property of sound that we perceive as highness and lowness. A
difference in the frequency at which a sound wave vibrates is caused by changes
in the pitch, measured in cycles per second (cps). Samples of four notes of
different pitch are shown in figure 2.3 with their wave patterns, and as the
frequency increases, the pitch also increases, and the note sounds higher. Pitch
determines the placement of a note on a musical scale, corresponding to a
standard, specified frequency and intensity. It is often used to tune both
instruments and voices to one another. Some people have the inborn ability,
known as „perfect pitch‟, to recognize or sing a given note without reference to
any other pitch (www.cartaga.org.lb).
22
Fig. 2.3: Pitch illustration (Encarta Encyclopedia, 2008)
6. Sound quality (tone): This is the characteristic of sound that allows the ear to
differentiate between tones produced by various instruments, even when the
sound waves are indistinguishable in amplitude and frequency. Overtones are
supplemental components in the wave that vibrate in simple multiples of the base
frequency, causing the distinction in quality, or timbre. The ear of humans
perceives distinctly different qualities in the same note when it is produced by a
tuning fork, a violin, or a piano (CBSE Sample Paper34 Science Class X 2010).
2.2.1 Sound pressure and the decibel
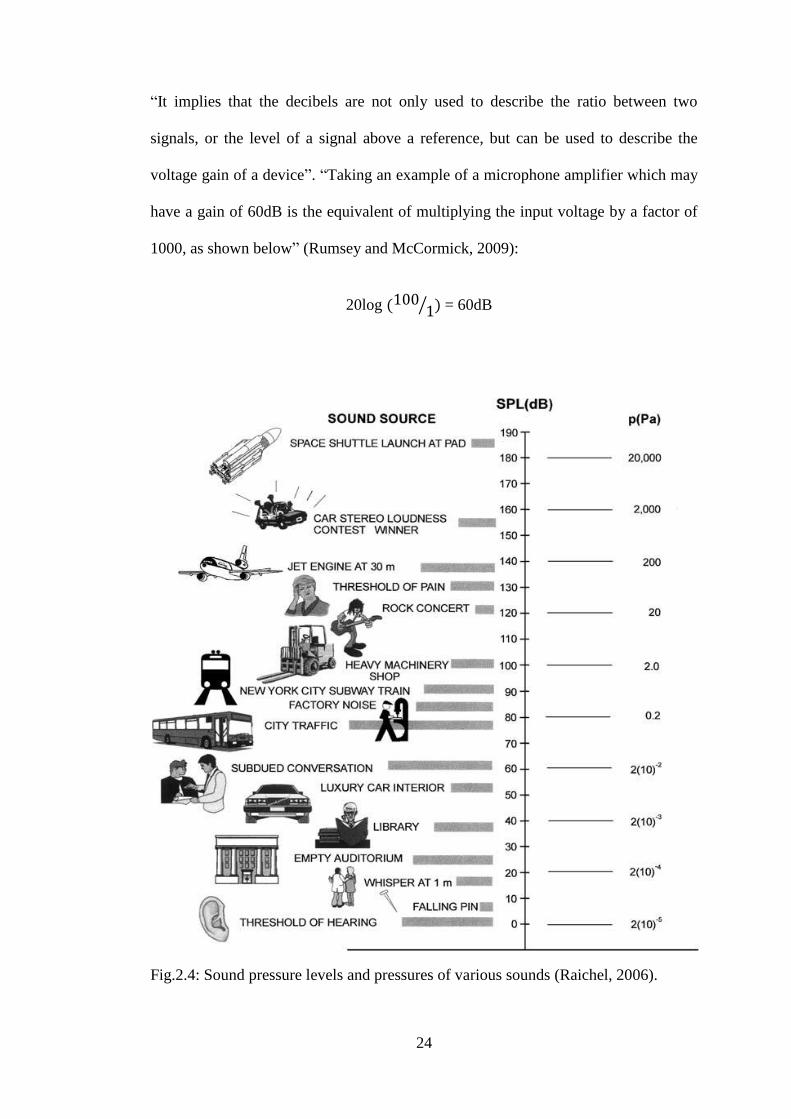
(i) Sound Pressure
Generally, sound pressure is normally measured or calculated in Pascal (Pa) and it is
also known as the deviation from ambient air pressure that is caused by sound waves.
Figure 2.4 below shows the sound pressure levels and corresponding pressure of
various sound sources. It is instigated by the acoustic power output of a sound
source, but is modified by the environment between the source and the receiver. “On
the other hand, sound power is a characteristic of a sound, while Sound pressure is
the effect of a sound as experienced at some specific location” (Walter et al, 2009).
Sound pressure must be referenced to a particular point in a space since it usually
vary from one place to another in a room .The average smallest sound pressure
23
human ear can detect is around Pascal (Pa). Humans begin to sense sound
painful when the sound pressure is around 20Pa (Walter et al, 2009).
Atmospheric pressure has value of Pa.
Therefore, 1 Pascal = micropascal
= 1 Newton/ (
= 10 microbar
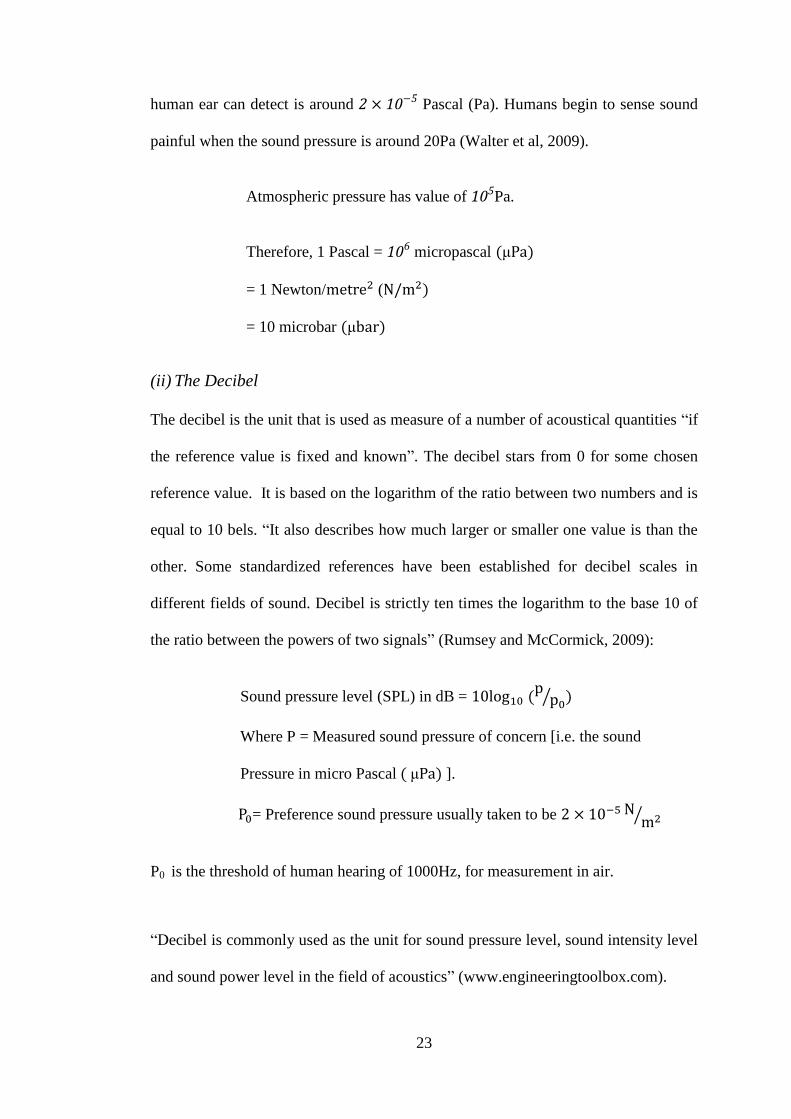
(ii) The Decibel
The decibel is the unit that is used as measure of a number of acoustical quantities “if
the reference value is fixed and known”. The decibel stars from 0 for some chosen
reference value. It is based on the logarithm of the ratio between two numbers and is
equal to 10 bels. “It also describes how much larger or smaller one value is than the
other. Some standardized references have been established for decibel scales in
different fields of sound. Decibel is strictly ten times the logarithm to the base 10 of
the ratio between the powers of two signals” (Rumsey and McCormick, 2009):
Sound pressure level (SPL) in dB =
Where P = Measured sound pressure of concern [i.e. the sound
Pressure in micro Pascal ].
= Preference sound pressure usually taken to be
P0 is the threshold of human hearing of 1000Hz, for measurement in air.
“Decibel is commonly used as the unit for sound pressure level, sound intensity level
and sound power level in the field of acoustics” (www.engineeringtoolbox.com).
24
“It implies that the decibels are not only used to describe the ratio between two
signals, or the level of a signal above a reference, but can be used to describe the
voltage gain of a device”. “Taking an example of a microphone amplifier which may
have a gain of 60dB is the equivalent of multiplying the input voltage by a factor of
1000, as shown below” (Rumsey and McCormick, 2009):
20log = 60dB
Fig.2.4: Sound pressure levels and pressures of various sounds (Raichel, 2006).
25
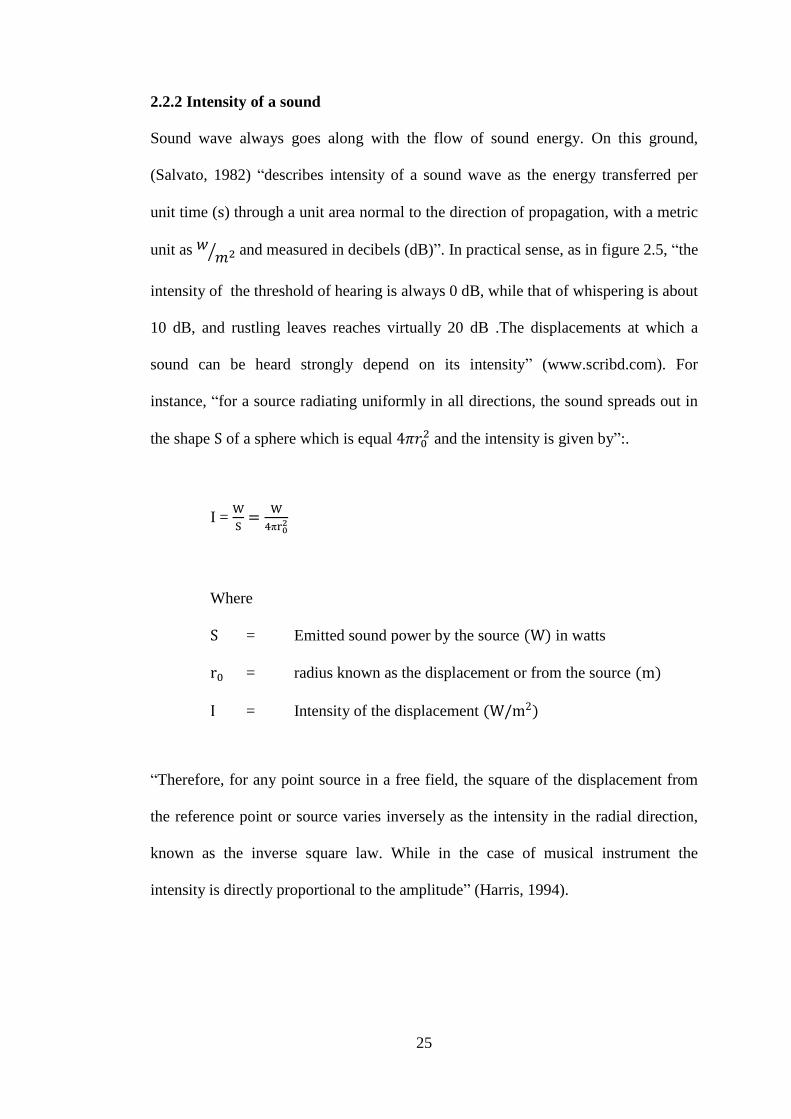
2.2.2 Intensity of a sound
Sound wave always goes along with the flow of sound energy. On this ground,
(Salvato, 1982) “describes intensity of a sound wave as the energy transferred per
unit time ( ) through a unit area normal to the direction of propagation, with a metric
unit as and measured in decibels (dB)”. In practical sense, as in figure 2.5, “the
intensity of the threshold of hearing is always 0 dB, while that of whispering is about
10 dB, and rustling leaves reaches virtually 20 dB .The displacements at which a
sound can be heard strongly depend on its intensity” (www.scribd.com). For
instance, “for a source radiating uniformly in all directions, the sound spreads out in
the shape of a sphere which is equal and the intensity is given by”:.
I =
Where
= Emitted sound power by the source in watts
= radius known as the displacement or from the source
= Intensity of the displacement
“Therefore, for any point source in a free field, the square of the displacement from
the reference point or source varies inversely as the intensity in the radial direction,
known as the inverse square law. While in the case of musical instrument the
intensity is directly proportional to the amplitude” (Harris, 1994).

26
Fig. 2.5: Graphical representation of various sound intensities in decibel (adapted
from Raichel, 2006)
2.2.3 Threshold of hearing and threshold of pain
(i) Threshold of hearing
Kinsler et al, (1982) “described threshold of hearing as the weakest sound an average
human ear can detect. It is remarkably low and occurs when a distance less than the
diameter of a single atom deflects the membrane in the ear”. “The value of the
threshold varies slightly from person to person but for reference purposes it is
defined to have the following values at 1000HZ” (McMullan, 1983):
When measured as intensity =
When measured as pressure =
0
20
40
60
80
100
120
140
sou
nd
pre
ssu
re le
vel [
dB
]
27
(ii) Threshold of pain
Threshold of pain as described by McMullan, (1983) “is the strongest sound a human
ear can tolerate. Very strong sounds become painful to the ear mechanism and very
large pressure will have other harmful physical effect, such as those experienced in
an explosion, for instance a bomb blast. The threshold of pain has the following
approximate values”.
When measured as intensity =
When measured as pressure =
2.3 Human ear, perception of sound and its consequences
(i) Hearing
Hearing is the perception of sound by human beings or mammals and the sense of
hearing includes the ear and the brain (Shepherd, 1994). According to Elert Glenn in
Wikipedia, the free encyclopedia of 2004, he stated that “Hearing or audition is the
sense of sound perception and results from tiny hair fibers in the inner ear detecting
the motion of atmospheric particles within (at best) a range of 20 to 20000 Hz”, as
shown in figure 2.6. “He also expressed that Sound can also be detected as vibration
by tactition”, although the effect of sound on humans varies from person to person
(Wikipedia, 2004).
According to (Encarta, 2008), “humans however, can hear vibrations passing through
gases, solids, and liquids. In some cases, sound waves are transmitted to the inner ear
by a method of hearing called bone conductivity”. “People can hear their own voice
partly by bone conductivity” (Encarta, 2008). Table 2.4 shows the comparison of
frequency ranges for some common sounds and human hearing.
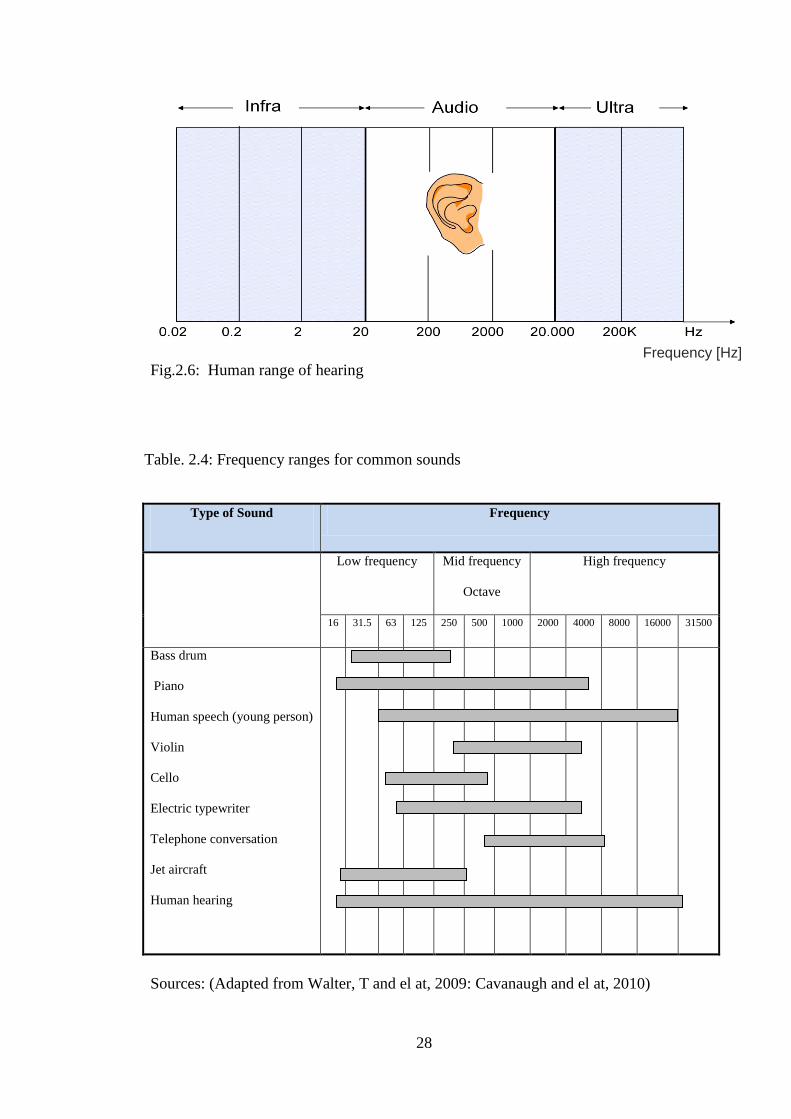
28
Fig.2.6: Human range of hearing
Table. 2.4: Frequency ranges for common sounds
Type of Sound Frequency
Low frequency Mid frequency
Octave
High frequency
16 31.5 63 125 250 500 1000 2000 4000 8000 16000 31500
Bass drum
Piano
Human speech (young person)
Violin
Cello
Electric typewriter
Telephone conversation
Jet aircraft
Human hearing
Sources: (Adapted from Walter, T and el at, 2009: Cavanaugh and el at, 2010)
Frequency [Hz]
29
Health and medical online article, (2011) “reports that the voice causes the bones of
the skull to vibrate, and these vibrations directly stimulate the sound-sensitive cells of
the inner ear”. “Only a comparatively small part of a normal person‟s hearing
depends on bone conductivity, but some totally deaf people can be helped if sound
vibrations are transferred to the skull bones by a hearing aid” (auuuu.org, 2011).
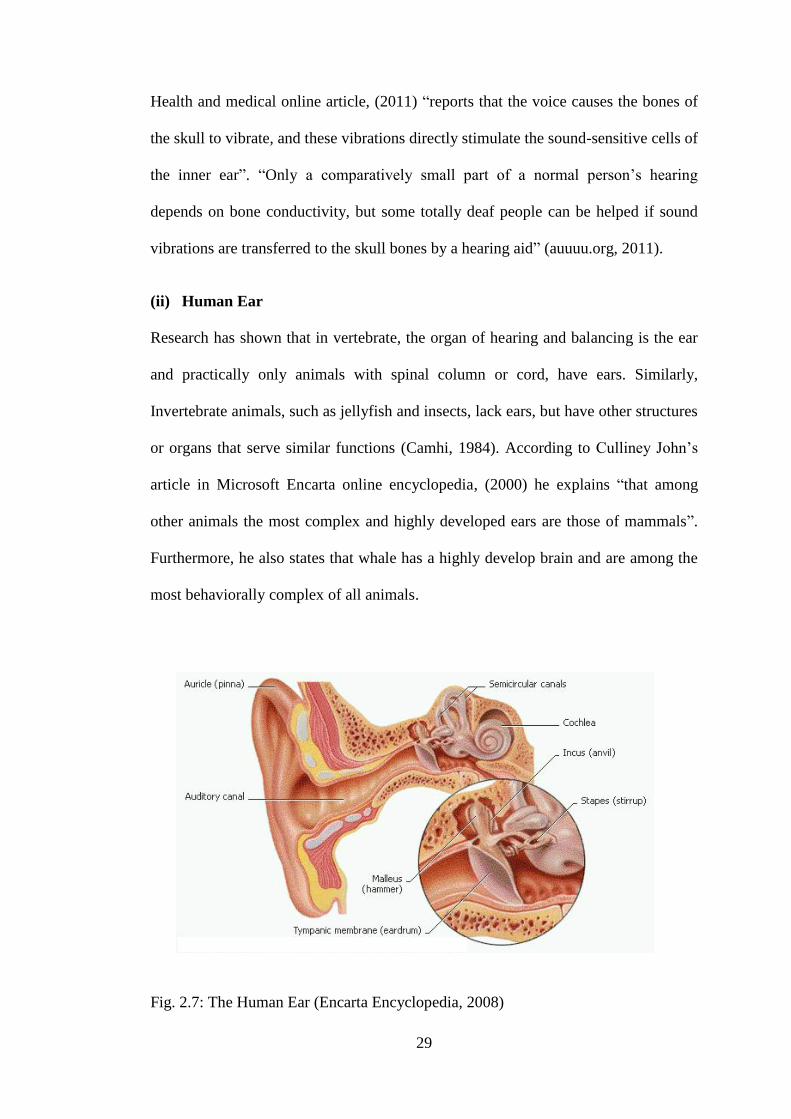
(ii) Human Ear
Research has shown that in vertebrate, the organ of hearing and balancing is the ear
and practically only animals with spinal column or cord, have ears. Similarly,
Invertebrate animals, such as jellyfish and insects, lack ears, but have other structures
or organs that serve similar functions (Camhi, 1984). According to Culliney John‟s
article in Microsoft Encarta online encyclopedia, (2000) he explains “that among
other animals the most complex and highly developed ears are those of mammals”.
Furthermore, he also states that whale has a highly develop brain and are among the
most behaviorally complex of all animals.
Fig. 2.7: The Human Ear (Encarta Encyclopedia, 2008)
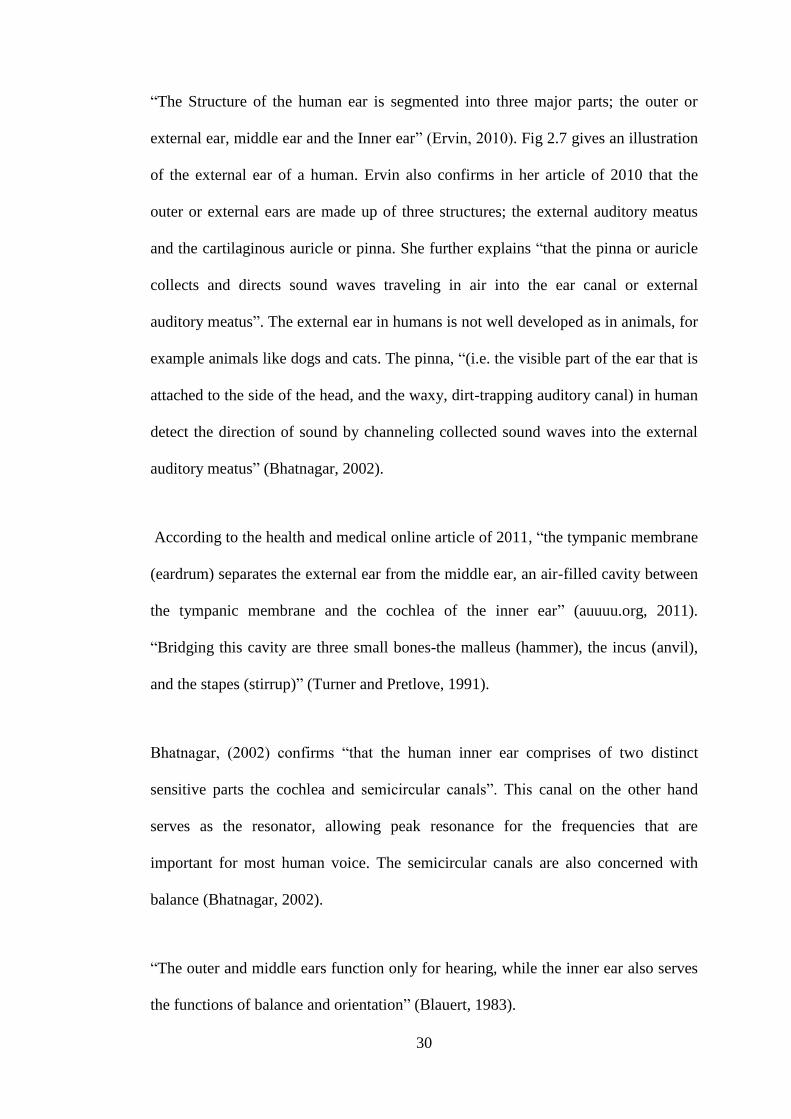
30
“The Structure of the human ear is segmented into three major parts; the outer or
external ear, middle ear and the Inner ear” (Ervin, 2010). Fig 2.7 gives an illustration
of the external ear of a human. Ervin also confirms in her article of 2010 that the
outer or external ears are made up of three structures; the external auditory meatus
and the cartilaginous auricle or pinna. She further explains “that the pinna or auricle
collects and directs sound waves traveling in air into the ear canal or external
auditory meatus”. The external ear in humans is not well developed as in animals, for
example animals like dogs and cats. The pinna, “(i.e. the visible part of the ear that is
attached to the side of the head, and the waxy, dirt-trapping auditory canal) in human
detect the direction of sound by channeling collected sound waves into the external
auditory meatus” (Bhatnagar, 2002).
According to the health and medical online article of 2011, “the tympanic membrane
(eardrum) separates the external ear from the middle ear, an air-filled cavity between
the tympanic membrane and the cochlea of the inner ear” (auuuu.org, 2011).
“Bridging this cavity are three small bones-the malleus (hammer), the incus (anvil),
and the stapes (stirrup)” (Turner and Pretlove, 1991).
Bhatnagar, (2002) confirms “that the human inner ear comprises of two distinct
sensitive parts the cochlea and semicircular canals”. This canal on the other hand
serves as the resonator, allowing peak resonance for the frequencies that are
important for most human voice. The semicircular canals are also concerned with
balance (Bhatnagar, 2002).
“The outer and middle ears function only for hearing, while the inner ear also serves
the functions of balance and orientation” (Blauert, 1983).
31
Report has also shown “that some animals can only detect vibrations passing through
the ground, while some can hear sound or vibrations passing through water”
(auuuu.org, 2011). “The ear of humans is capable of hearing many of the sounds
produced in nature, but certainly not all sounds can be heard by them” (Blauert,
1983).
However, “low frequencies like a heartbeat of 1 or 2 Hz cannot be heard by humans,
unlike sonar sounds produced by dolphins which are too high”. “Frequency that is
below the human range is known as infrasound, but may be detected by a creature
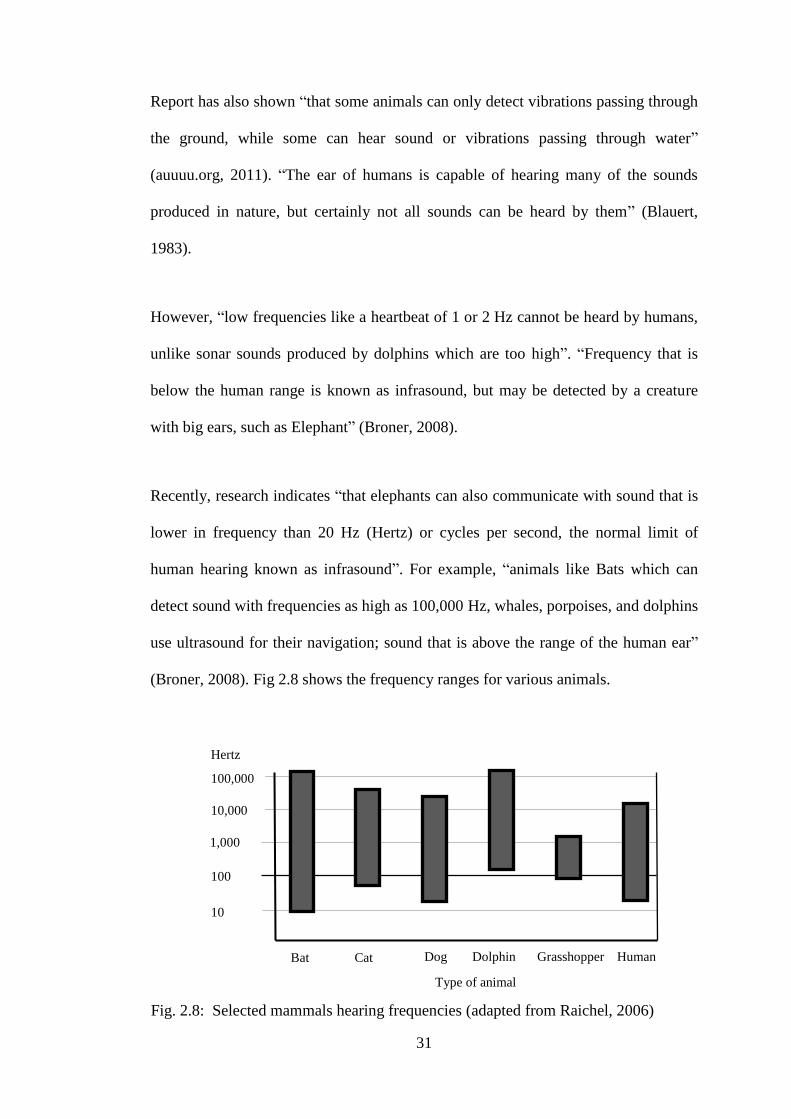
with big ears, such as Elephant” (Broner, 2008).
Recently, research indicates “that elephants can also communicate with sound that is
lower in frequency than 20 Hz (Hertz) or cycles per second, the normal limit of
human hearing known as infrasound”. For example, “animals like Bats which can
detect sound with frequencies as high as 100,000 Hz, whales, porpoises, and dolphins
use ultrasound for their navigation; sound that is above the range of the human ear”
(Broner, 2008). Fig 2.8 shows the frequency ranges for various animals.
Human Dolphin Dog Cat Bat Grasshopper
100,000
10,000
1,000
100
10
Hertz
Type of animal
Fig. 2.8: Selected mammals hearing frequencies (adapted from Raichel, 2006)

32
2.3.1 Consequences of noise on humans
According to (Kinsler et al, 1982), he described that the effect of noise on human
emotions ranges from annoyance, anger, and to psychological disruption.
He asserts that physiologically, noise can varies from harmless to painful and
physically damaging. Furthermore, he avers that noise can affect economic factors by
decreasing workers efficiency, affecting turnover and altering profit margins.
According to the publication of World Health Organisations (WHO) of 1998 on
Environmental Health Criteria, (Berglund and Lindvall, 1995) defined health as “a
state of complete physical, mental and society well-being and not nearly the abuse of
disease infinity”. Their statement shows that excessive noise is clearly a health
problem to humans.
Cheremisinoff, (1996) on the other hand categorized the effects of noise as;
“annoyance, effect on human performance, induced hearing loss effect, nonauditory
health effects, individual behavior effects, effects on sleep, communication
interference effect, effects on domestic animals and wildlife”.
Apart from the effect of noise listed above, it also affects the “circulatory and
nervous system”. “The effects of noise are difficult to assess at a time, since
individuals react differently to noise depending on age, sex and socioeconomic
background”. “The relationship of noise to productivity or performance is
contradicting and not well established, but over a longtime it may be a terrible health
hazard to the body system”. “Some booms like bomb blast or gunshot can cause
physical damage to the entire body structures over a time period, which indicated that
33
long time exposure to high level noise is more harmful than intermittent noise on
occasional exposure” (Jacko and LaBreche, 2009).
“High and middle frequency sound at high levels is generally more harmful than low-
frequency sound at the same level”. Therefore, “greater harm is done with increased
time of exposure” (Murray and Lewis, 1995).
2.3.2 Acoustic trauma
Martin and Martin (2010), states that “acoustic trauma is an injury obtain in the
hearing mechanisms, which usually occurs in the inner ear due to very loud noise
(noise level greater than 140-150 dB), such as an explosion near the ear, gunshot or
long-term exposure to loud noises (loud music or machinery)”. “It is a common
cause of sensory hearing loss which may lead to the damage of the ear drum,
ossicles, and the hair cells, supporting cells and tissues of the organ corti” (Salvi et
al. 1998).
2.3.3 Temporary threshold shift (TTS)
William (1991) ,“defined temporary threshold shift as a temporary change in hearing
level that recovers between exposures, resulting from sound levels over about 70 to
75dB (A)”. For instance, “If a car radio is turn up after a noisy work day, then it may
found out that the next morning there will be an increment in the sound of the radio,
in this case we may be experiencing TTS and this may last, depending on the nature
of the exposure and the individuals, for minutes, hours, or days, after the sound has
stopped”. “As long as intervals between exposures are long enough for complete
recovery, it is unlikely that permanent damage will occur”. “It is thought that TTS is
due to reversible biochemical changes to the stereocilia of the hair cells” (Melnick,
1991).
34
2.3.4 Permanent threshold shift (PTS)
“This is as a result of continued or repeated exposure to excessive noise over a period
of time, which may lead to permanent damage to the ear, although this process
occurs gradually”. “Normally, it is the hair cells in the inner ear, which detect the 4-6
kHz frequencies, which deteriorate first” (William 1991). “As most of the speech
frequencies are below this range, the loss may initially go unnoticed”. “With further
excessive noise exposure, the hearing loss increases and extends down to lower
frequencies as well and the person begins to have trouble understanding speech”
(Gelfrand, 2009).
2.3.5 Tinnitus
“Tinnitus is the term given to noises which are perceived in the ears or in the head;
such noises can be running, buzzing, hissing, whistling, and pulsing”. “It can also be
other sounds which do not come from an external source” (Gunn, 2009). “Research
into the causes of tinnitus is still ongoing”. “However, the current theory is that
damage to the hair cells of the inner ear causes the generation of weakness, abnormal
nerve impulses, which are mistakenly perceived by the brain as real external sounds”
(Gunn, 2009: Gelfrand, 2009).
2.4 Source of unwanted noise
The source of noise must be determined by professionals if lasting solutions are to be
provided to noise pollution in our society. Different people have identified a number
of sources of noise pollution in our environment.
According to (Salvato, 1982), he classified the major sources of noise pollution as;
urban noise, commercial activities noise, residential contribution noise, and
community noise.
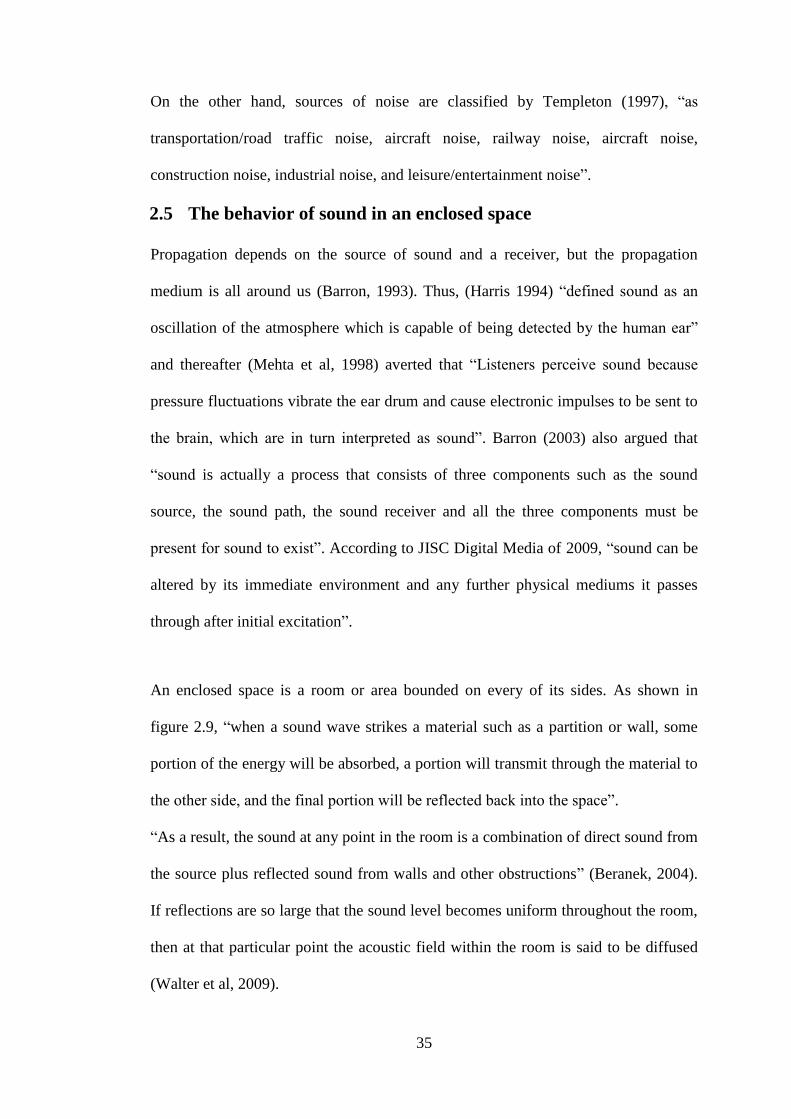
35
On the other hand, sources of noise are classified by Templeton (1997), “as
transportation/road traffic noise, aircraft noise, railway noise, aircraft noise,
construction noise, industrial noise, and leisure/entertainment noise”.
2.5 The behavior of sound in an enclosed space
Propagation depends on the source of sound and a receiver, but the propagation
medium is all around us (Barron, 1993). Thus, (Harris 1994) “defined sound as an
oscillation of the atmosphere which is capable of being detected by the human ear”
and thereafter (Mehta et al, 1998) averted that “Listeners perceive sound because
pressure fluctuations vibrate the ear drum and cause electronic impulses to be sent to
the brain, which are in turn interpreted as sound”. Barron (2003) also argued that
“sound is actually a process that consists of three components such as the sound
source, the sound path, the sound receiver and all the three components must be
present for sound to exist”. According to JISC Digital Media of 2009, “sound can be
altered by its immediate environment and any further physical mediums it passes
through after initial excitation”.
An enclosed space is a room or area bounded on every of its sides. As shown in
figure 2.9, “when a sound wave strikes a material such as a partition or wall, some
portion of the energy will be absorbed, a portion will transmit through the material to
the other side, and the final portion will be reflected back into the space”.
“As a result, the sound at any point in the room is a combination of direct sound from
the source plus reflected sound from walls and other obstructions” (Beranek, 2004).
If reflections are so large that the sound level becomes uniform throughout the room,
then at that particular point the acoustic field within the room is said to be diffused
(Walter et al, 2009).
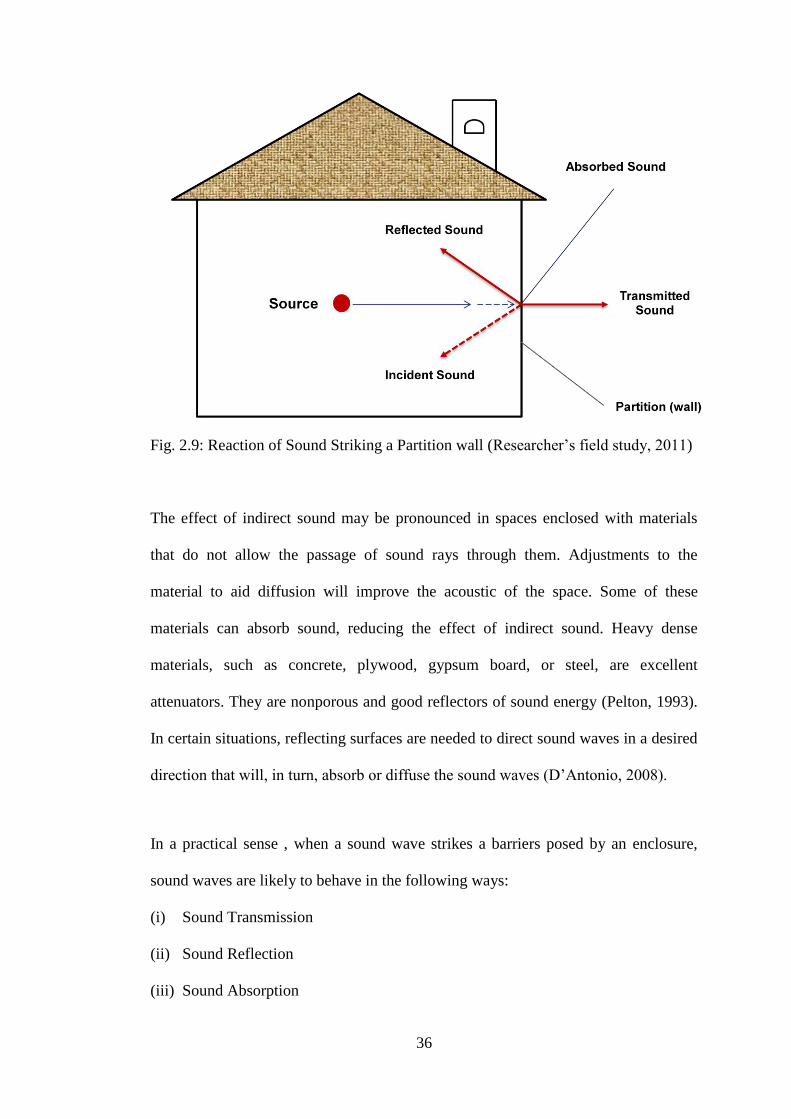
36
The effect of indirect sound may be pronounced in spaces enclosed with materials
that do not allow the passage of sound rays through them. Adjustments to the
material to aid diffusion will improve the acoustic of the space. Some of these
materials can absorb sound, reducing the effect of indirect sound. Heavy dense
materials, such as concrete, plywood, gypsum board, or steel, are excellent
attenuators. They are nonporous and good reflectors of sound energy (Pelton, 1993).
In certain situations, reflecting surfaces are needed to direct sound waves in a desired
direction that will, in turn, absorb or diffuse the sound waves (D‟Antonio, 2008).
In a practical sense , when a sound wave strikes a barriers posed by an enclosure,
sound waves are likely to behave in the following ways:
(i) Sound Transmission
(ii) Sound Reflection
(iii) Sound Absorption
Fig. 2.9: Reaction of Sound Striking a Partition wall (Researcher‟s field study, 2011)

37
(iv) Sound Diffusion
(v) Sound Diffraction
(vi) Direct and indirect sound
2.5.1 Sound transmittance
Hammershoi and Moller (1996), “defined sound transmittance is the ratio of
transmitted sound to the incoming sound. They also confirms that the ratio of sound
intensity on the receiver side to the sound intensity on the source side of the partition
element”. “Efficiency of walls and floors in preventing sound transmission depends
on their mass, the heavier the construction the less easily it is set into vibration and
the higher its vibration values” (Diament, 1986) . For instance, a sound travelling
from a room to an adjacent room (i.e. the receiving room), as shown in figure 2.10.
The transmitted sound level to the receiving room will depend on three basic factors
which are as below;
“The sound – isolating properties of the wall (i.e. sound transmission loss),
the total surface area of the common wall that radiates sound into the
adjacent room, and the total sound absorption present in the receiving room”
(Cavanaugh and Wilkes, 1999).
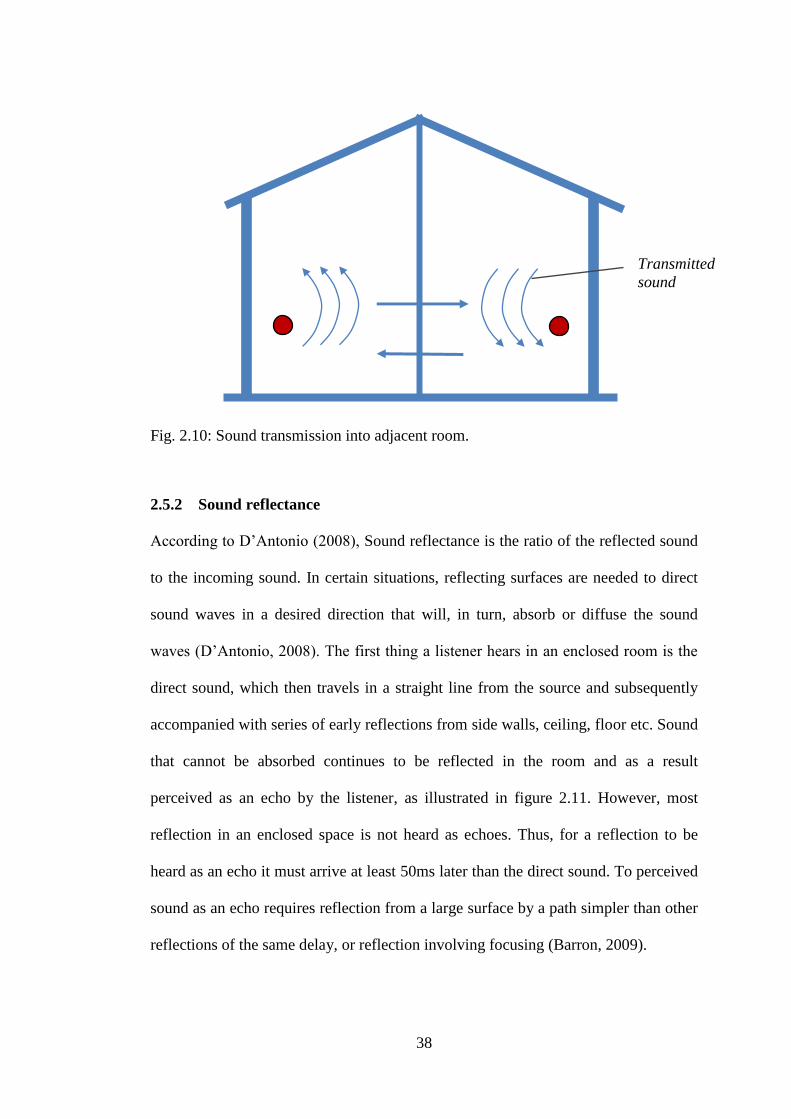
38
Fig. 2.10: Sound transmission into adjacent room.
2.5.2 Sound reflectance
According to D‟Antonio (2008), Sound reflectance is the ratio of the reflected sound
to the incoming sound. In certain situations, reflecting surfaces are needed to direct
sound waves in a desired direction that will, in turn, absorb or diffuse the sound
waves (D‟Antonio, 2008). The first thing a listener hears in an enclosed room is the
direct sound, which then travels in a straight line from the source and subsequently
accompanied with series of early reflections from side walls, ceiling, floor etc. Sound
that cannot be absorbed continues to be reflected in the room and as a result
perceived as an echo by the listener, as illustrated in figure 2.11. However, most
reflection in an enclosed space is not heard as echoes. Thus, for a reflection to be
heard as an echo it must arrive at least 50ms later than the direct sound. To perceived
sound as an echo requires reflection from a large surface by a path simpler than other
reflections of the same delay, or reflection involving focusing (Barron, 2009).
Transmitted
sound
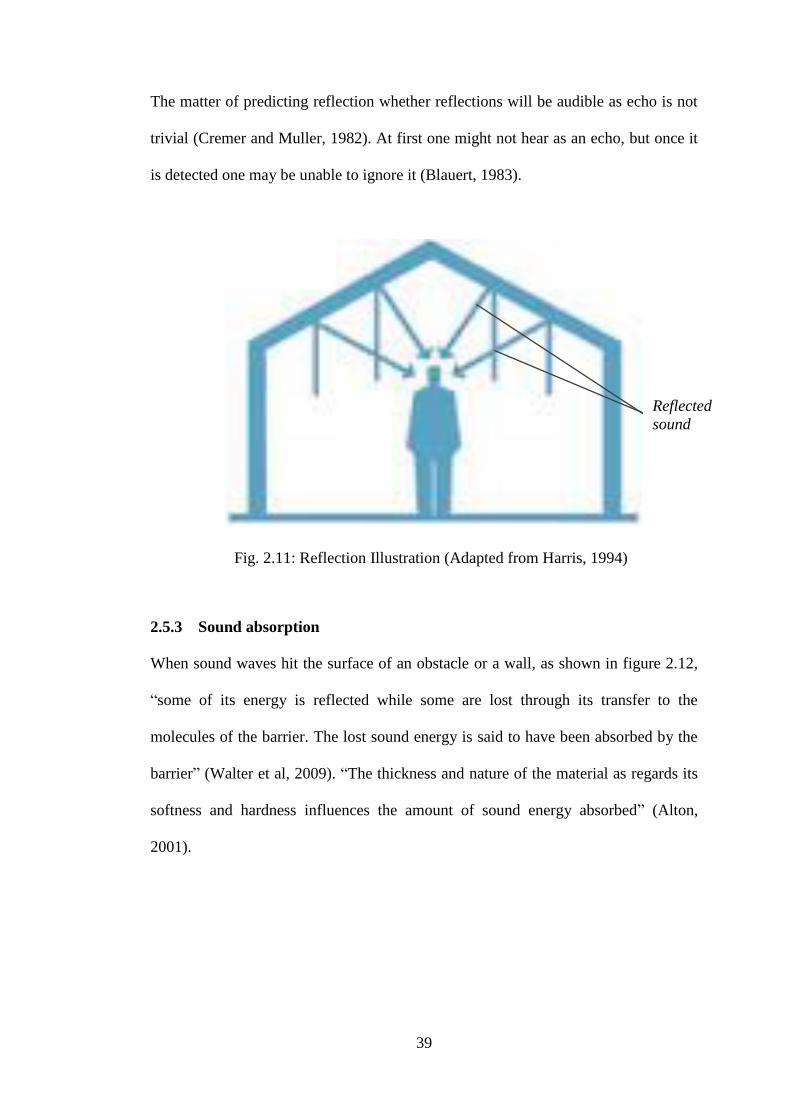
39
The matter of predicting reflection whether reflections will be audible as echo is not
trivial (Cremer and Muller, 1982). At first one might not hear as an echo, but once it
is detected one may be unable to ignore it (Blauert, 1983).
Fig. 2.11: Reflection Illustration (Adapted from Harris, 1994)
2.5.3 Sound absorption
When sound waves hit the surface of an obstacle or a wall, as shown in figure 2.12,
“some of its energy is reflected while some are lost through its transfer to the
molecules of the barrier. The lost sound energy is said to have been absorbed by the
barrier” (Walter et al, 2009). “The thickness and nature of the material as regards its
softness and hardness influences the amount of sound energy absorbed” (Alton,
2001).
Reflected
sound
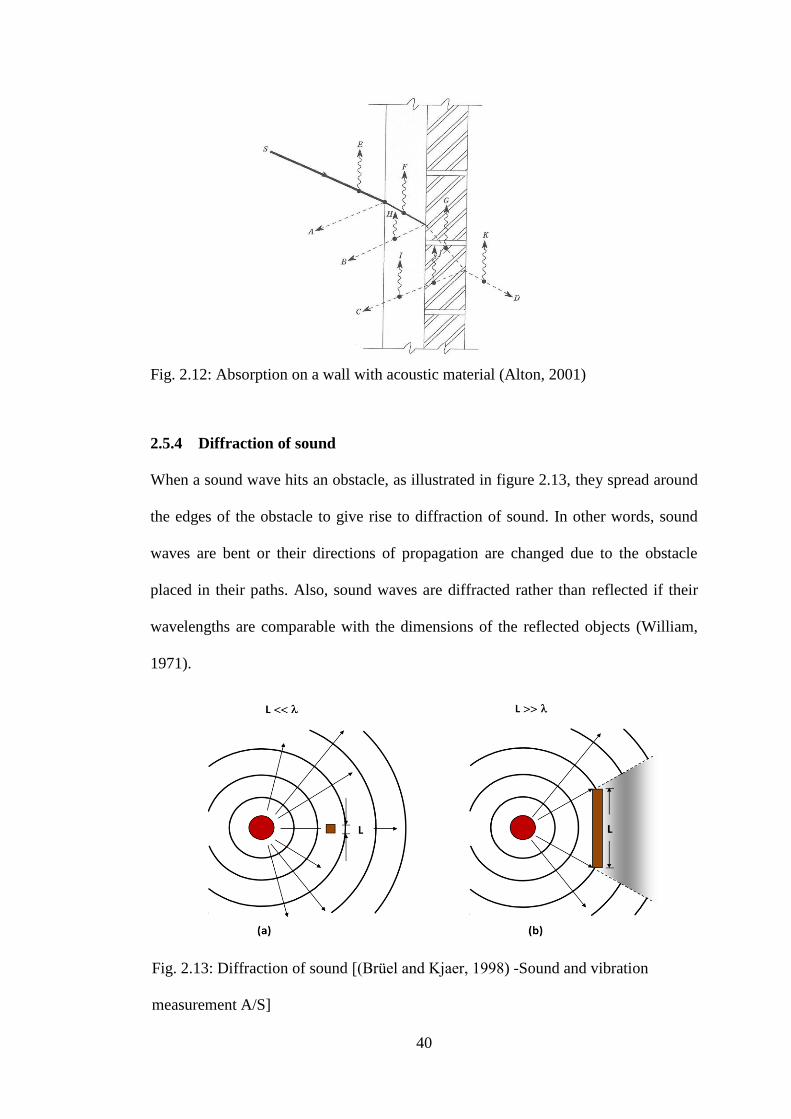
40
Fig. 2.12: Absorption on a wall with acoustic material (Alton, 2001)
2.5.4 Diffraction of sound
When a sound wave hits an obstacle, as illustrated in figure 2.13, they spread around
the edges of the obstacle to give rise to diffraction of sound. In other words, sound
waves are bent or their directions of propagation are changed due to the obstacle
placed in their paths. Also, sound waves are diffracted rather than reflected if their
wavelengths are comparable with the dimensions of the reflected objects (William,
1971).
Fig. 2.13: Diffraction of sound [(Brüel and Kjaer, 1998) -Sound and vibration
measurement A/S]
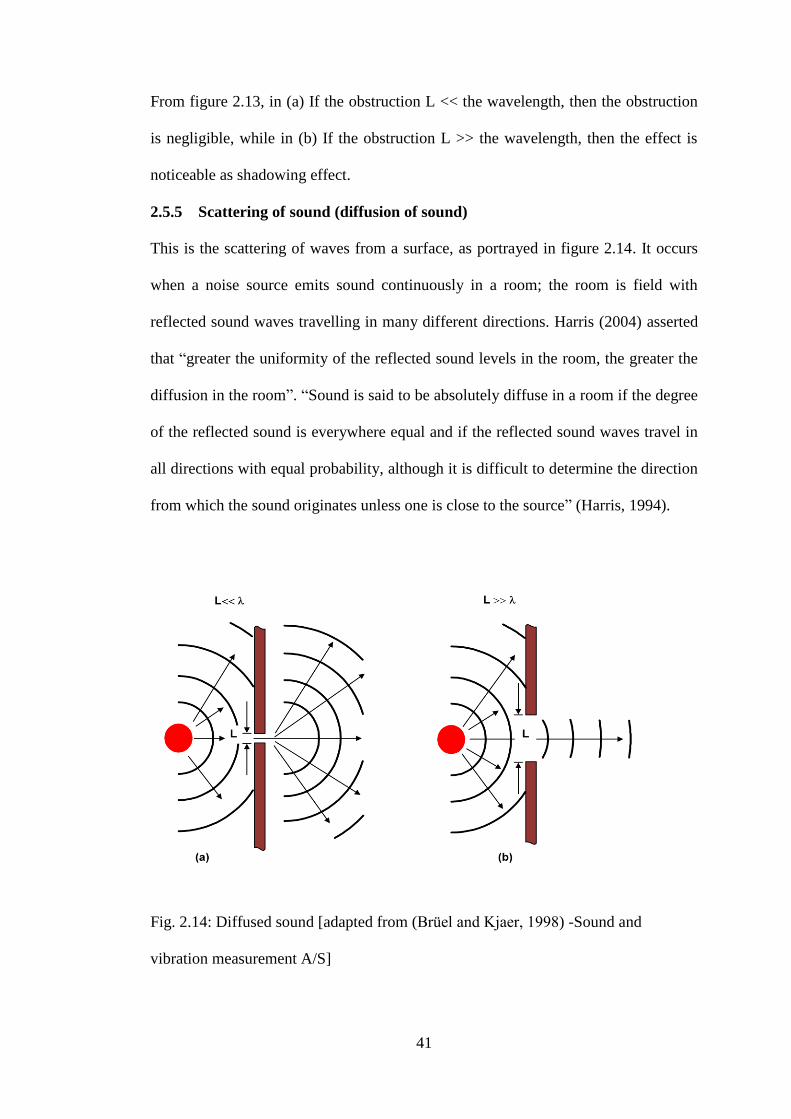
41
From figure 2.13, in (a) If the obstruction L << the wavelength, then the obstruction
is negligible, while in (b) If the obstruction L >> the wavelength, then the effect is
noticeable as shadowing effect.
2.5.5 Scattering of sound (diffusion of sound)
This is the scattering of waves from a surface, as portrayed in figure 2.14. It occurs
when a noise source emits sound continuously in a room; the room is field with
reflected sound waves travelling in many different directions. Harris (2004) asserted
that “greater the uniformity of the reflected sound levels in the room, the greater the
diffusion in the room”. “Sound is said to be absolutely diffuse in a room if the degree
of the reflected sound is everywhere equal and if the reflected sound waves travel in
all directions with equal probability, although it is difficult to determine the direction
from which the sound originates unless one is close to the source” (Harris, 1994).
Fig. 2.14: Diffused sound [adapted from (Brüel and Kjaer, 1998) -Sound and
vibration measurement A/S]
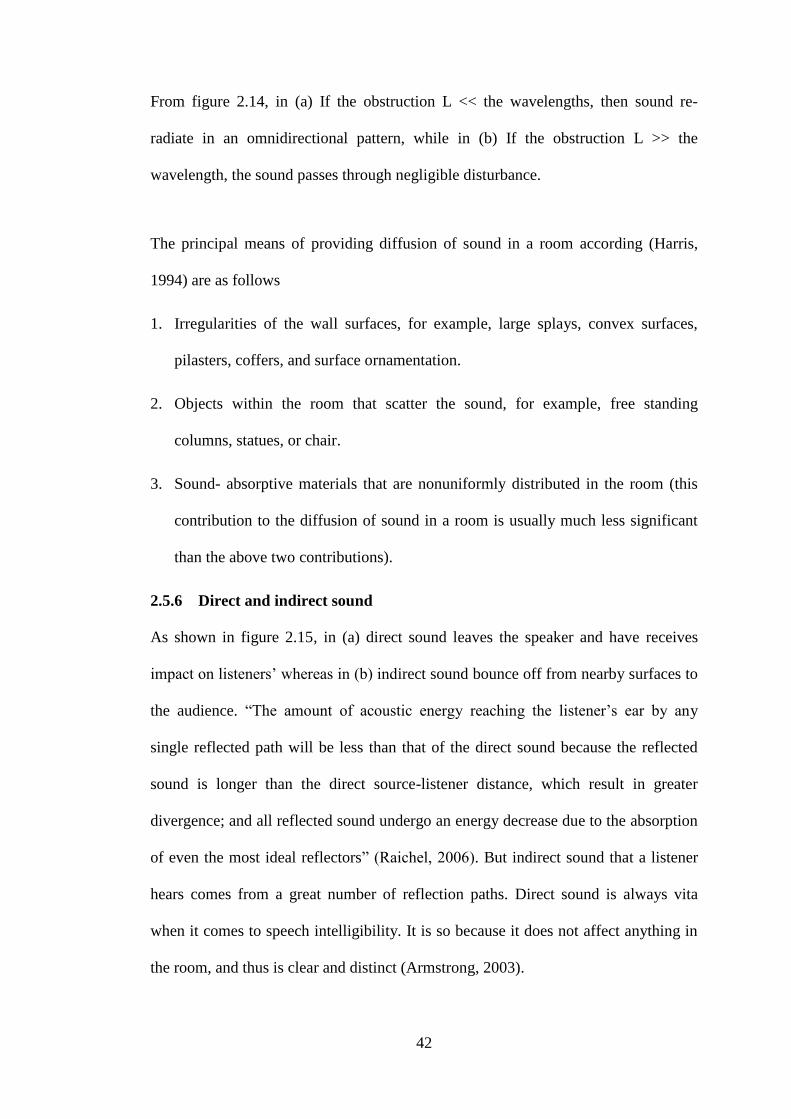
42
From figure 2.14, in (a) If the obstruction L << the wavelengths, then sound re-
radiate in an omnidirectional pattern, while in (b) If the obstruction L >> the
wavelength, the sound passes through negligible disturbance.
The principal means of providing diffusion of sound in a room according (Harris,
1994) are as follows
1. Irregularities of the wall surfaces, for example, large splays, convex surfaces,
pilasters, coffers, and surface ornamentation.
2. Objects within the room that scatter the sound, for example, free standing
columns, statues, or chair.
3. Sound- absorptive materials that are nonuniformly distributed in the room (this
contribution to the diffusion of sound in a room is usually much less significant
than the above two contributions).
2.5.6 Direct and indirect sound
As shown in figure 2.15, in (a) direct sound leaves the speaker and have receives
impact on listeners‟ whereas in (b) indirect sound bounce off from nearby surfaces to
the audience. “The amount of acoustic energy reaching the listener‟s ear by any
single reflected path will be less than that of the direct sound because the reflected
sound is longer than the direct source-listener distance, which result in greater
divergence; and all reflected sound undergo an energy decrease due to the absorption
of even the most ideal reflectors” (Raichel, 2006). But indirect sound that a listener
hears comes from a great number of reflection paths. Direct sound is always vita
when it comes to speech intelligibility. It is so because it does not affect anything in
the room, and thus is clear and distinct (Armstrong, 2003).

43
Fig: 2.15. Reception of direct and indirect sound (Arthur, 2002).
On the other hand, reflected sound takes longer period to reach the listener compared
to direct sound, because its path to the listener is longer. Reflected sound can be good
or bad depending on the time delay (Armstrong, 2003). “Consequently, the
contribution of reflected sound to the total intensity at the listener‟s ear can exceed
the contribution of direct sound particularly if the room surfaces are highly
reflective” (Raichel, 2006).
“If a sound source is operated continuously the acoustic intensity builds up in time
until a maximum is reached. If the room is totally absorbent so that there are no
reflections, the room operates as an anechoic chamber, which simulates a free field
condition with partial reflection, however, the source continues to add acoustic
energy to the room, that is partially absorbed by the enclosing surfaces (i.e. the wall,
ceiling, floor and furnishings) and deflected back into the room” (Raichel, 2006).
(a) Direct signals leave the
Speakers and impact the
audience
(b) Indirect signals bounce
off nearby surfaces to
Audience
44
“For a source operating in a reverberation chamber the gain intensity can be
considerable-as much as ten times the initial level and approximately proportional to
reverberation time. Thus, it can be desirable to have a long reverberation time to
render a weak sound more audible” (Bistafa and Bradley, 2000).
2.6 Reverberation
In a practical sense, “when a sound source stops emitting energy in an enclosed space
or hall, it takes some time for the sound to become imperceptible to the ear. This
prolongation of the sound in the room caused by continued multiple reflections are
called reverberation” (Cavanaugh and Wilkes, 1999); as illustrated in figure 2.16.
In large halls, the number of reflections arriving at times later than one-tenth of a
second after the direct sound (= 100 ms) [i.e. 34m (0.1s)] is so high that individual
reflections are no longer distinguishable. The late sound after 100ms is called
reverberant sound. Reverberation is particularly obvious in a large church or
cathedral spaces (Barron, 2009).
“Despite that reverberation is due to continued multiple reflections, controlling the
reverberation time in a space does not ensure that the space will be free from
reflection and other acoustic defects or problems, since high reverberation time will
cause a build-up of the noise level in a space” (Bistafa and Bradley, 2000).
Bradley et al (1987), avers “that reverberation time (RT60), and background noise
level measurement have traditionally been used to describe auditoria acoustical
issues or problems”.
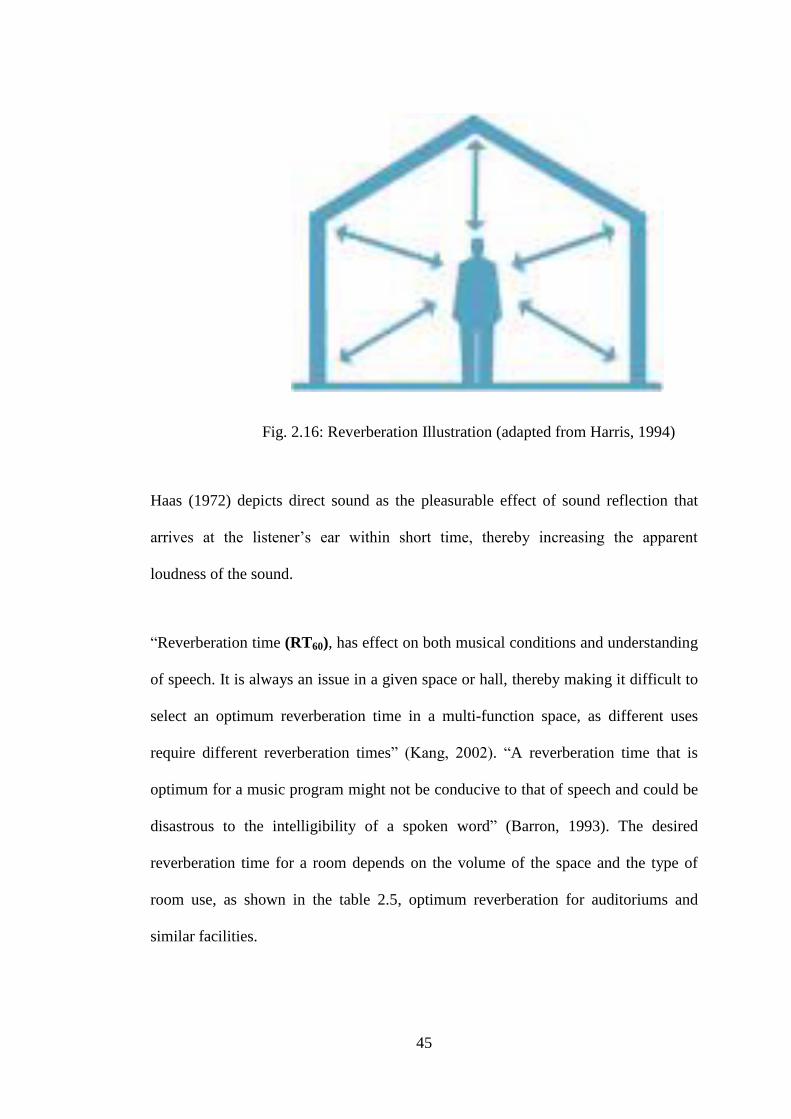
45
Fig. 2.16: Reverberation Illustration (adapted from Harris, 1994)
Haas (1972) depicts direct sound as the pleasurable effect of sound reflection that
arrives at the listener‟s ear within short time, thereby increasing the apparent
loudness of the sound.
“Reverberation time (RT60), has effect on both musical conditions and understanding
of speech. It is always an issue in a given space or hall, thereby making it difficult to
select an optimum reverberation time in a multi-function space, as different uses
require different reverberation times” (Kang, 2002). “A reverberation time that is
optimum for a music program might not be conducive to that of speech and could be
disastrous to the intelligibility of a spoken word” (Barron, 1993). The desired
reverberation time for a room depends on the volume of the space and the type of
room use, as shown in the table 2.5, optimum reverberation for auditoriums and
similar facilities.
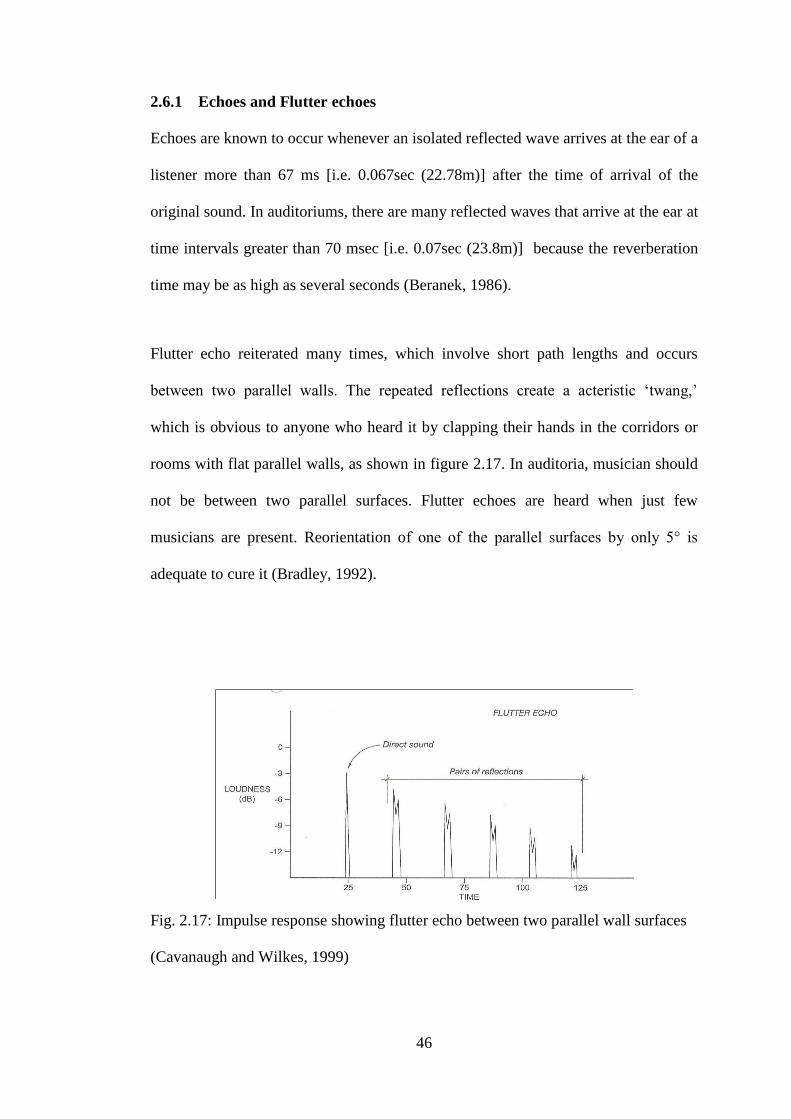
46
2.6.1 Echoes and Flutter echoes
Echoes are known to occur whenever an isolated reflected wave arrives at the ear of a
listener more than 67 ms [i.e. 0.067sec (22.78m)] after the time of arrival of the
original sound. In auditoriums, there are many reflected waves that arrive at the ear at
time intervals greater than 70 msec [i.e. 0.07sec (23.8m)] because the reverberation
time may be as high as several seconds (Beranek, 1986).
Flutter echo reiterated many times, which involve short path lengths and occurs
between two parallel walls. The repeated reflections create a acteristic „twang,‟
which is obvious to anyone who heard it by clapping their hands in the corridors or
rooms with flat parallel walls, as shown in figure 2.17. In auditoria, musician should
not be between two parallel surfaces. Flutter echoes are heard when just few
musicians are present. Reorientation of one of the parallel surfaces by only 5° is
adequate to cure it (Bradley, 1992).
Fig. 2.17: Impulse response showing flutter echo between two parallel wall surfaces
(Cavanaugh and Wilkes, 1999)

47
Table.2.5: Optimum reverberation (500-1000 Hz) for auditoriums and similar
facilities.
Source: (Adapted from Johnson, R. et al, 1990: Cavanaugh and Wilkes, 1999)
0.2 0.4 0.6 0.8 1.0 1.2 1.4 1.6 1.8 2.0 2.2 2.4 2.6 2.8 3.0 3.2 3.4
0.2 0.4 0.6 0.8 1.0 1.2 1.4 1.6 1.8 2.0 2.2 2.4 2.6 2.8 3.0 3.2 3.4
Sp
eech
S
pee
ch a
nd
Mu
sic
Mu
sic
Liturgical, orchestra, chorus, or organ
Dance bands, etc, using sound system
Symphony (Romantic works)
Secular choral works
Semi-classical concert and choral groups, using sound system
Playhouses intimate drama production
Lectures and conference room
Cinema
Small theaters
High school auditorium
General purpose auditorium
Cathedrals Churches
Elementary classrooms
Recording and broadcast studio for speech only
Touring Broadway musical comedies, operettas, Gilbert and Sullivan
Opera
Contemporary orchestral works, rectal and chamber music
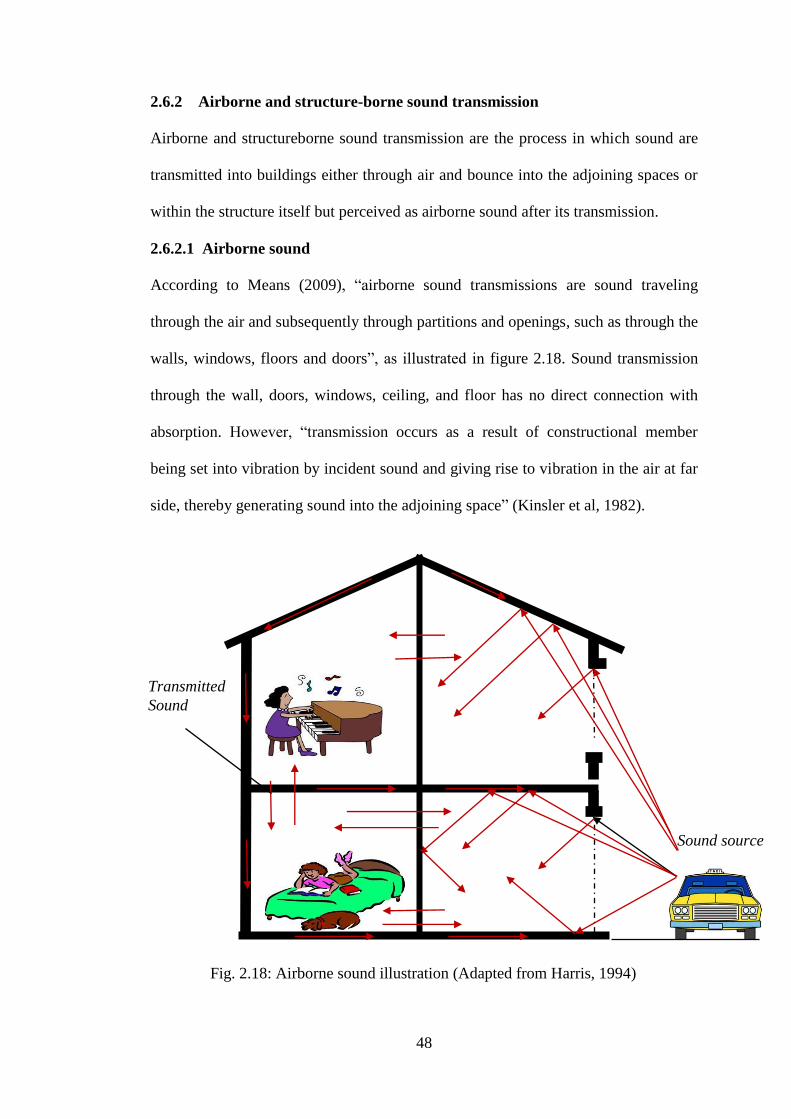
48
2.6.2 Airborne and structure-borne sound transmission
Airborne and structureborne sound transmission are the process in which sound are
transmitted into buildings either through air and bounce into the adjoining spaces or
within the structure itself but perceived as airborne sound after its transmission.
2.6.2.1 Airborne sound
According to Means (2009), “airborne sound transmissions are sound traveling
through the air and subsequently through partitions and openings, such as through the
walls, windows, floors and doors”, as illustrated in figure 2.18. Sound transmission
through the wall, doors, windows, ceiling, and floor has no direct connection with
absorption. However, “transmission occurs as a result of constructional member
being set into vibration by incident sound and giving rise to vibration in the air at far
side, thereby generating sound into the adjoining space” (Kinsler et al, 1982).
Fig. 2.18: Airborne sound illustration (Adapted from Harris, 1994)
Transmitted
Sound
Sound source
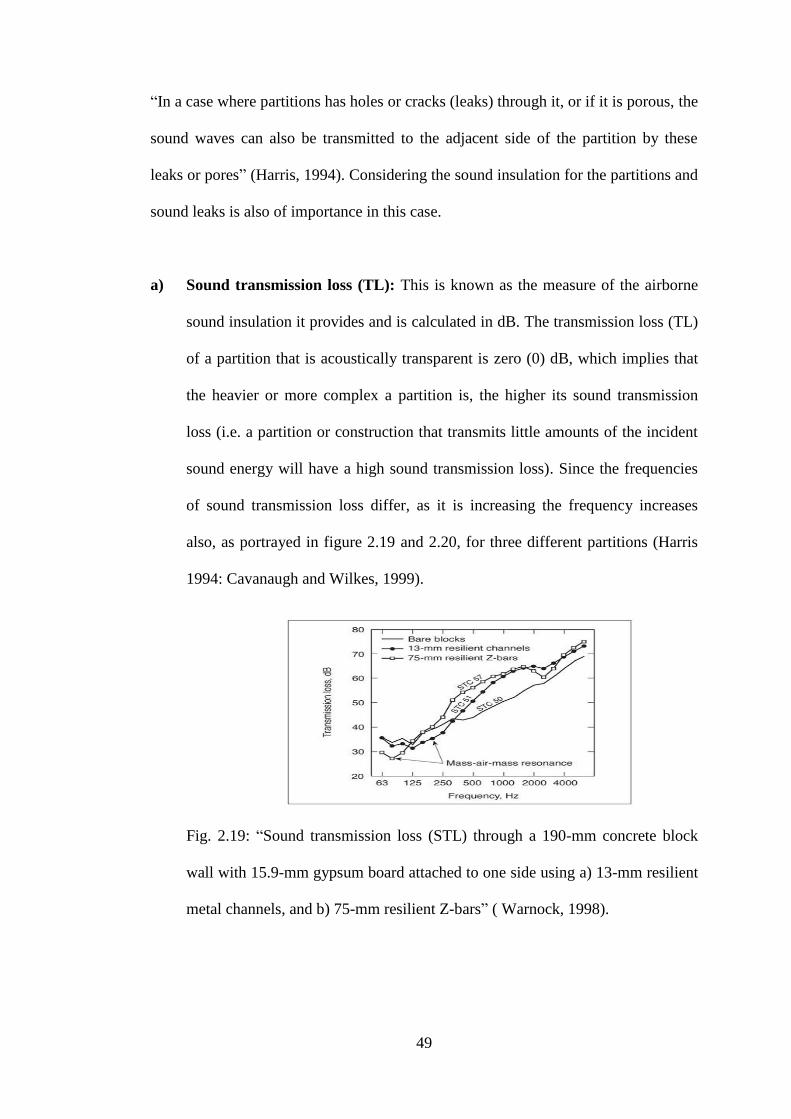
49
“In a case where partitions has holes or cracks (leaks) through it, or if it is porous, the
sound waves can also be transmitted to the adjacent side of the partition by these
leaks or pores” (Harris, 1994). Considering the sound insulation for the partitions and
sound leaks is also of importance in this case.
a) Sound transmission loss (TL): This is known as the measure of the airborne
sound insulation it provides and is calculated in dB. The transmission loss (TL)
of a partition that is acoustically transparent is zero (0) dB, which implies that
the heavier or more complex a partition is, the higher its sound transmission
loss (i.e. a partition or construction that transmits little amounts of the incident
sound energy will have a high sound transmission loss). Since the frequencies
of sound transmission loss differ, as it is increasing the frequency increases
also, as portrayed in figure 2.19 and 2.20, for three different partitions (Harris
1994: Cavanaugh and Wilkes, 1999).
Fig. 2.19: “Sound transmission loss (STL) through a 190-mm concrete block
wall with 15.9-mm gypsum board attached to one side using a) 13-mm resilient
metal channels, and b) 75-mm resilient Z-bars” ( Warnock, 1998).
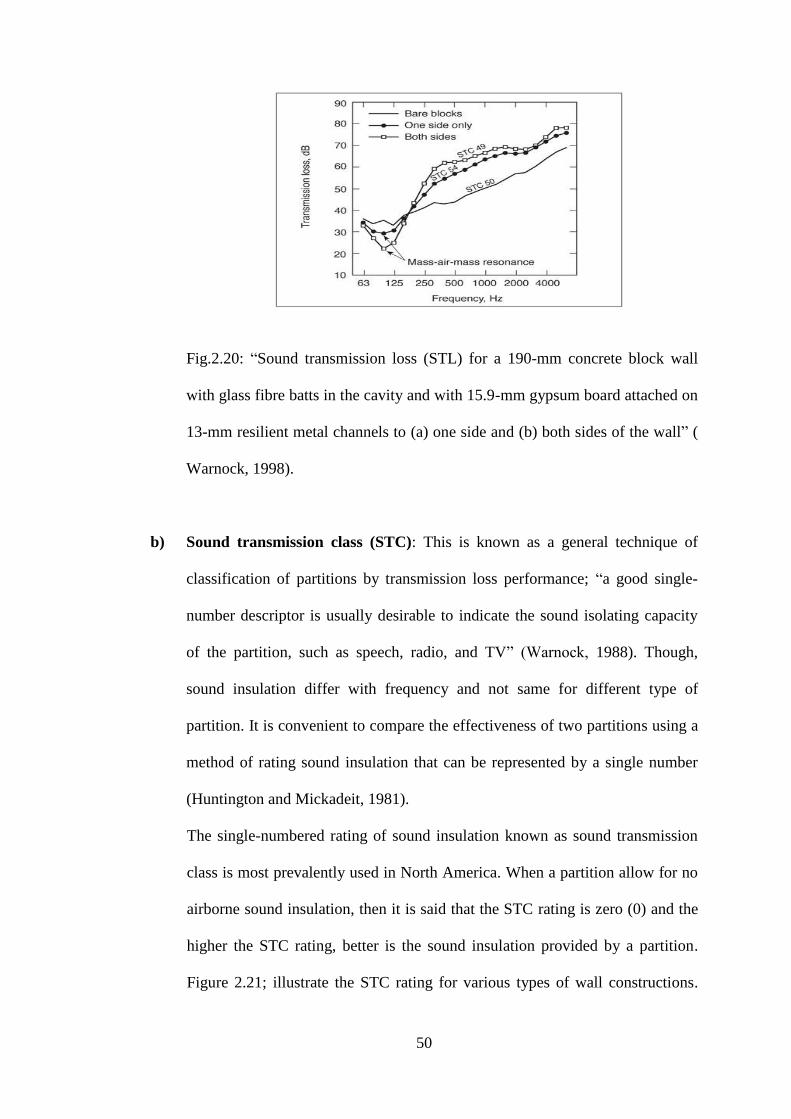
50
Fig.2.20: “Sound transmission loss (STL) for a 190-mm concrete block wall
with glass fibre batts in the cavity and with 15.9-mm gypsum board attached on
13-mm resilient metal channels to (a) one side and (b) both sides of the wall” (
Warnock, 1998).
b) Sound transmission class (STC): This is known as a general technique of
classification of partitions by transmission loss performance; “a good single-
number descriptor is usually desirable to indicate the sound isolating capacity
of the partition, such as speech, radio, and TV” (Warnock, 1988). Though,
sound insulation differ with frequency and not same for different type of
partition. It is convenient to compare the effectiveness of two partitions using a
method of rating sound insulation that can be represented by a single number
(Huntington and Mickadeit, 1981).
The single-numbered rating of sound insulation known as sound transmission
class is most prevalently used in North America. When a partition allow for no
airborne sound insulation, then it is said that the STC rating is zero (0) and the
higher the STC rating, better is the sound insulation provided by a partition.
Figure 2.21; illustrate the STC rating for various types of wall constructions.
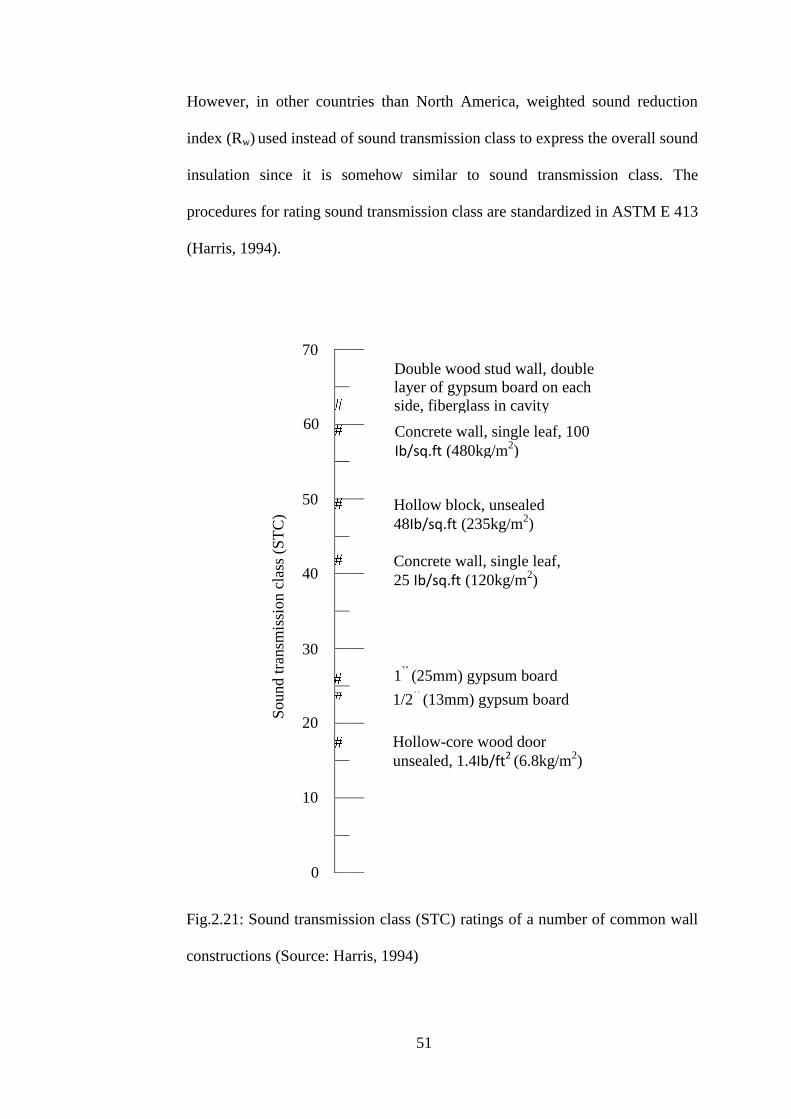
51
Double wood stud wall, double
layer of gypsum board on each
side, fiberglass in cavity
Concrete wall, single leaf, 100
Ib/sq.ft (480kg/m2)
Hollow block, unsealed
48Ib/sq.ft (235kg/m2)
Concrete wall, single leaf,
25 Ib/sq.ft (120kg/m2)
1/2‟‟
(13mm) gypsum board
1‟‟
(25mm) gypsum board
However, in other countries than North America, weighted sound reduction
index (Rw) used instead of sound transmission class to express the overall sound
insulation since it is somehow similar to sound transmission class. The
procedures for rating sound transmission class are standardized in ASTM E 413
(Harris, 1994).
Fig.2.21: Sound transmission class (STC) ratings of a number of common wall
constructions (Source: Harris, 1994)
Hollow-core wood door
unsealed, 1.4Ib/ft2 (6.8kg/m
2)
70
40
50
60
0
10
20
30
Sound t
ransm
issi
on c
lass
(S
TC
)

52
c) Sound leaks: This is the process in which sound passes through crack or hole
in a building, such as through partition and can reduce the effectiveness of the
sound insulation which it provides. The use of lightweight demountable
partition system might cause severe sound leakage at the panel joint, floor,
ceiling tracks and side wall intersections, which is even more damaging.
Materials and system to be used must be detailed and specified to issue positive
panel joint seals that will perform effectively over the expected life of the
partition installation (Huntington and Mickadeit, 1981). Figure 2.22; illustrate
some sound leakage and flanking transmission paths between a structure rooms.
Fig.2.22: Sound leakage and flanking transmission path between rooms (source:
Cavanaugh and Wilkes, 1999).

53
2.6.2.2 Structureborne sound
Möser, (2009), simply “defined structure-borne sound as sound energy transmitted
through solid elements or structure of a building”. When sound energy is directed
induced into a structure (by the impacts of footsteps, dropping of an objects on the
floor, hammering, or by rigidly attached vibrating mechanical equipment, slamming
of the door, etc), the energy will travel relatively easily throughout the structure and
reradiate as air born sound in adjacent spaces or can be perceived by a listener as
airborne sound (Barron, 1993). Fig. 2.23 illustrates some possible path in which
sound can transmit through the floor, where all the components are rigidly connected
(i.e. Flanked transmission). Arrowhead marked with letter D–Represent direct
transmission through the common petition. While arrowhead marked with letter F–
Represent flanking paths (Harris, 1994).
Fig. 2.23: Positive part of transmitted sound through a structure of a building
(Harris, 1994).
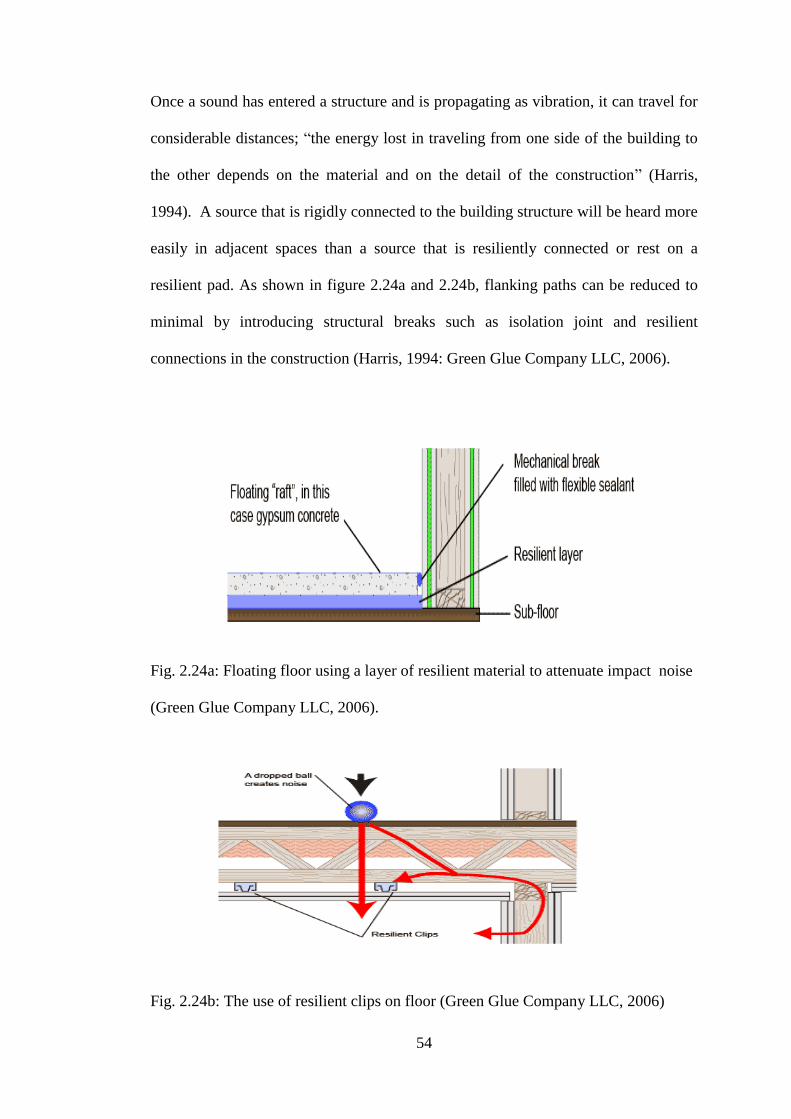
54
Once a sound has entered a structure and is propagating as vibration, it can travel for
considerable distances; “the energy lost in traveling from one side of the building to
the other depends on the material and on the detail of the construction” (Harris,
1994). A source that is rigidly connected to the building structure will be heard more
easily in adjacent spaces than a source that is resiliently connected or rest on a
resilient pad. As shown in figure 2.24a and 2.24b, flanking paths can be reduced to
minimal by introducing structural breaks such as isolation joint and resilient
connections in the construction (Harris, 1994: Green Glue Company LLC, 2006).
Fig. 2.24a: Floating floor using a layer of resilient material to attenuate impact noise
(Green Glue Company LLC, 2006).
Fig. 2.24b: The use of resilient clips on floor (Green Glue Company LLC, 2006)
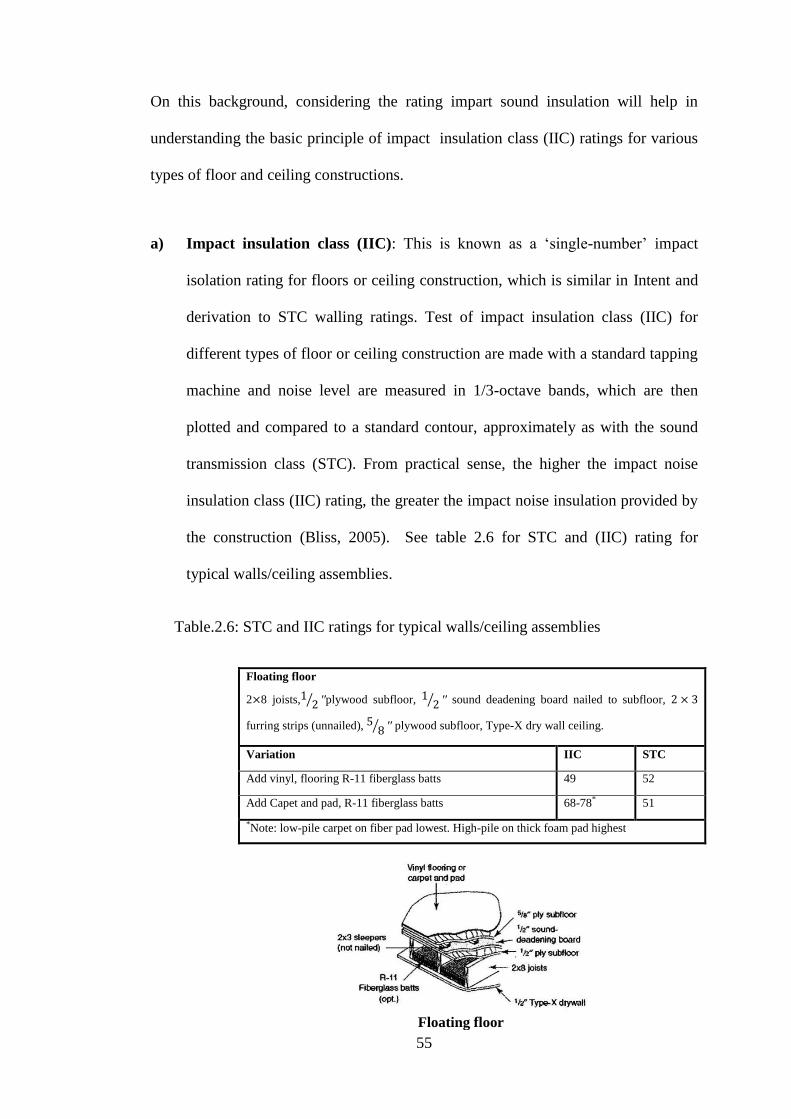
55
On this background, considering the rating impart sound insulation will help in
understanding the basic principle of impact insulation class (IIC) ratings for various
types of floor and ceiling constructions.
a) Impact insulation class (IIC): This is known as a „single-number‟ impact
isolation rating for floors or ceiling construction, which is similar in Intent and
derivation to STC walling ratings. Test of impact insulation class (IIC) for
different types of floor or ceiling construction are made with a standard tapping
machine and noise level are measured in 1/3-octave bands, which are then
plotted and compared to a standard contour, approximately as with the sound
transmission class (STC). From practical sense, the higher the impact noise
insulation class (IIC) rating, the greater the impact noise insulation provided by
the construction (Bliss, 2005). See table 2.6 for STC and (IIC) rating for
typical walls/ceiling assemblies.
Table.2.6: STC and IIC ratings for typical walls/ceiling assemblies
Floating floor
2 8 joists, plywood subfloor, sound deadening board nailed to subfloor,
furring strips (unnailed), plywood subfloor, Type-X dry wall ceiling.
Variation IIC STC
Add vinyl, flooring R-11 fiberglass batts 49 52
Add Capet and pad, R-11 fiberglass batts 68-78* 51
*Note: low-pile carpet on fiber pad lowest. High-pile on thick foam pad highest
Floating floor
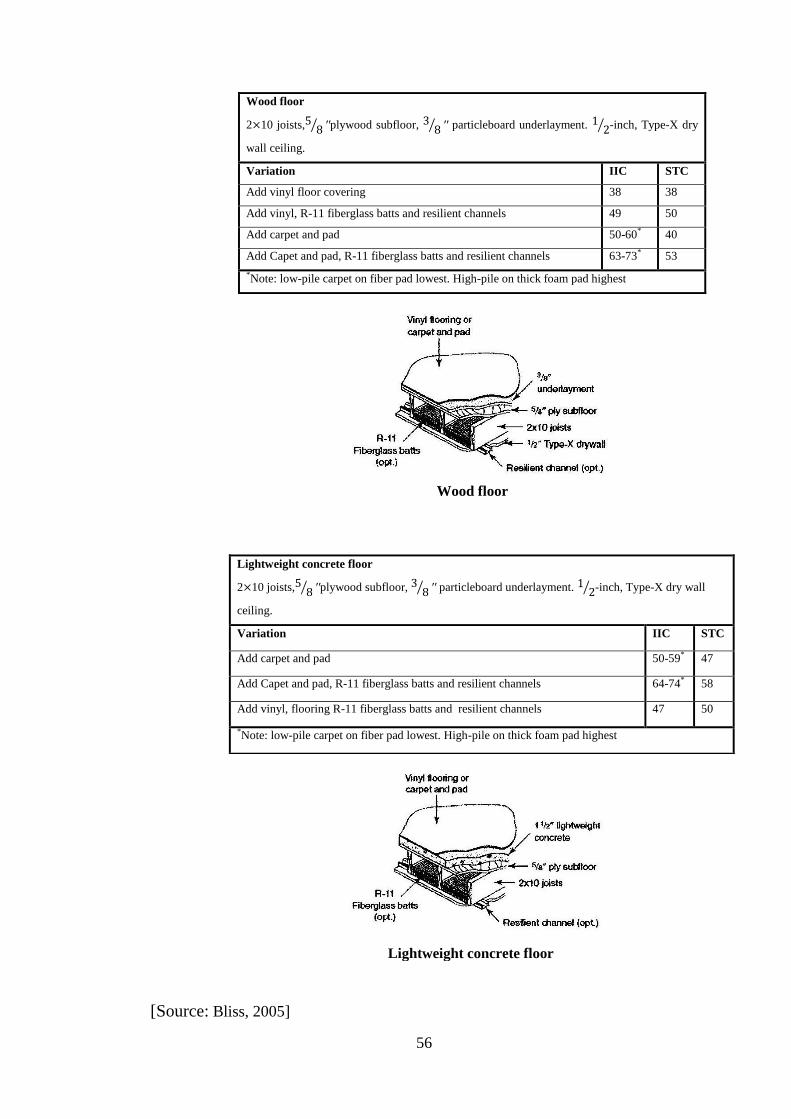
56
Wood floor
2 10 joists, plywood subfloor, particleboard underlayment. -inch, Type-X dry
wall ceiling.
Variation IIC STC
Add vinyl floor covering 38 38
Add vinyl, R-11 fiberglass batts and resilient channels 49 50
Add carpet and pad 50-60* 40
Add Capet and pad, R-11 fiberglass batts and resilient channels 63-73* 53
*Note: low-pile carpet on fiber pad lowest. High-pile on thick foam pad highest
[Source: Bliss, 2005]
Lightweight concrete floor
2 10 joists, plywood subfloor, particleboard underlayment. -inch, Type-X dry wall
ceiling.
Variation IIC STC
Add carpet and pad 50-59* 47
Add Capet and pad, R-11 fiberglass batts and resilient channels 64-74* 58
Add vinyl, flooring R-11 fiberglass batts and resilient channels 47 50
*Note: low-pile carpet on fiber pad lowest. High-pile on thick foam pad highest
Lightweight concrete floor
Wood floor
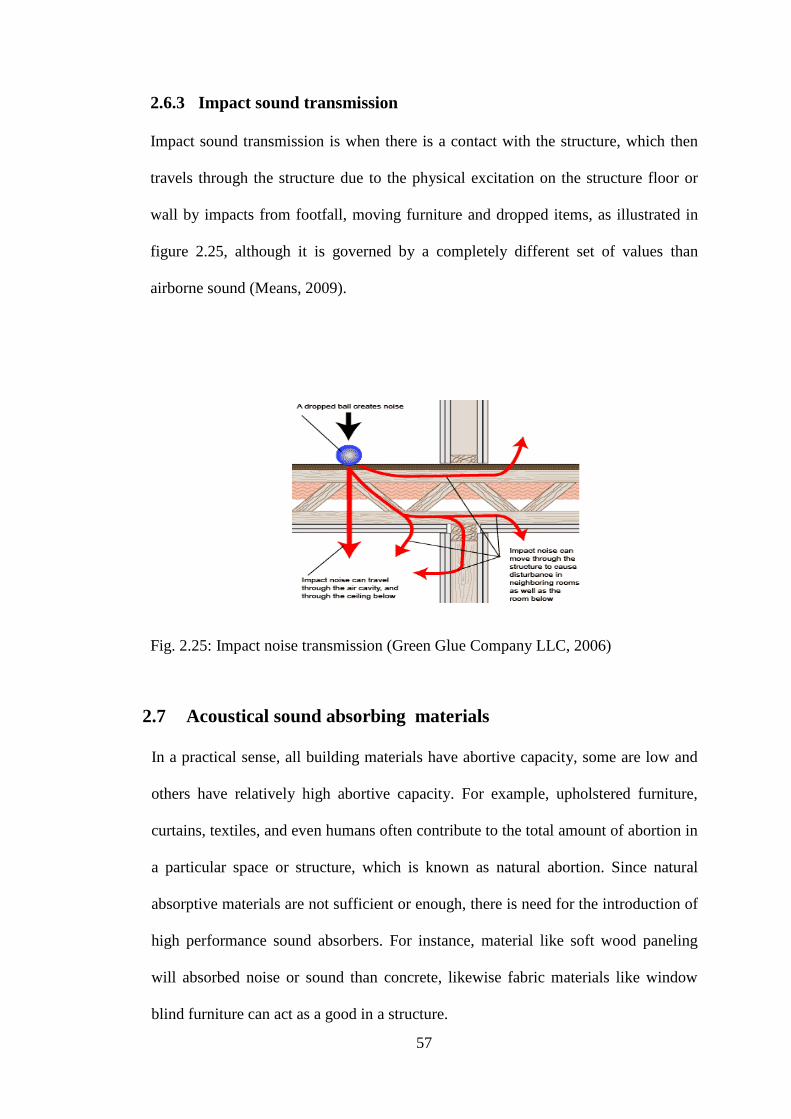
57
2.6.3 Impact sound transmission
Impact sound transmission is when there is a contact with the structure, which then
travels through the structure due to the physical excitation on the structure floor or
wall by impacts from footfall, moving furniture and dropped items, as illustrated in
figure 2.25, although it is governed by a completely different set of values than
airborne sound (Means, 2009).
Fig. 2.25: Impact noise transmission (Green Glue Company LLC, 2006)
2.7 Acoustical sound absorbing materials
In a practical sense, all building materials have abortive capacity, some are low and
others have relatively high abortive capacity. For example, upholstered furniture,
curtains, textiles, and even humans often contribute to the total amount of abortion in
a particular space or structure, which is known as natural abortion. Since natural
absorptive materials are not sufficient or enough, there is need for the introduction of
high performance sound absorbers. For instance, material like soft wood paneling
will absorbed noise or sound than concrete, likewise fabric materials like window
blind furniture can act as a good in a structure.
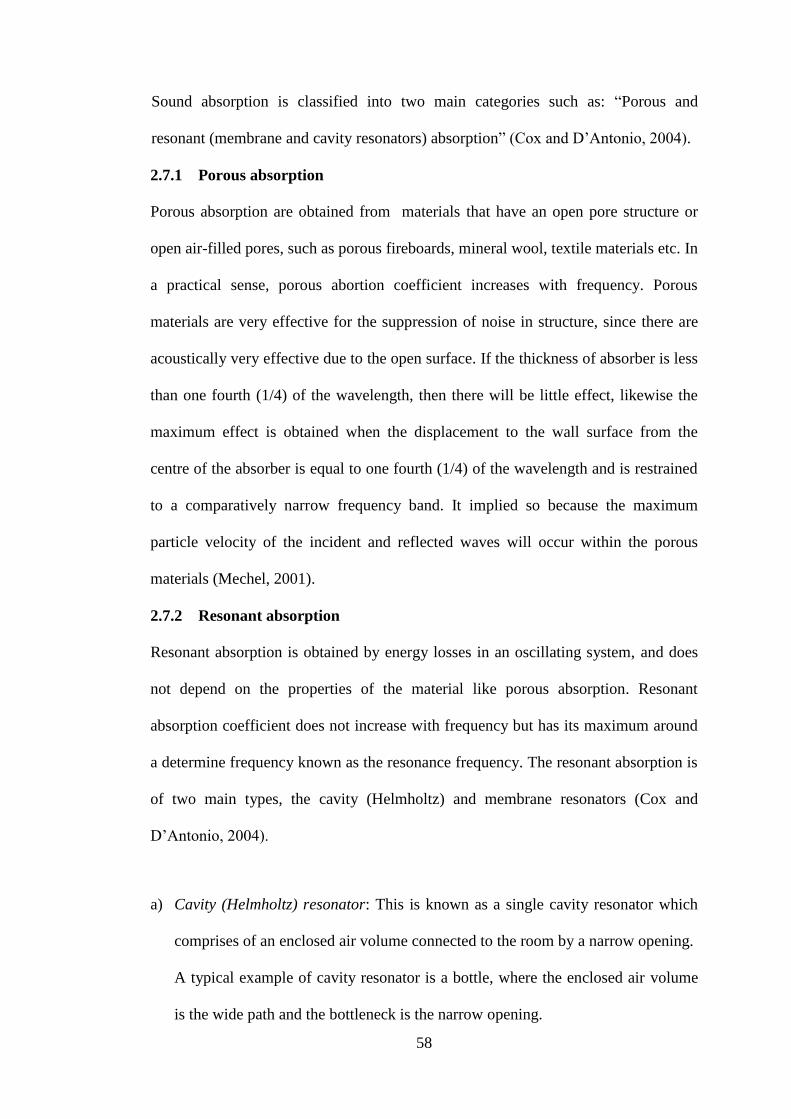
58
Sound absorption is classified into two main categories such as: “Porous and
resonant (membrane and cavity resonators) absorption” (Cox and D‟Antonio, 2004).
2.7.1 Porous absorption
Porous absorption are obtained from materials that have an open pore structure or
open air-filled pores, such as porous fireboards, mineral wool, textile materials etc. In
a practical sense, porous abortion coefficient increases with frequency. Porous
materials are very effective for the suppression of noise in structure, since there are
acoustically very effective due to the open surface. If the thickness of absorber is less
than one fourth (1/4) of the wavelength, then there will be little effect, likewise the
maximum effect is obtained when the displacement to the wall surface from the
centre of the absorber is equal to one fourth (1/4) of the wavelength and is restrained
to a comparatively narrow frequency band. It implied so because the maximum
particle velocity of the incident and reflected waves will occur within the porous
materials (Mechel, 2001).
2.7.2 Resonant absorption
Resonant absorption is obtained by energy losses in an oscillating system, and does
not depend on the properties of the material like porous absorption. Resonant
absorption coefficient does not increase with frequency but has its maximum around
a determine frequency known as the resonance frequency. The resonant absorption is
of two main types, the cavity (Helmholtz) and membrane resonators (Cox and
D‟Antonio, 2004).
a) Cavity (Helmholtz) resonator: This is known as a single cavity resonator which
comprises of an enclosed air volume connected to the room by a narrow opening.
A typical example of cavity resonator is a bottle, where the enclosed air volume
is the wide path and the bottleneck is the narrow opening.
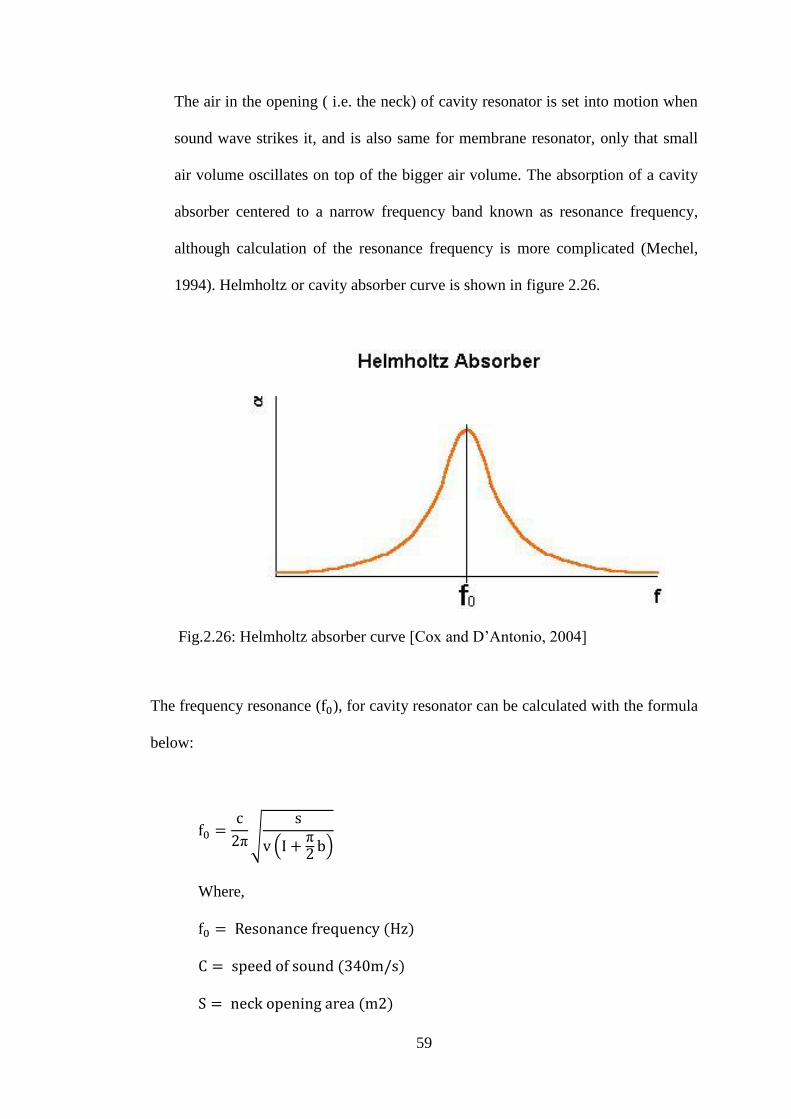
59
The air in the opening ( i.e. the neck) of cavity resonator is set into motion when
sound wave strikes it, and is also same for membrane resonator, only that small
air volume oscillates on top of the bigger air volume. The absorption of a cavity
absorber centered to a narrow frequency band known as resonance frequency,
although calculation of the resonance frequency is more complicated (Mechel,
1994). Helmholtz or cavity absorber curve is shown in figure 2.26.
Fig.2.26: Helmholtz absorber curve [Cox and D‟Antonio, 2004]
The frequency resonance ( ), for cavity resonator can be calculated with the formula
below:
Where,

60
A cavity resonator is not necessarily an individual unit, perforated panels and
slotted absorbers also serve same purpose as cavity resonator, where all the three
perimeters are combined, which may be plywood, hardboard, plasterboard or
metal, and can also behave like membrane absorber. Mostly commercially used
absorptive materials falls under this category. The absorption of a perforated
panel at a displacement from a rigid wall with mineral wool in the void will vary
with respect to the open space. Figure 2.27, shows different degrees of
perforation of a hard fibre panel (Bies and Hansen, 1996).
Fig.2.27: Curves for different degrees of perforation of a hard fibre panel [Cox and
D‟Antonio, 2004].
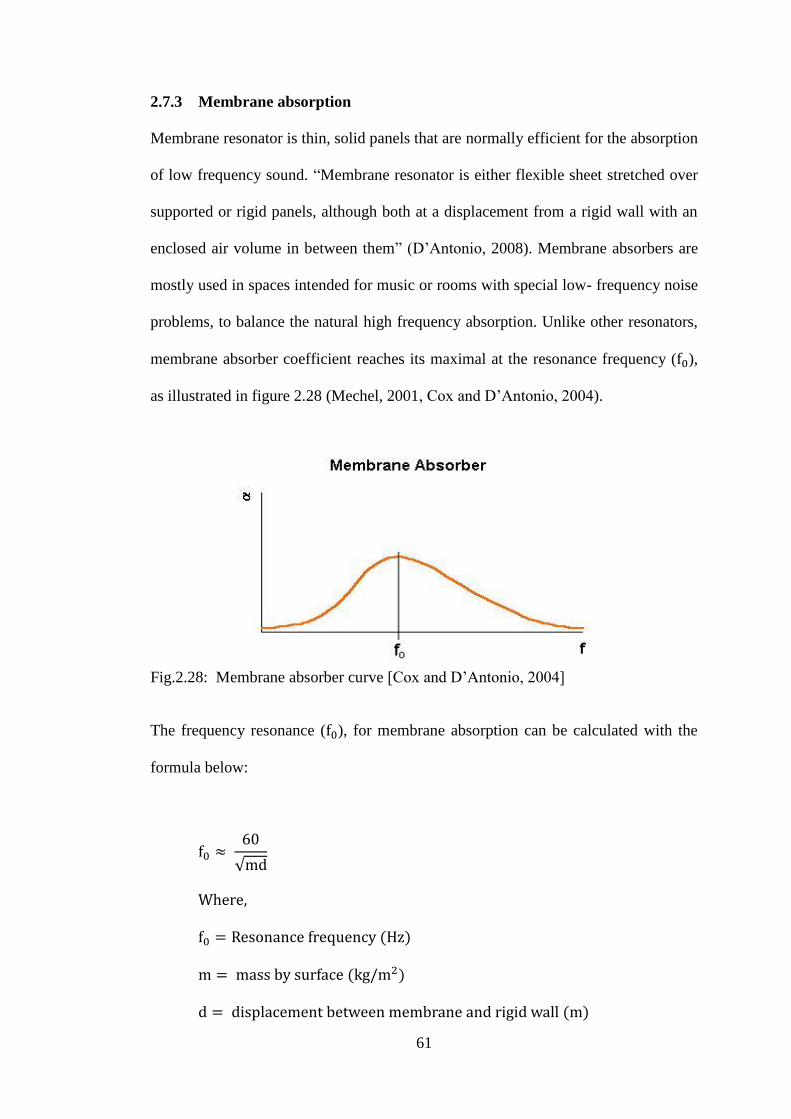
61
2.7.3 Membrane absorption
Membrane resonator is thin, solid panels that are normally efficient for the absorption
of low frequency sound. “Membrane resonator is either flexible sheet stretched over
supported or rigid panels, although both at a displacement from a rigid wall with an
enclosed air volume in between them” (D‟Antonio, 2008). Membrane absorbers are
mostly used in spaces intended for music or rooms with special low- frequency noise
problems, to balance the natural high frequency absorption. Unlike other resonators,
membrane absorber coefficient reaches its maximal at the resonance frequency ( ),
as illustrated in figure 2.28 (Mechel, 2001, Cox and D‟Antonio, 2004).
Fig.2.28: Membrane absorber curve [Cox and D‟Antonio, 2004]
The frequency resonance ( ), for membrane absorption can be calculated with the
formula below:
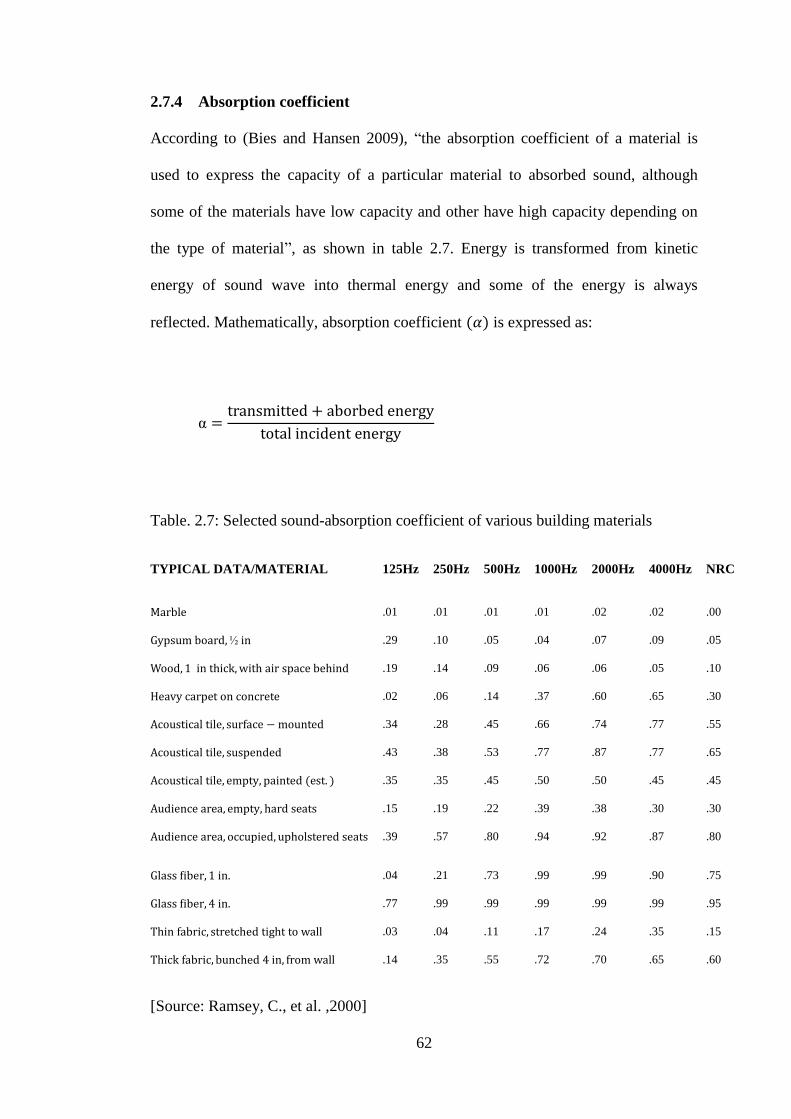
62
2.7.4 Absorption coefficient
According to (Bies and Hansen 2009), “the absorption coefficient of a material is
used to express the capacity of a particular material to absorbed sound, although
some of the materials have low capacity and other have high capacity depending on
the type of material”, as shown in table 2.7. Energy is transformed from kinetic
energy of sound wave into thermal energy and some of the energy is always
reflected. Mathematically, absorption coefficient is expressed as:
Table. 2.7: Selected sound-absorption coefficient of various building materials
TYPICAL DATA/MATERIAL 125Hz 250Hz 500Hz 1000Hz 2000Hz 4000Hz NRC
.01 .01 .01 .01 .02 .02 .00
.29 .10 .05 .04 .07 .09 .05
.19 .14 .09 .06 .06 .05 .10
.02 .06 .14 .37 .60 .65 .30
.34 .28 .45 .66 .74 .77 .55
.43 .38 .53 .77 .87 .77 .65
.35 .35 .45 .50 .50 .45 .45
.15 .19 .22 .39 .38 .30 .30
.39 .57 .80 .94 .92 .87 .80
.04 .21 .73 .99 .99 .90 .75
.77 .99 .99 .99 .99 .99 .95
.03 .04 .11 .17 .24 .35 .15
.14 .35 .55 .72 .70 .65 .60
[Source: Ramsey, C., et al. ,2000]
63
2.8 Speech Intelligibility
Research has shown that in today‟s multi-media society, speech in all likelihood is
the most significant and effective in terms of individual communication. More
emphasis has been led on the intelligibility and clarity of public address (PA) system.
Systems with good intelligibility can be transformed into total unintelligibility.
“However, with many rooms being used exclusively for speech between individual
and groups, it is essential that acoustic design accommodate and enhance such use”
(Dorman, et al).
Marsh (2002), delineated “speech intelligibility as the degree to which a normal
listener or human can understand a spoken message or phrase”. If the residents are
unable to understand the emergency information they are being given, they cannot
react appropriately, as a result which may lead to injury or death. Background noise,
echoes, reverberation and distortion are the primary causes for low speech
intelligibility (e.g. sound from amplifier, speaker etc) (Houtgast. et al., 1985). Late
sound is strongly influenced by the reverberation time; longer reverberation times
produce a higher level of late sound and thus undermine speech intelligibility.
“Speech intelligibility is very important because many activities rely on verbal
communication to a greater or less extent, for example, in large auditoria or where
public talk is being given, a listener has limited access to a spoken word or phrase but
solely rely on depend more heavily upon the sound actually produced by the speakers
month” (Houtgast. et al., 1985).
64
Communication systems normally compress speech into less than the usual
bandwidth and may reduce the dynamic range, so alternative analysis methods are
used.
The frequency range and acoustic power of speech vary widely. Consonants in
normal speech have a power of around 0.03 , while shouting can produced up to
2 The information content of speech is mainly carried by high –frequency low–
energy consonants. Noise has the greatest masking effect on speech if it contains
significant power over 500 Low- frequency background sound is more acceptable
than high- frequency sound except that low-frequency (500 Hz) pure tones have a
strong masking effect. “A widely accepted standard way of assessing the problem is
to use speech interference levels(SIL), known as the arithmetic average of sound
pressure level at 500, 1000 and 2000Hz frequencies, however, is measure of the
degree to which background noise interferes with speech” (Marsh, 2002). The upper
limiting SIL-values for the indicated voice levels are approximately shown in table
2.8. Above these values, the speaker will attempt to raise his or her voice for listeners
to hear him or her (Turner and Pretlove, 1991).
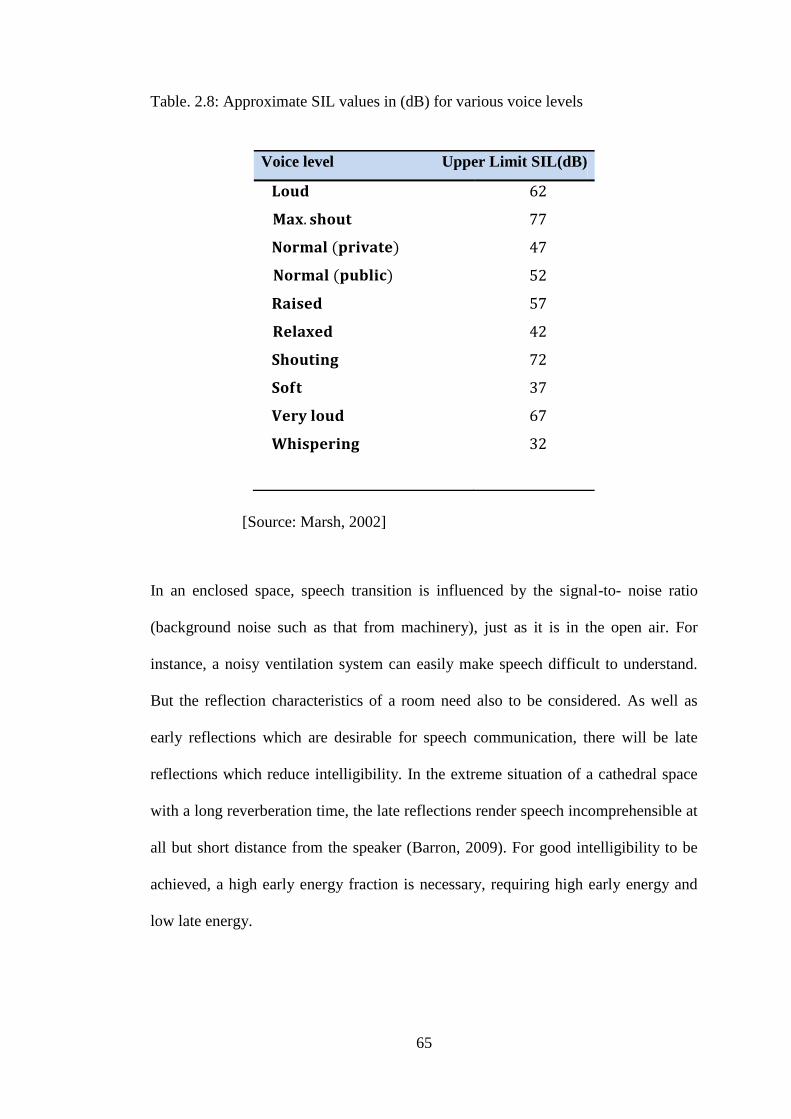
65
Table. 2.8: Approximate SIL values in (dB) for various voice levels
[Source: Marsh, 2002]
In an enclosed space, speech transition is influenced by the signal-to- noise ratio
(background noise such as that from machinery), just as it is in the open air. For
instance, a noisy ventilation system can easily make speech difficult to understand.
But the reflection characteristics of a room need also to be considered. As well as
early reflections which are desirable for speech communication, there will be late
reflections which reduce intelligibility. In the extreme situation of a cathedral space
with a long reverberation time, the late reflections render speech incomprehensible at
all but short distance from the speaker (Barron, 2009). For good intelligibility to be
achieved, a high early energy fraction is necessary, requiring high early energy and
low late energy.
Voice level Upper Limit SIL(dB)
66
2.8.1 Requirement for good speech intelligibility
According to (Howard and Angus, 2009), for good intelligibility to be attain we
require the following.
1. The direct sound should be greater than or equal to the reverberate sound, which
implies that the listener should not be further away from the critical distance.
2. The speech to interference ratio should ideally be greater than 10dB and at worst
7.5dB.
3. The previous two requirements (1) and (2) above have the implication that the
level of the direct sound should be above a certain level (at least 10dB above
background noise and equal to the reverberant sound level), “for both efficiency
and the comfort of the audience, since the direct sound is to be constant at this
level throughout the coverage area” (Howard and Angus, 2009).
2.8.2 Key Parameters affecting speech intelligibility
The key parameters affecting speech intelligibility in an enclosed space or hall are
reverberant (direct-to-reverberant) or late energy, early sound reflection, signal-To-
Noise Ratio, frequency response and lastly, ambient or background noise.
2.8.2.1 Reverberant (direct-to-reverberant) or late energy
“The reverberant sound field consists of sound waves that have been reflected from
multiple surfaces before they arrive at the listener‟s ears” (Templeton, 1997). They
travel long distances between reflections and therefore are progressively reduced in
loudness from the direct sound and early reflections. The reverberant sound field may
persist for 2 sec or longer in concert halls. It contributes to sensations of
reverberance. If the reverberant sounds arrive from many directions and are not
exactly the same at the two ears of people listening, it will also increase the sensation
of acoustic spaciousness in the room.
67
If the reverberant sound field has strong low-frequency or bass components, it will
increase the sense of warmth in the room. If it has strong higher frequency or treble
components, it will contribute to the perception of brilliance (Johnson, 1990). The
required ratio of direct-to-reverberant signal for intelligible speech is highly
dependent on the overall reverberation time of the space. For example, a much higher
ratio is required in a cathedral with a reverberation time of say 7 s, than a similar-
sized building with an RT of only 2 or 3 s. It is interesting to note, as will be shown
later, that good intelligibility can be obtained even with negative D/R ratios
(Templeton, 1997).
2.8.2.2 Early sound reflection
“The early sound reflections are sound waves that strike one of the room surfaces and
are reflected to the listener‟s location”. Reflections that arrive within short time
intervals after the direct sound (less than 80 msec for music) are usually combined
with the direct sound by the ear, see figure 2.29. These reflections add to the direct
sound increasing its apparent loudness. If the reflections arrive within 40 msec or less
after the direct sound, they will also contribute to a sense of acoustic intimacy. Early
reflections that arrive from the sides of the listener‟s head also contribute to
sensations of envelopment and widening of the acoustic image of the sound source.
The combination of these early reflections with the direct sound is what makes it
possible to have similar levels of loudness at seats located throughout a large room
(Bradley, 1986).
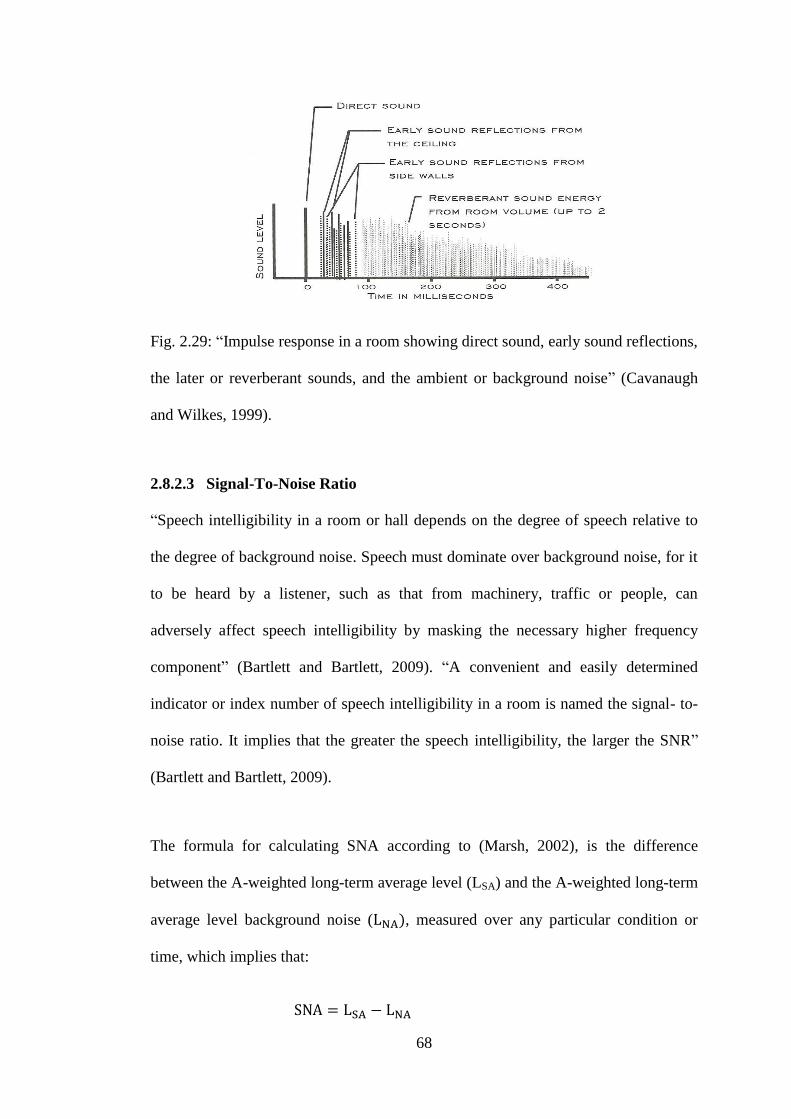
68
Fig. 2.29: “Impulse response in a room showing direct sound, early sound reflections,
the later or reverberant sounds, and the ambient or background noise” (Cavanaugh
and Wilkes, 1999).
2.8.2.3 Signal-To-Noise Ratio
“Speech intelligibility in a room or hall depends on the degree of speech relative to
the degree of background noise. Speech must dominate over background noise, for it
to be heard by a listener, such as that from machinery, traffic or people, can
adversely affect speech intelligibility by masking the necessary higher frequency
component” (Bartlett and Bartlett, 2009). “A convenient and easily determined
indicator or index number of speech intelligibility in a room is named the signal- to-
noise ratio. It implies that the greater the speech intelligibility, the larger the SNR”
(Bartlett and Bartlett, 2009).
The formula for calculating SNA according to (Marsh, 2002), is the difference
between the A-weighted long-term average level (LSA) and the A-weighted long-term
average level background noise ( , measured over any particular condition or
time, which implies that:
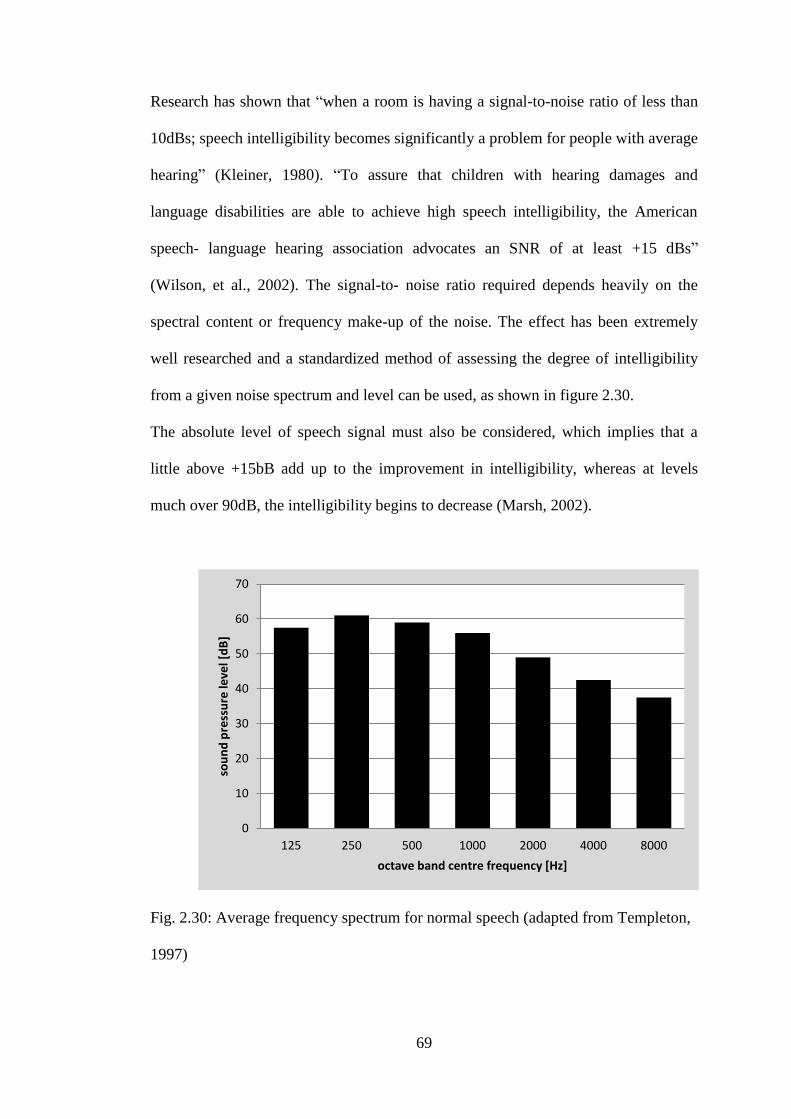
69
Research has shown that “when a room is having a signal-to-noise ratio of less than
10dBs; speech intelligibility becomes significantly a problem for people with average
hearing” (Kleiner, 1980). “To assure that children with hearing damages and
language disabilities are able to achieve high speech intelligibility, the American
speech- language hearing association advocates an SNR of at least +15 dBs”
(Wilson, et al., 2002). The signal-to- noise ratio required depends heavily on the
spectral content or frequency make-up of the noise. The effect has been extremely
well researched and a standardized method of assessing the degree of intelligibility
from a given noise spectrum and level can be used, as shown in figure 2.30.
The absolute level of speech signal must also be considered, which implies that a
little above +15bB add up to the improvement in intelligibility, whereas at levels
much over 90dB, the intelligibility begins to decrease (Marsh, 2002).
Fig. 2.30: Average frequency spectrum for normal speech (adapted from Templeton,
1997)
0
10
20
30
40
50
60
70
125 250 500 1000 2000 4000 8000
sou
nd
pre
ssu
re le
vel [
dB
]
octave band centre frequency [Hz]
70
2.8.2.4 Frequency response
Although the primary speech information is contained at higher consonant
frequencies, the main power of the voice comes from low and mid frequency vowel
sounds with most energy centered at around 200-600 Hz. Typically the higher
frequency information is 15-20 dB below these levels can be easily masked or lost if
the sound system places too much emphasis on the lower frequency region as often
happens when systems are either incorrectly equalized or worse still not equalized at
all (Bartlett and Bartlett, 2009).
2.8.2.5 Ambient or background noise
Shih, (1991) augured that “noise is a complex sound that has little or no periodicity
and thereafter states that the essential characteristic of noise is its undesirability”. On
the other hand, “noise is defined as unwanted sound” (Salvato, 1982). “In recent
years, the rapid increase of noise level in our environment has become a national
public health hazard; people are usually annoyed by noise and can be distracted by it.
Noise affects man's state of mental, physical, and social well-being” (Shih, 1991).
For these reasons, there is need to achieve quiet conditions in multiple dwelling
housing, offices, factories and multipurpose spaces.
Therefore, “ambient sound or noise is the composite of airborne sound from many
sources near or far associated with the environment, although no particular sound is
signed out for interest, for example it might be noise from machinery or traffic”
(Pelton, 1993). However, whether we are in our homes, workplaces, or outdoors, we
will almost certainly be exposed to a certain level of background or ambient sound
such as traffic noise, railway noise or aircraft noise. The main contributor to
background noise is usually the ventilation systems.
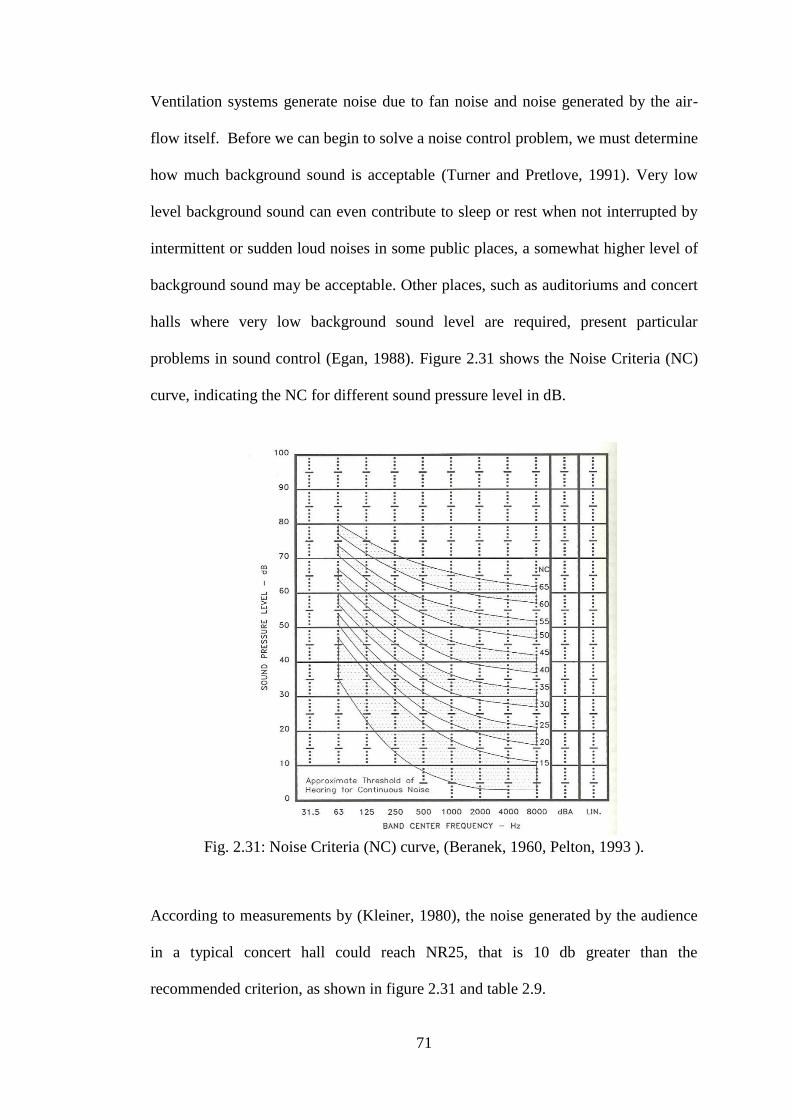
71
Ventilation systems generate noise due to fan noise and noise generated by the air-
flow itself. Before we can begin to solve a noise control problem, we must determine
how much background sound is acceptable (Turner and Pretlove, 1991). Very low
level background sound can even contribute to sleep or rest when not interrupted by
intermittent or sudden loud noises in some public places, a somewhat higher level of
background sound may be acceptable. Other places, such as auditoriums and concert
halls where very low background sound level are required, present particular
problems in sound control (Egan, 1988). Figure 2.31 shows the Noise Criteria (NC)
curve, indicating the NC for different sound pressure level in dB.
Fig. 2.31: Noise Criteria (NC) curve, (Beranek, 1960, Pelton, 1993 ).
According to measurements by (Kleiner, 1980), the noise generated by the audience
in a typical concert hall could reach NR25, that is 10 db greater than the
recommended criterion, as shown in figure 2.31 and table 2.9.
72
Several criteria are available for background noise, which are based on individual
octave band sound levels. The most common European criterion is the NR (Noise
Rating) but there is also the American NC (Noise Criterion), a revised version the
PNC (Preferred Noise Criterion) and more recently the RC (Room Criterion).
Noise Criteria (NC) curves are one of several systems used to establish allowable
sound levels for various interior spaces. NC curves are shaped to compensate for the
human ear‟s response to loudness at octave band center frequencies and the speech
interference properties of noise. Acceptable NC levels for various types of rooms are
given in table 2.9 (ASHA, 2000).
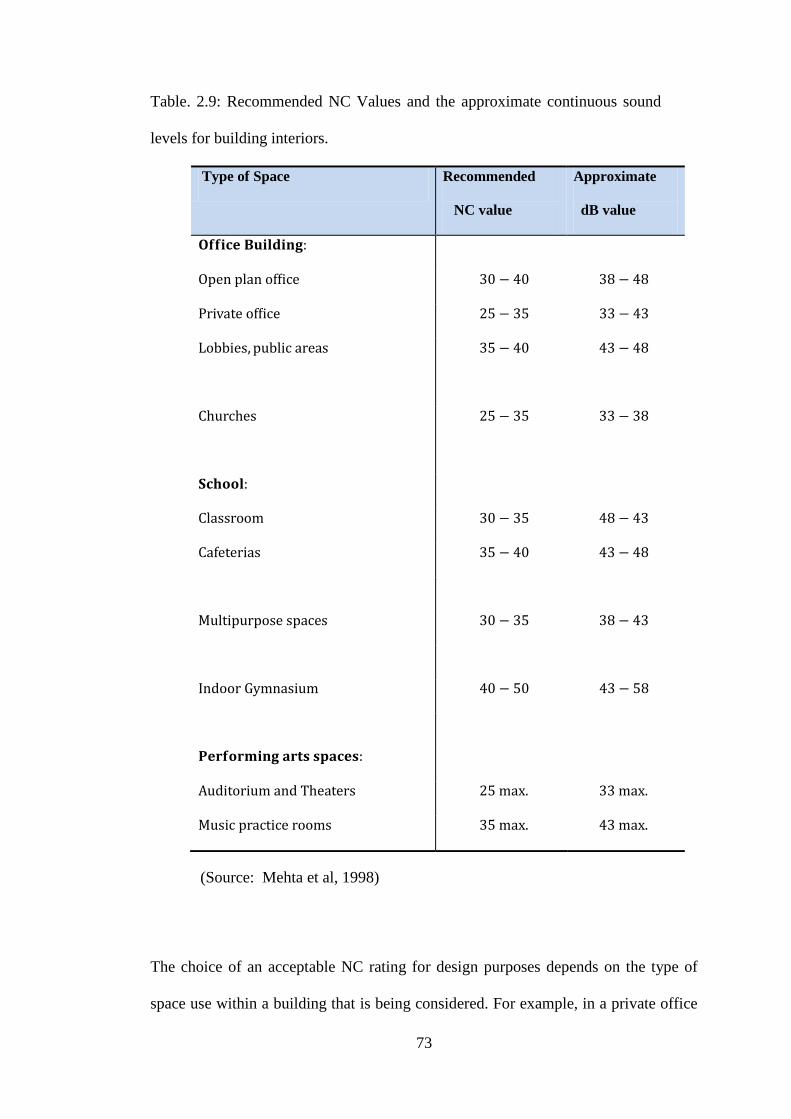
73
Table. 2.9: Recommended NC Values and the approximate continuous sound
levels for building interiors.
Type of Space Recommended
NC value
Approximate
dB value
(Source: Mehta et al, 1998)
The choice of an acceptable NC rating for design purposes depends on the type of
space use within a building that is being considered. For example, in a private office
74
or conference room environment, “the primary consideration is to ensure that the
background noise (with the HVAC system in operation) does not interfere with
speech communication; in open-plan offices, however, it is also important to ensure
that the background noise is high enough to reduce the awareness of speech and other
noises produced by neighbors nearby” (Walter et al, 2009).
In contrast, in a concert hall, the primary consideration is to ensure that the
background noise (with the HVAC system in operation) does not “mask” (i.e.,
prevent one from hearing) the quietest passages of music. “It should be emphasized
that meeting an NC criterion does not ensure that the “quality” of the background
noise will be unobjectionable to a listener (as a result of spectral imbalance) unless
the shape of the noise spectrum being evaluated is approximately that of the
designated NC curve for at least four contiguous octave bands” (Harris, 1991).
On the other hand, due to the recognized shortcomings of the NC curve, specifically
that they are undefined in the very low frequencies (16 and 31.5 octave bands) and
are not sufficiently stringent at frequencies above 2kHz. ASHRAE (the American
society of heating, refrigerating and air-conditioning engineer) developed and
adopted the room criterion (RC) as the suggested noise limiting benchmark in
preference to NC curves and this curves were used to evaluate the acceptability of
background mechanical system noise for typical space types (Walter et al, 2009).
Room criteria curve is shown graphically in figure 2.32.
Region A: “High probability that noise-induce vibration in light wall and ceiling
construction will be clearly feelable; anticipate audible rattles in light fixtures, doors,
window etc” (Walter et al, 2009).
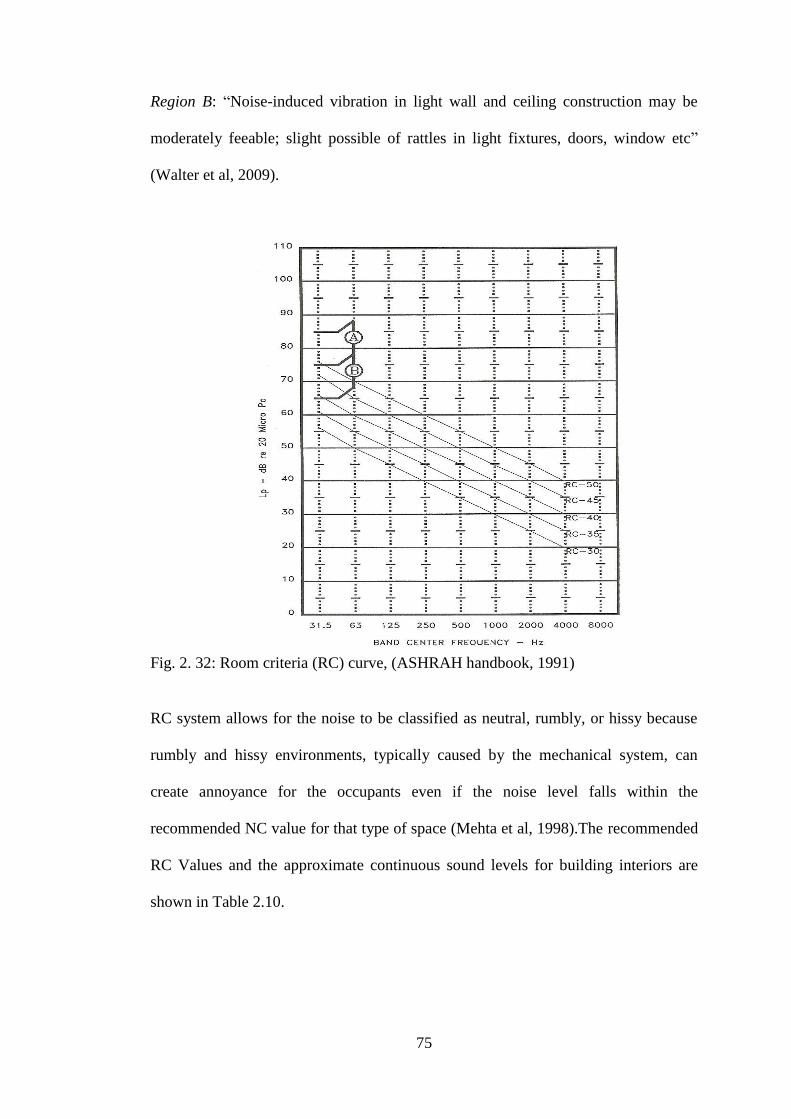
75
Region B: “Noise-induced vibration in light wall and ceiling construction may be
moderately feeable; slight possible of rattles in light fixtures, doors, window etc”
(Walter et al, 2009).
Fig. 2. 32: Room criteria (RC) curve, (ASHRAH handbook, 1991)
RC system allows for the noise to be classified as neutral, rumbly, or hissy because
rumbly and hissy environments, typically caused by the mechanical system, can
create annoyance for the occupants even if the noise level falls within the
recommended NC value for that type of space (Mehta et al, 1998).The recommended
RC Values and the approximate continuous sound levels for building interiors are
shown in Table 2.10.
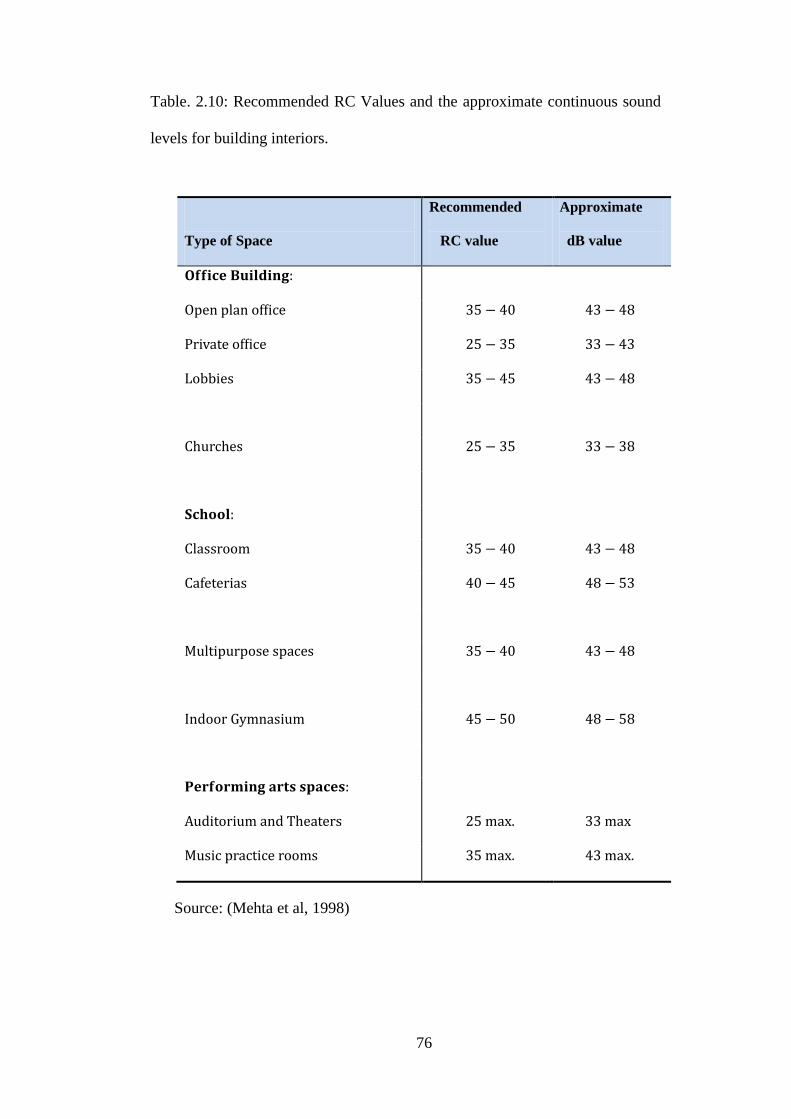
76
Table. 2.10: Recommended RC Values and the approximate continuous sound
levels for building interiors.
Type of Space
Recommended
RC value
Approximate
dB value
Source: (Mehta et al, 1998)

77
Room criteria (RC) curve differ from noise criteria (NR) curve in a number of
aspects which was summarized by (Walter et al, 2009) as:
1. They are straight lines, as in figure 2.32.
2. Their slope is constant at -5dB per octave (determined from extensive tests,
mostly in the range of 40 to 50 dB).
3. Region labeled A and B as in figure 14 deal with the problem of low frequencies
and high sound pressure level, an issue that cannot be discovered in the noise
criteria (NC) curve. Theses region deals with rumble and vibration that can cause
extremum annoyance to many occupants as illustrated in figure 2.32 above.
2.9 Speech intelligibility measurement techniques
The basically two types of tasks that have been used to measure speech intelligibility
are categorized in to two major outlines:
1. Word identification tests in which the listener is required to write down what the
talker says. In order word, known as subjective testing”.
2. Scaling procedures in which the listener makes judgments about the talker‟s
intelligibility using a technique such as an equal appearing interval scaling
procedure or direct magnitude estimation. It is an accurate and rapid method of
measuring intelligibility with acoustic instruments.
2.9.1 Articulation index
The articulation index is an existing method for rating the effect of background noise
on speech intelligibility which was adopted from an American Standard (ANSI 53.5).
Basically the signal-to-noise ratio between the speech signal and the background
noise in each of 20 one-third octave bands is measured. The 20 S/N ratios are then
individually weighted according to the speech information content contained within a
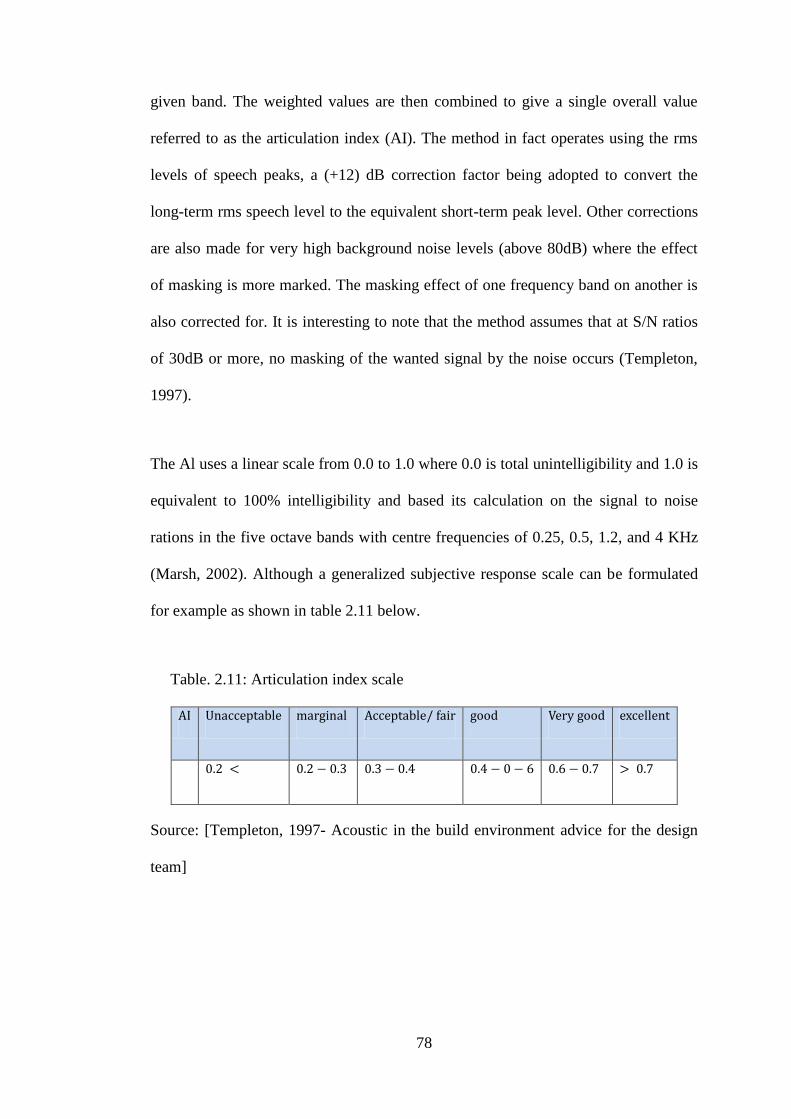
78
given band. The weighted values are then combined to give a single overall value
referred to as the articulation index (AI). The method in fact operates using the rms
levels of speech peaks, a (+12) dB correction factor being adopted to convert the
long-term rms speech level to the equivalent short-term peak level. Other corrections
are also made for very high background noise levels (above 80dB) where the effect
of masking is more marked. The masking effect of one frequency band on another is
also corrected for. It is interesting to note that the method assumes that at S/N ratios
of 30dB or more, no masking of the wanted signal by the noise occurs (Templeton,
1997).
The Al uses a linear scale from 0.0 to 1.0 where 0.0 is total unintelligibility and 1.0 is
equivalent to 100% intelligibility and based its calculation on the signal to noise
rations in the five octave bands with centre frequencies of 0.25, 0.5, 1.2, and 4 KHz
(Marsh, 2002). Although a generalized subjective response scale can be formulated
for example as shown in table 2.11 below.
Table. 2.11: Articulation index scale
Source: [Templeton, 1997- Acoustic in the build environment advice for the design
team]
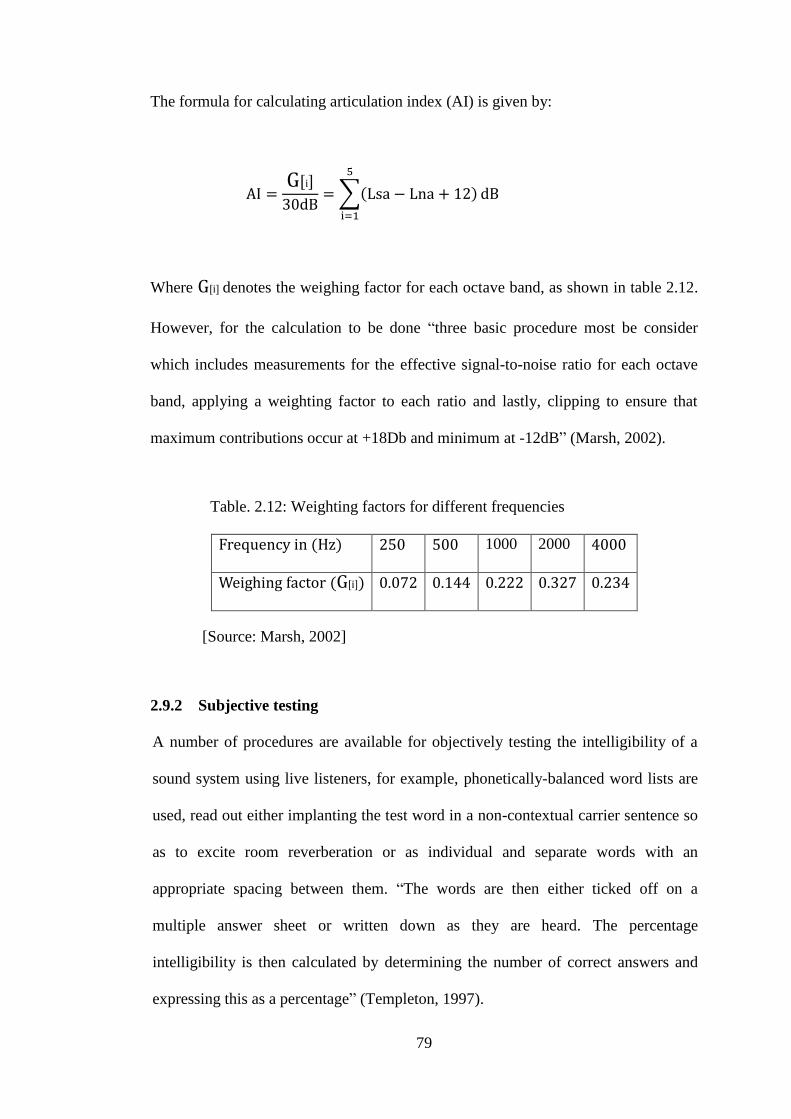
79
The formula for calculating articulation index (AI) is given by:
Where denotes the weighing factor for each octave band, as shown in table 2.12.
However, for the calculation to be done “three basic procedure most be consider
which includes measurements for the effective signal-to-noise ratio for each octave
band, applying a weighting factor to each ratio and lastly, clipping to ensure that
maximum contributions occur at +18Db and minimum at -12dB” (Marsh, 2002).
Table. 2.12: Weighting factors for different frequencies
1000 2000
[Source: Marsh, 2002]
2.9.2 Subjective testing
A number of procedures are available for objectively testing the intelligibility of a
sound system using live listeners, for example, phonetically-balanced word lists are
used, read out either implanting the test word in a non-contextual carrier sentence so
as to excite room reverberation or as individual and separate words with an
appropriate spacing between them. “The words are then either ticked off on a
multiple answer sheet or written down as they are heard. The percentage
intelligibility is then calculated by determining the number of correct answers and
expressing this as a percentage” (Templeton, 1997).
80
2.9.3 Percentage articulation loss of consonant % Alc
Direct percentage Alcons (percentage loss of consonants) testing, although based on
concepts dating back to the 1960s and early l970s, is a relatively new measurement
technique which is originally based on the reception of words by listeners (Bruel and
Kjar magazine, 2008). Essentially this method measures the ratio between early
energy, late energy, noise and the ratio of the direct to reverberant sound components
received from a sound system or test loudspeaker at a typical listening position. The
measurement is usually carried out in the 2 kHz band only and requires the use of a
highly sophisticated and computerized instrument, although measurements at other
frequencies are often carried out to give a more detailed picture of a particular system
(Ballon, 2009).
The % Alcons is obtained by measuring the RT and the direct-to- reverberant
(reflected energy) ratio and from these two parameters the equivalent % Alcons can
be computed.
One of the most useful features of the % Alcons method is that one can correlate
measurement with prediction, and the % Alcons is still effectively the only method
we have of predicting the potential intelligibility of a sound system before it is
installed. “In Dirac, the % Alc is derived from the STI through a widely used
approximation formulation by Farrel Becker” (Houtgast and el at, 2002).
The % Alc scale is not quite sophisticated; the concept works more as series of
bands, as shown in table 2.10.
81
2.9.4 Speech transmission test (STI and RASTI)
“Speech transmission index (STI) is a more new and detailed version of the
articulation index first introduced by Steeneken and Houtgast as a measure of
estimating speech communication from acoustic measurements” (Steeneken and
Houtgast, 1983). Speech transmission index, are the modern and most complex
intelligibility measurement techniques currently available. It is only the advent of
modern microprocessor and desk top computer technology that have enabled the
technique to be implemented on a practical basis (Bruel and Kjar magazine, 2008).
This method of measurements surpasses the (AI) concept due to the attempt made in
including distortion in the time domain, and those that occur over time, like
reverberation. Some degree of reverberation adds „liveness‟ to a room, but substantial
reverberation is very common problem that causes speech intelligibility to deteriorate
(Marsh, 2002: Gelfrand, 2009).
The STI uses a sophisticated method of physical analysis known as the modulation
transfer function (MTF) to determine how a test signal is affected by a noise and
distortion in the octave bands from 125 to 8000Hz. The MTF results are then
converted to a transmission index for each band. The bands are weighted according
to their importance for speech communication ( as in the case of AI), and are then
combined to produce the STI, which ranges from 0 to 100% (or 0 to 1.0), and is
divided into five (5) categorized bands from „bad‟ to „excellent‟, as shown in table 2.
13. The higher the STI, the better are the conditions for speech communication
(Gelfrand, 2009).
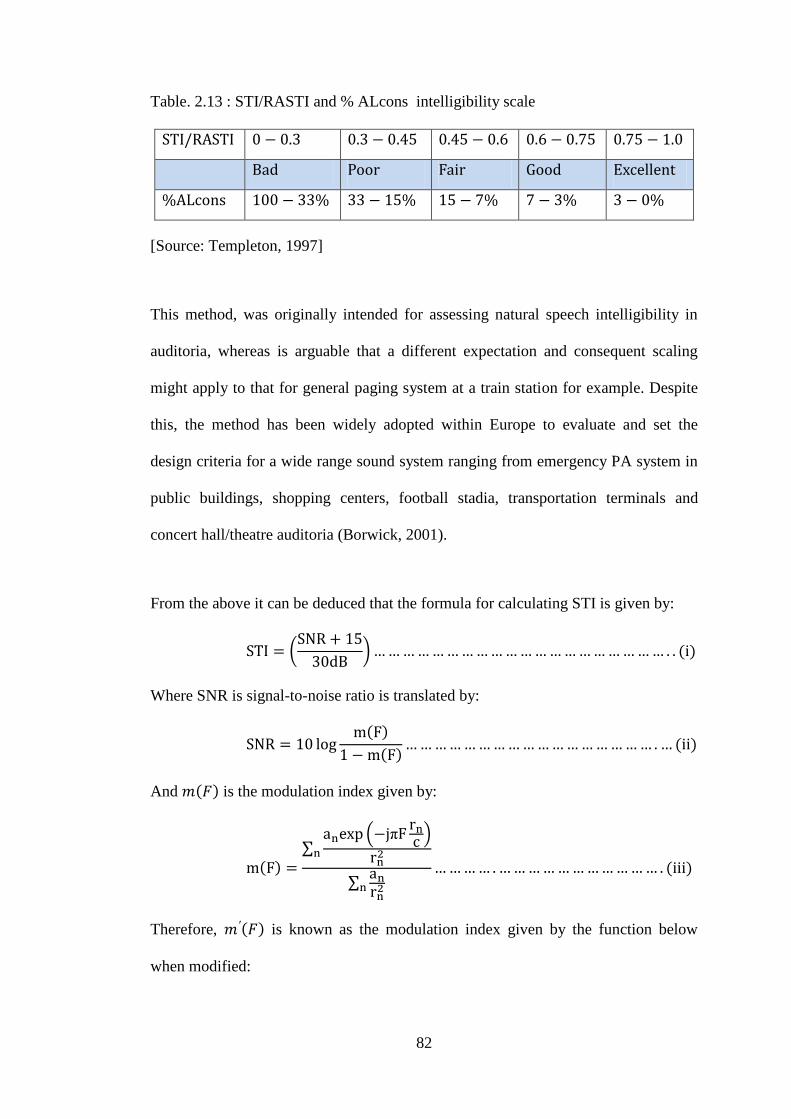
82
Table. 2.13 : STI/RASTI and % ALcons intelligibility scale
[Source: Templeton, 1997]
This method, was originally intended for assessing natural speech intelligibility in
auditoria, whereas is arguable that a different expectation and consequent scaling
might apply to that for general paging system at a train station for example. Despite
this, the method has been widely adopted within Europe to evaluate and set the
design criteria for a wide range sound system ranging from emergency PA system in
public buildings, shopping centers, football stadia, transportation terminals and
concert hall/theatre auditoria (Borwick, 2001).
From the above it can be deduced that the formula for calculating STI is given by:
Where SNR is signal-to-noise ratio is translated by:
And is the modulation index given by:
Therefore, is known as the modulation index given by the function below
when modified:
83
“From the above formulas, in (ii), (iii) and (iv) F represents the modulation
frequency, in (iii) C is the speed of sound and refers to the With being the relative
path length of the nth
impulse and as the intensity of background noise.
On the other hand, rapid speech transmission Index (RASTI), is a portable method
used in the real-time determination of speech intelligibility developed by Steeneken
and Houtgast and can be established by using instrumentation which include a
loudspeaker place in the location of the a talker or speaker and microphone placed
where the listener or hearer would be (Steeneken and Houtgast, 1985). The
loudspeaker presents a test signal into the room being evaluated, and the sound
picked up by the microphone reflects how the original test signal has been affected
by the noise and other acoustical characteristics in the room. The result are then
passed as RASTI values from 0.0 to 1.0, which can be used to indicate relative
speech intelligibility: for instance, 0.29, is rated as bad; 0.3 to 0.44, rated as poor;
0.45 to 0.59, rated as fair; 0.6 to 0.74 as good; 0.75, excellent (Gelfrand, 2009), as
also indicated in table 2.10.
2.9.5 Merit and demerit of the (STI/RASTI) system
1. It automatically takes into account any background noise and hence the prevalent
S/N ratio as well as the effect of reverberation time and reverberant level (i.e.
D/R ratio) (Gelfrand, 2009).
84
2. However, like the % Alcons methods, the STI does not account for discrete, late
reflection. System non-linearities and some forms of signal processing can also
severely disrupt this method (Marsh, 2002).
3. A major advantage of STI /RASTI is the ability to readily carry out „what if‟
speculations and predictions by post-processing the noise component data; for
example, if measurements were taken during a quiet period, it is possible to
manually input new noise data and get a recalculated STI (Crandell and el at,
2005).
4. A major disadvantage of the RASTI method is that no information is gathered
over the whole operating range of a sound system, e.g. at 125 and 250Hz at low
to mid frequencies and at 4 and 8kHz at the upper end (kang, 2002).
5. The disadvantage of RASTI/STI method is that the potential result cannot be
readily predicted without the use of a complex computer model (Walter et al,
2009).
2.9.6 Useful-to-detrimental ratio’s
This method of speech intelligibility measures was first introduced by (Lochner and
Burger, 1958), “which essentially predicts early to late sound ratio with background
sound energy combined to the late arriving sound”. “This method predicts speech
intelligibility scores based on useful energy calculated from a weighted sum of sound
energy arriving in the first 95 msec, by using the equating derived by Lochner and
Burger”:
85
Where (a) is known as “the fraction of energy of each individual reflection
integrated into the useful energy sum, which can be approximately calculated by the
equation derived by Bradley”:
Where (ra) is the relative amplitude of the reflection and (t) its relative delay.
Suppose (SL and BL) are the steady-state long-term (rms) speech and background
level and the ( are the related total speech and background energies, then
the useful energy can be estimated using the equation derived by Bradley (Bradley,
1986):
Where and are the relative and late energy sums from uncelebrated pulse
recordings and is the linear early/late ratio with an early time limit .
Therefore, Bradley derived the detrimental equation as below:
When equation is divided by , an expression for useful/detrimental ratio is
obtained for any early sound limit , which is given by:
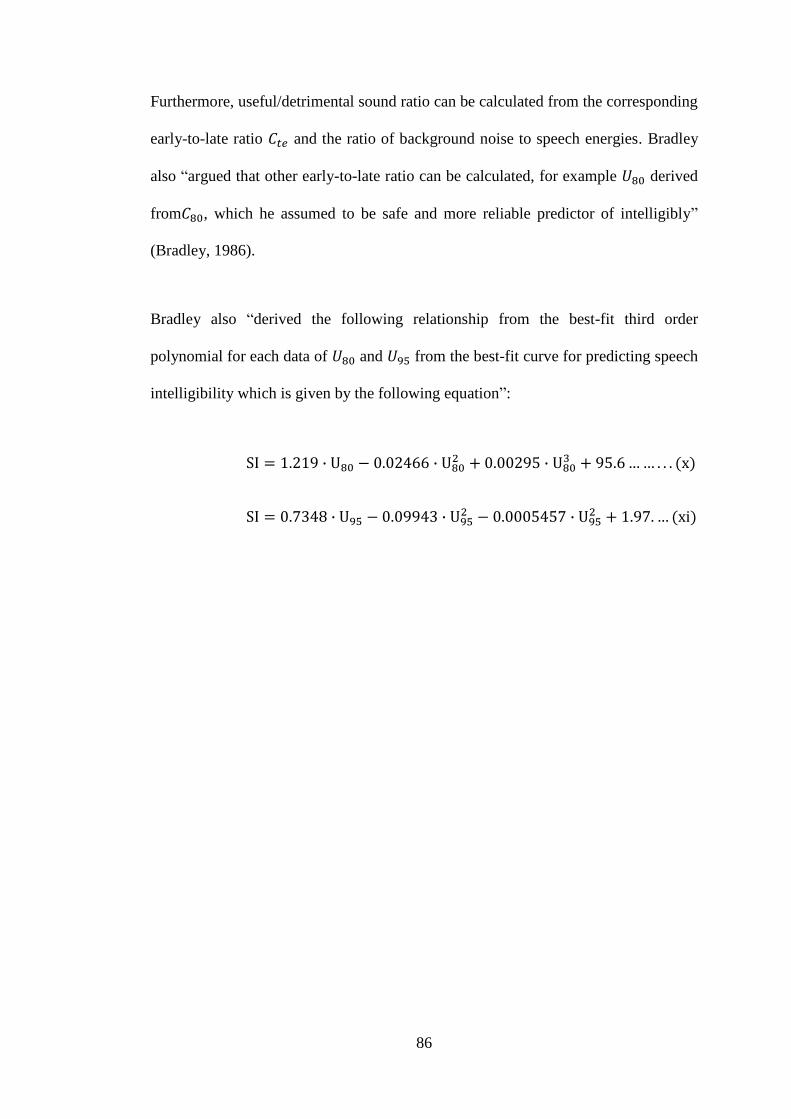
86
Furthermore, useful/detrimental sound ratio can be calculated from the corresponding
early-to-late ratio and the ratio of background noise to speech energies. Bradley
also “argued that other early-to-late ratio can be calculated, for example derived
from , which he assumed to be safe and more reliable predictor of intelligibly”
(Bradley, 1986).
Bradley also “derived the following relationship from the best-fit third order
polynomial for each data of and from the best-fit curve for predicting speech
intelligibility which is given by the following equation”:
87
Chapter 3
RESEARCH METHODOLOGY
3.1 Introduction
The purpose of this section is to consider the research design which deals with the
ways information were gathered to accomplish the research aims and objectives. In
this study both qualitative and quantitative research method were used to identify the
acoustic problems – its sources, effects, and possible control, hence the research
instrument that was adopted are measurement and scaling techniques, personal
observation and desk review. The research instruments adopted in this research
include the following:
3.2 Measurement and Scaling Techniques
A set of instruments was used to educe relevant information or data on the particular
issues or problems (i.e. Noise problems) and was later analyzed to provide a suitable
and appropriate solution to the problems and the issues at hand. Among this
instrument that are used to predict the sound or speech intelligibility level in the hall
are the, Sound level meter, microphone and DIRAC program aided with a standard
window PC (computer) to calculate the EDT, INR, SNR, C80, D50,H, BR(RT), RT
and RAST, from 20 different points in the Hall.
Microsoft excel software was also used to construct tables. Averages, minimum and
maximum values of sound levels were considered in this research study.
88
3.3 Personal Observation
Aerial photographs were taken on the area in question (LaLa Mustafa Pasa Sport
Complex- Eastern Mediterranean University, Gazimağus) so as to have a first hand
and pictorial information on the issues or problems. Direct observations was also
made, considering noise sources from inside and outside the building, building
orientation, the sitting arrangement, and dimensions of the entire Hall was recorded
to support this research.
3.4 Desk Review of Related Literature
Relevant textbook and publications including websites (internet) was used to support
the data and information that are needed.
89
Chapter 4
DATA PRESENTATION, ANALYSIS AND DISCUSSION
4.1 Introduction
The purpose of this chapter is for data presentation, analysis and interpretation of the
data collected from the research source-LaLa Mustafa Pasa Sport Complex. Tables
were used to analyse the data collected and they were arranged with respect to
statement below, which include the description of the Hall under survey and personal
data. A survey was carried out in the hall to reveal the acoustical defects affecting the
space, as well as direct observation considering intrusive noise sources into the
space, building orientations, the sitting arrangement, dimensions of the space and the
building as a whole. In addition, photographic records of both the interior and
exterior, plans and sections for correlation with the survey were made as it affects the
acoustical suitability of the hall, as shown in figures 4.1, 4.2, 4.3, 4.4 and 4.5
respectively. Measurements also were taken from various points in the hall to
identify the speech intelligibility and reverberation (Echo) problems of the entire
space, as indicated in figure 4.6.
4.2 LaLa Mustafa Pasa Sport Complex specification/description
From table 4.1, it could be seen that LaLa Mustafa Pasa Sport Complex is located at
Eastern Mediterranean University (E.M.U), Gazimağus in Turkish Republic of
Northern Cyprus. The hall interior space is about 3172 in area and approximately
45846 in volume with 3,500 seats. The interior space which is meant for sport,
speeches and other activities has a reverberation time (RT) of about 4.5 and rapid
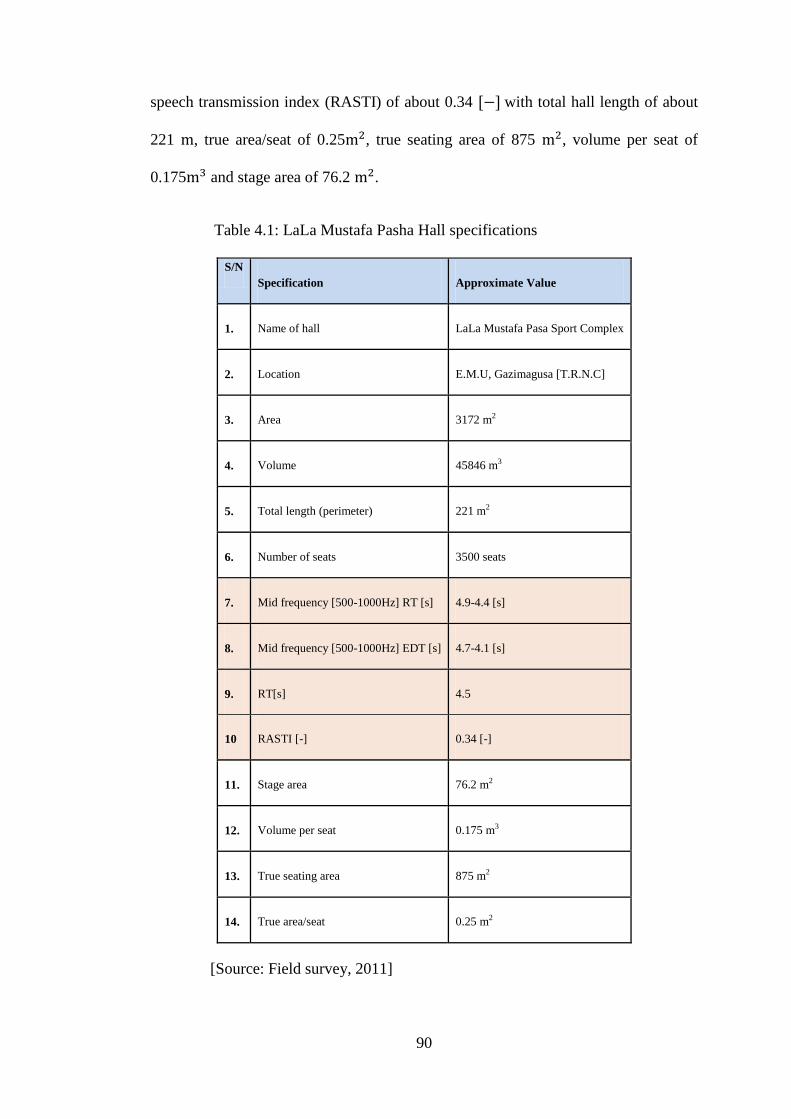
90
speech transmission index (RASTI) of about 0.34 with total hall length of about
221 , true area/seat of 0.25 , true seating area of 875 , volume per seat of
0.175 and stage area of 76.2 .
Table 4.1: LaLa Mustafa Pasha Hall specifications
S/N
Specification Approximate Value
1. Name of hall LaLa Mustafa Pasa Sport Complex
2. Location E.M.U, Gazimagusa [T.R.N.C]
3. Area 3172 m2
4. Volume 45846 m3
5. Total length (perimeter) 221 m2
6. Number of seats 3500 seats
7. Mid frequency [500-1000Hz] RT [s] 4.9-4.4 [s]
8. Mid frequency [500-1000Hz] EDT [s] 4.7-4.1 [s]
9. RT[s] 4.5
10 RASTI [-] 0.34 [-]
11. Stage area 76.2 m2
12. Volume per seat 0.175 m3
13. True seating area 875 m2
14. True area/seat 0.25 m2
[Source: Field survey, 2011]
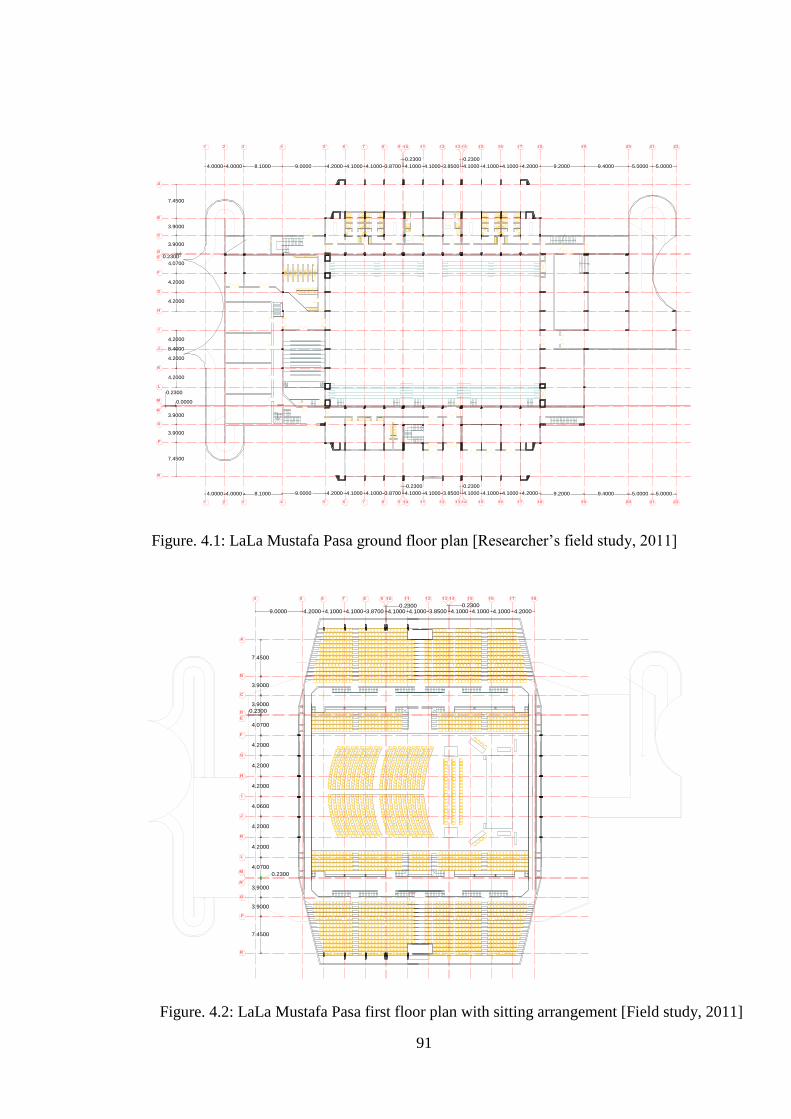
91
A
B
C
D
E
F
G
H
I
J
K
L
M
N
O
P
R
4.2000 4.1000 4.1000 3.8700
0.2300
4.1000 4.1000 3.8500
0.2300
5 6 7 8 9 10 11 12 13 14 15 16 17 18
4.1000 4.1000 4.20009.00008.10004.00004.0000
4321
4.1000 9.2000 9.4000 5.0000 5.0000
19 20 21 22
4.2000 4.1000 4.1000 3.8700
0.2300
4.1000 4.1000 3.8500
0.2300
5 6 7 8 9 10 11 12 13 14 15 16 17 18
4.1000 4.1000 4.20009.00008.10004.00004.0000
4321
4.1000 9.2000 9.4000 5.0000 5.0000
19 20 21 22
7.4500
3.9000
3.9000
0.2300
4.0700
4.2000
4.2000
8.4000
4.2000
4.2000
4.2000
0.0000
0.2300
3.9000
3.9000
7.4500
A
B
C
D
E
F
G
H
I
J
K
L
M
N
O
P
R
7.4500
3.9000
3.9000
0.2300
4.0700
4.2000
4.2000
4.2000
4.0600
4.2000
4.2000
4.0700
0.2300
3.9000
3.9000
7.4500
4.2000 4.1000 4.1000 3.87000.2300
4.1000 4.1000 3.85000.2300
5 6 7 8 9 10 11 12 13 14 15 16 17 18
4.1000 4.1000 4.20009.0000
4
4.1000
Figure. 4.1: LaLa Mustafa Pasa ground floor plan [Researcher‟s field study, 2011]
Figure. 4.2: LaLa Mustafa Pasa first floor plan with sitting arrangement [Field study, 2011]
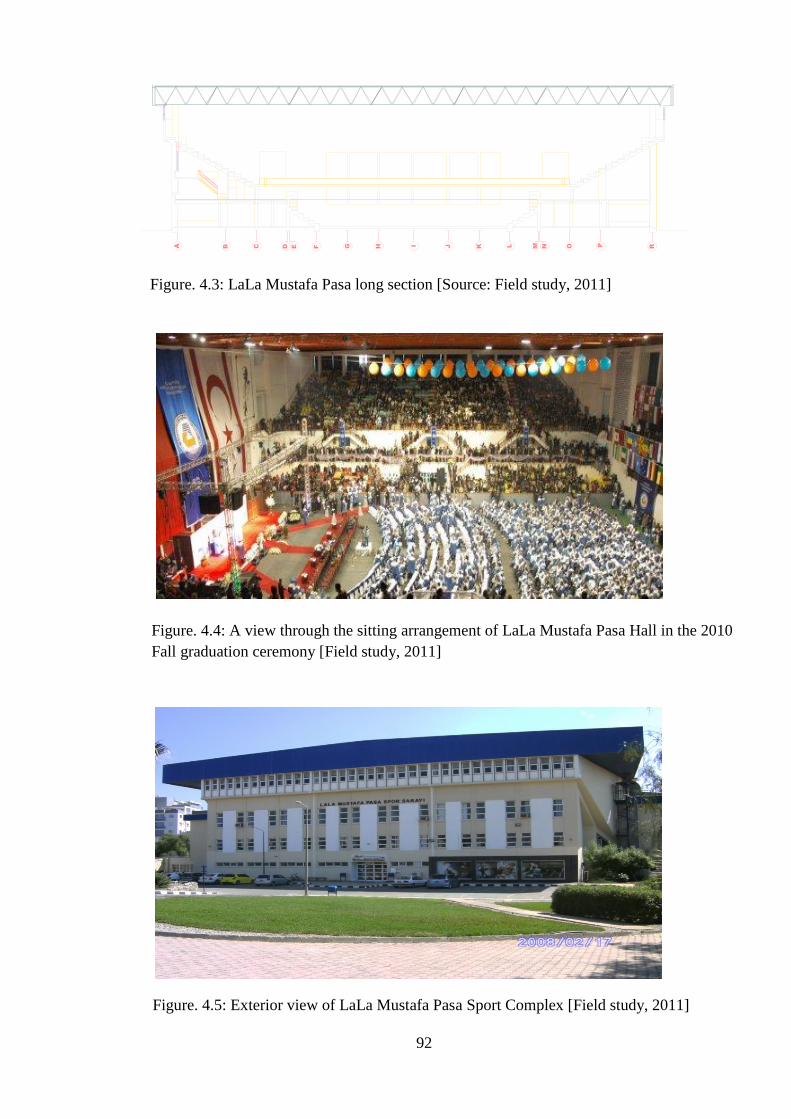
92
A B C D E F G H
I J K L M N O P R
Figure. 4.3: LaLa Mustafa Pasa long section [Source: Field study, 2011]
Figure. 4.4: A view through the sitting arrangement of LaLa Mustafa Pasa Hall in the 2010
Fall graduation ceremony [Field study, 2011]
Figure. 4.5: Exterior view of LaLa Mustafa Pasa Sport Complex [Field study, 2011]
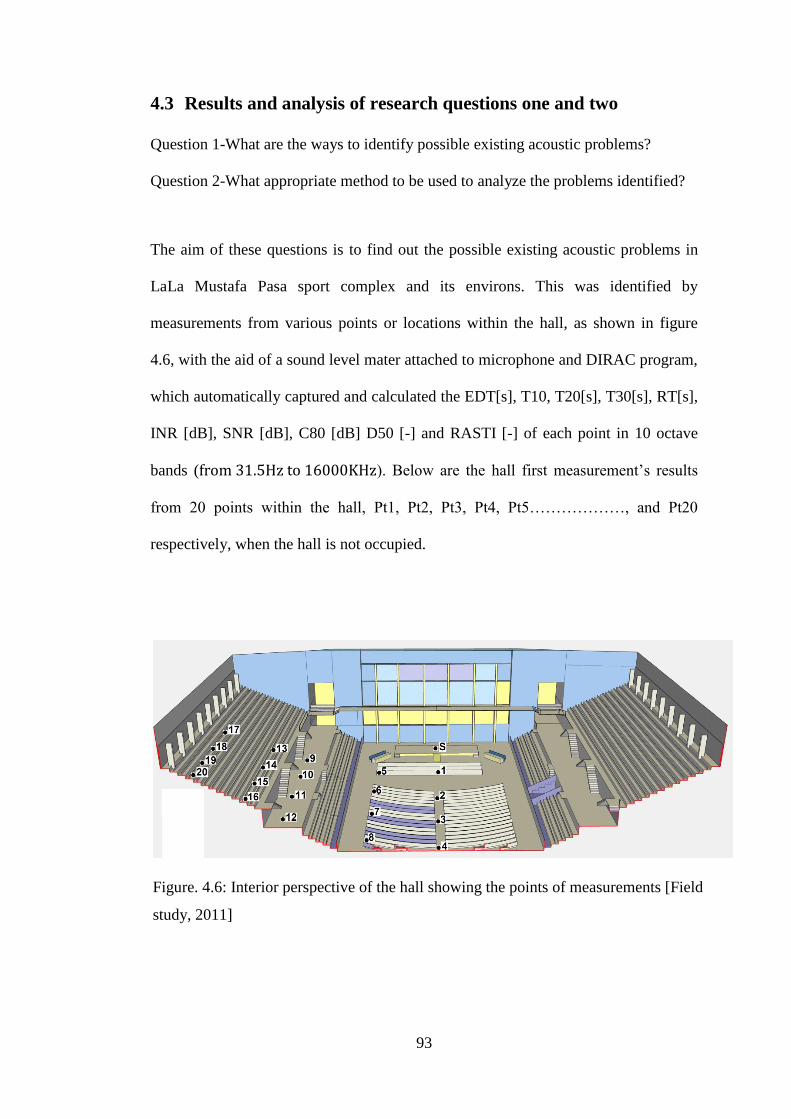
93
4.3 Results and analysis of research questions one and two
Question 1-What are the ways to identify possible existing acoustic problems?
Question 2-What appropriate method to be used to analyze the problems identified?
The aim of these questions is to find out the possible existing acoustic problems in
LaLa Mustafa Pasa sport complex and its environs. This was identified by
measurements from various points or locations within the hall, as shown in figure
4.6, with the aid of a sound level mater attached to microphone and DIRAC program,
which automatically captured and calculated the EDT[s], T10, T20[s], T30[s], RT[s],
INR [dB], SNR [dB], C80 [dB] D50 [-] and RASTI [-] of each point in 10 octave
bands ( ). Below are the hall first measurement‟s results
from 20 points within the hall, Pt1, Pt2, Pt3, Pt4, Pt5………………, and Pt20
respectively, when the hall is not occupied.
Figure. 4.6: Interior perspective of the hall showing the points of measurements [Field
study, 2011]
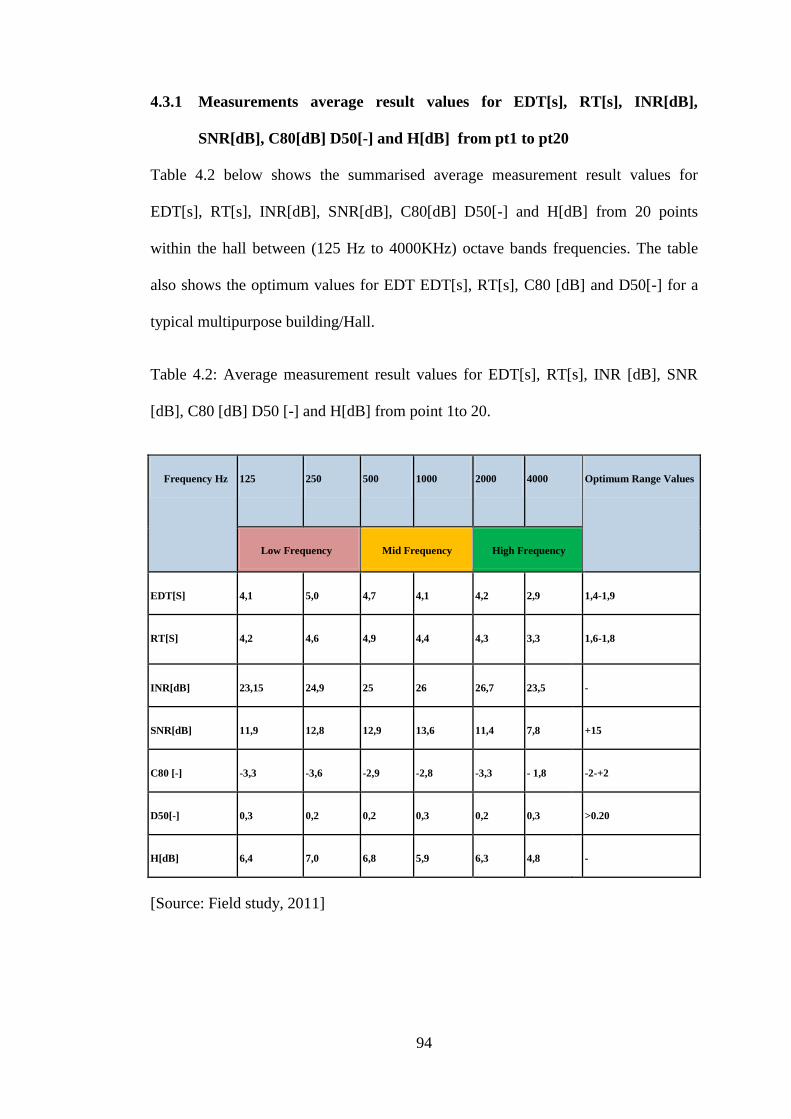
94
4.3.1 Measurements average result values for EDT[s], RT[s], INR[dB],
SNR[dB], C80[dB] D50[-] and H[dB] from pt1 to pt20
Table 4.2 below shows the summarised average measurement result values for
EDT[s], RT[s], INR[dB], SNR[dB], C80[dB] D50[-] and H[dB] from 20 points
within the hall between (125 Hz to 4000KHz) octave bands frequencies. The table
also shows the optimum values for EDT EDT[s], RT[s], C80 [dB] and D50[-] for a
typical multipurpose building/Hall.
Table 4.2: Average measurement result values for EDT[s], RT[s], INR [dB], SNR
[dB], C80 [dB] D50 [-] and H[dB] from point 1to 20.
Frequency Hz 125 250 500 1000 2000 4000 Optimum Range Values
Low Frequency Mid Frequency High Frequency
EDT[S] 4,1 5,0 4,7 4,1 4,2 2,9 1,4-1,9
RT[S] 4,2 4,6 4,9 4,4 4,3 3,3 1,6-1,8
INR[dB] 23,15 24,9 25 26 26,7 23,5 -
SNR[dB] 11,9 12,8 12,9 13,6 11,4 7,8 +15
C80 [-] -3,3 -3,6 -2,9 -2,8 -3,3 - 1,8 -2-+2
D50[-] 0,3 0,2 0,2 0,3 0,2 0,3 >0.20
H[dB] 6,4 7,0 6,8 5,9 6,3 4,8 -
[Source: Field study, 2011]

95
From the analysis as shown in table 4.2, it was deduced that the mid reverberation
time [RT] average from 500-1000Hz is 4.9-4.4s and mid early decay time [EDT] of
the same frequencies is 4.7- 4.1s, exceeds the optimum require values for general
multipurpose use. This indicated that the Hall suffers from sound distribution
problem and also shows that the surfaces of the hall is not at most times results to
early reflections on users of the Hall. However the measurements are for unoccupied
Hall.
For multi-purpose use the optimum range for clarity is given as -2 to +2 dB (Barron,
20090). It was equally observed that the speech clarity of this particular Hall at mid
frequencies (i.e. 500-1000Hz is -2.9 to -2.8) exceeds the optimum range value for
multipurpose use, which shows that this have an effect on the speech intelligibility of
the Hall as a Whole. Below is the graphical representation of the average values for
the EDT[s] and RT[s].
Figure. 4.7: Graphical representation of the EDT[s] and RT[s] [Field study, 2011]
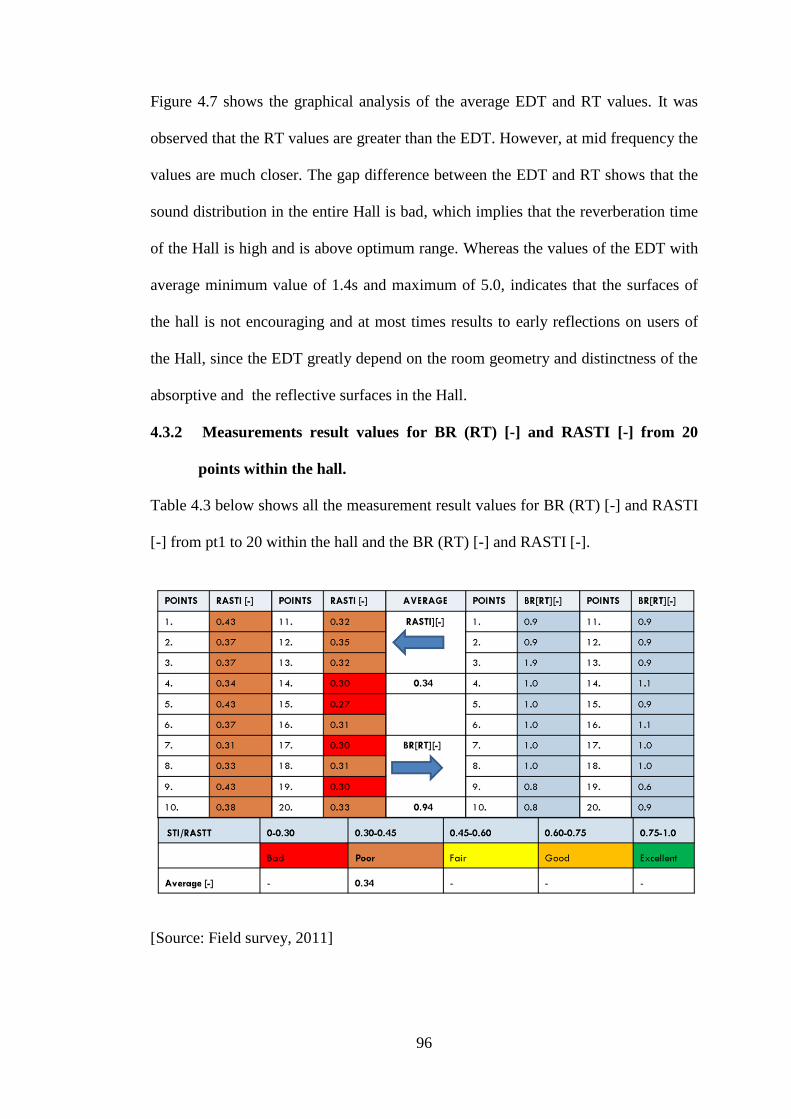
96
Figure 4.7 shows the graphical analysis of the average EDT and RT values. It was
observed that the RT values are greater than the EDT. However, at mid frequency the
values are much closer. The gap difference between the EDT and RT shows that the
sound distribution in the entire Hall is bad, which implies that the reverberation time
of the Hall is high and is above optimum range. Whereas the values of the EDT with
average minimum value of 1.4s and maximum of 5.0, indicates that the surfaces of
the hall is not encouraging and at most times results to early reflections on users of
the Hall, since the EDT greatly depend on the room geometry and distinctness of the
absorptive and the reflective surfaces in the Hall.
4.3.2 Measurements result values for BR (RT) [-] and RASTI [-] from 20
points within the hall.
Table 4.3 below shows all the measurement result values for BR (RT) [-] and RASTI
[-] from pt1 to 20 within the hall and the BR (RT) [-] and RASTI [-].
[Source: Field survey, 2011]
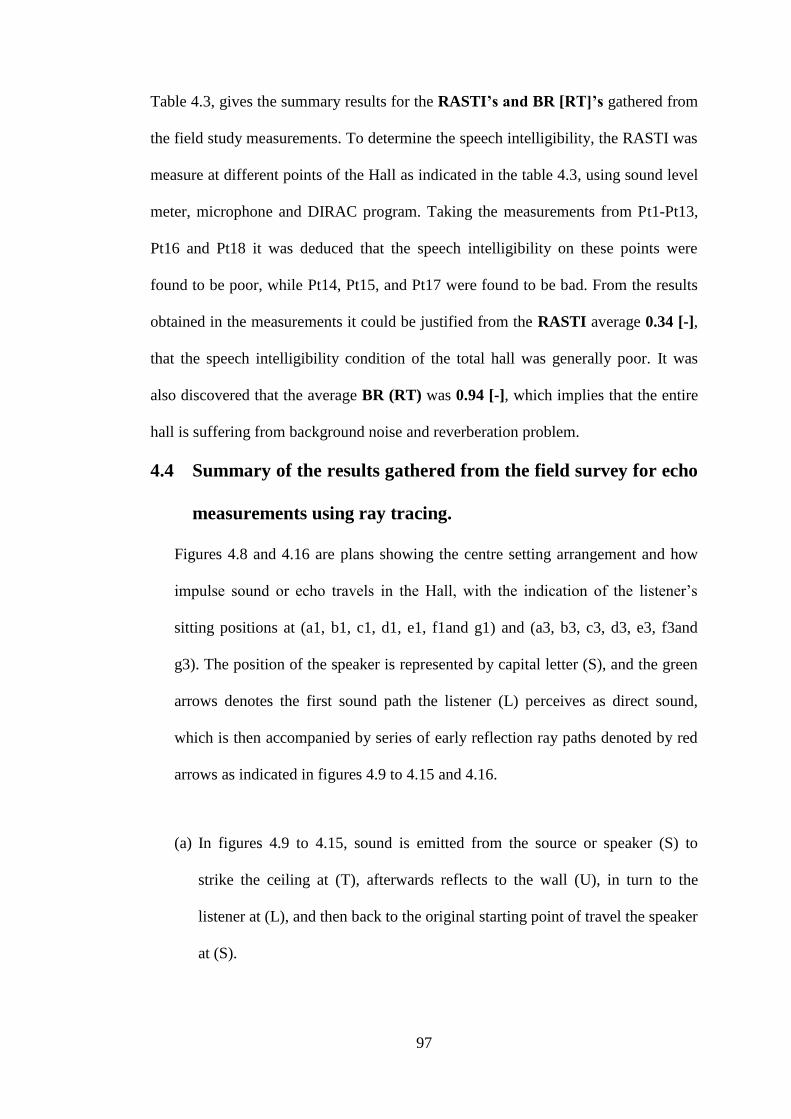
97
Table 4.3, gives the summary results for the RASTI’s and BR [RT]’s gathered from
the field study measurements. To determine the speech intelligibility, the RASTI was
measure at different points of the Hall as indicated in the table 4.3, using sound level
meter, microphone and DIRAC program. Taking the measurements from Pt1-Pt13,
Pt16 and Pt18 it was deduced that the speech intelligibility on these points were
found to be poor, while Pt14, Pt15, and Pt17 were found to be bad. From the results
obtained in the measurements it could be justified from the RASTI average 0.34 [-],
that the speech intelligibility condition of the total hall was generally poor. It was
also discovered that the average BR (RT) was 0.94 [-], which implies that the entire
hall is suffering from background noise and reverberation problem.
4.4 Summary of the results gathered from the field survey for echo
measurements using ray tracing.
Figures 4.8 and 4.16 are plans showing the centre setting arrangement and how
impulse sound or echo travels in the Hall, with the indication of the listener‟s
sitting positions at (a1, b1, c1, d1, e1, f1and g1) and (a3, b3, c3, d3, e3, f3and
g3). The position of the speaker is represented by capital letter (S), and the green
arrows denotes the first sound path the listener (L) perceives as direct sound,
which is then accompanied by series of early reflection ray paths denoted by red
arrows as indicated in figures 4.9 to 4.15 and 4.16.
(a) In figures 4.9 to 4.15, sound is emitted from the source or speaker (S) to
strike the ceiling at (T), afterwards reflects to the wall (U), in turn to the
listener at (L), and then back to the original starting point of travel the speaker
at (S).
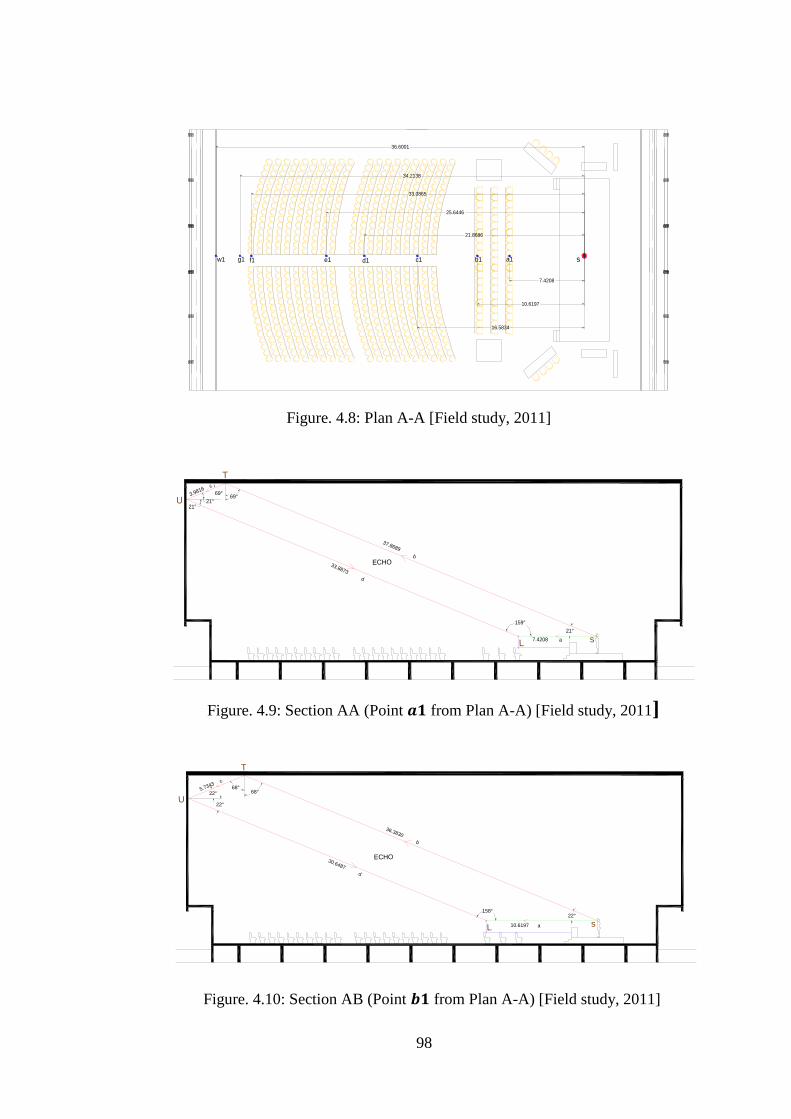
98
e1 d1 c1 b1f1 sa1g1w1
36.6001
34.2138
33.0865
25.6446
21.8686
7.4208
10.6197
16.5834
37.8689
3.9816
33.8873
7.4208
b
c
d
a
ECHO
s
T
U
L
21°21°
69°69°
21°
159°
36.3830
5.7343
30.6487
10.6197
b
c
d
a
ECHO
sL
T
U
22°158°
22°
22°
68°68°
Figure. 4.8: Plan A-A [Field study, 2011]
Figure. 4.10: Section AB (Point from Plan A-A) [Field study, 2011]
Figure. 4.9: Section AA (Point from Plan A-A) [Field study, 2011]
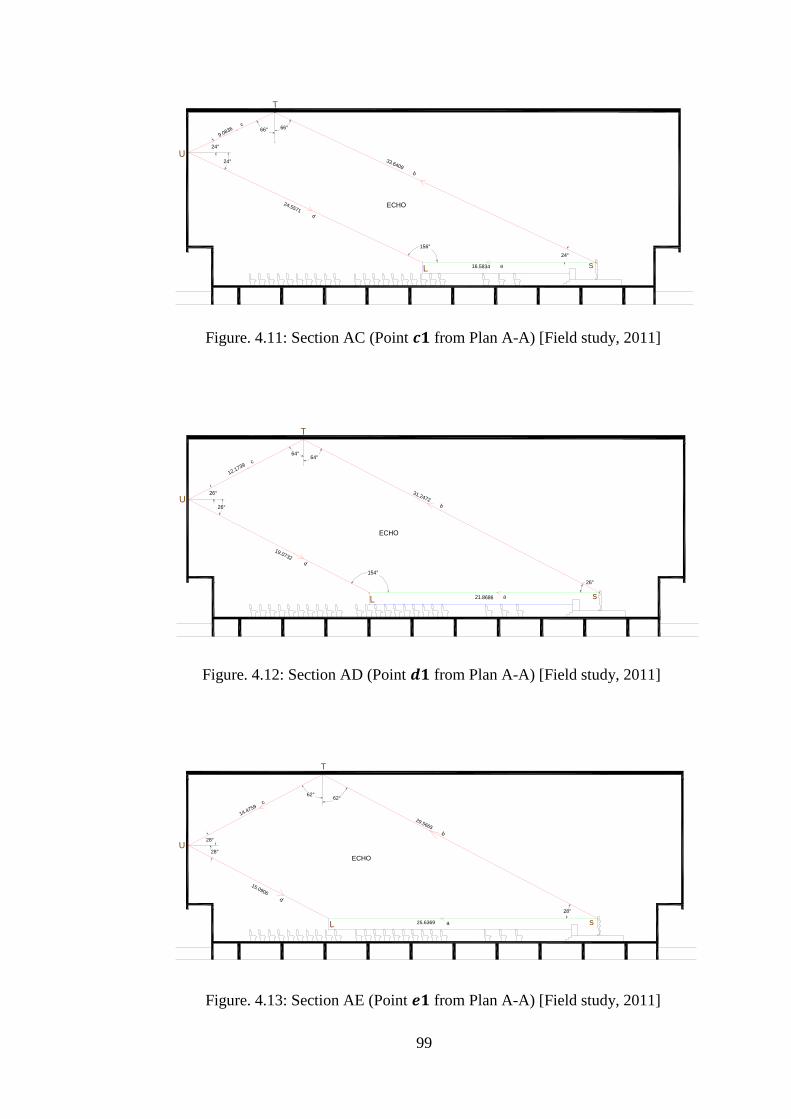
99
33.6409
9.0836
24.5571
16.5834
b
c
d
a
ECHO
sL
T
U
66° 66°
24°
156°
24°
24°
31.2472
12.1739
19.0732
21.8686
b
c
d
a
ECHO
sL
T
U
26°
64°64°
26°
26°
154°
29.5665
14.4759
15.0906
25.6369
b
c
d
a
ECHO
sL
T
U
28°
62°62°
28°
28°
Figure. 4.11: Section AC (Point from Plan A-A) [Field study, 2011]
Figure. 4.12: Section AD (Point from Plan A-A) [Field study, 2011]
Figure. 4.13: Section AE (Point from Plan A-A) [Field study, 2011]
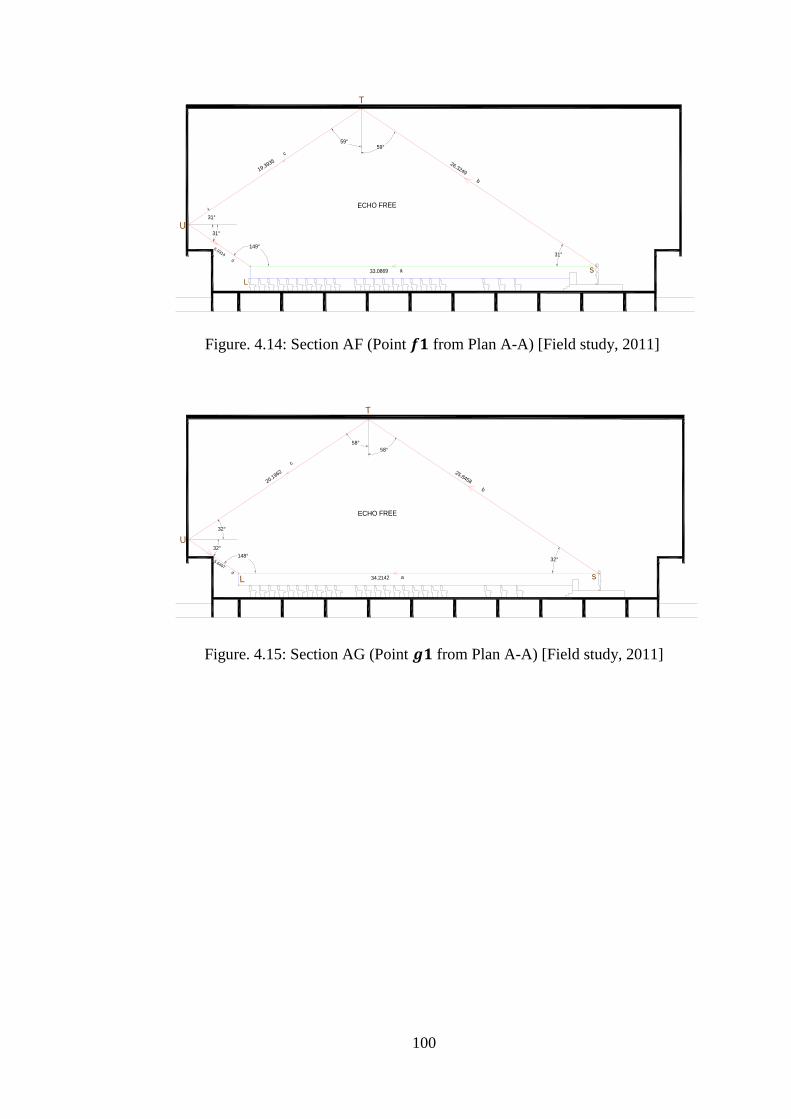
100
20.1962
5.6497
34.2142
c
d
a
25.8458
b
ECHO FREE
sL
T
U
58°
58°
32°
32°
148°32°
19.3935
6.9314
33.0869
c
d
a
26.3249
b
ECHO FREE
s
L
T
U
149°
31°
31°
59°59°
31°
Figure. 4.14: Section AF (Point from Plan A-A) [Field study, 2011]
Figure. 4.15: Section AG (Point from Plan A-A) [Field study, 2011]
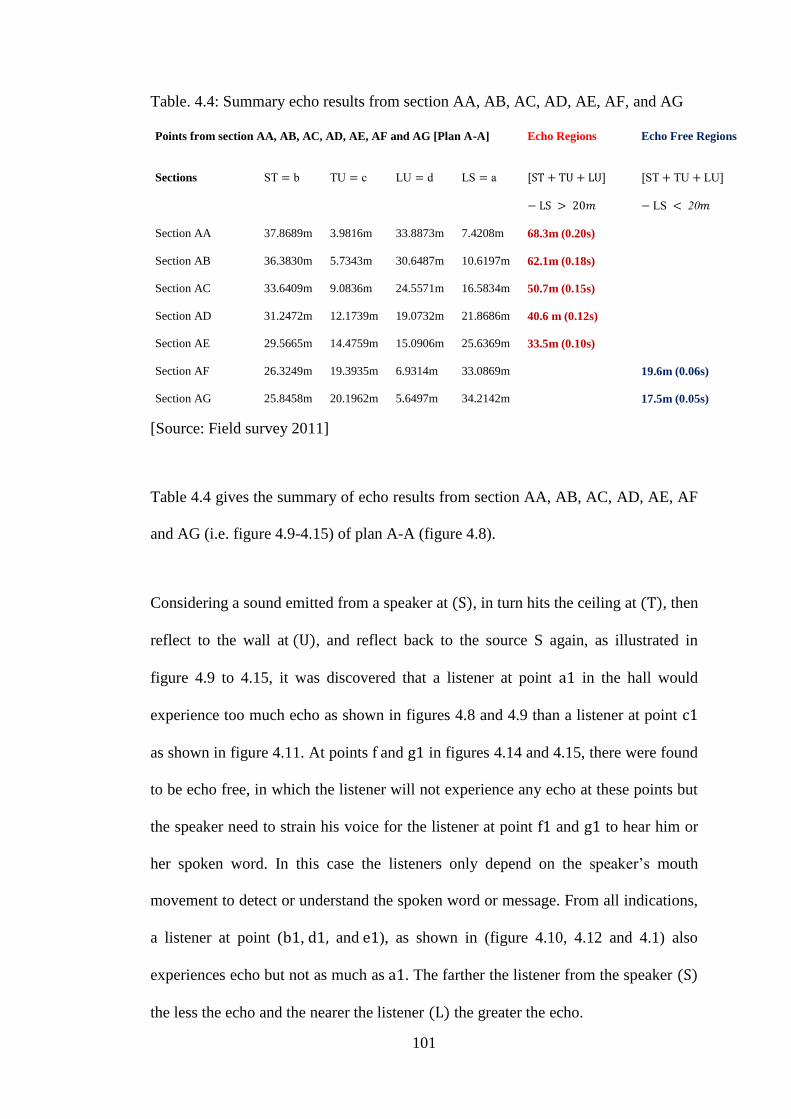
101
Table. 4.4: Summary echo results from section AA, AB, AC, AD, AE, AF, and AG
[Source: Field survey 2011]
Table 4.4 gives the summary of echo results from section AA, AB, AC, AD, AE, AF
and AG (i.e. figure 4.9-4.15) of plan A-A (figure 4.8).
Considering a sound emitted from a speaker at , in turn hits the ceiling at , then
reflect to the wall at , and reflect back to the source S again, as illustrated in
figure 4.9 to 4.15, it was discovered that a listener at point in the hall would
experience too much echo as shown in figures 4.8 and 4.9 than a listener at point
as shown in figure 4.11. At points and in figures 4.14 and 4.15, there were found
to be echo free, in which the listener will not experience any echo at these points but
the speaker need to strain his voice for the listener at point and to hear him or
her spoken word. In this case the listeners only depend on the speaker‟s mouth
movement to detect or understand the spoken word or message. From all indications,
a listener at point ( , and ), as shown in (figure 4.10, 4.12 and 4.1) also
experiences echo but not as much as . The farther the listener from the speaker
the less the echo and the nearer the listener the greater the echo.
Points from section AA, AB, AC, AD, AE, AF and AG [Plan A-A] Echo Regions Echo Free Regions
Sections ST b TU c LU d LS a
ST TU LU
LS
Section AA 37.8689m 3.9816m 33.8873m 7.4208m 68.3m (0.20s)
Section AB 36.3830m 5.7343m 30.6487m 10.6197m 62.1m (0.18s)
Section AC 33.6409m 9.0836m 24.5571m 16.5834m 50.7m (0.15s)
Section AD 31.2472m 12.1739m 19.0732m 21.8686m 40.6 m (0.12s)
Section AE 29.5665m 14.4759m 15.0906m 25.6369m 33.5m (0.10s)
Section AF 26.3249m 19.3935m 6.9314m 33.0869m 19.6m (0.06s)
Section AG 25.8458m 20.1962m 5.6497m 34.2142m 17.5m (0.05s)
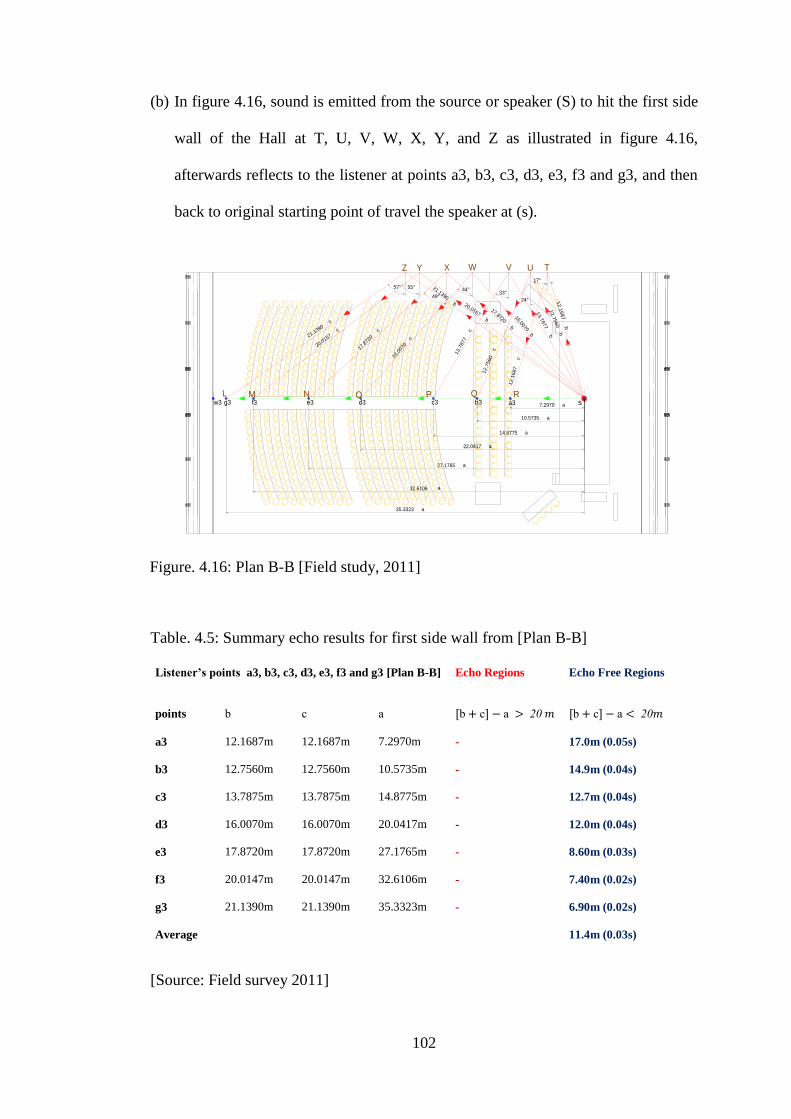
102
c3 b3 a3d3 sg3 e3w3 f3 7.2970
10.5735
14.8775
22.0417
27.1765
32.6106
35.3323
21.1390 c
20.0157
c
17.8
720
c
16.007
0 c
13.7
877 c
12.7
560 c
12.1
687 c
21.1390 b 20.0157 b
17.8720 b
13.7
877 b
12.7
560 b
16.0070 b
12.1
687 b
57° 55°
49°
44°33°
24°
17°
a
a
a
a
a
a
a
TUVWY XZ
RPONML Q
(b) In figure 4.16, sound is emitted from the source or speaker (S) to hit the first side
wall of the Hall at T, U, V, W, X, Y, and Z as illustrated in figure 4.16,
afterwards reflects to the listener at points a3, b3, c3, d3, e3, f3 and g3, and then
back to original starting point of travel the speaker at (s).
Table. 4.5: Summary echo results for first side wall from [Plan B-B]
[Source: Field survey 2011]
Listener’s points a3, b3, c3, d3, e3, f3 and g3 [Plan B-B] Echo Regions Echo Free Regions
points b c a b c a b c a
a3 12.1687m 12.1687m 7.2970m - 17.0m (0.05s)
b3 12.7560m 12.7560m 10.5735m - 14.9m (0.04s)
c3 13.7875m 13.7875m 14.8775m - 12.7m (0.04s)
d3 16.0070m 16.0070m 20.0417m - 12.0m (0.04s)
e3 17.8720m 17.8720m 27.1765m - 8.60m (0.03s)
f3 20.0147m 20.0147m 32.6106m - 7.40m (0.02s)
g3 21.1390m 21.1390m 35.3323m - 6.90m (0.02s)
Average 11.4m (0.03s)
Figure. 4.16: Plan B-B [Field study, 2011]
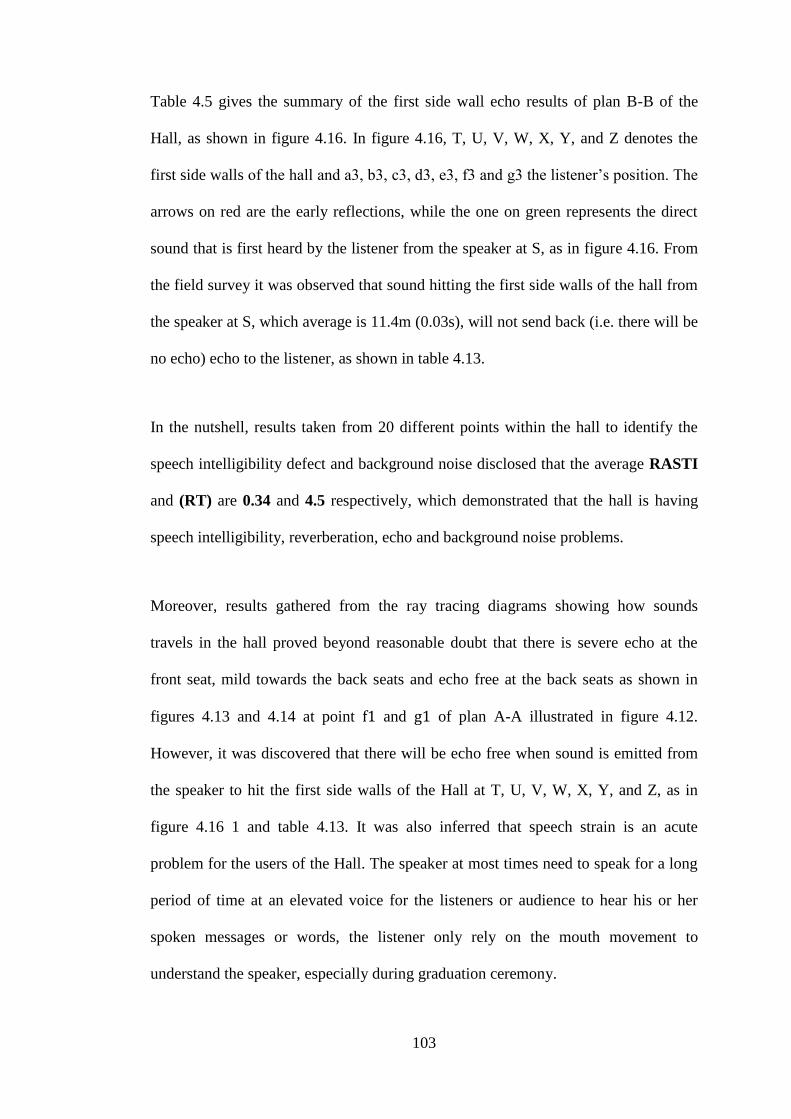
103
Table 4.5 gives the summary of the first side wall echo results of plan B-B of the
Hall, as shown in figure 4.16. In figure 4.16, T, U, V, W, X, Y, and Z denotes the
first side walls of the hall and a3, b3, c3, d3, e3, f3 and g3 the listener‟s position. The
arrows on red are the early reflections, while the one on green represents the direct
sound that is first heard by the listener from the speaker at S, as in figure 4.16. From
the field survey it was observed that sound hitting the first side walls of the hall from
the speaker at S, which average is 11.4m (0.03s), will not send back (i.e. there will be
no echo) echo to the listener, as shown in table 4.13.
In the nutshell, results taken from 20 different points within the hall to identify the
speech intelligibility defect and background noise disclosed that the average RASTI
and (RT) are 0.34 and 4.5 respectively, which demonstrated that the hall is having
speech intelligibility, reverberation, echo and background noise problems.
Moreover, results gathered from the ray tracing diagrams showing how sounds
travels in the hall proved beyond reasonable doubt that there is severe echo at the
front seat, mild towards the back seats and echo free at the back seats as shown in
figures 4.13 and 4.14 at point and of plan A-A illustrated in figure 4.12.
However, it was discovered that there will be echo free when sound is emitted from
the speaker to hit the first side walls of the Hall at T, U, V, W, X, Y, and Z, as in
figure 4.16 1 and table 4.13. It was also inferred that speech strain is an acute
problem for the users of the Hall. The speaker at most times need to speak for a long
period of time at an elevated voice for the listeners or audience to hear his or her
spoken messages or words, the listener only rely on the mouth movement to
understand the speaker, especially during graduation ceremony.

104
Furthermore, in some cases, the speaker experiences a higher incidence of voice
problems than the general audience or listeners.

105
Chapter 5
RECOMMENDATION AND CONCLUSION
5.1 Recommendations for Possible Noise Control Measures
in LaLa Mustafa Pasa Sport Complex
The provision of adequate and pleasant listening space in LaLa Mustafa Pasa Sports
Complex is very important for the users in general, since uncoordinated noisy
environment can lead to several health hazards. Against this background the study
proffers the following recommendations.
1. Application of natural terrain such as tress and artificial barriers such as screen to
provide additional shielding and prevent traffic noise from intruding into the hall
from the outside should be introduced.
2. Hanging baffles such as ANC-600P premium ceiling baffles should be hanged
freely from the Hall trusses to interrupt the path of noise and reduce the amount
of sound reverberation. It has a noise rating criteria (NRC) of 1.15 per 4' x 2'
(0.10m-0.05m) Baffle and has a Class A fire rating per ASTM E-84. It also has
lowers center frequency of maximum absorption to 125 Hz (0.46) and mid to
high frequency absorption is typically 500Hz (1.07) to 2000Hz (1.01). This type
of baffles is capable of withstanding abuse from basketballs, volleyballs and the
like. 24" - 35" (0.61m to 0.82m) apart over the entire reverberant hall can result
in approximately 4 - 12 decibel reduction in general noise.
106
3. Wall diffuser such as double duty diffuserTM
(polycylindrical fabric covered),
should be placed on side and real wall to conserve or act to scatter high frequency
sound and trap bass in any location of the hall. The bass absorption vary with
size. A 2‟ x 4‟ (0.05m-0.10m) unit is recommended because it has maximum
absorption at approximately 125 Hz. Increasing size to 4‟ x 8‟ (0.10m x 0.20m)
lowers center frequency of maximum absorption to 63 Hz. Mid to high frequency
absorption is typically 0.10 to 0.25 and has a noise rating criteria (NRC) 0.10.
This type of diffuser is also capable of increasing absorption and prevents
resonance.
4. Wall panel such as Ripstop nylon material should be used on side and rear walls;
because such panels covered with Ripstop nylon offers an extremely durable
baffle that can withstand abuse from basketballs and volleyballs. These fiberglass
filled wall panel is excellent for acoustical treatment in large open rooms and
work well to reduce reverberation and increase speech intelligibility.
5. Acoustic carpet underlay such as silentstep or impact barrier® LD carpet
underlayment should be install on the floors of the hall (i.e. the walk way in
between the seats and large corridor) to maximise noise by providing superior
airborne noise transmission loss and excellent impact noise. These products are
extremely effective in reducing impact sound from footfall and very effective in
reducing airborne sound transmission and add comfort to your carpeted floor.
These products are also engineered for low pile carpets and qualify as a Class II
heavy traffic commercial grade products. However, maintenance and replacement
cost should be considered.
6. Cracks and openings around conduits, pipes, or ducts should be sealed by using
ANC-WB42 Loaded Vinyl, Composite Noise Wrap Barrier. This composite
107
prevent noise that transmits through the walls of the pipe or duct as air or other
contents move through it. In addition it also increases the sound absorption in the
cavity and provides sound absorption and thermal insulation around the pipe or
ductwork. Among other products, ANC-WB4 loaded vinyl has a smoke density
index of 19.5, flame spread index of 12.5 and has a class A flammability rating
per ASTM E-84 which makes the product a good fire resistance. It can also
withstand temperature of -10° to +180° F and which makes it a good insulator.
This product is also recommended because of noise rating criteria (NRC) of 30
with lower center frequency of 19 (125Hz) and mid to high frequency abortion of
23(500Hz) and 23(2000Hz) respectively.
7. Quality electronic sound reinforcement system should be used to reduce sound
that will mask speech intelligibility. Without good acoustic reinforcement from
surfaces, sound may dominate the room and might lead to unnatural sound.
8. Replacement of existing windows with insulated glass such as double glazing of
1/4” air space cavity with STC rating of 51 should be used, however the larger
the air cavity the better the STC rating, or acoustical lovers to reduce traffic noise
(air-born sound) from intruding into the hall from the exterior (outside). This
double glazing reduces a 60 dB outside traffic noise level to 40 dB within the hall
and it also improves the thermal performance of the hall.
5.2 Conclusion
In conclusion, a multipurpose space should be able to handle a wide range of
functions. It should be designed with several lighting systems, have acoustically
treated walls and ceilings, and be technologically integrated and easily maintained. A
good multipurpose space should be able to satisfy the needs of its assigned functions
at reasonably high levels of performance. Whether they are used for multimedia
108
presentations, stage and musical productions, physical education, or sport activities,
acoustic issues need to be addressed in the design phase or stage to minimize some of
the hazards in the multipurpose spaces/ auditoria and other related buildings in
general. They must also be improved upon to ensure pleasant environment for the
occupants after completion. It was clearly observed from the study that the major
surfaces in an auditorium have important implications on the acoustical quality of a
place. As a result acoustic balance maintains desired characteristics of speech
intelligibility, reverberation time, and echo to mention but three factors only.
In this research, DIRAC computer program was used for the assessment of the
acoustical defects of the unoccupied Hall. The results from the research for [RT] and
[EDT] show that there is excessive reverberation time and early decay time
throughout the Hall, since the optimum range reverberation time and early decay
time for multipurpose Halls should not exceed between 1.6 to 1.8s and 1.4 to 1.9s
respectively. The research results also show that the bass balance which is the ratio of
mid frequency [RT] to high frequency [RT] falls above the optimum range.
It was also confirmed that clarity was undermined by excessive reverberance sound,
which in turn affects speech in the entire hall. The speech intelligibility of this hall
was found to be poor, which disclosed that the hall is having severe speech
intelligibility problem. Another aspect is the sound level distribution from the echo
ray tracing, which shows that the hall has no reflectors and absorbing materials to
reflect and absorb sound sufficiently through the hall and as a result led to the
formation of echo, longer reverberation and poor quality of sound distribution
throughout the hall. Moreover, in this case the direct sound becomes inadequate at
the middle and back seats locations of the hall.
109
Results gathered from the ray tracing also show that there is severe echo at the front,
middle and echo free at the last back seats. However, speech strain is an acute
problem for the users of the hall. The speaker at most times need to speak for a long
period of time at an elevated voice for the listeners or audience to hear his or her
spoken words, the listener only depends on the mouth movement to understand the
speaker. Furthermore, in some cases, the speaker experiences a higher incidence of
voice problems than the general audience or listeners.
Consequently, in order to avoid acoustical defects, precautions has to be taken from
the design stage as earlier mentioned, since eradicating acoustic defects completely
in large buildings is almost inevitable. However, the acoustics of LaLa Mustafa
Pasha Sport Complex should be taken care of by implementing the above
recommendation to mitigate or attenuate the noise defects to the minimal, since noise
can be controlled by modifying the source, the path and the receiver, using sound
absorbing materials, sound barriers or deflectors, acoustical linings, and other sound
control materials.
5.2.1 Suggestions for further research
(i) Further research could be made to ameliorate the acoustical stability of this hall
by using acoustic model testing to identify the diffuse and specula reflections
and will address many of the drawbacks of previously reported models, level of
speech intelligibility and other factors through a technique known as
“Auralisation”. This will be finally achieved by the use of personal computer
software called “ODEAN” software to predict the acoustical defects of the hall.
This program also improves the room acoustics of existing buildings or halls.
(ii) Apart from the economical ways and materials mentioned in this research for
mitigating sound in LaLa Mustafa Hall of EMU, North Cyprus, further study
110
could also be research upon on the newest best durable sound absorbing
materials to be used to control sound in the Hall. Moreover, the most economic
aspect of these suggestions should be studied upon as well.
(iii) Further research could also be done on the hall to determine occupied
reverberation time [RT] for correlation with the unoccupied reverberation time
[RT] result measured in this research.
111
REFERENCES
A New DIRAC. (2008). Measuring Speech Intelligibility. Bruel & Kjar Magazine,
(1), 26-27.
Alison, R. (2009). Renovation of Roy Thomson Hall. Artec Consultants Inc.
Retrieved from,
http://www.artec-
usa.com/03_projects/performing_arts_venues/roy_thomson_hall/press/roy_th
omson_hall_press_01.html 15.
Alton, E. (2001). The Master Handbook of Acoustics. New York: McGraw- Hill
Companies, Inc.
Andrade, E. (1932). The sale Pleyel. Paris and Architectural Acoustics Nature,
(130), 332-333.
Arthur, N. (2002). Auditorium Acoustics. Retrieved from,
http://www.church-acoustics.com/aa104.htm6 June. 2011.
ASHA. (2000). Classroom Acoustics: A resource for creating learning environments
with desirable listening conditions. Acoustical Society of America, (2), 112 -
125.
ASHRAE. (1991). Sound and Vibration Control. In ASHRAE System Guide and
Data Handbook, Chapter 42, Atlanta.
Ausgabe. (2009). Ausgabe. In Bildern-Monumente-online Magazine. Retrieved from
http://monumente2009-preview.sitepark.com/07/02/service/bilderindex.php
23 Jun. 2011.
Bagenal, H and Wood, A. (1931). Planning For Good Acoustics. London: Methuen
and Co. Ltd.
112
Bagenal, H. (1950). Concert Halls. Journal of the Royal Institute of British
Architects, 84-85.
Ballon, G. (2000). A Sound Engineer’s Guide to Audio Test and Measurement.
United Kingdom: Elsevier‟s science and technology Ltd.
Barron, F. (2003). Industrial Noise Control and Acoustics: U.S.A: Marcel Dekker
Inc.
Barron, M. (1988). The Royal festival Hall Acoustic Revisited. Applied acoustics,
24(4), 255-273. Doi: 10.1016/0003-682x (88)90084-9.
Barron, M. (1992). Precedents in Concert Hall Form. Proceedings of the institute of
Acoustics, 14(2), 147-156.
Barron, M. (1993). Auditorium Acoustics and Architectural design: London: Spon
Press.
Barron, M. (1995). Bass sound in concert auditoria. Journal of the acoustical society
Of America, 97, 1088-1098.
Barron, M. (2009). Auditorium Acoustics and Architectural design: London: Spon
Press.
Bartlett, B and Bartlett, J. (2009). Practical Recording Techniques: The step-to-step
Approach to Professional Audio Recording. United Kingdom: Elsevier Inc.
Beranek, L. (1960). Noise Reduction. New York: McGraw- Hill.
Beranek, L. (1962). Music, Acoustics and Architecture. New York: John Wiley &
Sons Inc.
Beranek, L. (1979). The Acoustical Design of Boston Symphony Hall. Acoustical
Society American, 66, 1220.
Beranek, L. (2004).Concert Halls and Opera Houses: Music, Acoustics and
Architecture: New York: John Wiley & Sons, Inc.
113
Beranek, L. (1986). Acoustics. New York: American Institute of Physic Inc.
Berlin Philharmonic Hall of 1963. Retrieved from
http://www.greatbuildings.com/cgi-bin/gbi.cgi/BerlinPhilharmonic
Hall.html/cid1073050979 Concerthall6.html30 Jun. 2011
Bhatnagar, S. (2002). Neuroscience for the Study of Communicative Disorders.
United state of America: Lippincott Williams & Wilkins.
Bies, D and Hansen, C. (1996). Engineering Noise Control: Theory and Practice.
London: E & FN Spon Press.
Bies, D and Hansen, C. (2009). Engineering noise control: Theory and Practice.
New York: E & FN Spon Press.
Binggeli, C and Greichen, P. (2011). Interior Graphic Standards. New Jersey: John
Wiley & Sons Inc.
Blauert, J. (1983). Spatial Hearing. Cambridge, MA: MIT Press,
Bliss, S. (2005). Best Practice Guide to Residential Construction: Materials,
Finishes and Details. New York: John Wiley & Sons.
Borwick, J. (2001). Loudspeaker and Headphone Handbook. London: Reed
Education & Professional Publishing Ltd.
Broner, N. (2008). Effect of infrasound, low frequency noise, and ultrasound on
People. In Handbook of Noise Control. (Eds.) Crocker M, (26). Hoboken,
New Jersey: John Wiley & sons Inc.
Bistafa, S and Bradley, S. (2000). Reverberation Time and Maximum Background-
Noise Level for Classroom from a Comparative Study of Speech Intelligibility
Metric. Acoustical Society of America, 100(1), 408-427.
114
Bradley, S et al. (1987). Review of Methods of Measuring Rooms for Speech. Paper
Presented at the 113th meeting of the Acoustical Society of America,
Indianapolis Inc.
Bradley, S. (1991). Some Further Investigations of the Seat Dip Effect. Acoustical
Society of America. 100(1), 427-436.
Bradley, S. (1992). Predicting Theater Chair Absorption from Reverberation
Chamber Measurements. Acoustical Society of America, 91, 1514-1512.
Bradley, S. (1986). Predictors of Speech Intelligibility in Rooms. Acoustical
Society of America.80, 837-845.
Braham, H. (1980). The Architecture of the French Enlightenment. London: Thames
& Hudson Ltd.
Brewer, C. (1854). Sound and Its Phenomena. London: Jerrold Nadler.
Brüel and Kjaer. (1998). Sound and vibration measurement (A/S).
Camhi, J. (1984). Neuroethology; Nerve Cells and the Natural Behavior of Animals.
Sunderland. Massachusetts: Sinauer Associates, Inc.
Cavanaugh, W and Wilkes. (1999). Architectural Acoustics: Principles and Practice.
Canada: John Wiley & Son, Inc.
CBSE Sample Paper34 Science Class X. (2010). Retrieved from
http://www.wiziq.com/tutorial/104356-CBSE-Sample-Paper34-Science-
Class-X-2010
Clement, P. (1999). Reflection On An Ideal: Traditional And Changes At The
Grosser Musikvereinssaal Vienna. Proceeding of the Institute of Acoustics,
21(6), 4-12.
Cox, T and D‟Antonio. (2004). Acoustics Absorbers and Diffusers: Theory, Design
and Application. New York: Spon Press.
115
Crandell, C et al. (2005). Sound Field Amplification: Principles and Applications
of Room Acoustics. 1, London: Applied Science.
Cremer, L. (1989). Early Lateral Reflections in Some Modern Halls. Acoustical
Society of America, 85, 1213-1225.
D‟Antonio, P. (2008). Acoustic Absorbers And Diffusers: Theory, Design And
Application. London :Spon Press.
Diament, P. ( 1986). Wave Transmission and Fiber Optics. New York: Macmillan
Publishing Company.
Dorman, M. et al. (1997). Speech Intelligibility As A Function of The Number of
Channels of Stimulation For Signal Processor Using Sine-Wave And Noise-
Band Outputs. Acoustical society of America, 102(4), 2403-2411.
Egan, M. (2007). Architectural Acoustics. New York: McGraw- Hill, Inc.
Elert, G. (2004). Frequency Range of Human Hearing. In Physic Factbook
Wikipedia (Eds.), The Free Encyclopedia. Retrieved From
http://hypertextbook.com/facts/2003/ChrisDAmbrose.shtml
Ervin, S. (2010). Introduction to the Anatomy and Physiology of the Auditory System:
Retrieved From,
http://www.workplaceintegra.com/hearing-articles/Ear-anatomy.html,17
May. 2011.
Finocchiaro, M. (1989). The Galileo Affair: A documentary History. London:
University of California Press Ltd.
Forsyth, M. (1985). Building For Music. England: Cambridge university press.
Funk and Wagnalls. (1994). Explanation of Acoustics. In ACS
Articles(Eds.), Retrieved From,
http://www.allchurchsound.com/education/edart/acsts.html.
116
Green Glue Company LLC. ( 2006). Impact Noise: Retrieved from,
http://www.someacustica.com/imagens/greenglue/dealingWithImpactNoise.p
df.
Gunn, P. (2009). Causes of Hearing Damage: Occupational Health and Safety
Proactioner Reading. Western Australia: Workpsafe.
Haas, H. (1972). The Influence of A Single Echo On The Audibility of Speech.
Audio Engineering Society, 20, 146–159.
Harris, C. (1991). Handbook of Acoustical Measurements and Noise Control. New
York: McGraw-Hill,Inc.
Harris, C. (1994). Noise control in buildings: a guide for Architects and Engineers.
New York: McGraw-Hill,Inc.
Harris, C. (2001). Acoustical design of Benaroya hall, Seattle. Acoustical
Society of America, 110, 2841-2844.
Harris, C. (1975). Dictionary of Architecture and Construction. New York:
McGraw-Hill,Inc.
Houtgast, T et al. (2002). Past, Present and Future of The Speech Transmission
Index. In TNO Human Factors (Eds), Netherland : Soesterberg.
Houtgast, T. et al. (1985). A Review of The MTF Concept In Room Acoustics And Its
Use For Estimating Speech Intelligibility In Auditoria. Acoustical Society of
America, 77, 1069-1077.
Howard, D and Augus, J. (2009). Acoustics And Psychoacoustics. United kingdom:
Elsevier Ltd.
Hunt, F.(1978). Origin of Acoustics: The Science Of Sound From Antiquity To The
Age Of Newton. New Haven: Yale University Press.
117
Huntington, W and Mickadeit, R. (1981). Building construction: Materials and types
of construction. New York: John Wiley &Sons.
Jacko, R and LaBreche, T. (2009). Environmental Health and Safety For Municipal
Infrastructure, Land Use And Planning, And Industry. USA: John Wiley &
Sons Inc.
JISC Digital Media: Audio The Physical Principle of Sound. Retrieved from
http://www.jiscdigitalmedia.ac.uk/audio/advice/the-physical-principles-of-
sound.
Johnson, R.(1990). Reflection on The Acoustical Design of Halls For Music
Performance: V.O. Knudsen Lectures, A paper presented on the 120th
meeting
of the Acoustical Society of America.
Jordan, N and Rinder, J. (2006). The Alberta Jubilee Halls reborn with Up-To-Date
Acoustics. Proceedings of the Institute of Acoustics, (28) 2, 297-298.
Kang, J. (2002). Acoustics of Long Spaces: Theory And Design Practice. London:
Thomas Telford Ltd.
Kleiner, M. (1980). On The Audience Induced Background Noise Level in Auditoria.
Acoustical Society of America, 46, 82-88.
Kurtovic, H. ( 1975). The Influence of Reflected Sound Upon Speech Intelligibility.
Acoustical Society of America, 33, 32-39.
Lochner, J. and Burger, J. (1958). The Subjective Masking of Short Time Delayed
Echoes, Their Primary Sounds, And Their Contribution To The Intelligibility
of Speech. Acoustical society of America , 8, 1–10.
Louis, V. (1782). Salle de Spectacle de Bordeaux. Paris.
118
Marsh, A.(2002). Speech Intelligibility. Retrieved from
http://www.kemt.fei.tuke.sk/Predmety/KEMT320_EA/_web/Online_Course_
on_Acoustics/intelligibility.html 12 Jul. 2011.
Martin BL and Martin GK. (2010). Noise Induced Hearing Loss. Philadelphia, Pa:
Elsevier Science & Technology Ltd.
Means, R. (2009). The gypsum construction Handbook. United States: John Wiley &
Sons Inc.
Mechel, F. (1994). Helmholtz Resonators With Slotted Neck Plates. Acoustical
Society of America , 80, 321-331.
Mechel, F.(2001). Panel Absorber. Journal of Sound Vibration, 248(10), 43-70.
Mehta, M et al. (1998). Architectural Acoustics :Principles and Design. New York:
Prentice hall.
Melnick, W. (1991). Human Temporary Threshold Shift (TTS) and Damage Risk.
Acoustical Society of America, 90(1), 147-154.
Metkemeijer el at. (1988). The Dr Anton Philips Hall in the Hague. Proceedings of
the Institute of Acoustics 10 (2), 271-280.
Meyer, J. (2009). Acoustics and the Performance of Music. New York: Springer
Science.
Microsoft Encarta Online Encyclopedia. (2000). Whale. Retrieved from
http://encarta.msn.com.
Microsoft Encyclopedia Encarta Standard Edition (2008). Acoustics and Ear.
Retrieved from http://encarta.msn.com
Müller, H. (1992). The simple design of shoebox concert halls and their
shortcomings: Proceedings of the institute of Acoustics, 14 (2), 9-16.
New York: Springer.
119
Patte, P. (1782). Essai sur l’architecture théâtrale. Paris : Kessinger Publishing,
LLC.
Pawel, J. et al. (1996). Neurophysiologic Approach to Tinnitus Patients. America
Journal of Otology, Inc, 17(2), 187-368.
Pelton, H. (1993). Noise Control Management. New York : Van Nostrand Reinhold.
Pitch. (2002). Retrieved from
http://www.cartage.org.lb/en/themes/Sciences/Physics/Acoustics/PhysicalCha
racteristics/Pitch/Pitch.htm 13 May. 2011.
Primacoustic Acoustic Solutions: Radial Engineering Ltd. Retrieved from:
http://www.primacoustic.com/radiator-science.htm.
Raichel, D. (2006). The Science and Applications of Acoustics: New York: Springer
Science and Business Media, Inc.
Ramsey, C et al. (2000). Architectural Graphics Standard. New York: John Wiley
and Son, Inc.
Rayleigh, S. (1878). The Theory of Sound. 1, London: Macmillan Education
Ltd.
Rayleigh, S. (1945). The Theory of Sound. London: Macmillan Education Ltd.
Rogers, C. (1982). A Social Psychology of Schooling: Expectancy Process. London:
Law Book Co. of Australasia.
Roy Thomson Hall Tickets. (2005). Retrieved from:
http://www.gamestub.com/roy-thomson-hall-tickets/html 30 Jun. 2011.
Roy Thomson Hall. (2009). Conference of Independent Schools’ Music Festival.
Retrieved from http:/www.cismf.ca.30 Jun.2011.
Rumsey, F and McCormick, T. (2009). Sound And Recording. United kingdom:
Elsevier Ltd.
120
Sabine, W. (1922). Collected Papers On Acoustics. New York: Harvard University
Press.
Sale Pleyel. (2010). Retrieved from,
http://www.eurocheapo.com/blog/paris-music-venue-salle-pleyel.html 23 Jun.
2011.
Salvato, A. (1982). Environmental Engineering and Sanitation. New York: John
Wiley & Sons Inc.
Salvi, R. et al. (1998). Protecting The Inner Ear From Acoustic Trauma. The
International Tinnitus Journal, 4(1), 11-15.
Saunder, G. (1790). A Treatise on Theatres. London: Benjamin Blom, Inc.
Shepherd, G. (1994). Neurobiology. New York: Oxford University Press.
Shih, H. (1991). A literature Survey of Noise Pollution. Washington, DC: National
Technical Information Service, Spring Field, Vergina.
Sidney, S. (1955). Green Retreats: The story of Vauxhall Gardens, 1661–1859.
London: Odhams Press. Retrieved from Answers.com:
http://www.answers.com/topic/vauxhall-gardens 18 Jun. 2011.
Smith, R. (1861). Acoustics of Public Buildings. London: Crosby Lockwood
Sound Art Press. Retrieved from:
http://www.soundart.com/p/press.html 23 Jun. 2011.
Engineering ToolBox. (2011). Sound Intensity. Retrieved from,
http://www.engineeringtoolbox.com/sound-intensity-d_712.html 15 May.
2011.
Suntory Hall. (2007). Retrieved from:
http://www.nagata.co.jp/sakuhin/factsheets/suntory.pdf 30 Jun. 201.

121
Talaske, H et al. (1982). Halls for Music Performance: Two decades of experience
1962-1982. New York: Institute of Physic.
Templeton, D. (1993). Acoustics in the built environment: Advice for the design team
London: Reed Educational and Professional Publishing Ltd.
Turner, J and Pretlove, A. (1991). Acoustics For Engineers. London: Macmillan
Education Ltd.
Ukers, W.(2009). All about coffee. The tea and coffee trade journal company, New
York. Retrieved from:
http://www.gutenberg.org/files/28500/28500-h/28500-h.htm. 18, June, 2011.
Vitruvius, P. (1960). The Ten Books on Architecture. New York : Dover
Publications.
Walter, T et al. (2009). Mechanical and Electrical Equipment for Buildings. New
York: John Willey and Sons, Inc.
Warnock, A.( 1998). Controlling sound transmission through concrete block walls.
Instate for research in construction, national research council, construction
technology update 13. Retrieved from:
http://www.nrc-cnrc.gc.ca/eng/ibp/irc/ctus-n 13. html 08 June, 2011.
Warnock, A.( 1999). Controlling s the transmission of impact sound through floors.
Instate for research in construction, national research council, construction
technology update 15. Retrieved from:
http://www.nrc-cnrc.gc.ca/eng/ibp/irc/ctus/ctus-n35.html 16 June, 2011.
Water and Noise Pollution. (nd). Retrieved from
http://www.scribd.com/doc/47580442/Water-and-Noise-Pollution 15 May.
2011.
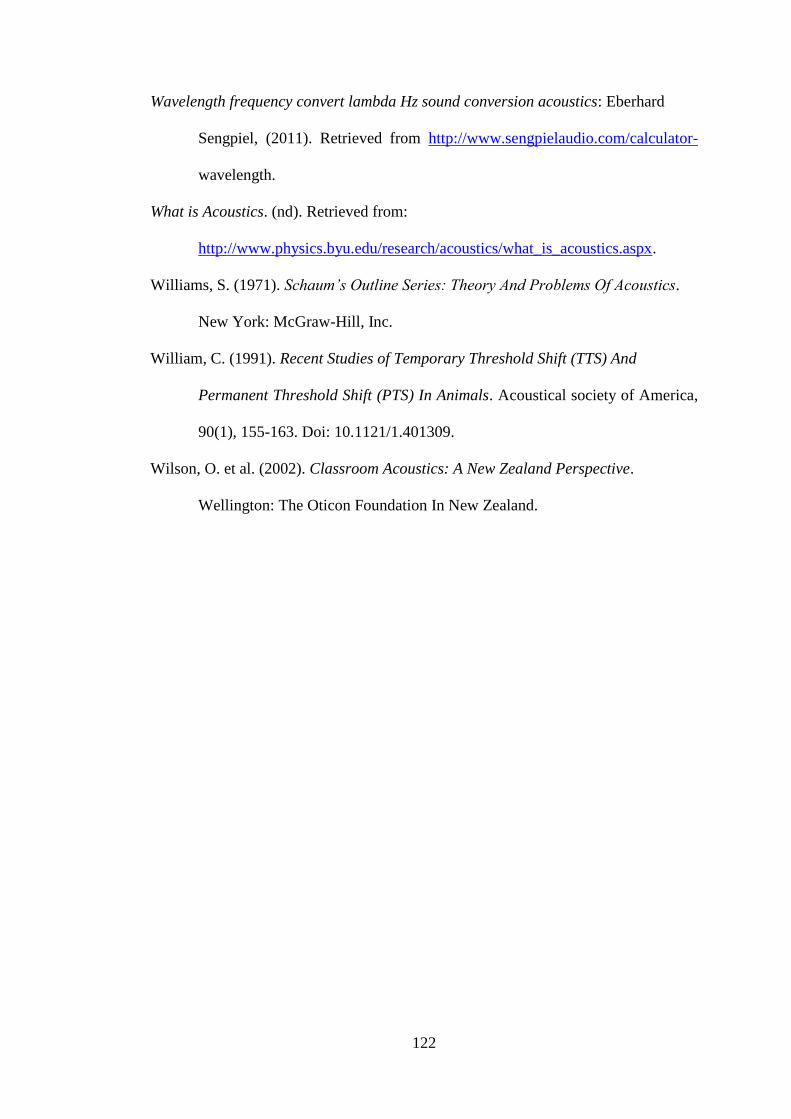
122
Wavelength frequency convert lambda Hz sound conversion acoustics: Eberhard
Sengpiel, (2011). Retrieved from http://www.sengpielaudio.com/calculator-
wavelength.
What is Acoustics. (nd). Retrieved from:
http://www.physics.byu.edu/research/acoustics/what_is_acoustics.aspx.
Williams, S. (1971). Schaum’s Outline Series: Theory And Problems Of Acoustics.
New York: McGraw-Hill, Inc.
William, C. (1991). Recent Studies of Temporary Threshold Shift (TTS) And
Permanent Threshold Shift (PTS) In Animals. Acoustical society of America,
90(1), 155-163. Doi: 10.1121/1.401309.
Wilson, O. et al. (2002). Classroom Acoustics: A New Zealand Perspective.
Wellington: The Oticon Foundation In New Zealand.

123
APPENDICES
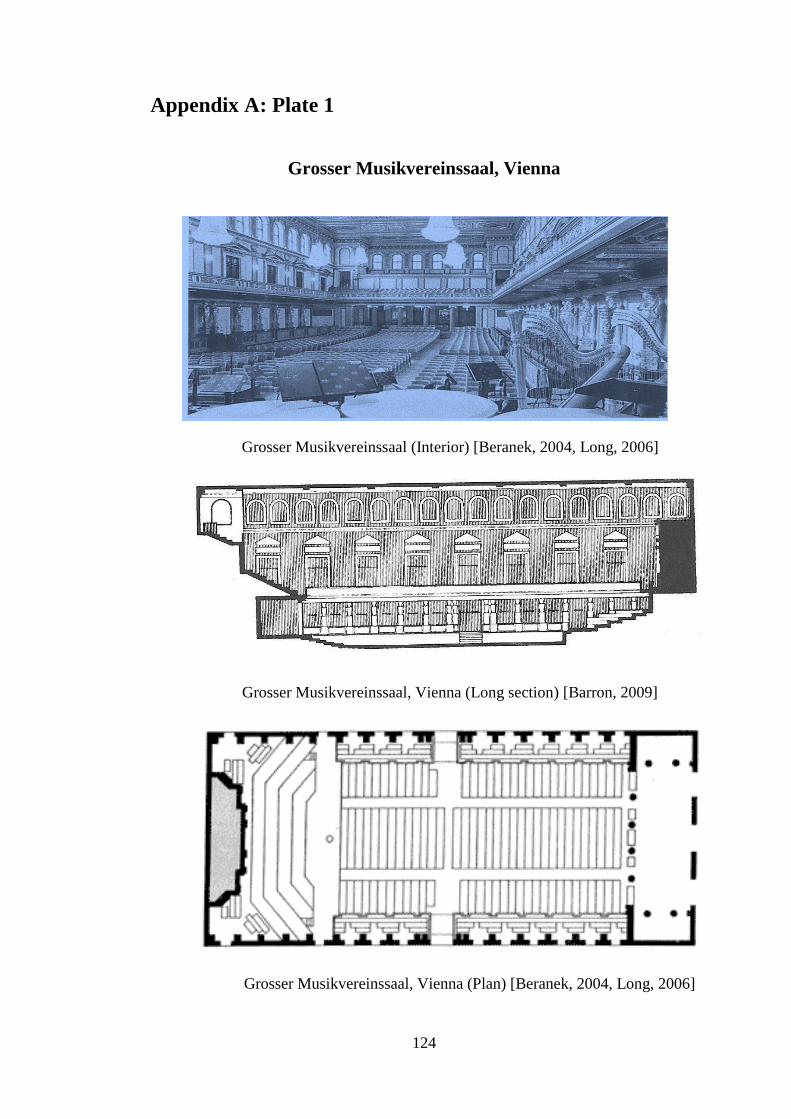
124
Appendix A: Plate 1
Grosser Musikvereinssaal, Vienna
Grosser Musikvereinssaal (Interior) [Beranek, 2004, Long, 2006]
Grosser Musikvereinssaal, Vienna (Long section) [Barron, 2009]
Grosser Musikvereinssaal, Vienna (Plan) [Beranek, 2004, Long, 2006]
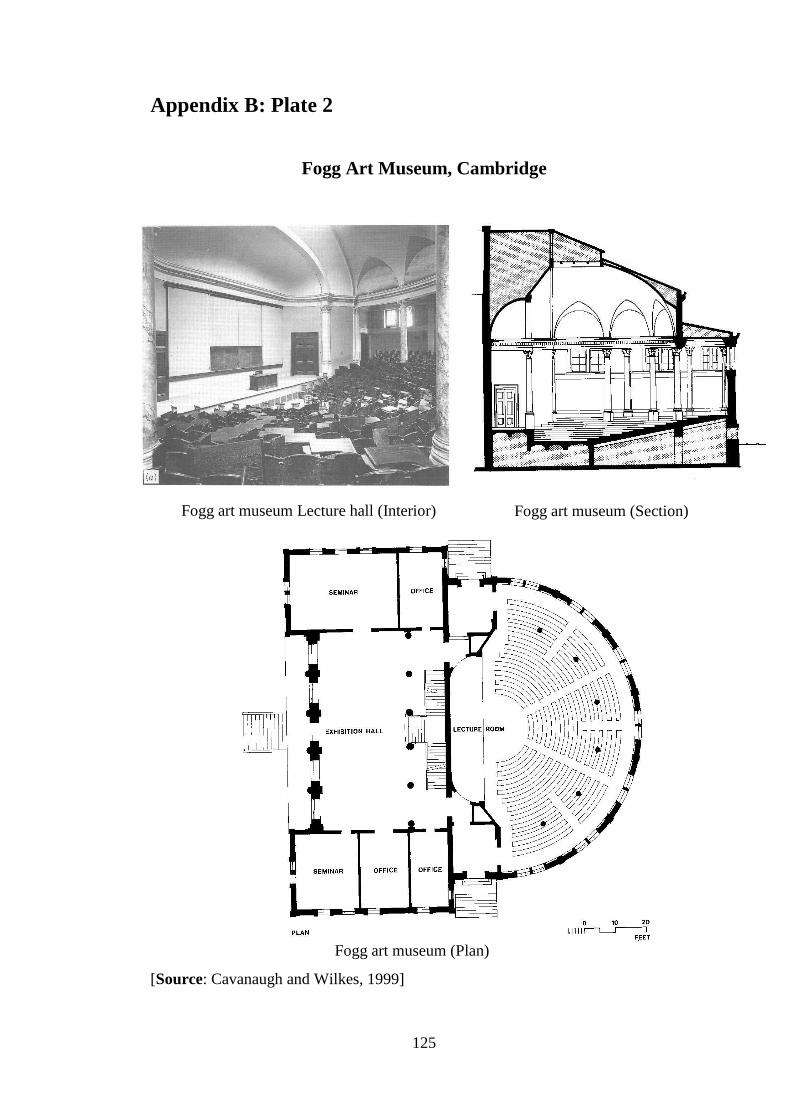
125
Appendix B: Plate 2
Fogg Art Museum, Cambridge
[Source: Cavanaugh and Wilkes, 1999]
Fogg art museum Lecture hall (Interior) Fogg art museum (Section)
Fogg art museum (Plan)
126
Appendix C: Plate 3
Boston music hall, Massachusetts
Boston music hall (Interior) [Long, 2006]
Boston music hall (Section) [Barron, 2009]
Boston music hall (Plan) [Long, 2006]
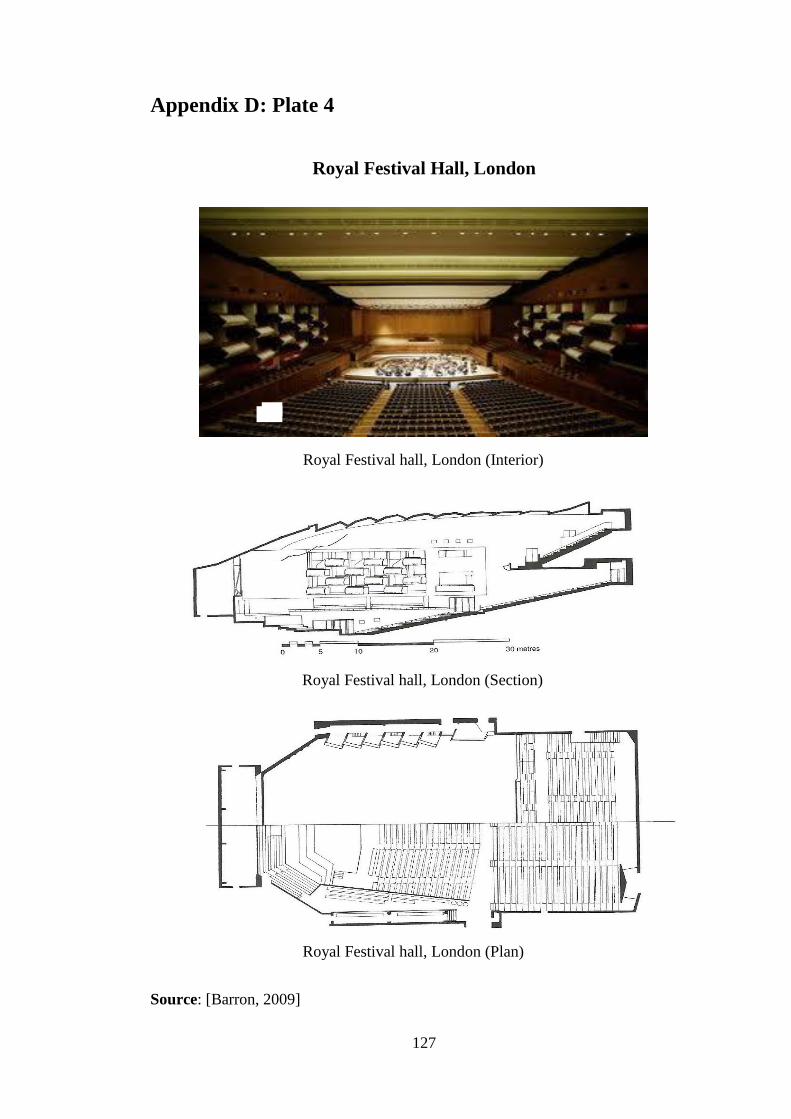
127
Appendix D: Plate 4
Royal Festival Hall, London
Source: [Barron, 2009]
Royal Festival hall, London (Interior)
Royal Festival hall, London (Section)
Royal Festival hall, London (Plan)

128
Appendix E: Plate 5
Vaux Hall Ranelagh Garden, London
Vaux hall Ranelagh garden, London (Plan) [Sidney, 1955]
Vaux hall Ranelagh garden, London (Exterior view) [Sidney,1955]
Vaux hall Ranelagh garden, London (Interior view) [Ukers, 2009]
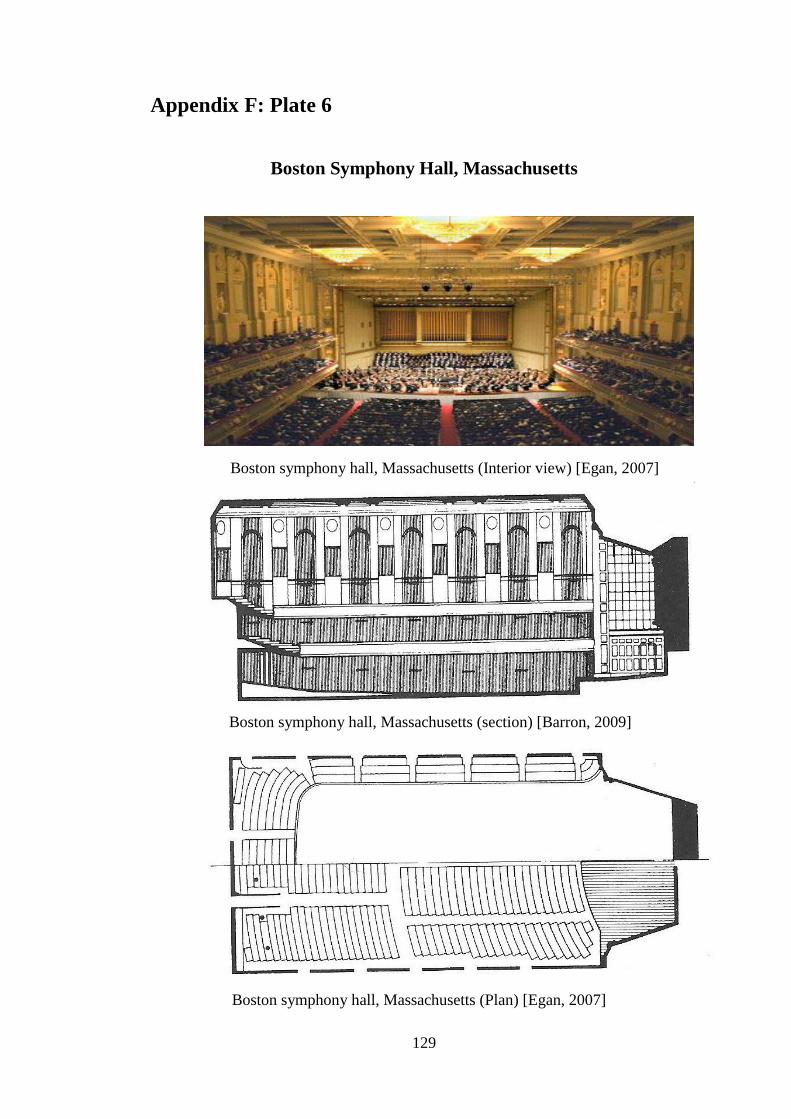
129
Appendix F: Plate 6
Boston Symphony Hall, Massachusetts
Boston symphony hall, Massachusetts (Interior view) [Egan, 2007]
Boston symphony hall, Massachusetts (section) [Barron, 2009]
Boston symphony hall, Massachusetts (Plan) [Egan, 2007]
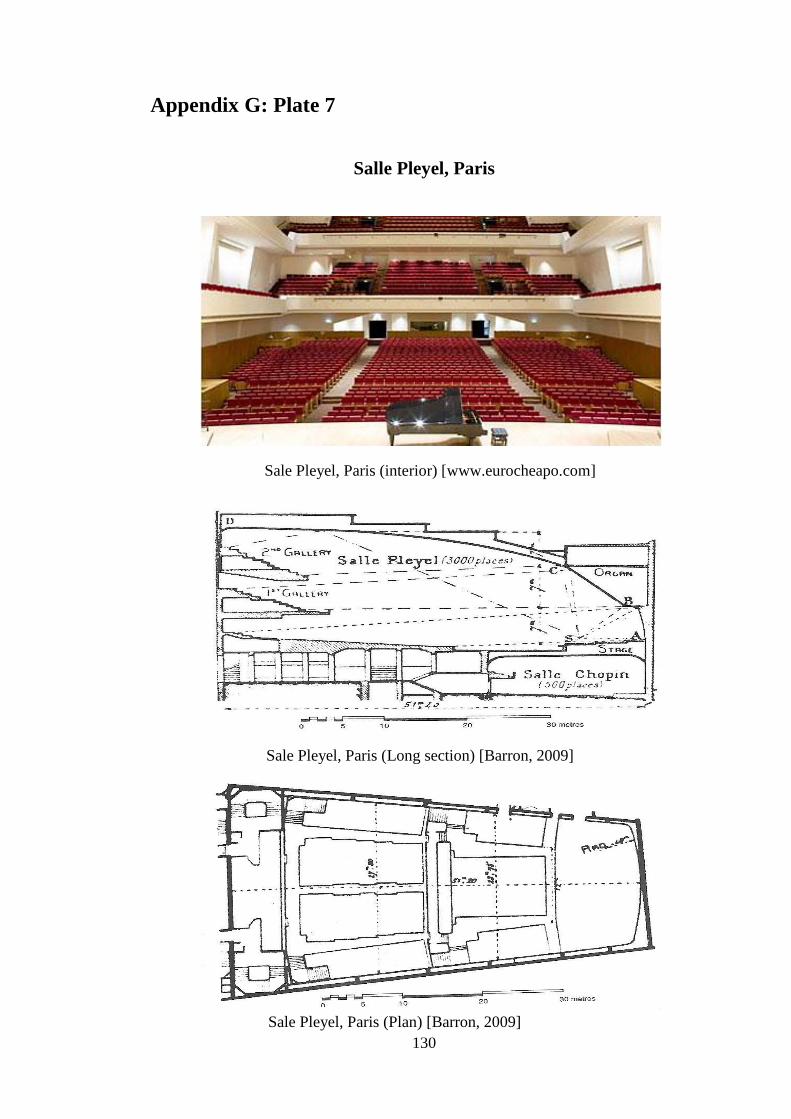
130
Appendix G: Plate 7
Salle Pleyel, Paris
Sale Pleyel, Paris (interior) [www.eurocheapo.com]
Sale Pleyel, Paris (Long section) [Barron, 2009]
Sale Pleyel, Paris (Plan) [Barron, 2009]
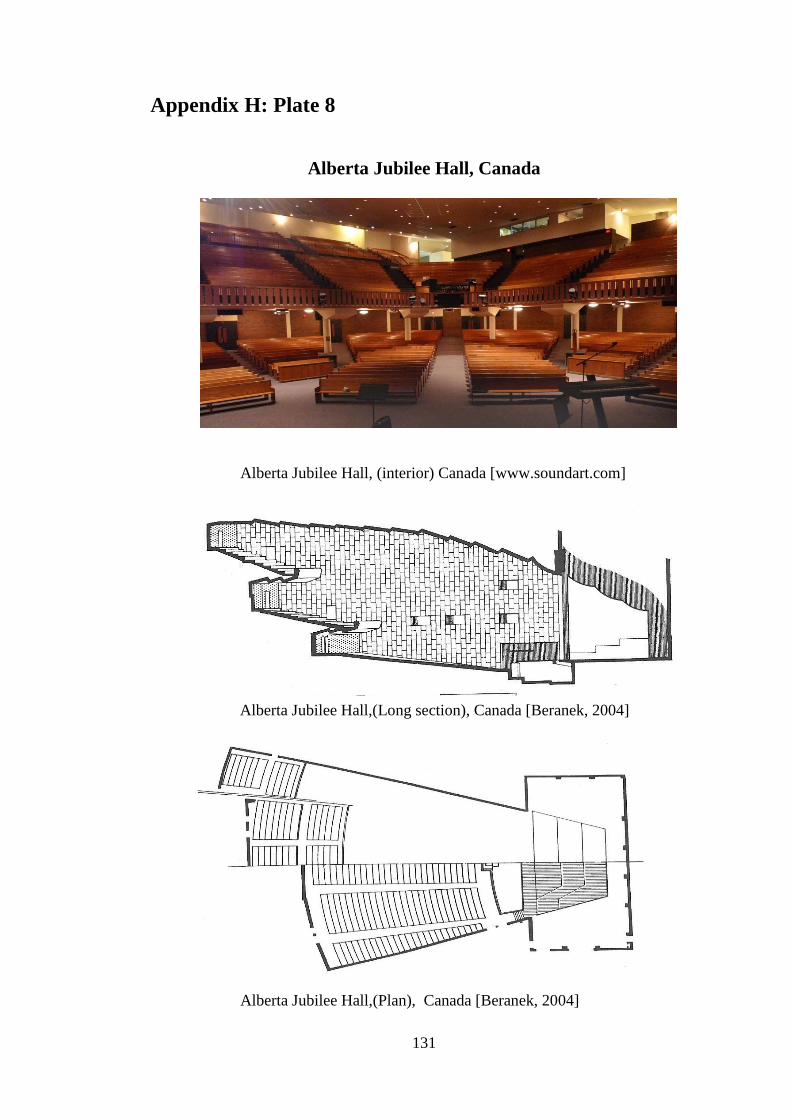
131
Appendix H: Plate 8
Alberta Jubilee Hall, Canada
Alberta Jubilee Hall, (interior) Canada [www.soundart.com]
Alberta Jubilee Hall,(Long section), Canada [Beranek, 2004]
Alberta Jubilee Hall,(Plan), Canada [Beranek, 2004]

132
Appendix I: Plate 9
Beethovenhalle, Bonn, Germany
Beethovenhalle (Interior), Bonn [Monumnte-online Magazine, 2009]
Beethovenhalle (Plan), Bonn [Monumnte-online Magazine, 2009]
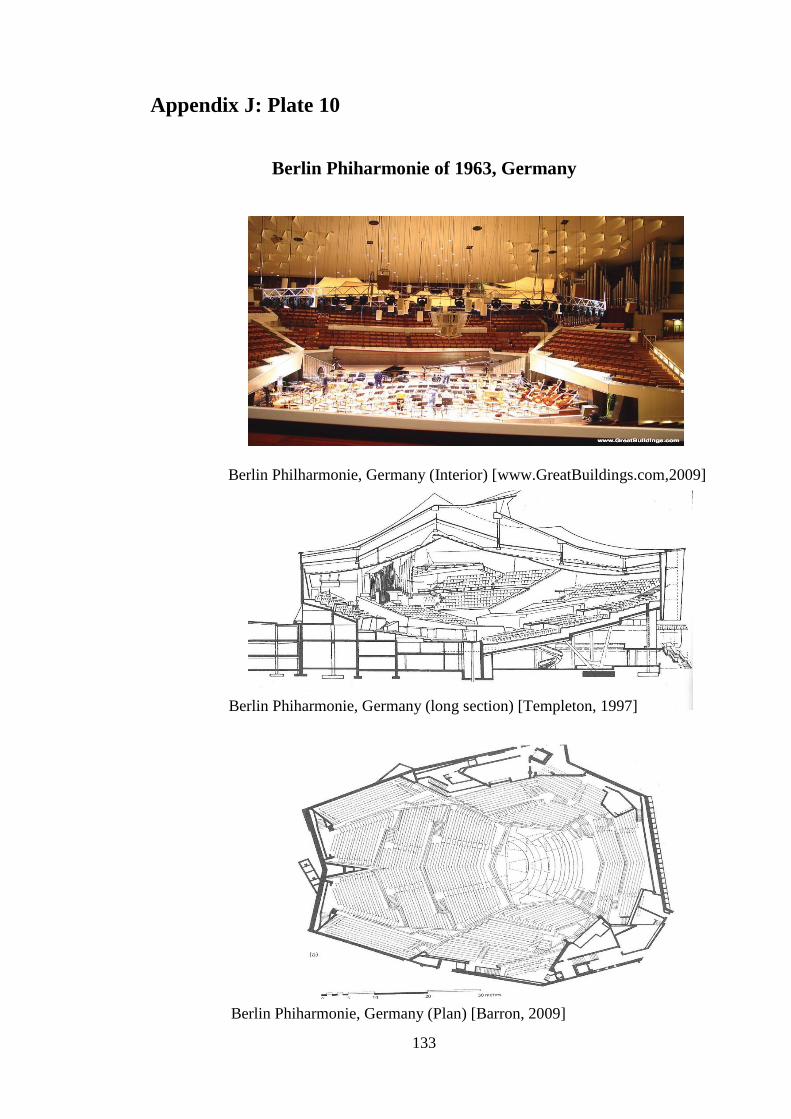
133
Appendix J: Plate 10
Berlin Phiharmonie of 1963, Germany
Berlin Philharmonie, Germany (Interior) [www.GreatBuildings.com,2009]
Berlin Phiharmonie, Germany (long section) [Templeton, 1997]
Berlin Phiharmonie, Germany (Plan) [Barron, 2009]
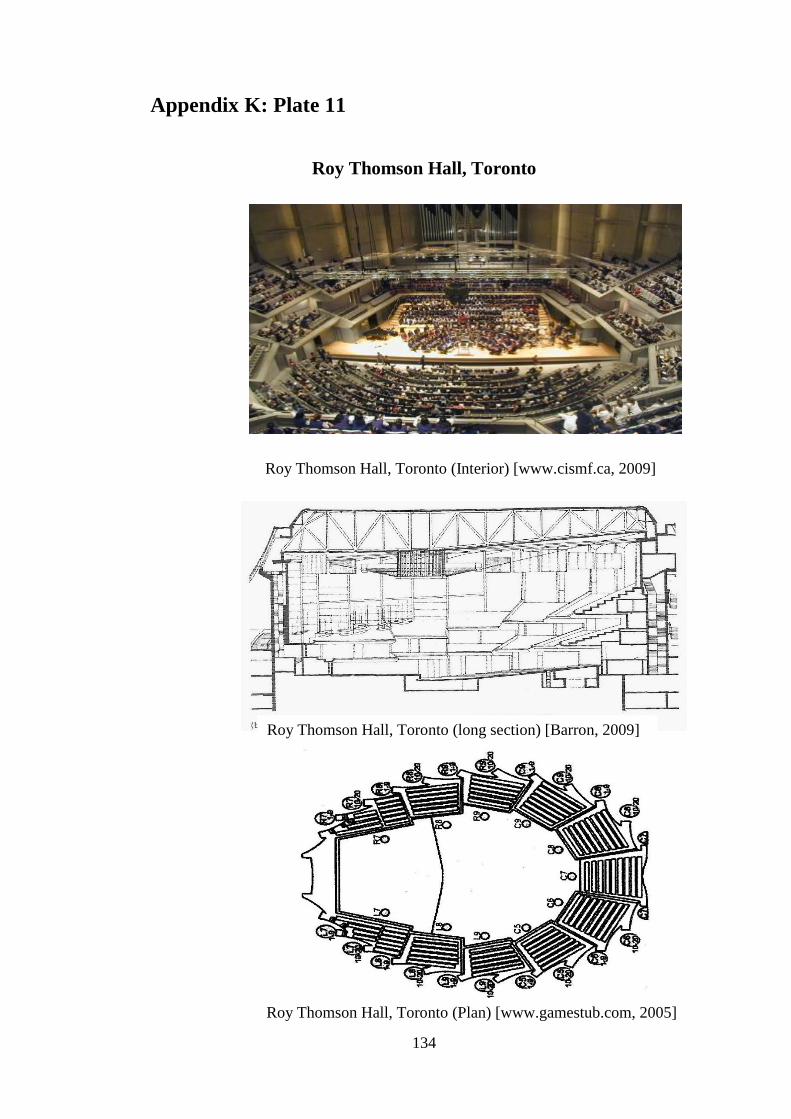
134
Appendix K: Plate 11
Roy Thomson Hall, Toronto
Roy Thomson Hall, Toronto (Plan) [www.gamestub.com, 2005]
Roy Thomson Hall, Toronto (long section) [Barron, 2009]
Roy Thomson Hall, Toronto (Interior) [www.cismf.ca, 2009]
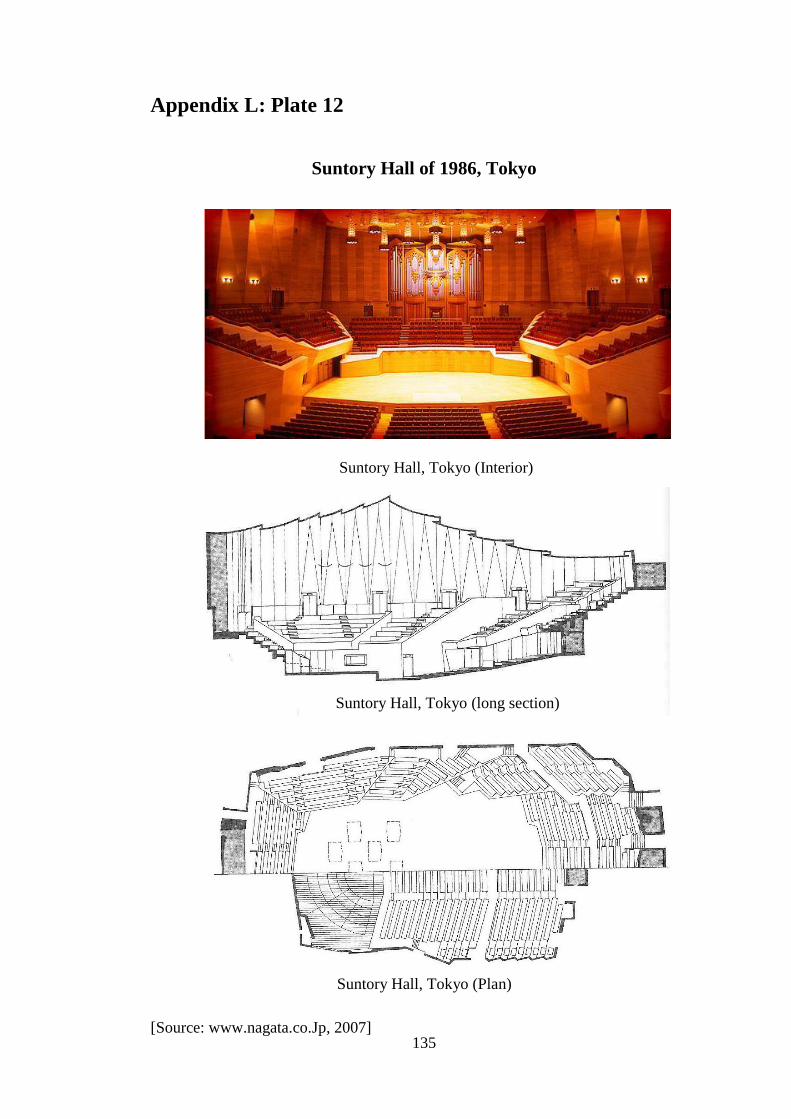
135
Appendix L: Plate 12
Suntory Hall of 1986, Tokyo
Suntory Hall, Tokyo (Plan)
[Source: www.nagata.co.Jp, 2007]
Suntory Hall, Tokyo (long section)
Suntory Hall, Tokyo (Interior)

136
[Source: Cavanaugh and Wilkes, 1999]
Appendix M: Plate 13
McDermott Concert Hall in Dallas, Texas
McDermott Concert Hall, Dallas (Main Plan)
McDermott Concert Hall, Dallas (Long Section)
McDermott Concert Hall, Dallas (Interior)

137
Appendix N: Plate 14
Selected Commonly Used Sound Absorbers In Structures
Polyurethane Foam
Polyurethane Pyramid Cutting Wedge Polyurethane Pyramid
Bermuda Triangle Trap
Max Wedge Sound Cylinder
Fire-flex Foam
Fab-TEC Fabric
Covered Foam
Cloudscape Ceiling Tiles
(Drop-In) Fireproof (Class 1) Wall
Panels
Hanging Baffles
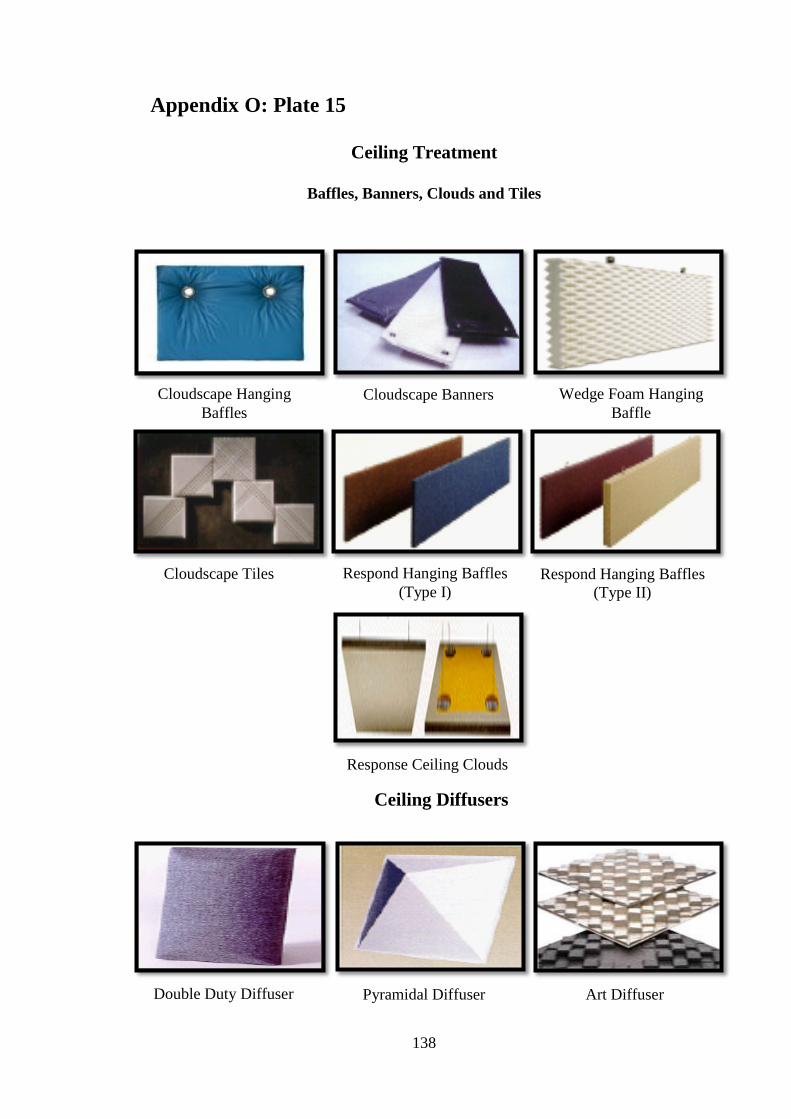
138
Appendix O: Plate 15
Ceiling Treatment
Baffles, Banners, Clouds and Tiles
Ceiling Diffusers
Cloudscape Hanging
Baffles
Cloudscape Banners Wedge Foam Hanging
Baffle
Respond Hanging Baffles
(Type II)
Respond Hanging Baffles
(Type I)
Cloudscape Tiles
Response Ceiling Clouds
Art Diffuser Pyramidal Diffuser Double Duty Diffuser
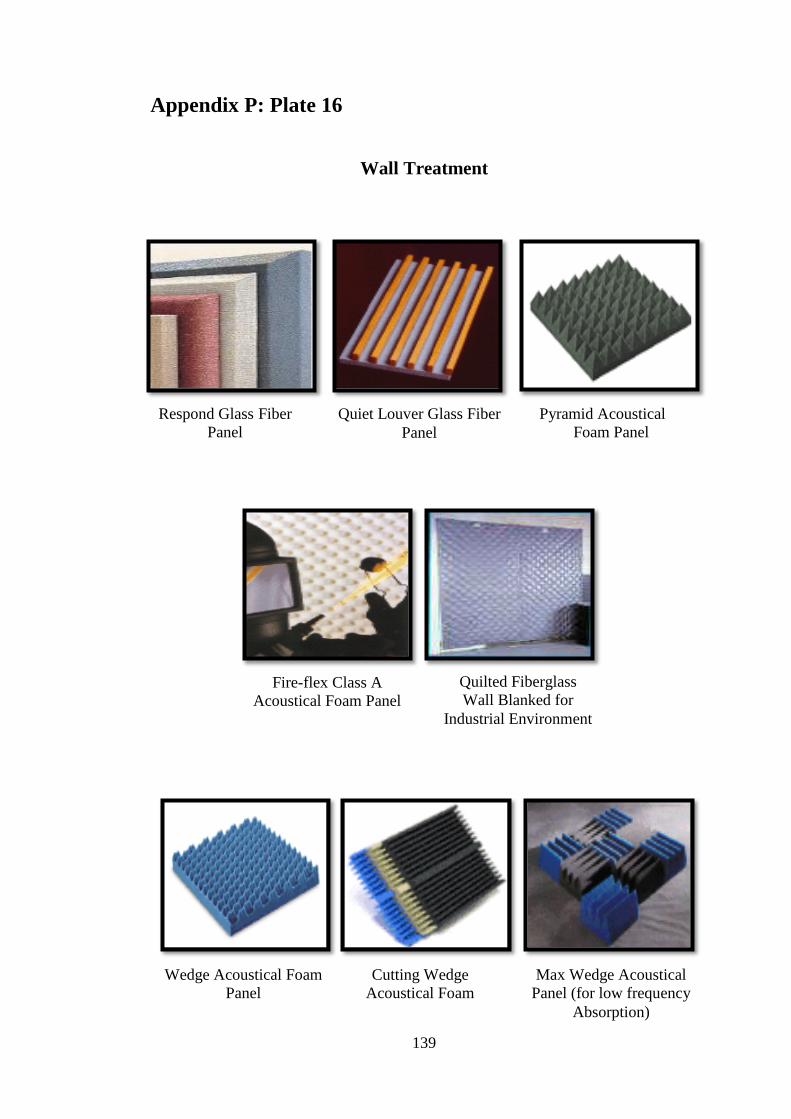
139
Appendix P: Plate 16
Wall Treatment
Respond Glass Fiber
Panel
Fire-flex Class A
Acoustical Foam Panel
Pyramid Acoustical
Foam Panel
Quiet Louver Glass Fiber
Panel
Quilted Fiberglass
Wall Blanked for
Industrial Environment
Wedge Acoustical Foam
Panel
Cutting Wedge
Acoustical Foam
Max Wedge Acoustical
Panel (for low frequency
Absorption)
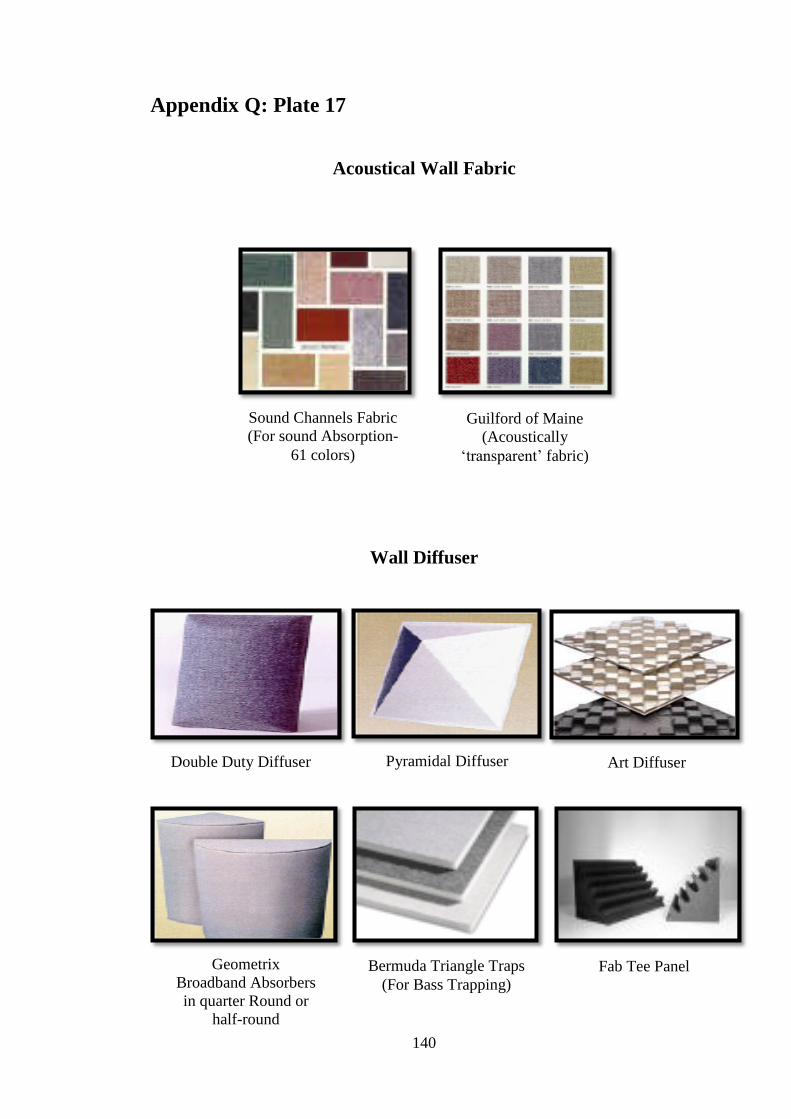
140
Appendix Q: Plate 17
Acoustical Wall Fabric
Wall Diffuser
Sound Channels Fabric
(For sound Absorption-
61 colors)
Guilford of Maine
(Acoustically
„transparent‟ fabric)
Double Duty Diffuser
Pyramidal Diffuser Art Diffuser
Geometrix
Broadband Absorbers
in quarter Round or
half-round
configuration
Bermuda Triangle Traps
(For Bass Trapping)
Fab Tee Panel